Cambridge IGCSE Physics 0625 — 2009 May/June Paper 5 · Variant 1
0625/51/M/J/09 · 4 questions · 40 marks · ≈45 min
The question paper and its mark scheme, free to read here and free to download. This is Cambridge’s own paper, exactly as it was sat.
Question paper12 pages
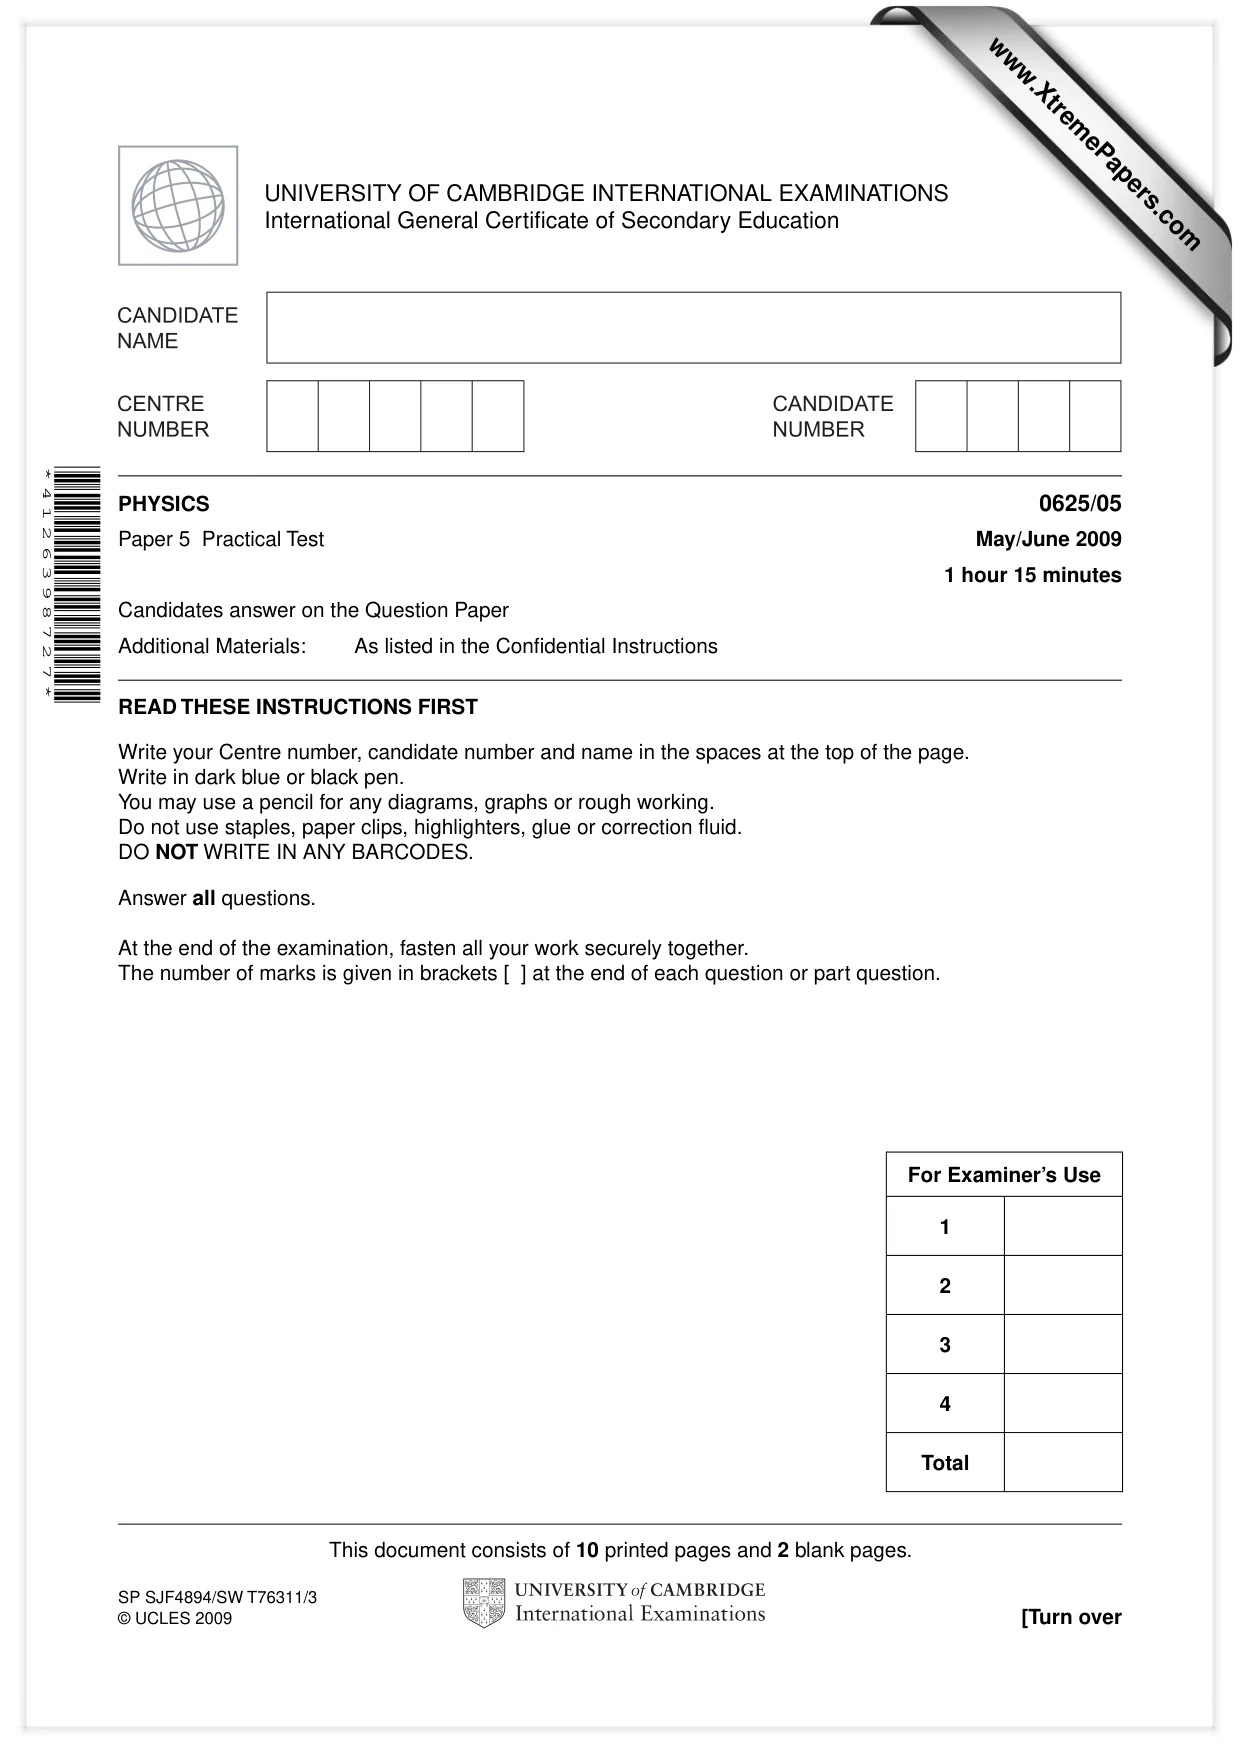

Mark scheme3 pages
Answers below. Sit the paper first if you are practising.
Questions as text
Q1 · In this experiment, you are to make two sets of measurements as accurately as you can in…
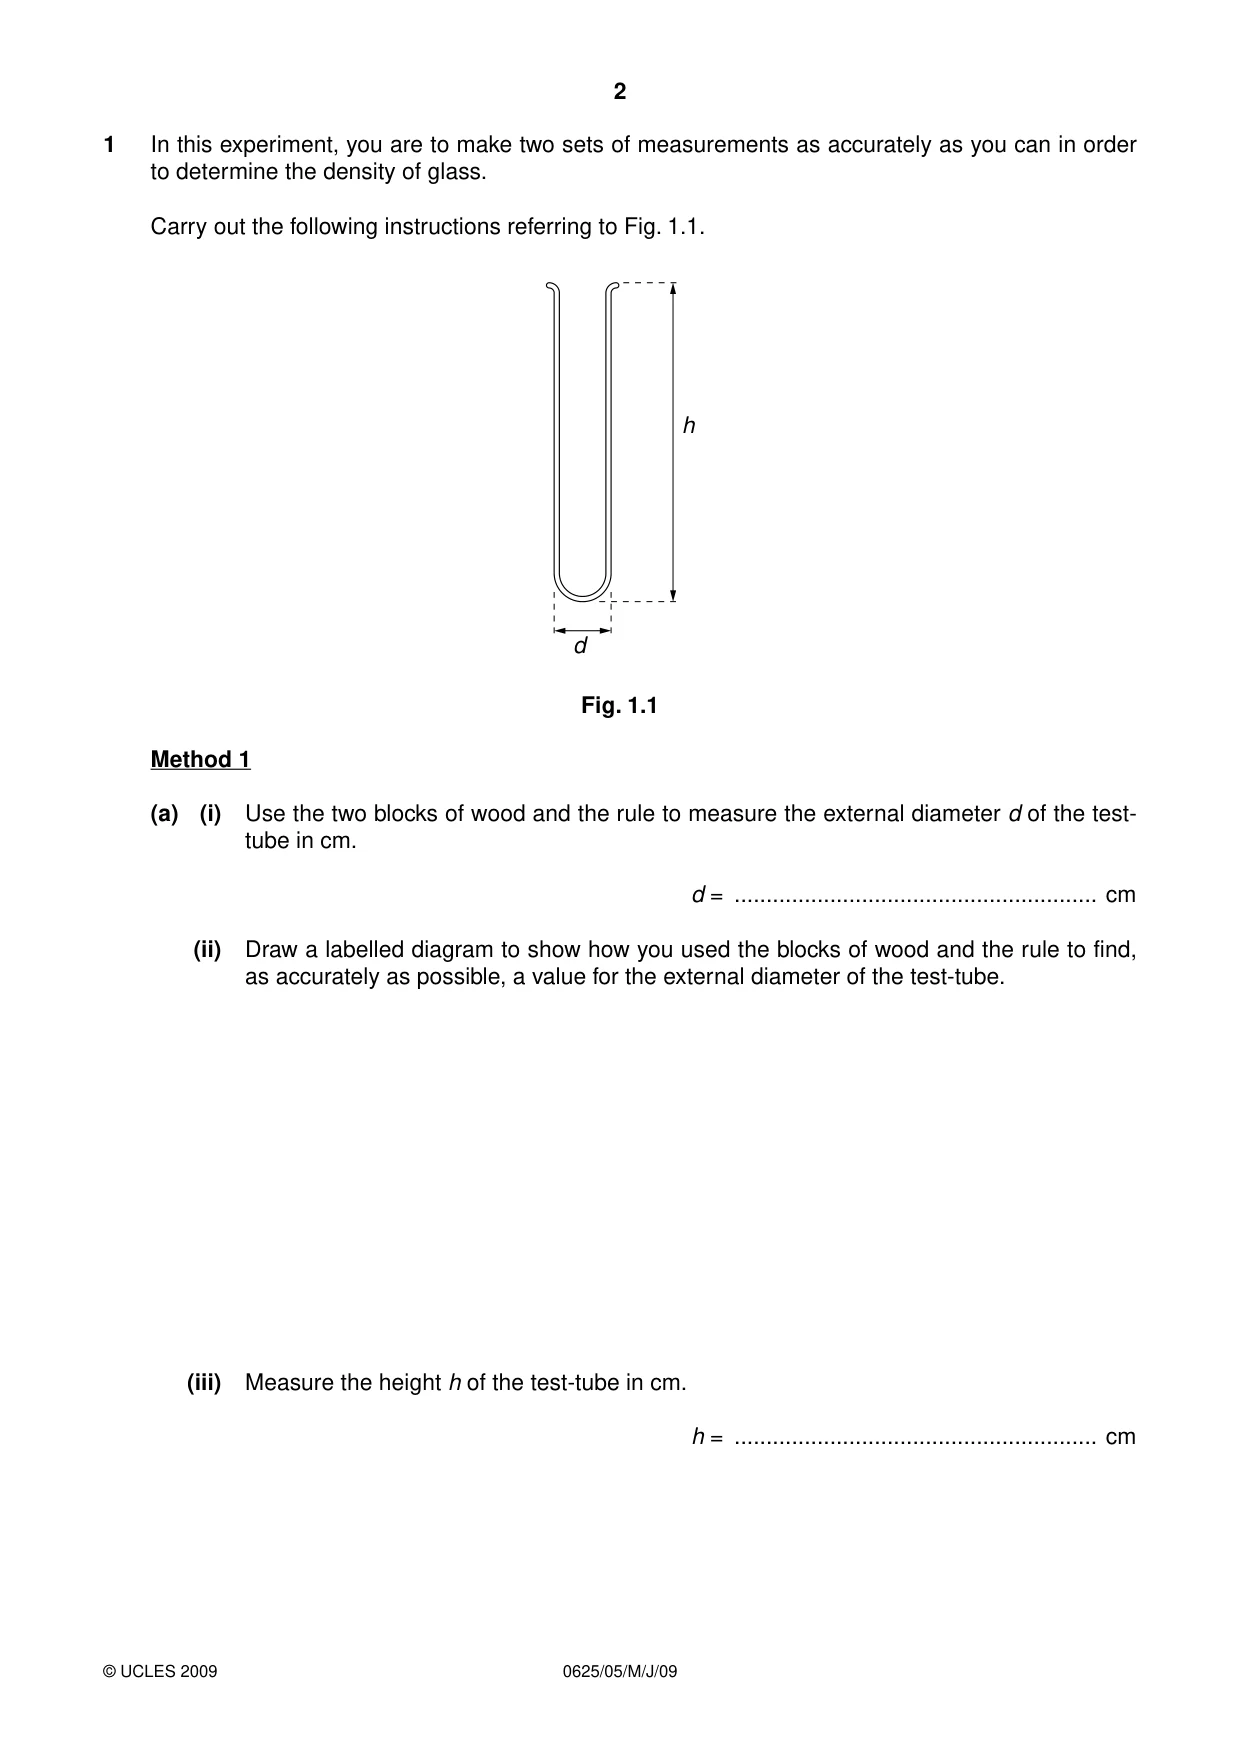
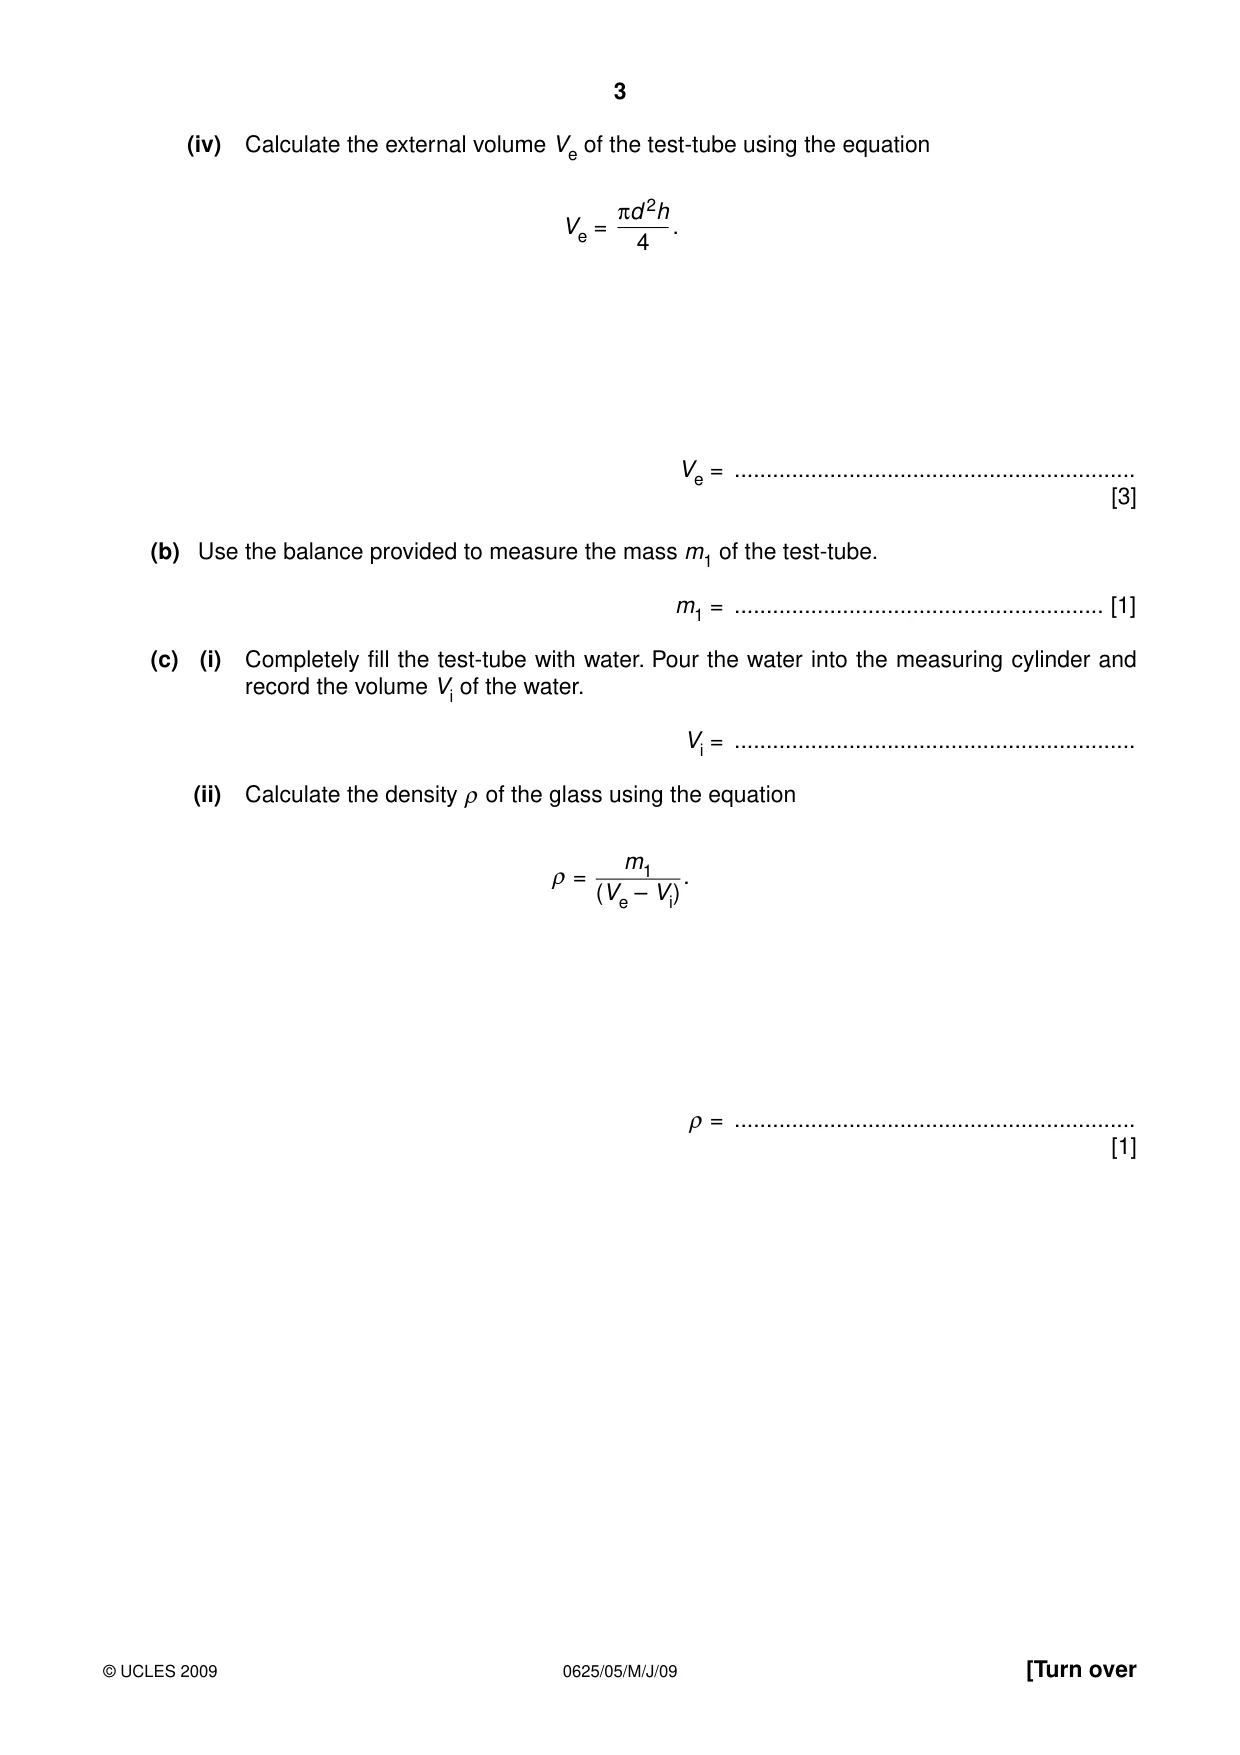
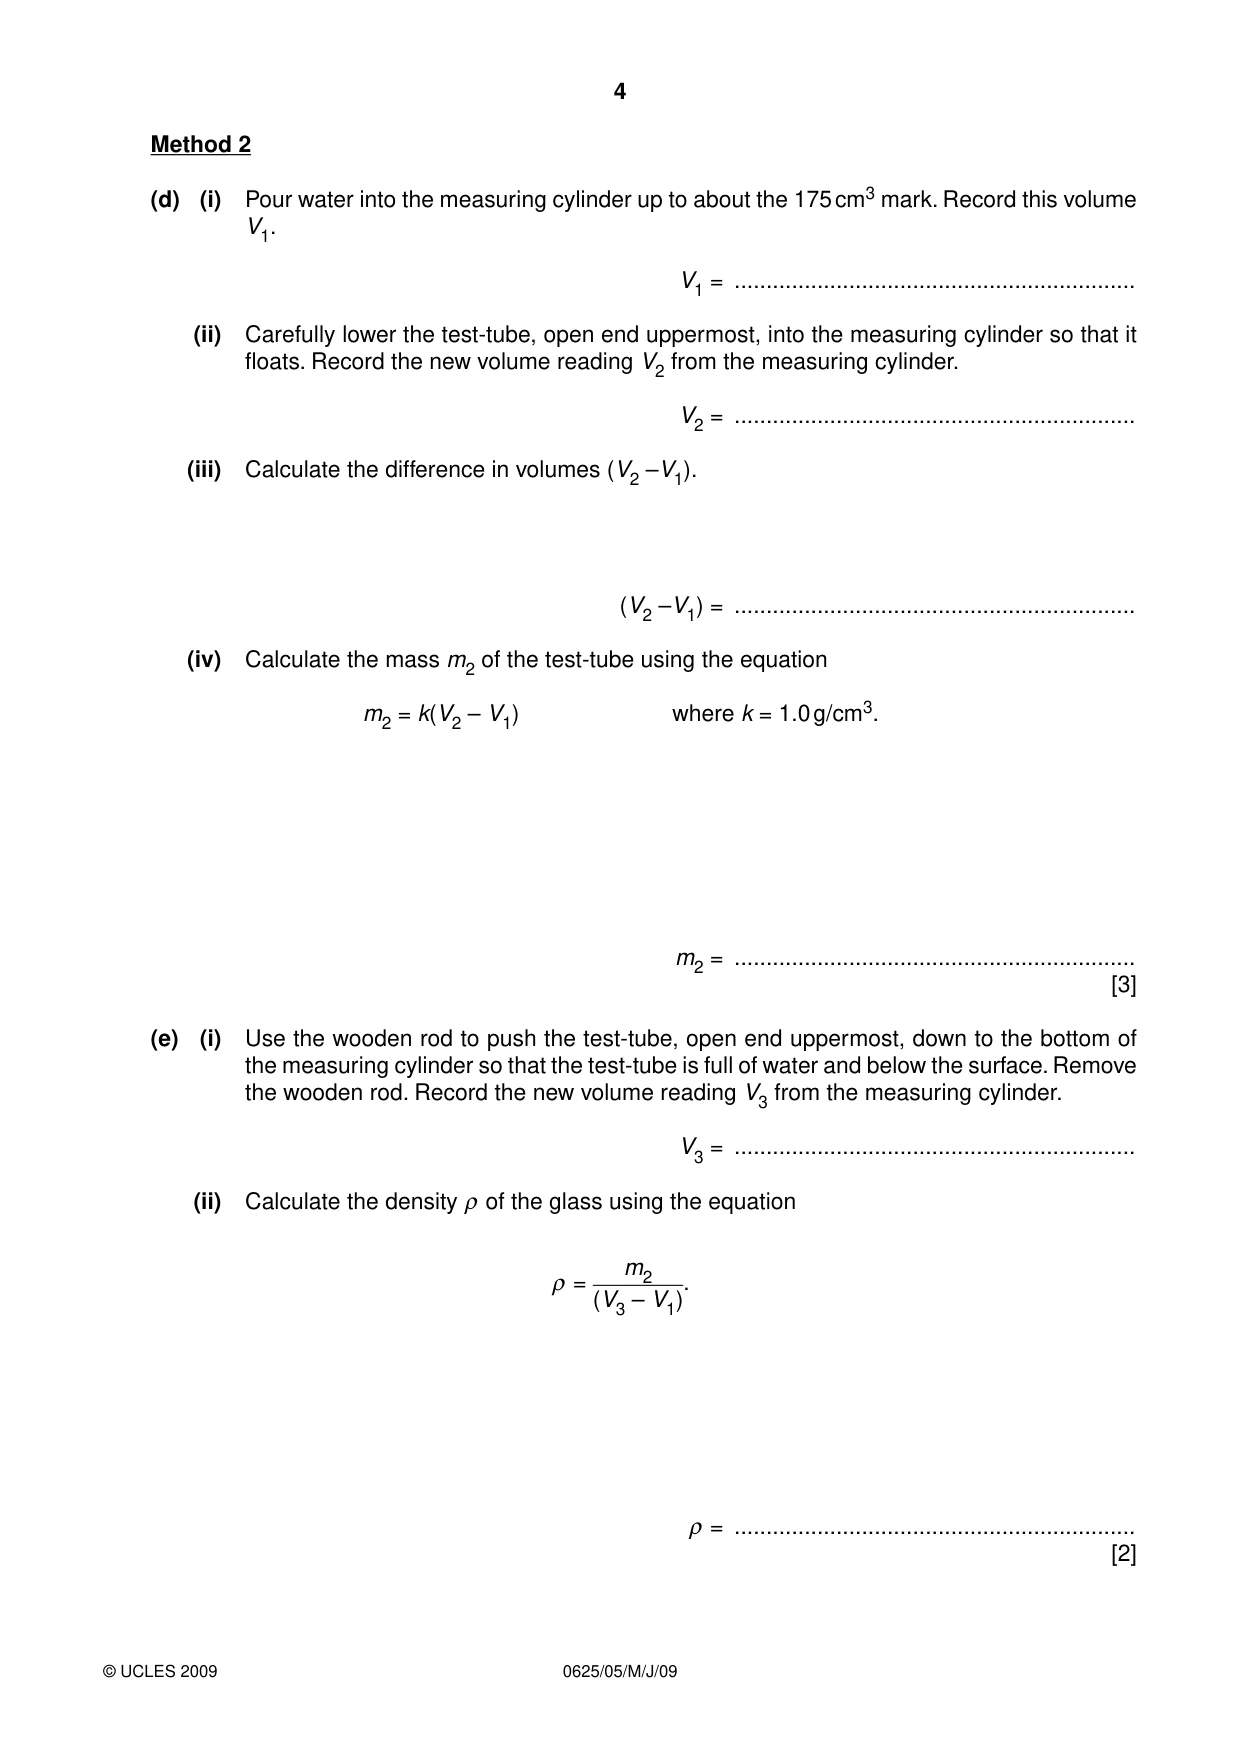
1 In this experiment, you are to make two sets of measurements as accurately as you can in order to determine the density of glass. Carry out the following instructions referring to Fig. 1.1. h d Fig. 1.1 Method 1 (a) (i) Use the two blocks of wood and the rule to measure the external diameter d of the test- tube in cm. d = ......................................................... cm (ii) Draw a labelled diagram to show how you used the blocks of wood and the rule to find, as accurately as possible, a value for the external diameter of the test-tube. (iii) Measure the height h of the test-tube in cm. h = ......................................................... cm (iv) Calculate the external volume Ve of the test-tube using the equation πd 2h Ve = . 4 Ve = ............................................................... [3] (b) Use the balance provided to measure the mass m1 of the test-tube. m1 = .......................................................... [1] (c) (i) Completely fill the test-tube with water. Pour the water into the measuring cylinder and record the volume Vi of the water. Vi = ............................................................... (ii) Calculate the density ρ of the glass using the equation m1 ρ = (Ve – Vi). ρ = ............................................................... [1] Method 2 (d) (i) Pour water into the measuring cylinder up to about the 175 cm3 mark. Record this volume V1. V1 = ............................................................... (ii) Carefully lower the test-tube, open end uppermost, into the measuring cylinder so that it floats. Record the new volume reading V2 from the measuring cylinder. V2 = ............................................................... (iii) Calculate the difference in volumes (V2 –V1). (V2 –V1) = ............................................................... (iv) Calculate the mass m2 of the test-tube using the equation m2 = k(V2 – V1) where k = 1.0 g/cm3. m2 = ............................................................... [3] (e) (i) Use the wooden rod to push the test-tube, open end uppermost, down to the bottom of the measuring cylinder so that the test-tube is full of water and below the surface. Remove the wooden rod. Record the new volume reading V3 from the measuring cylinder. V3 = ............................................................... (ii) Calculate the density ρ of the glass using the equation m2 ρ = (V3 – V1). ρ = ............................................................... [2]
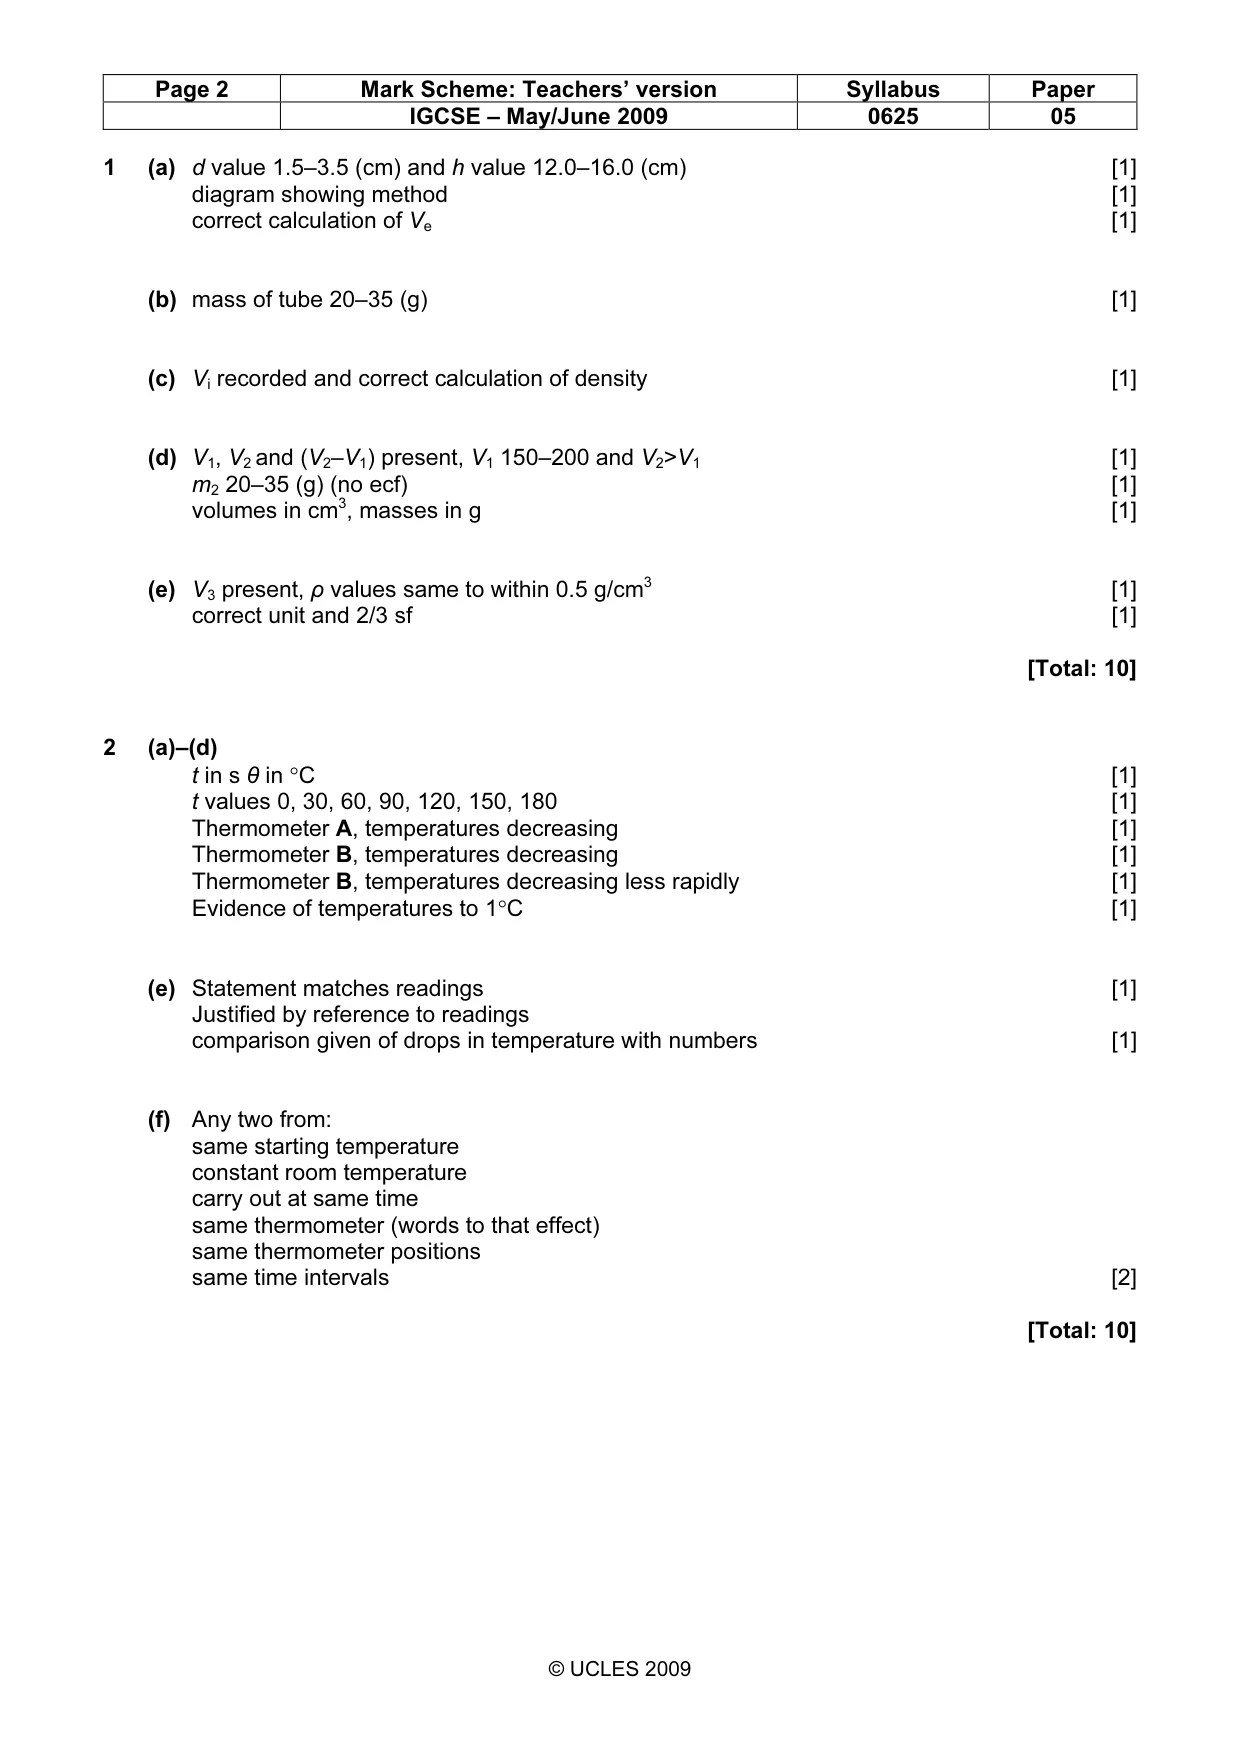
Mark scheme: 1 (a) d value 1.5–3.5 (cm) and h value 12.0–16.0 (cm) [1] diagram showing method [1] correct calculation of Ve [1] (b) mass of tube 20–35 (g) [1] (c) Vi recorded and correct calculation of density [1] (d) V1, V2 and (V2–V1) present, V1 150–200 and V2>V1 [1] m2 20–35 (g) (no ecf) [1] volumes in cm3, masses in g [1] (e) V3 present, ρ values same to within 0.5 g/cm3 [1] correct unit and 2/3 sf [1] [Total: 10]
More questions on Physical quantities and measurement techniques
Q2 · In this experiment, you are to investigate the cooling of thermometer bulbs under…
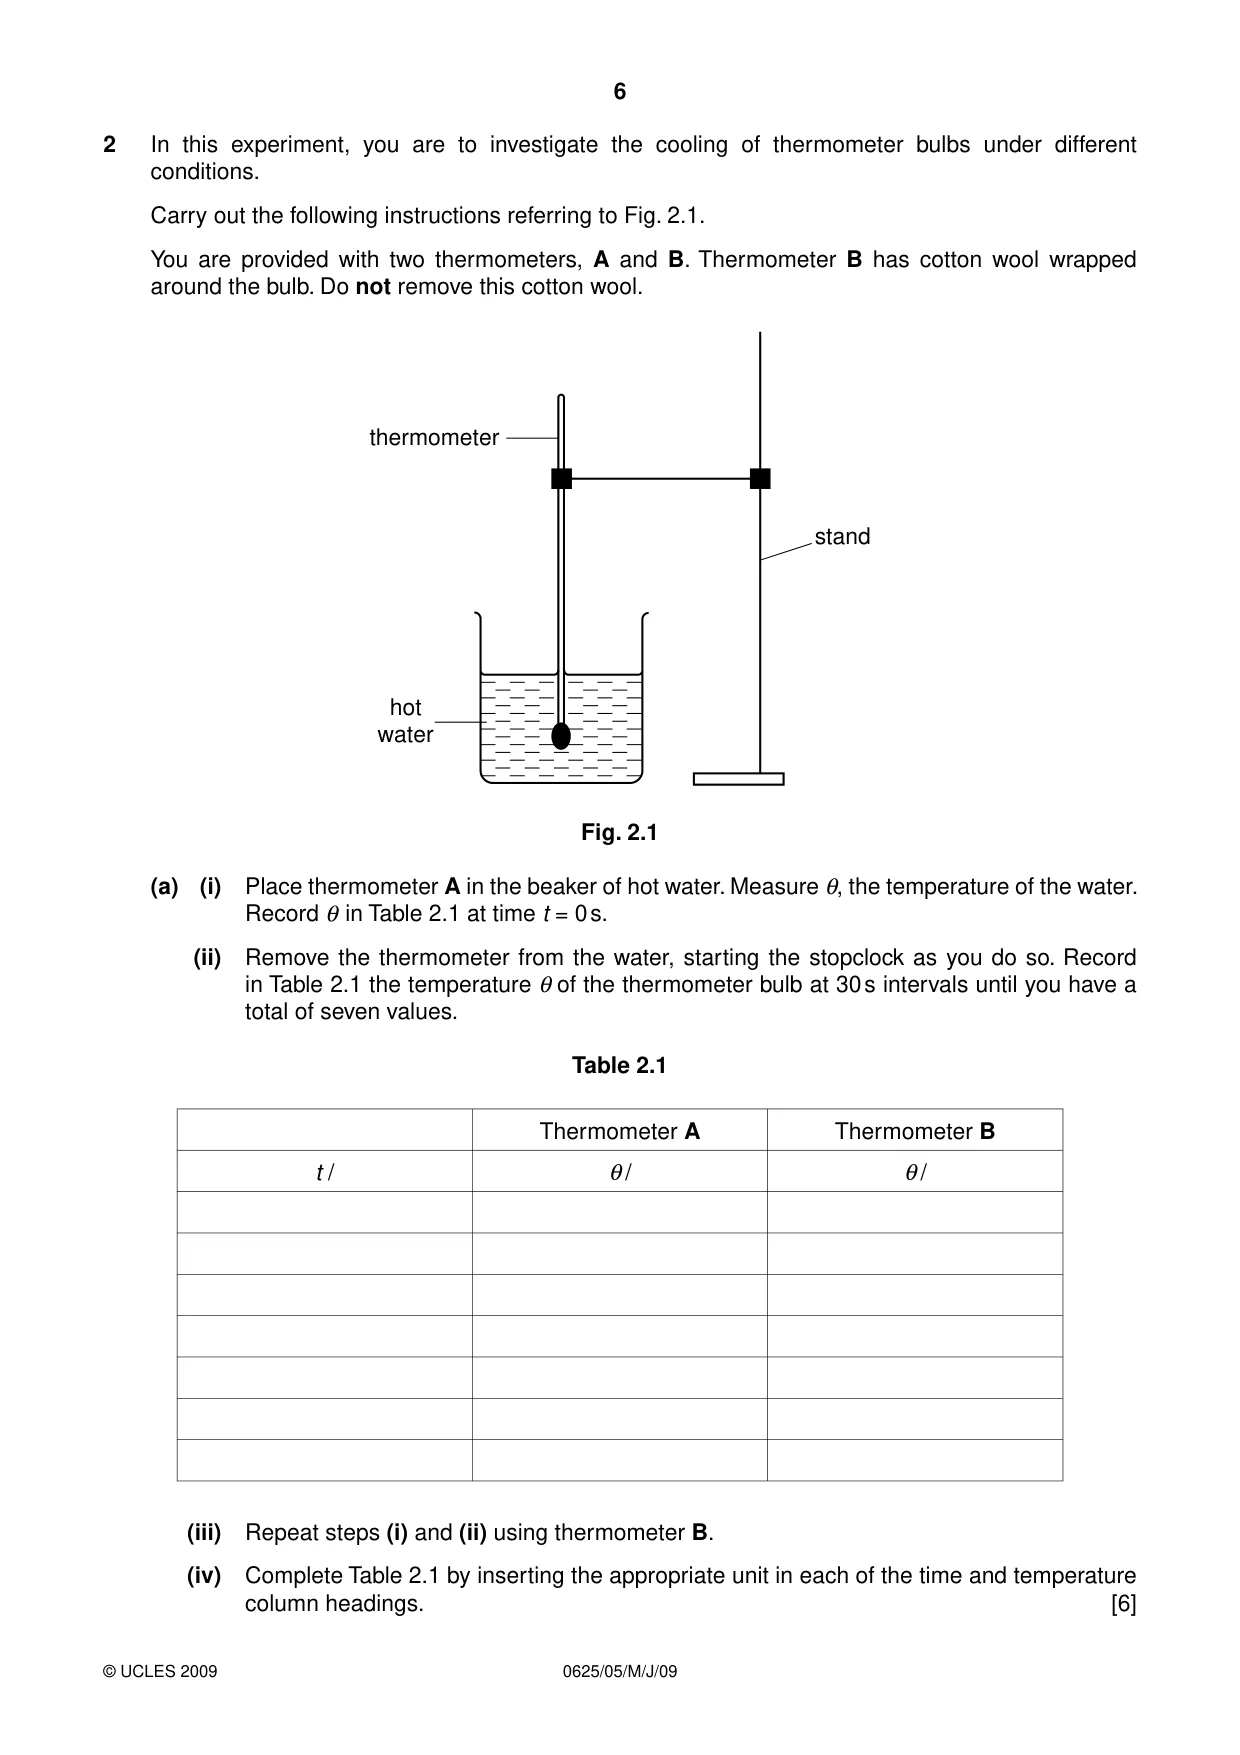
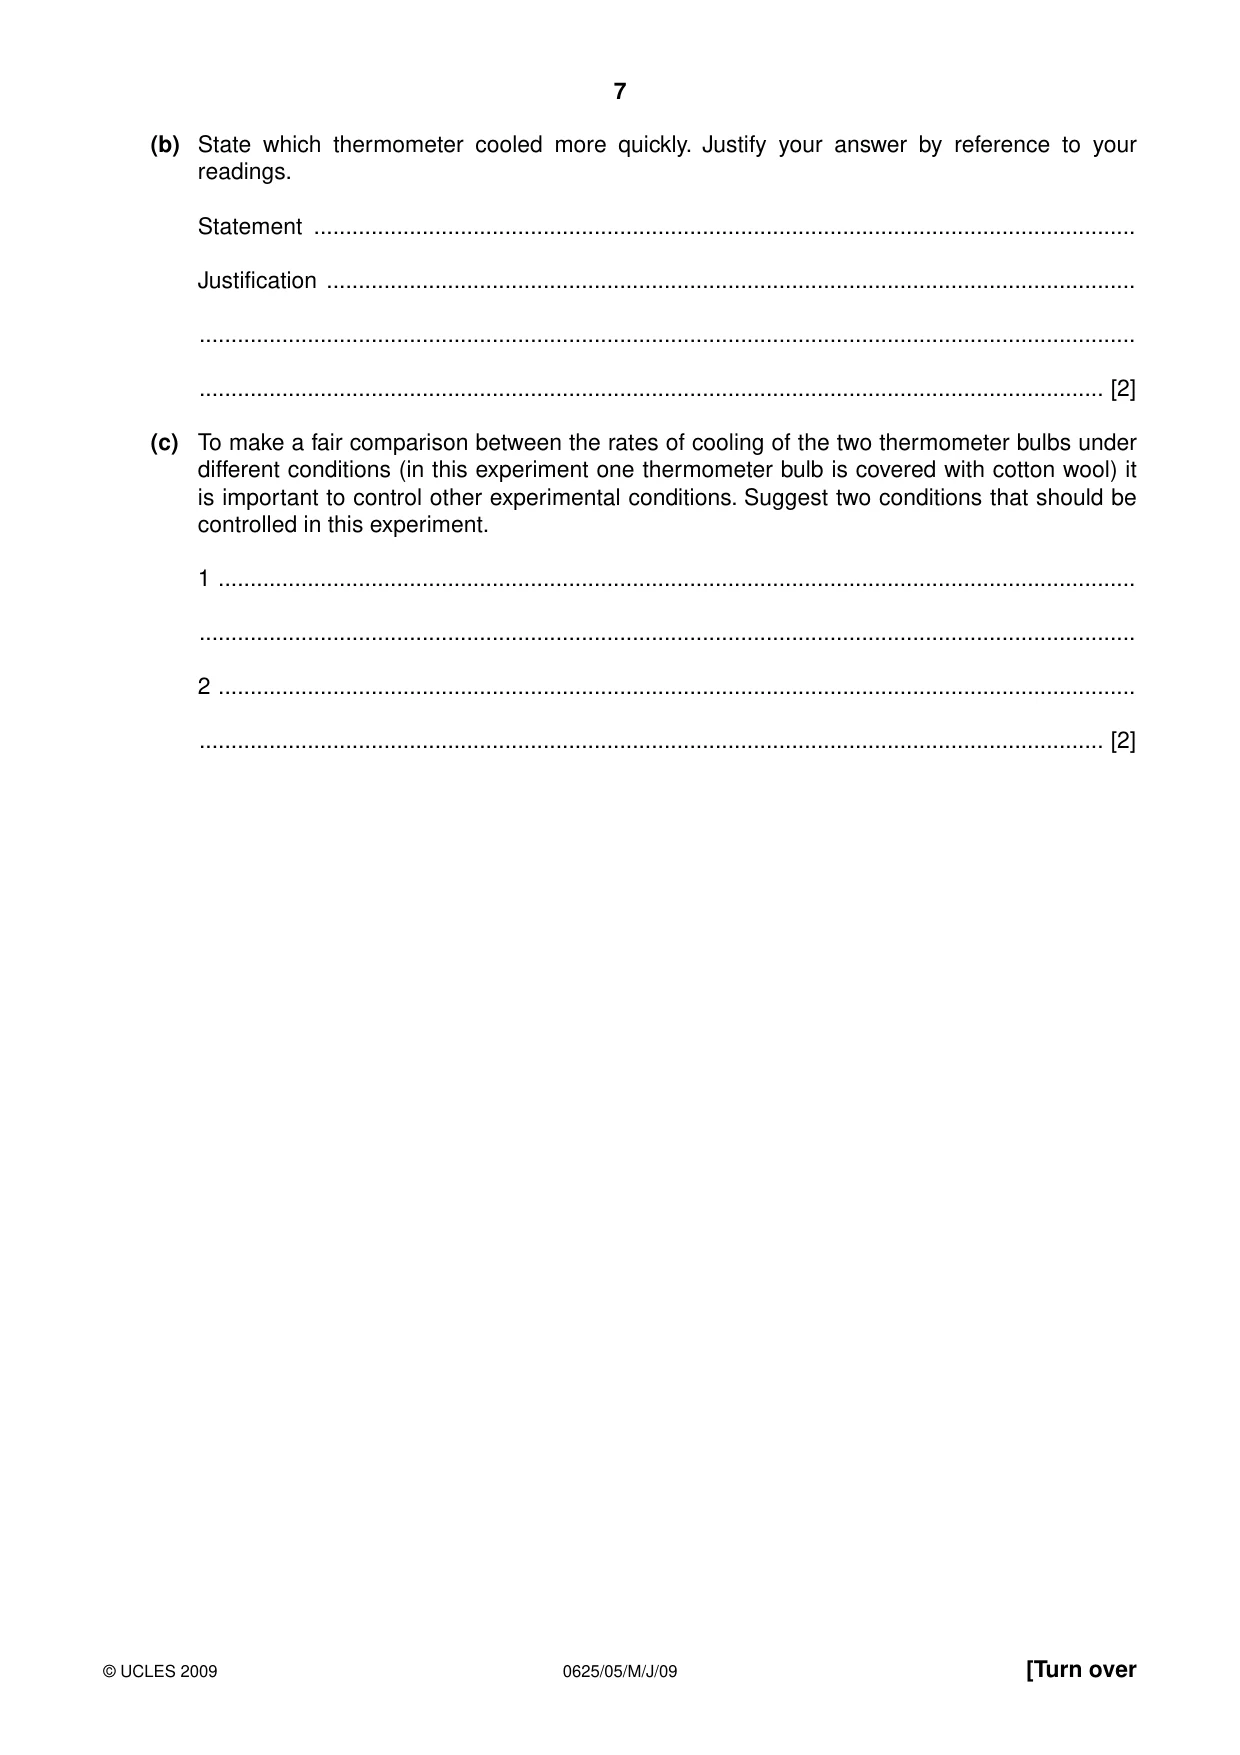
2 In this experiment, you are to investigate the cooling of thermometer bulbs under different conditions. Carry out the following instructions referring to Fig. 2.1. You are provided with two thermometers, A and B. Thermometer B has cotton wool wrapped around the bulb. Do not remove this cotton wool. thermometer stand hot water Fig. 2.1 (a) (i) Place thermometer A in the beaker of hot water. Measure θ, the temperature of the water. Record θ in Table 2.1 at time t = 0 s. (ii) Remove the thermometer from the water, starting the stopclock as you do so. Record in Table 2.1 the temperature θ of the thermometer bulb at 30 s intervals until you have a total of seven values. Table 2.1 Thermometer A Thermometer B t / θ/ θ/ (iii) Repeat steps (i) and (ii) using thermometer B. (iv) Complete Table 2.1 by inserting the appropriate unit in each of the time and temperature column headings. [6] (b) State which thermometer cooled more quickly. Justify your answer by reference to your readings. Statement ................................................................................................................................. Justification ............................................................................................................................... ................................................................................................................................................... .............................................................................................................................................. [2] (c) To make a fair comparison between the rates of cooling of the two thermometer bulbs under different conditions (in this experiment one thermometer bulb is covered with cotton wool) it is important to control other experimental conditions. Suggest two conditions that should be controlled in this experiment. 1 ................................................................................................................................................ ................................................................................................................................................... 2 ................................................................................................................................................ .............................................................................................................................................. [2]
Mark scheme: 2 (a)–(d) t in s θ in °C [1] t values 0, 30, 60, 90, 120, 150, 180 [1] Thermometer A, temperatures decreasing [1] Thermometer B, temperatures decreasing [1] Thermometer B, temperatures decreasing less rapidly [1] Evidence of temperatures to 1°C [1] (e) Statement matches readings [1] Justified by reference to readings comparison given of drops in temperature with numbers [1] (f) Any two from: same starting temperature constant room temperature carry out at same time same thermometer (words to that effect) same thermometer positions same time intervals [2] [Total: 10] IGCSE – May/June 2009 0625 05
Q3 · In this experiment, you will investigate the resistance of a wire
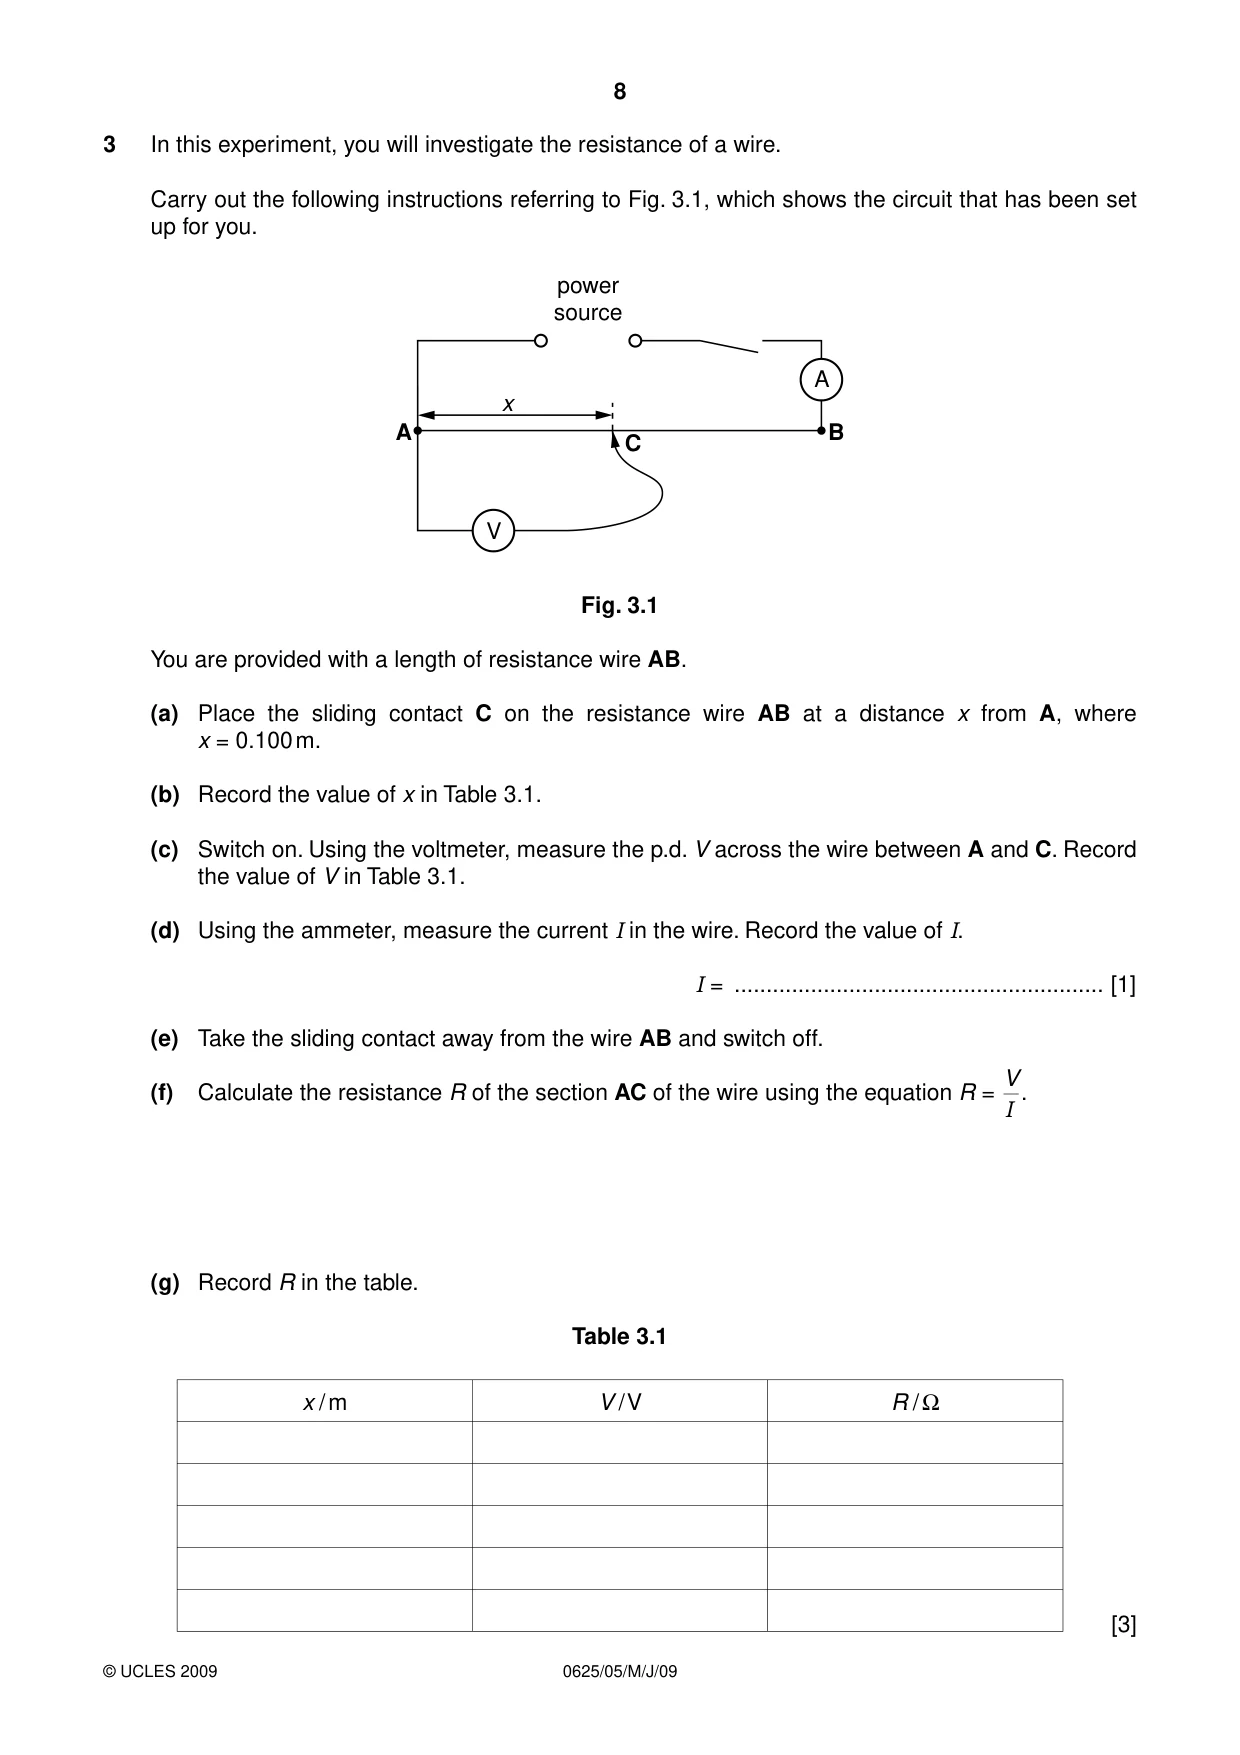
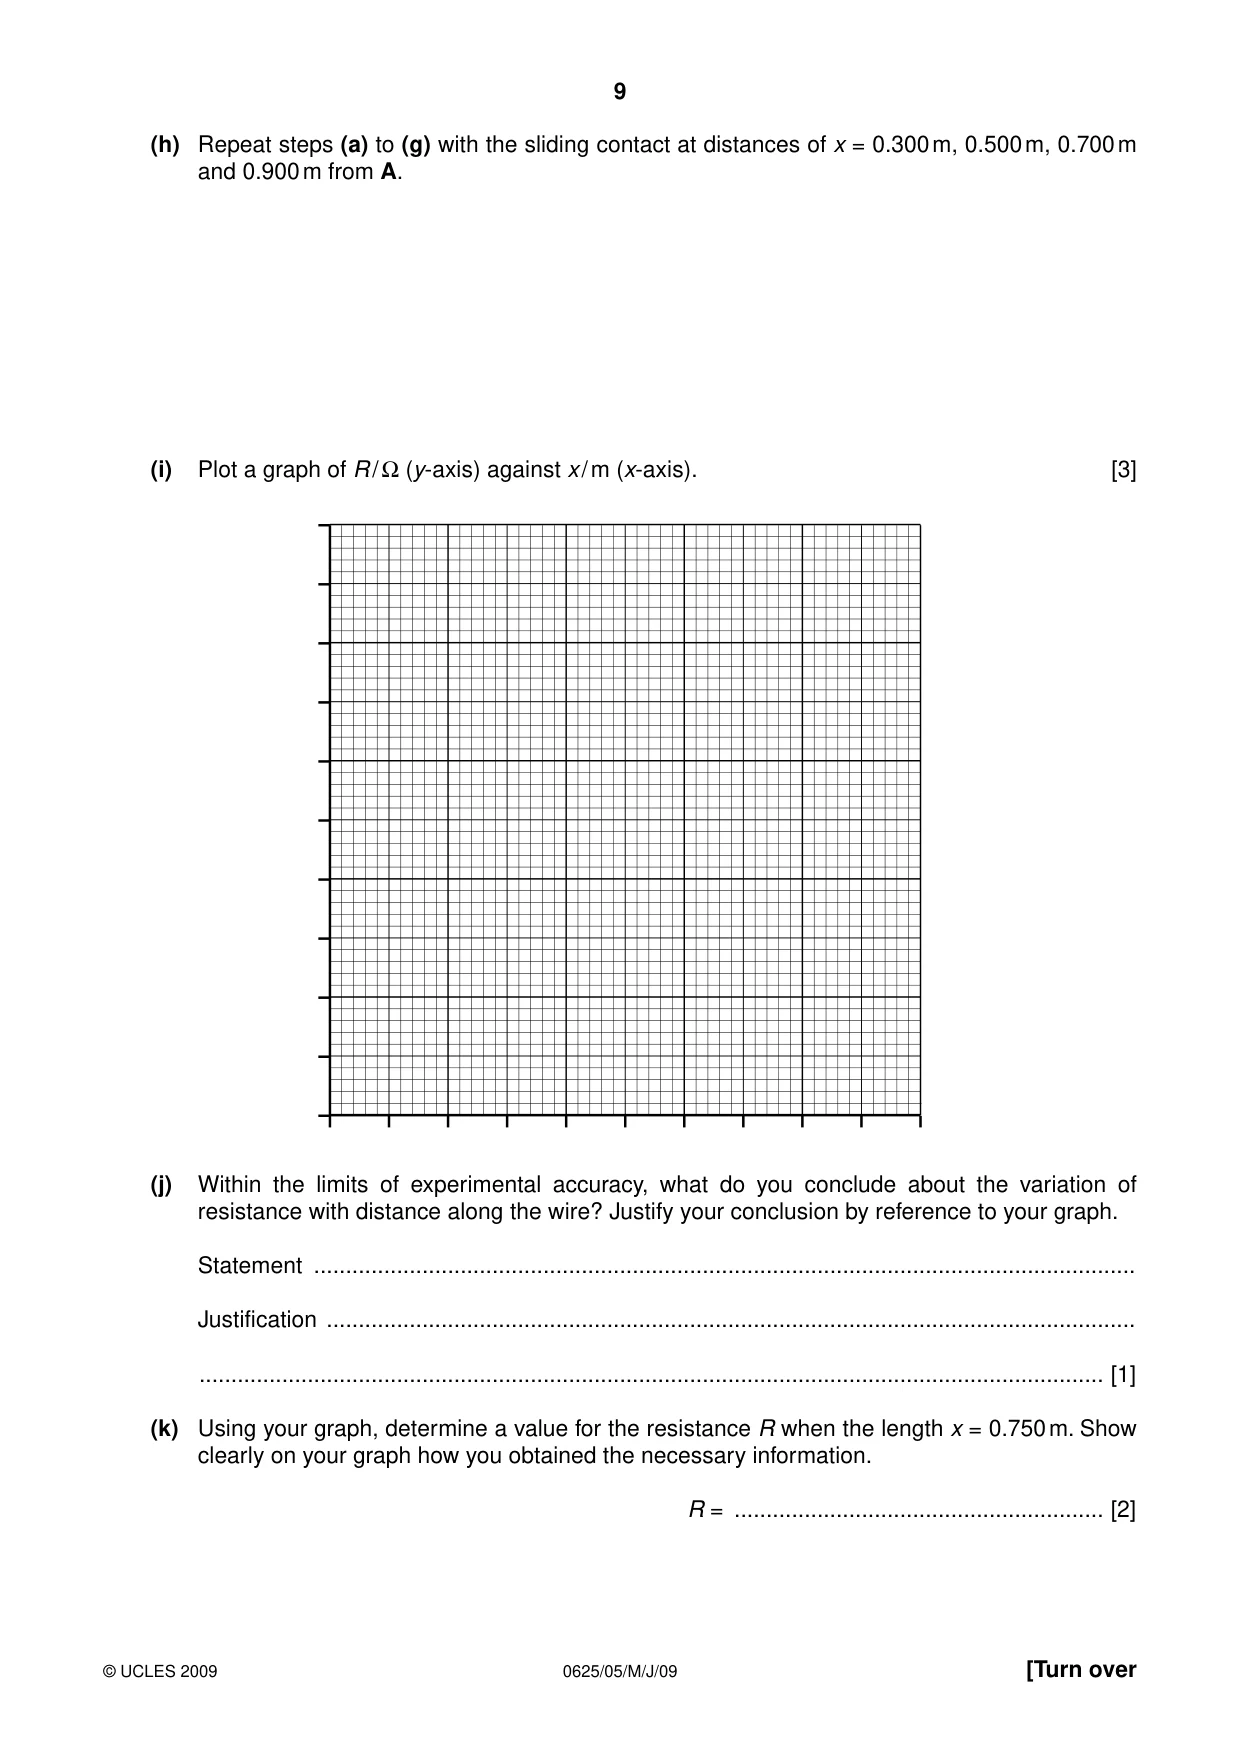
3 In this experiment, you will investigate the resistance of a wire. Carry out the following instructions referring to Fig. 3.1, which shows the circuit that has been set up for you. power source A x A B C V Fig. 3.1 You are provided with a length of resistance wire AB. (a) Place the sliding contact C on the resistance wire AB at a distance x from A, where x = 0.100 m. (b) Record the value of x in Table 3.1. (c) Switch on. Using the voltmeter, measure the p.d. V across the wire between A and C. Record the value of V in Table 3.1. (d) Using the ammeter, measure the current I in the wire. Record the value of I. I = .......................................................... [1] (e) Take the sliding contact away from the wire AB and switch off. V (f) Calculate the resistance R of the section AC of the wire using the equation R = . I (g) Record R in the table. Table 3.1 x / m V / V R / Ω [3] (h) Repeat steps (a) to (g) with the sliding contact at distances of x = 0.300 m, 0.500 m, 0.700 m and 0.900 m from A. (i) Plot a graph of R / Ω (y-axis) against x / m (x-axis). [3] (j) Within the limits of experimental accuracy, what do you conclude about the variation of resistance with distance along the wire? Justify your conclusion by reference to your graph. Statement ................................................................................................................................. Justification ............................................................................................................................... .............................................................................................................................................. [1] (k) Using your graph, determine a value for the resistance R when the length x = 0.750 m. Show clearly on your graph how you obtained the necessary information. R = .......................................................... [2]
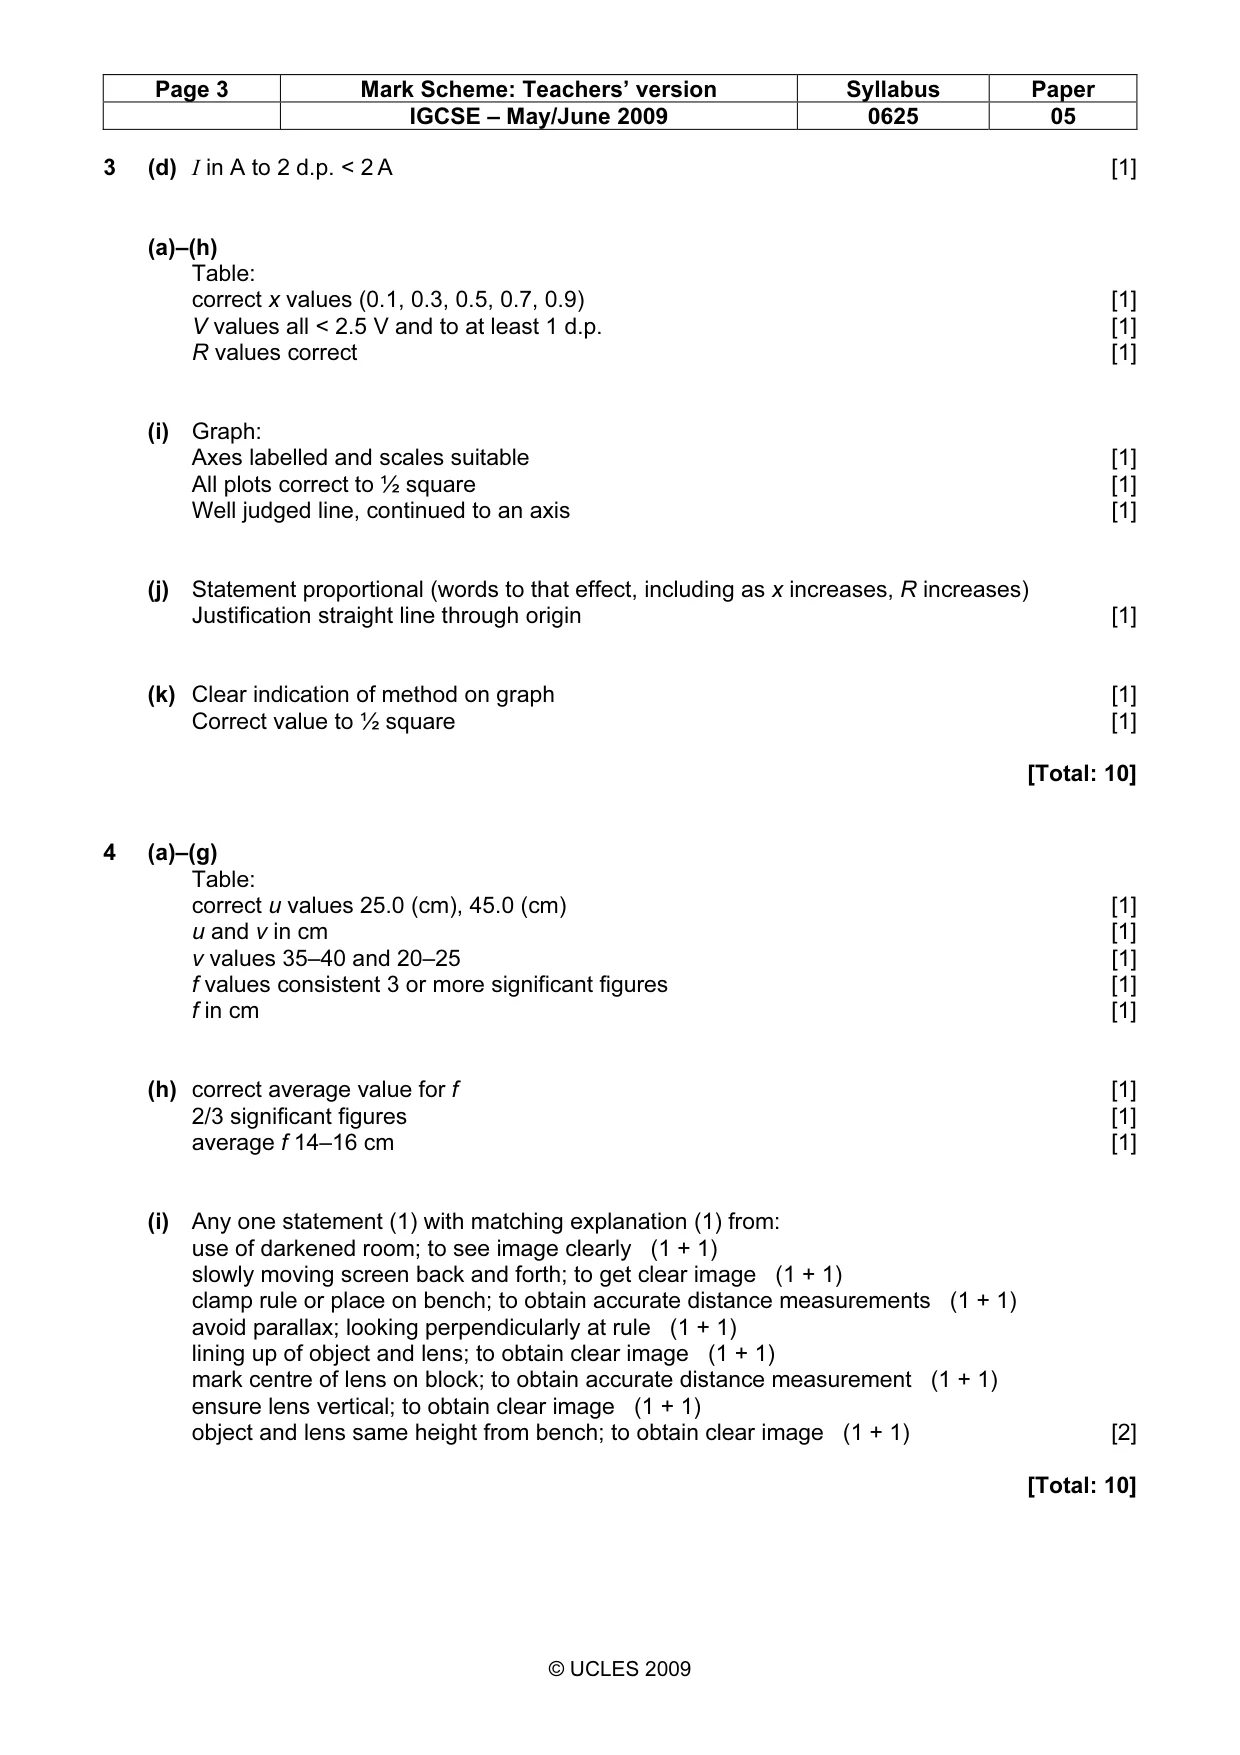
Mark scheme: 3 (d) I in A to 2 d.p. < 2 A [1] (a)–(h) Table: correct x values (0.1, 0.3, 0.5, 0.7, 0.9) [1] V values all < 2.5 V and to at least 1 d.p. [1] R values correct [1] (i) Graph: Axes labelled and scales suitable [1] All plots correct to ½ square [1] Well judged line, continued to an axis [1] (j) Statement proportional (words to that effect, including as x increases, R increases) Justification straight line through origin [1] (k) Clear indication of method on graph [1] Correct value to ½ square [1] [Total: 10]
More questions on Physical quantities and measurement techniques
Q4 · In this experiment, you are to determine the focal length of a converging lens
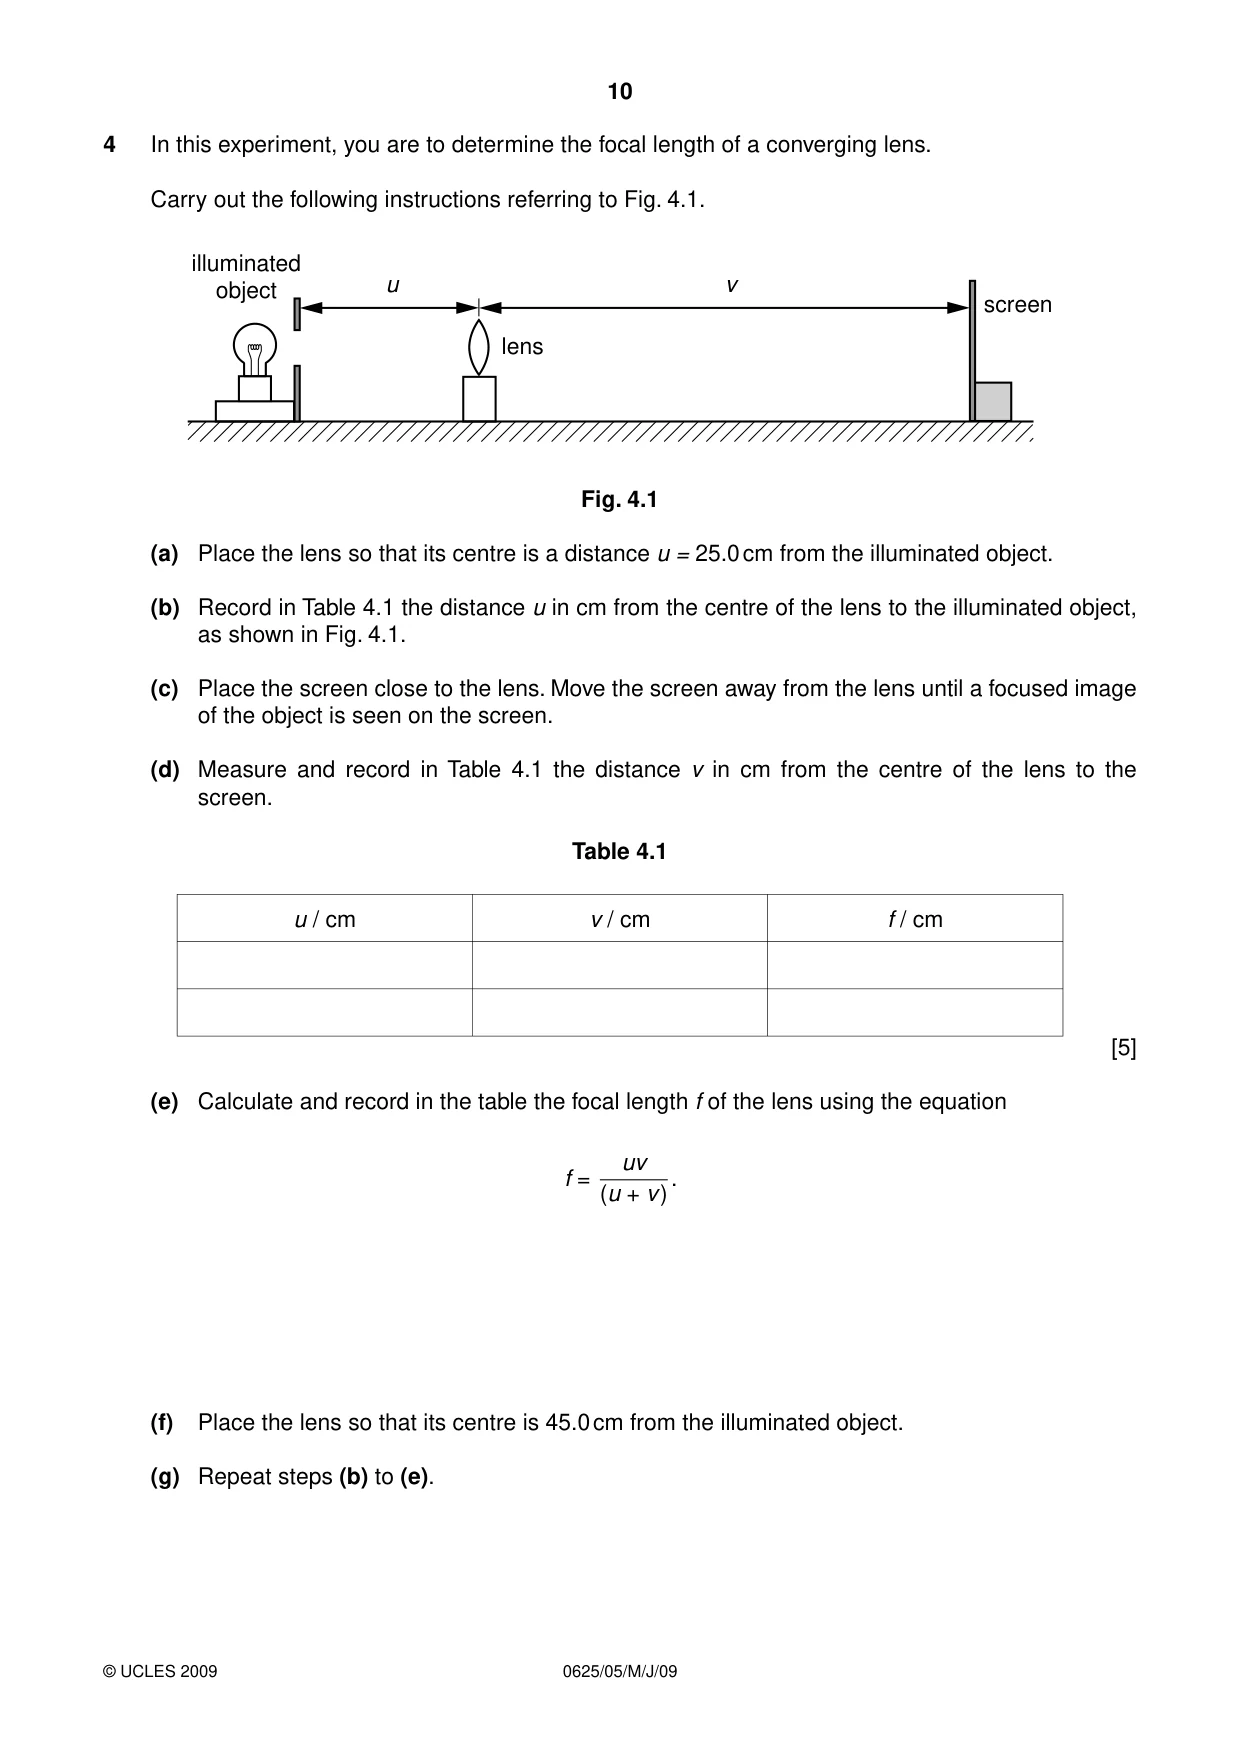
4 In this experiment, you are to determine the focal length of a converging lens. Carry out the following instructions referring to Fig. 4.1. illuminated object u v screen lens Fig. 4.1 (a) Place the lens so that its centre is a distance u = 25.0 cm from the illuminated object. (b) Record in Table 4.1 the distance u in cm from the centre of the lens to the illuminated object, as shown in Fig. 4.1. (c) Place the screen close to the lens. Move the screen away from the lens until a focused image of the object is seen on the screen. (d) Measure and record in Table 4.1 the distance v in cm from the centre of the lens to the screen. Table 4.1 u / cm v / cm f / cm [5] (e) Calculate and record in the table the focal length f of the lens using the equation uv f = (u + v). (f) Place the lens so that its centre is 45.0 cm from the illuminated object. (g) Repeat steps (b) to (e). (h) Calculate the average value of the focal length. Average value of the focal length = ............................................................... [3] (i) State and briefly explain one precaution you took in order to obtain reliable measurements. Statement ................................................................................................................................. Explanation ............................................................................................................................... .............................................................................................................................................. [2]
Mark scheme: 4 (a)–(g) Table: correct u values 25.0 (cm), 45.0 (cm) [1] u and v in cm [1] v values 35–40 and 20–25 [1] f values consistent 3 or more significant figures [1] f in cm [1] (h) correct average value for f [1] 2/3 significant figures [1] average f 14–16 cm [1] (i) Any one statement (1) with matching explanation (1) from: use of darkened room; to see image clearly (1 + 1) slowly moving screen back and forth; to get clear image (1 + 1) clamp rule or place on bench; to obtain accurate distance measurements (1 + 1) avoid parallax; looking perpendicularly at rule (1 + 1) lining up of object and lens; to obtain clear image (1 + 1) mark centre of lens on block; to obtain accurate distance measurement (1 + 1) ensure lens vertical; to obtain clear image (1 + 1) object and lens same height from bench; to obtain clear image (1 + 1) [2] [Total: 10]
What was in this paper
The subtopics covered by these 4 questions, and how many questions each got. Open one in a new tab to see every Cambridge question on it.
What you needed in this session
Cambridge’s own grade thresholds for 2009 May/June, Paper 5 · Variant 1. A higher threshold means an easier paper — the bar moves with how the cohort did.