Cambridge IGCSE Physics 0625 — 2008 Oct/Nov Paper 5 · Variant 1
0625/51/O/N/08 · 4 questions · 40 marks · ≈45 min
The question paper and its mark scheme, free to read here and free to download. This is Cambridge’s own paper, exactly as it was sat.
Question paper12 pages
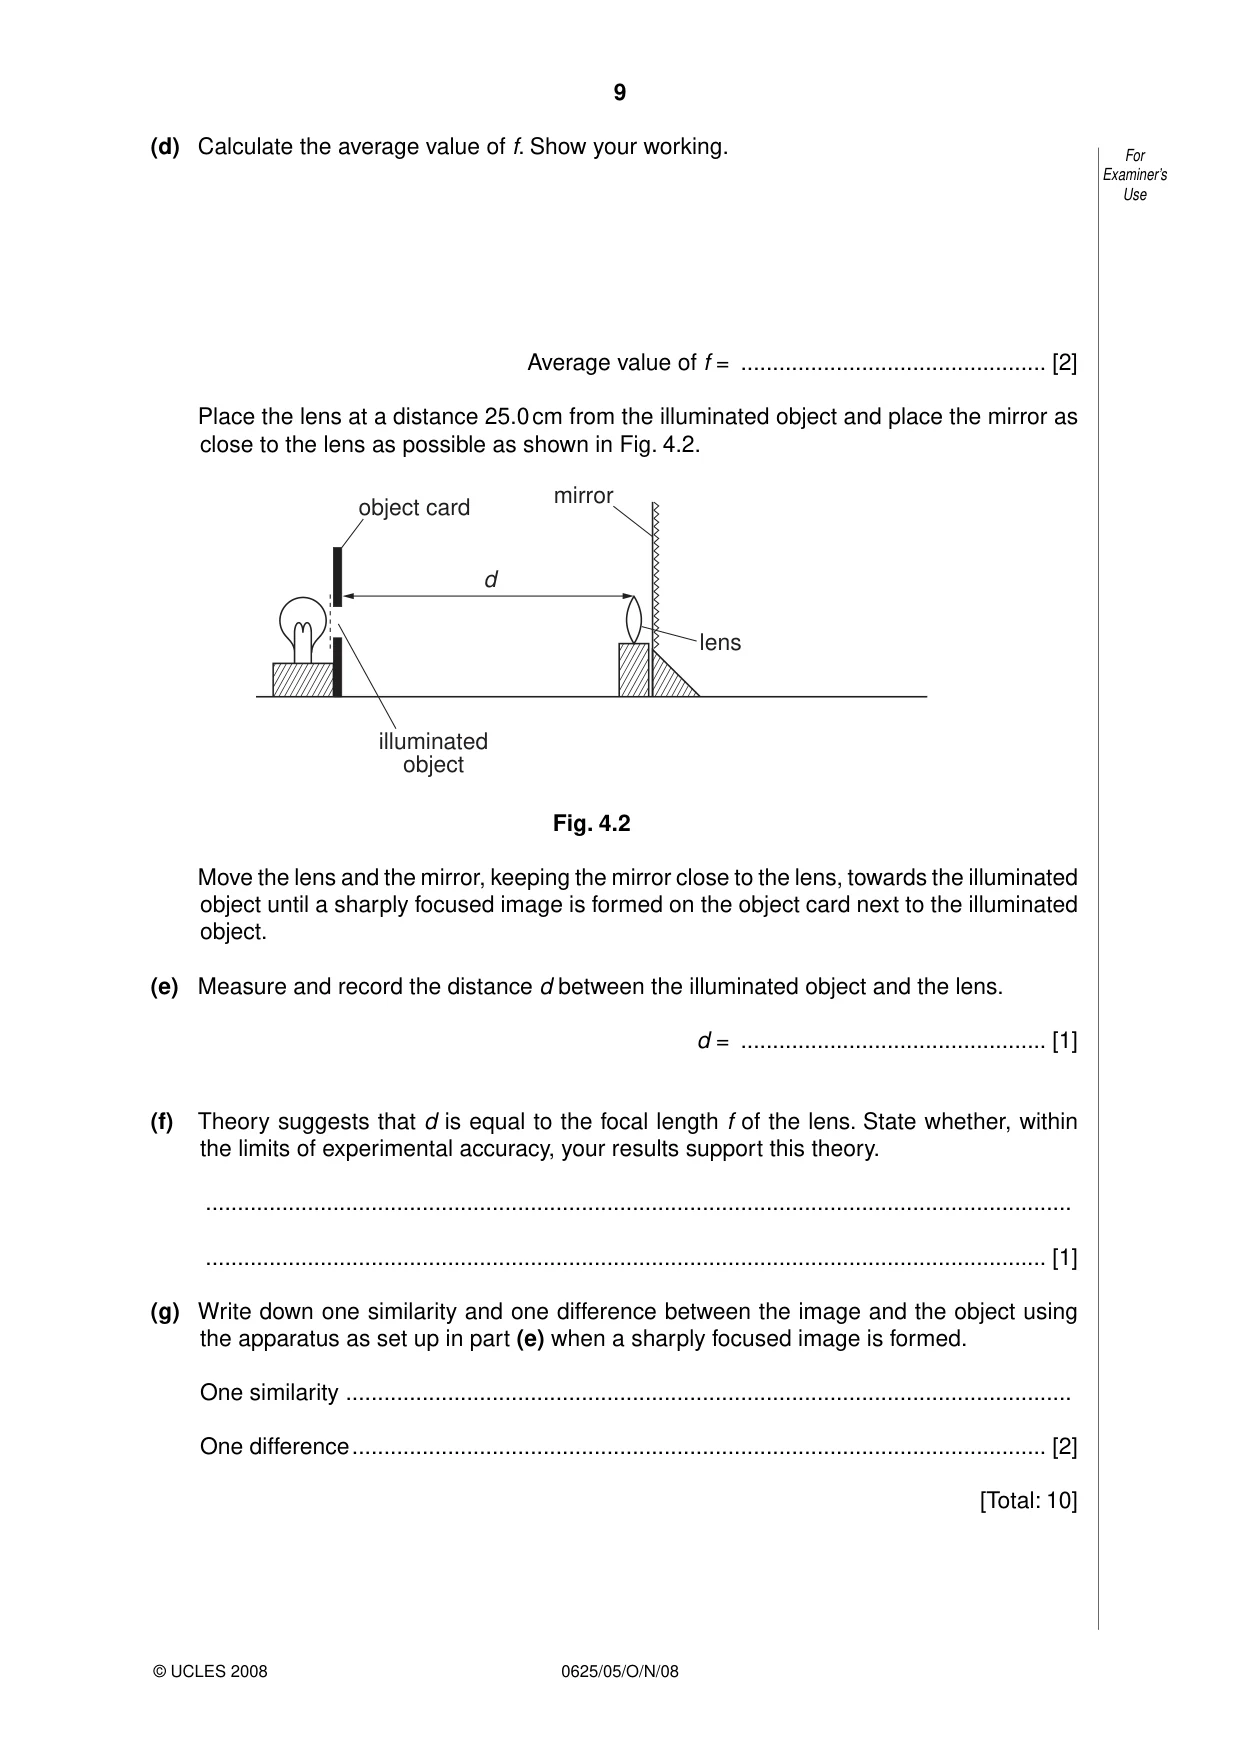



Mark scheme3 pages
Answers below. Sit the paper first if you are practising.
Questions as text
Q1 · In this experiment you will determine the density of the metal from which a load is made
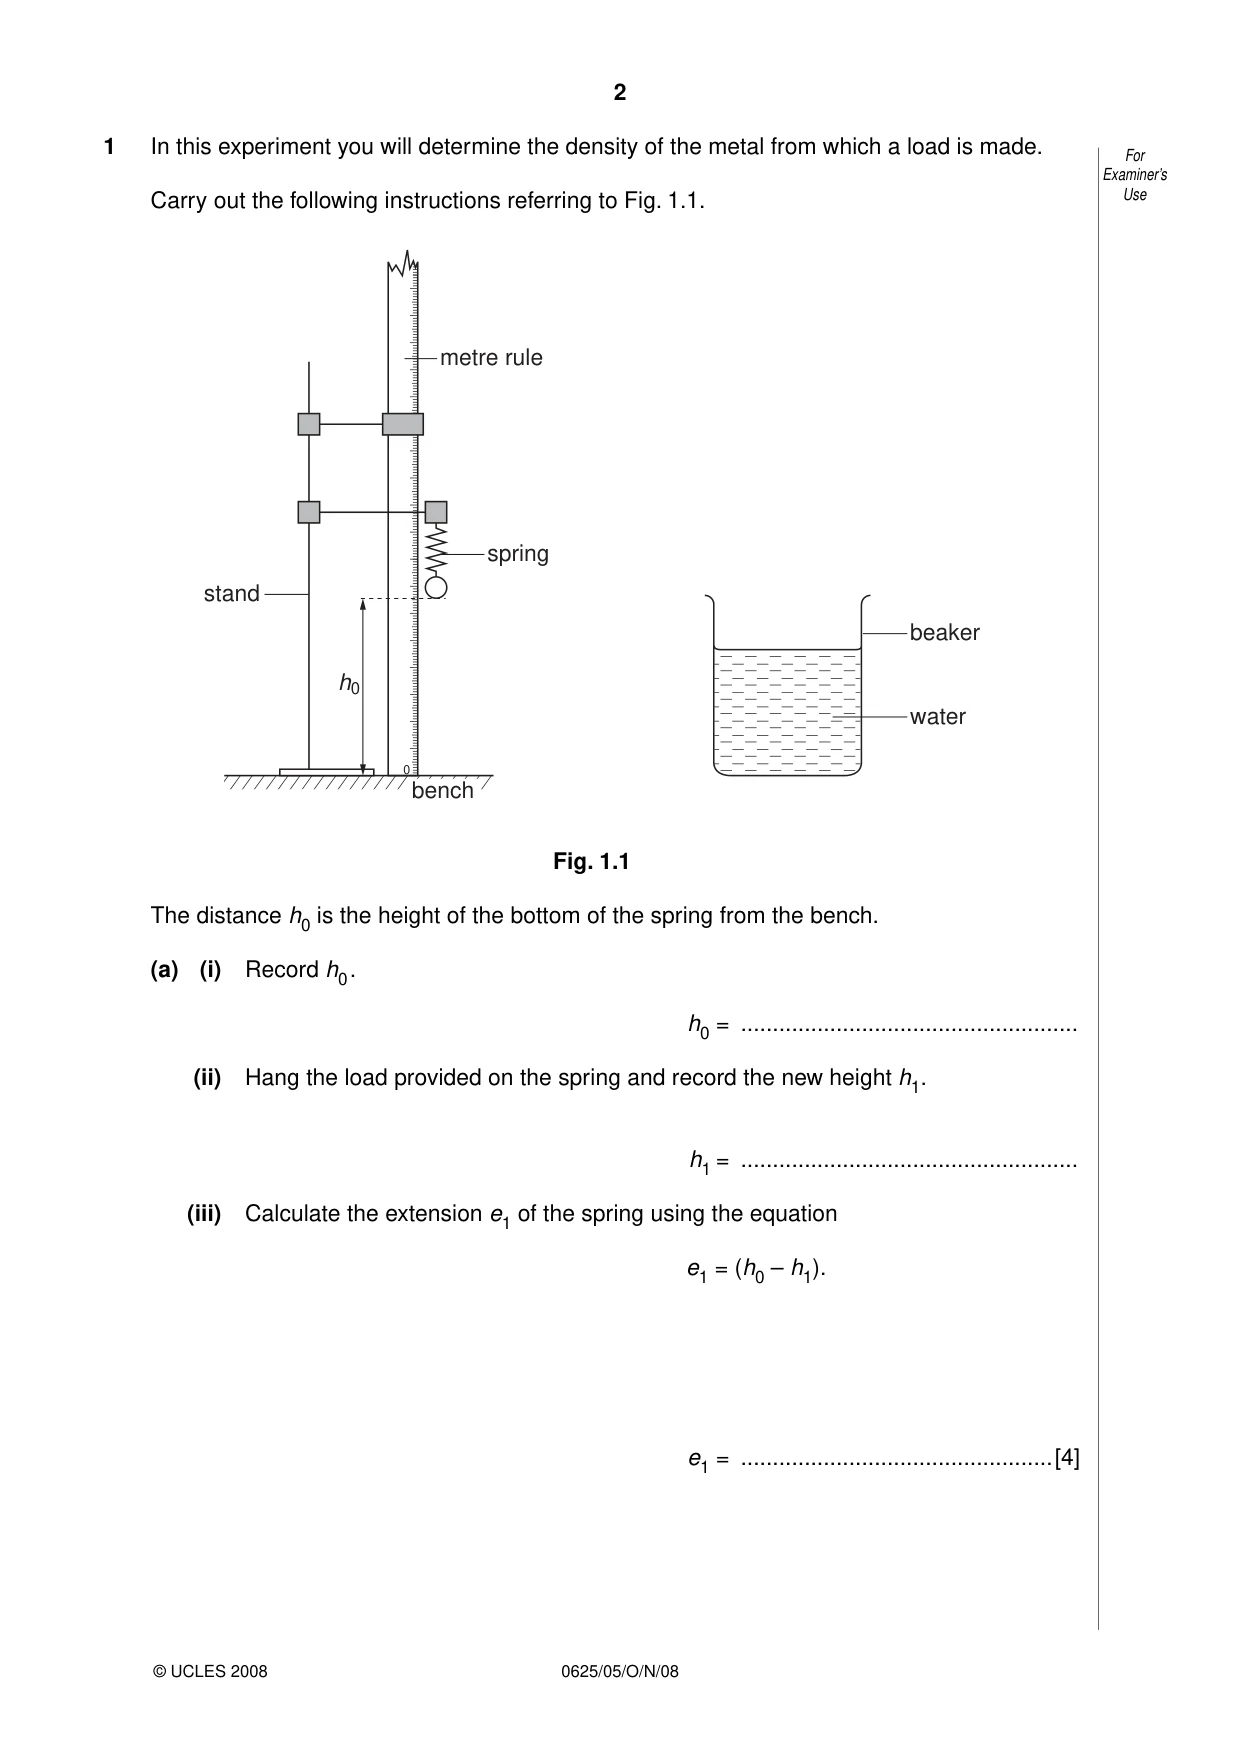
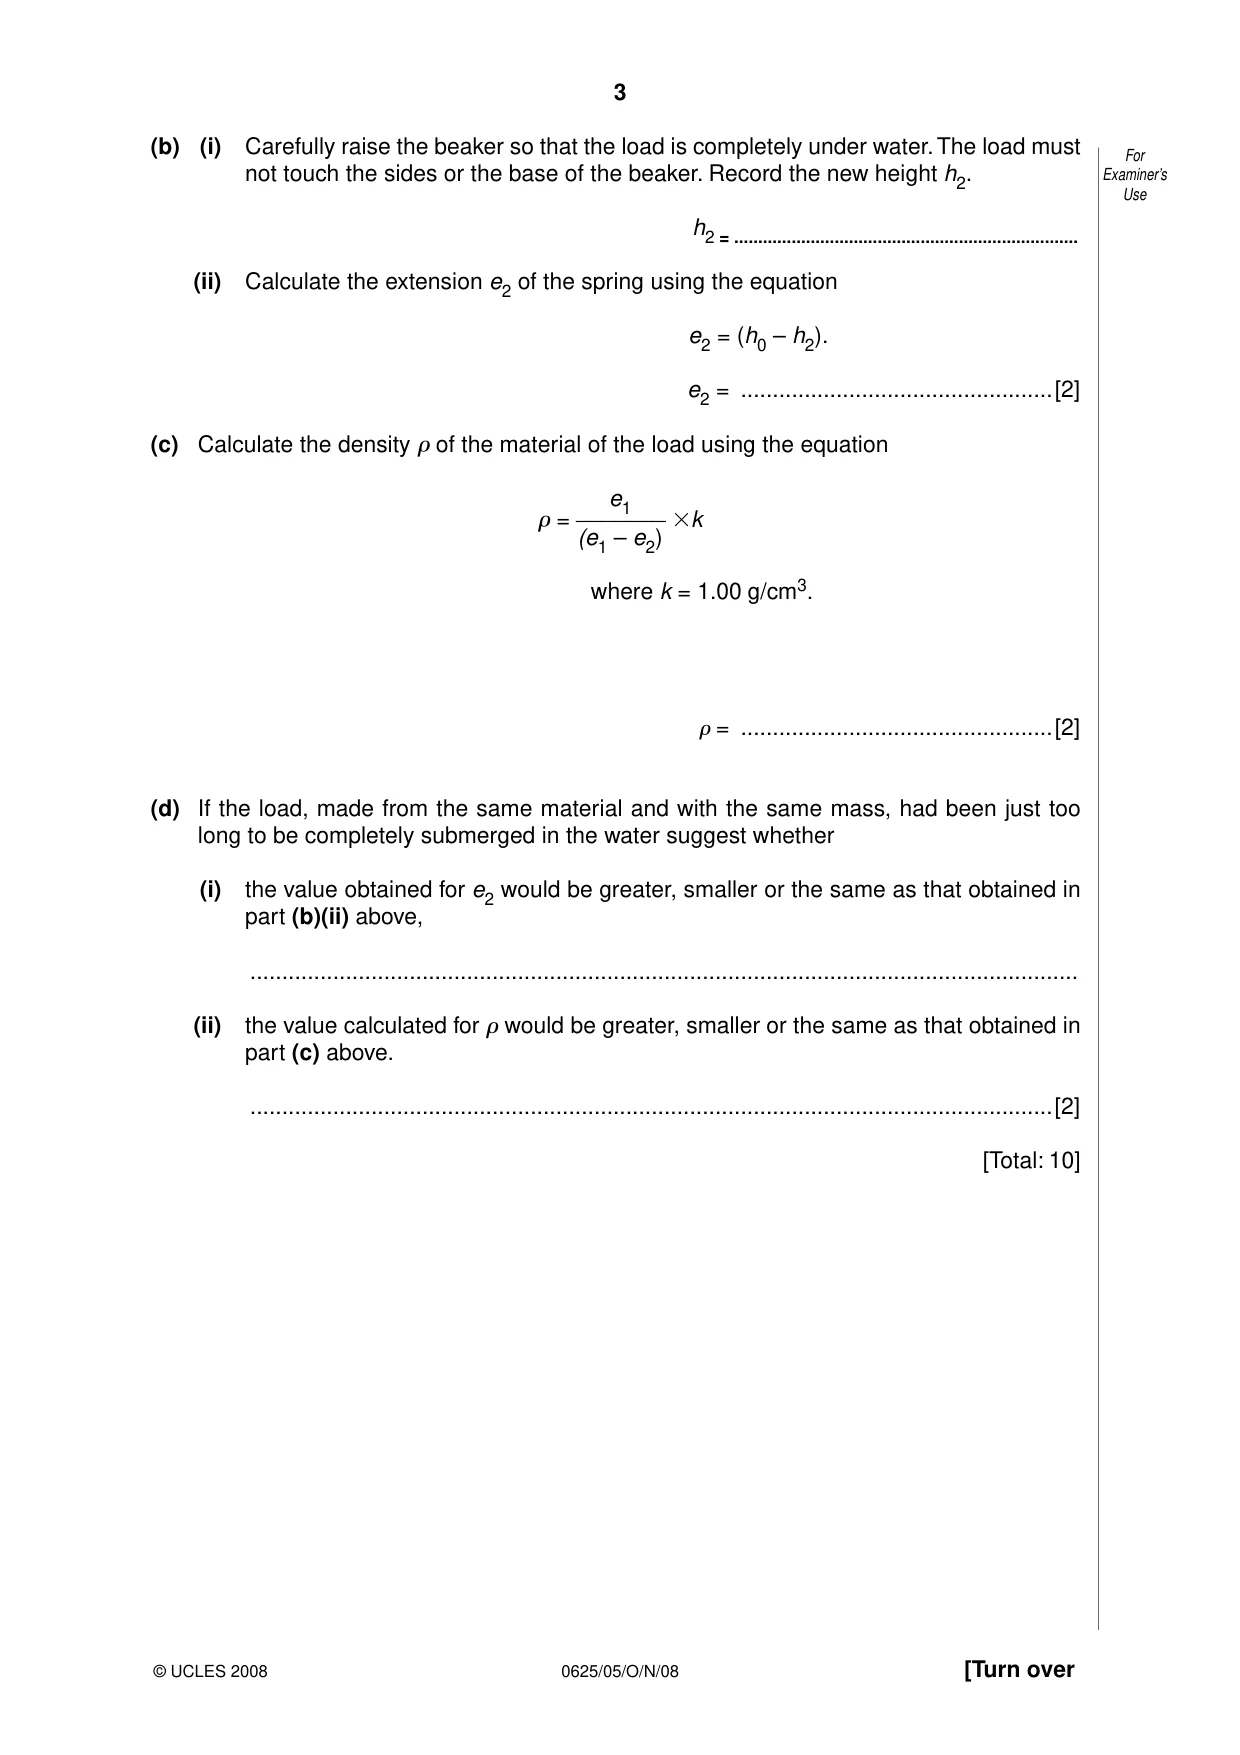
1 In this experiment you will determine the density of the metal from which a load is made. For Examiner’s Carry out the following instructions referring to Fig. 1.1. Use metre rule spring stand beaker h0 water 0 bench Fig. 1.1 The distance h is the height of the bottom of the spring from the bench. 0 (a) (i) Record h . 0 h = ..................................................... 0 (ii) Hang the load provided on the spring and record the new height h 1. h = ..................................................... 1 (iii) Calculate the extension e1 of the spring using the equation e1 = (h0 – h1). e1 = .................................................[4] (b) (i) Carefully raise the beaker so that the load is completely under water. The load must For not touch the sides or the base of the beaker. Record the new height h2. Examiner’s Use h2 = ........................................................................ (ii) Calculate the extension e2 of the spring using the equation e2 = (h0 – h2). e2 = .................................................[2] (c) Calculate the density of the material of the load using the equation _______e1 = k (e1 – e2) where k = 1.00 g/cm3. = .................................................[2] (d) If the load, made from the same material and with the same mass, had been just too long to be completely submerged in the water suggest whether (i) the value obtained for e2 would be greater, smaller or the same as that obtained in part (b)(ii) above, .................................................................................................................................. (ii) the value calculated for would be greater, smaller or the same as that obtained in part (c) above. ..............................................................................................................................[2] [Total: 10]
Mark scheme: 1 (a) (i) & (ii) h0 value [1] h1 value < h0 value [1] (iii) correct e1 value [1] all above in correct unit (m, cm, mm) stated at least once [1] (b) (i) & (ii) h2 value, <h0 and > h1 [1] e2 value correct [1] (c) density calculation correct [1] 2/3 significant figures, value 6–10 g/cm3 [1] (d) e2 greater [1] ρ greater (or identical to e2 answer) [1] [Total: 10]
More questions on Physical quantities and measurement techniques
Q2 · In this experiment, you will investigate the potential difference across and the current…
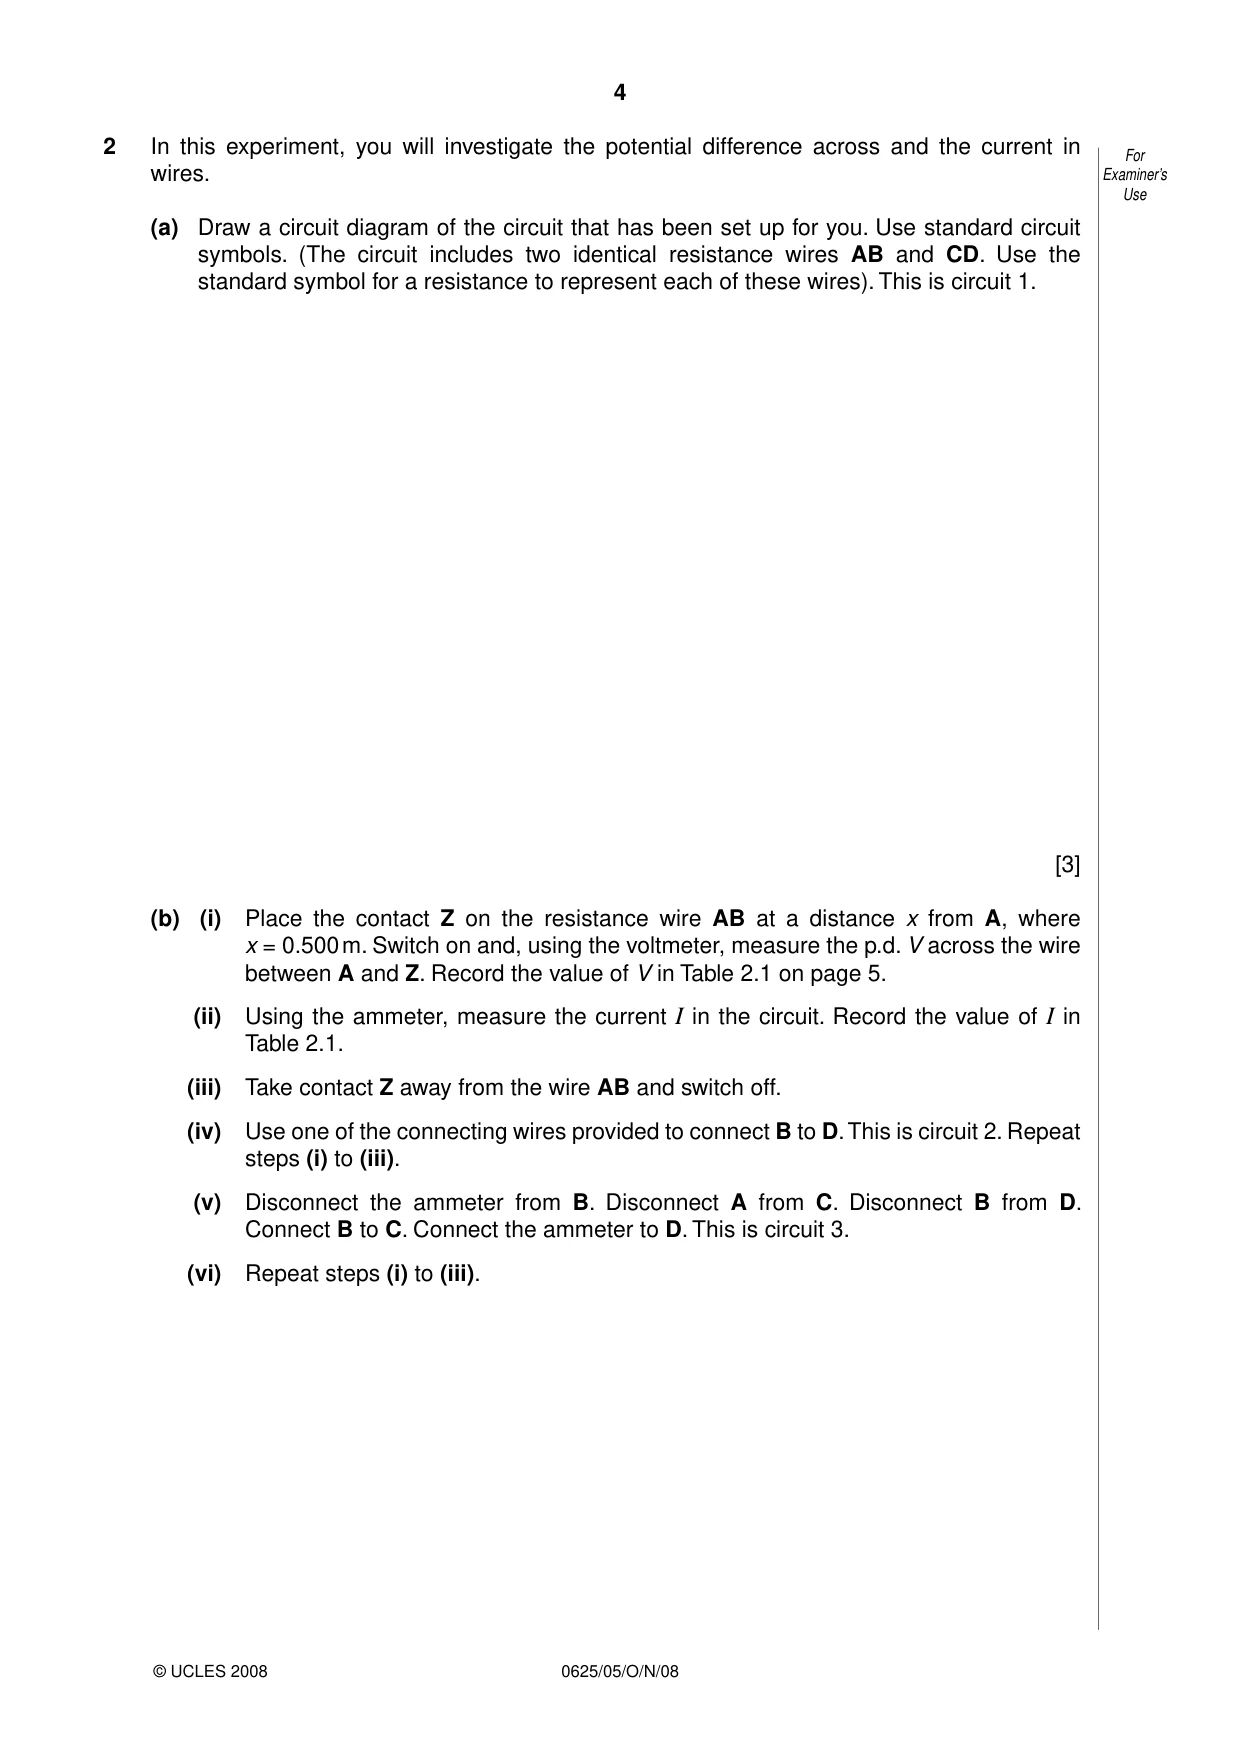
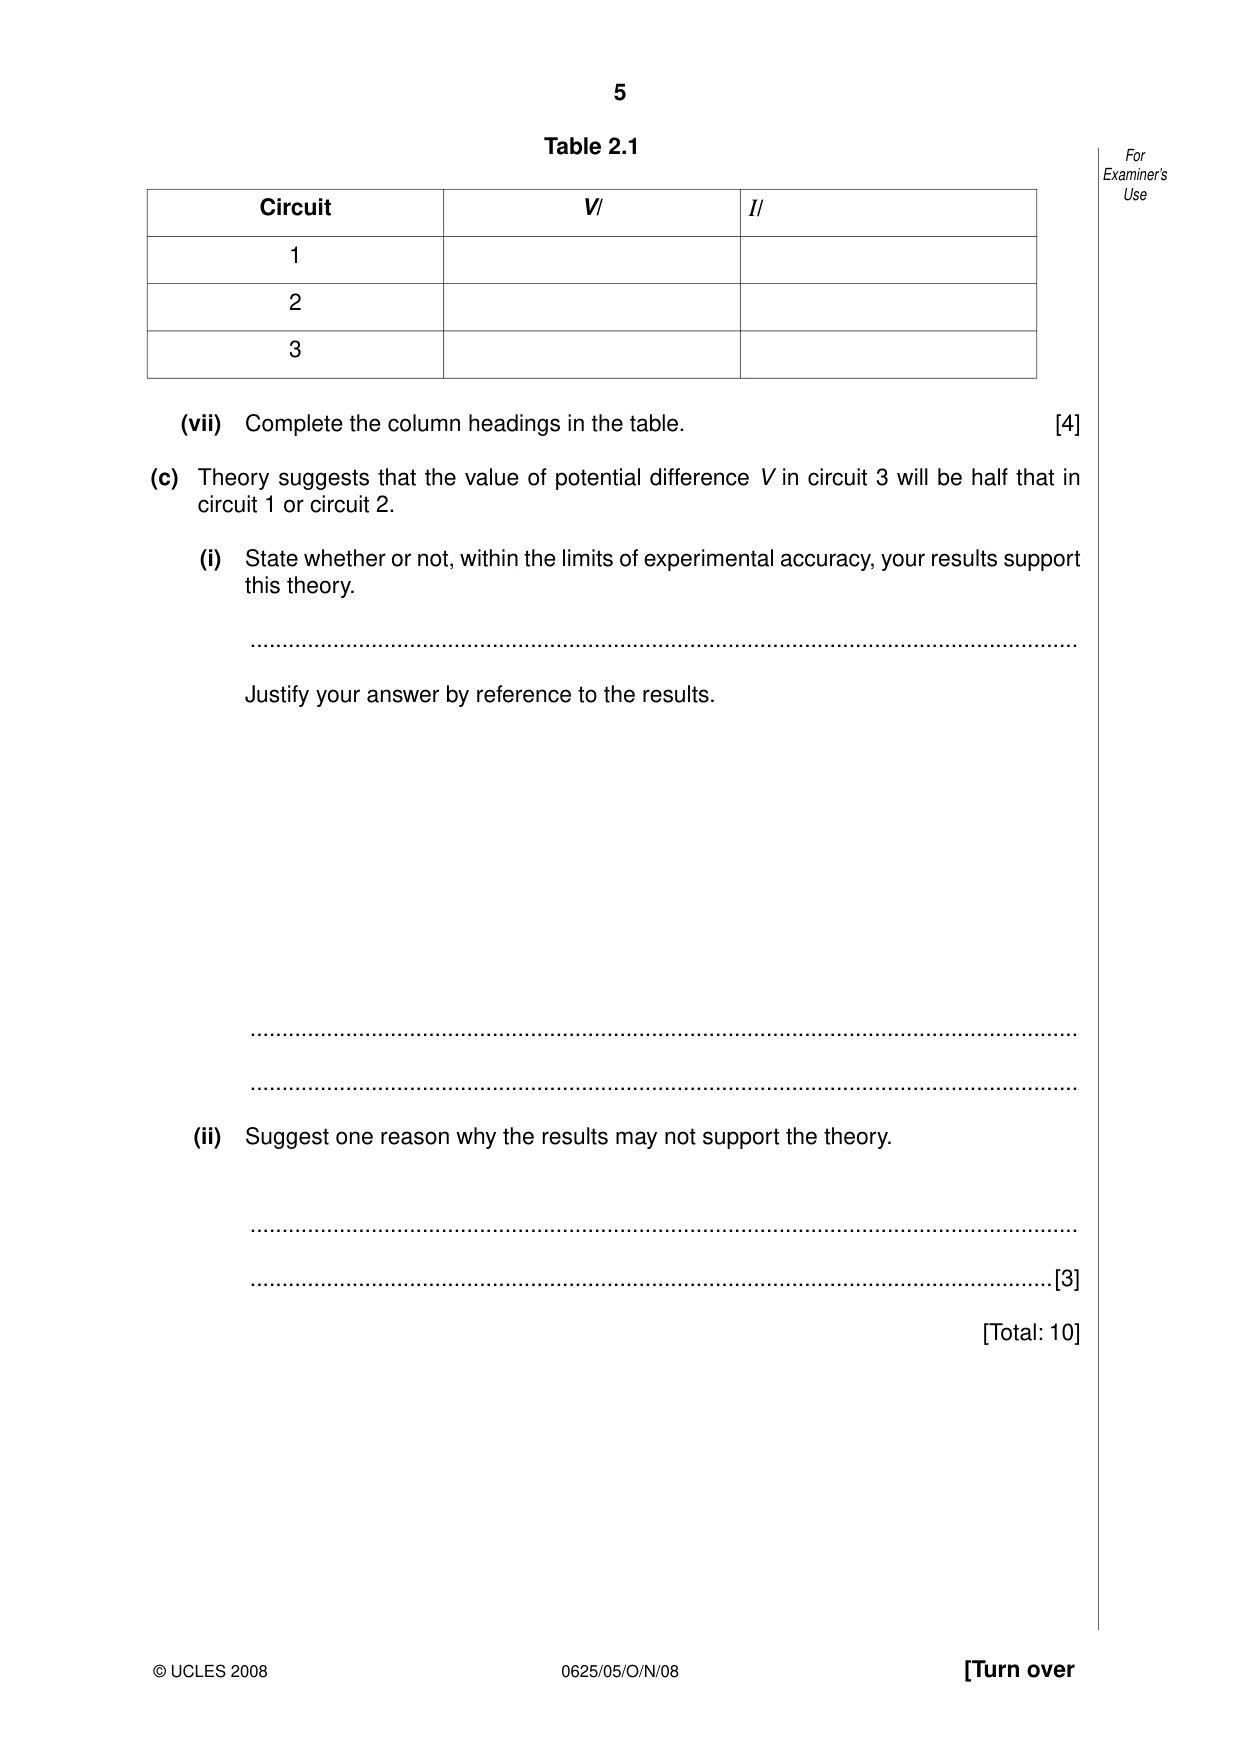
2 In this experiment, you will investigate the potential difference across and the current in For wires. Examiner’s Use (a) Draw a circuit diagram of the circuit that has been set up for you. Use standard circuit symbols. (The circuit includes two identical resistance wires AB and CD. Use the standard symbol for a resistance to represent each of these wires). This is circuit 1. [3] (b) (i) Place the contact Z on the resistance wire AB at a distance x from A, where x = 0.500 m. Switch on and, using the voltmeter, measure the p.d. V across the wire between A and Z. Record the value of V in Table 2.1 on page 5. (ii) Using the ammeter, measure the current I in the circuit. Record the value of I in Table 2.1. (iii) Take contact Z away from the wire AB and switch off. (iv) Use one of the connecting wires provided to connect B to D. This is circuit 2. Repeat steps (i) to (iii). (v) Disconnect the ammeter from B. Disconnect A from C. Disconnect B from D. Connect B to C. Connect the ammeter to D. This is circuit 3. (vi) Repeat steps (i) to (iii). Table 2.1 For Examiner’s Use Circuit V/ I/ 1 2 3 (vii) Complete the column headings in the table. [4] (c) Theory suggests that the value of potential difference V in circuit 3 will be half that in circuit 1 or circuit 2. (i) State whether or not, within the limits of experimental accuracy, your results support this theory. .................................................................................................................................. Justify your answer by reference to the results. .................................................................................................................................. .................................................................................................................................. (ii) Suggest one reason why the results may not support the theory. .................................................................................................................................. ..............................................................................................................................[3] [Total: 10]
Mark scheme: 2 Diagram: correct symbols for ammeter and voltmeter [1] correct symbols for resistor [1] correct circuit arrangement [1] Table: units V, A (symbol/word) [1] All V to at least 1 d.p., < 1.5 V [1] All I to at least 2 d.p., Y 1 A [1] Circuit 3 V < circuit 1 and 2 values [1] (i) Statement: Yes (if within 10%) No (if not) [1] Justification: must match statement (e.g. close enough/too different or words to that effect) [1] Resistance at connections/temperature change/ Internal resistance of source/other sensible suggestion [1] [Total: 10] IGCSE – October/November 2008 0625 5
Q3 · In this experiment you are to investigate the change in temperature of hot water as water…
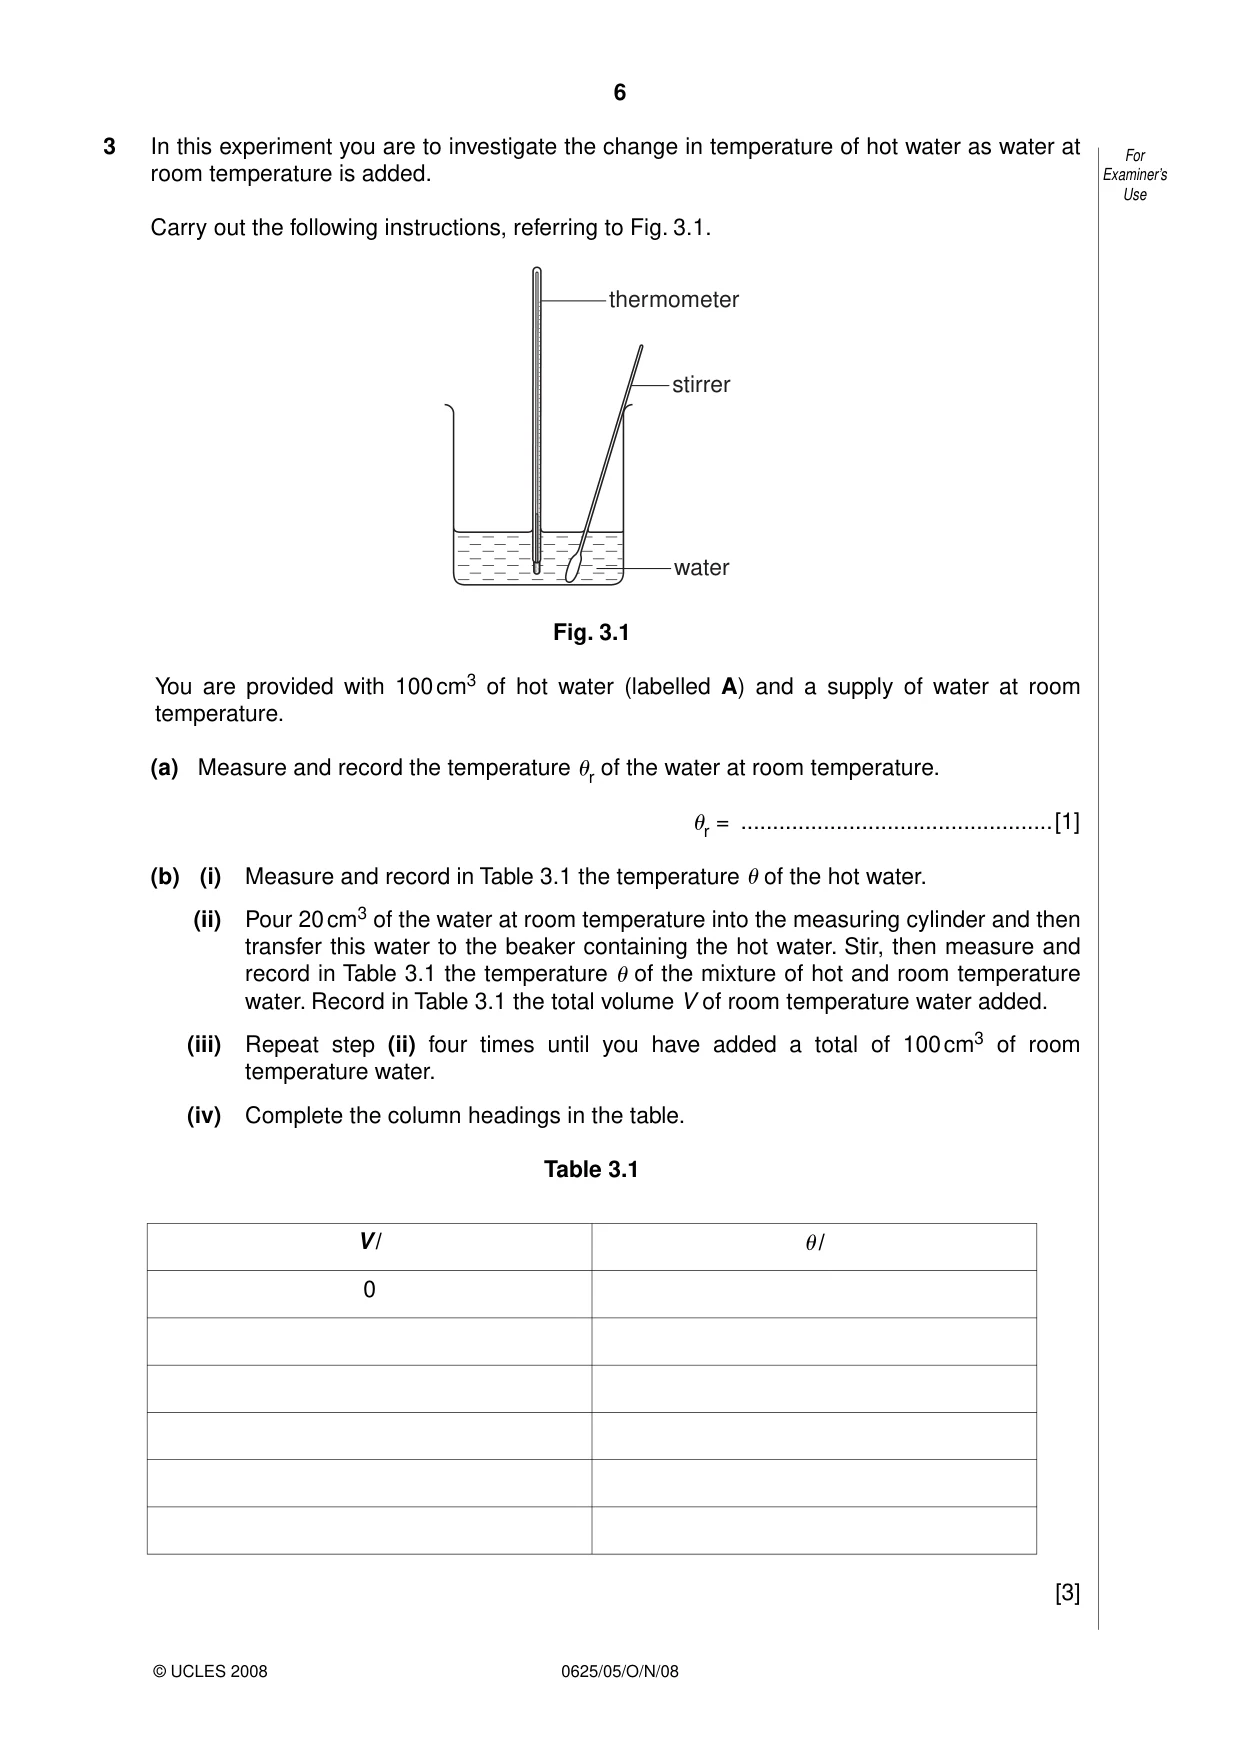
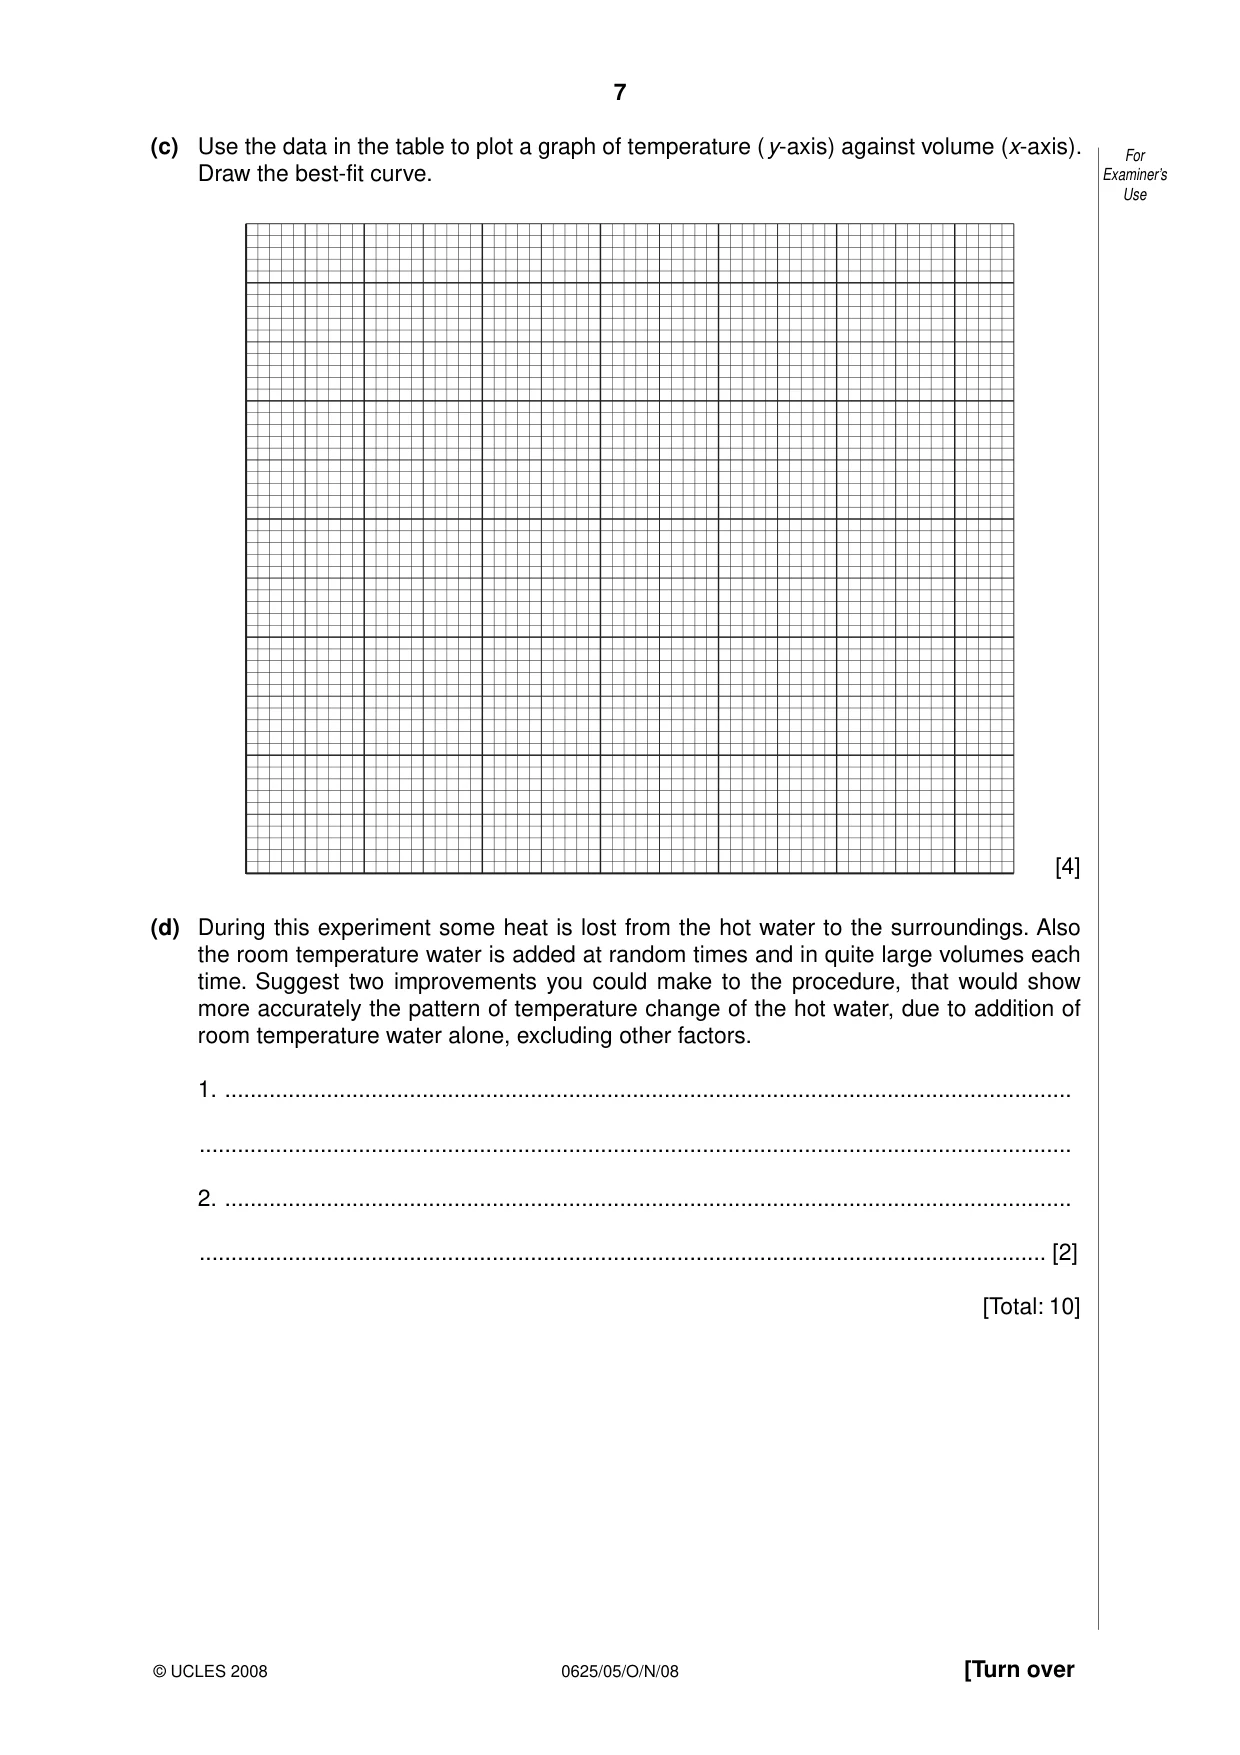
3 In this experiment you are to investigate the change in temperature of hot water as water at For room temperature is added. Examiner’s Use Carry out the following instructions, referring to Fig. 3.1. thermometer stirrer water Fig. 3.1 You are provided with 100 cm3 of hot water (labelled A) and a supply of water at room temperature. (a) Measure and record the temperature of the water at room temperature. r = .................................................[1] r (b) (i) Measure and record in Table 3.1 the temperature of the hot water. (ii) Pour 20 cm3 of the water at room temperature into the measuring cylinder and then transfer this water to the beaker containing the hot water. Stir, then measure and record in Table 3.1 the temperature of the mixture of hot and room temperature water. Record in Table 3.1 the total volume V of room temperature water added. (iii) Repeat step (ii) four times until you have added a total of 100 cm3 of room temperature water. (iv) Complete the column headings in the table. Table 3.1 V / / 0 [3] (c) Use the data in the table to plot a graph of temperature ( y-axis) against volume (x-axis). For Draw the best-fit curve. Examiner’s Use [4] (d) During this experiment some heat is lost from the hot water to the surroundings. Also the room temperature water is added at random times and in quite large volumes each time. Suggest two improvements you could make to the procedure, that would show more accurately the pattern of temperature change of the hot water, due to addition of room temperature water alone, excluding other factors. 1. ..................................................................................................................................... ......................................................................................................................................... 2. ..................................................................................................................................... ..................................................................................................................................... [2] [Total: 10]
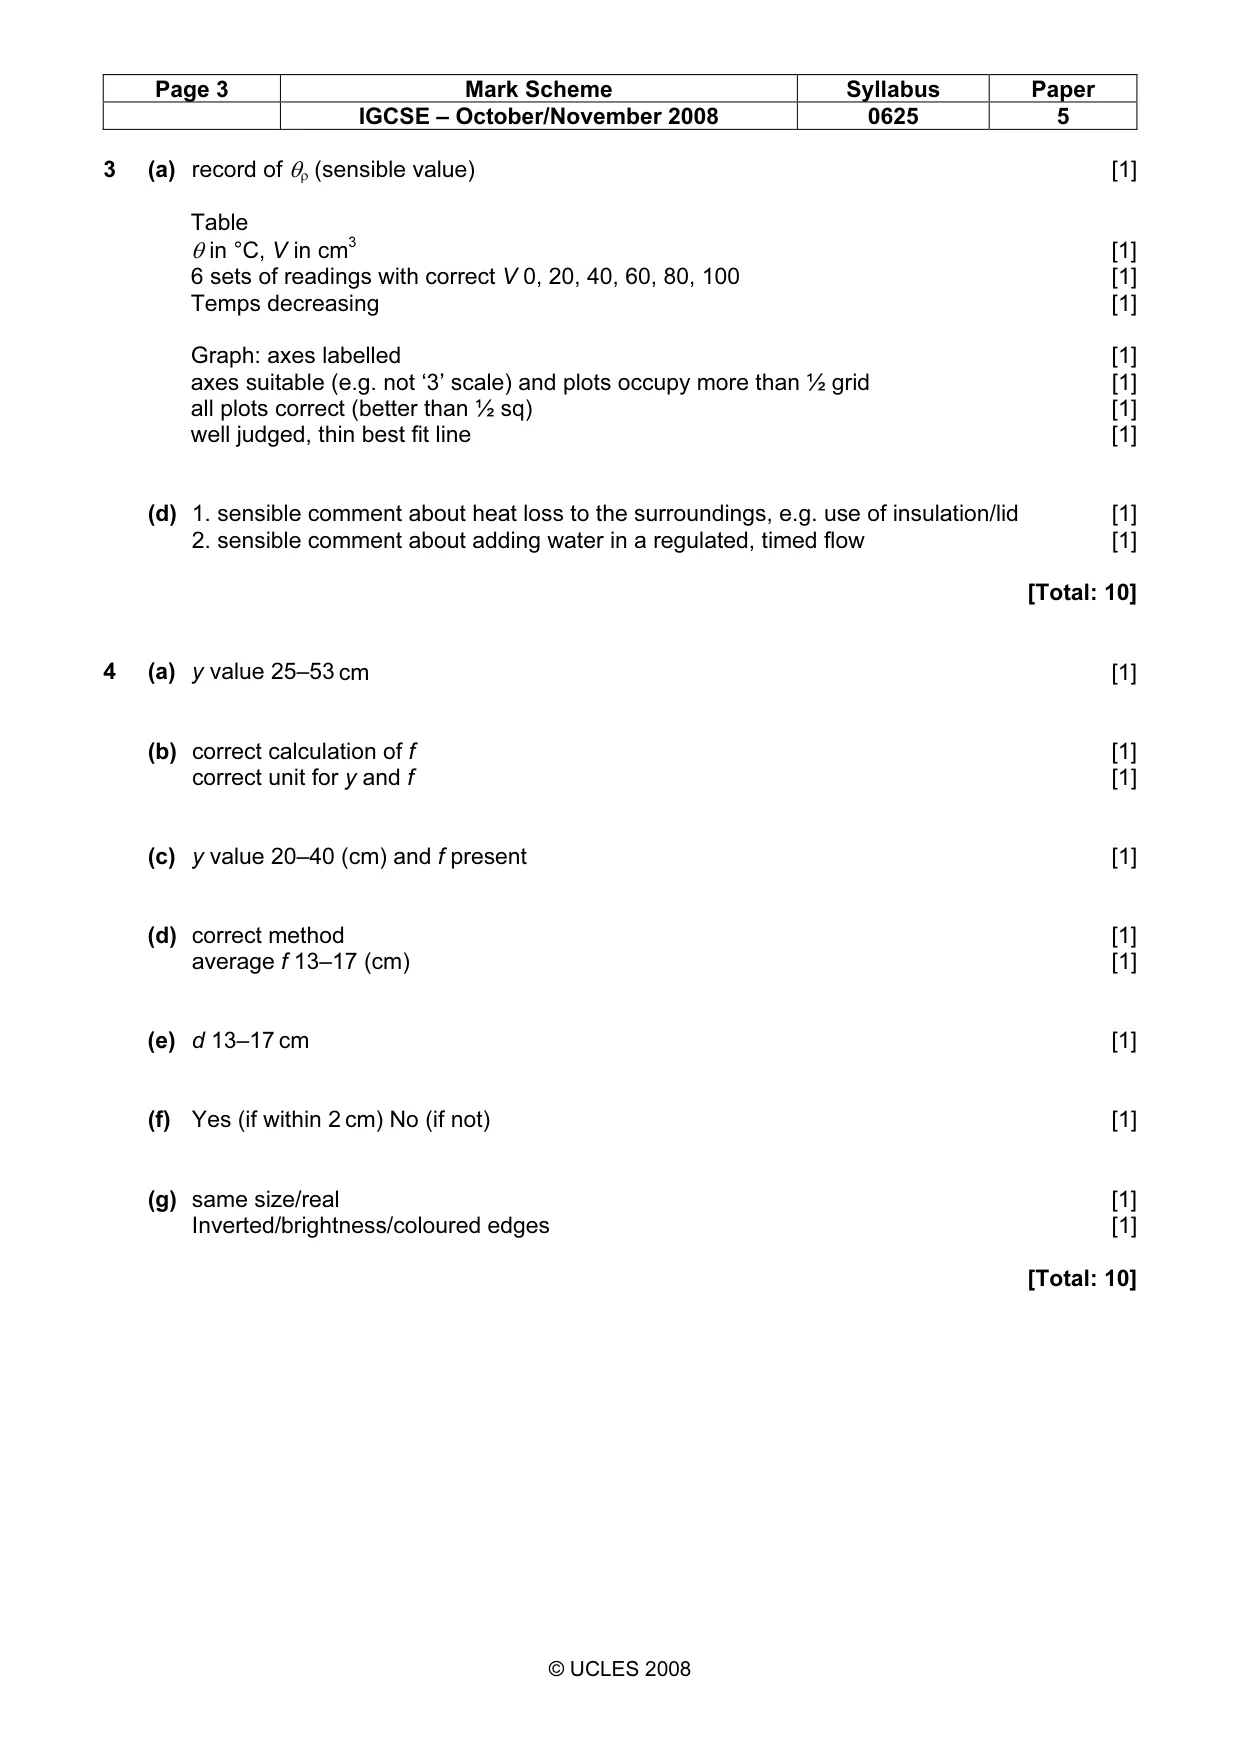
Mark scheme: 3 (a) record of θρ (sensible value) [1] Table θ in °C, V in cm3 [1] 6 sets of readings with correct V 0, 20, 40, 60, 80, 100 [1] Temps decreasing [1] Graph: axes labelled [1] axes suitable (e.g. not ‘3’ scale) and plots occupy more than ½ grid [1] all plots correct (better than ½ sq) [1] well judged, thin best fit line [1] (d) 1. sensible comment about heat loss to the surroundings, e.g. use of insulation/lid [1] 2. sensible comment about adding water in a regulated, timed flow [1] [Total: 10]
Q4 · In this experiment, you are to determine the focal length of a converging lens
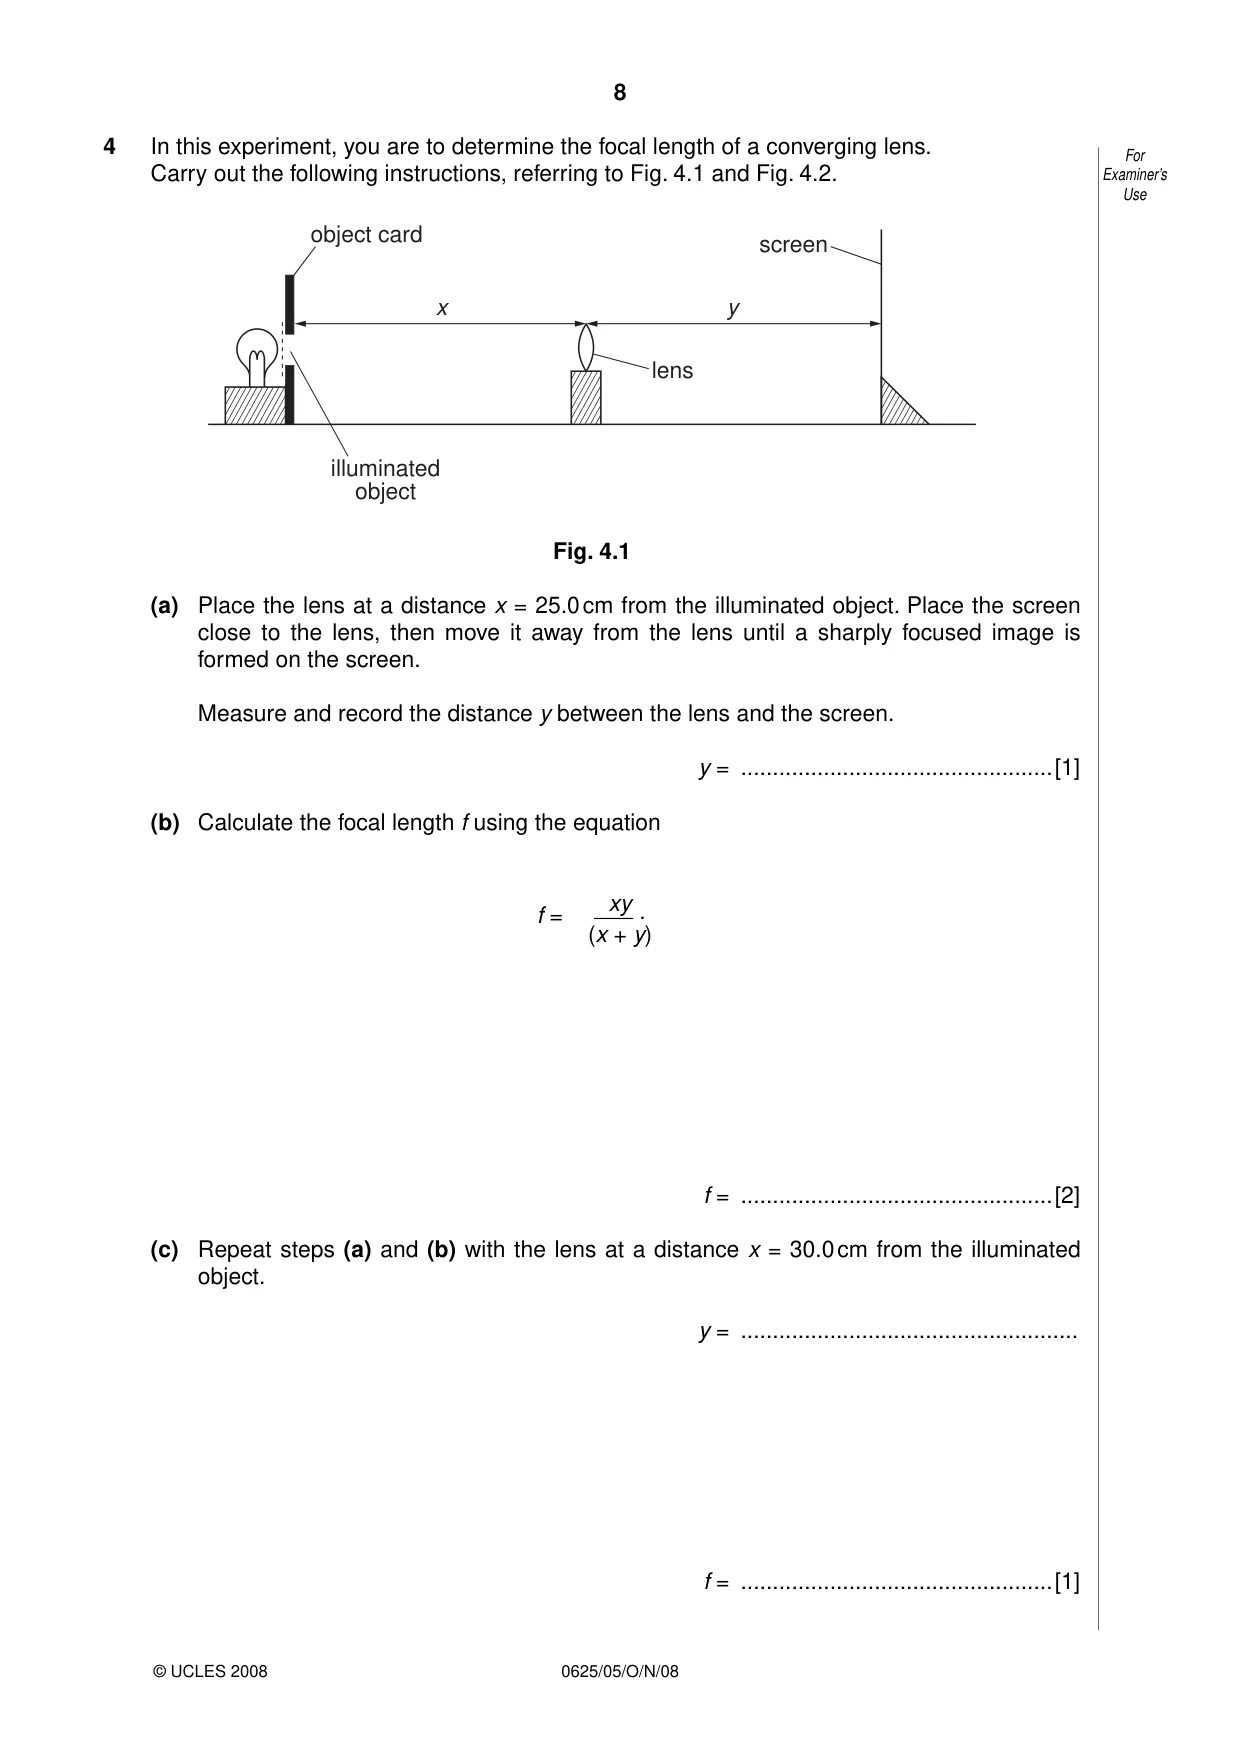
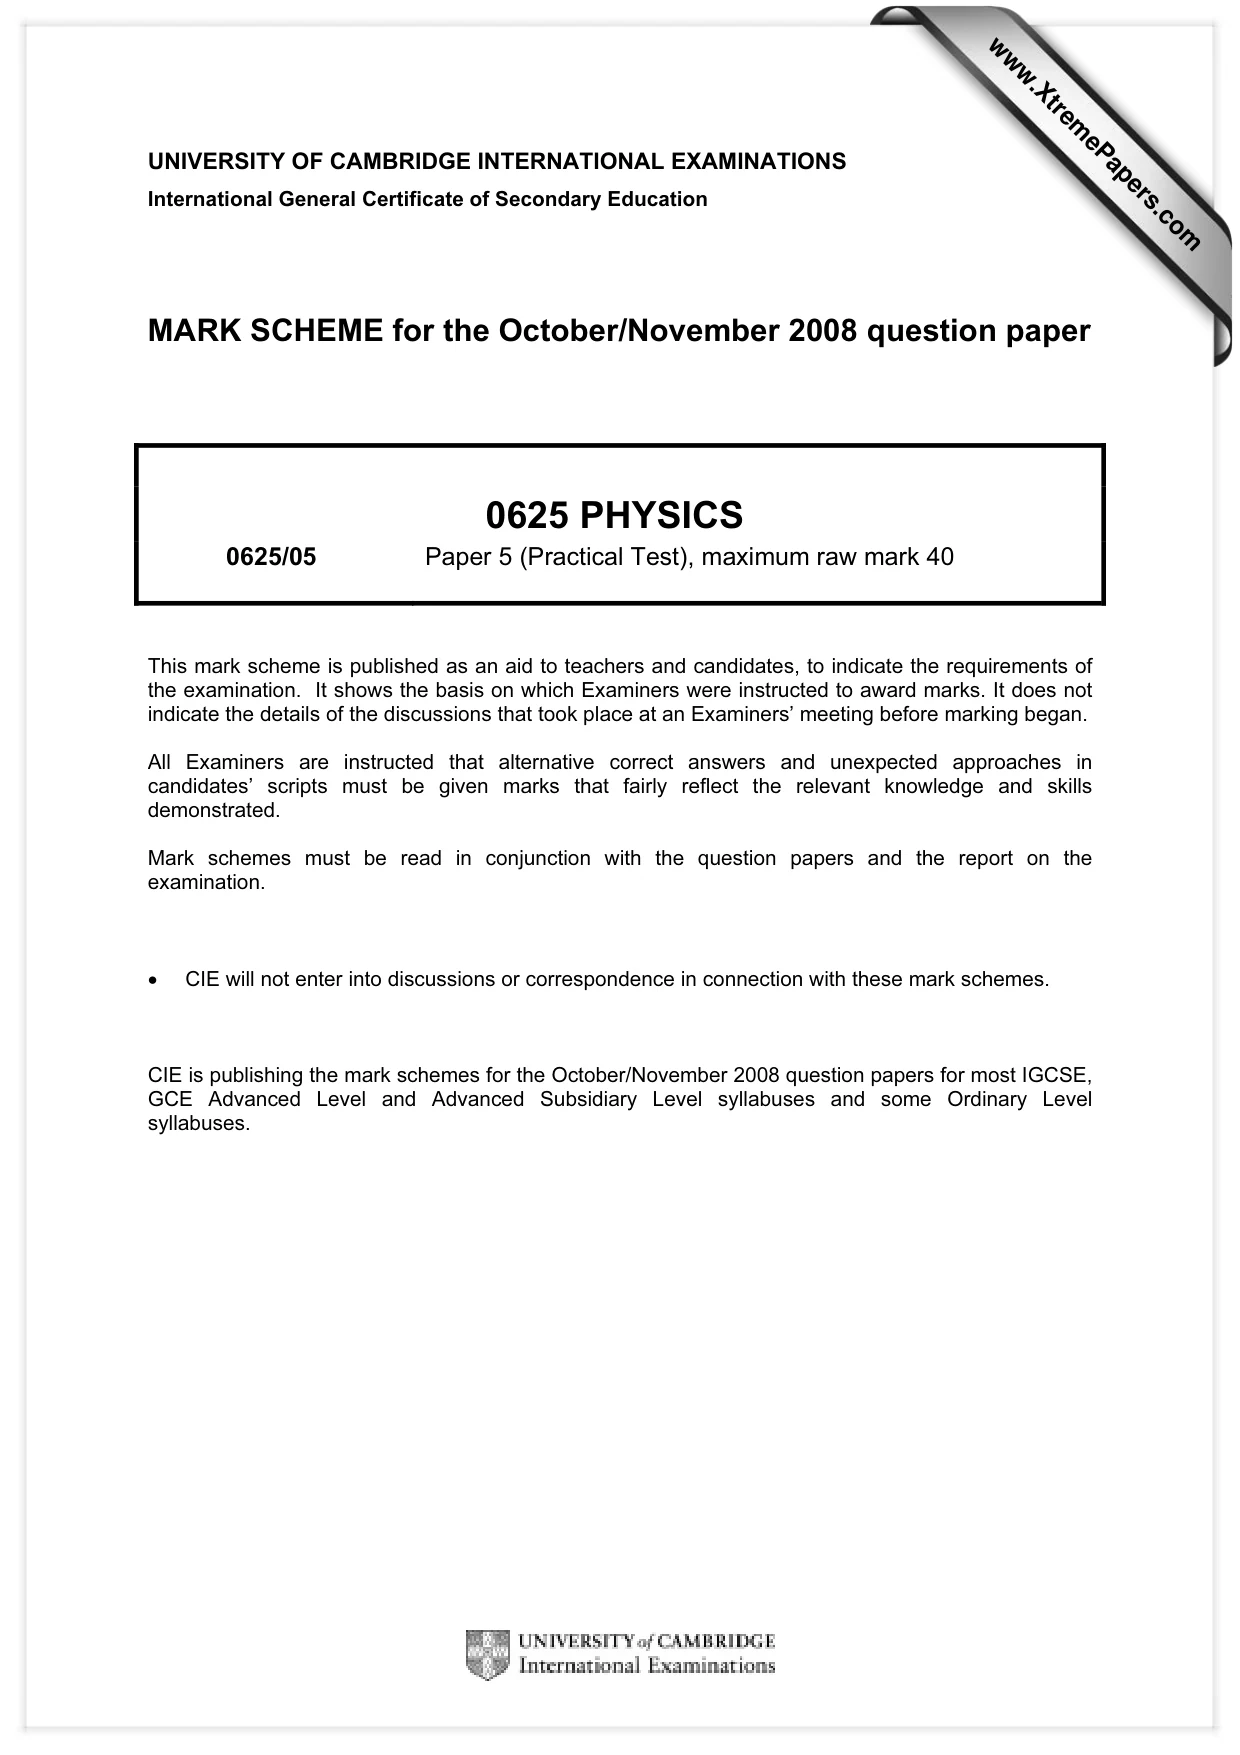
4 In this experiment, you are to determine the focal length of a converging lens. For Carry out the following instructions, referring to Fig. 4.1 and Fig. 4.2. Examiner’s Use object card screen x y lens illuminated object Fig. 4.1 (a) Place the lens at a distance x = 25.0 cm from the illuminated object. Place the screen close to the lens, then move it away from the lens until a sharply focused image is formed on the screen. Measure and record the distance y between the lens and the screen. y = .................................................[1] (b) Calculate the focal length f using the equation ___xy . f = (x + y) f = .................................................[2] (c) Repeat steps (a) and (b) with the lens at a distance x = 30.0 cm from the illuminated object. y = ..................................................... f = .................................................[1] (d) Calculate the average value of f. Show your working. For Examiner’s Use Average value of f = ................................................ [2] Place the lens at a distance 25.0 cm from the illuminated object and place the mirror as close to the lens as possible as shown in Fig. 4.2. mirror object card d lens illuminated object Fig. 4.2 Move the lens and the mirror, keeping the mirror close to the lens, towards the illuminated object until a sharply focused image is formed on the object card next to the illuminated object. (e) Measure and record the distance d between the illuminated object and the lens. d = ................................................ [1] (f) Theory suggests that d is equal to the focal length f of the lens. State whether, within the limits of experimental accuracy, your results support this theory. ........................................................................................................................................ .................................................................................................................................... [1] (g) Write down one similarity and one difference between the image and the object using the apparatus as set up in part (e) when a sharply focused image is formed. One similarity .................................................................................................................. One difference ............................................................................................................. [2] [Total: 10]
Mark scheme: 4 (a) y value 25–53 cm [1] (b) correct calculation of f [1] correct unit for y and f [1] (c) y value 20–40 (cm) and f present [1] (d) correct method [1] average f 13–17 (cm) [1] (e) d 13–17 cm [1] (f) Yes (if within 2 cm) No (if not) [1] (g) same size/real [1] Inverted/brightness/coloured edges [1] [Total: 10]
What was in this paper
The subtopics covered by these 4 questions, and how many questions each got. Open one in a new tab to see every Cambridge question on it.
What you needed in this session
Cambridge’s own grade thresholds for 2008 Oct/Nov, Paper 5 · Variant 1. A higher threshold means an easier paper — the bar moves with how the cohort did.