Cambridge IGCSE Physics 0625 — 2008 May/June Paper 5 · Variant 1
0625/51/M/J/08 · 4 questions · 40 marks · ≈45 min
The question paper and its mark scheme, free to read here and free to download. This is Cambridge’s own paper, exactly as it was sat.
Question paper12 pages
Mark scheme3 pages
Answers below. Sit the paper first if you are practising.
Questions as text
Q1 · In this experiment, you are to determine the weight of a mass using a balancing method
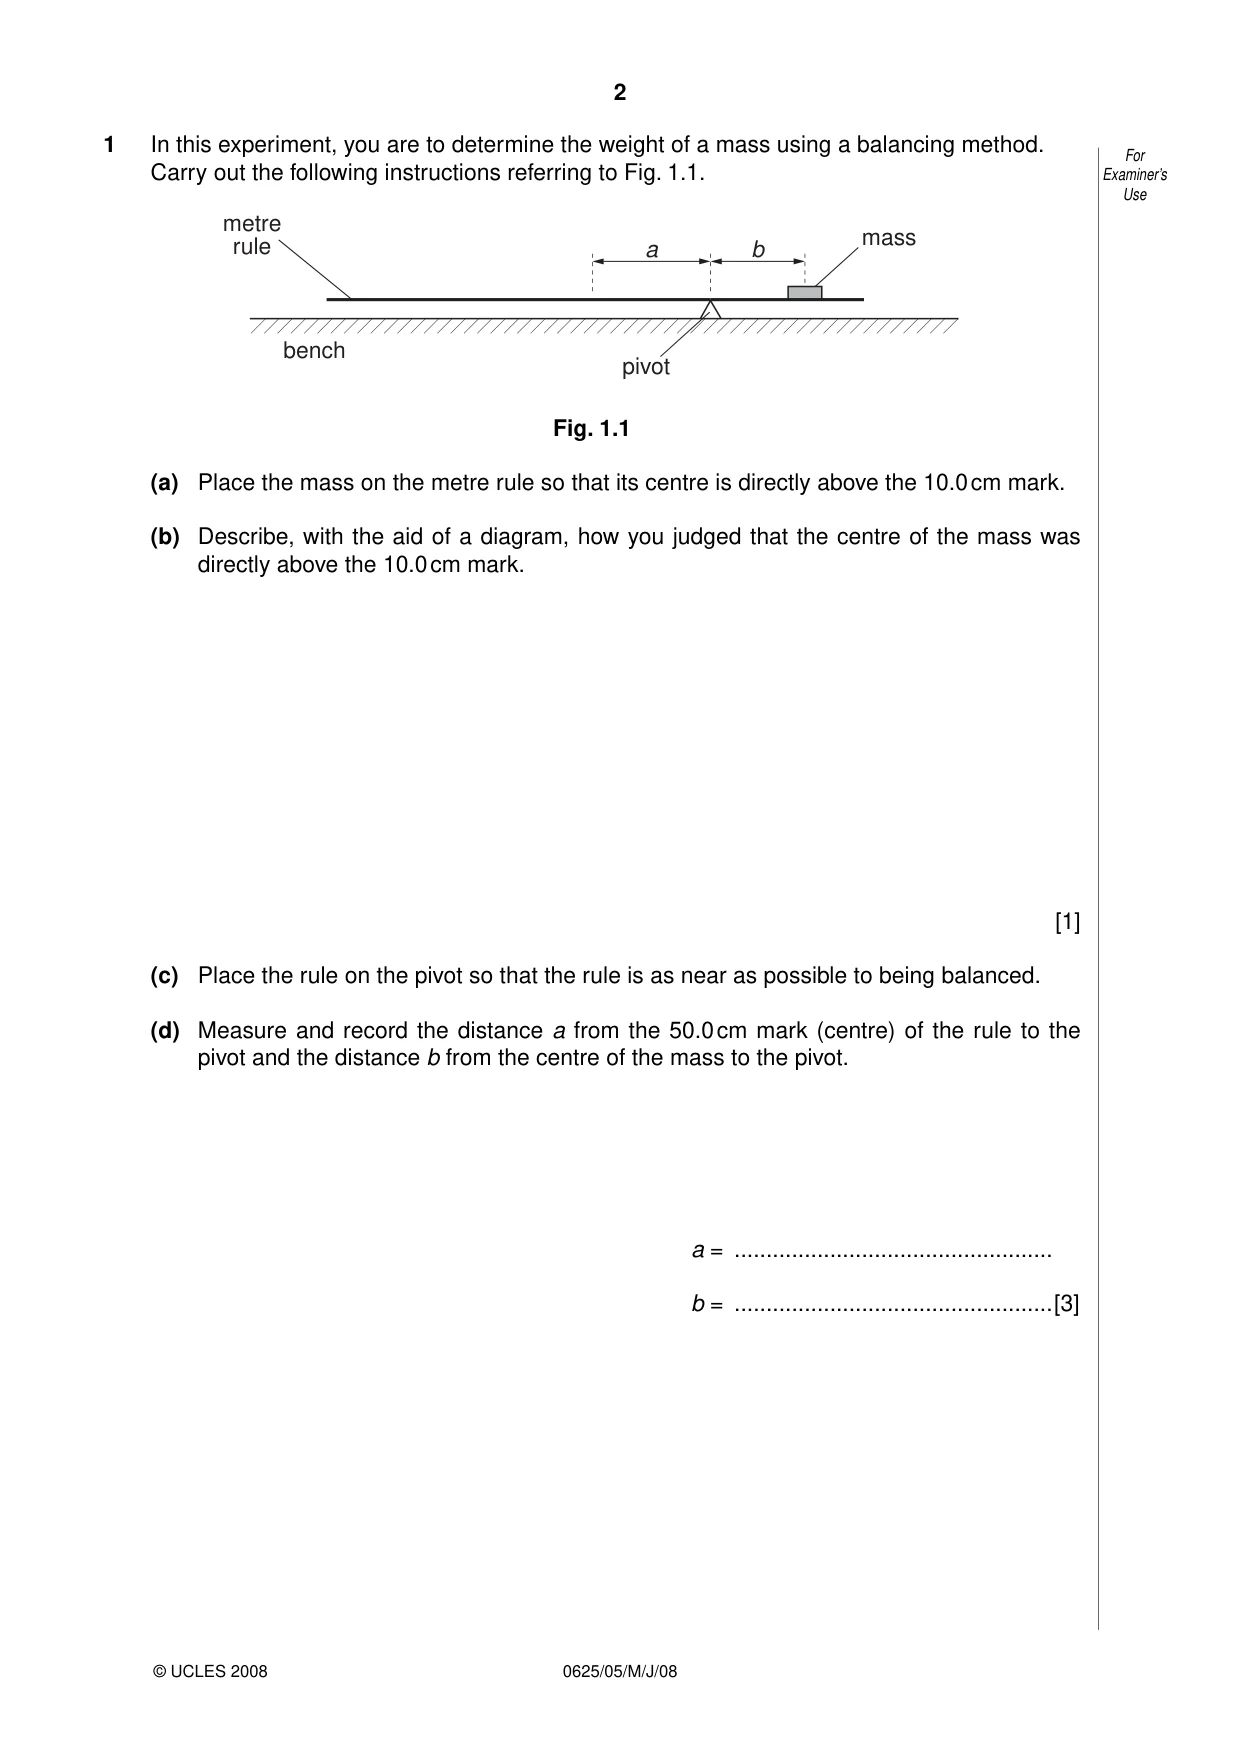
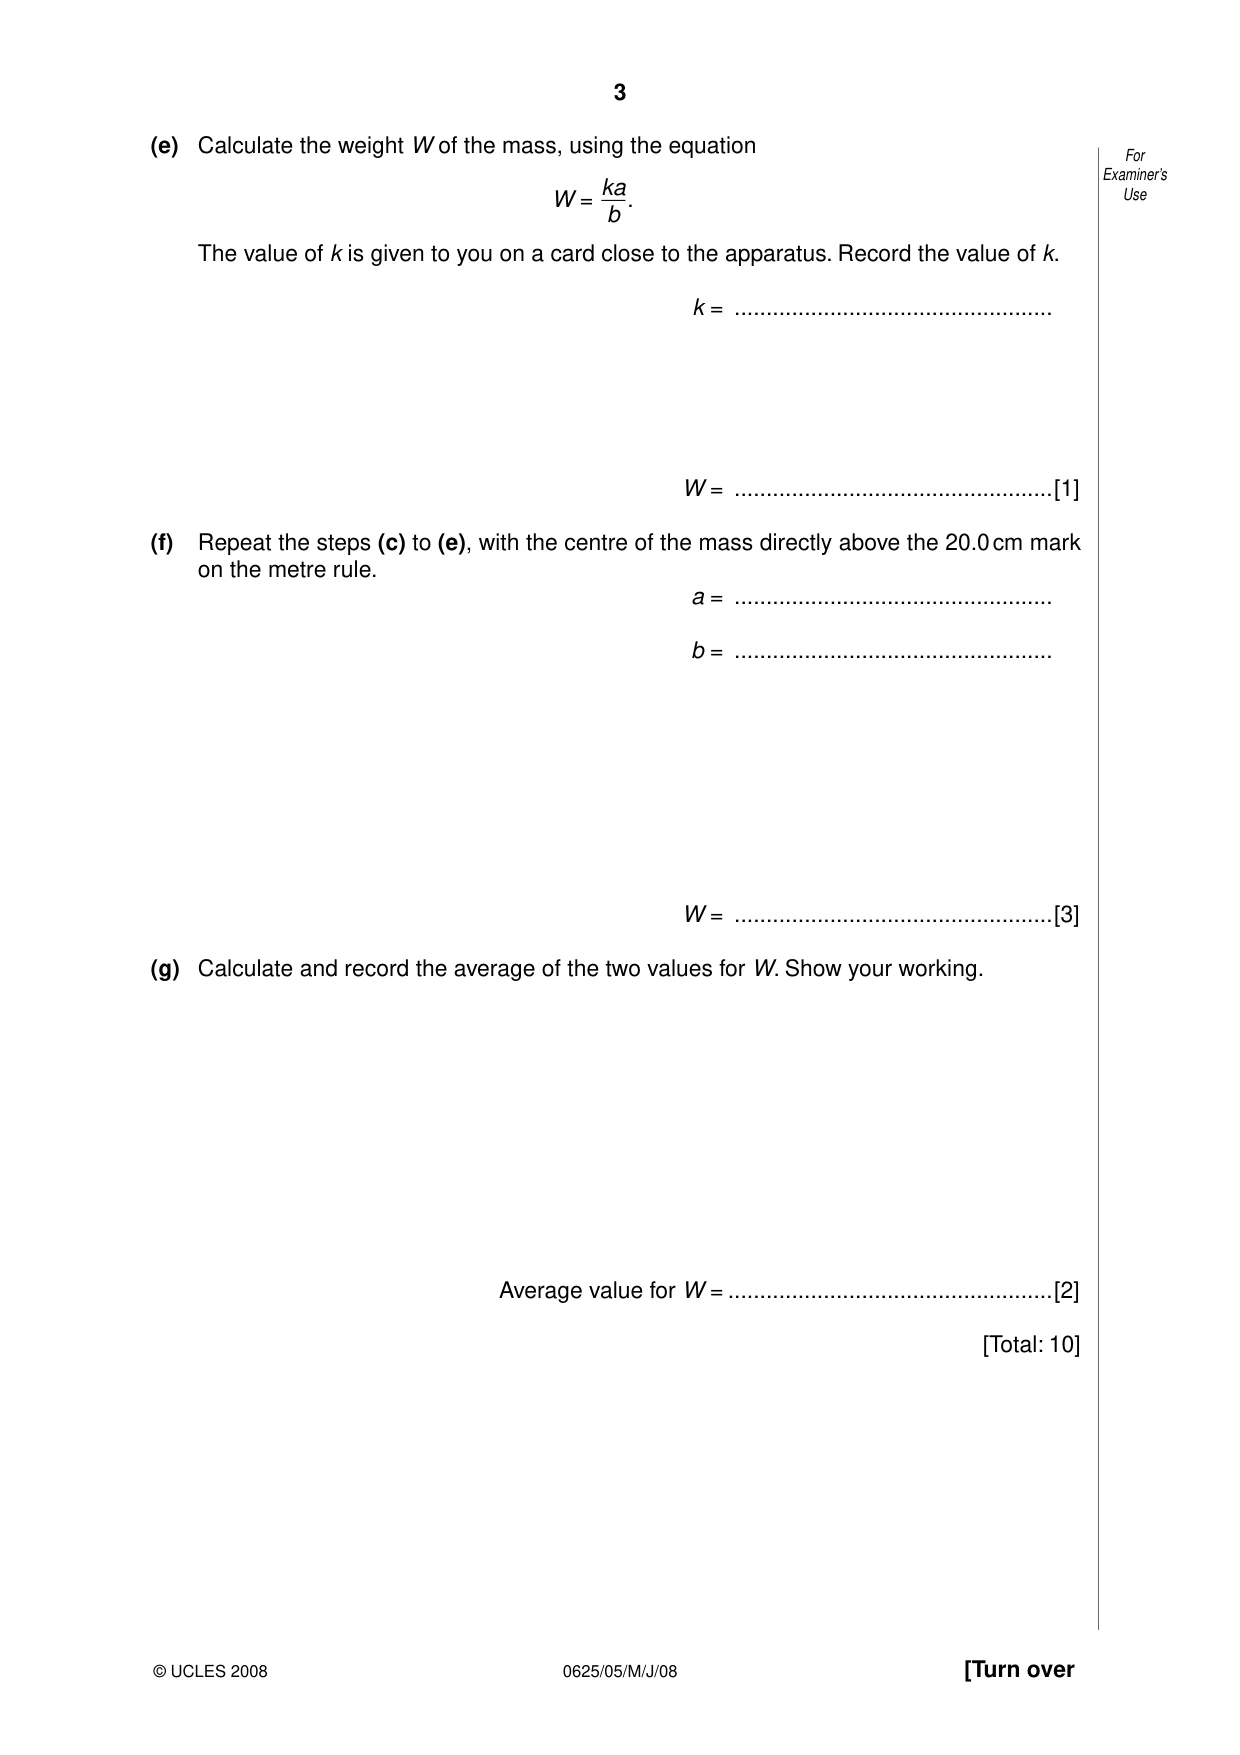
1 In this experiment, you are to determine the weight of a mass using a balancing method. For Carry out the following instructions referring to Fig. 1.1. Examiner’s Use metre mass rule a b bench pivot Fig. 1.1 (a) Place the mass on the metre rule so that its centre is directly above the 10.0 cm mark. (b) Describe, with the aid of a diagram, how you judged that the centre of the mass was directly above the 10.0 cm mark. [1] (c) Place the rule on the pivot so that the rule is as near as possible to being balanced. (d) Measure and record the distance a from the 50.0 cm mark (centre) of the rule to the pivot and the distance b from the centre of the mass to the pivot. a = .................................................. b = ..................................................[3] (e) Calculate the weight W of the mass, using the equation For Examiner’s ka Use W = . b The value of k is given to you on a card close to the apparatus. Record the value of k. k = .................................................. W = ..................................................[1] (f) Repeat the steps (c) to (e), with the centre of the mass directly above the 20.0 cm mark on the metre rule. a = .................................................. b = .................................................. W = ..................................................[3] (g) Calculate and record the average of the two values for W. Show your working. Average value for W = ...................................................[2] [Total: 10]
Mark scheme: 1 (b) clear explanation/diagram [1] (d) a + b = 38 – 42 cm [1] b > a [1] both in m, cm or mm, with unit [1] (e) W correct calculation (ecf) [1] (f) new a and b values, both less than 50 cm [1] a + b = 28 – 32 (cm) [1] two W values same to within 10% [1] (g) correct method [1] 2/3 significant figures and unit N [1] [Total: 10]
More questions on Physical quantities and measurement techniques
Q2 · In this experiment you are to compare the combined resistance of lamps in different…
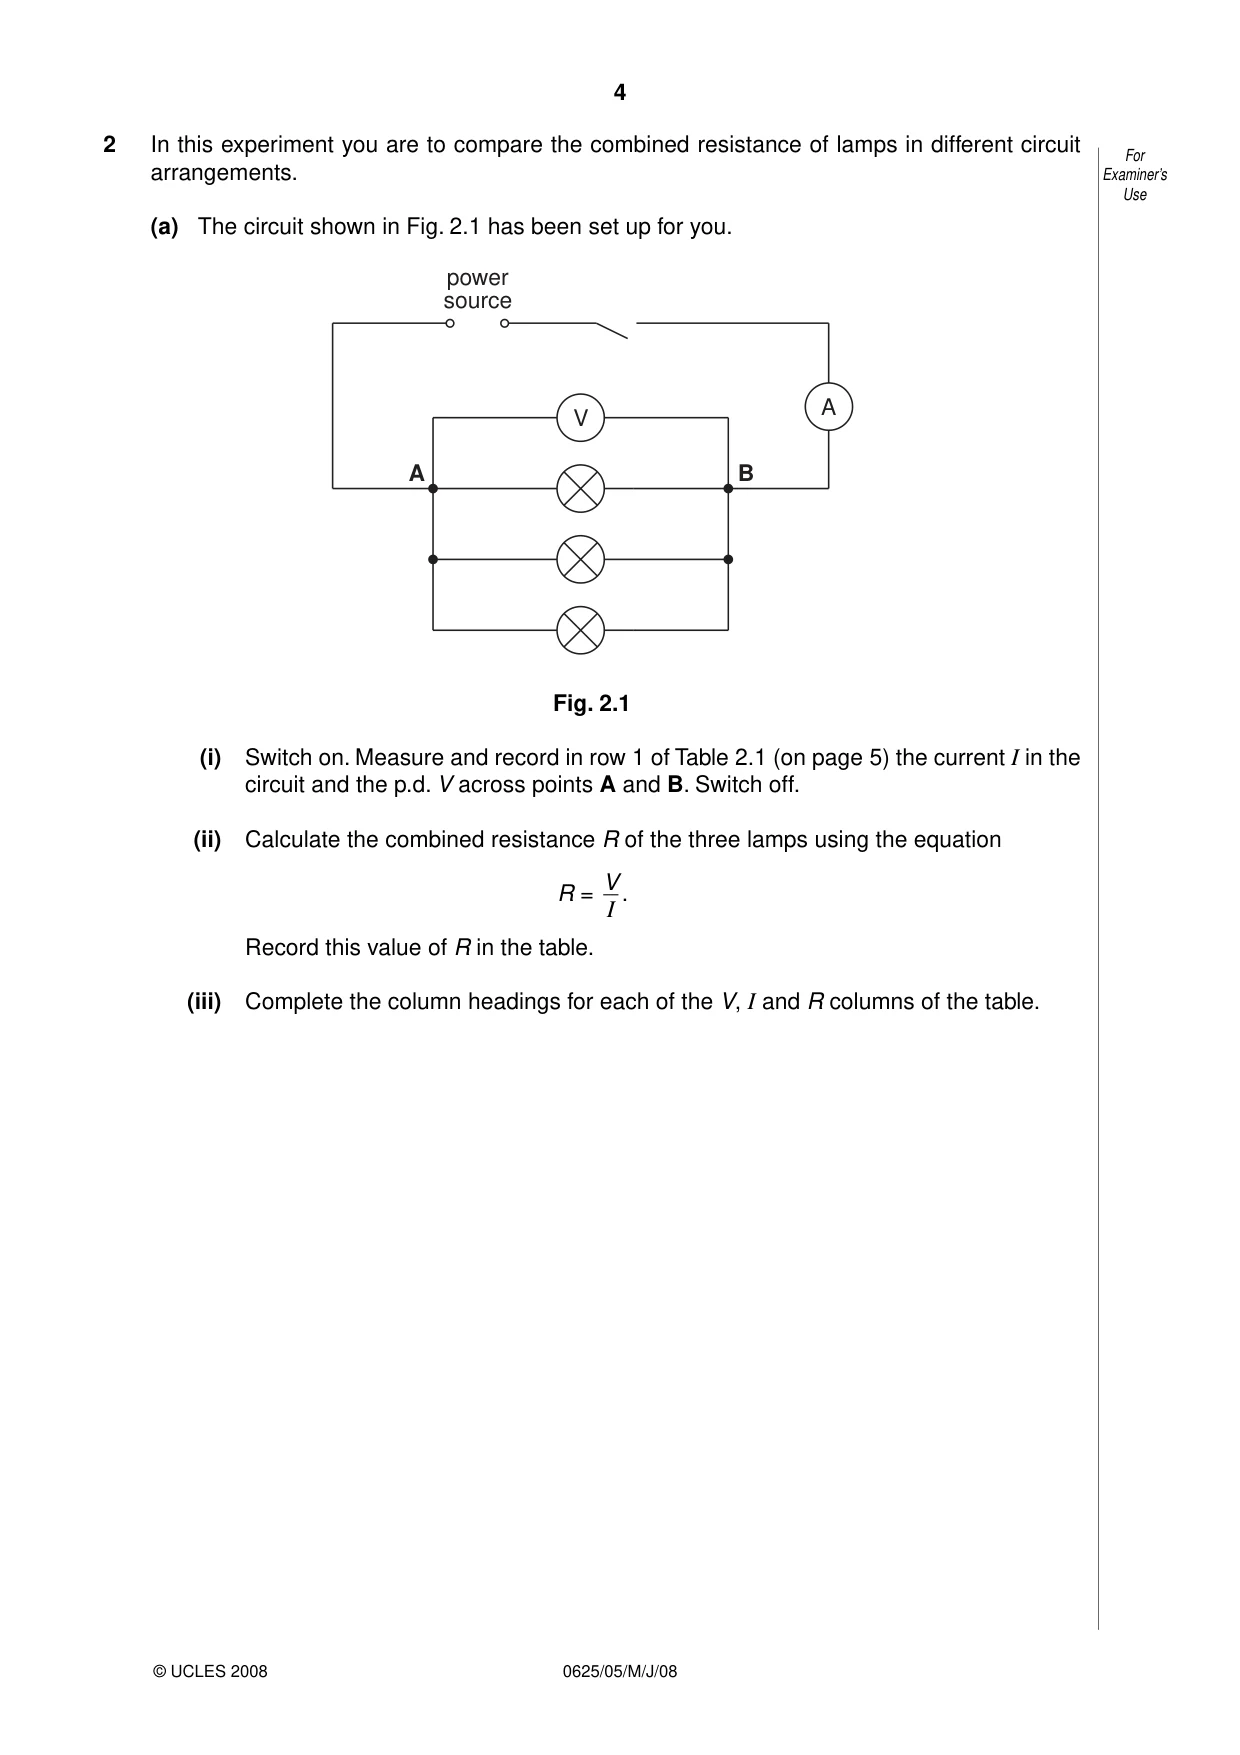
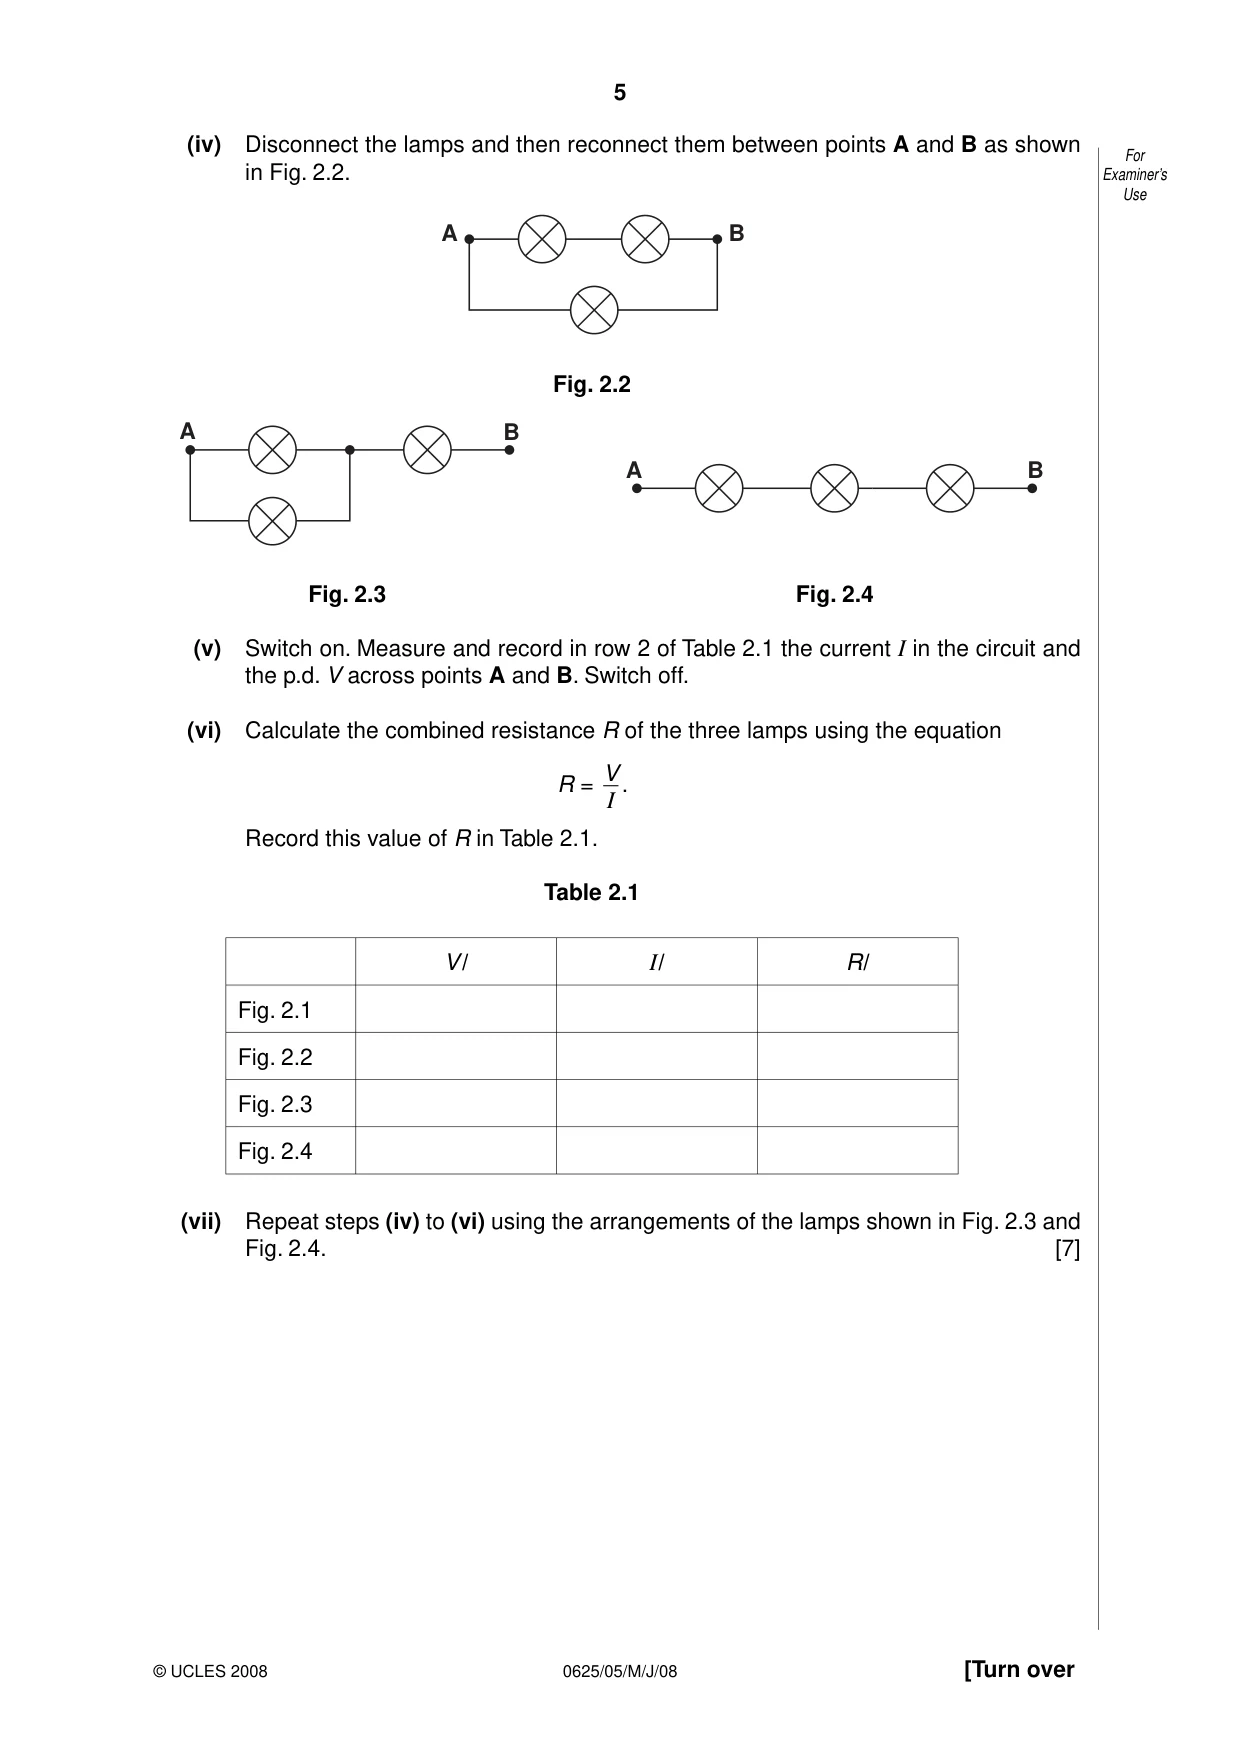
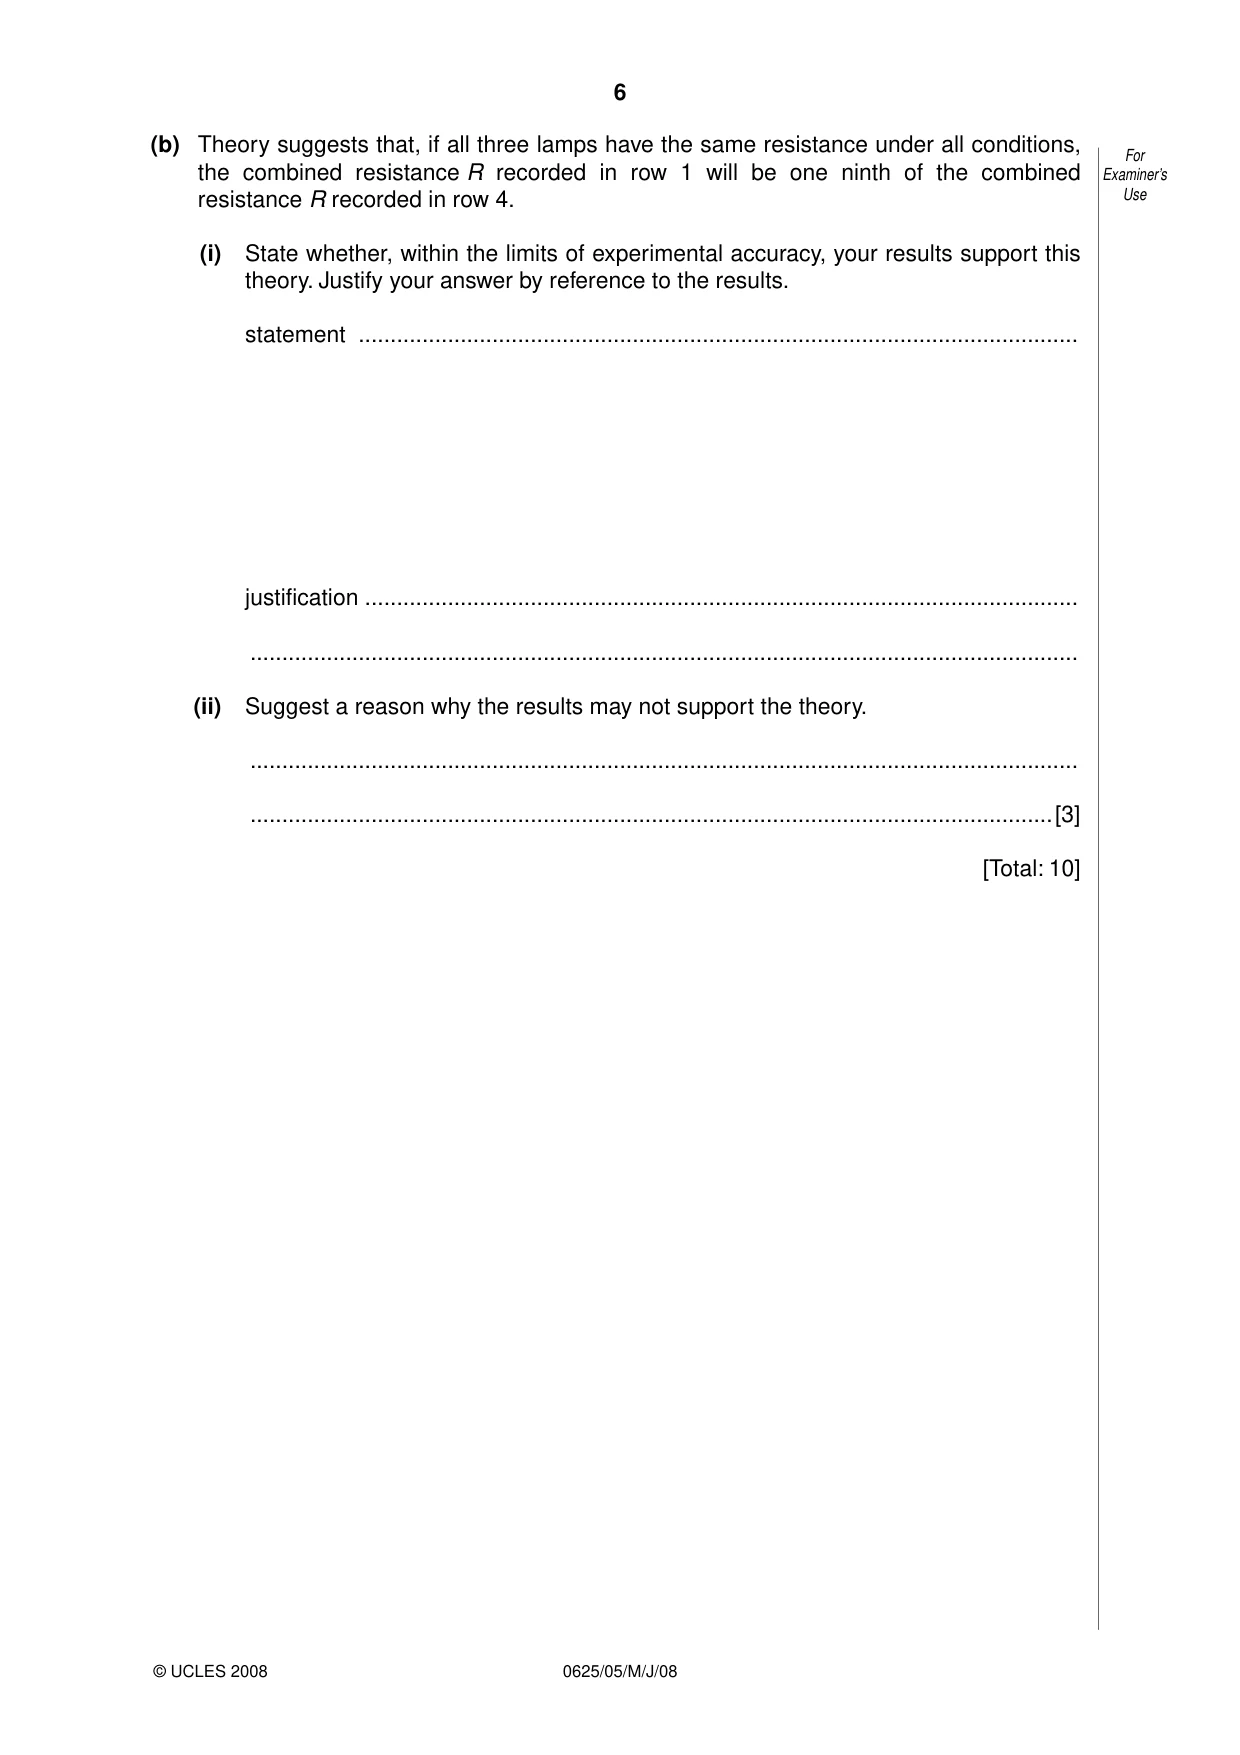
2 In this experiment you are to compare the combined resistance of lamps in different circuit For arrangements. Examiner’s Use (a) The circuit shown in Fig. 2.1 has been set up for you. power source A V A B Fig. 2.1 (i) Switch on. Measure and record in row 1 of Table 2.1 (on page 5) the current I in the circuit and the p.d. V across points A and B. Switch off. (ii) Calculate the combined resistance R of the three lamps using the equation V R = . I Record this value of R in the table. (iii) Complete the column headings for each of the V, I and R columns of the table. (iv) Disconnect the lamps and then reconnect them between points A and B as shown For in Fig. 2.2. Examiner’s Use A B Fig. 2.2 A B A B Fig. 2.3 Fig. 2.4 (v) Switch on. Measure and record in row 2 of Table 2.1 the current I in the circuit and the p.d. V across points A and B. Switch off. (vi) Calculate the combined resistance R of the three lamps using the equation V R = . I Record this value of R in Table 2.1. Table 2.1 V / I / R / Fig. 2.1 Fig. 2.2 Fig. 2.3 Fig. 2.4 (vii) Repeat steps (iv) to (vi) using the arrangements of the lamps shown in Fig. 2.3 and Fig. 2.4. [7] (b) Theory suggests that, if all three lamps have the same resistance under all conditions, For the combined resistance R recorded in row 1 will be one ninth of the combined Examiner’s resistance R recorded in row 4. Use (i) State whether, within the limits of experimental accuracy, your results support this theory. Justify your answer by reference to the results. statement ................................................................................................................. justification ................................................................................................................ .................................................................................................................................. (ii) Suggest a reason why the results may not support the theory. .................................................................................................................................. ..............................................................................................................................[3] [Total: 10]
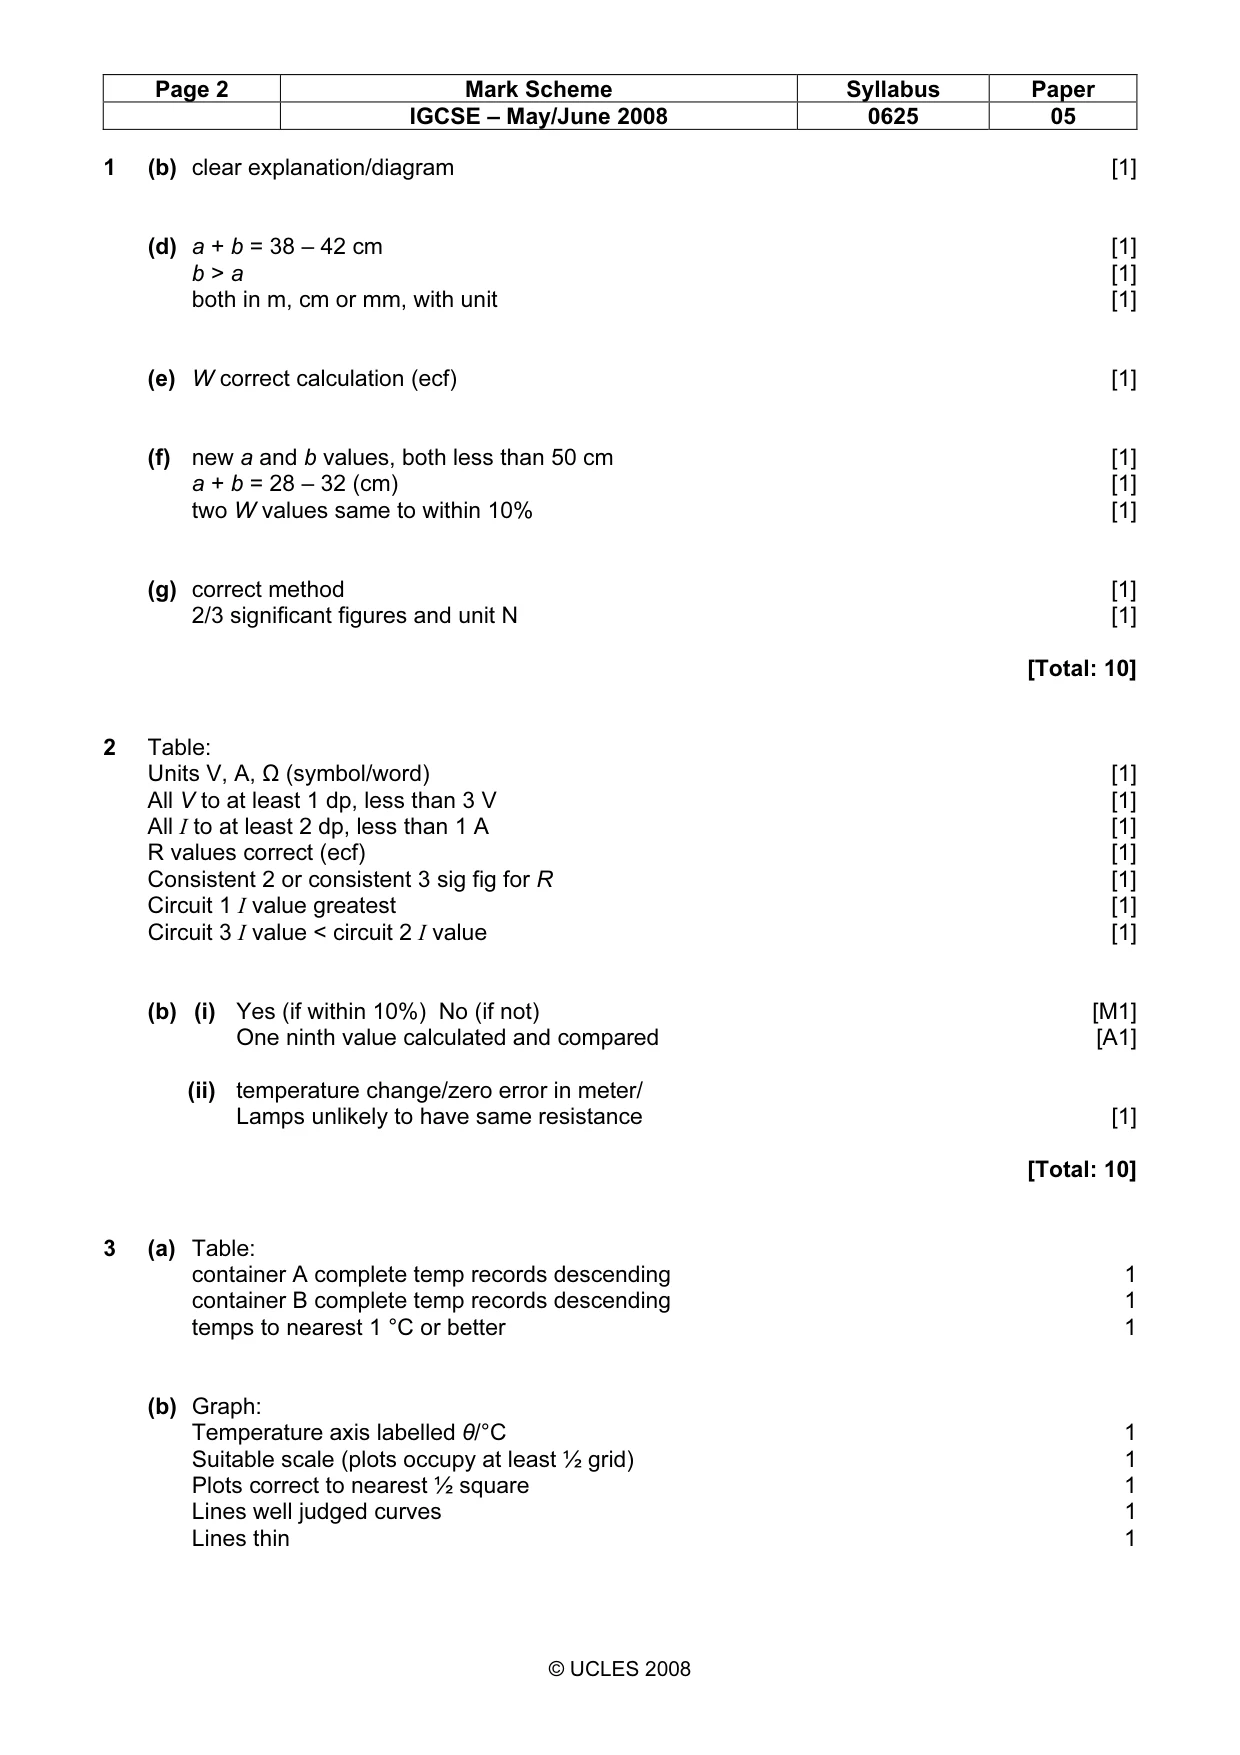
Mark scheme: 2 Table: Units V, A, Ω (symbol/word) [1] All V to at least 1 dp, less than 3 V [1] All I to at least 2 dp, less than 1 A [1] R values correct (ecf) [1] Consistent 2 or consistent 3 sig fig for R [1] Circuit 1 I value greatest [1] Circuit 3 I value < circuit 2 I value [1] (b) (i) Yes (if within 10%) No (if not) [M1] One ninth value calculated and compared [A1] (ii) temperature change/zero error in meter/ Lamps unlikely to have same resistance [1] [Total: 10]
Q3 · In this experiment you are to investigate the effect of surface area exposed to the air…
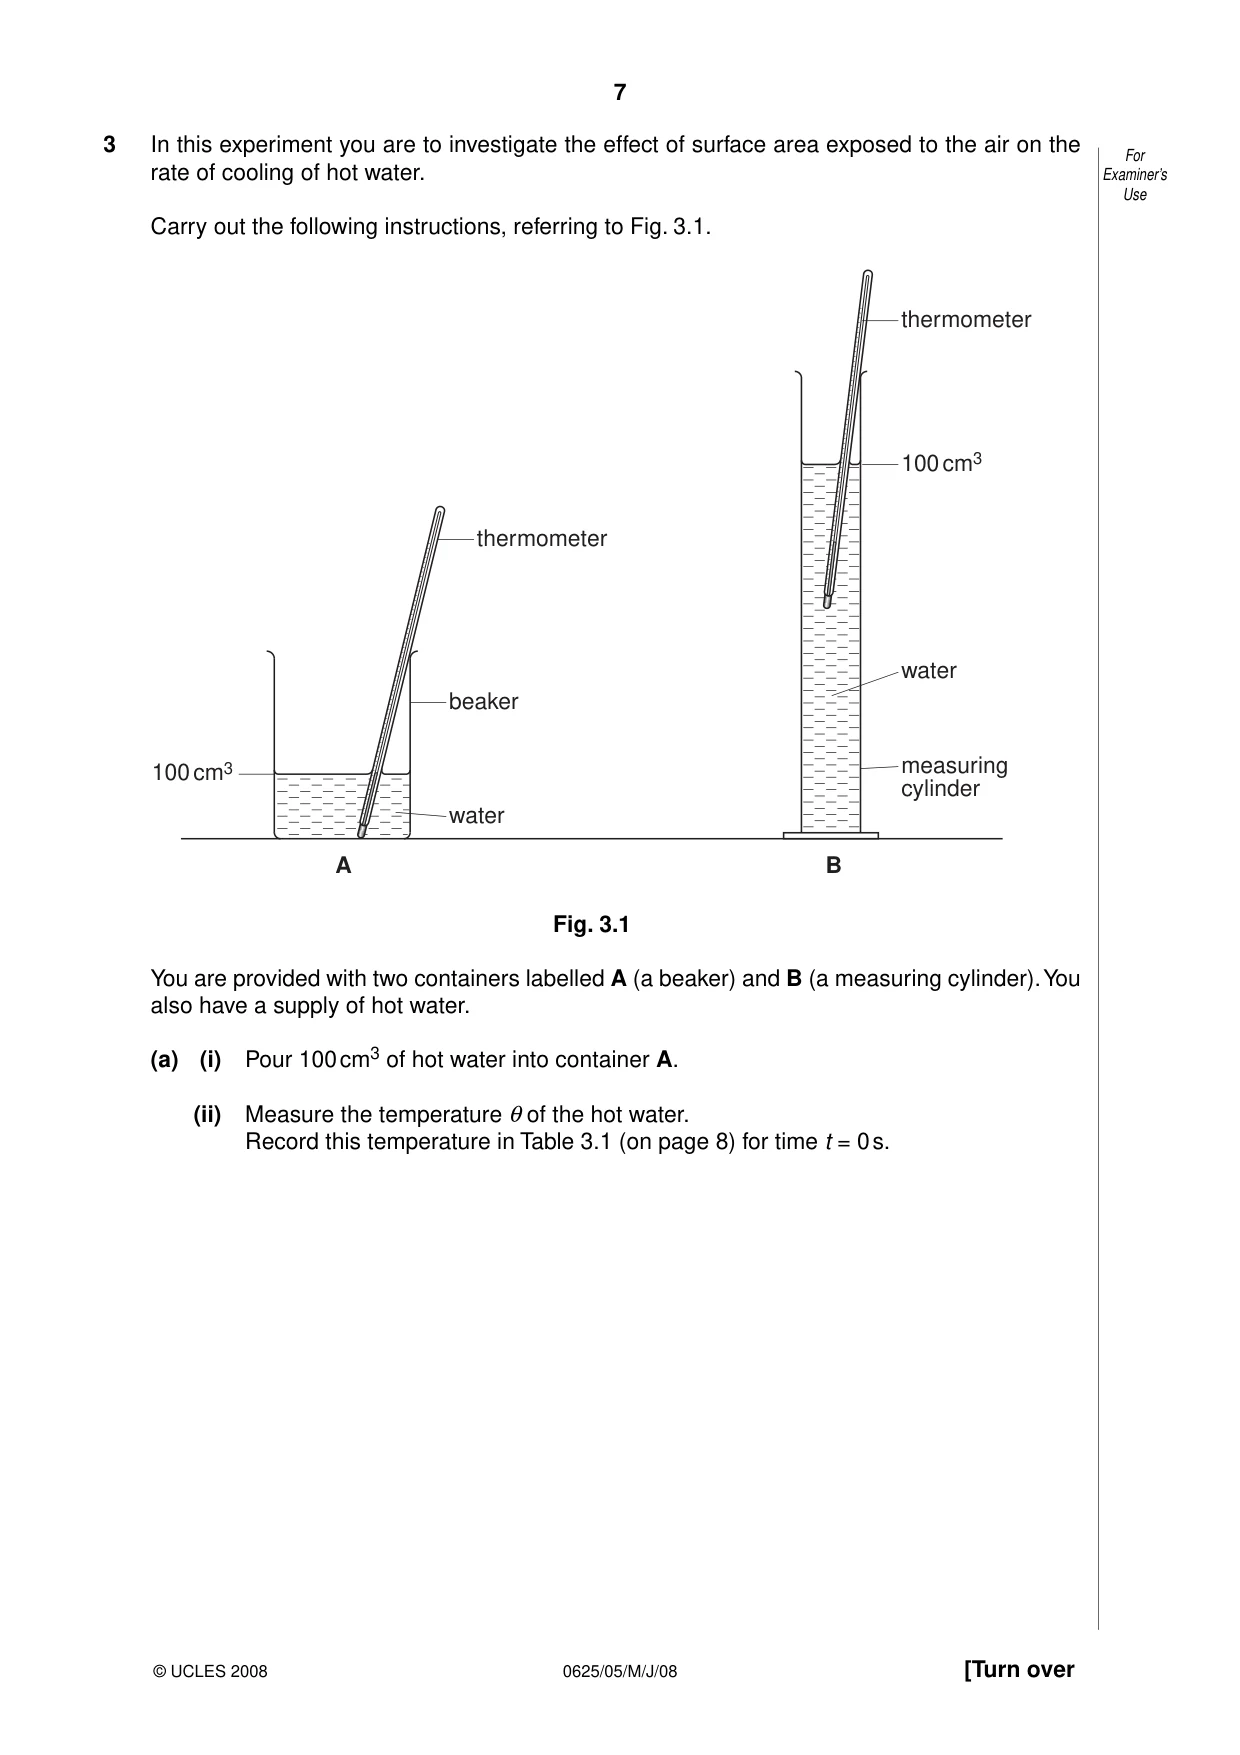
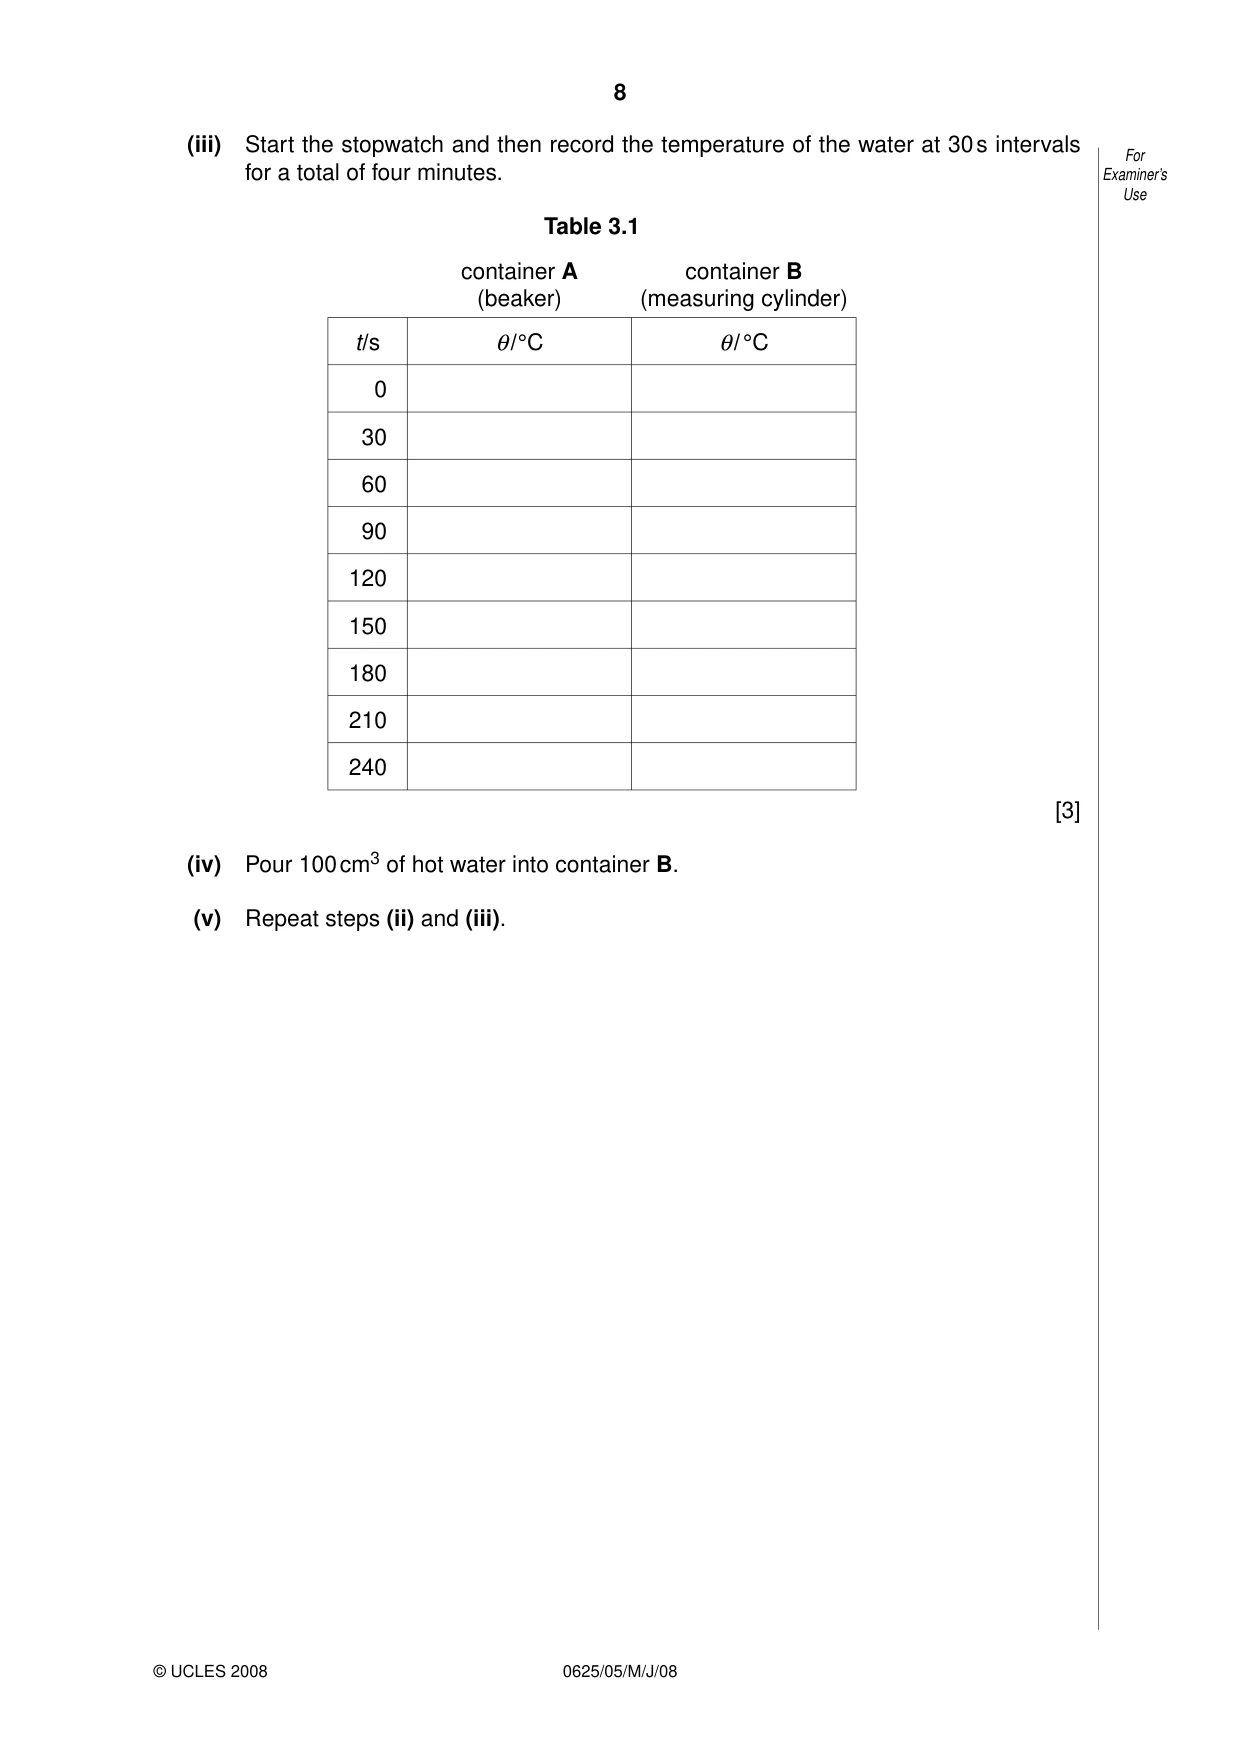
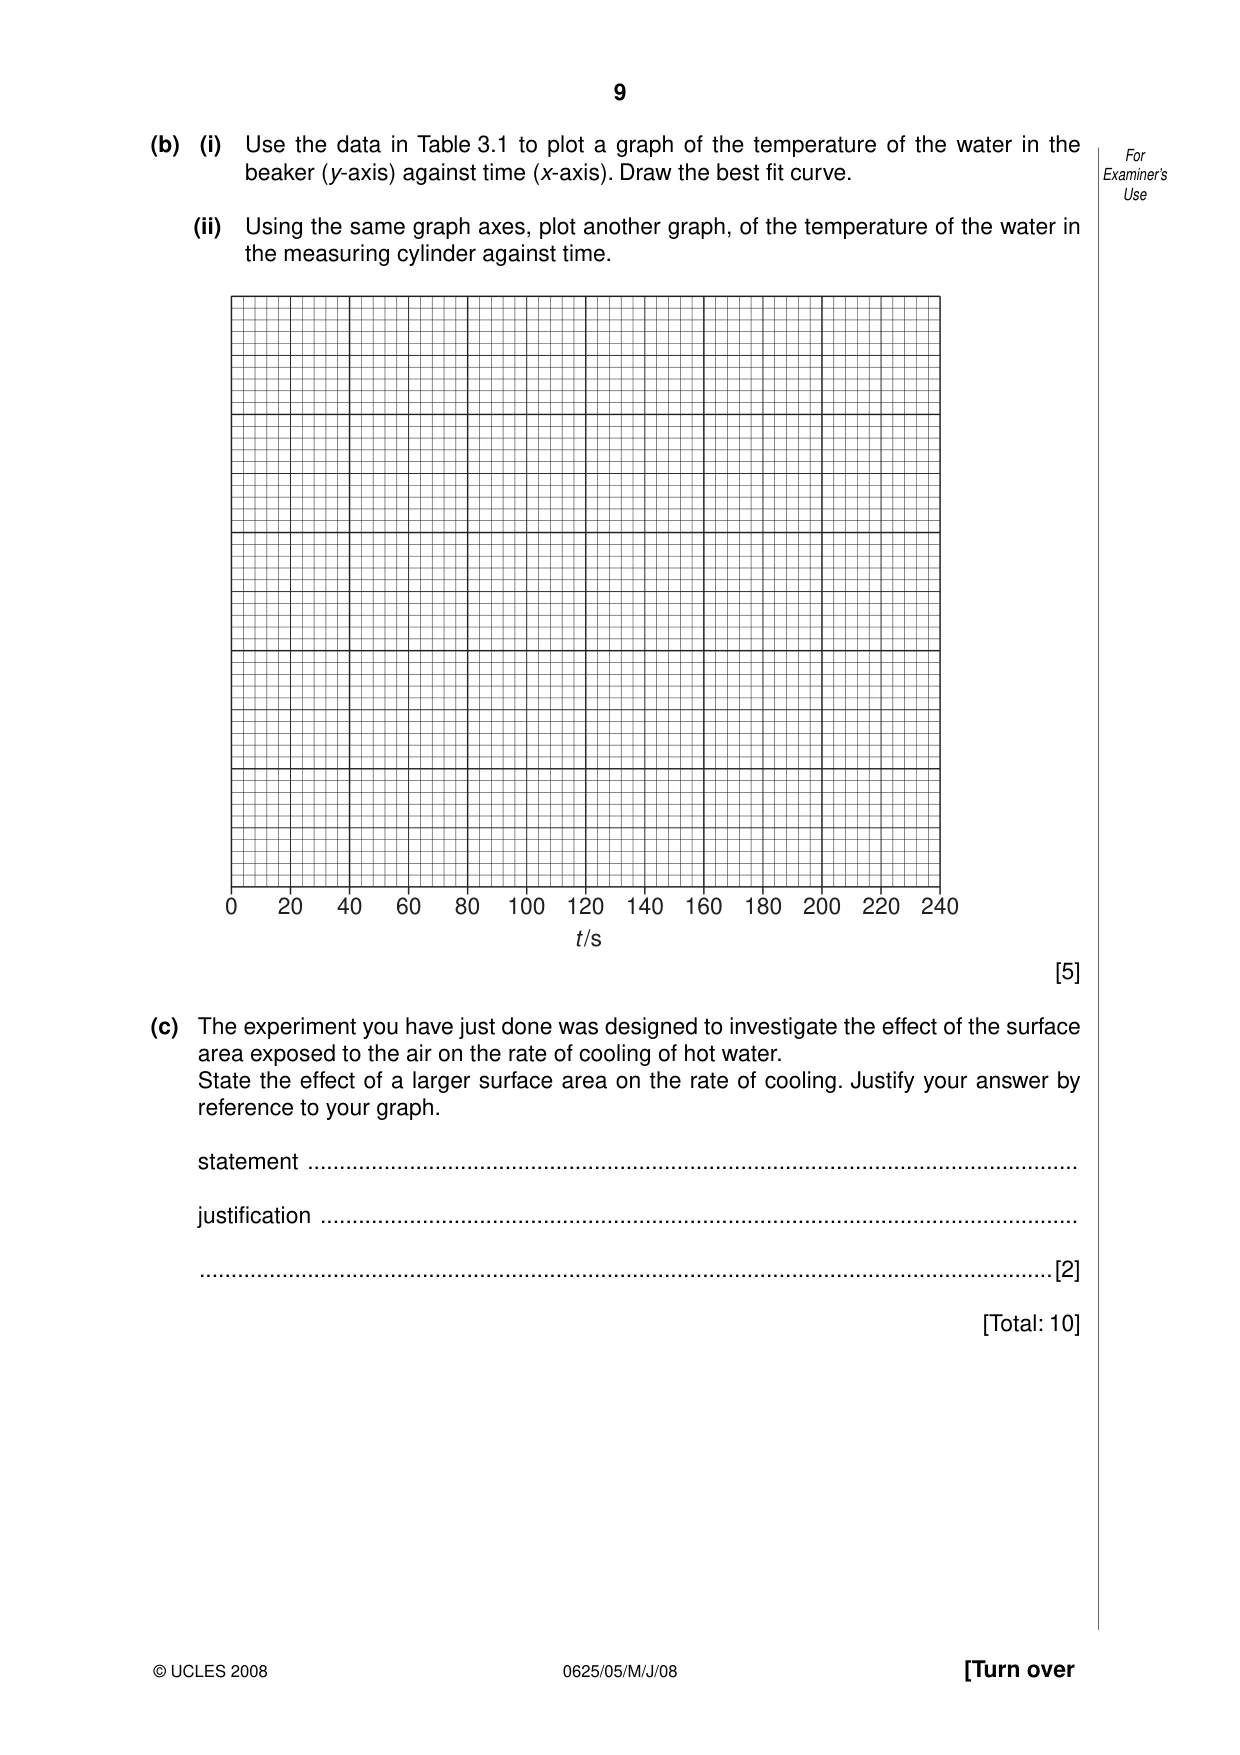
3 In this experiment you are to investigate the effect of surface area exposed to the air on the For rate of cooling of hot water. Examiner’s Use Carry out the following instructions, referring to Fig. 3.1. thermometer 100 cm3 thermometer water beaker measuring 100 cm3 cylinder water A B Fig. 3.1 You are provided with two containers labelled A (a beaker) and B (a measuring cylinder). You also have a supply of hot water. (a) (i) Pour 100 cm3 of hot water into container A. (ii) Measure the temperature θ of the hot water. Record this temperature in Table 3.1 (on page 8) for time t = 0 s. (iii) Start the stopwatch and then record the temperature of the water at 30 s intervals For for a total of four minutes. Examiner’s Use Table 3.1 container A container B (beaker) (measuring cylinder) t /s θ/ °C θ/ °C 0 30 60 90 120 150 180 210 240 [3] (iv) Pour 100 cm3 of hot water into container B. (v) Repeat steps (ii) and (iii). (b) (i) Use the data in Table 3.1 to plot a graph of the temperature of the water in the For beaker (y-axis) against time (x-axis). Draw the best fit curve. Examiner’s Use (ii) Using the same graph axes, plot another graph, of the temperature of the water in the measuring cylinder against time. 0 20 40 60 80 100 120 140 160 180 200 220 240 t /s [5] (c) The experiment you have just done was designed to investigate the effect of the surface area exposed to the air on the rate of cooling of hot water. State the effect of a larger surface area on the rate of cooling. Justify your answer by reference to your graph. statement ......................................................................................................................... justification ....................................................................................................................... ......................................................................................................................................[2] [Total: 10]
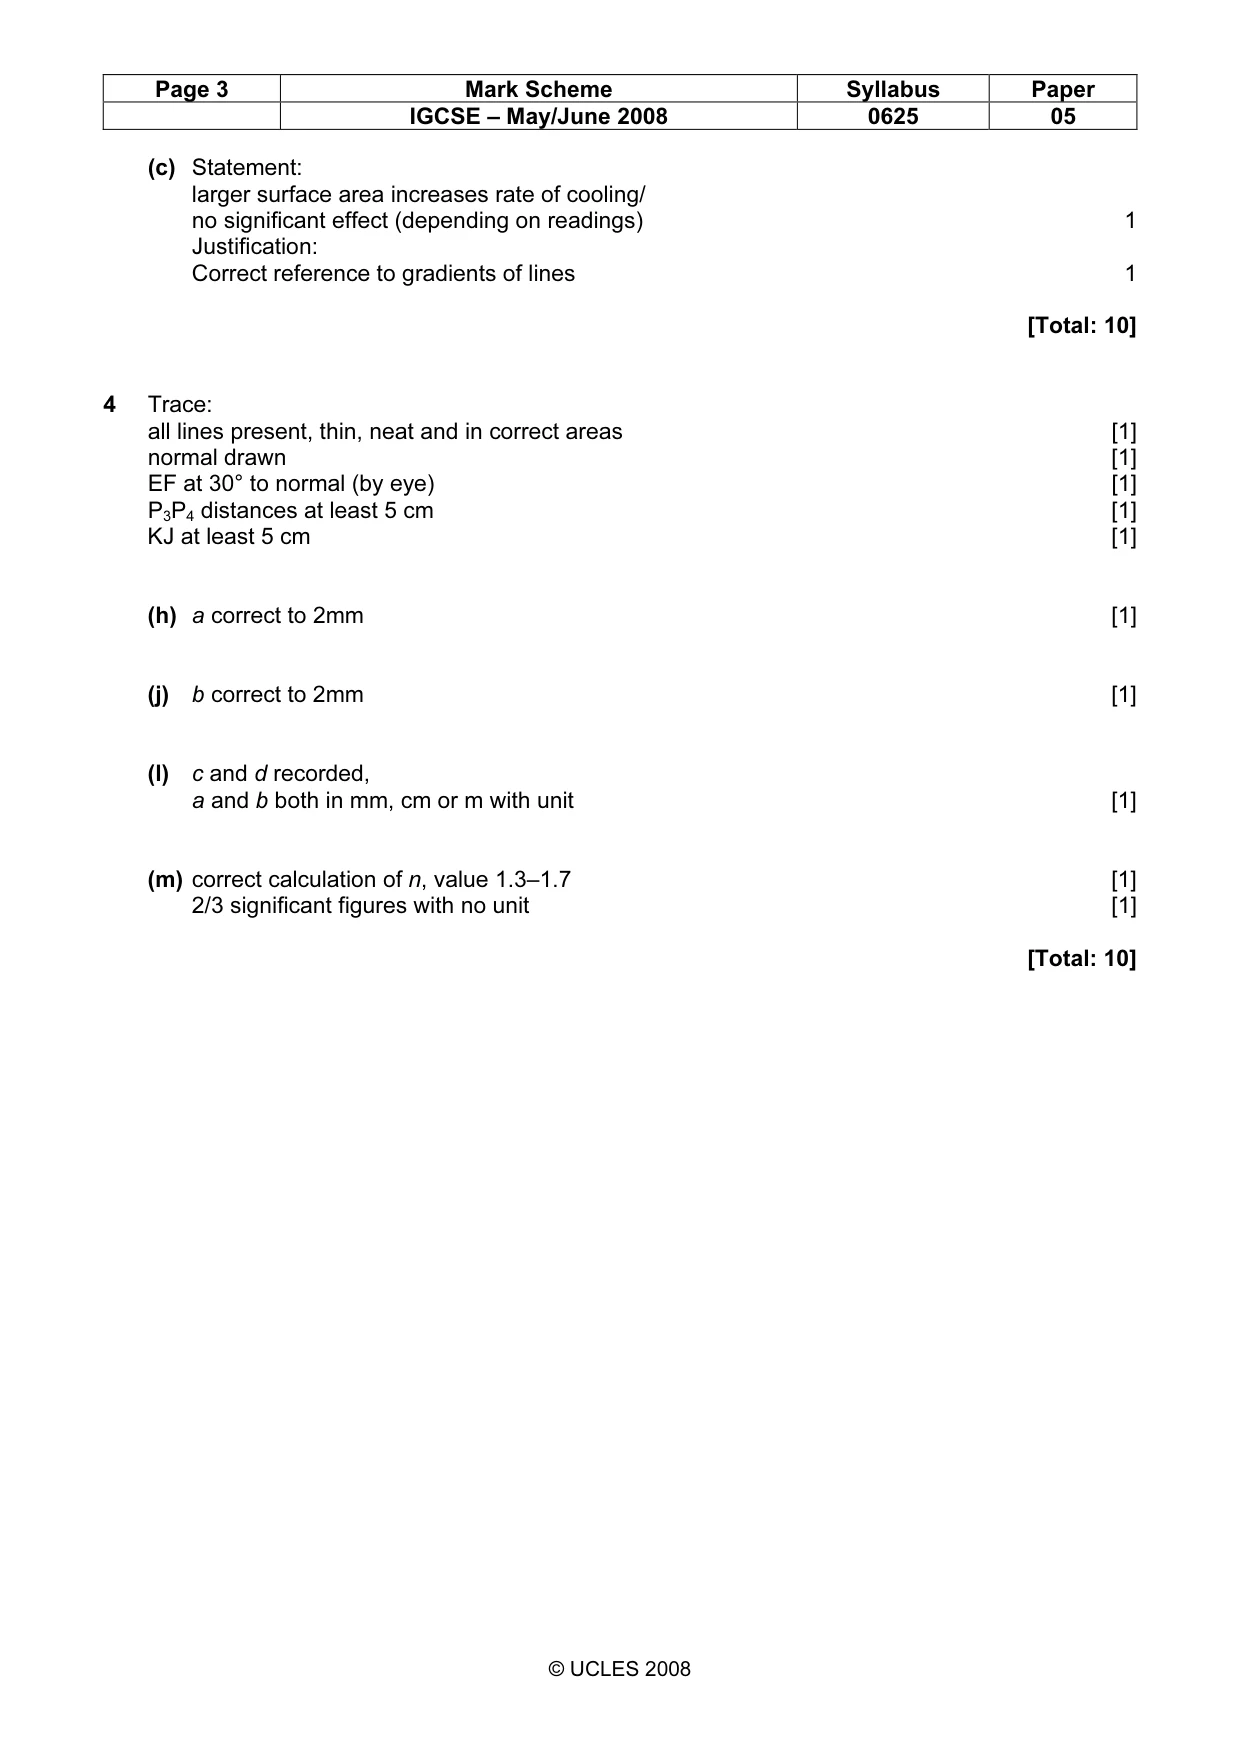
Mark scheme: 3 (a) Table: container A complete temp records descending 1 container B complete temp records descending 1 temps to nearest 1 °C or better 1 (b) Graph: Temperature axis labelled θ/°C 1 Suitable scale (plots occupy at least ½ grid) 1 Plots correct to nearest ½ square 1 Lines well judged curves 1 Lines thin 1 IGCSE – May/June 2008 0625 05 (c) Statement: larger surface area increases rate of cooling/ no significant effect (depending on readings) 1 Justification: Correct reference to gradients of lines 1 [Total: 10]
Q4 · In this experiment you are to determine a quantity called the refractive index of the…
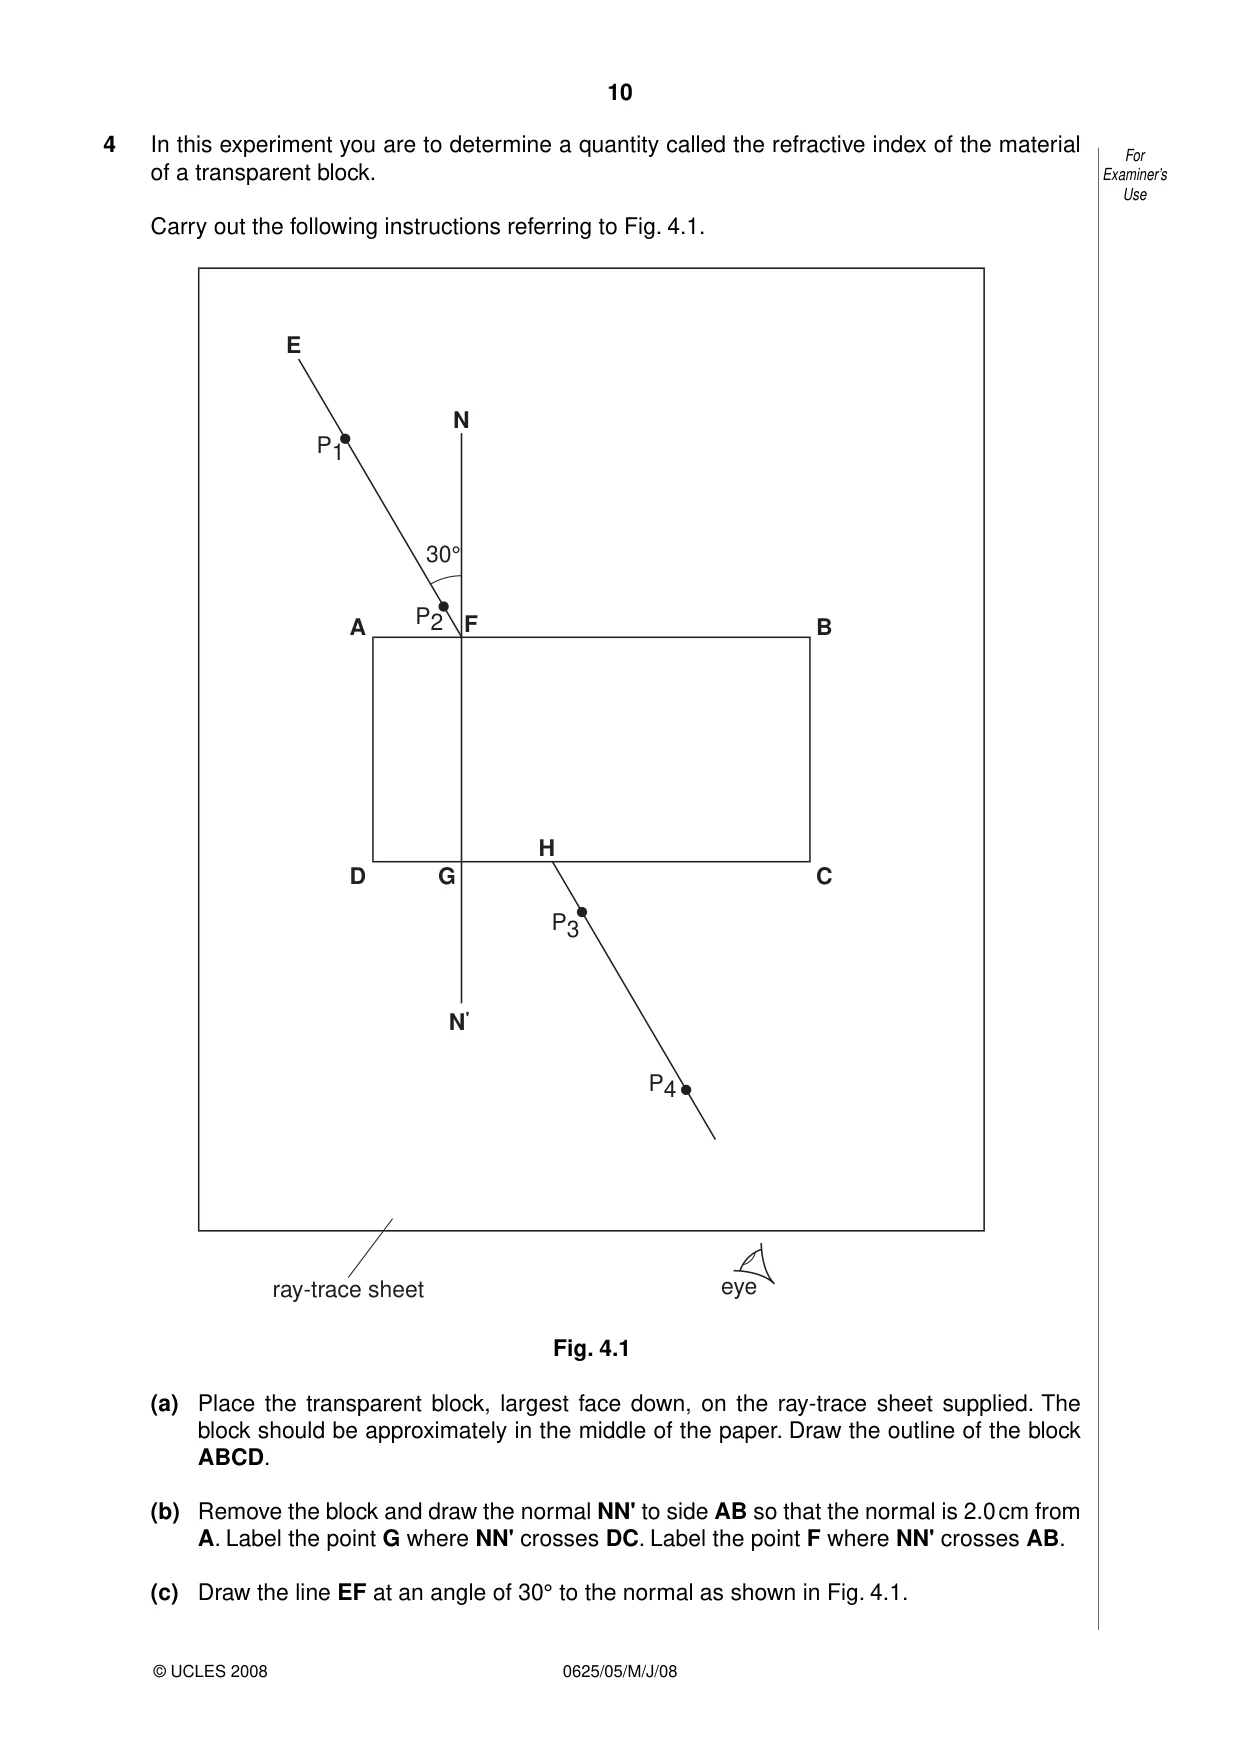
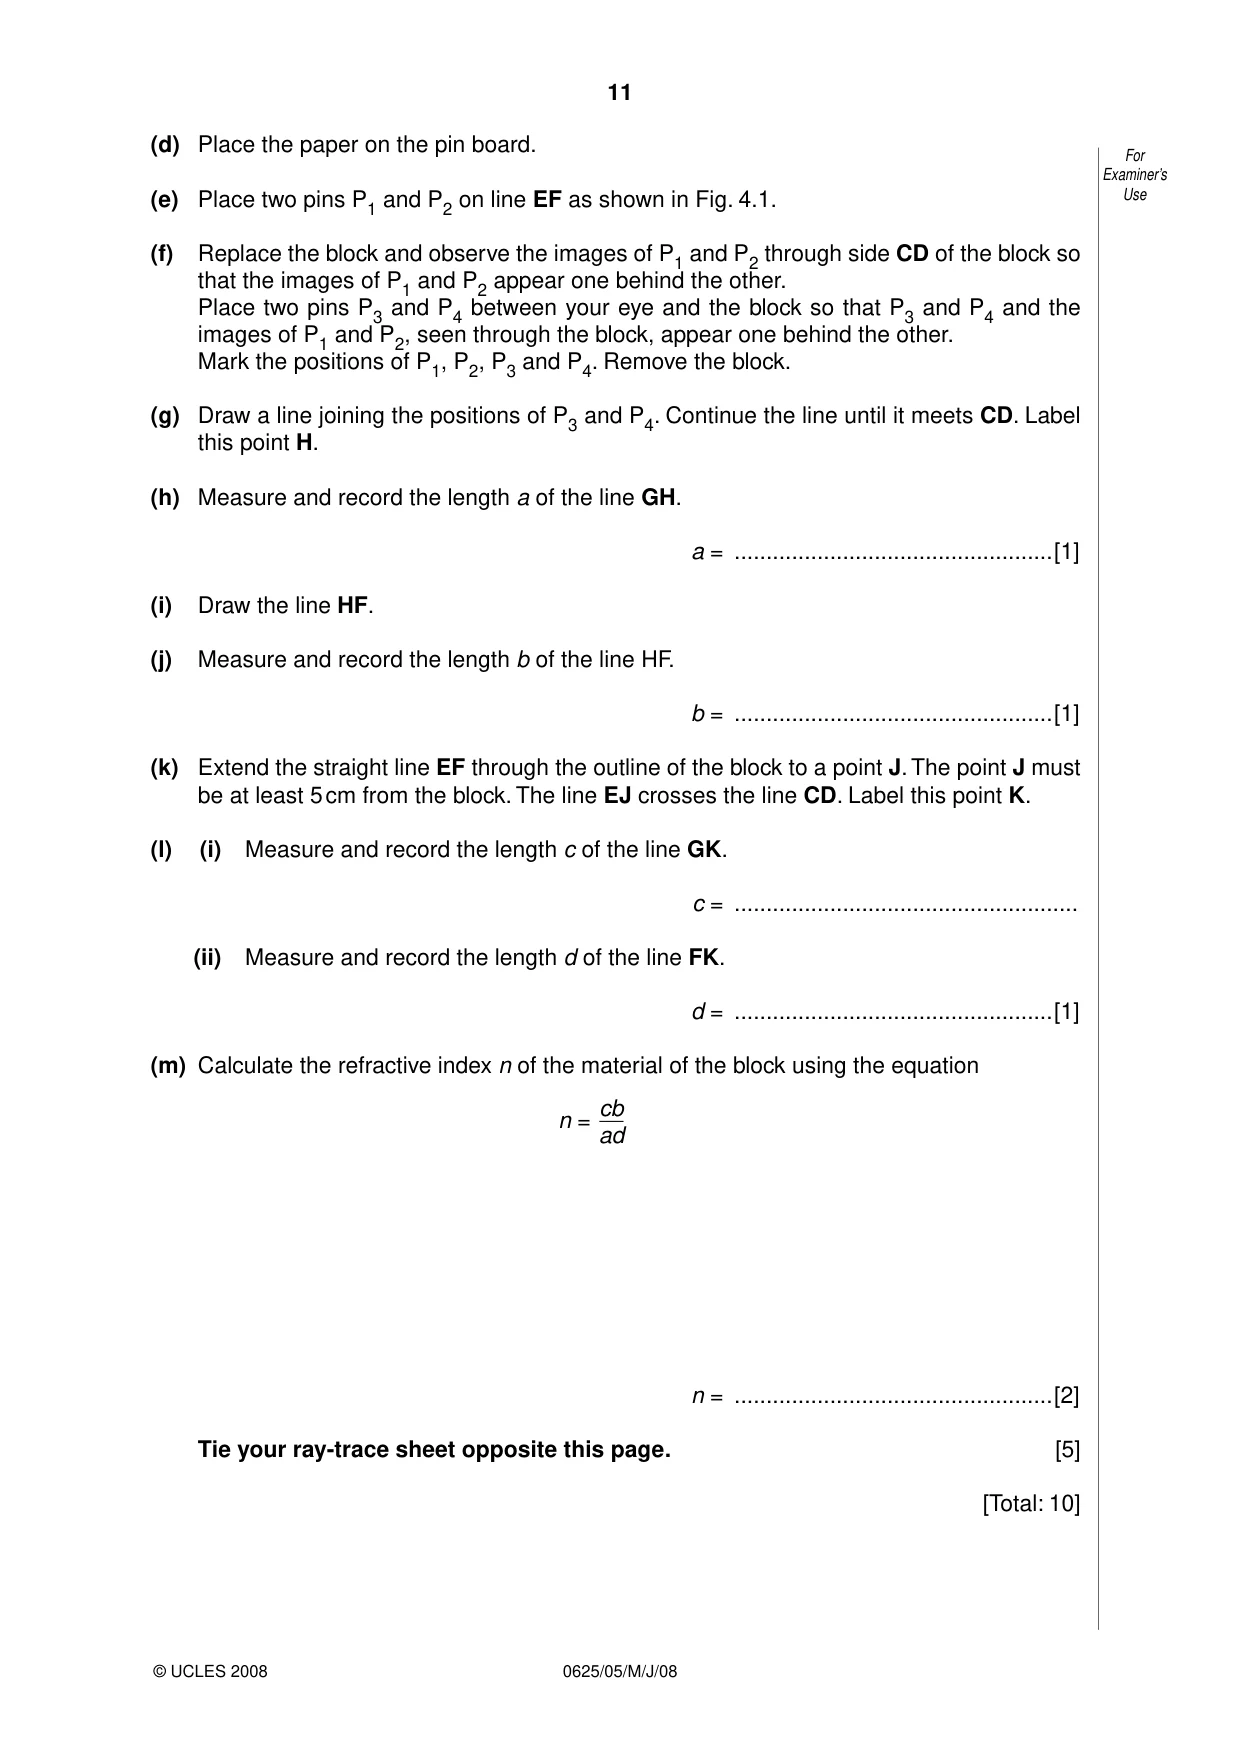
4 In this experiment you are to determine a quantity called the refractive index of the material For of a transparent block. Examiner’s Use Carry out the following instructions referring to Fig. 4.1. E N P1 30° A P2 F B H D G C P3 N' P4 ray-trace sheet eye Fig. 4.1 (a) Place the transparent block, largest face down, on the ray-trace sheet supplied. The block should be approximately in the middle of the paper. Draw the outline of the block ABCD. (b) Remove the block and draw the normal NN' to side AB so that the normal is 2.0 cm from A. Label the point G where NN' crosses DC. Label the point F where NN' crosses AB. (c) Draw the line EF at an angle of 30° to the normal as shown in Fig. 4.1. (d) Place the paper on the pin board. For Examiner’s (e) Place two pins P1 and P2 on line EF as shown in Fig. 4.1. Use (f) Replace the block and observe the images of P1 and P2 through side CD of the block so that the images of P1 and P2 appear one behind the other. Place two pins P3 and P4 between your eye and the block so that P3 and P4 and the images of P1 and P2, seen through the block, appear one behind the other. Mark the positions of P1, P2, P3 and P4. Remove the block. (g) Draw a line joining the positions of P3 and P4. Continue the line until it meets CD. Label this point H. (h) Measure and record the length a of the line GH. a = ..................................................[1] (i) Draw the line HF. (j) Measure and record the length b of the line HF. b = ..................................................[1] (k) Extend the straight line EF through the outline of the block to a point J. The point J must be at least 5 cm from the block. The line EJ crosses the line CD. Label this point K. (l) (i) Measure and record the length c of the line GK. c = ...................................................... (ii) Measure and record the length d of the line FK. d = ..................................................[1] (m) Calculate the refractive index n of the material of the block using the equation cb n = ad n = ..................................................[2] Tie your ray-trace sheet opposite this page. [5] [Total: 10]
Mark scheme: 4 Trace: all lines present, thin, neat and in correct areas [1] normal drawn [1] EF at 30° to normal (by eye) [1] P3P4 distances at least 5 cm [1] KJ at least 5 cm [1] (h) a correct to 2mm [1] (j) b correct to 2mm [1] (l) c and d recorded, a and b both in mm, cm or m with unit [1] (m) correct calculation of n, value 1.3–1.7 [1] 2/3 significant figures with no unit [1] [Total: 10]
What was in this paper
The subtopics covered by these 4 questions, and how many questions each got. Open one in a new tab to see every Cambridge question on it.
What you needed in this session
Cambridge’s own grade thresholds for 2008 May/June, Paper 5 · Variant 1. A higher threshold means an easier paper — the bar moves with how the cohort did.