Cambridge IGCSE Physical Science 0652 — 2013 Oct/Nov Paper 6 · Variant 1
0652/61/O/N/13
The question paper and its mark scheme, free to read here and free to download. This is Cambridge’s own paper, exactly as it was sat.
Question paper20 pages
Mark scheme4 pages
Answers below. Sit the paper first if you are practising.
Paper as text
Question paper, page 1
This document consists of 20 printed pages. IB13 11_0652_61/3RP © UCLES 2013 [Turn over *6333115655* UNIVERSITY OF CAMBRIDGE INTERNATIONAL EXAMINATIONS International General Certificate of Secondary Education PHYSICAL SCIENCE 0652/61 Paper 6 Alternative to Practical October/November 2013 1 hour Candidates answer on the Question Paper. No Additional Materials are required. READ THESE INSTRUCTIONS FIRST Write your Centre number, candidate number and name on all the work you hand in. Write in dark blue or black pen. You may use a pencil for any diagrams or graphs. Do not use staples, paper clips, glue or correction fluid. DO NOT WRITE IN ANY BARCODES. Answer all questions. Electronic calculators may be used. You may lose marks if you do not show your working or if you do not use appropriate units. At the end of the examination, fasten all your work securely together. The number of marks is given in brackets [ ] at the end of each question or part question.
Question paper, page 2
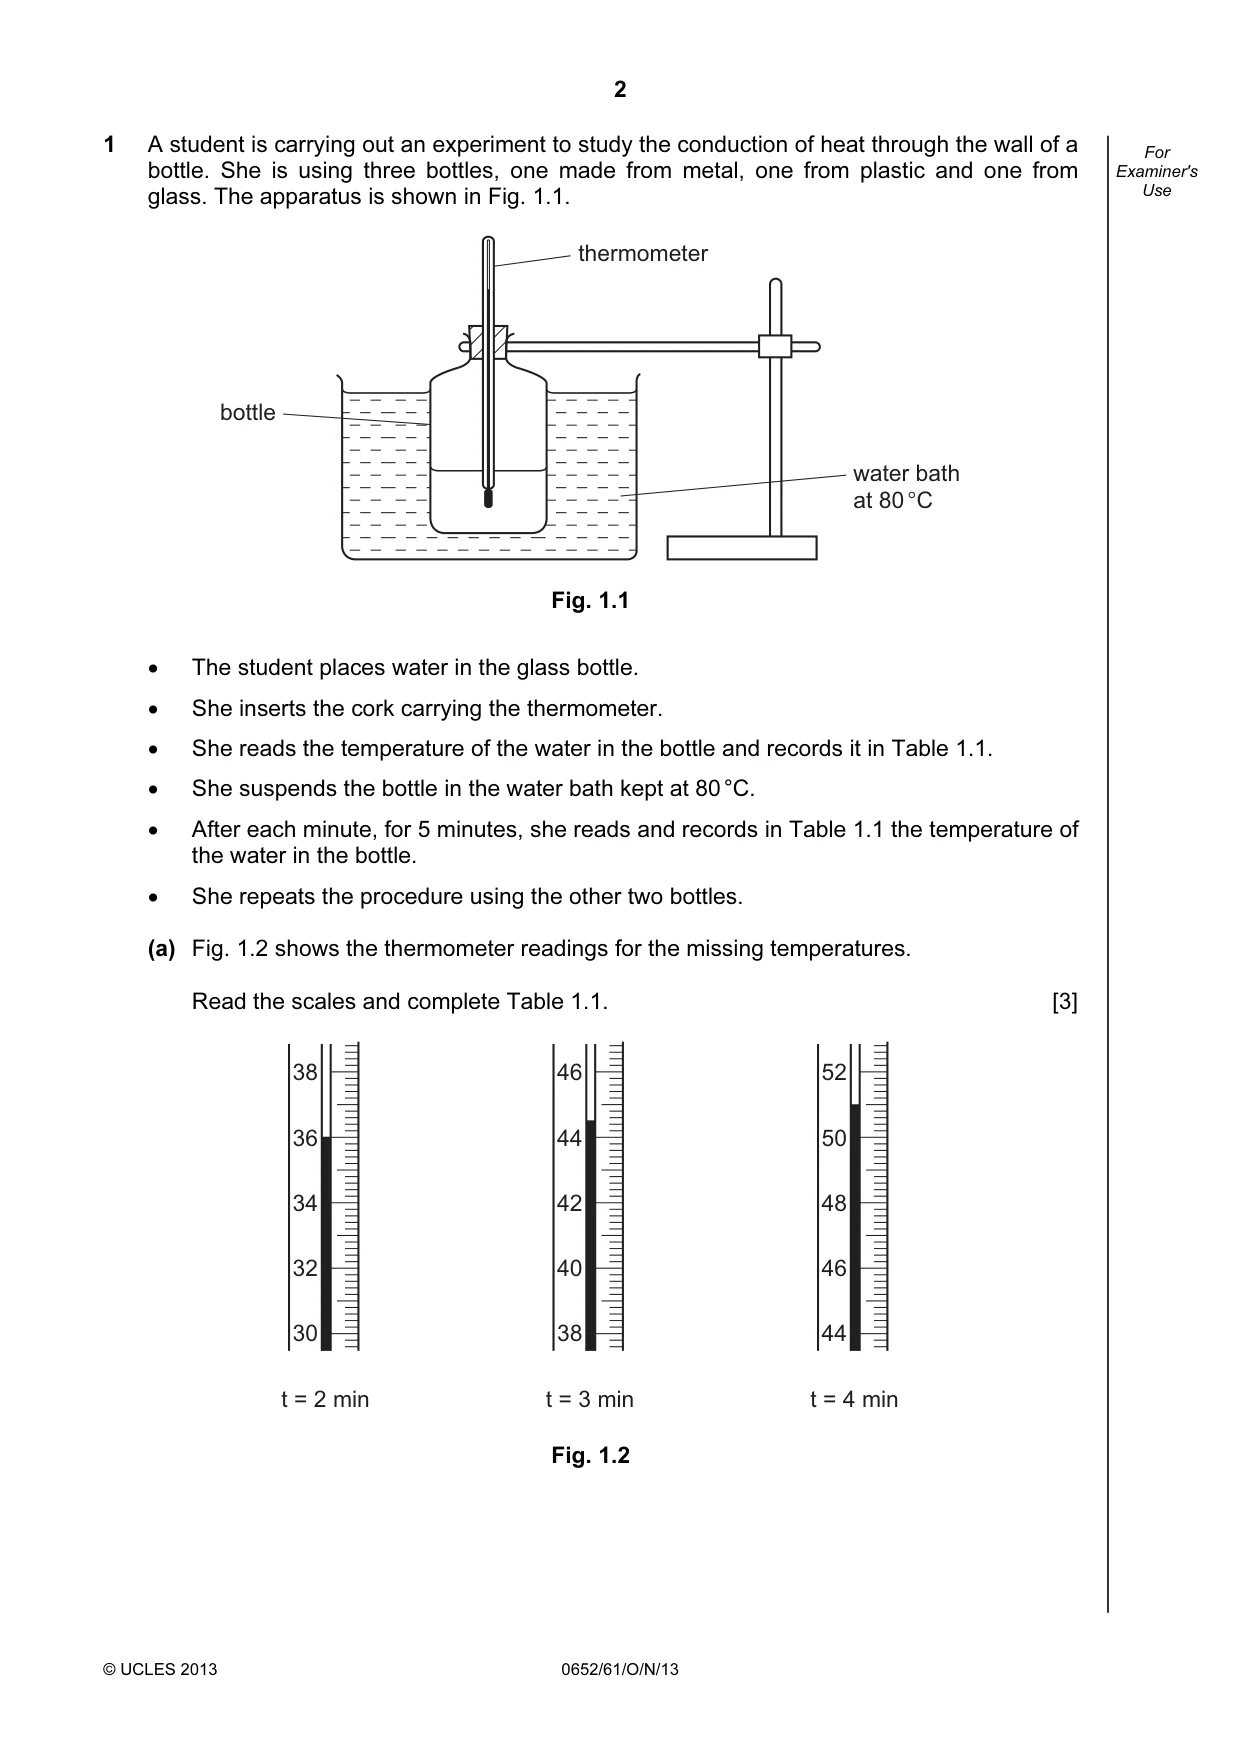
2 © UCLES 2013 0652/61/O/N/13 For Examiner's Use 1 A student is carrying out an experiment to study the conduction of heat through the wall of a bottle. She is using three bottles, one made from metal, one from plastic and one from glass. The apparatus is shown in Fig. 1.1. bottle thermometer water bath at 80 °C Fig. 1.1 • The student places water in the glass bottle. • She inserts the cork carrying the thermometer. • She reads the temperature of the water in the bottle and records it in Table 1.1. • She suspends the bottle in the water bath kept at 80 °C. • After each minute, for 5 minutes, she reads and records in Table 1.1 the temperature of the water in the bottle. • She repeats the procedure using the other two bottles. (a) Fig. 1.2 shows the thermometer readings for the missing temperatures. Read the scales and complete Table 1.1. [3] 38 36 34 32 30 t = 2 min 46 44 42 40 38 t = 3 min 52 50 48 46 44 t = 4 min Fig. 1.2
Question paper, page 3
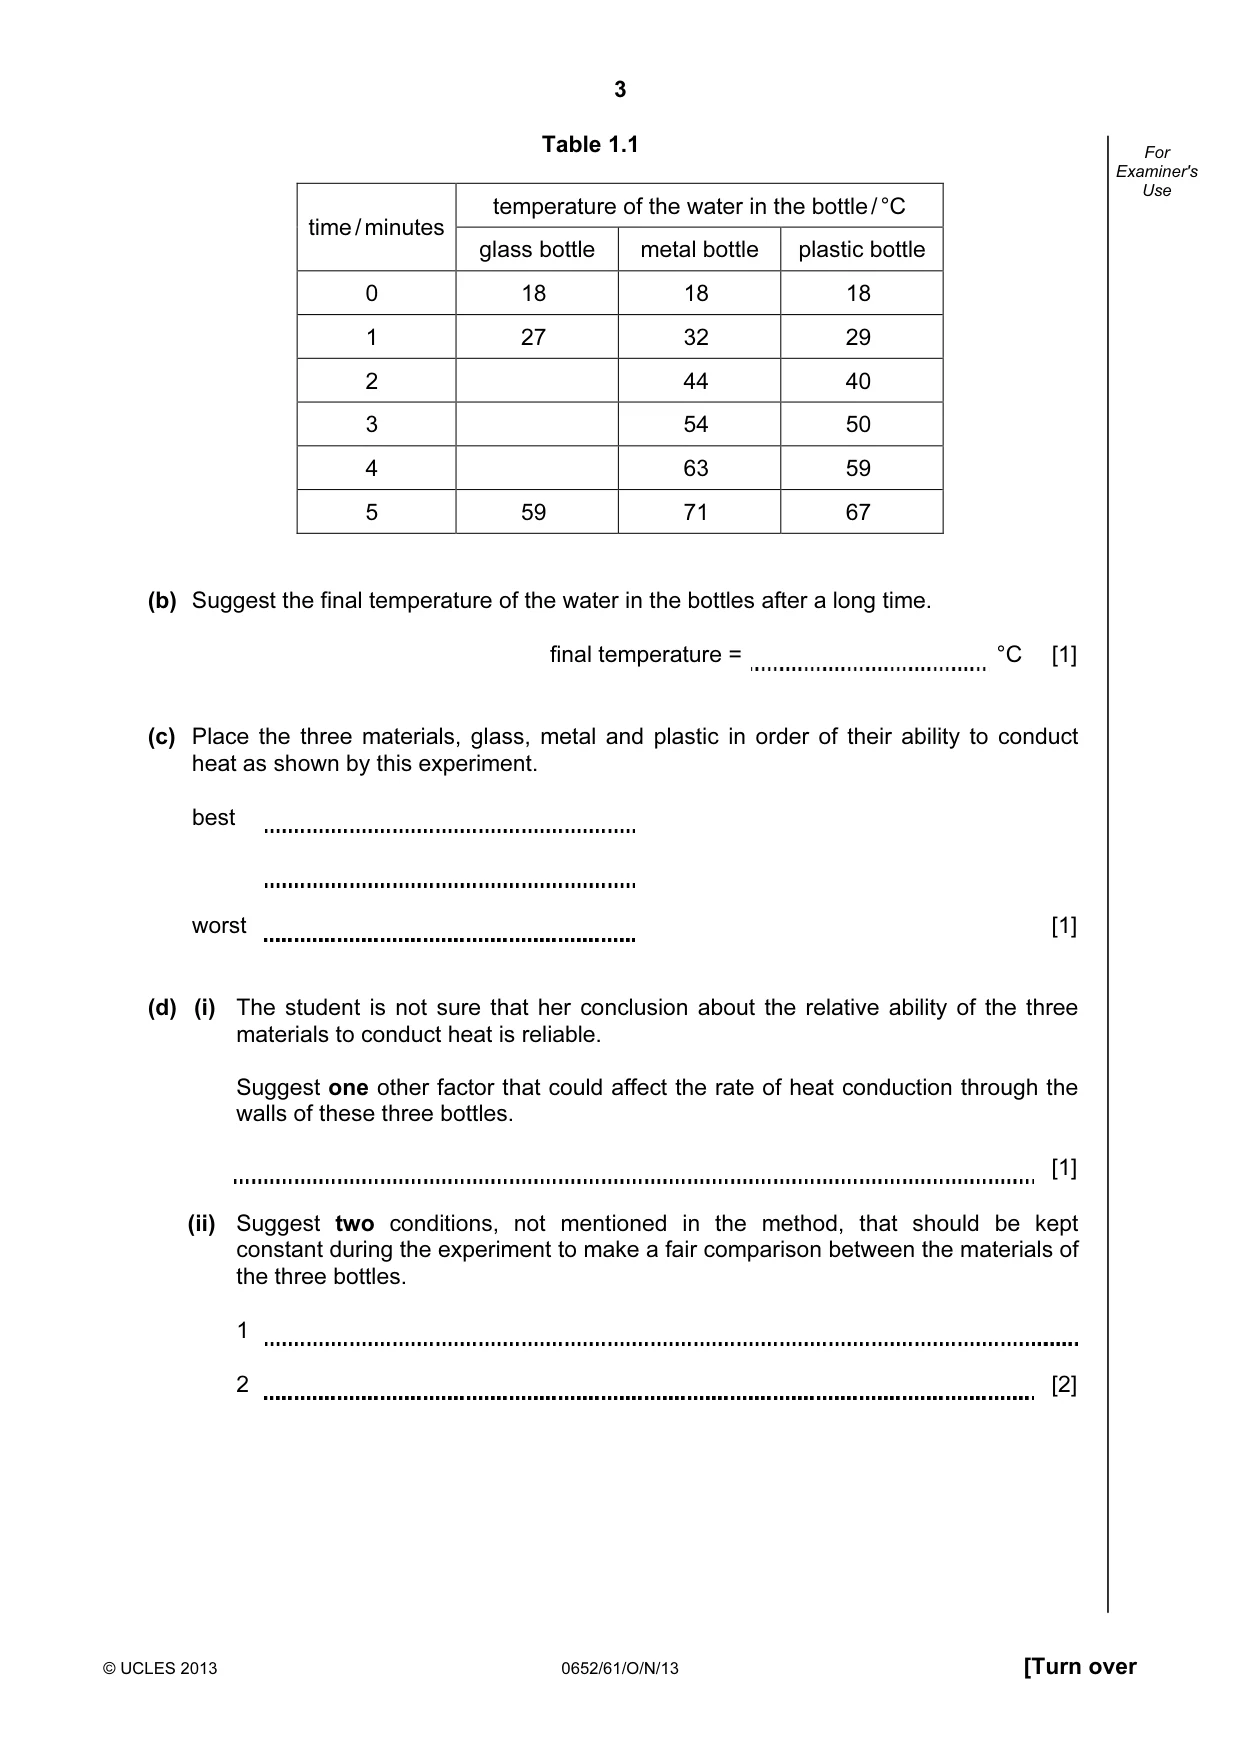
3 © UCLES 2013 0652/61/O/N/13 [Turn over For Examiner's Use Table 1.1 temperature of the water in the bottle / °C time / minutes glass bottle metal bottle plastic bottle 0 18 18 18 1 27 32 29 2 44 40 3 54 50 4 63 59 5 59 71 67 (b) Suggest the final temperature of the water in the bottles after a long time. final temperature = °C [1] (c) Place the three materials, glass, metal and plastic in order of their ability to conduct heat as shown by this experiment. best worst [1] (d) (i) The student is not sure that her conclusion about the relative ability of the three materials to conduct heat is reliable. Suggest one other factor that could affect the rate of heat conduction through the walls of these three bottles. [1] (ii) Suggest two conditions, not mentioned in the method, that should be kept constant during the experiment to make a fair comparison between the materials of the three bottles. 1 2 [2]
Question paper, page 4
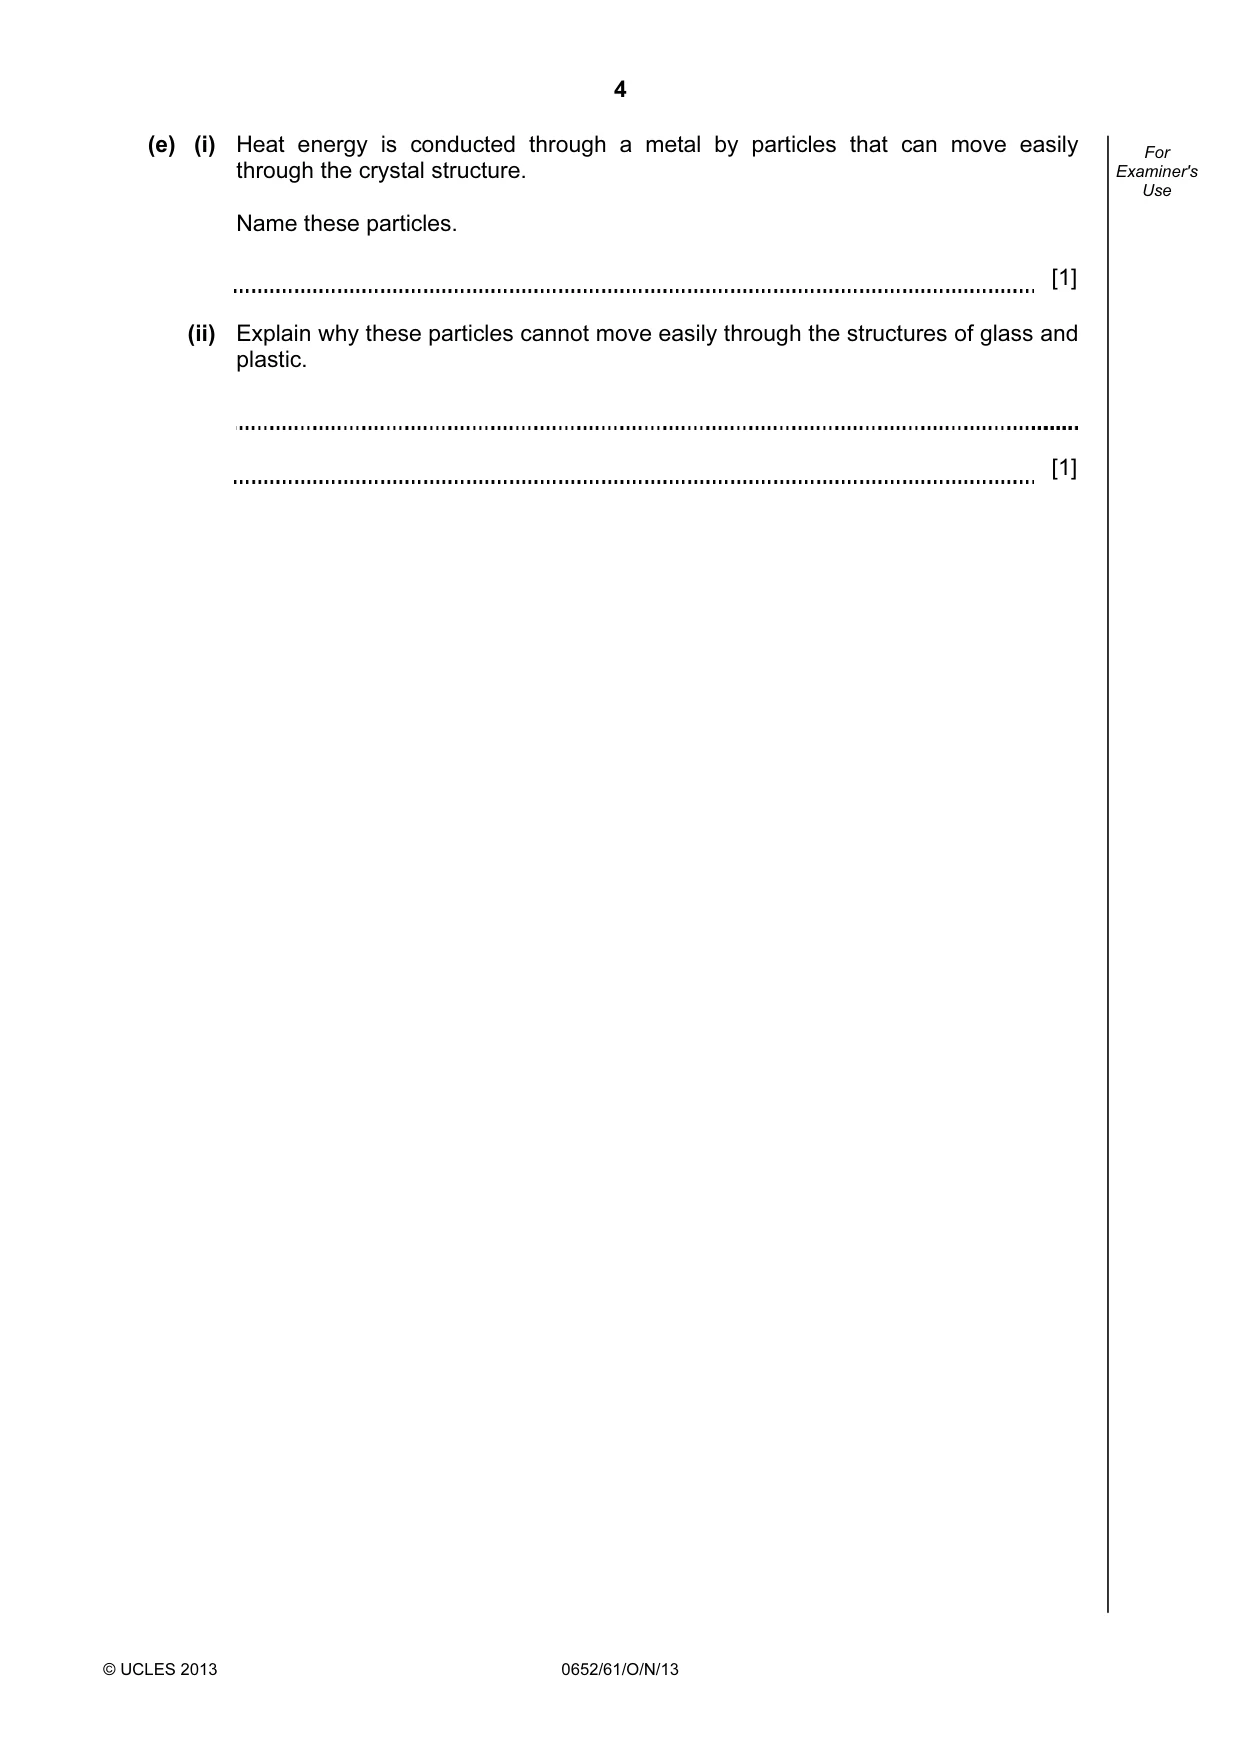
4 © UCLES 2013 0652/61/O/N/13 For Examiner's Use (e) (i) Heat energy is conducted through a metal by particles that can move easily through the crystal structure. Name these particles. [1] (ii) Explain why these particles cannot move easily through the structures of glass and plastic. [1]
Question paper, page 5
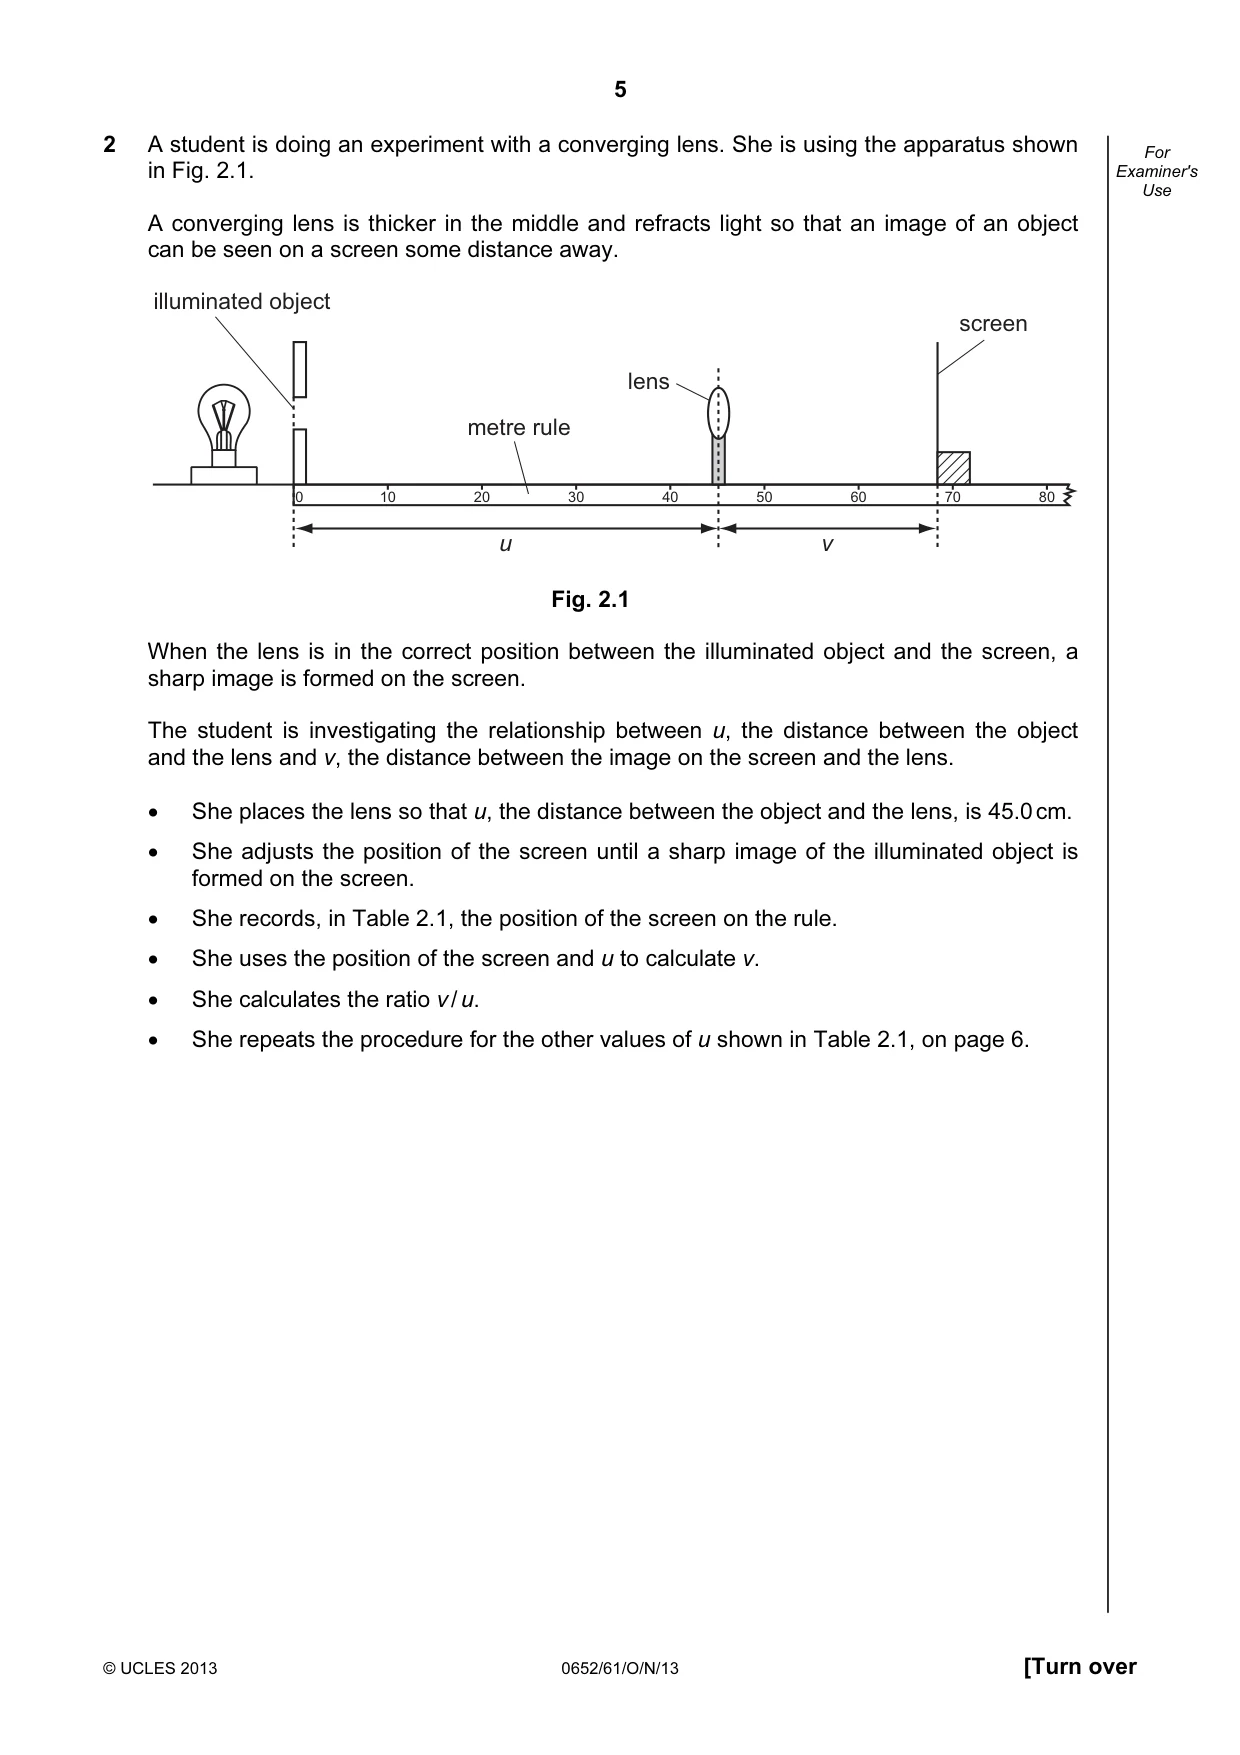
5 © UCLES 2013 0652/61/O/N/13 [Turn over For Examiner's Use 2 A student is doing an experiment with a converging lens. She is using the apparatus shown in Fig. 2.1. A converging lens is thicker in the middle and refracts light so that an image of an object can be seen on a screen some distance away. u v screen illuminated object lens 10 0 20 30 40 50 60 70 80 metre rule Fig. 2.1 When the lens is in the correct position between the illuminated object and the screen, a sharp image is formed on the screen. The student is investigating the relationship between u, the distance between the object and the lens and v, the distance between the image on the screen and the lens. • She places the lens so that u, the distance between the object and the lens, is 45.0 cm. • She adjusts the position of the screen until a sharp image of the illuminated object is formed on the screen. • She records, in Table 2.1, the position of the screen on the rule. • She uses the position of the screen and u to calculate v. • She calculates the ratio v / u. • She repeats the procedure for the other values of u shown in Table 2.1, on page 6.
Question paper, page 6
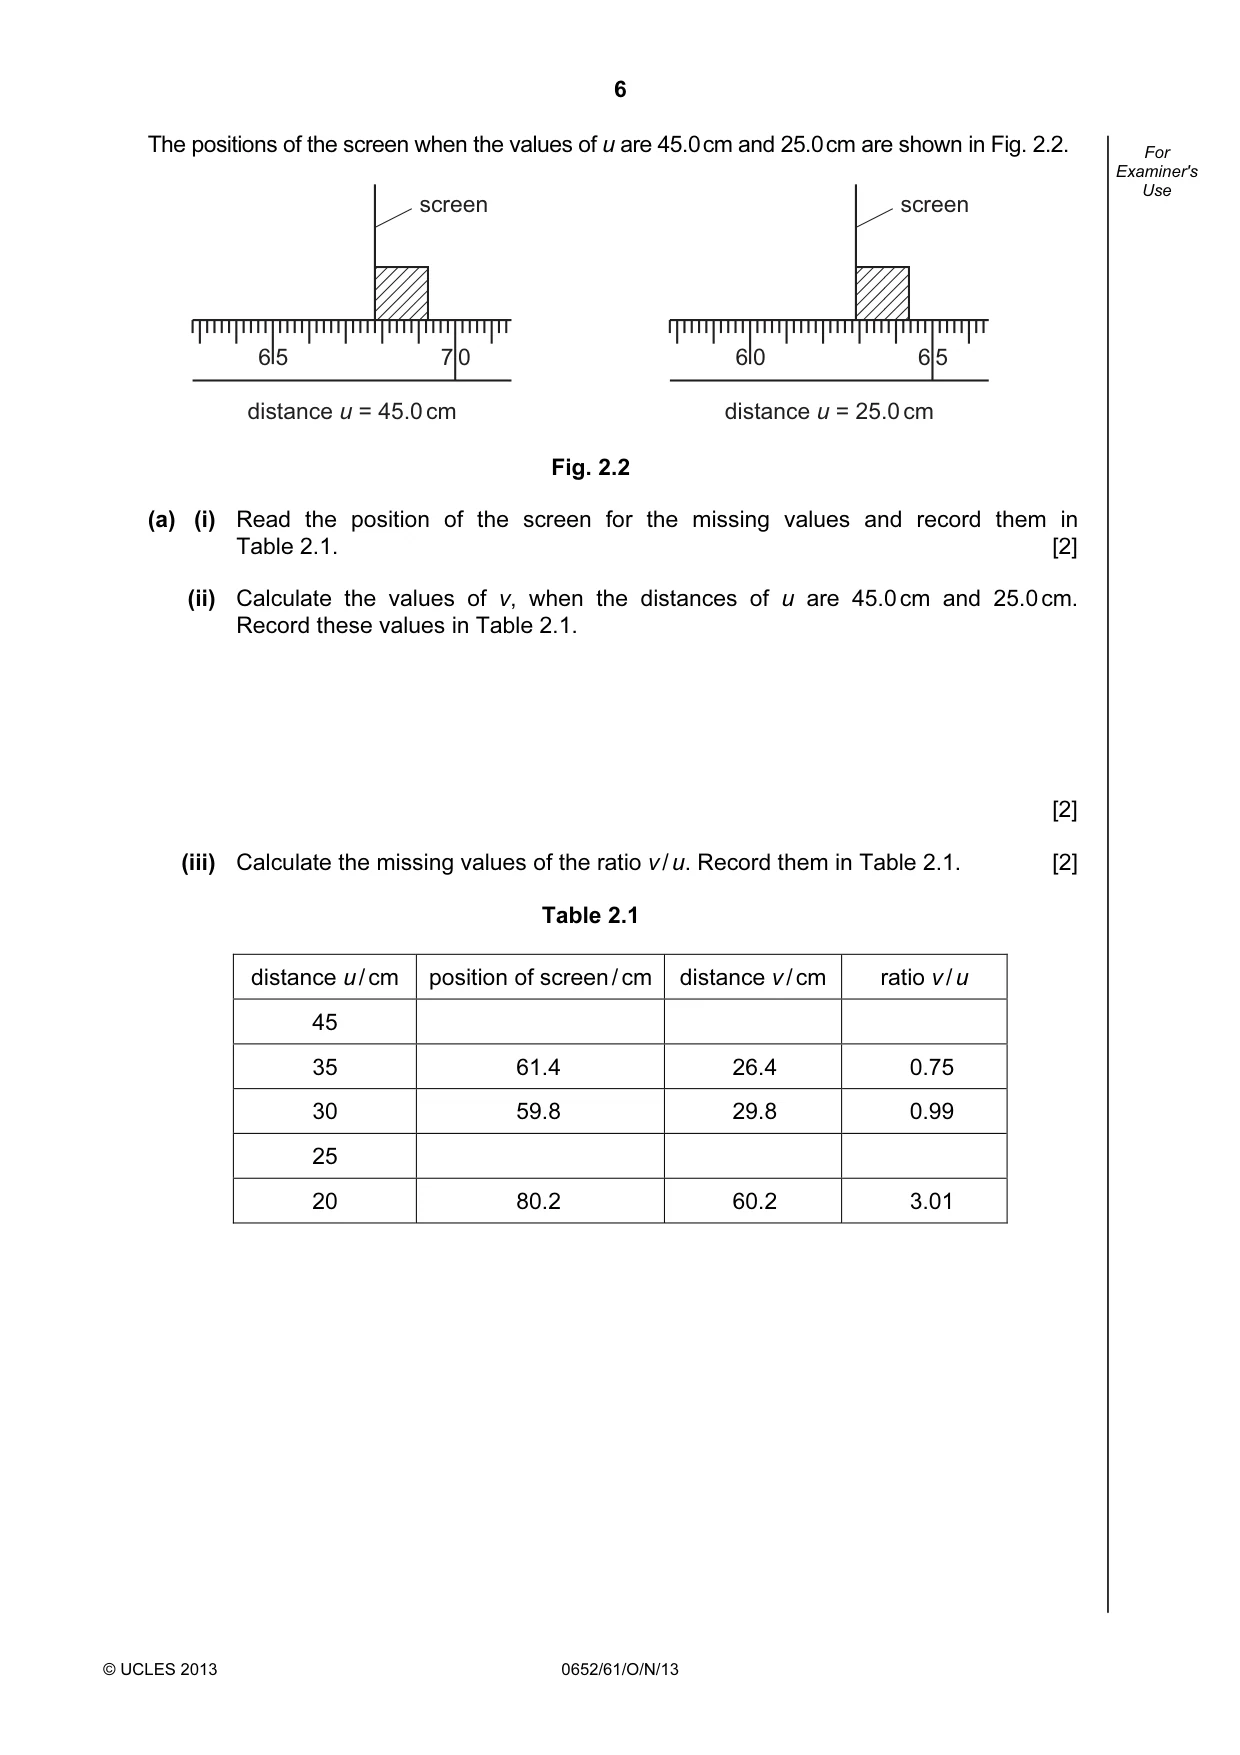
6 © UCLES 2013 0652/61/O/N/13 For Examiner's Use The positions of the screen when the values of u are 45.0 cm and 25.0 cm are shown in Fig. 2.2. 6 5 7 0 screen distance u = 45.0 cm 6 0 6 5 screen distance u = 25.0 cm Fig. 2.2 (a) (i) Read the position of the screen for the missing values and record them in Table 2.1. [2] (ii) Calculate the values of v, when the distances of u are 45.0 cm and 25.0 cm. Record these values in Table 2.1. [2] (iii) Calculate the missing values of the ratio v / u. Record them in Table 2.1. [2] Table 2.1 distance u / cm position of screen / cm distance v / cm ratio v / u 45 35 61.4 26.4 0.75 30 59.8 29.8 0.99 25 20 80.2 60.2 3.01
Question paper, page 7
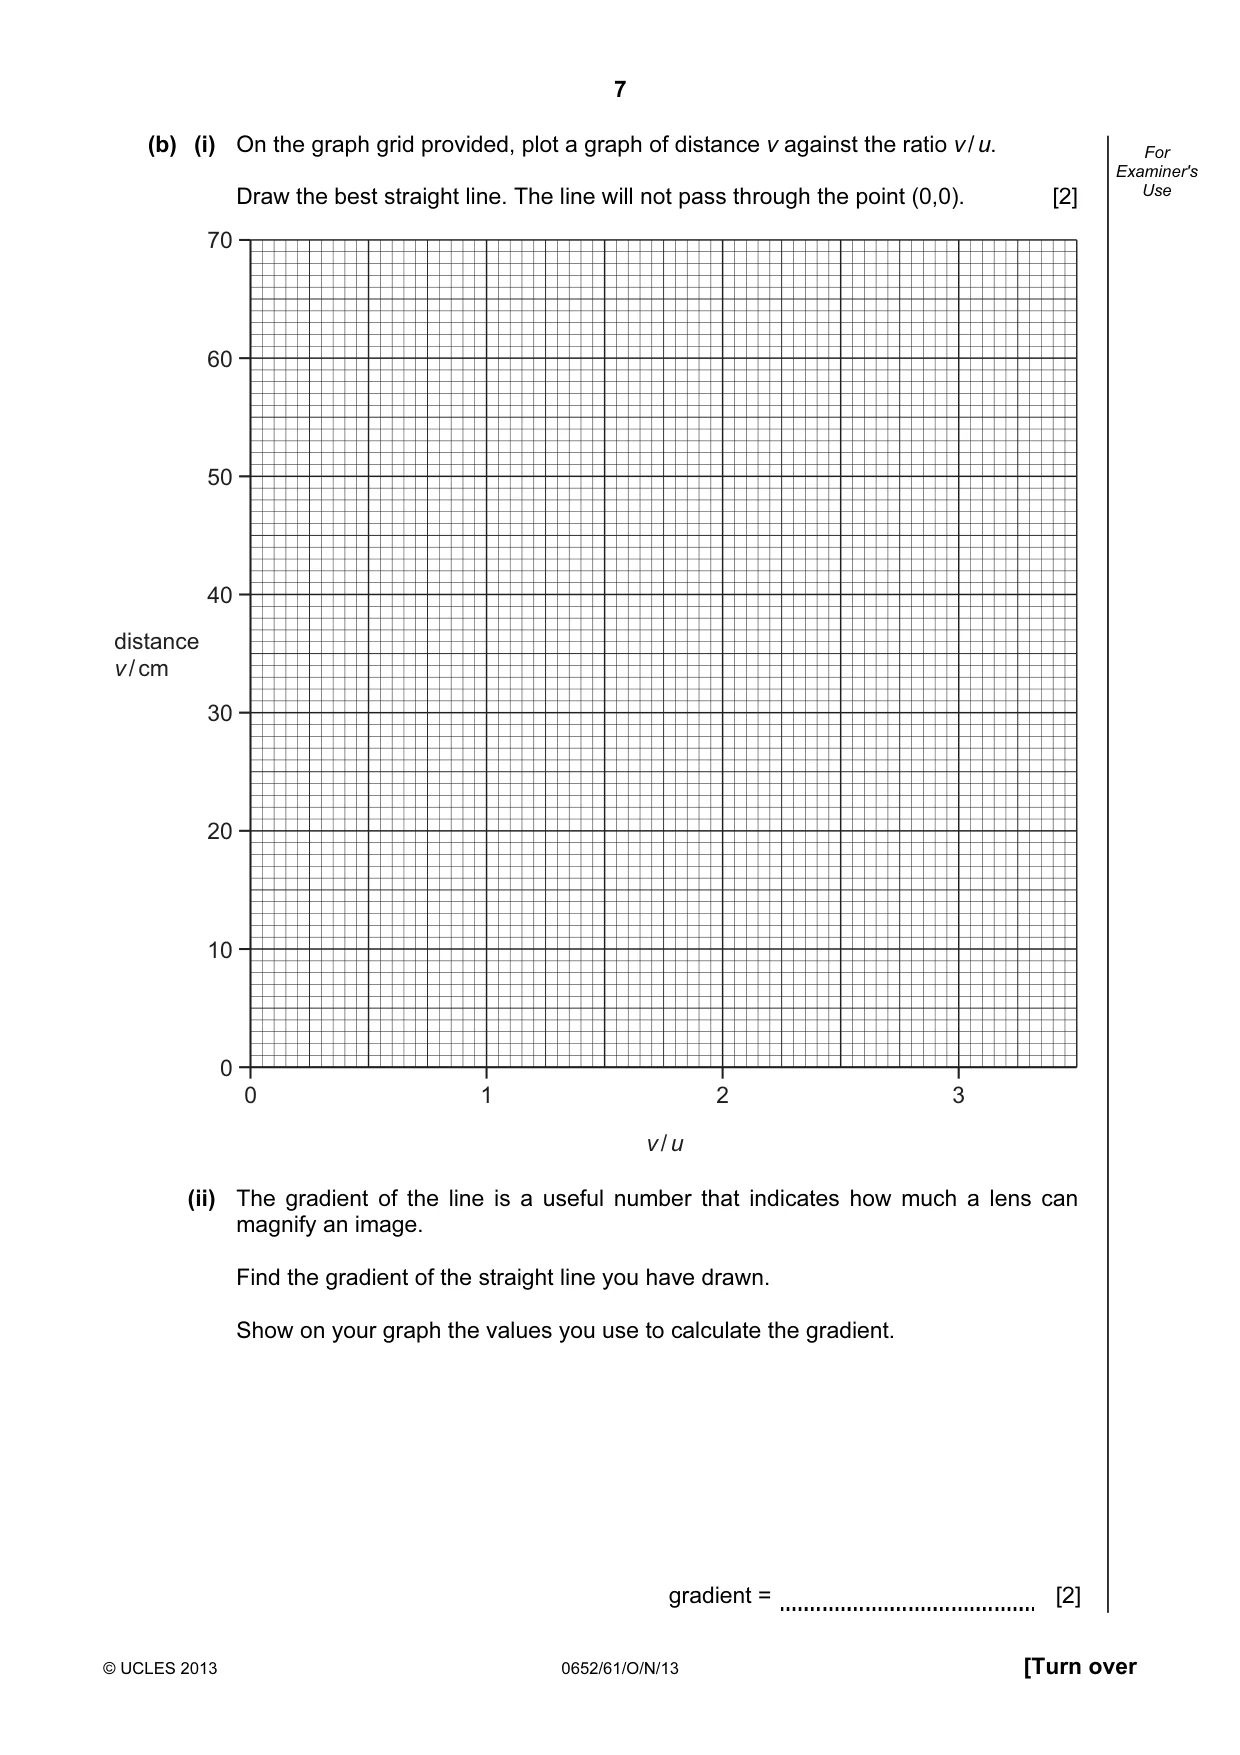
7 © UCLES 2013 0652/61/O/N/13 [Turn over For Examiner's Use (b) (i) On the graph grid provided, plot a graph of distance v against the ratio v / u. Draw the best straight line. The line will not pass through the point (0,0). [2] 0 1 2 3 70 60 50 40 30 20 10 0 distance v / cm v / u (ii) The gradient of the line is a useful number that indicates how much a lens can magnify an image. Find the gradient of the straight line you have drawn. Show on your graph the values you use to calculate the gradient. gradient = [2]
Question paper, page 8
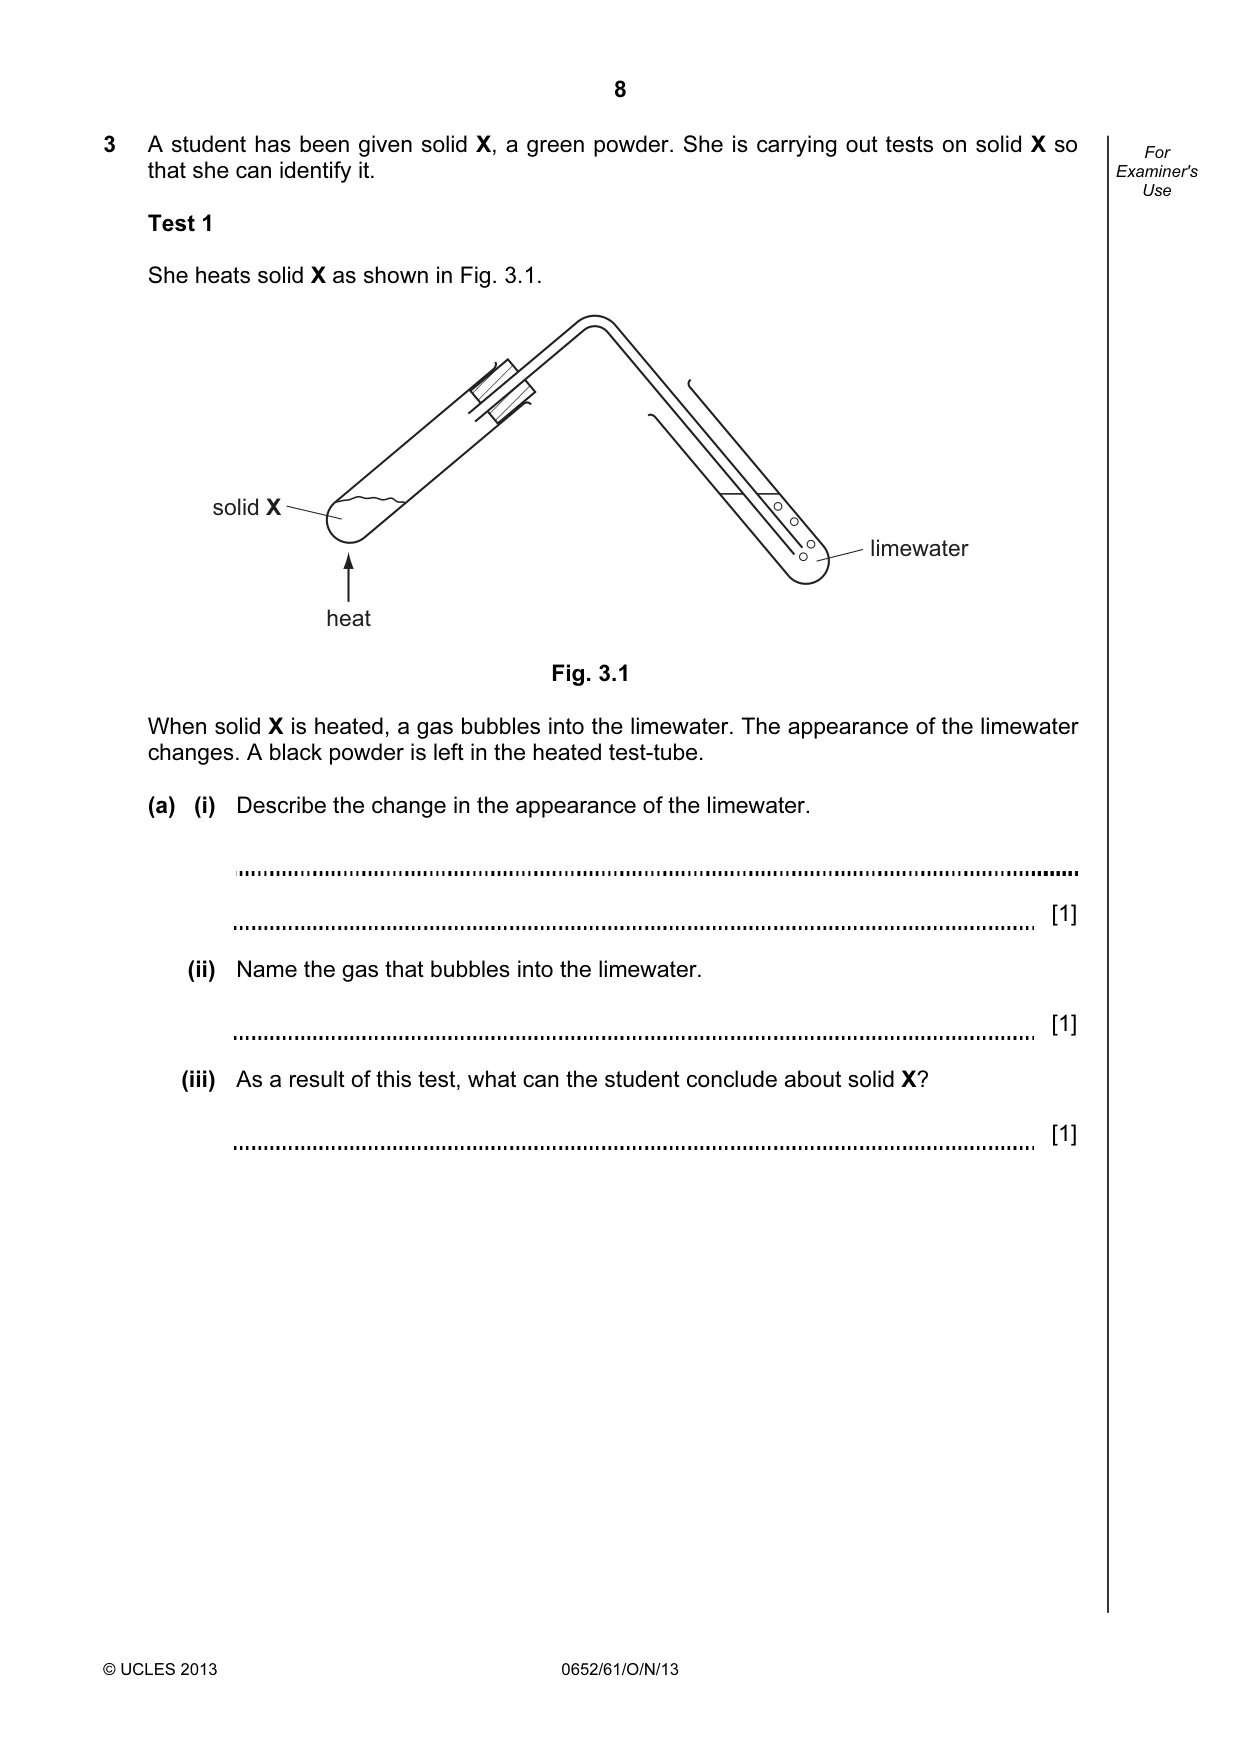
8 © UCLES 2013 0652/61/O/N/13 For Examiner's Use 3 A student has been given solid X, a green powder. She is carrying out tests on solid X so that she can identify it. Test 1 She heats solid X as shown in Fig. 3.1. solid X heat limewater Fig. 3.1 When solid X is heated, a gas bubbles into the limewater. The appearance of the limewater changes. A black powder is left in the heated test-tube. (a) (i) Describe the change in the appearance of the limewater. [1] (ii) Name the gas that bubbles into the limewater. [1] (iii) As a result of this test, what can the student conclude about solid X? [1]
Question paper, page 9
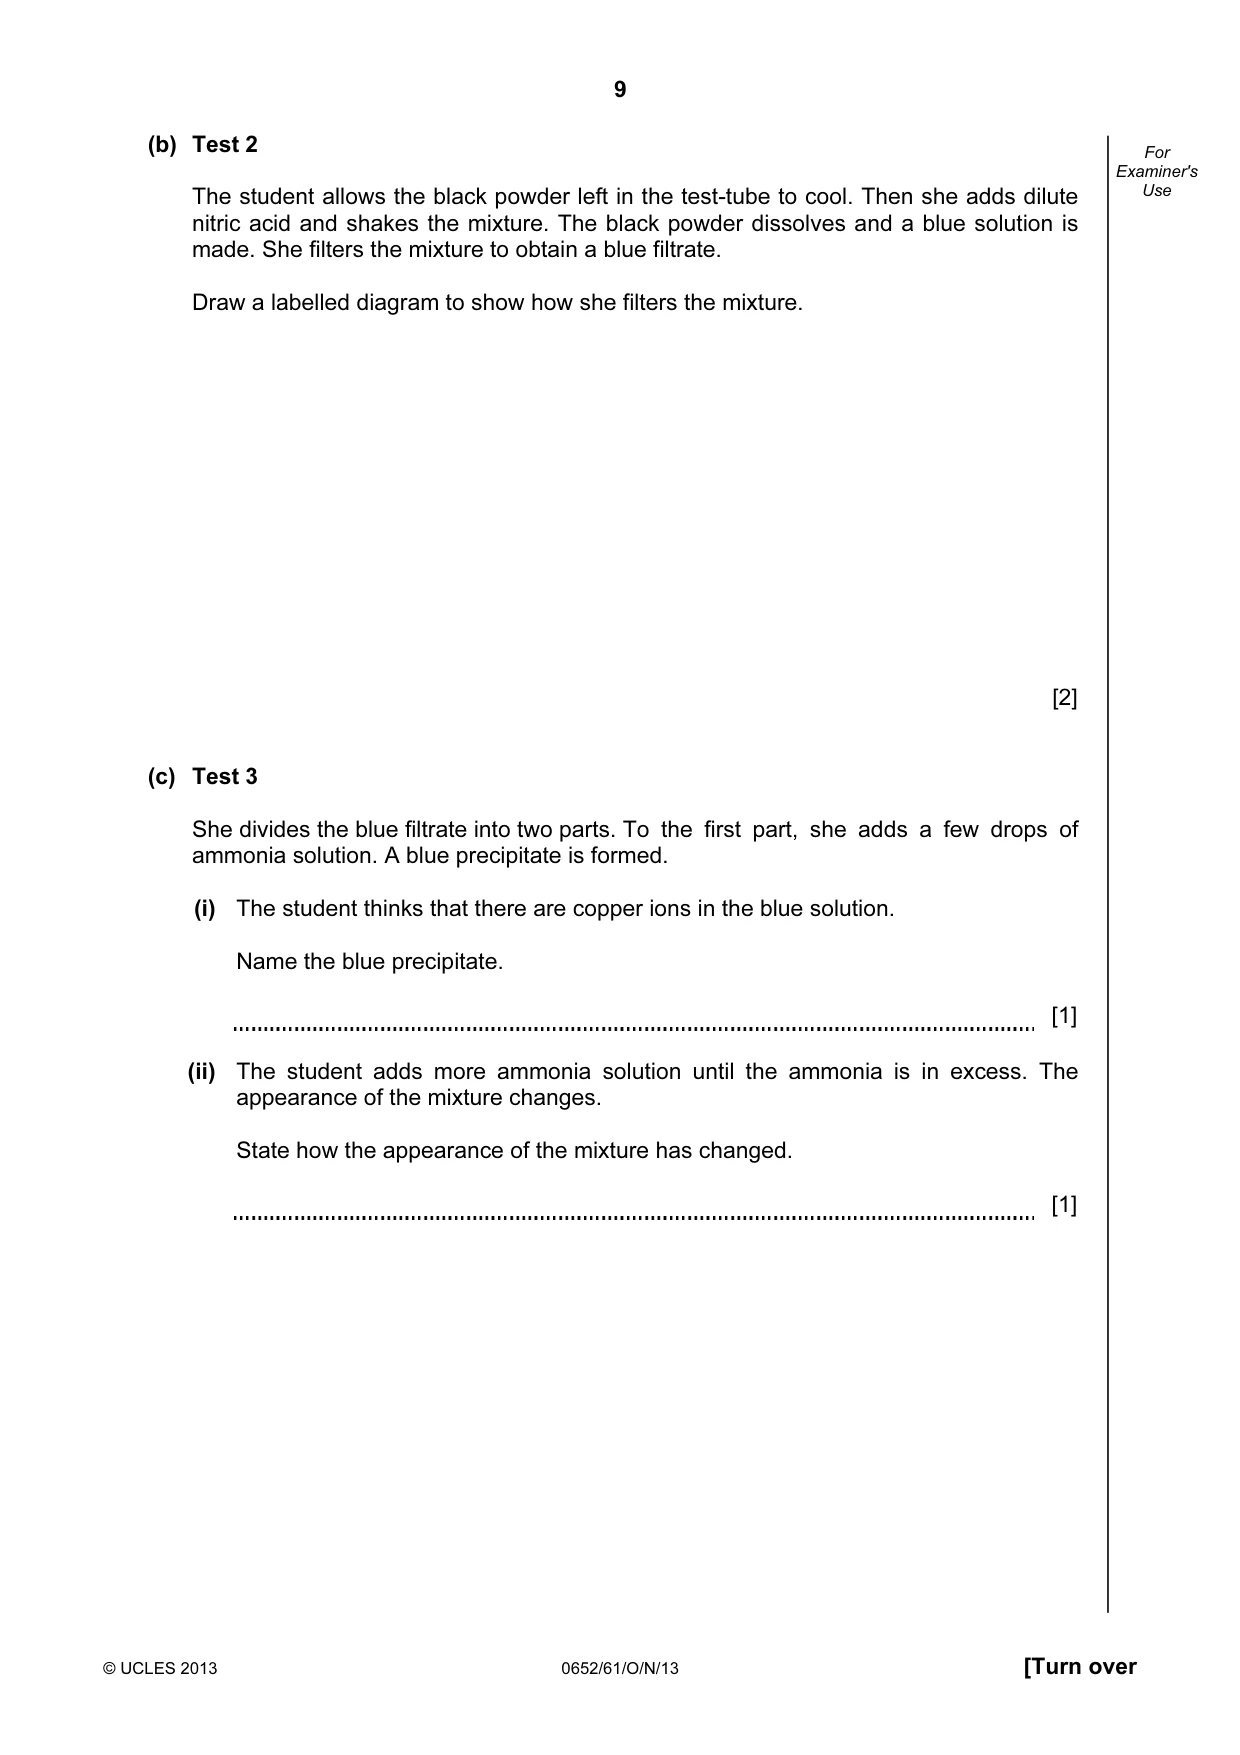
9 © UCLES 2013 0652/61/O/N/13 [Turn over For Examiner's Use (b) Test 2 The student allows the black powder left in the test-tube to cool. Then she adds dilute nitric acid and shakes the mixture. The black powder dissolves and a blue solution is made. She filters the mixture to obtain a blue filtrate. Draw a labelled diagram to show how she filters the mixture. [2] (c) Test 3 She divides the blue filtrate into two parts. To the first part, she adds a few drops of ammonia solution. A blue precipitate is formed. (i) The student thinks that there are copper ions in the blue solution. Name the blue precipitate. [1] (ii) The student adds more ammonia solution until the ammonia is in excess. The appearance of the mixture changes. State how the appearance of the mixture has changed. [1]
Question paper, page 10
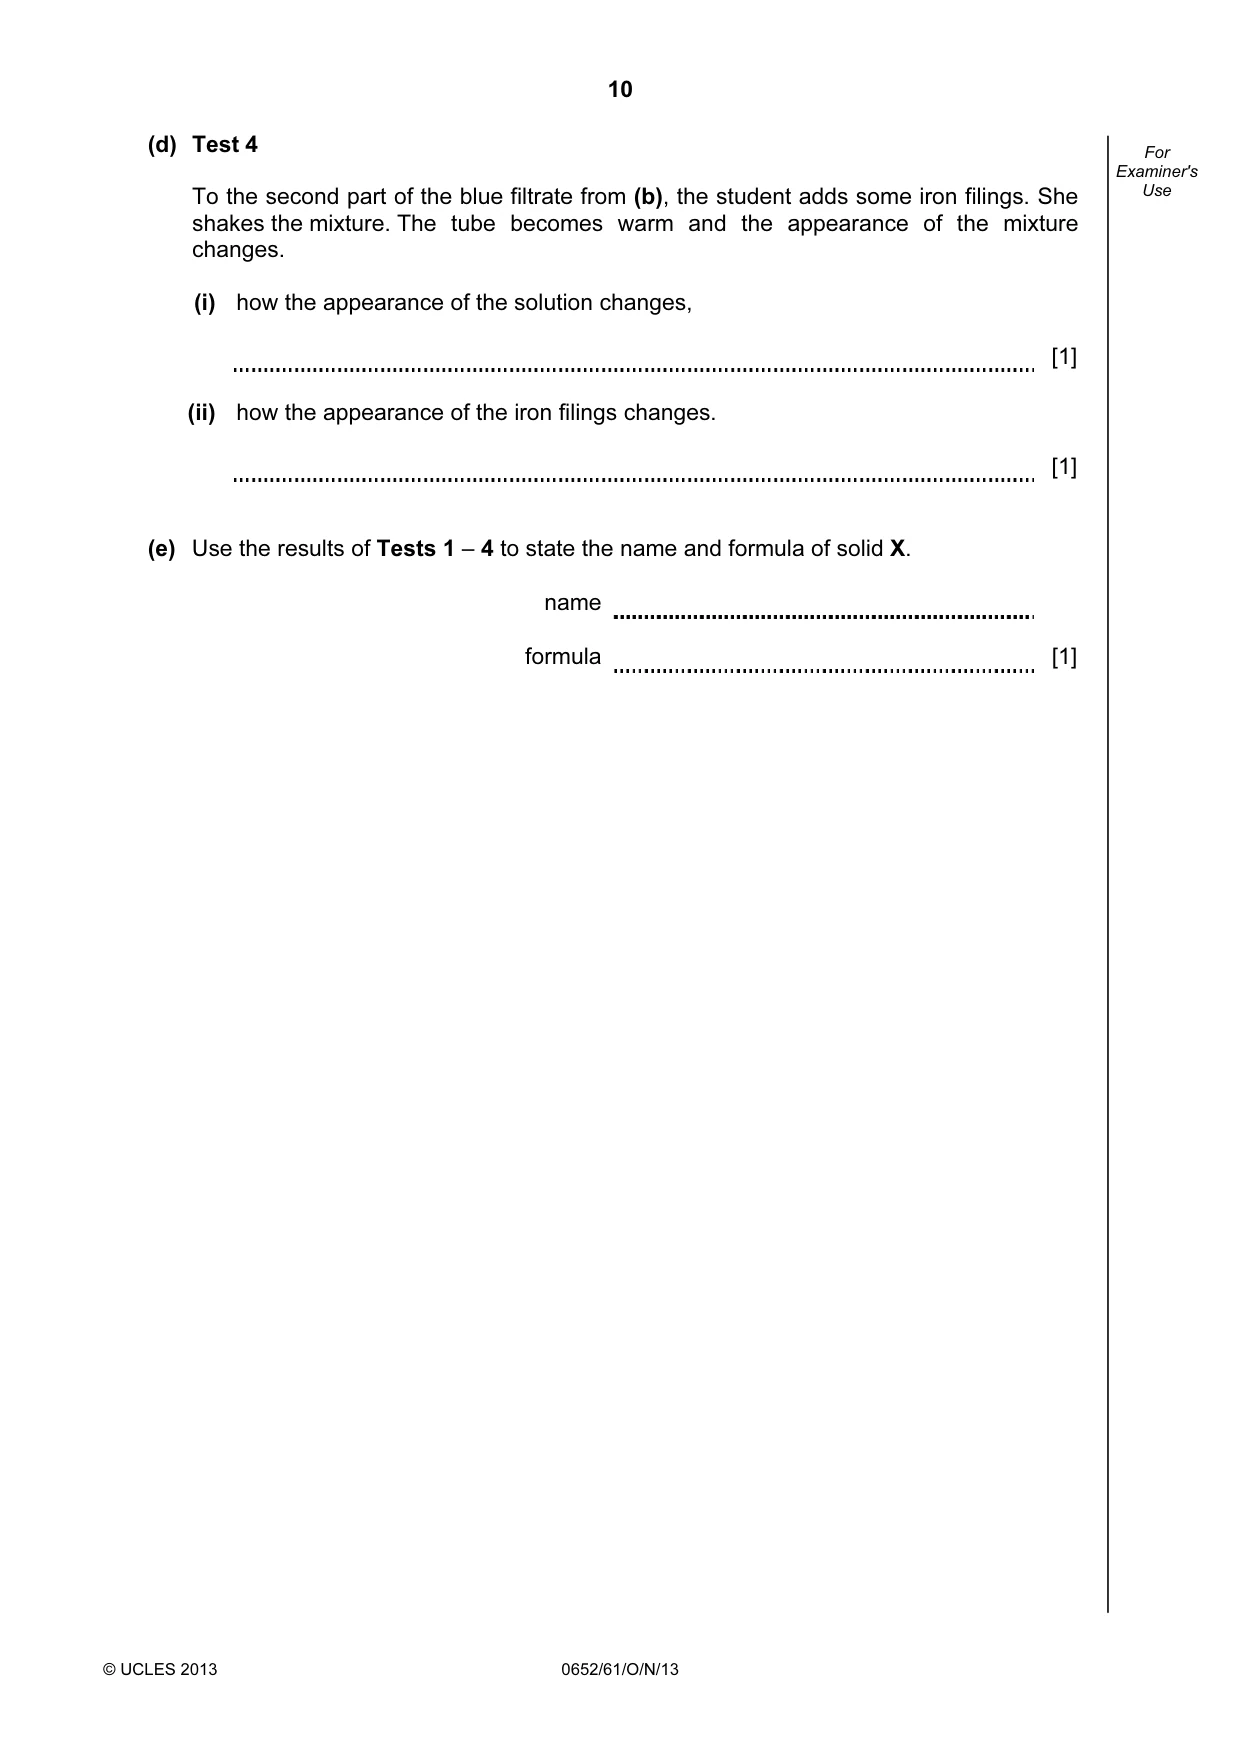
10 © UCLES 2013 0652/61/O/N/13 For Examiner's Use (d) Test 4 To the second part of the blue filtrate from (b), the student adds some iron filings. She shakes the mixture. The tube becomes warm and the appearance of the mixture changes. (i) how the appearance of the solution changes, [1] (ii) how the appearance of the iron filings changes. [1] (e) Use the results of Tests 1 – 4 to state the name and formula of solid X. name formula [1]
Question paper, page 11
11 © UCLES 2013 0652/61/O/N/13 [Turn over Please turn over for Question 4.
Question paper, page 12
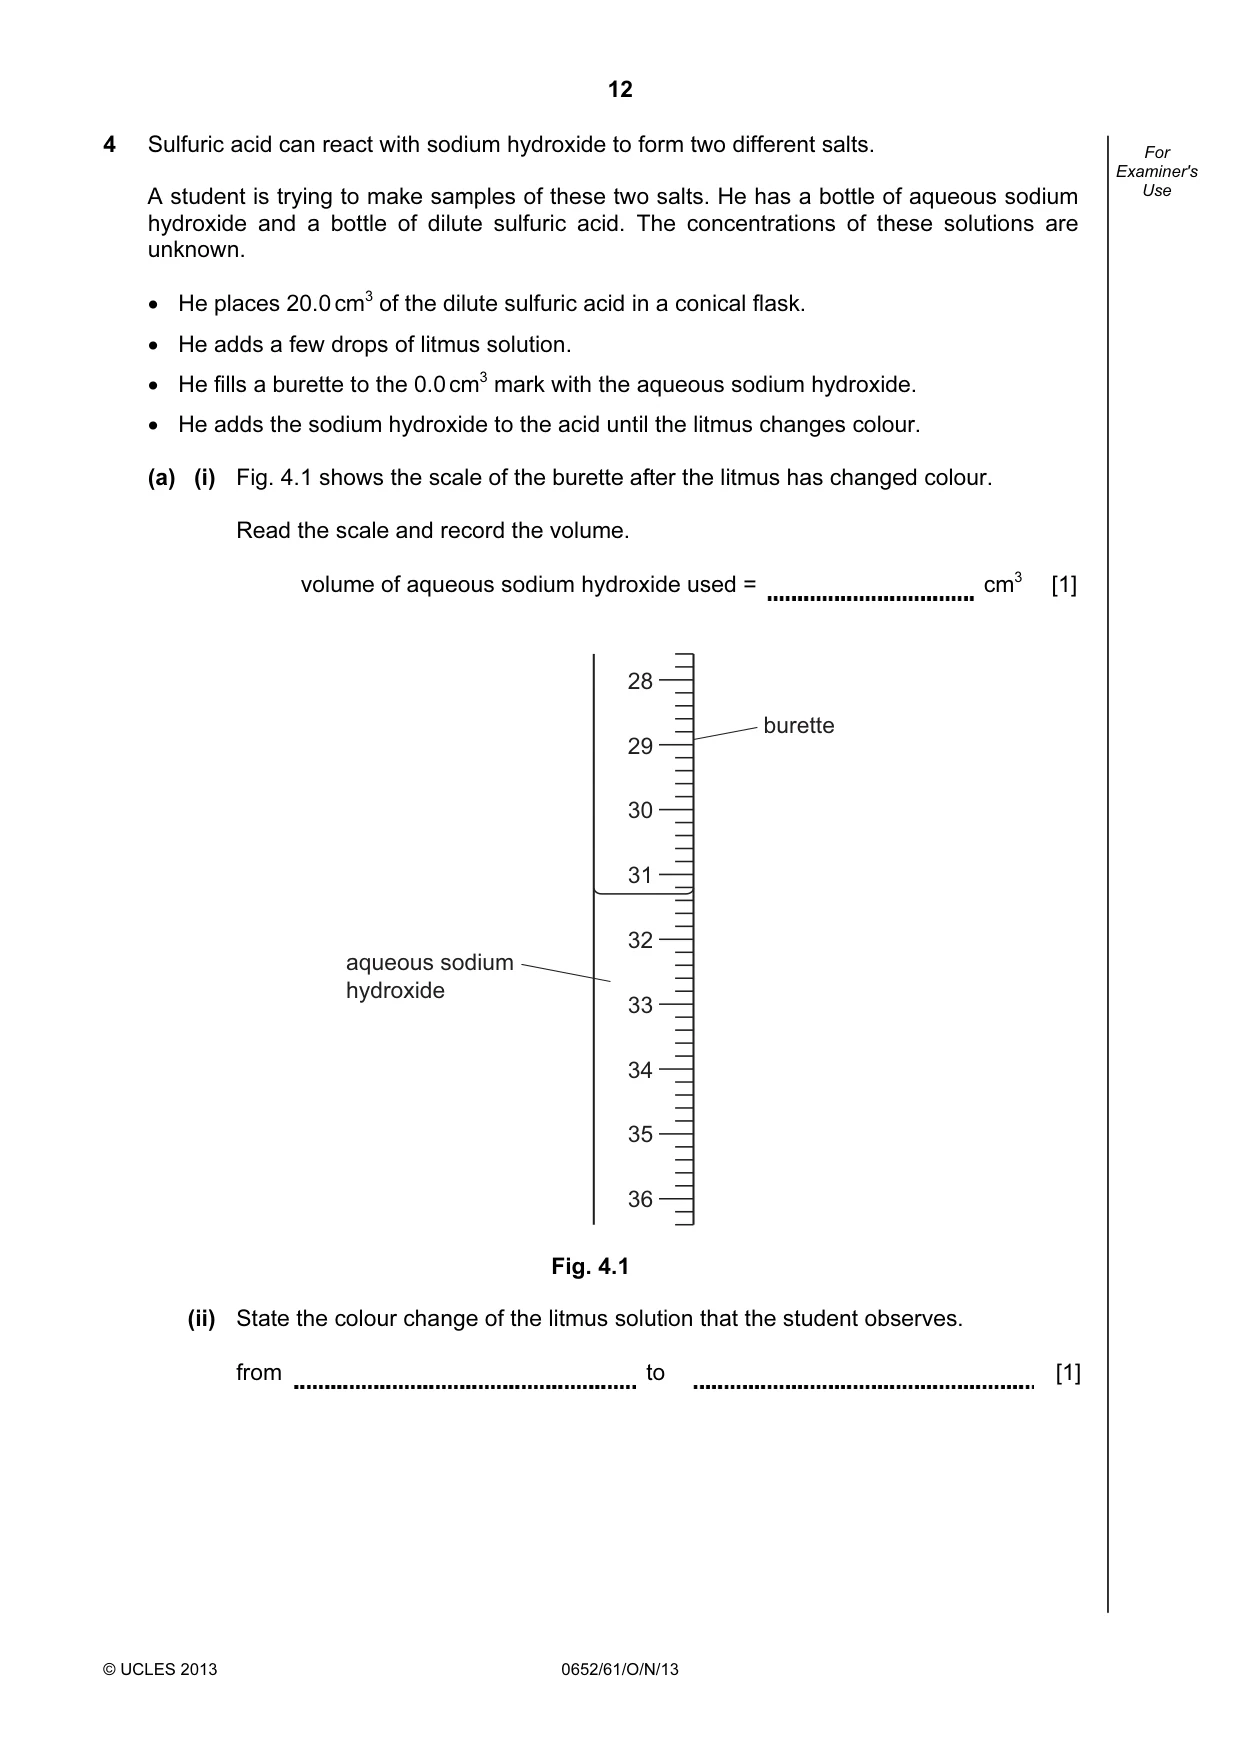
12 © UCLES 2013 0652/61/O/N/13 For Examiner's Use 4 Sulfuric acid can react with sodium hydroxide to form two different salts. A student is trying to make samples of these two salts. He has a bottle of aqueous sodium hydroxide and a bottle of dilute sulfuric acid. The concentrations of these solutions are unknown. • He places 20.0 cm3 of the dilute sulfuric acid in a conical flask. • He adds a few drops of litmus solution. • He fills a burette to the 0.0 cm3 mark with the aqueous sodium hydroxide. • He adds the sodium hydroxide to the acid until the litmus changes colour. (a) (i) Fig. 4.1 shows the scale of the burette after the litmus has changed colour. Read the scale and record the volume. volume of aqueous sodium hydroxide used = cm3 [1] 28 29 30 31 32 33 34 35 36 burette aqueous sodium hydroxide Fig. 4.1 (ii) State the colour change of the litmus solution that the student observes. from to [1]
Question paper, page 13
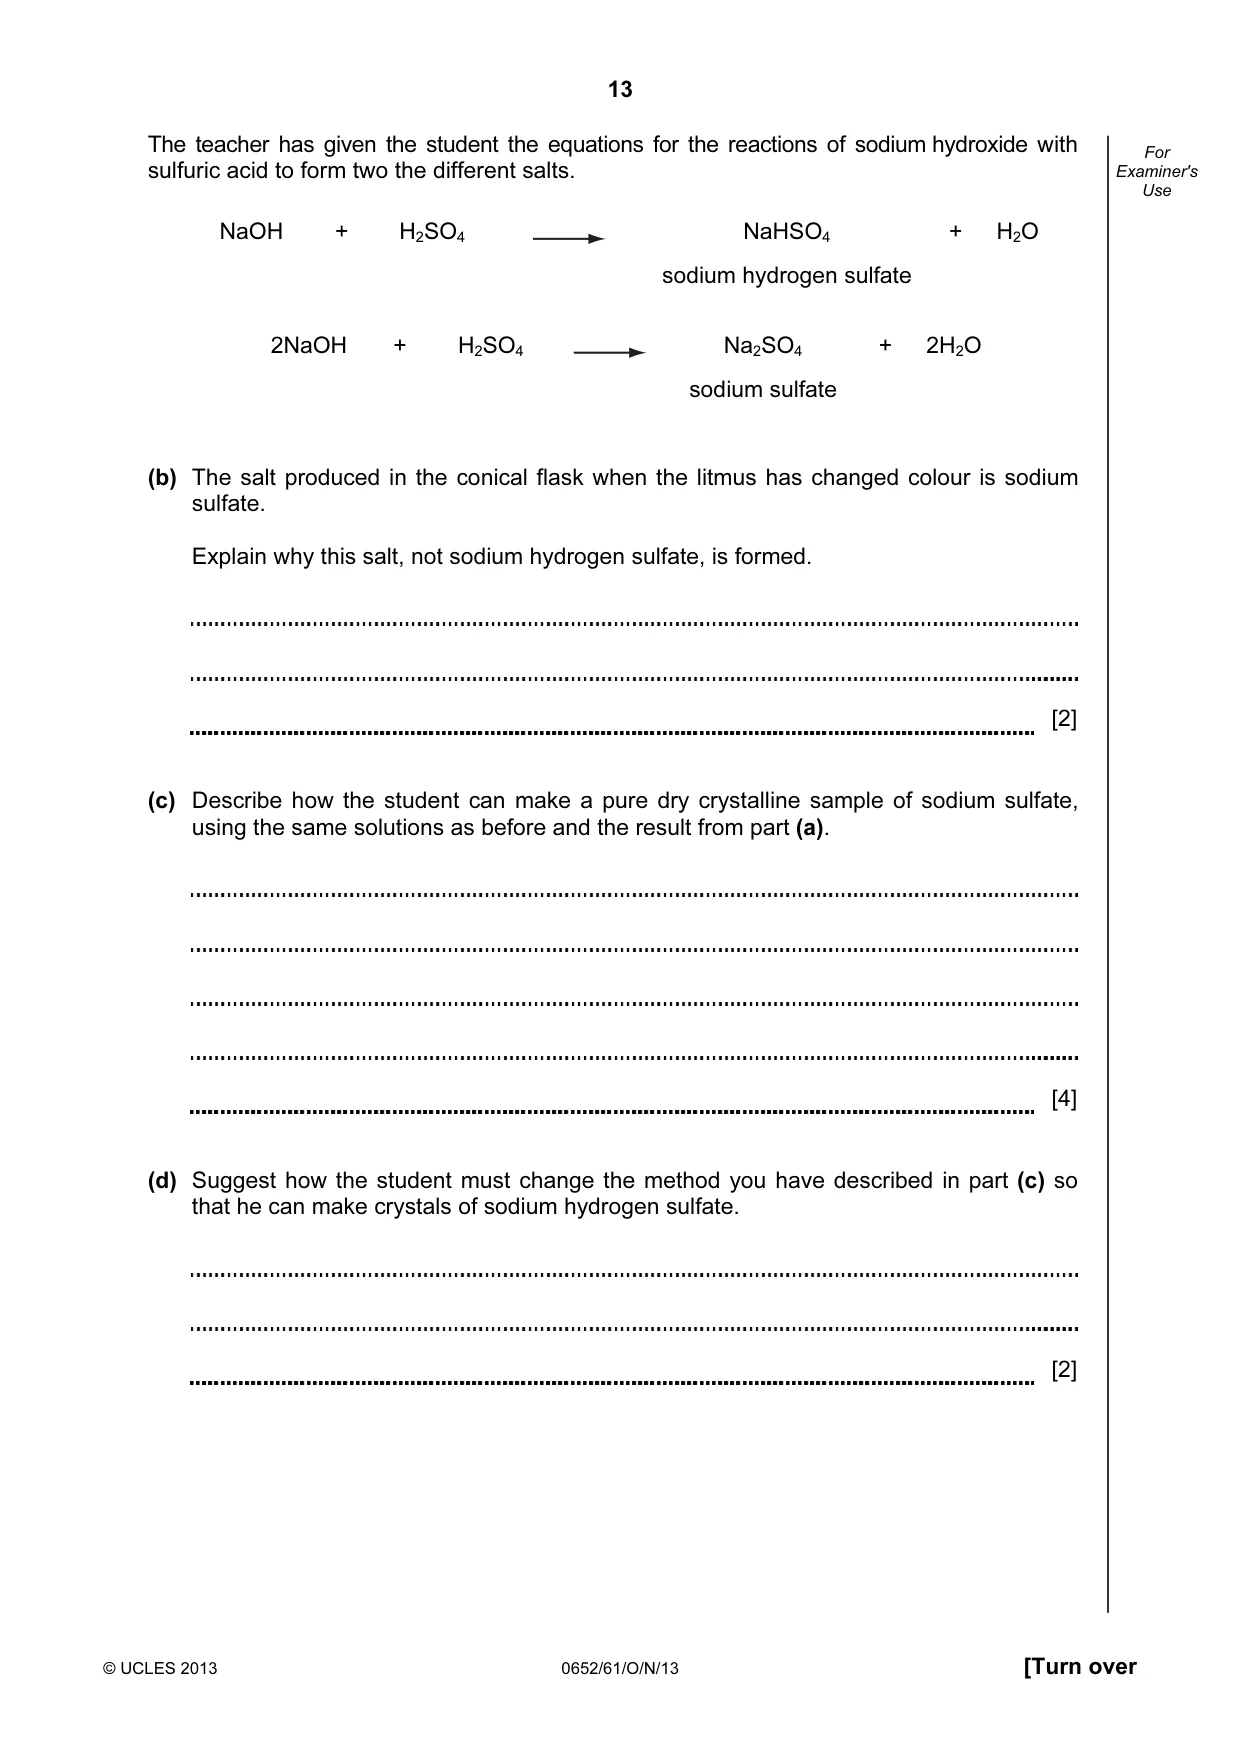
13 © UCLES 2013 0652/61/O/N/13 [Turn over For Examiner's Use The teacher has given the student the equations for the reactions of sodium hydroxide with sulfuric acid to form two the different salts. NaOH + H2SO4 NaHSO4 + H2O sodium hydrogen sulfate 2NaOH + H2SO4 Na2SO4 + 2H2O sodium sulfate (b) The salt produced in the conical flask when the litmus has changed colour is sodium sulfate. Explain why this salt, not sodium hydrogen sulfate, is formed. [2] (c) Describe how the student can make a pure dry crystalline sample of sodium sulfate, using the same solutions as before and the result from part (a). [4] (d) Suggest how the student must change the method you have described in part (c) so that he can make crystals of sodium hydrogen sulfate. [2]
Question paper, page 14
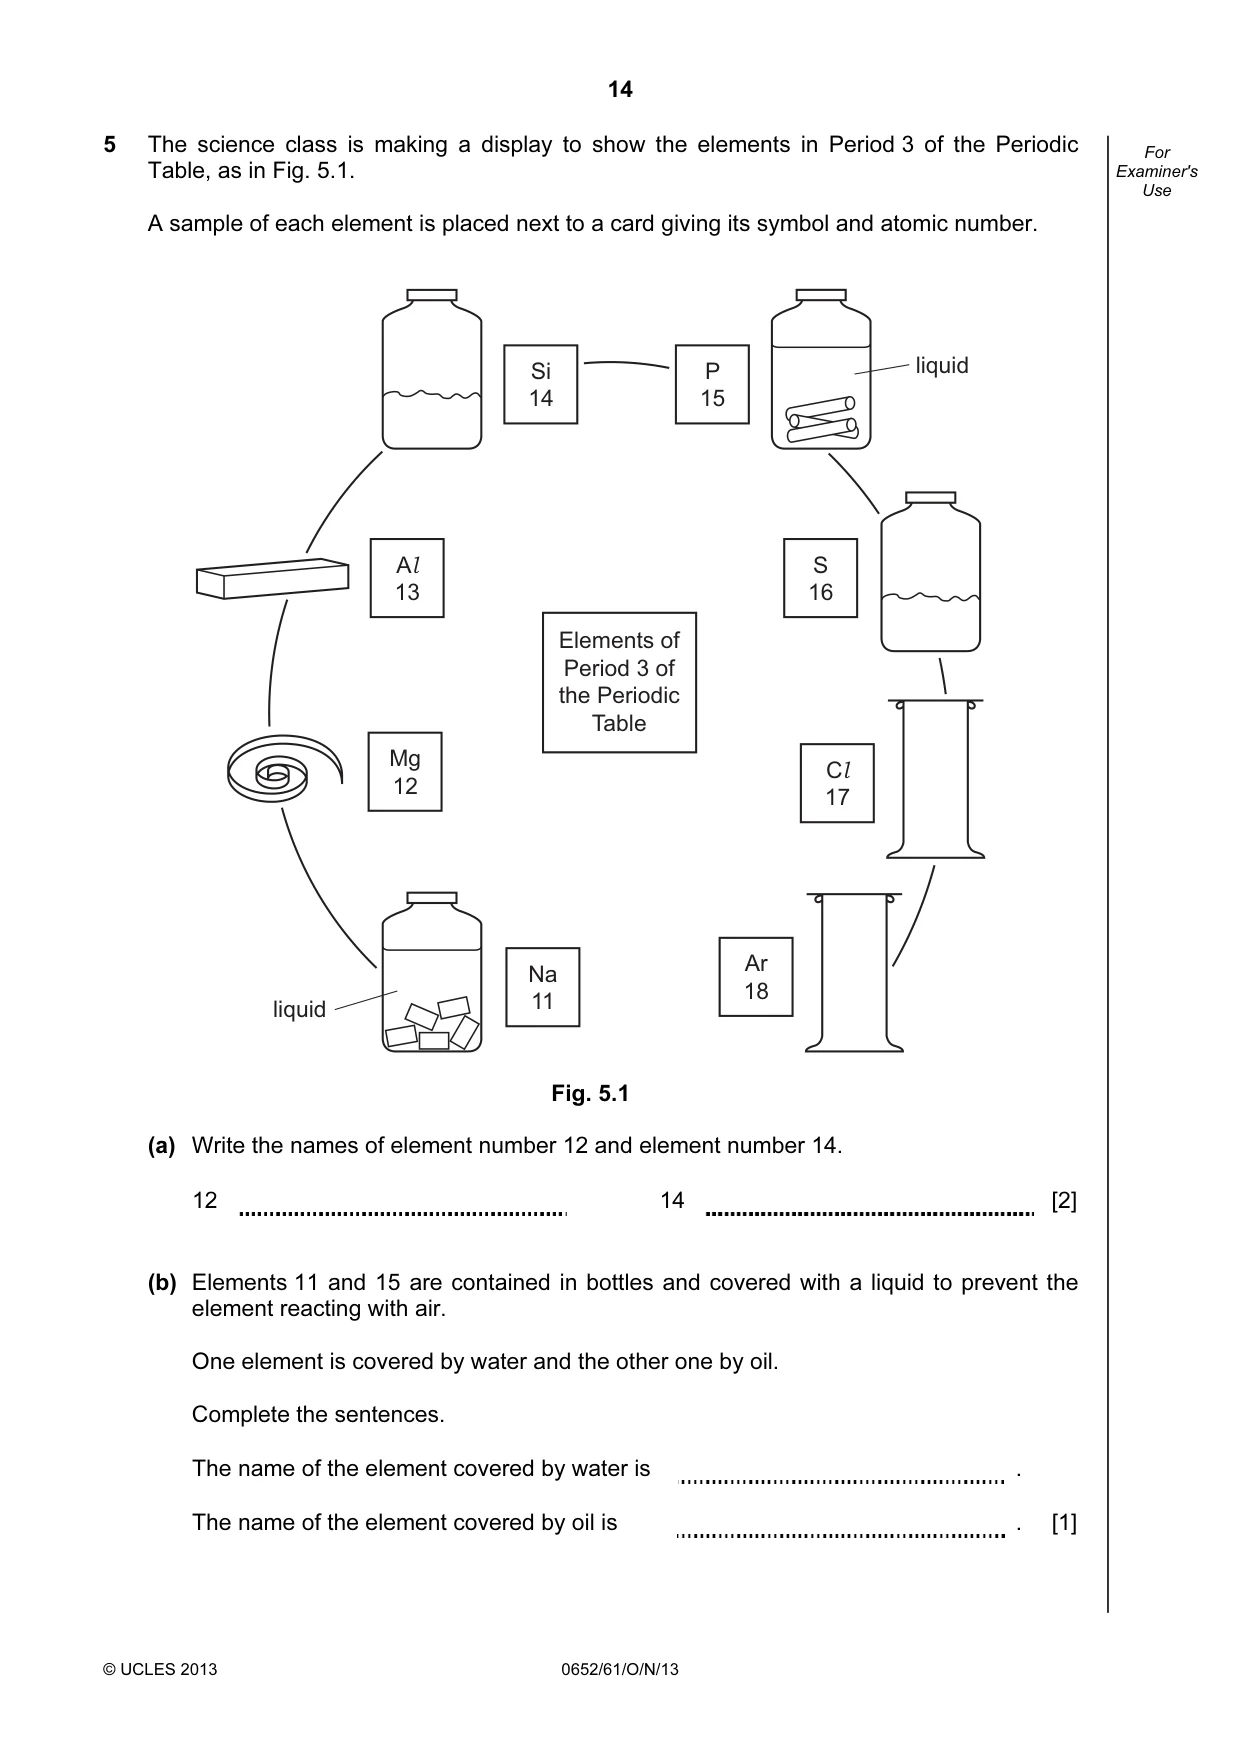
14 © UCLES 2013 0652/61/O/N/13 For Examiner's Use 5 The science class is making a display to show the elements in Period 3 of the Periodic Table, as in Fig. 5.1. A sample of each element is placed next to a card giving its symbol and atomic number. Ar 18 Cl 17 Mg 12 S 16 Al 13 P 15 Si 14 Na 11 liquid liquid Elements of Period 3 of the Periodic Table Fig. 5.1 (a) Write the names of element number 12 and element number 14. 12 14 [2] (b) Elements 11 and 15 are contained in bottles and covered with a liquid to prevent the element reacting with air. One element is covered by water and the other one by oil. Complete the sentences. The name of the element covered by water is . The name of the element covered by oil is . [1]
Question paper, page 15
15 © UCLES 2013 0652/61/O/N/13 [Turn over For Examiner's Use (c) The two gas-jars holding samples of elements 17 and 18 have lost their labels. How can a student tell from the appearance of the gases which gas-jar contains element number 17? [1] (d) Describe an experiment that a student can do to show that element number 13 is a metal. State the observation that the student will make. You may draw a diagram to help you. [2]
Question paper, page 16
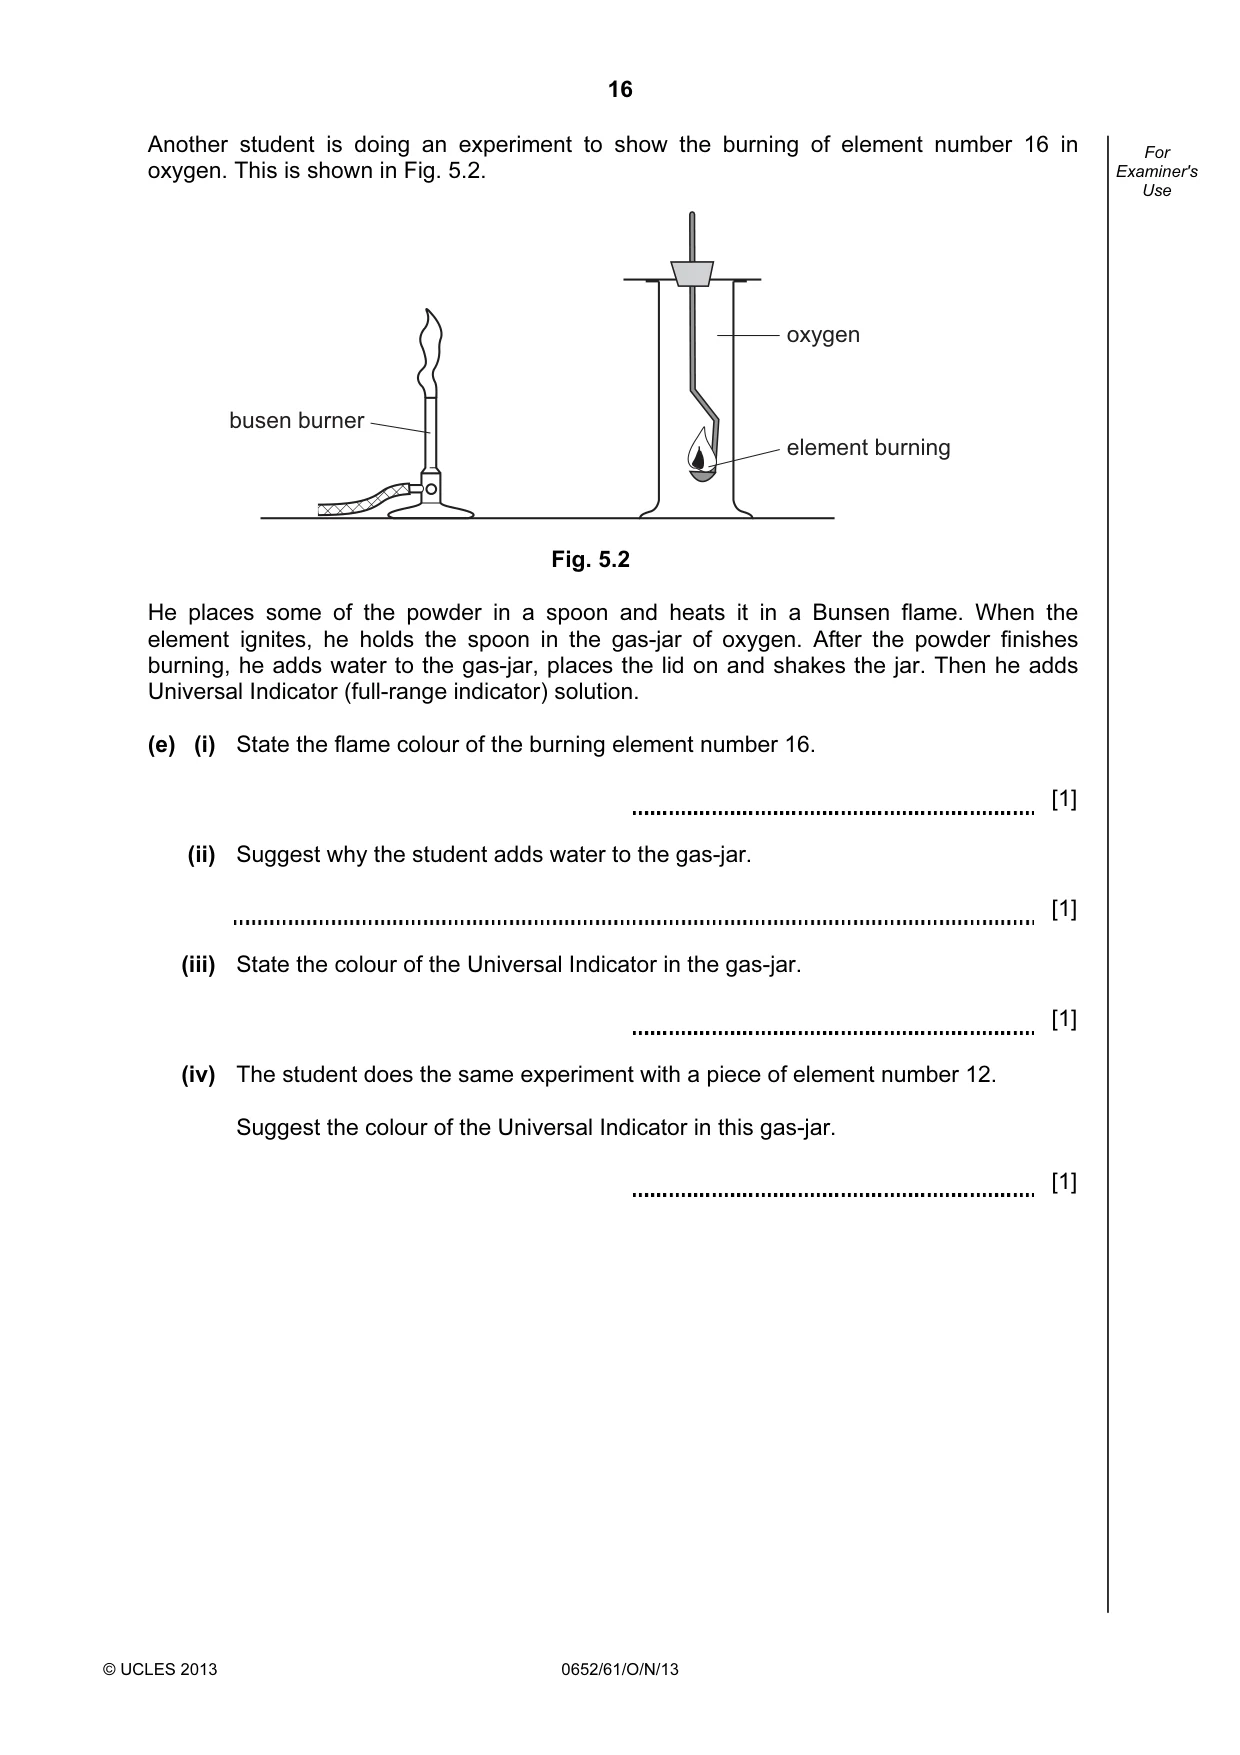
16 © UCLES 2013 0652/61/O/N/13 For Examiner's Use Another student is doing an experiment to show the burning of element number 16 in oxygen. This is shown in Fig. 5.2. busen burner element burning oxygen Fig. 5.2 He places some of the powder in a spoon and heats it in a Bunsen flame. When the element ignites, he holds the spoon in the gas-jar of oxygen. After the powder finishes burning, he adds water to the gas-jar, places the lid on and shakes the jar. Then he adds Universal Indicator (full-range indicator) solution. (e) (i) State the flame colour of the burning element number 16. [1] (ii) Suggest why the student adds water to the gas-jar. [1] (iii) State the colour of the Universal Indicator in the gas-jar. [1] (iv) The student does the same experiment with a piece of element number 12. Suggest the colour of the Universal Indicator in this gas-jar. [1]
Question paper, page 17
17 © UCLES 2013 0652/61/O/N/13 [Turn over Please turn over for Question 6.
Question paper, page 18
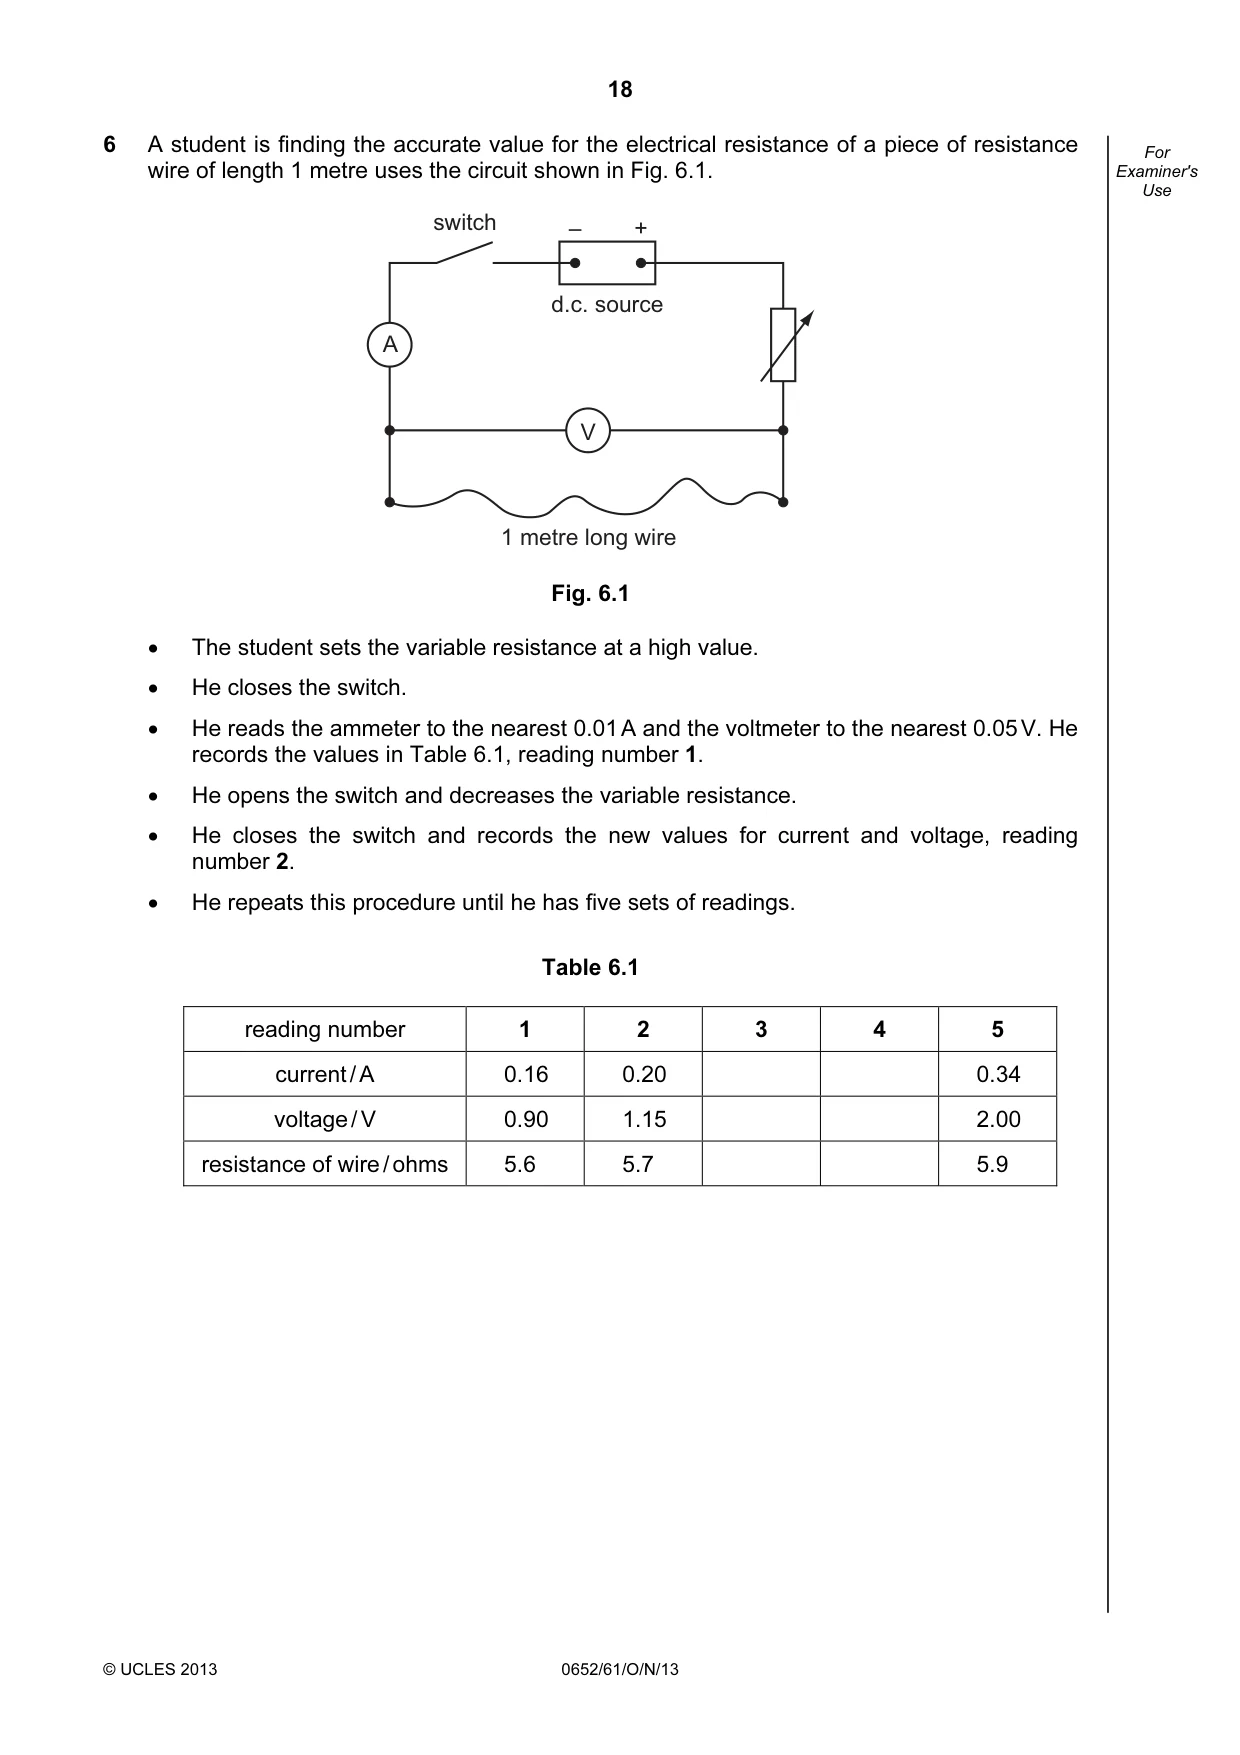
18 © UCLES 2013 0652/61/O/N/13 For Examiner's Use 6 A student is finding the accurate value for the electrical resistance of a piece of resistance wire of length 1 metre uses the circuit shown in Fig. 6.1. d.c. source – + V A 1 metre long wire switch Fig. 6.1 • The student sets the variable resistance at a high value. • He closes the switch. • He reads the ammeter to the nearest 0.01 A and the voltmeter to the nearest 0.05 V. He records the values in Table 6.1, reading number 1. • He opens the switch and decreases the variable resistance. • He closes the switch and records the new values for current and voltage, reading number 2. • He repeats this procedure until he has five sets of readings. Table 6.1 reading number 1 2 3 4 5 current / A 0.16 0.20 0.34 voltage / V 0.90 1.15 2.00 resistance of wire / ohms 5.6 5.7 5.9
Question paper, page 19
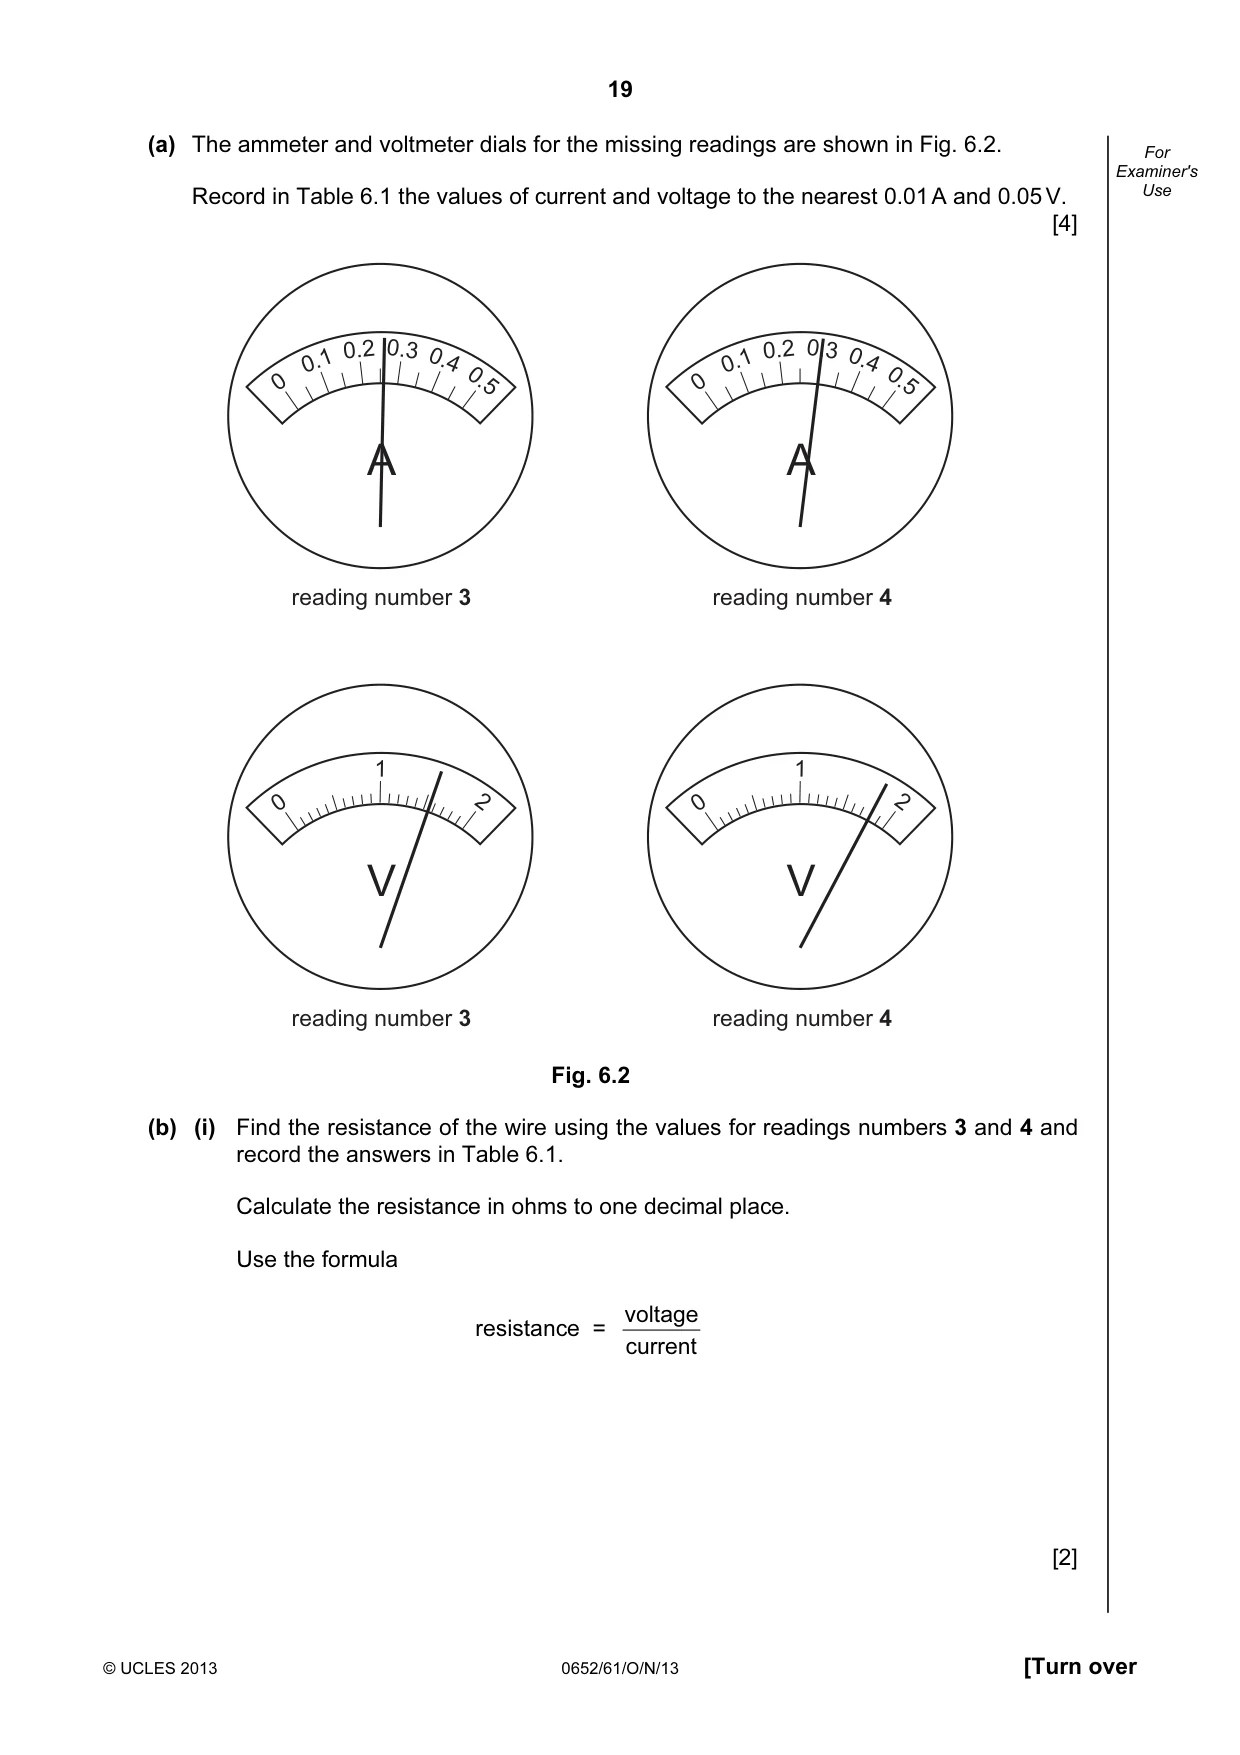
19 © UCLES 2013 0652/61/O/N/13 [Turn over For Examiner's Use (a) The ammeter and voltmeter dials for the missing readings are shown in Fig. 6.2. Record in Table 6.1 the values of current and voltage to the nearest 0.01 A and 0.05 V. [4] A 0 0.1 0.2 0.3 0.4 0.5 A 0 0.1 0.2 0.3 0.4 0.5 V 0 1 2 V 0 1 2 reading number 3 reading number 4 reading number 3 reading number 4 Fig. 6.2 (b) (i) Find the resistance of the wire using the values for readings numbers 3 and 4 and record the answers in Table 6.1. Calculate the resistance in ohms to one decimal place. Use the formula resistance = current voltage [2]
Question paper, page 20
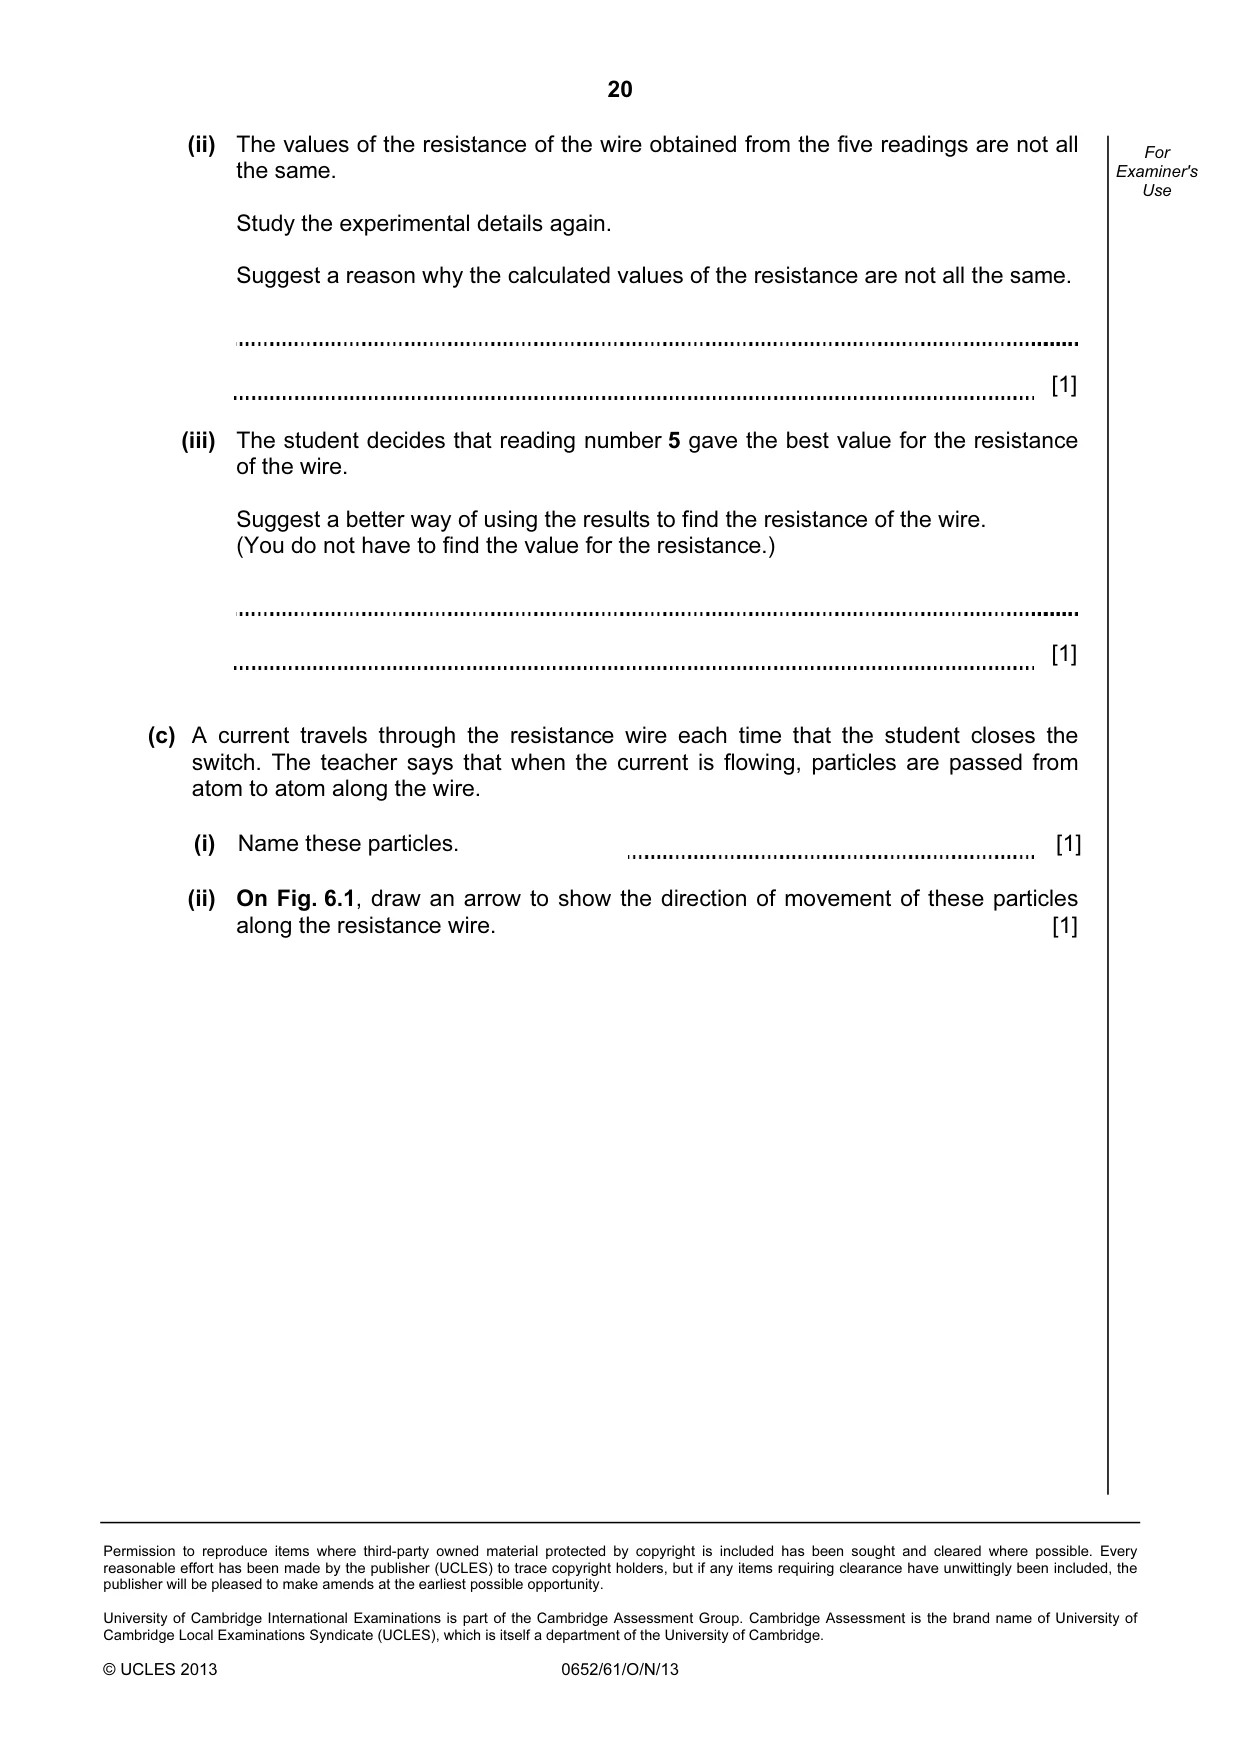
20 Permission to reproduce items where third-party owned material protected by copyright is included has been sought and cleared where possible. Every reasonable effort has been made by the publisher (UCLES) to trace copyright holders, but if any items requiring clearance have unwittingly been included, the publisher will be pleased to make amends at the earliest possible opportunity. University of Cambridge International Examinations is part of the Cambridge Assessment Group. Cambridge Assessment is the brand name of University of Cambridge Local Examinations Syndicate (UCLES), which is itself a department of the University of Cambridge. © UCLES 2013 0652/61/O/N/13 For Examiner's Use (ii) The values of the resistance of the wire obtained from the five readings are not all the same. Study the experimental details again. Suggest a reason why the calculated values of the resistance are not all the same. [1] (iii) The student decides that reading number 5 gave the best value for the resistance of the wire. Suggest a better way of using the results to find the resistance of the wire. (You do not have to find the value for the resistance.) [1] (c) A current travels through the resistance wire each time that the student closes the switch. The teacher says that when the current is flowing, particles are passed from atom to atom along the wire. (i) Name these particles. [1] (ii) On Fig. 6.1, draw an arrow to show the direction of movement of these particles along the resistance wire. [1]
Mark scheme, page 1
CAMBRIDGE INTERNATIONAL EXAMINATIONS International General Certificate of Secondary Education MARK SCHEME for the October/November 2013 series 0652 PHYSICAL SCIENCE 0652/61 Paper 6 (Alternative to Practical), maximum raw mark 60 This mark scheme is published as an aid to teachers and candidates, to indicate the requirements of the examination. It shows the basis on which Examiners were instructed to award marks. It does not indicate the details of the discussions that took place at an Examiners’ meeting before marking began, which would have considered the acceptability of alternative answers. Mark schemes should be read in conjunction with the question paper and the Principal Examiner Report for Teachers. Cambridge will not enter into discussions about these mark schemes. Cambridge is publishing the mark schemes for the October/November 2013 series for most IGCSE, GCE Advanced Level and Advanced Subsidiary Level components and some Ordinary Level components.
Mark scheme, page 2
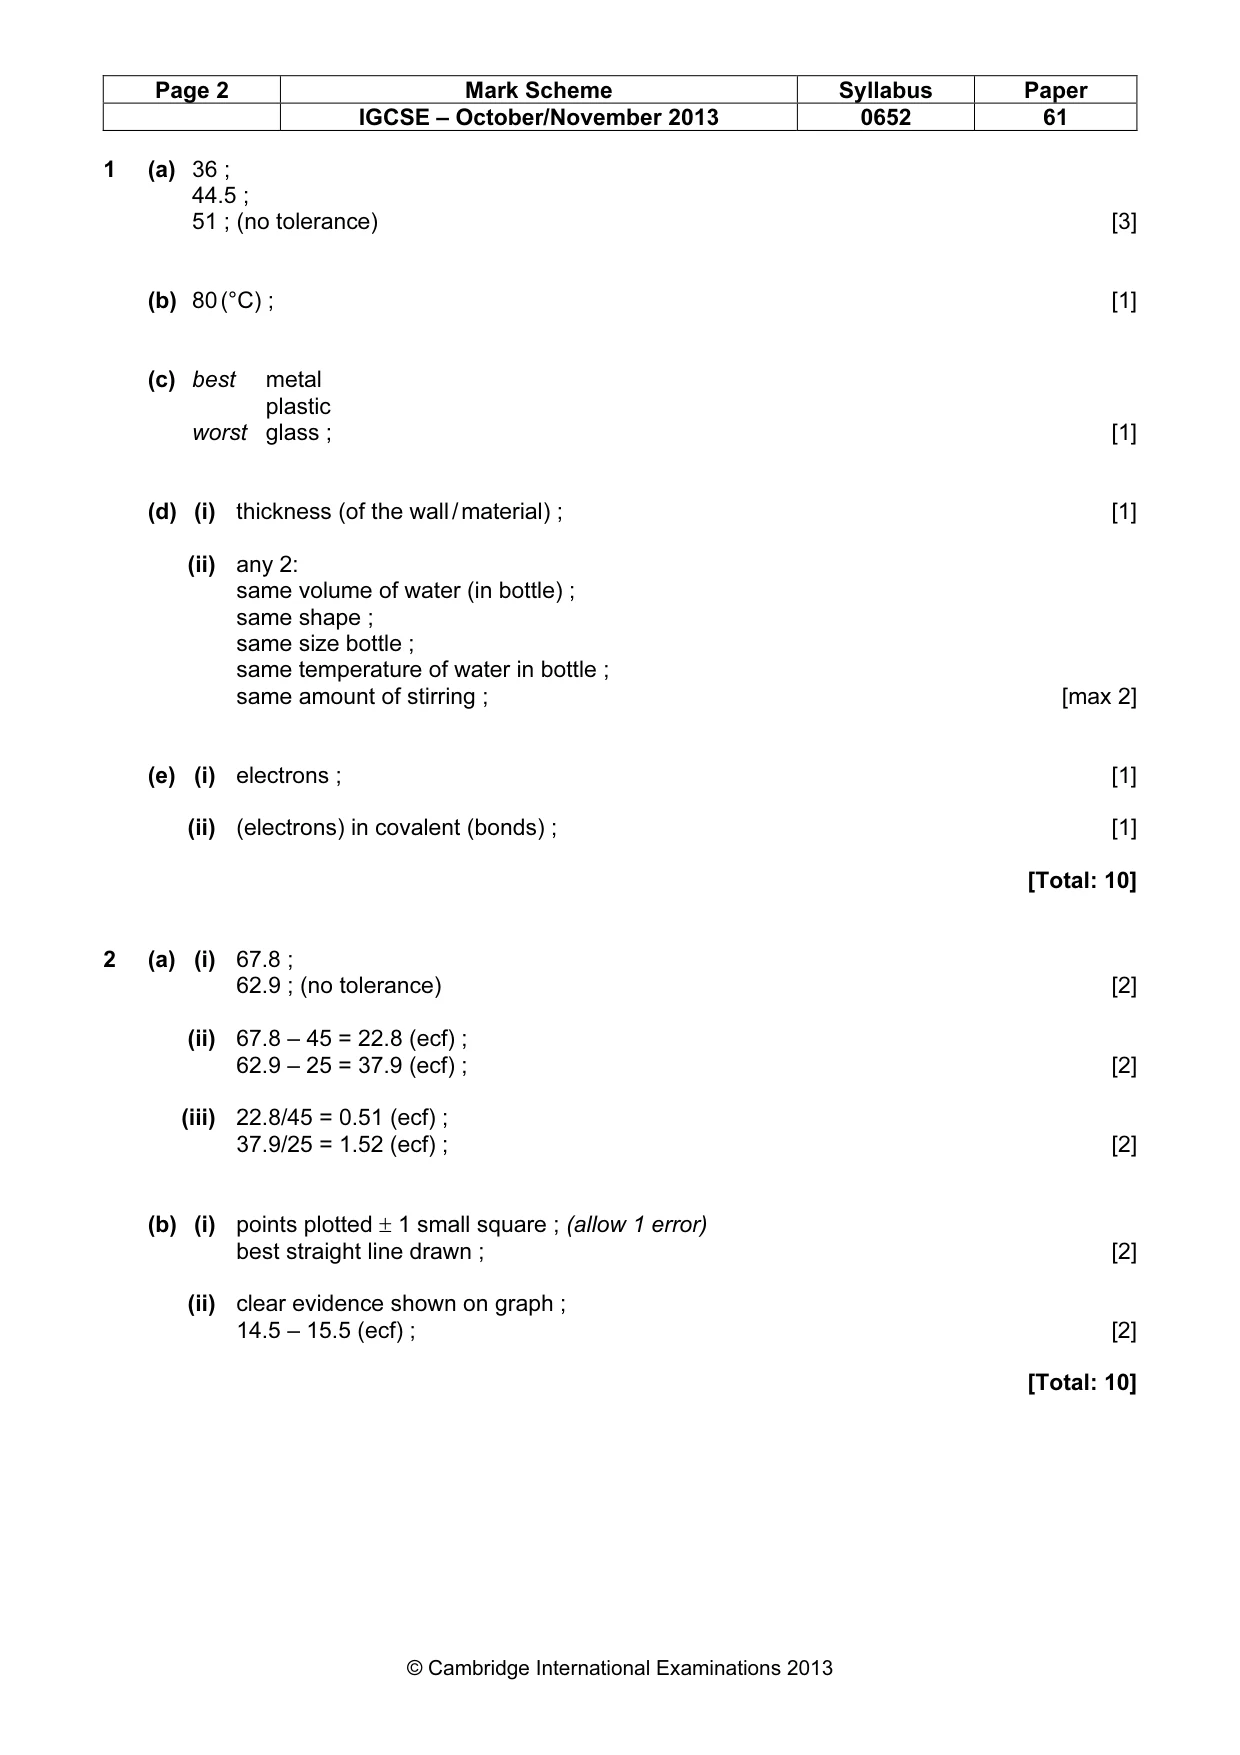
Page 2 Mark Scheme Syllabus Paper IGCSE – October/November 2013 0652 61 © Cambridge International Examinations 2013 1 (a) 36 ; 44.5 ; 51 ; (no tolerance) [3] (b) 80 (°C) ; [1] (c) best metal plastic worst glass ; [1] (d) (i) thickness (of the wall / material) ; [1] (ii) any 2: same volume of water (in bottle) ; same shape ; same size bottle ; same temperature of water in bottle ; same amount of stirring ; [max 2] (e) (i) electrons ; [1] (ii) (electrons) in covalent (bonds) ; [1] [Total: 10] 2 (a) (i) 67.8 ; 62.9 ; (no tolerance) [2] (ii) 67.8 – 45 = 22.8 (ecf) ; 62.9 – 25 = 37.9 (ecf) ; [2] (iii) 22.8/45 = 0.51 (ecf) ; 37.9/25 = 1.52 (ecf) ; [2] (b) (i) points plotted ± 1 small square ; (allow 1 error) best straight line drawn ; [2] (ii) clear evidence shown on graph ; 14.5 – 15.5 (ecf) ; [2] [Total: 10]
Mark scheme, page 3
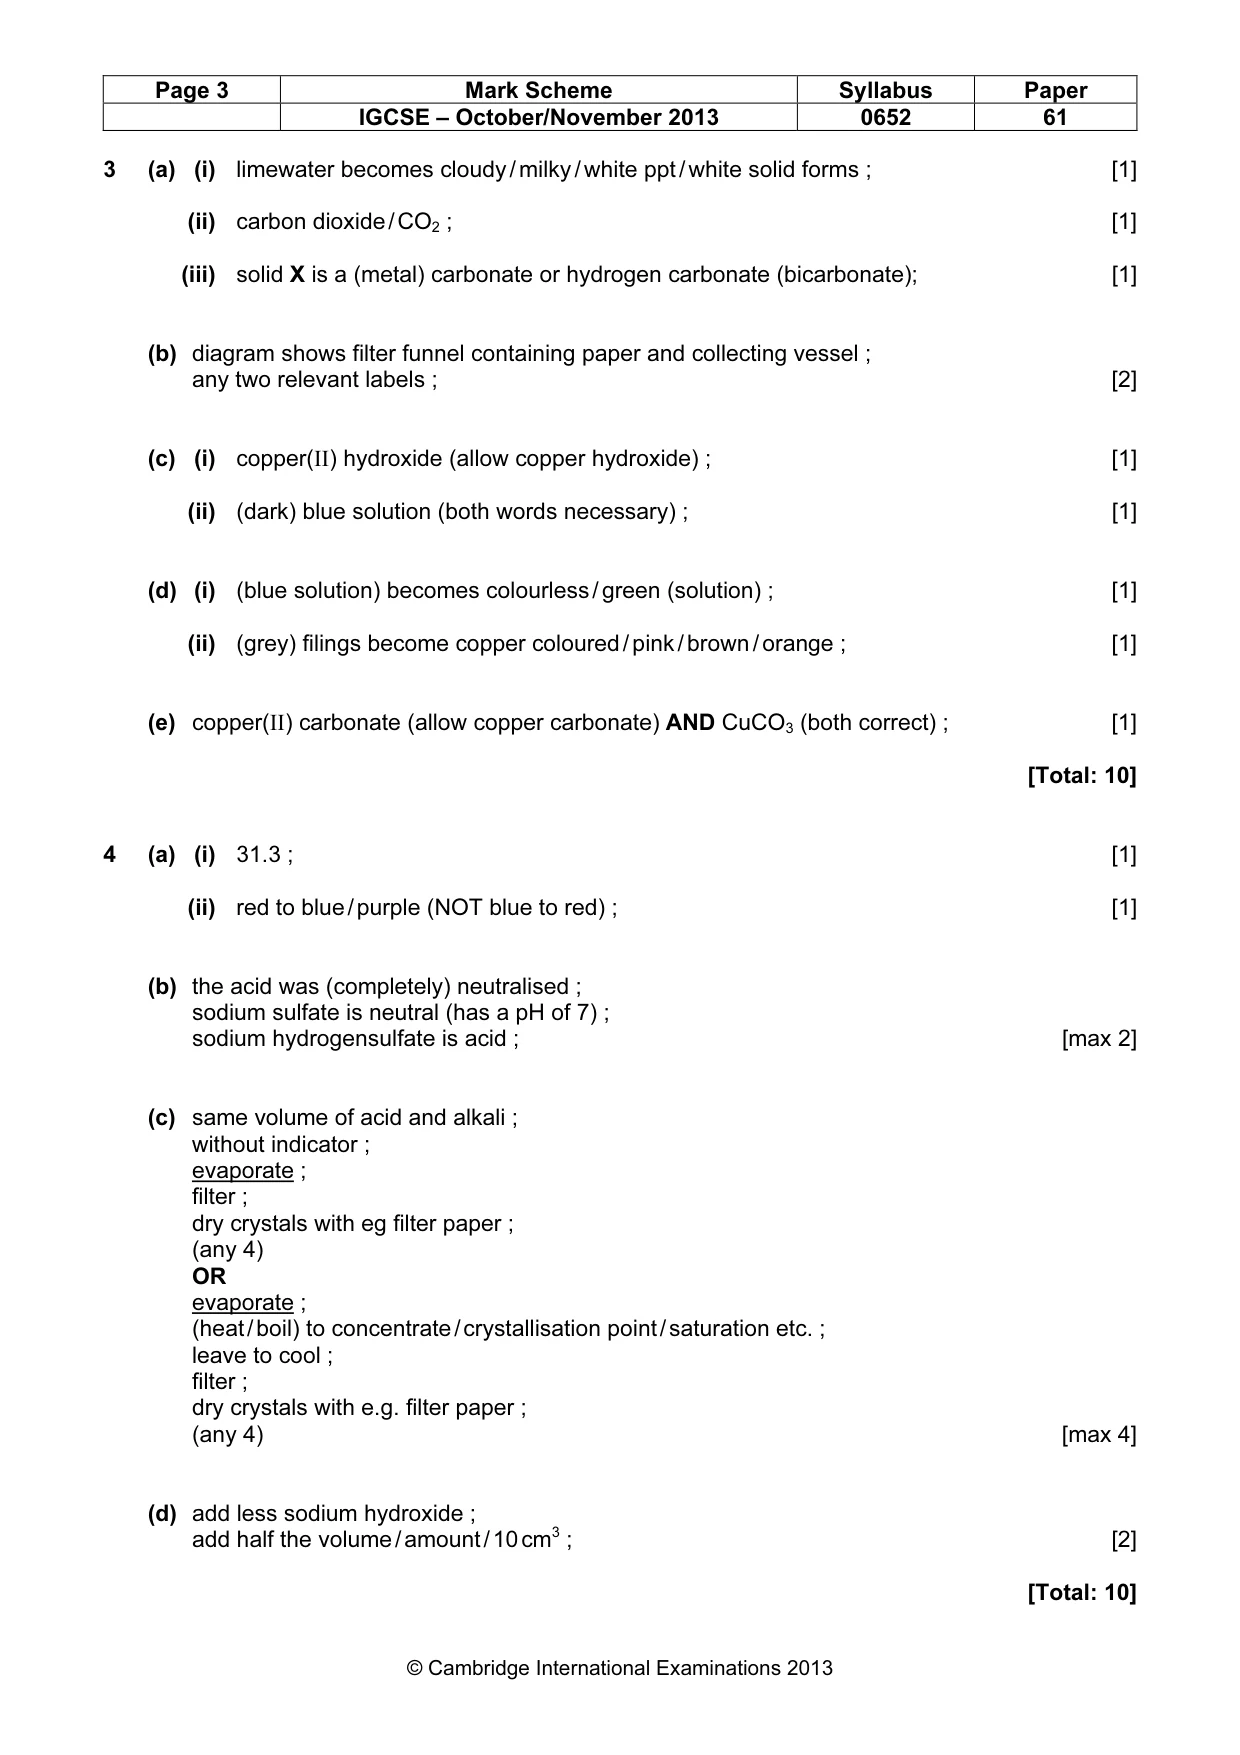
Page 3 Mark Scheme Syllabus Paper IGCSE – October/November 2013 0652 61 © Cambridge International Examinations 2013 3 (a) (i) limewater becomes cloudy / milky / white ppt / white solid forms ; [1] (ii) carbon dioxide / CO2 ; [1] (iii) solid X is a (metal) carbonate or hydrogen carbonate (bicarbonate); [1] (b) diagram shows filter funnel containing paper and collecting vessel ; any two relevant labels ; [2] (c) (i) copper(II) hydroxide (allow copper hydroxide) ; [1] (ii) (dark) blue solution (both words necessary) ; [1] (d) (i) (blue solution) becomes colourless / green (solution) ; [1] (ii) (grey) filings become copper coloured / pink / brown / orange ; [1] (e) copper(II) carbonate (allow copper carbonate) AND CuCO3 (both correct) ; [1] [Total: 10] 4 (a) (i) 31.3 ; [1] (ii) red to blue / purple (NOT blue to red) ; [1] (b) the acid was (completely) neutralised ; sodium sulfate is neutral (has a pH of 7) ; sodium hydrogensulfate is acid ; [max 2] (c) same volume of acid and alkali ; without indicator ; evaporate ; filter ; dry crystals with eg filter paper ; (any 4) OR evaporate ; (heat / boil) to concentrate / crystallisation point / saturation etc. ; leave to cool ; filter ; dry crystals with e.g. filter paper ; (any 4) [max 4] (d) add less sodium hydroxide ; add half the volume / amount / 10 cm3 ; [2] [Total: 10]
Mark scheme, page 4
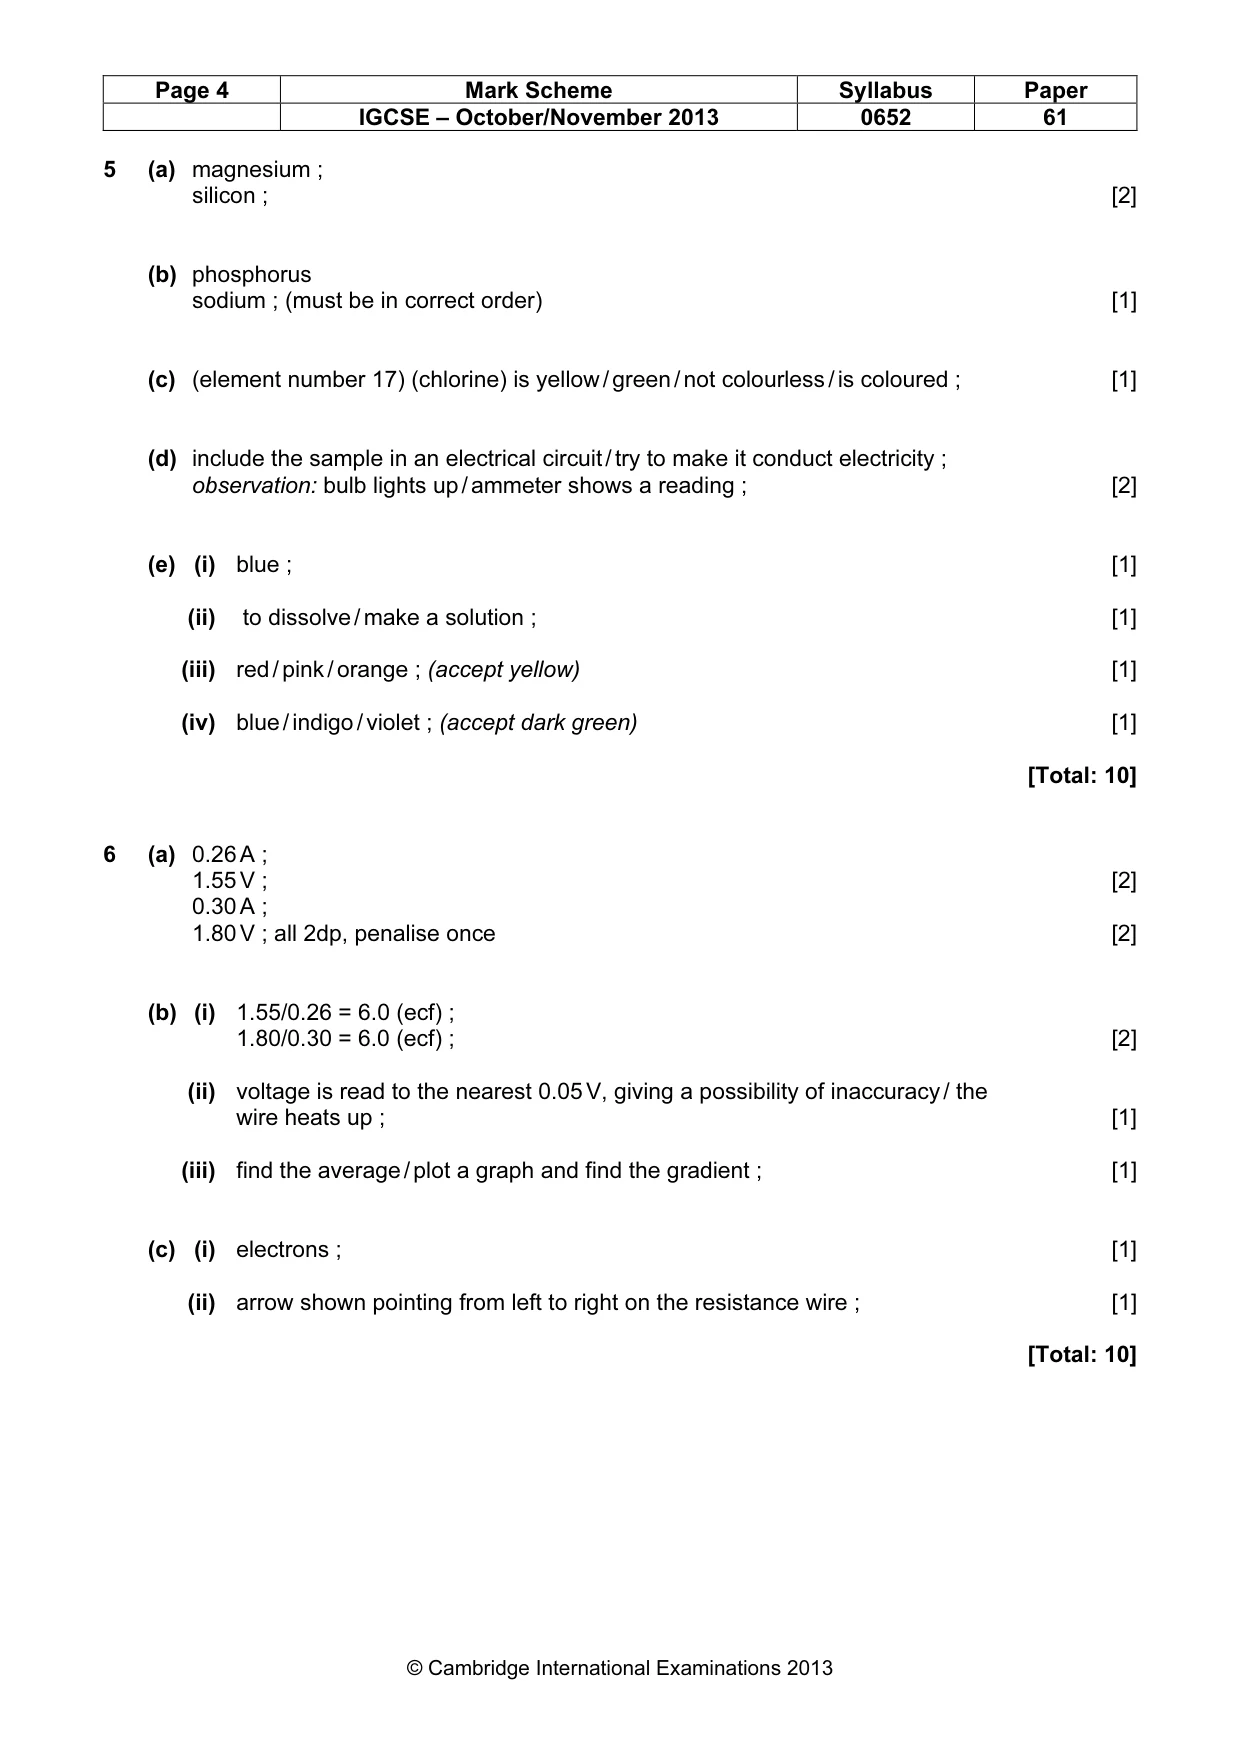
Page 4 Mark Scheme Syllabus Paper IGCSE – October/November 2013 0652 61 © Cambridge International Examinations 2013 5 (a) magnesium ; silicon ; [2] (b) phosphorus sodium ; (must be in correct order) [1] (c) (element number 17) (chlorine) is yellow / green / not colourless / is coloured ; [1] (d) include the sample in an electrical circuit / try to make it conduct electricity ; observation: bulb lights up / ammeter shows a reading ; [2] (e) (i) blue ; [1] (ii) to dissolve / make a solution ; [1] (iii) red / pink / orange ; (accept yellow) [1] (iv) blue / indigo / violet ; (accept dark green) [1] [Total: 10] 6 (a) 0.26 A ; 1.55 V ; [2] 0.30 A ; 1.80 V ; all 2dp, penalise once [2] (b) (i) 1.55/0.26 = 6.0 (ecf) ; 1.80/0.30 = 6.0 (ecf) ; [2] (ii) voltage is read to the nearest 0.05 V, giving a possibility of inaccuracy / the wire heats up ; [1] (iii) find the average / plot a graph and find the gradient ; [1] (c) (i) electrons ; [1] (ii) arrow shown pointing from left to right on the resistance wire ; [1] [Total: 10]