Cambridge IGCSE Physical Science 0652 — 2011 Oct/Nov Paper 6 · Variant 1
0652/61/O/N/11 · 60 marks · ≈68 min
The question paper and its mark scheme, free to read here and free to download. This is Cambridge’s own paper, exactly as it was sat.
Question paper24 pages



Mark scheme4 pages
Answers below. Sit the paper first if you are practising.
Paper as text
Question paper, page 1
This document consists of 20 printed pages and 4 blank pages. IB11 11_0652_61/7RP © UCLES 2011 [Turn over *0527990204* For Examiner's Use 1 2 3 4 5 6 Total UNIVERSITY OF CAMBRIDGE INTERNATIONAL EXAMINATIONS International General Certificate of Secondary Education PHYSICAL SCIENCE 0652/61 Paper 6 Alternative to Practical October/November 2011 1 hour Candidates answer on the Question Paper. No Additional Materials are required. READ THESE INSTRUCTIONS FIRST Write your Centre number, candidate number and name on all the work you hand in. Write in dark blue or black pen. You may use a soft pencil for any diagrams or graphs. Do not use staples, paper clips, highlighters, glue or correction fluid. DO NOT WRITE IN ANY BARCODES. Answer all questions. At the end of the examination, fasten all your work securely together. The number of marks is given in brackets [ ] at the end of each question or part question.
Question paper, page 2
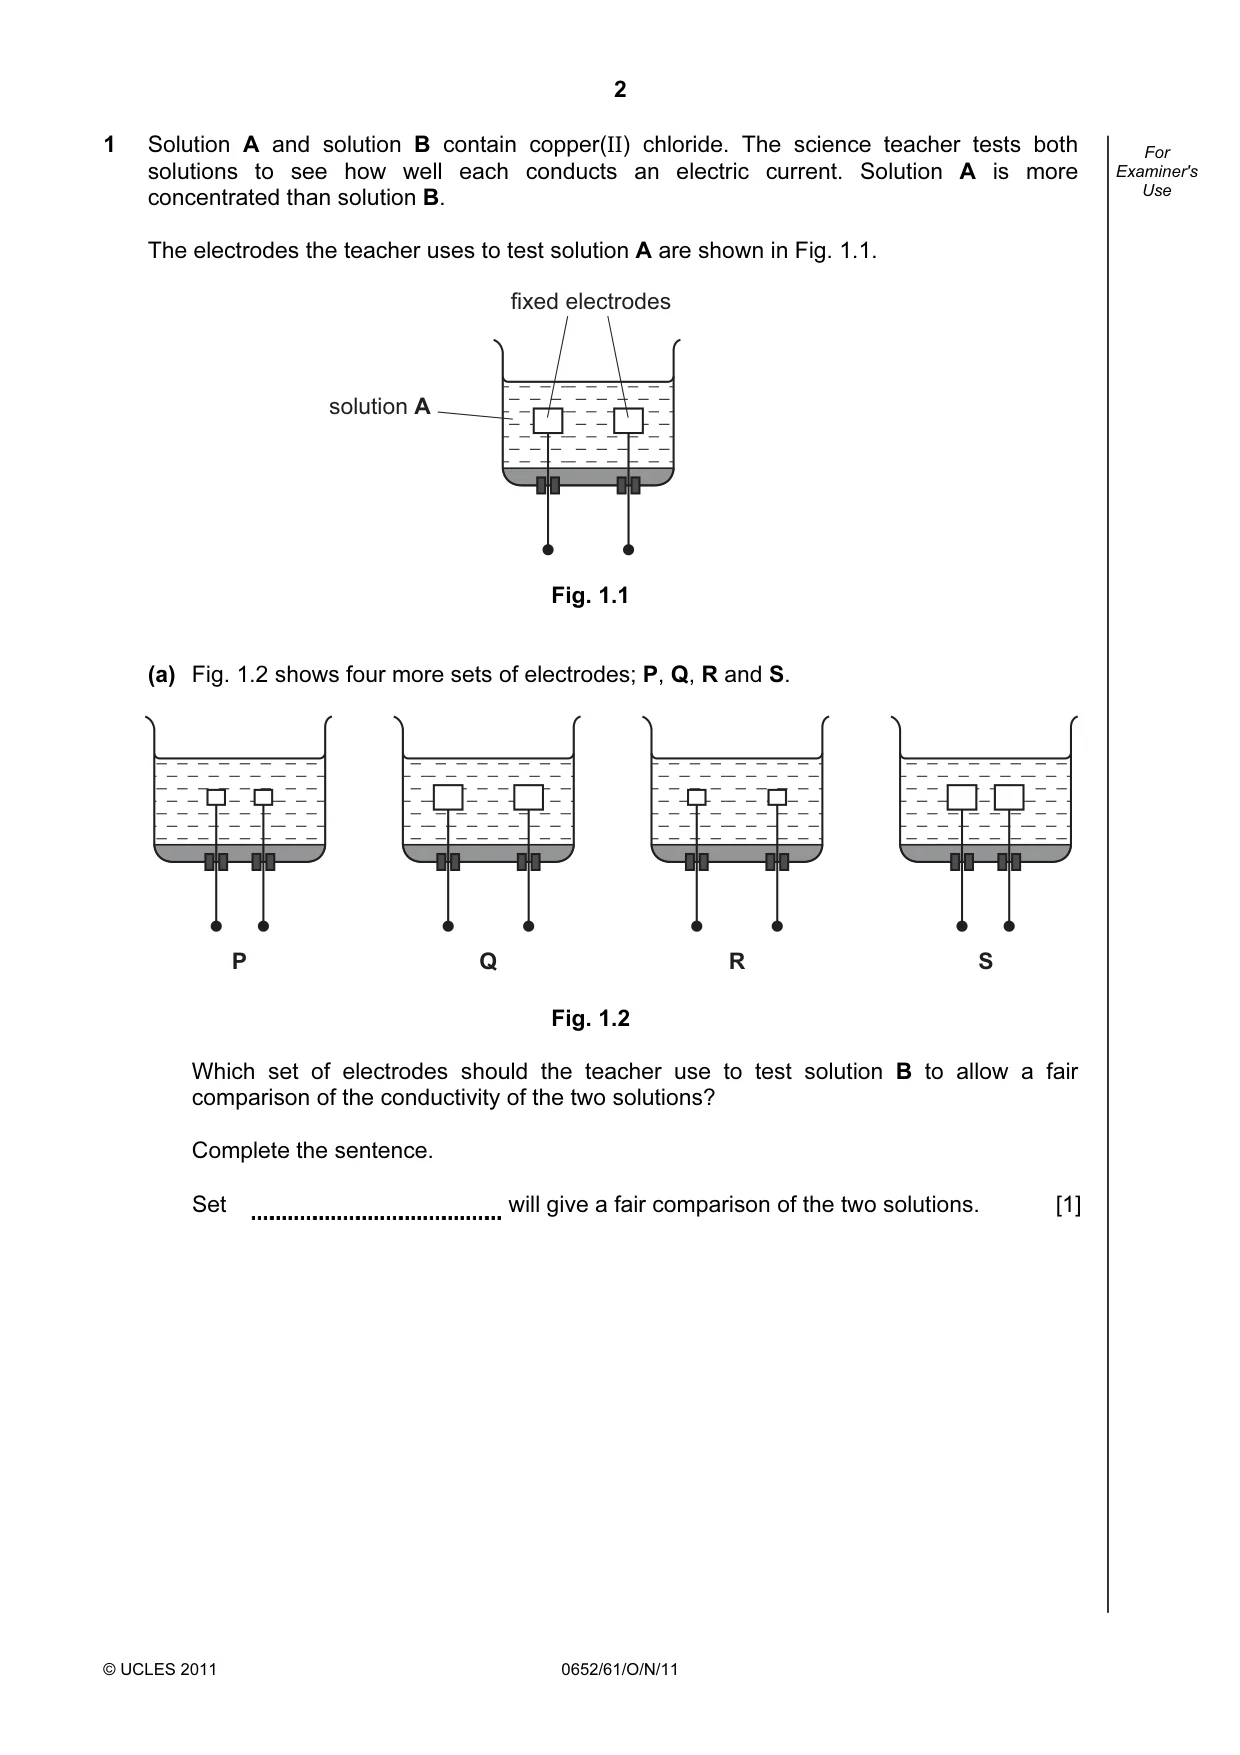
2 © UCLES 2011 0652/61/O/N/11 For Examiner's Use 1 Solution A and solution B contain copper(II) chloride. The science teacher tests both solutions to see how well each conducts an electric current. Solution A is more concentrated than solution B. The electrodes the teacher uses to test solution A are shown in Fig. 1.1. solution A fixed electrodes Fig. 1.1 (a) Fig. 1.2 shows four more sets of electrodes; P, Q, R and S. P S R Q Fig. 1.2 Which set of electrodes should the teacher use to test solution B to allow a fair comparison of the conductivity of the two solutions? Complete the sentence. Set will give a fair comparison of the two solutions. [1]
Question paper, page 3
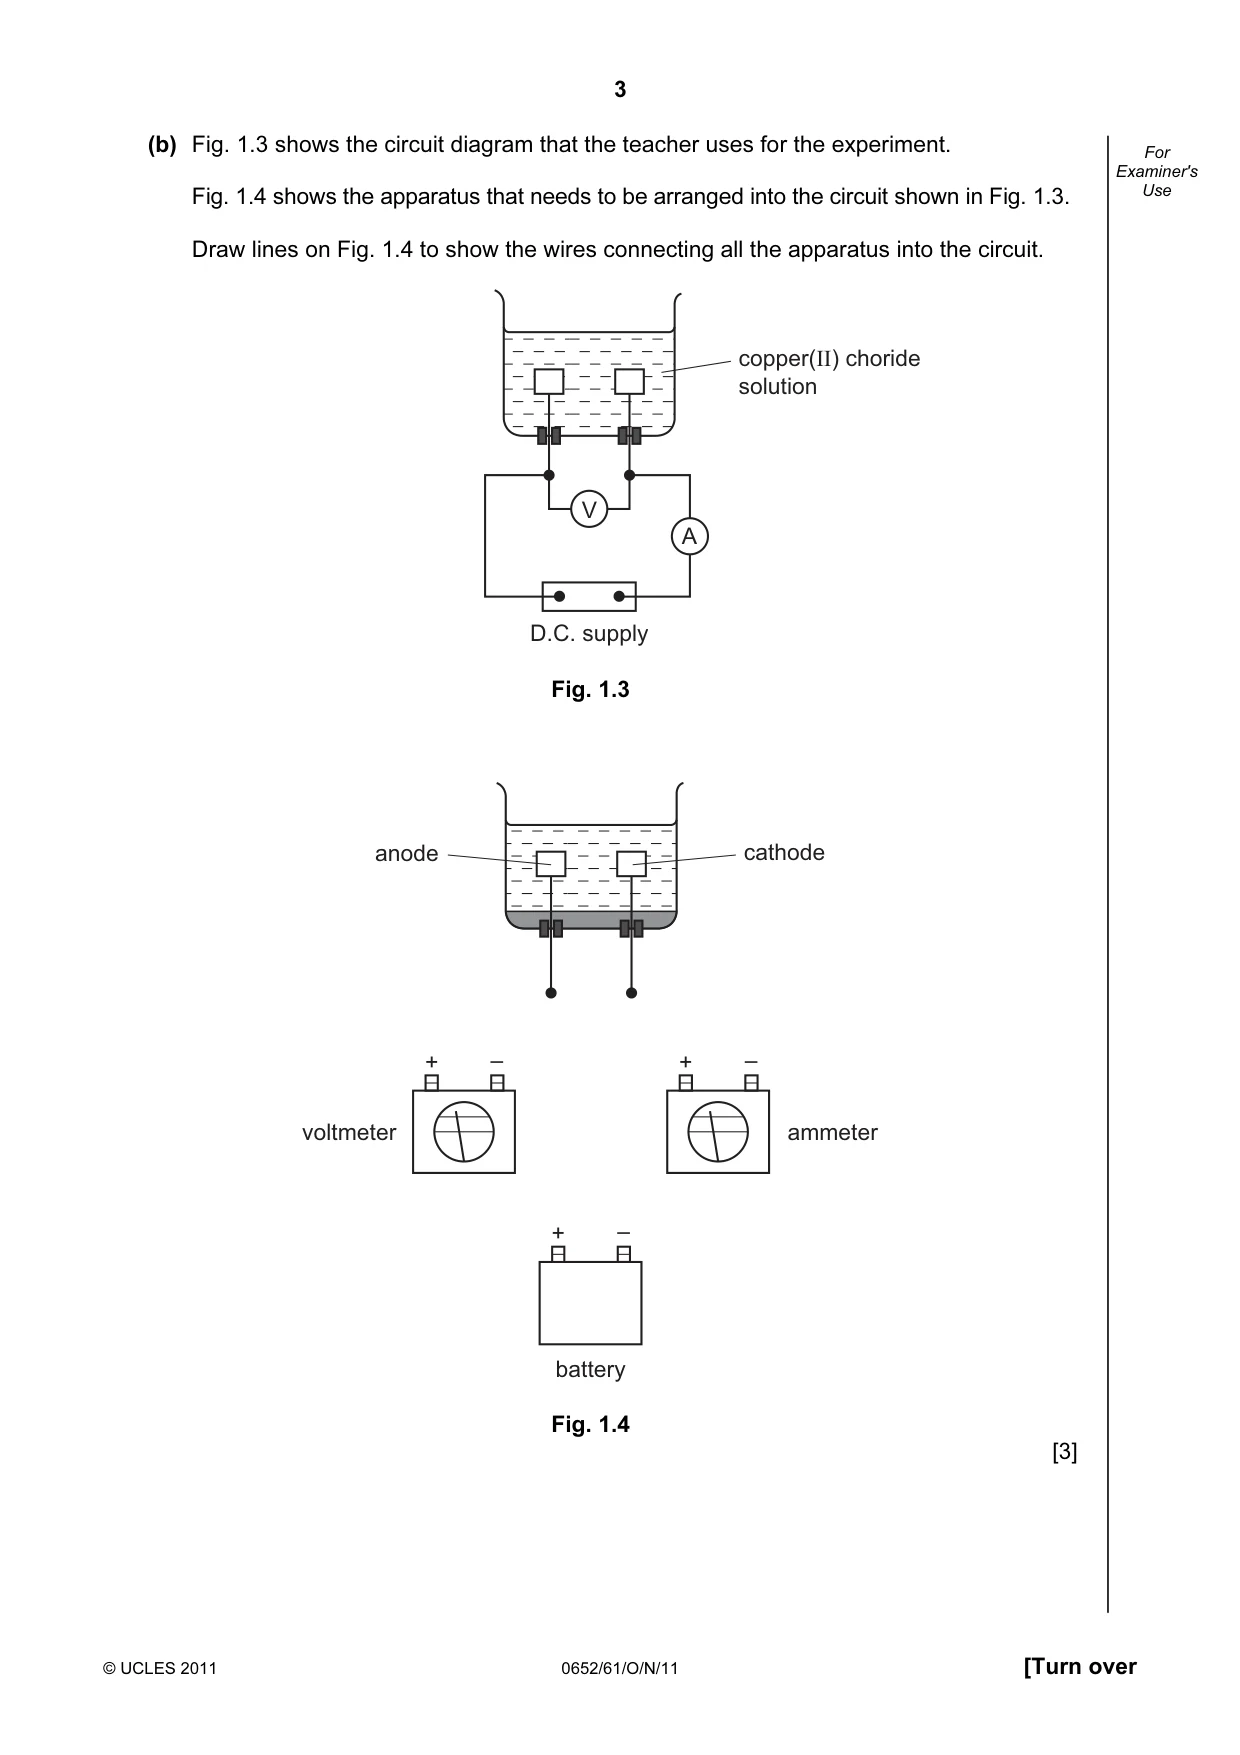
3 © UCLES 2011 0652/61/O/N/11 [Turn over For Examiner's Use (b) Fig. 1.3 shows the circuit diagram that the teacher uses for the experiment. Fig. 1.4 shows the apparatus that needs to be arranged into the circuit shown in Fig. 1.3. Draw lines on Fig. 1.4 to show the wires connecting all the apparatus into the circuit. V A D.C. supply copper(II) choride solution Fig. 1.3 anode cathode + – + – voltmeter + – ammeter battery Fig. 1.4 [3]
Question paper, page 4
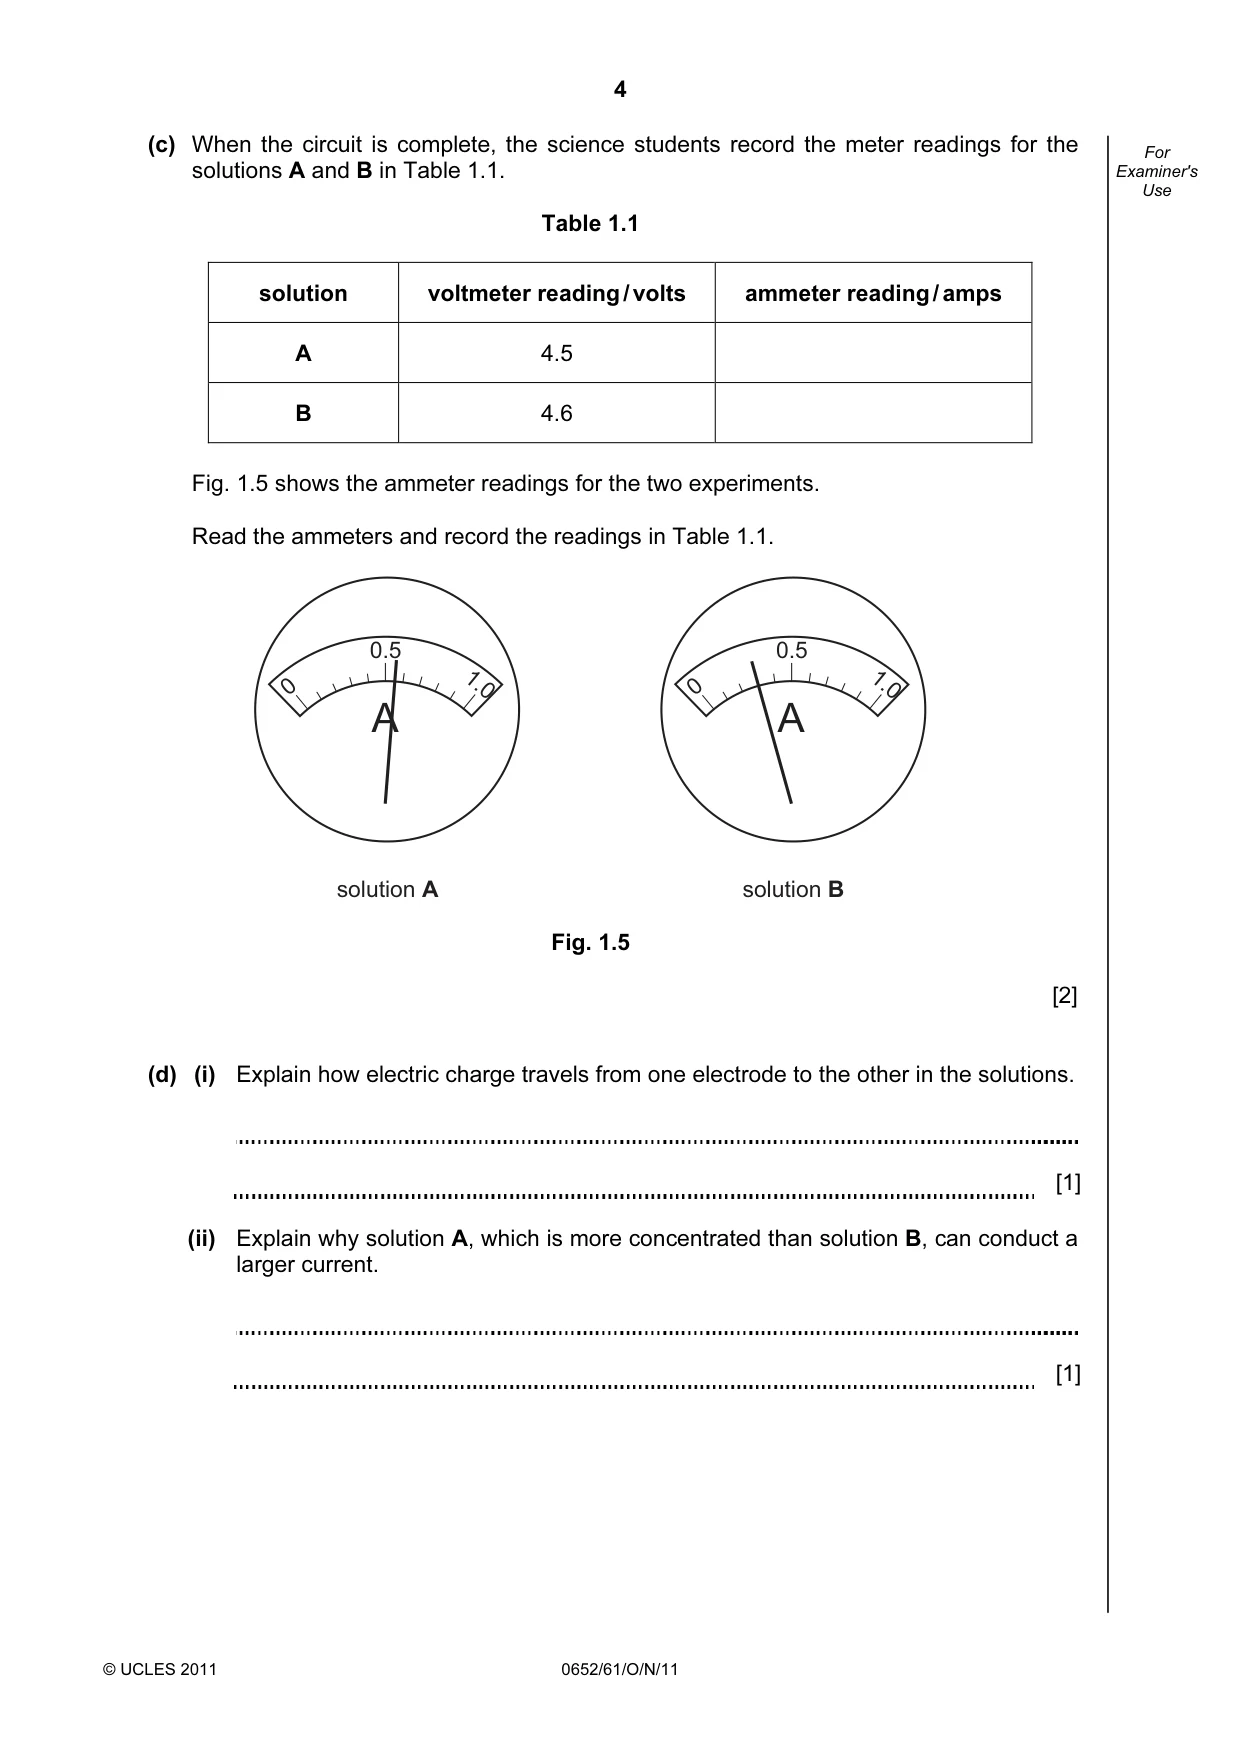
4 © UCLES 2011 0652/61/O/N/11 For Examiner's Use (c) When the circuit is complete, the science students record the meter readings for the solutions A and B in Table 1.1. Table 1.1 solution voltmeter reading / volts ammeter reading / amps A 4.5 B 4.6 Fig. 1.5 shows the ammeter readings for the two experiments. Read the ammeters and record the readings in Table 1.1. 0.5 1.0 0 A solution A 0.5 1.0 0 A solution B Fig. 1.5 [2] (d) (i) Explain how electric charge travels from one electrode to the other in the solutions. [1] (ii) Explain why solution A, which is more concentrated than solution B, can conduct a larger current. [1]
Question paper, page 5
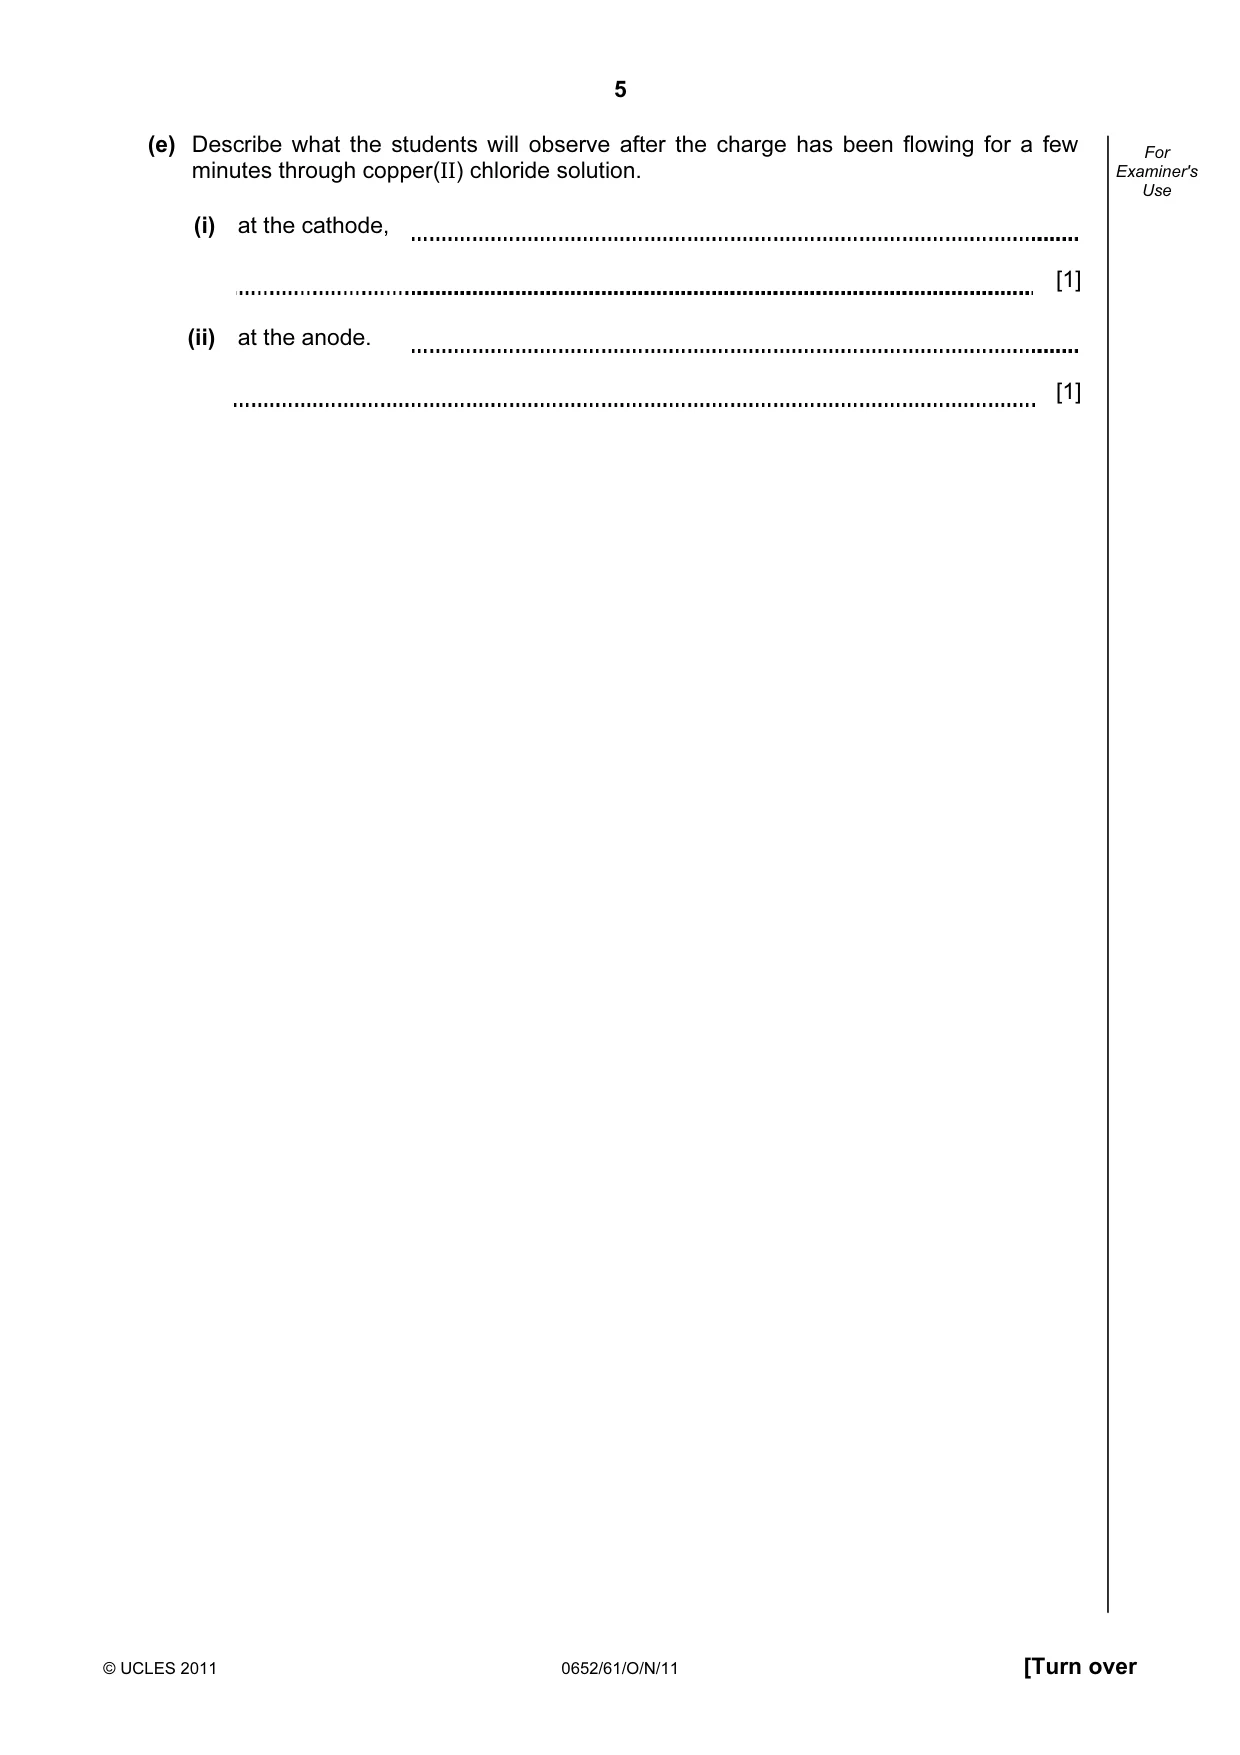
5 © UCLES 2011 0652/61/O/N/11 [Turn over For Examiner's Use (e) Describe what the students will observe after the charge has been flowing for a few minutes through copper(II) chloride solution. (i) at the cathode, [1] (ii) at the anode. [1]
Question paper, page 6
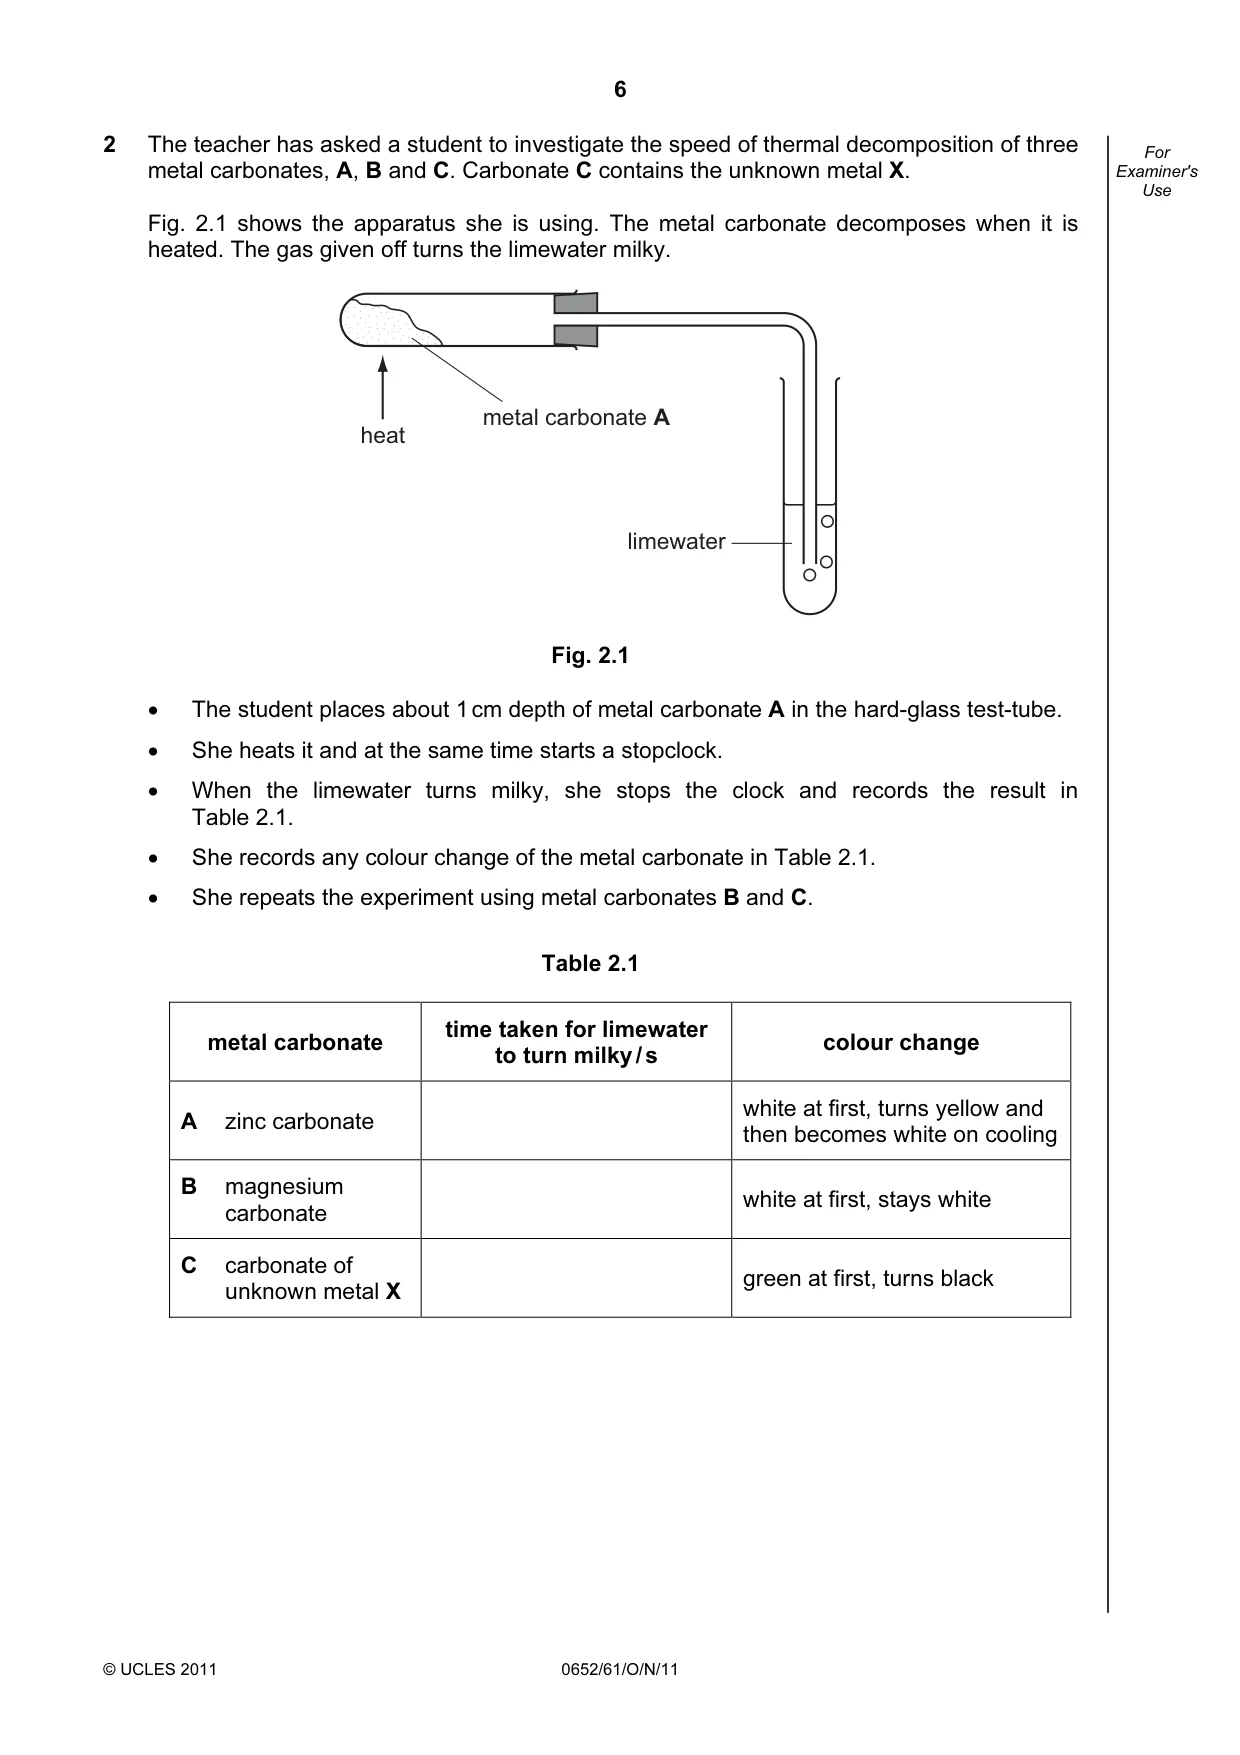
6 © UCLES 2011 0652/61/O/N/11 For Examiner's Use 2 The teacher has asked a student to investigate the speed of thermal decomposition of three metal carbonates, A, B and C. Carbonate C contains the unknown metal X. Fig. 2.1 shows the apparatus she is using. The metal carbonate decomposes when it is heated. The gas given off turns the limewater milky. limewater metal carbonate A heat Fig. 2.1 • The student places about 1 cm depth of metal carbonate A in the hard-glass test-tube. • She heats it and at the same time starts a stopclock. • When the limewater turns milky, she stops the clock and records the result in Table 2.1. • She records any colour change of the metal carbonate in Table 2.1. • She repeats the experiment using metal carbonates B and C. Table 2.1 metal carbonate time taken for limewater to turn milky / s colour change A zinc carbonate white at first, turns yellow and then becomes white on cooling B magnesium carbonate white at first, stays white C carbonate of unknown metal X green at first, turns black
Question paper, page 7
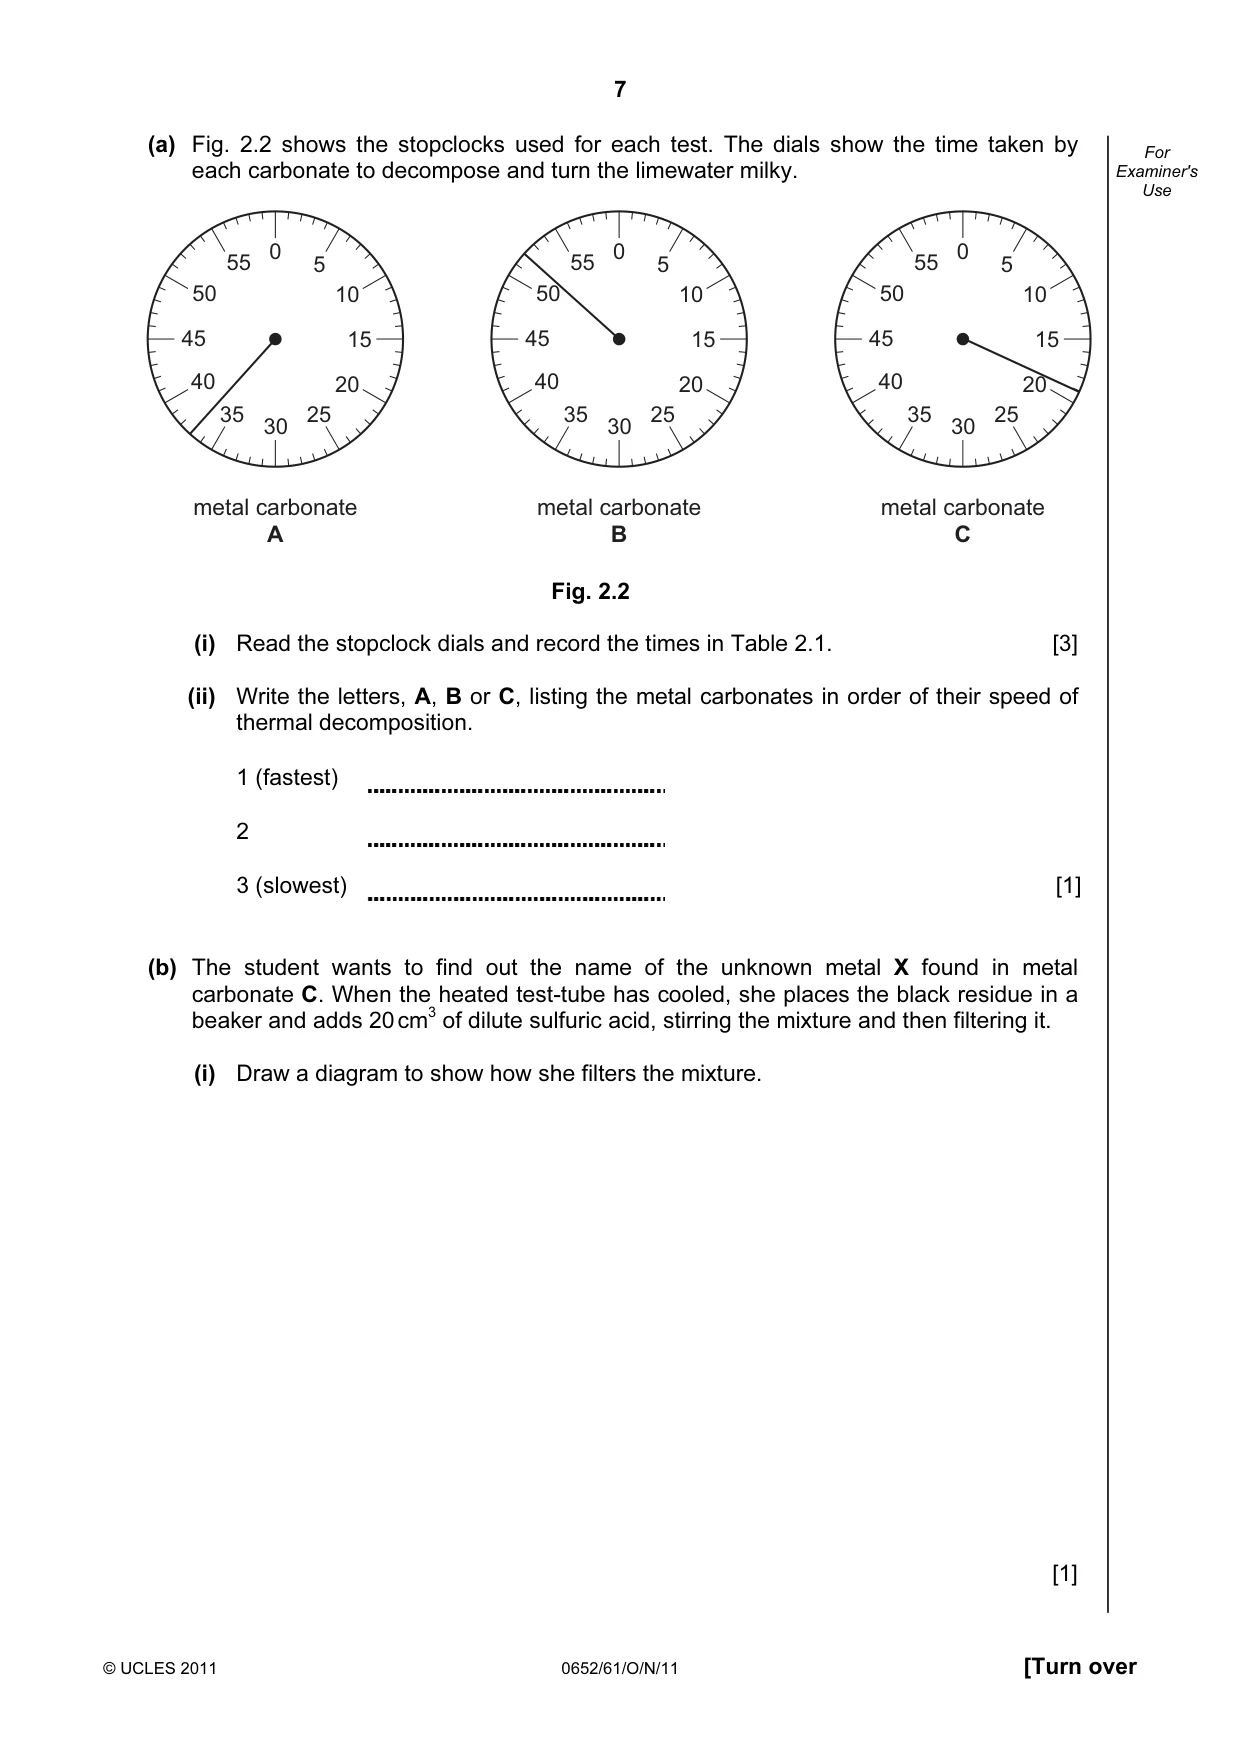
7 © UCLES 2011 0652/61/O/N/11 [Turn over For Examiner's Use (a) Fig. 2.2 shows the stopclocks used for each test. The dials show the time taken by each carbonate to decompose and turn the limewater milky. 5 0 10 15 20 40 25 35 30 45 50 55 metal carbonate A 5 0 10 15 20 40 25 35 30 45 50 55 metal carbonate B 5 0 10 15 20 40 25 35 30 45 50 55 metal carbonate C Fig. 2.2 (i) Read the stopclock dials and record the times in Table 2.1. [3] (ii) Write the letters, A, B or C, listing the metal carbonates in order of their speed of thermal decomposition. 1 (fastest) 2 3 (slowest) [1] (b) The student wants to find out the name of the unknown metal X found in metal carbonate C. When the heated test-tube has cooled, she places the black residue in a beaker and adds 20 cm3 of dilute sulfuric acid, stirring the mixture and then filtering it. (i) Draw a diagram to show how she filters the mixture. [1]
Question paper, page 8
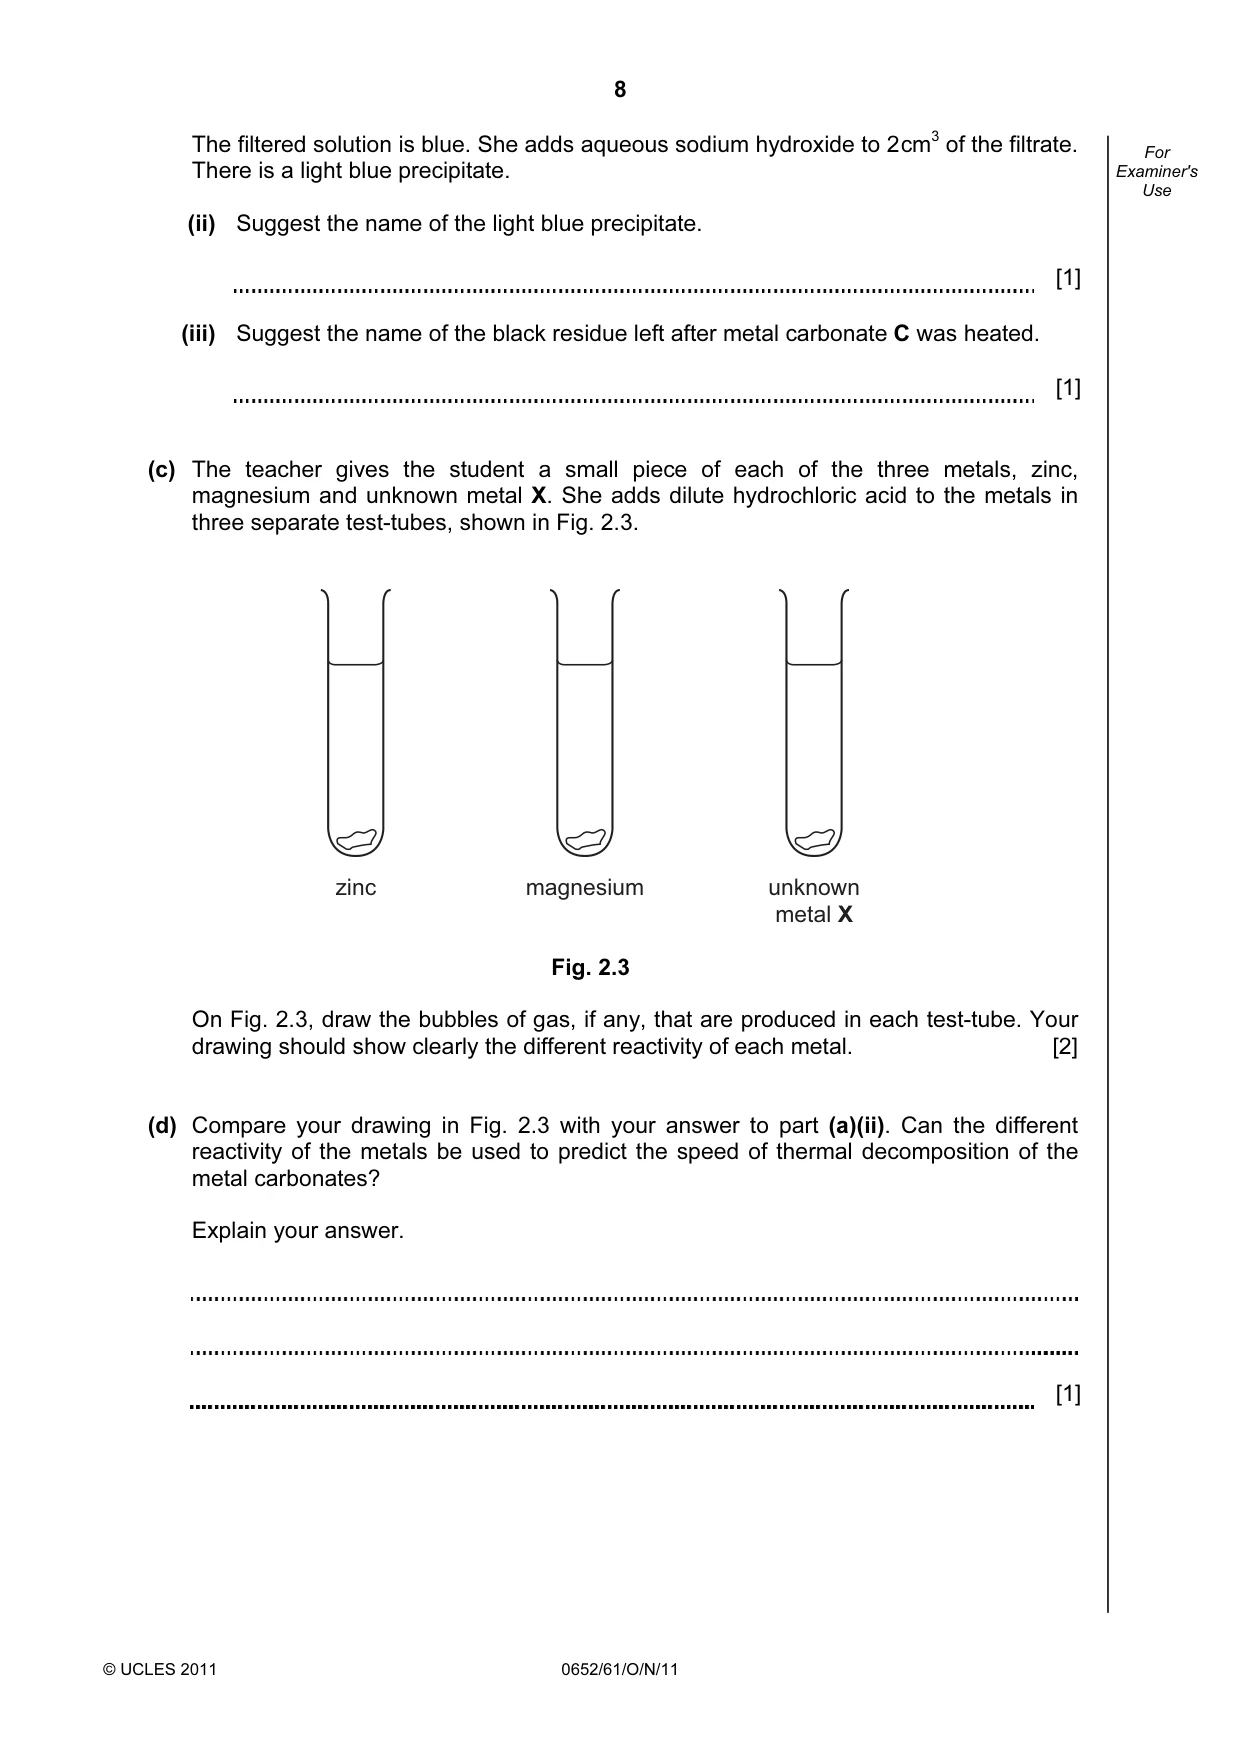
8 © UCLES 2011 0652/61/O/N/11 For Examiner's Use The filtered solution is blue. She adds aqueous sodium hydroxide to 2 cm3 of the filtrate. There is a light blue precipitate. (ii) Suggest the name of the light blue precipitate. [1] (iii) Suggest the name of the black residue left after metal carbonate C was heated. [1] (c) The teacher gives the student a small piece of each of the three metals, zinc, magnesium and unknown metal X. She adds dilute hydrochloric acid to the metals in three separate test-tubes, shown in Fig. 2.3. zinc magnesium unknown metal X Fig. 2.3 On Fig. 2.3, draw the bubbles of gas, if any, that are produced in each test-tube. Your drawing should show clearly the different reactivity of each metal. [2] (d) Compare your drawing in Fig. 2.3 with your answer to part (a)(ii). Can the different reactivity of the metals be used to predict the speed of thermal decomposition of the metal carbonates? Explain your answer. [1]
Question paper, page 9
9 © UCLES 2011 0652/61/O/N/11 [Turn over BLANK PAGE Please turn over for Question 3.
Question paper, page 10
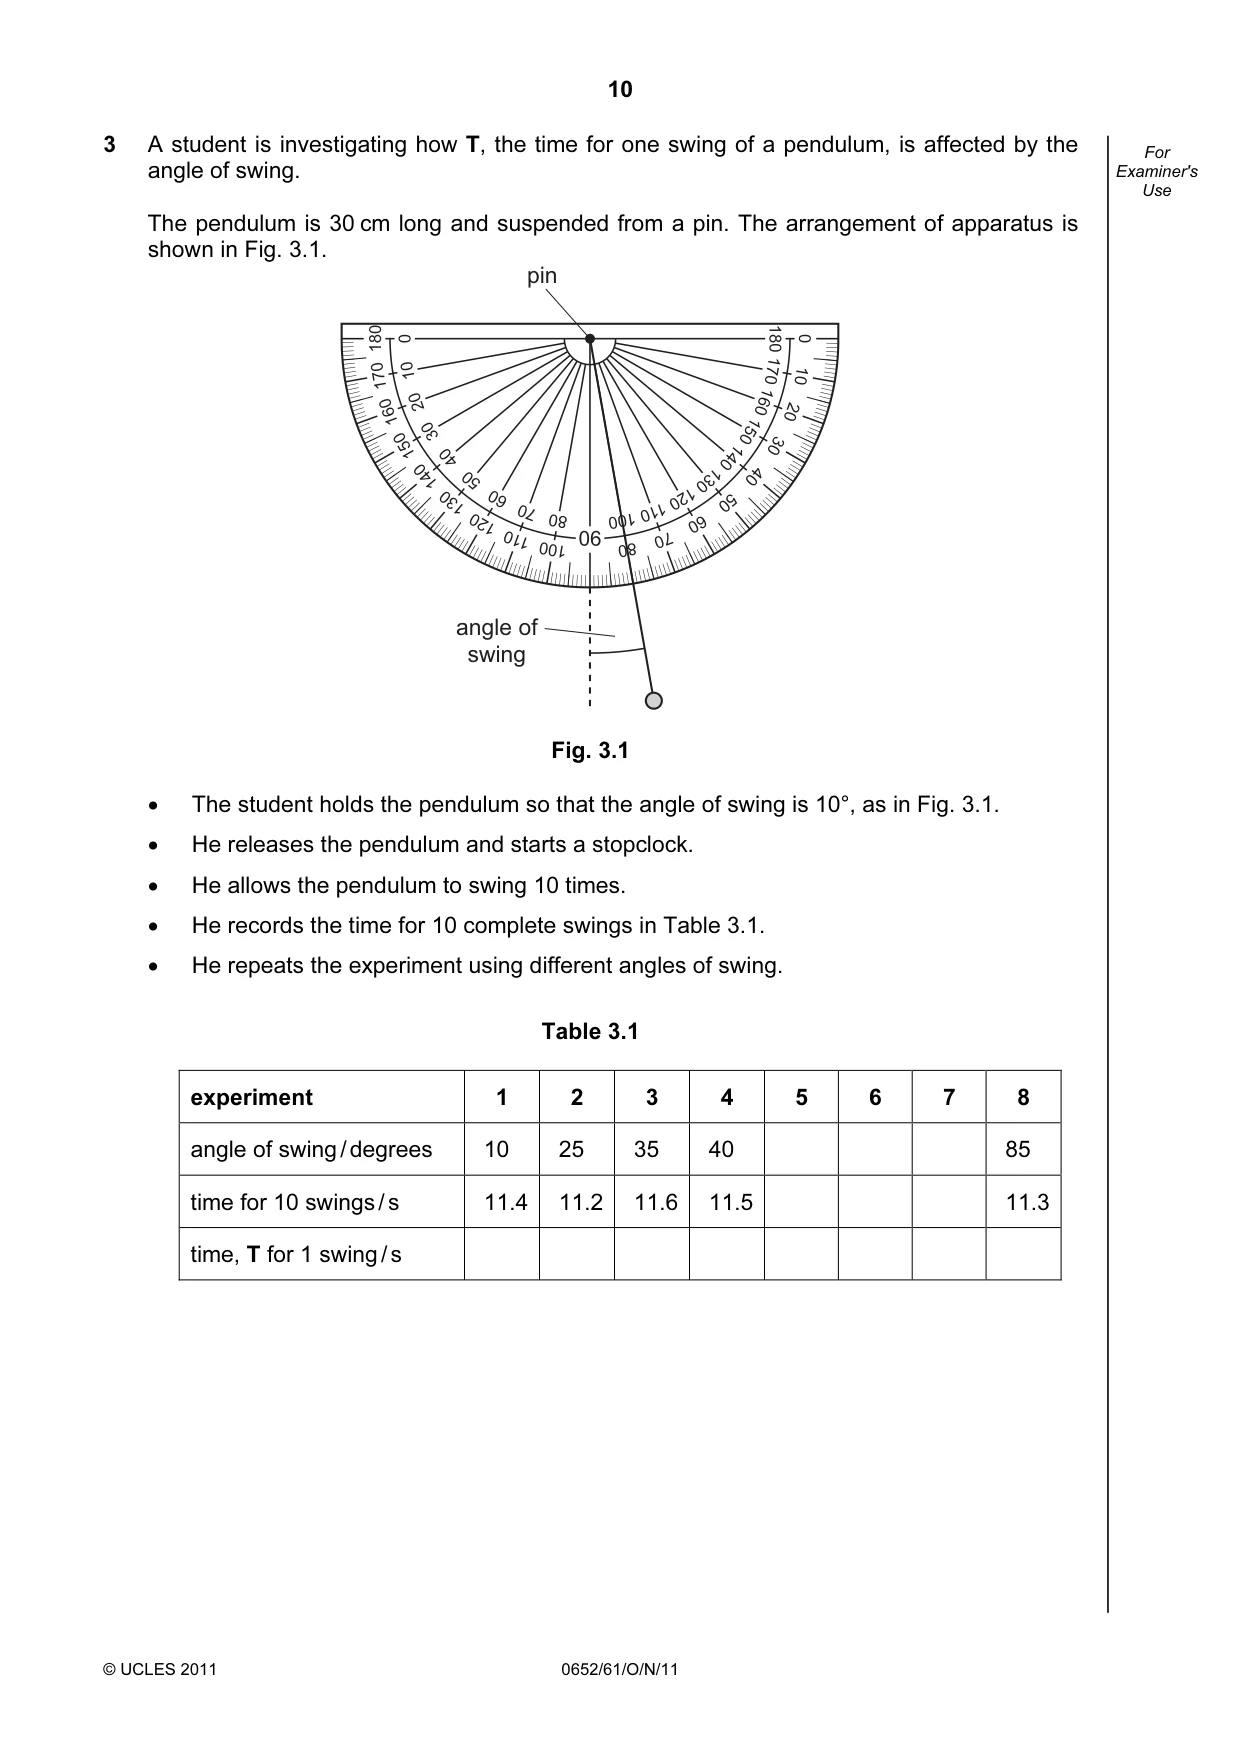
10 © UCLES 2011 0652/61/O/N/11 For Examiner's Use 3 A student is investigating how T, the time for one swing of a pendulum, is affected by the angle of swing. The pendulum is 30 cm long and suspended from a pin. The arrangement of apparatus is shown in Fig. 3.1. 0 180 170 160 150 140 130 120 110 100 80 70 60 50 40 30 20 10 0 10 20 30 40 50 60 70 80 100 110 120 130 140 150 160 170 180 90 pin angle of swing Fig. 3.1 • The student holds the pendulum so that the angle of swing is 10°, as in Fig. 3.1. • He releases the pendulum and starts a stopclock. • He allows the pendulum to swing 10 times. • He records the time for 10 complete swings in Table 3.1. • He repeats the experiment using different angles of swing. Table 3.1 experiment 1 2 3 4 5 6 7 8 angle of swing / degrees 10 25 35 40 85 time for 10 swings / s 11.4 11.2 11.6 11.5 11.3 time, T for 1 swing / s
Question paper, page 11
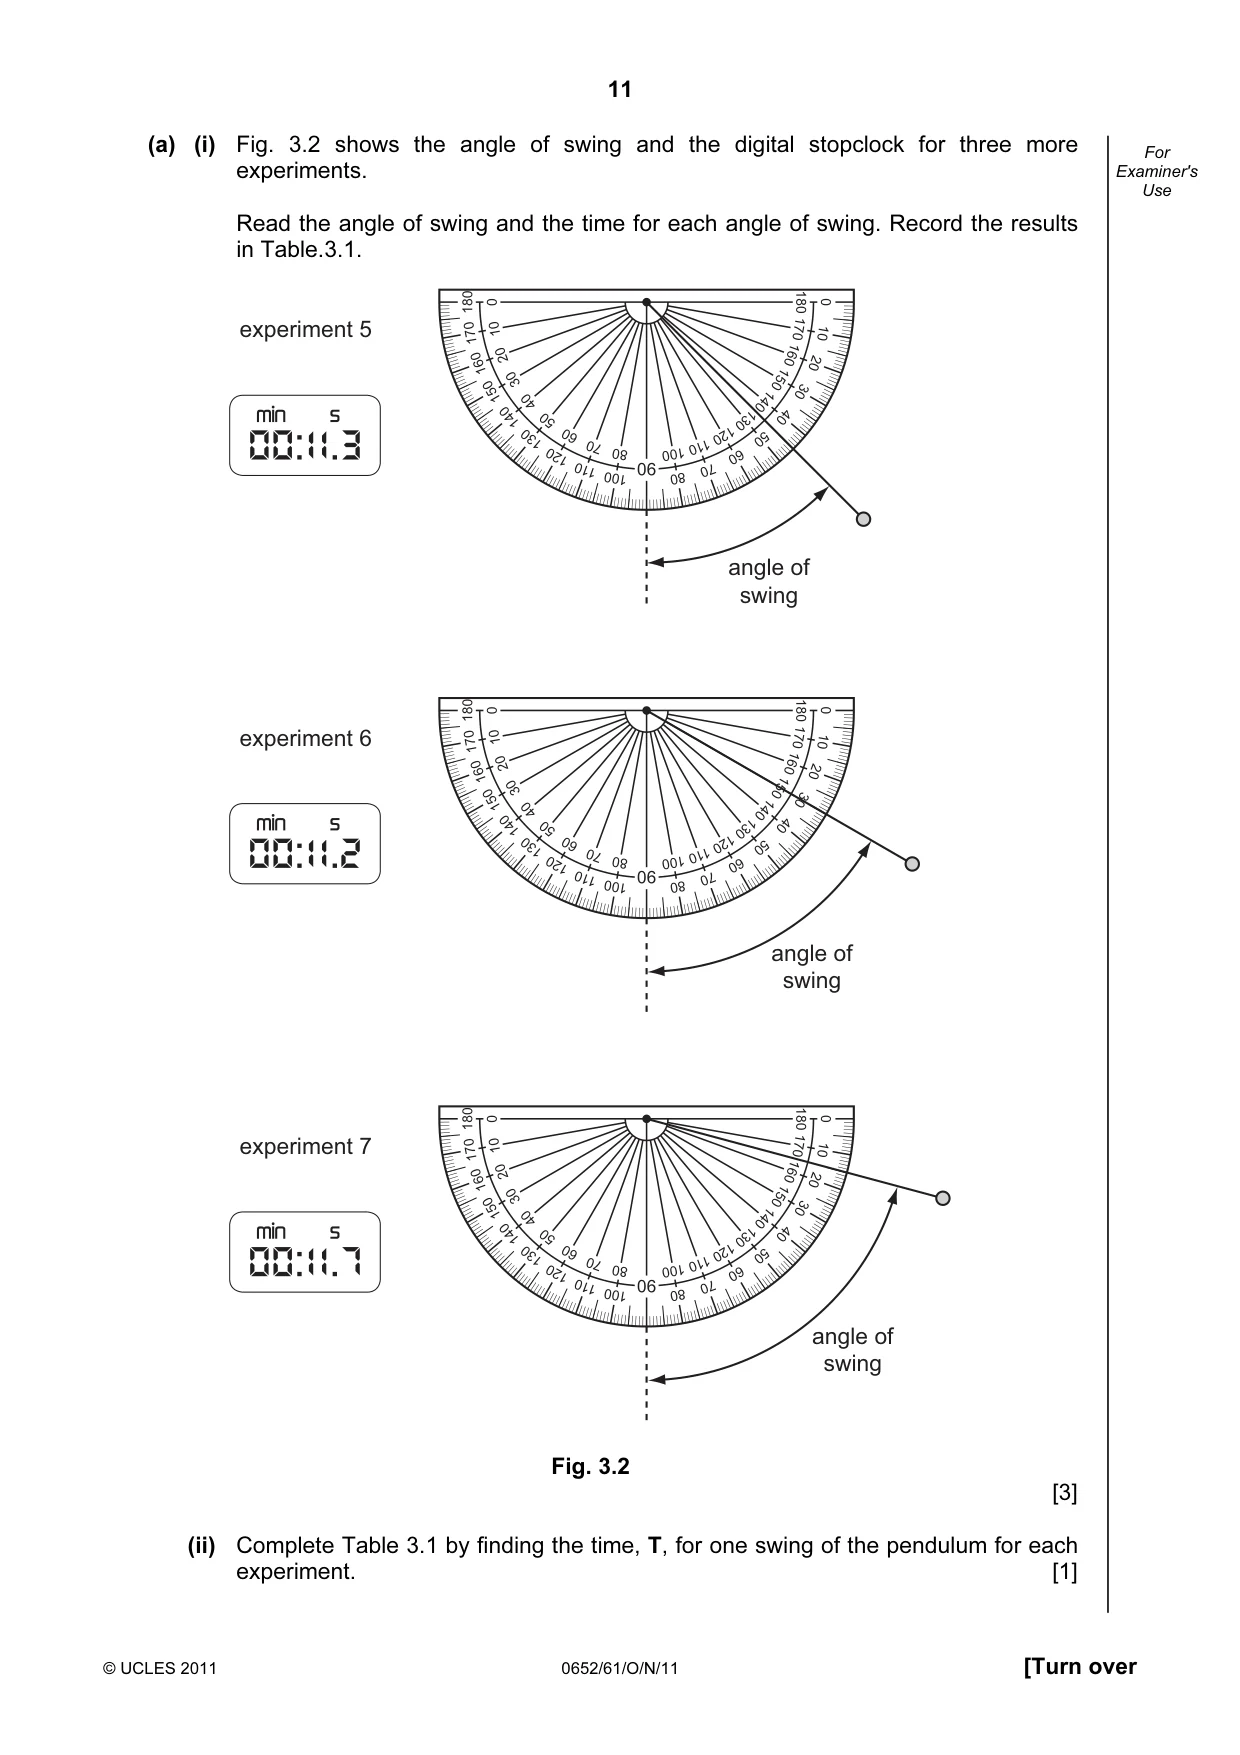
11 © UCLES 2011 0652/61/O/N/11 [Turn over For Examiner's Use (a) (i) Fig. 3.2 shows the angle of swing and the digital stopclock for three more experiments. Read the angle of swing and the time for each angle of swing. Record the results in Table.3.1. 0 180 170 160 150 140 130 120 110 100 80 70 60 50 40 30 20 10 0 10 20 30 40 50 60 70 80 100 110 120 130 140 150 160 170 180 90 angle of swing experiment 5 0 180 170 160 150 140 130 120 110 100 80 70 60 50 40 30 20 10 0 10 20 30 40 50 60 70 80 100 110 120 130 140 150 160 170 180 90 angle of swing experiment 6 0 180 170 160 150 140 130 120 110 100 80 70 60 50 40 30 20 10 0 10 20 30 40 50 60 70 80 100 110 120 130 140 150 160 170 180 90 angle of swing experiment 7 Fig. 3.2 [3] (ii) Complete Table 3.1 by finding the time, T, for one swing of the pendulum for each experiment. [1]
Question paper, page 12
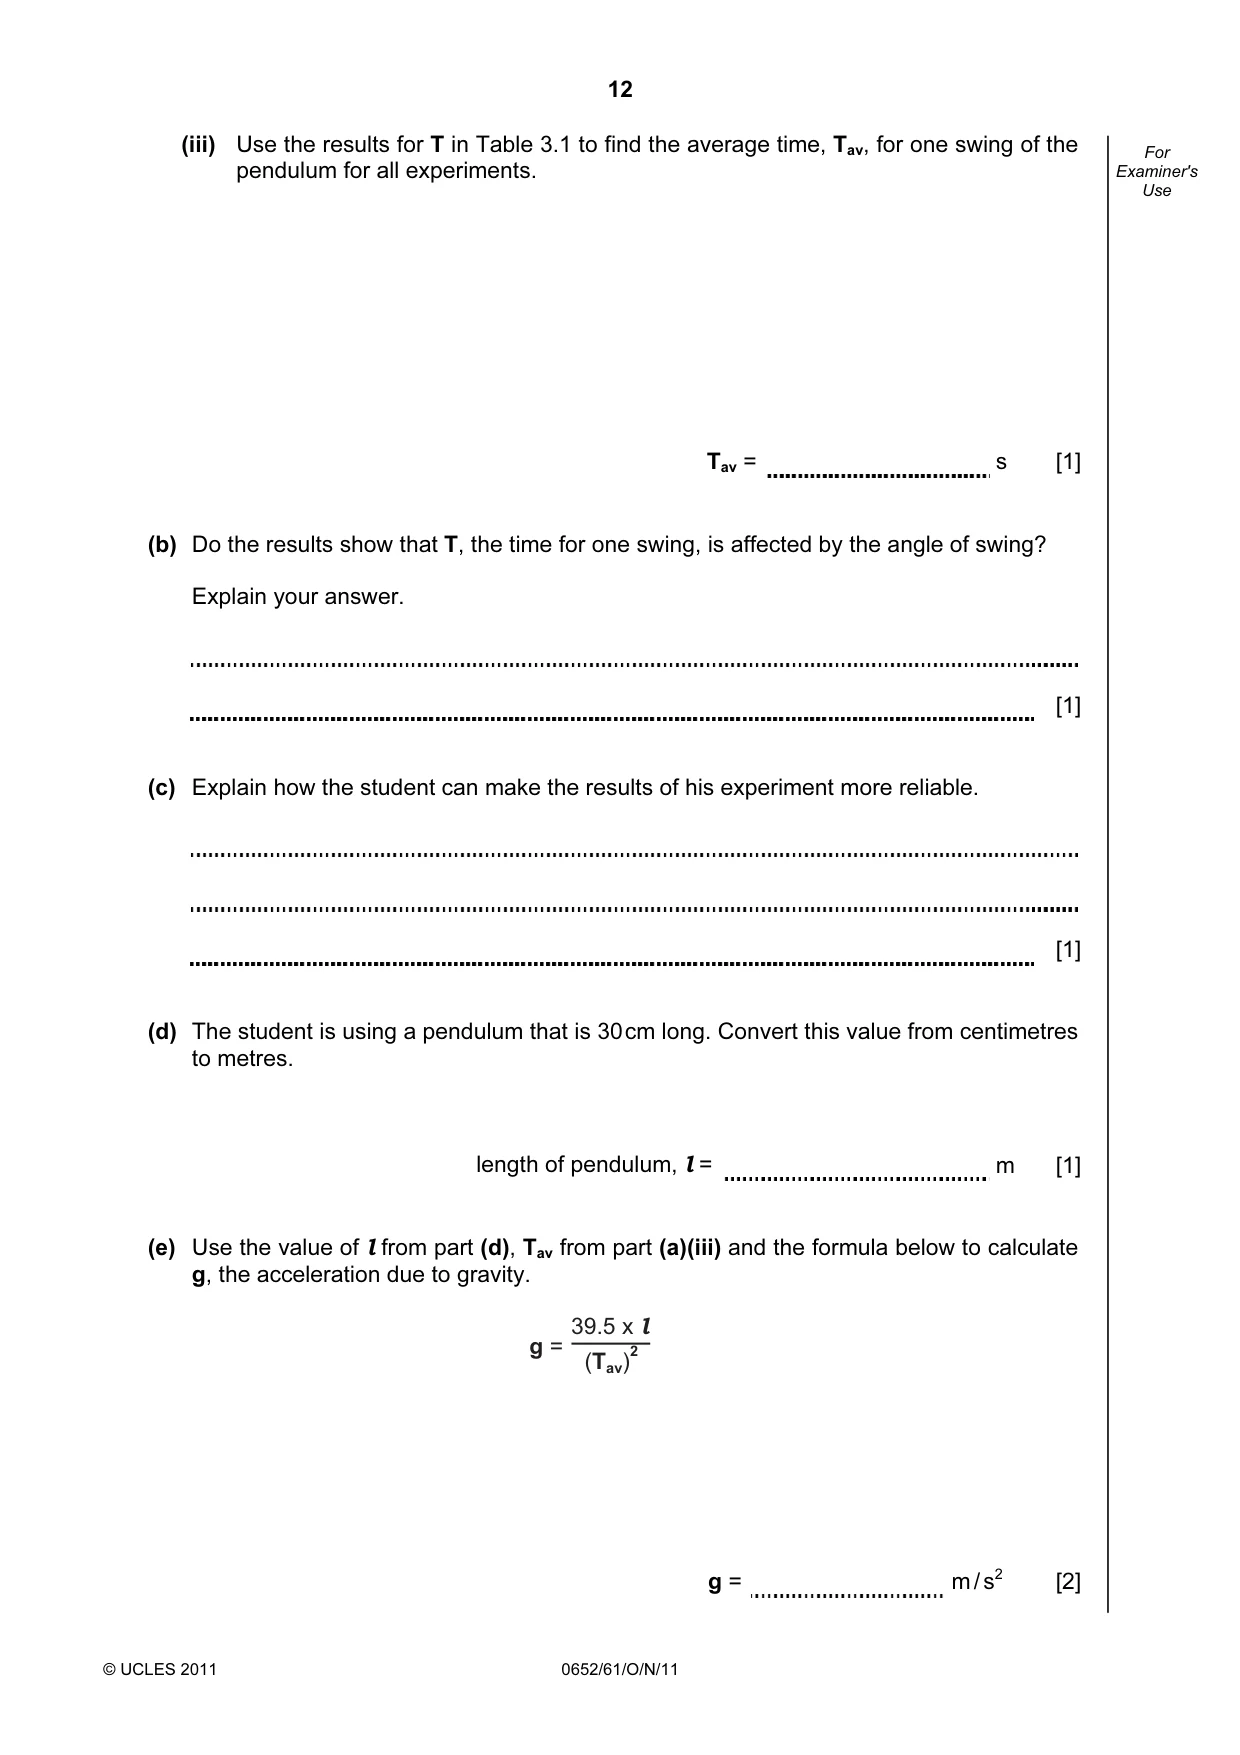
12 © UCLES 2011 0652/61/O/N/11 For Examiner's Use (iii) Use the results for T in Table 3.1 to find the average time, Tav, for one swing of the pendulum for all experiments. Tav = s [1] (b) Do the results show that T, the time for one swing, is affected by the angle of swing? Explain your answer. [1] (c) Explain how the student can make the results of his experiment more reliable. [1] (d) The student is using a pendulum that is 30 cm long. Convert this value from centimetres to metres. length of pendulum, l = m [1] (e) Use the value of l from part (d), Tav from part (a)(iii) and the formula below to calculate g, the acceleration due to gravity. (Tav) 2 39.5 x l g = g = m / s2 [2]
Question paper, page 13
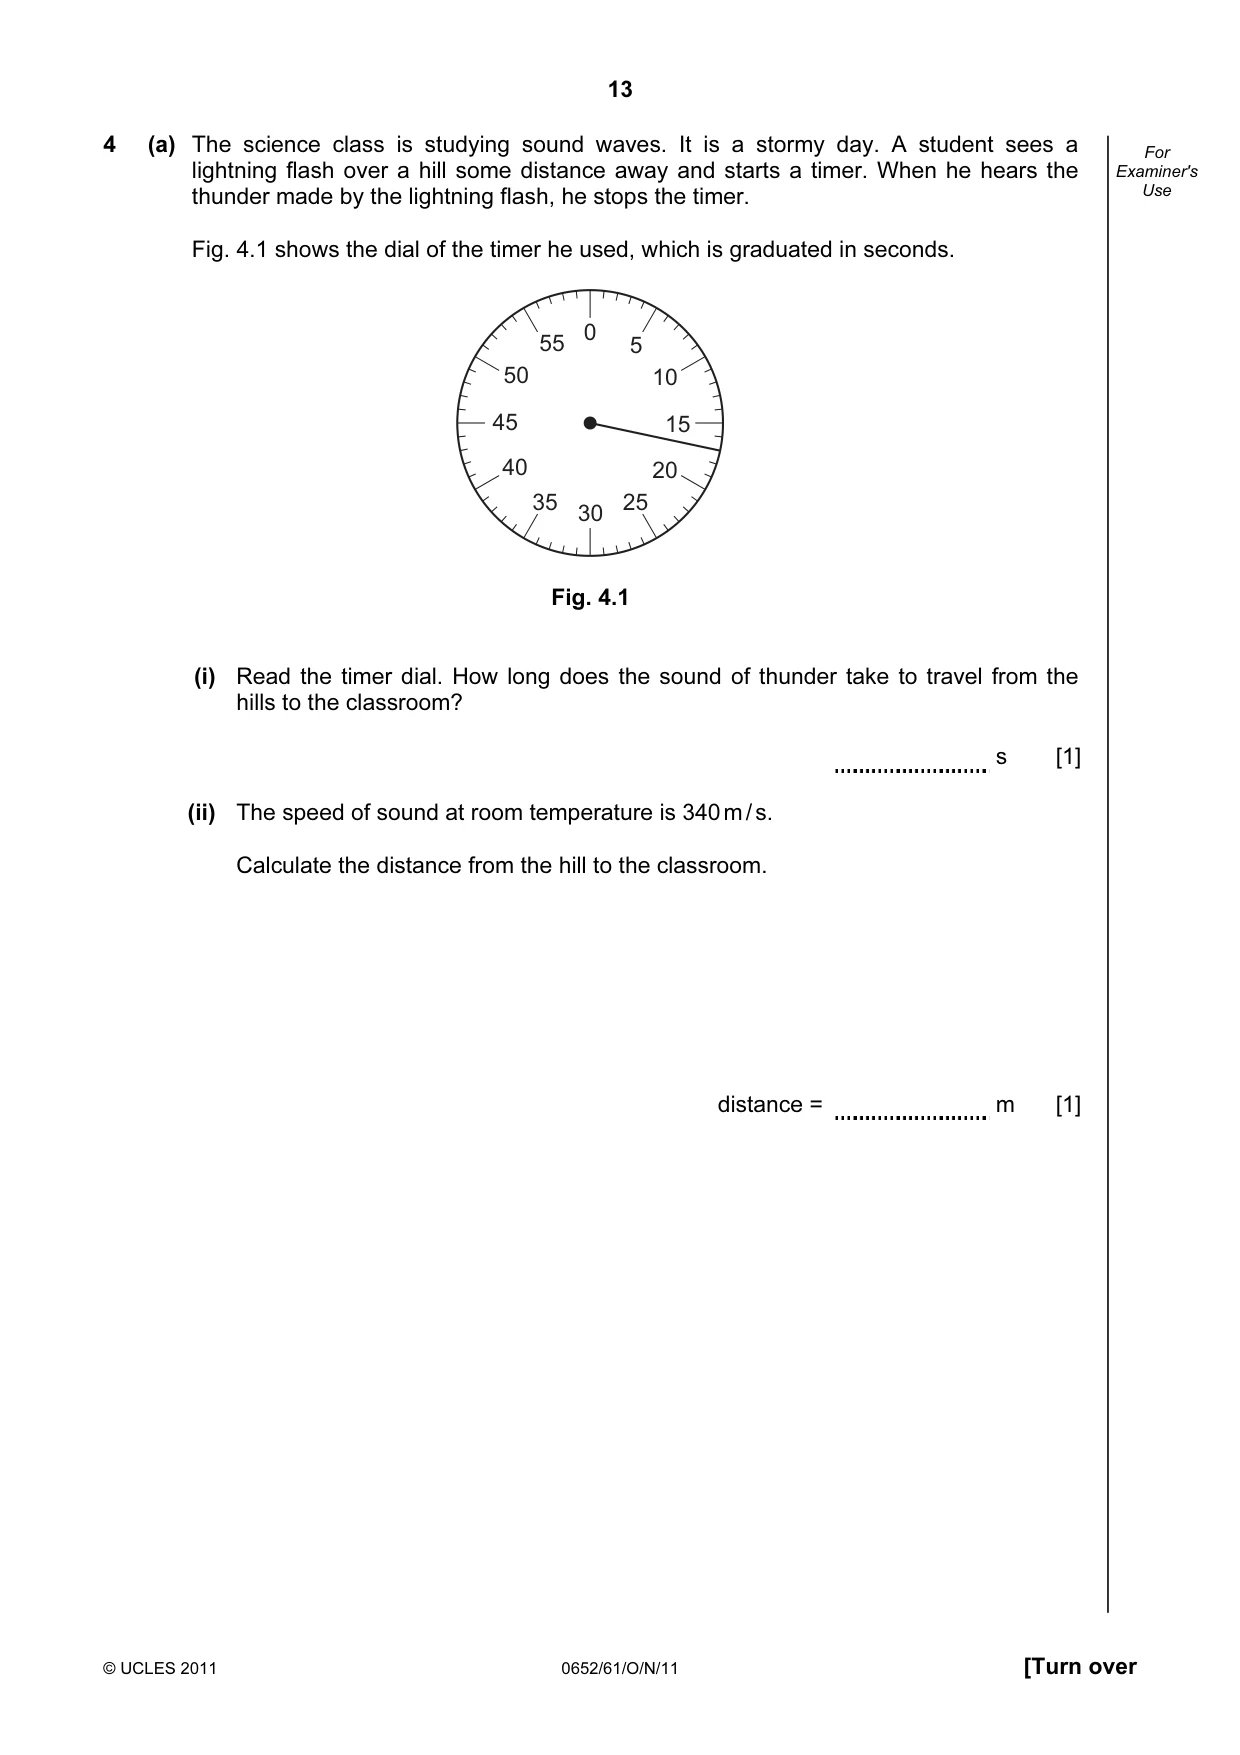
13 © UCLES 2011 0652/61/O/N/11 [Turn over For Examiner's Use 4 (a) The science class is studying sound waves. It is a stormy day. A student sees a lightning flash over a hill some distance away and starts a timer. When he hears the thunder made by the lightning flash, he stops the timer. Fig. 4.1 shows the dial of the timer he used, which is graduated in seconds. 5 0 10 15 20 40 25 35 30 45 50 55 Fig. 4.1 (i) Read the timer dial. How long does the sound of thunder take to travel from the hills to the classroom? s [1] (ii) The speed of sound at room temperature is 340 m / s. Calculate the distance from the hill to the classroom. distance = m [1]
Question paper, page 14
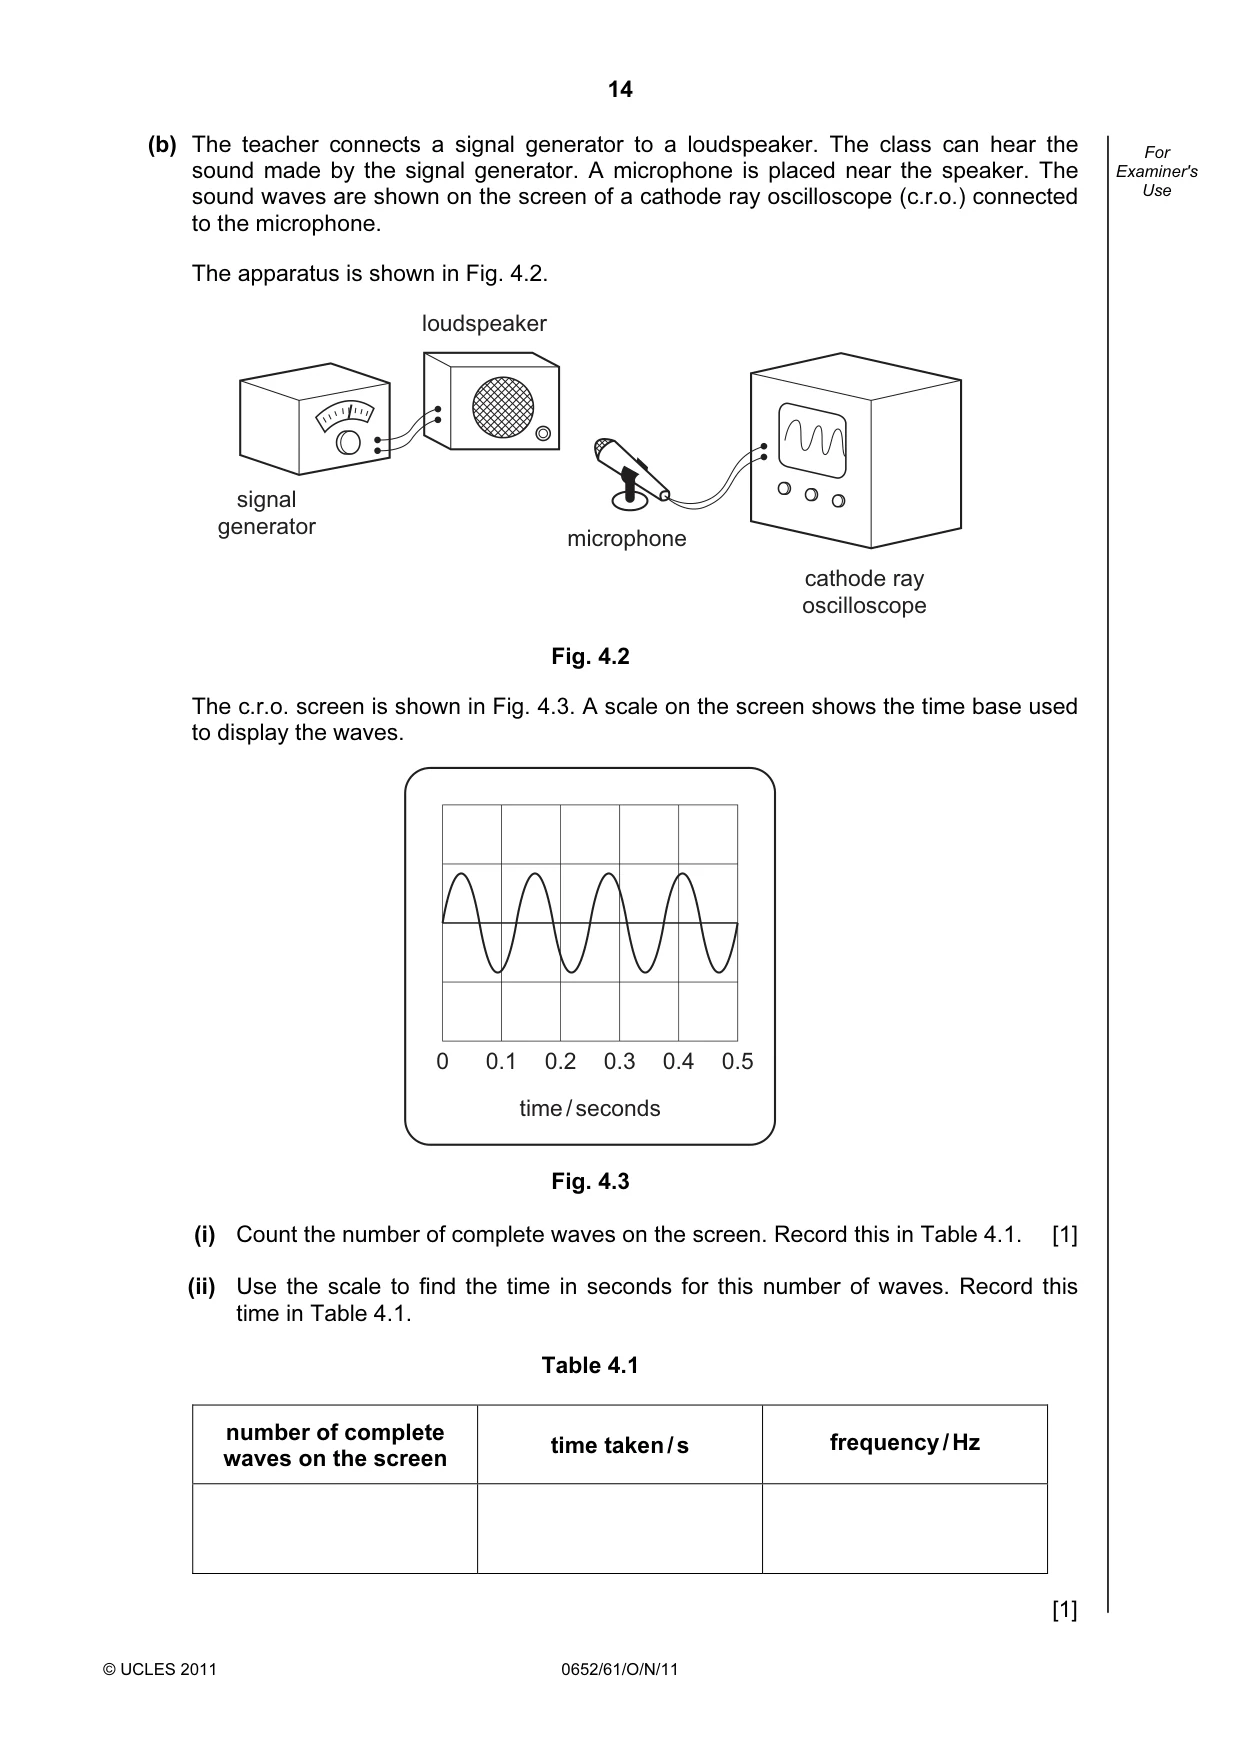
14 © UCLES 2011 0652/61/O/N/11 For Examiner's Use (b) The teacher connects a signal generator to a loudspeaker. The class can hear the sound made by the signal generator. A microphone is placed near the speaker. The sound waves are shown on the screen of a cathode ray oscilloscope (c.r.o.) connected to the microphone. The apparatus is shown in Fig. 4.2. signal generator loudspeaker microphone cathode ray oscilloscope Fig. 4.2 The c.r.o. screen is shown in Fig. 4.3. A scale on the screen shows the time base used to display the waves. 0 0.1 0.2 0.3 0.4 0.5 time / seconds Fig. 4.3 (i) Count the number of complete waves on the screen. Record this in Table 4.1. [1] (ii) Use the scale to find the time in seconds for this number of waves. Record this time in Table 4.1. Table 4.1 number of complete waves on the screen time taken / s frequency / Hz [1]
Question paper, page 15
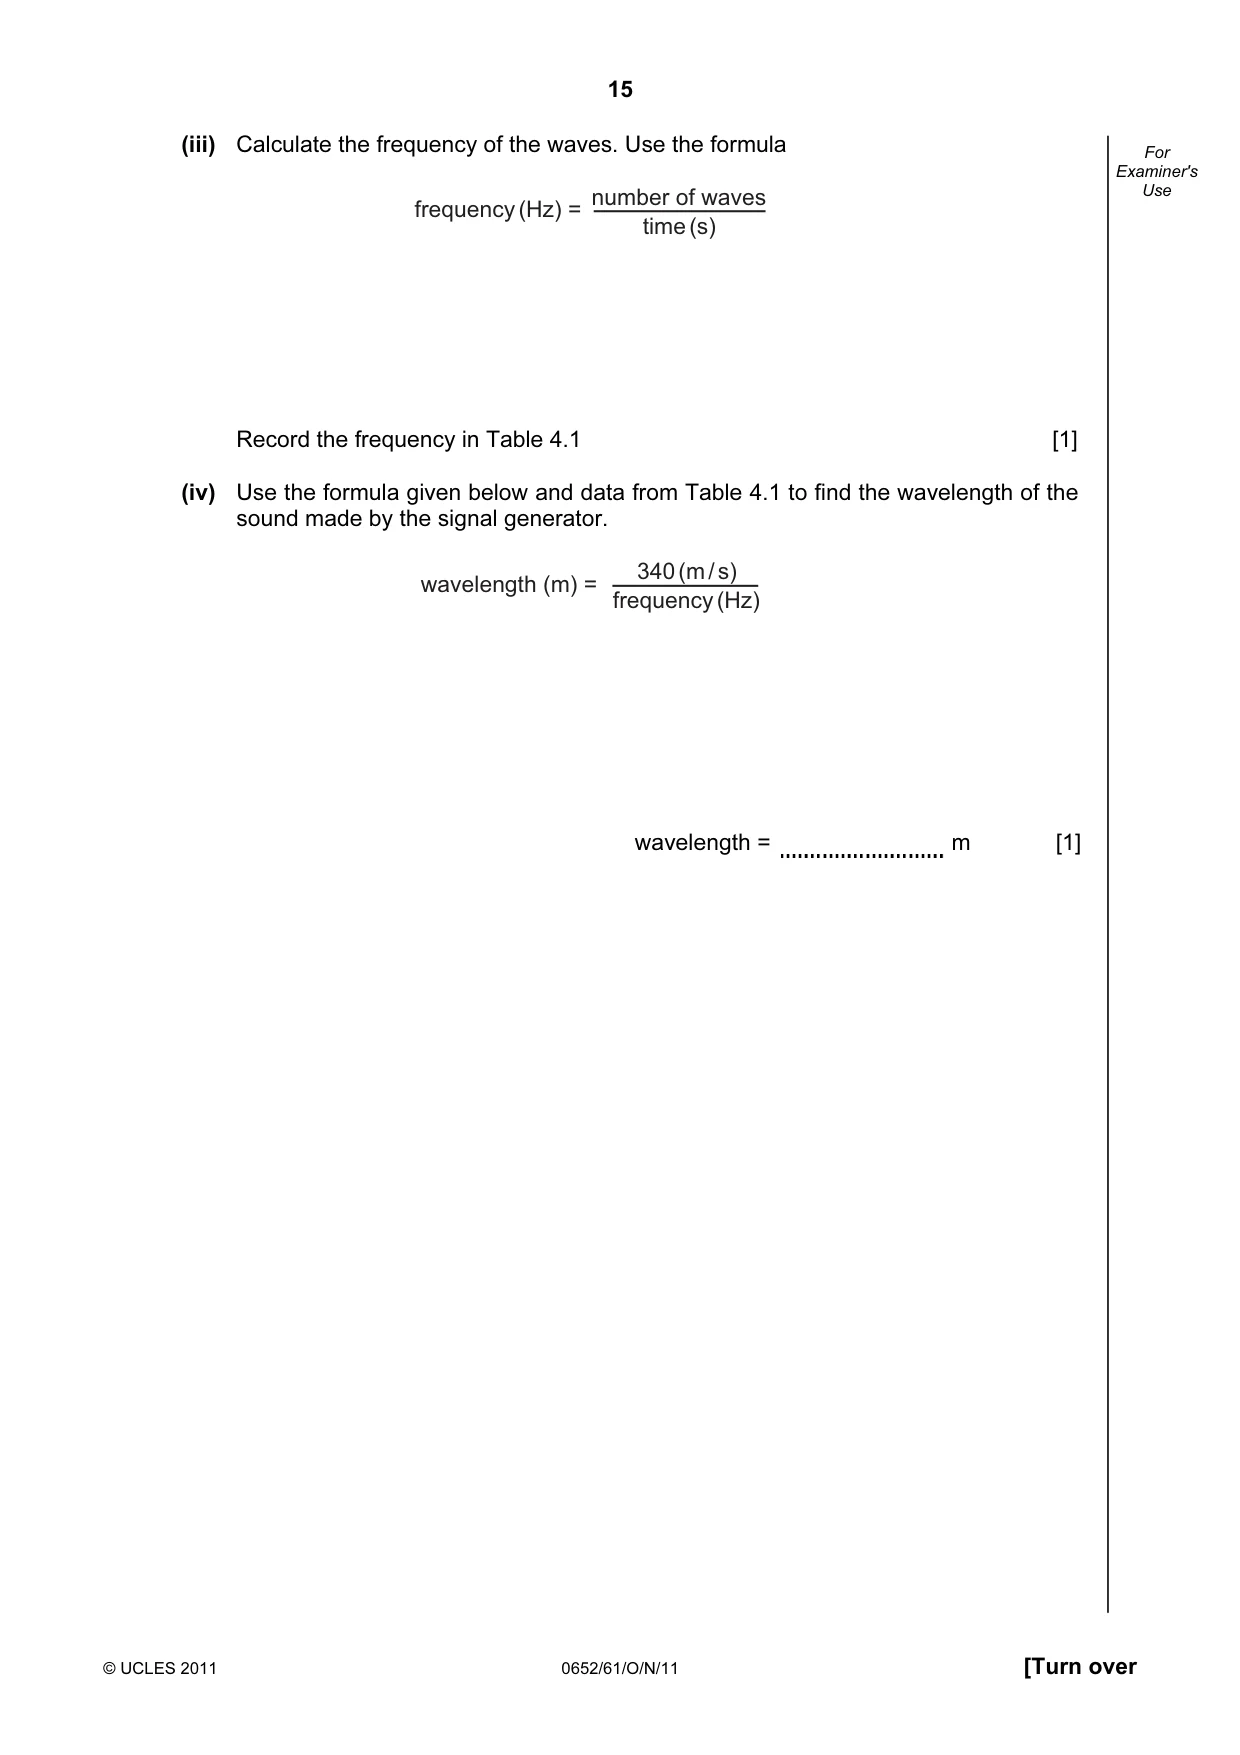
15 © UCLES 2011 0652/61/O/N/11 [Turn over For Examiner's Use (iii) Calculate the frequency of the waves. Use the formula frequency (Hz) = number of waves time (s) Record the frequency in Table 4.1 [1] (iv) Use the formula given below and data from Table 4.1 to find the wavelength of the sound made by the signal generator. wavelength (m) = frequency (Hz) 340 (m / s) wavelength = m [1]
Question paper, page 16
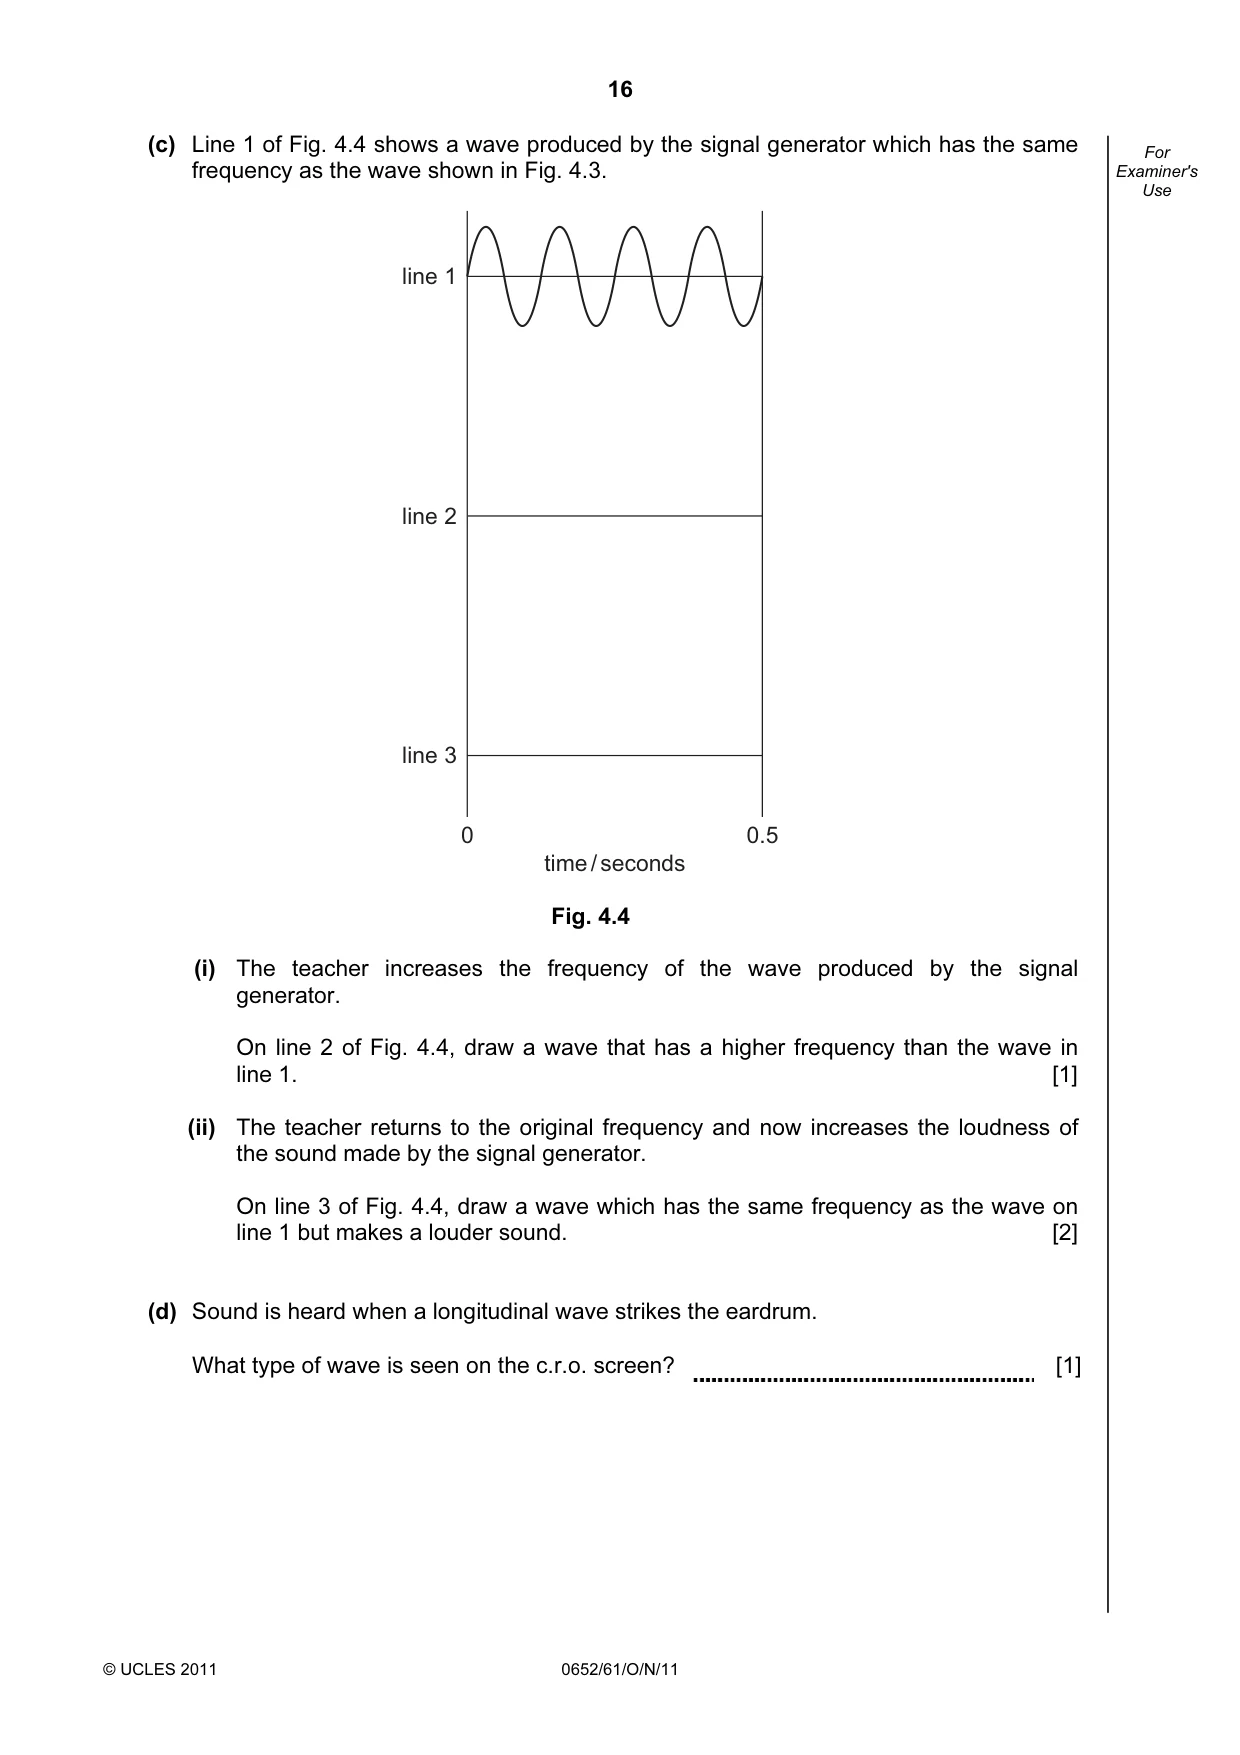
16 © UCLES 2011 0652/61/O/N/11 For Examiner's Use (c) Line 1 of Fig. 4.4 shows a wave produced by the signal generator which has the same frequency as the wave shown in Fig. 4.3. 0 line 1 0.5 line 2 line 3 time / seconds Fig. 4.4 (i) The teacher increases the frequency of the wave produced by the signal generator. On line 2 of Fig. 4.4, draw a wave that has a higher frequency than the wave in line 1. [1] (ii) The teacher returns to the original frequency and now increases the loudness of the sound made by the signal generator. On line 3 of Fig. 4.4, draw a wave which has the same frequency as the wave on line 1 but makes a louder sound. [2] (d) Sound is heard when a longitudinal wave strikes the eardrum. What type of wave is seen on the c.r.o. screen? [1]
Question paper, page 17
17 © UCLES 2011 0652/61/O/N/11 [Turn over BLANK PAGE Please turn over for Question 5.
Question paper, page 18
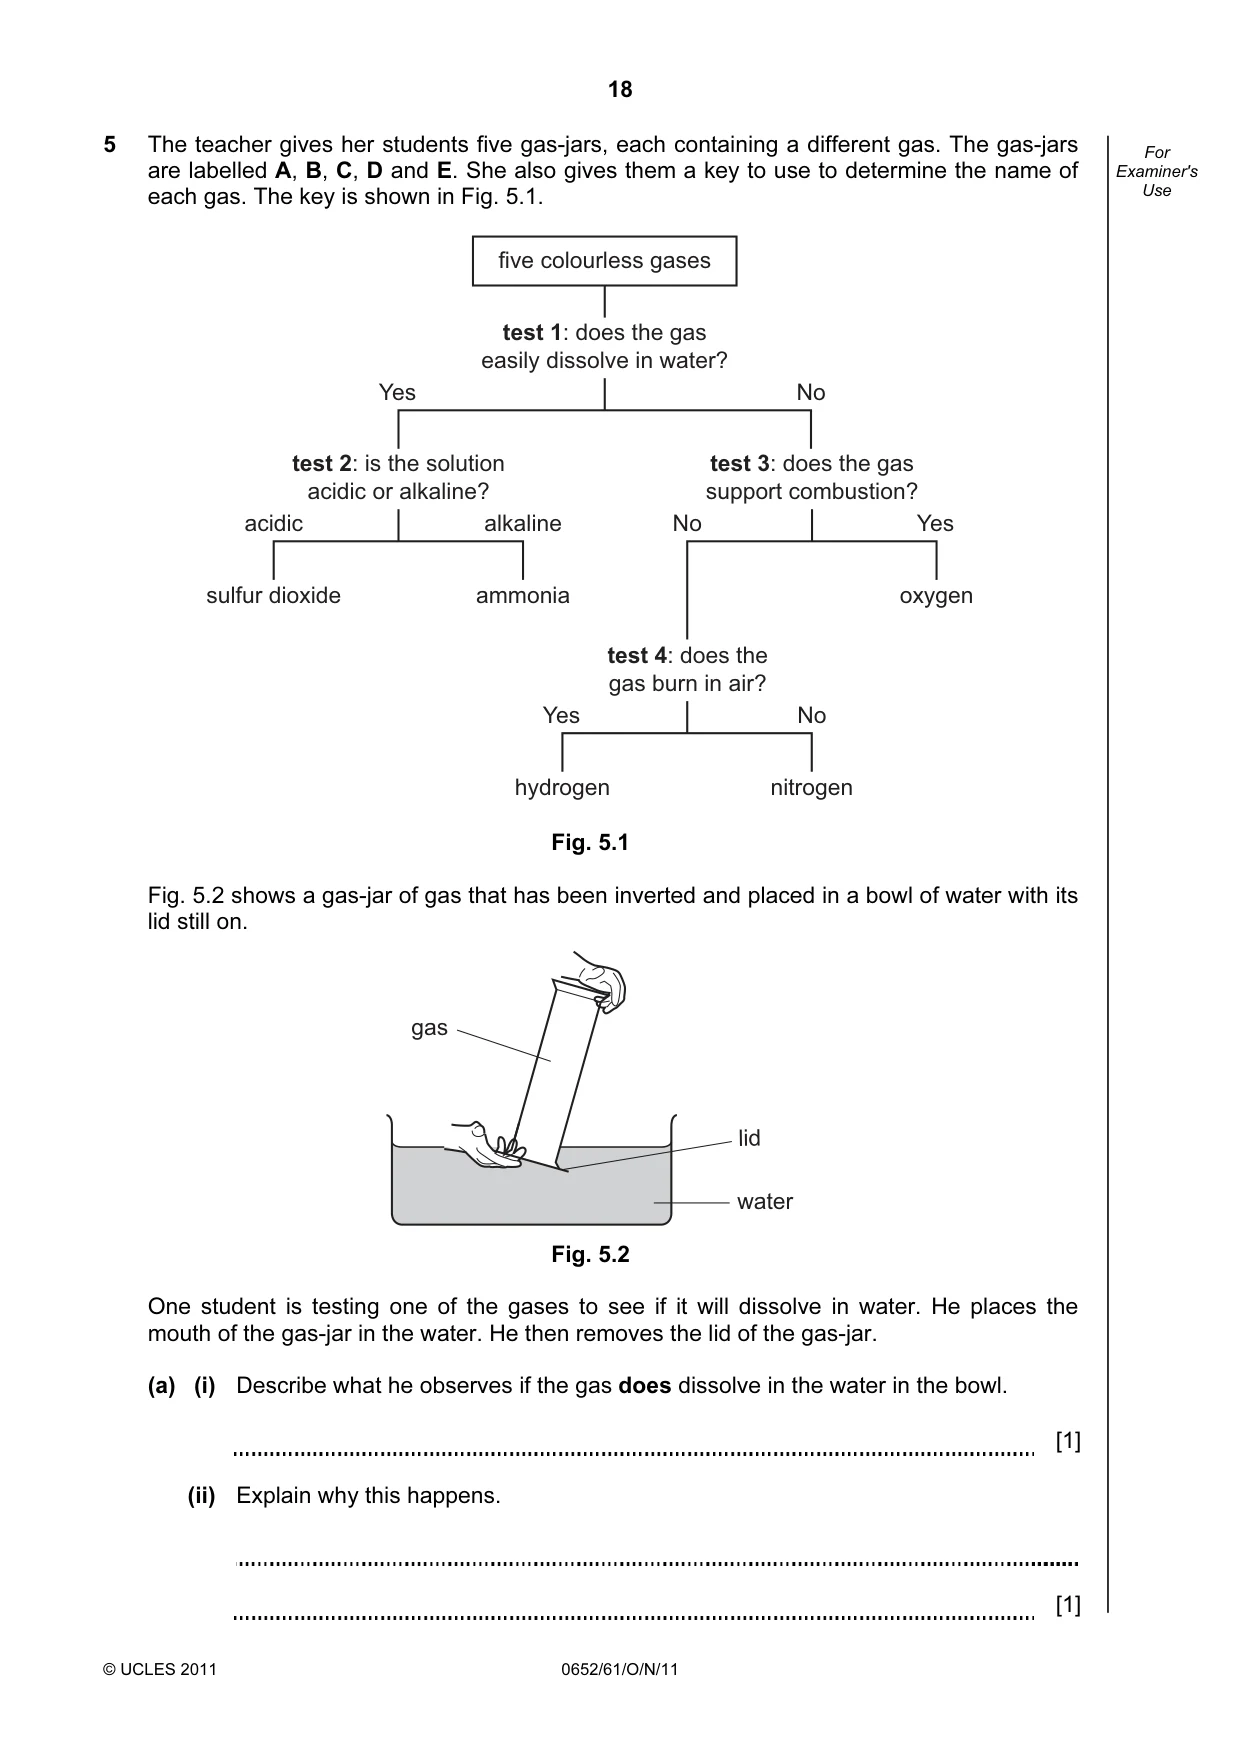
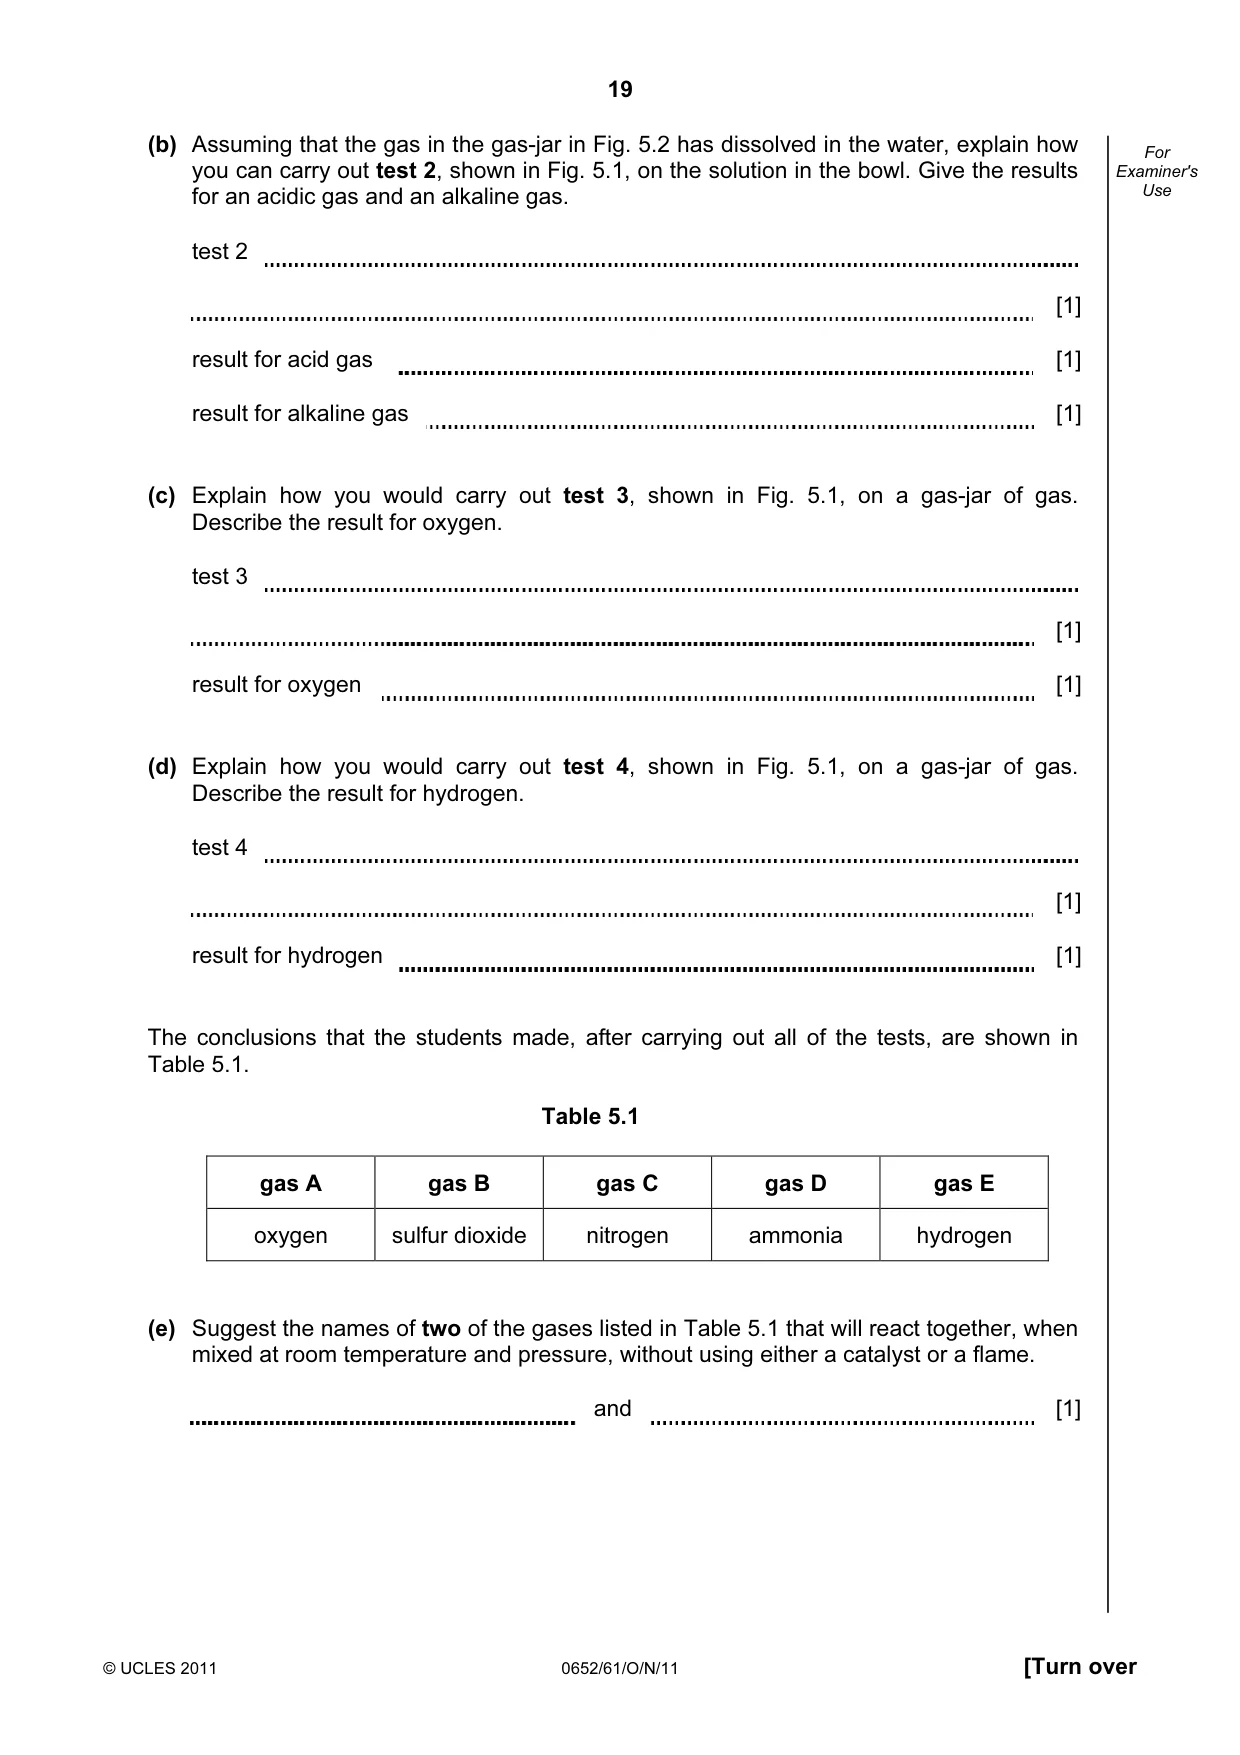
18 © UCLES 2011 0652/61/O/N/11 For Examiner's Use 5 The teacher gives her students five gas-jars, each containing a different gas. The gas-jars are labelled A, B, C, D and E. She also gives them a key to use to determine the name of each gas. The key is shown in Fig. 5.1. five colourless gases test 1: does the gas easily dissolve in water? test 2: is the solution acidic or alkaline? test 3: does the gas support combustion? test 4: does the gas burn in air? Yes No acidic alkaline sulfur dioxide ammonia Yes No hydrogen nitrogen No Yes oxygen Fig. 5.1 Fig. 5.2 shows a gas-jar of gas that has been inverted and placed in a bowl of water with its lid still on. gas water lid Fig. 5.2 One student is testing one of the gases to see if it will dissolve in water. He places the mouth of the gas-jar in the water. He then removes the lid of the gas-jar. (a) (i) Describe what he observes if the gas does dissolve in the water in the bowl. [1] (ii) Explain why this happens. [1]
Question paper, page 19
19 © UCLES 2011 0652/61/O/N/11 [Turn over For Examiner's Use (b) Assuming that the gas in the gas-jar in Fig. 5.2 has dissolved in the water, explain how you can carry out test 2, shown in Fig. 5.1, on the solution in the bowl. Give the results for an acidic gas and an alkaline gas. test 2 [1] result for acid gas [1] result for alkaline gas [1] (c) Explain how you would carry out test 3, shown in Fig. 5.1, on a gas-jar of gas. Describe the result for oxygen. test 3 [1] result for oxygen [1] (d) Explain how you would carry out test 4, shown in Fig. 5.1, on a gas-jar of gas. Describe the result for hydrogen. test 4 [1] result for hydrogen [1] The conclusions that the students made, after carrying out all of the tests, are shown in Table 5.1. Table 5.1 gas A gas B gas C gas D gas E oxygen sulfur dioxide nitrogen ammonia hydrogen (e) Suggest the names of two of the gases listed in Table 5.1 that will react together, when mixed at room temperature and pressure, without using either a catalyst or a flame. and [1]
Question paper, page 20
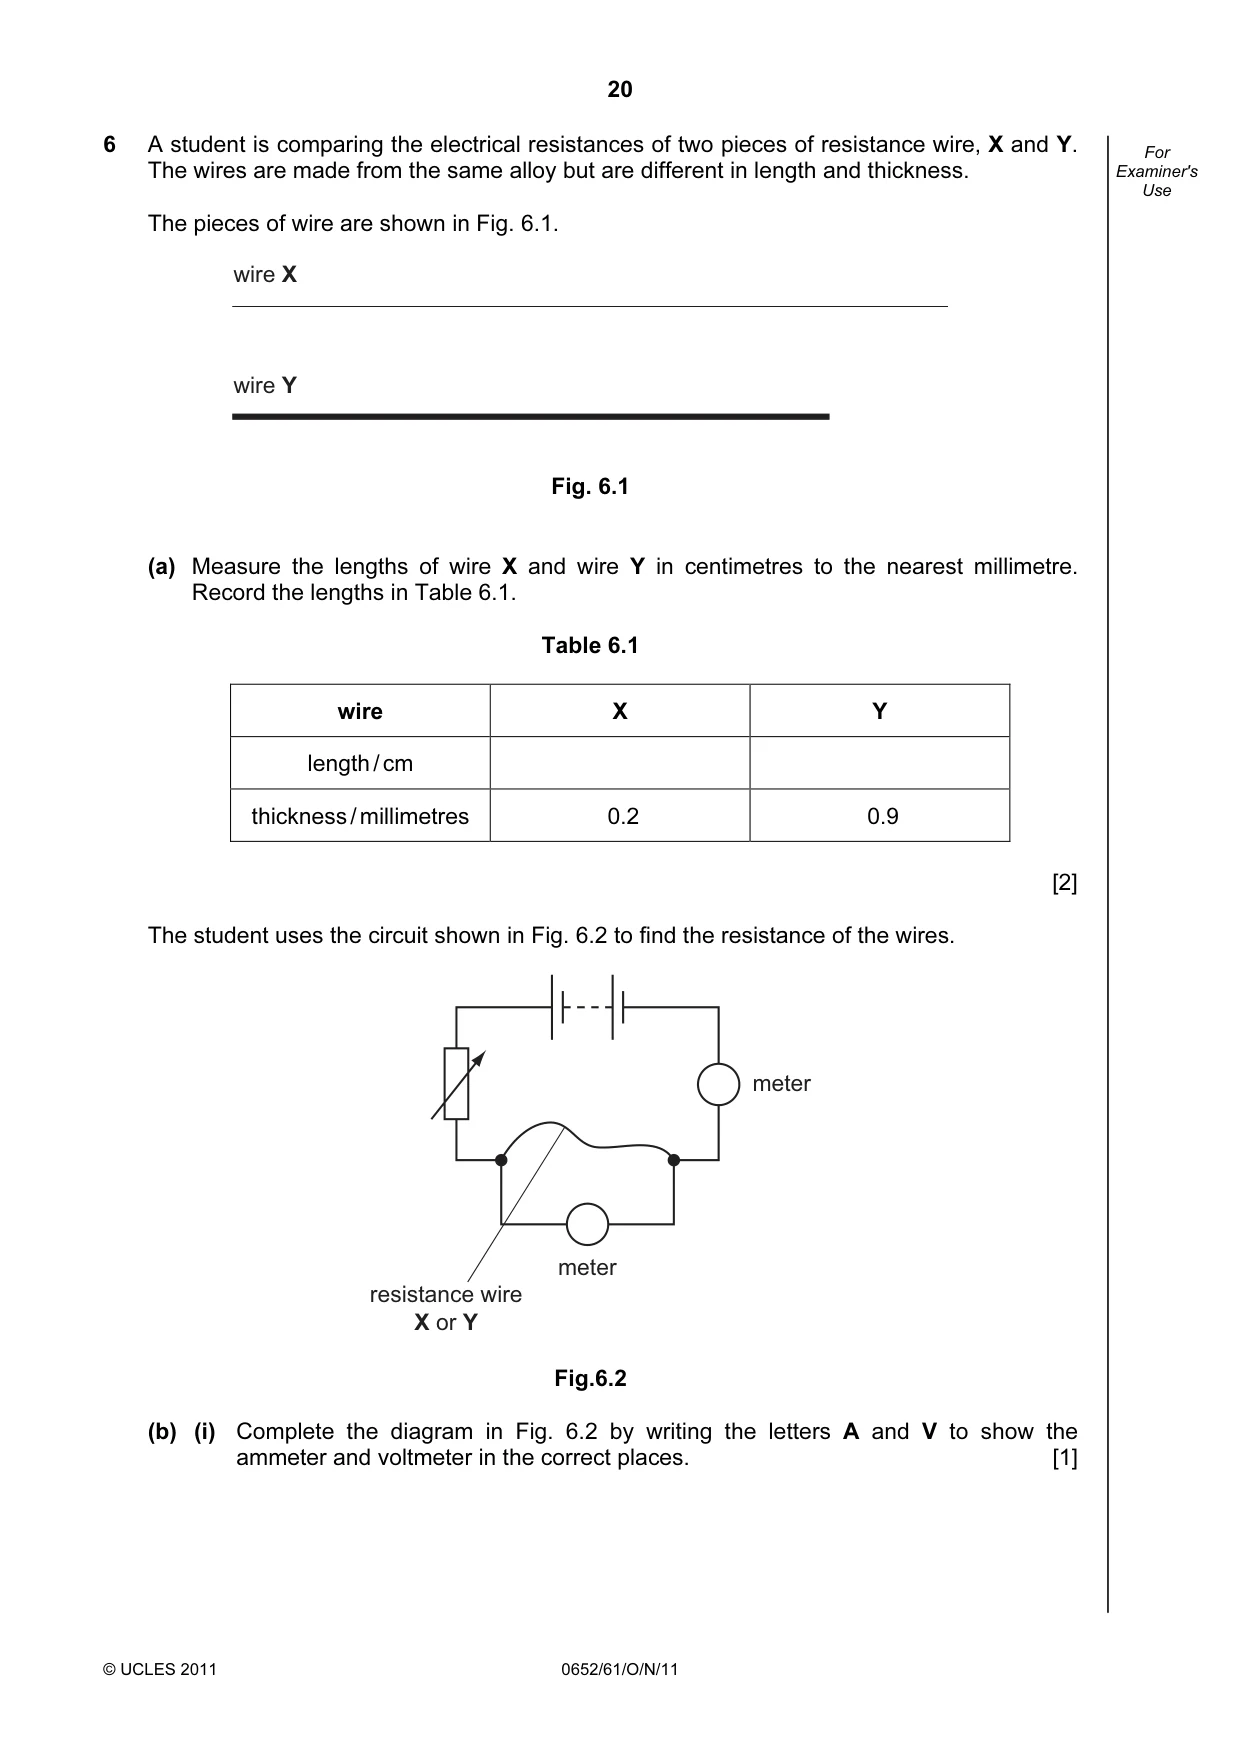
20 © UCLES 2011 0652/61/O/N/11 For Examiner's Use 6 A student is comparing the electrical resistances of two pieces of resistance wire, X and Y. The wires are made from the same alloy but are different in length and thickness. The pieces of wire are shown in Fig. 6.1. wire X wire Y Fig. 6.1 (a) Measure the lengths of wire X and wire Y in centimetres to the nearest millimetre. Record the lengths in Table 6.1. Table 6.1 wire X Y length / cm thickness / millimetres 0.2 0.9 [2] The student uses the circuit shown in Fig. 6.2 to find the resistance of the wires. meter meter resistance wire X or Y Fig.6.2 (b) (i) Complete the diagram in Fig. 6.2 by writing the letters A and V to show the ammeter and voltmeter in the correct places. [1]
Question paper, page 21
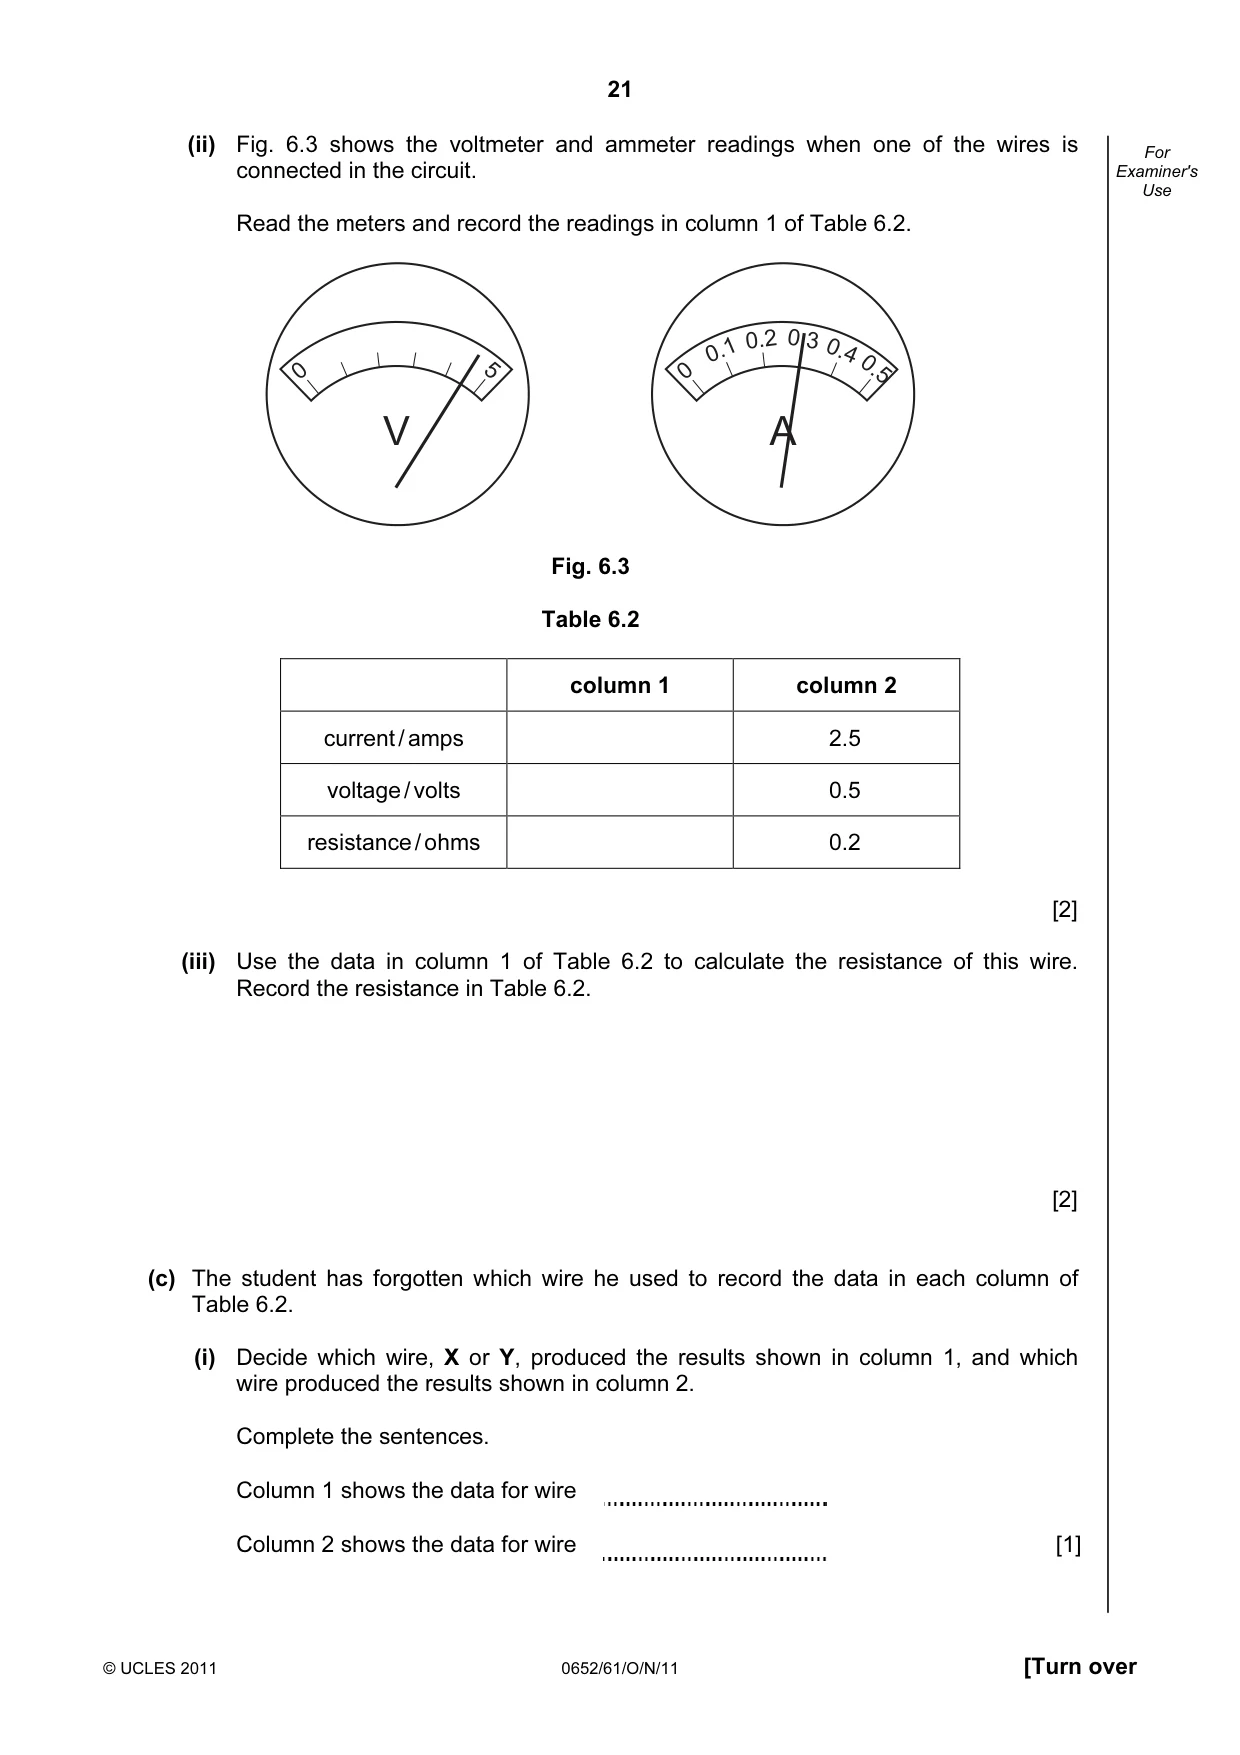
21 © UCLES 2011 0652/61/O/N/11 [Turn over For Examiner's Use (ii) Fig. 6.3 shows the voltmeter and ammeter readings when one of the wires is connected in the circuit. Read the meters and record the readings in column 1 of Table 6.2. 5 0 V 0.5 0 A 0.1 0.2 0.3 0.4 Fig. 6.3 Table 6.2 column 1 column 2 current / amps 2.5 voltage / volts 0.5 resistance / ohms 0.2 [2] (iii) Use the data in column 1 of Table 6.2 to calculate the resistance of this wire. Record the resistance in Table 6.2. [2] (c) The student has forgotten which wire he used to record the data in each column of Table 6.2. (i) Decide which wire, X or Y, produced the results shown in column 1, and which wire produced the results shown in column 2. Complete the sentences. Column 1 shows the data for wire Column 2 shows the data for wire [1]
Question paper, page 22
22 © UCLES 2011 0652/61/O/N/11 For Examiner's Use (ii) Explain your choice in (c)(i) by stating how the lengths and thicknesses of the two wires affect their electrical resistance. [2]
Question paper, page 23
23 © UCLES 2011 0652/61/O/N/11 BLANK PAGE
Question paper, page 24
24 Permission to reproduce items where third-party owned material protected by copyright is included has been sought and cleared where possible. Every reasonable effort has been made by the publisher (UCLES) to trace copyright holders, but if any items requiring clearance have unwittingly been included, the publisher will be pleased to make amends at the earliest possible opportunity. University of Cambridge International Examinations is part of the Cambridge Assessment Group. Cambridge Assessment is the brand name of University of Cambridge Local Examinations Syndicate (UCLES), which is itself a department of the University of Cambridge. © UCLES 2011 0652/61/O/N/11 BLANK PAGE
Mark scheme, page 1
UNIVERSITY OF CAMBRIDGE INTERNATIONAL EXAMINATIONS International General Certificate of Secondary Education MARK SCHEME for the October/November 2011 question paper for the guidance of teachers 0652 PHYSICAL SCIENCE 0652/61 Paper 6 (Alternative to Practical), maximum raw mark 60 This mark scheme is published as an aid to teachers and candidates, to indicate the requirements of the examination. It shows the basis on which Examiners were instructed to award marks. It does not indicate the details of the discussions that took place at an Examiners’ meeting before marking began, which would have considered the acceptability of alternative answers. Mark schemes must be read in conjunction with the question papers and the report on the examination. • Cambridge will not enter into discussions or correspondence in connection with these mark schemes. Cambridge is publishing the mark schemes for the October/November 2011 question papers for most IGCSE, GCE Advanced Level and Advanced Subsidiary Level syllabuses and some Ordinary Level syllabuses.
Mark scheme, page 2
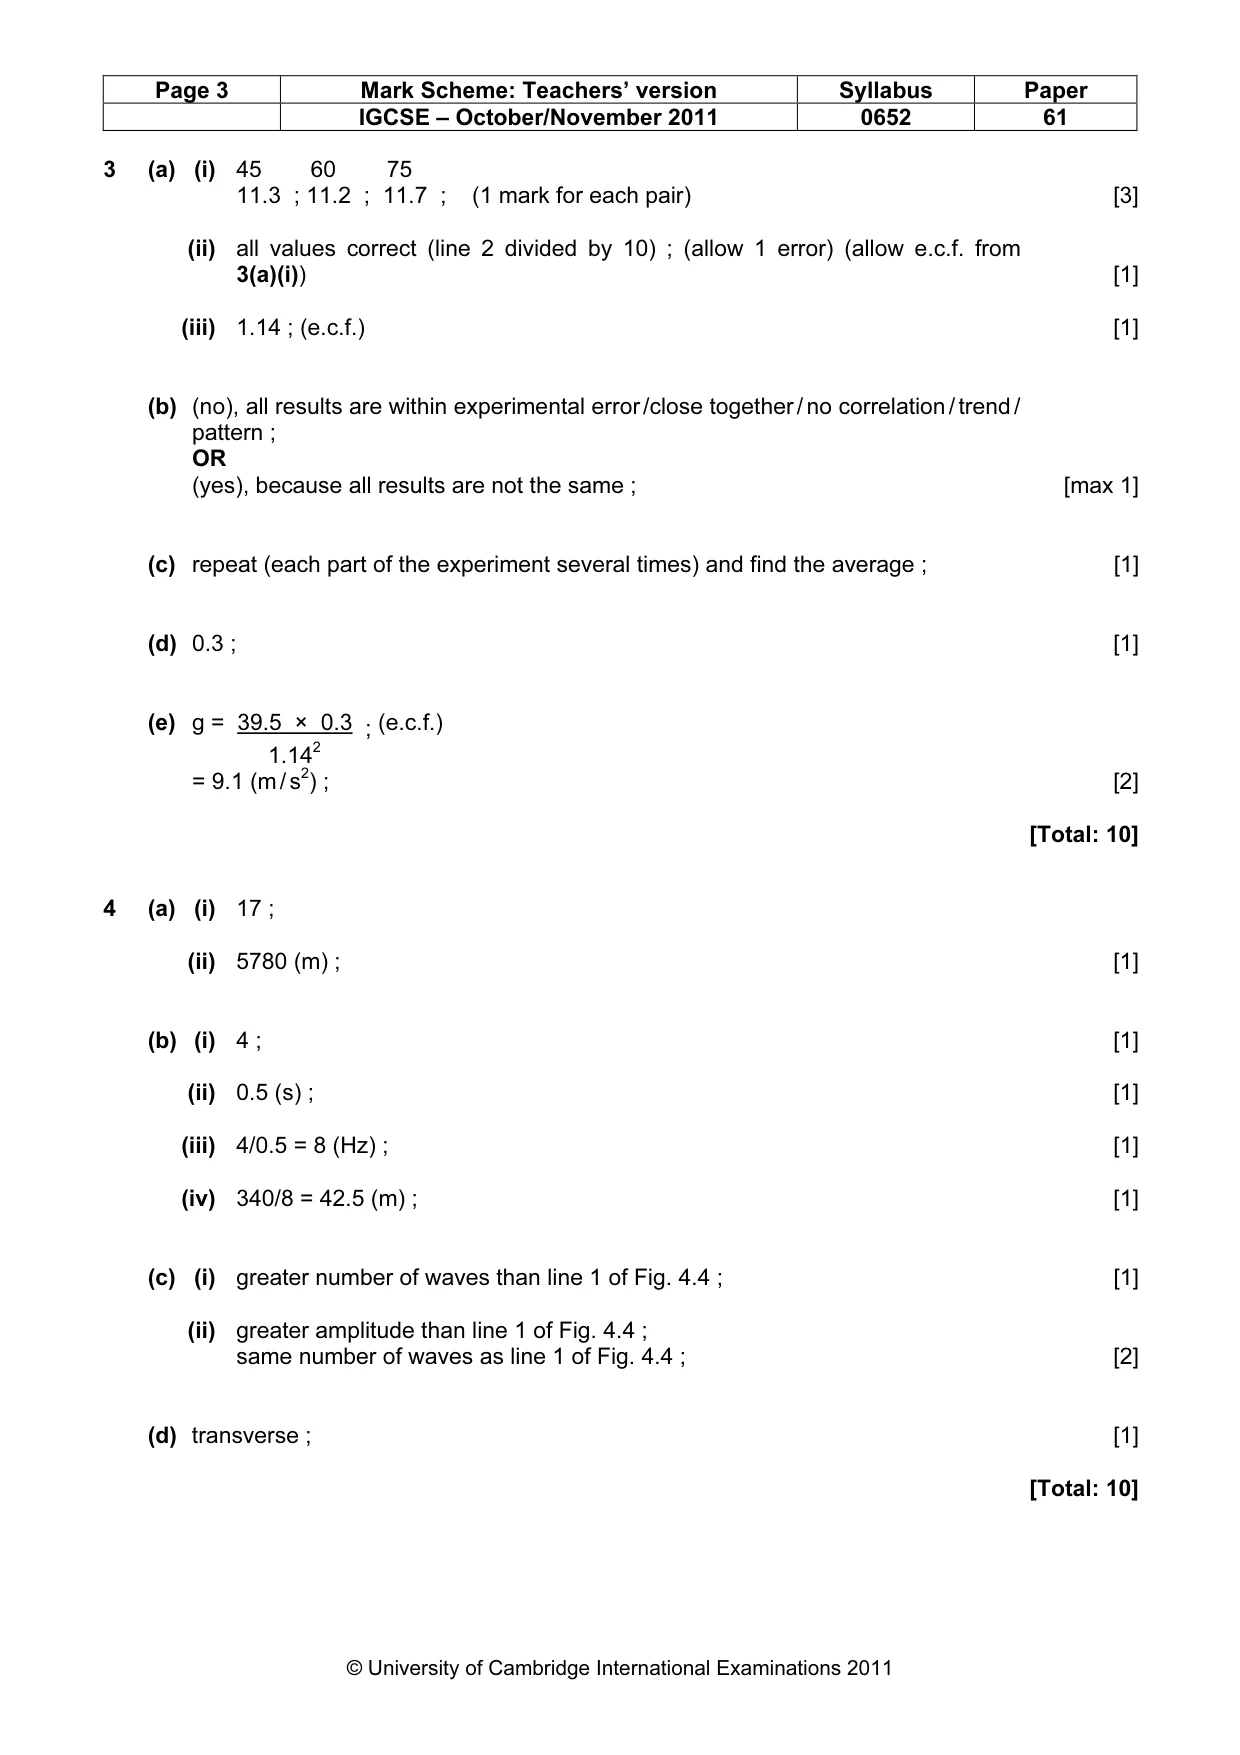
Page 2 Mark Scheme: Teachers’ version Syllabus Paper IGCSE – October/November 2011 0652 61 © University of Cambridge International Examinations 2011 1 (a) Q ; [1] (b) ammeter, cell and battery in series ; voltmeter in parallel with cell ; polarities correct ; [3] (c) A = 0.55 (A) ; B = 0.3(0) (V) ; [2] (d) (i) movement of (named) ions ; (ignore electrons) [1] (ii) more (greater concentration) of ions present ; (reject: greater concentration of copper chloride soln.) [1] (e) (i) cathode: red / brown / pink solid deposit ; [1] (ii) anode ; bubbles / effervescence / fizzing ; [1] [Total: 10] 2 (a) (i) 37 s ; 52 s ; 19 s ; (no tolerance) [3] (ii) C A B (correct order) ; [1] (b) (i) filter funnel showing filter paper and vessel to collect filtrate ; (labels not required) [1] (ii) copper hydroxide ; [1] (iii) copper oxide ; [1] (c) more bubbles from magnesium than from zinc ; no bubbles from metal X ; [2] (d) the carbonate of the more reactive metal does not decompose as easily / owtte ; [1] [Total: 10]
Mark scheme, page 3
Page 3 Mark Scheme: Teachers’ version Syllabus Paper IGCSE – October/November 2011 0652 61 © University of Cambridge International Examinations 2011 3 (a) (i) 45 60 75 11.3 ; 11.2 ; 11.7 ; (1 mark for each pair) [3] (ii) all values correct (line 2 divided by 10) ; (allow 1 error) (allow e.c.f. from 3(a)(i)) [1] (iii) 1.14 ; (e.c.f.) [1] (b) (no), all results are within experimental error /close together / no correlation / trend / pattern ; OR (yes), because all results are not the same ; [max 1] (c) repeat (each part of the experiment several times) and find the average ; [1] (d) 0.3 ; [1] (e) g = 39.5 × 0.3 ; (e.c.f.) 1.142 = 9.1 (m / s2) ; [2] [Total: 10] 4 (a) (i) 17 ; (ii) 5780 (m) ; [1] (b) (i) 4 ; [1] (ii) 0.5 (s) ; [1] (iii) 4/0.5 = 8 (Hz) ; [1] (iv) 340/8 = 42.5 (m) ; [1] (c) (i) greater number of waves than line 1 of Fig. 4.4 ; [1] (ii) greater amplitude than line 1 of Fig. 4.4 ; same number of waves as line 1 of Fig. 4.4 ; [2] (d) transverse ; [1] [Total: 10]
Mark scheme, page 4
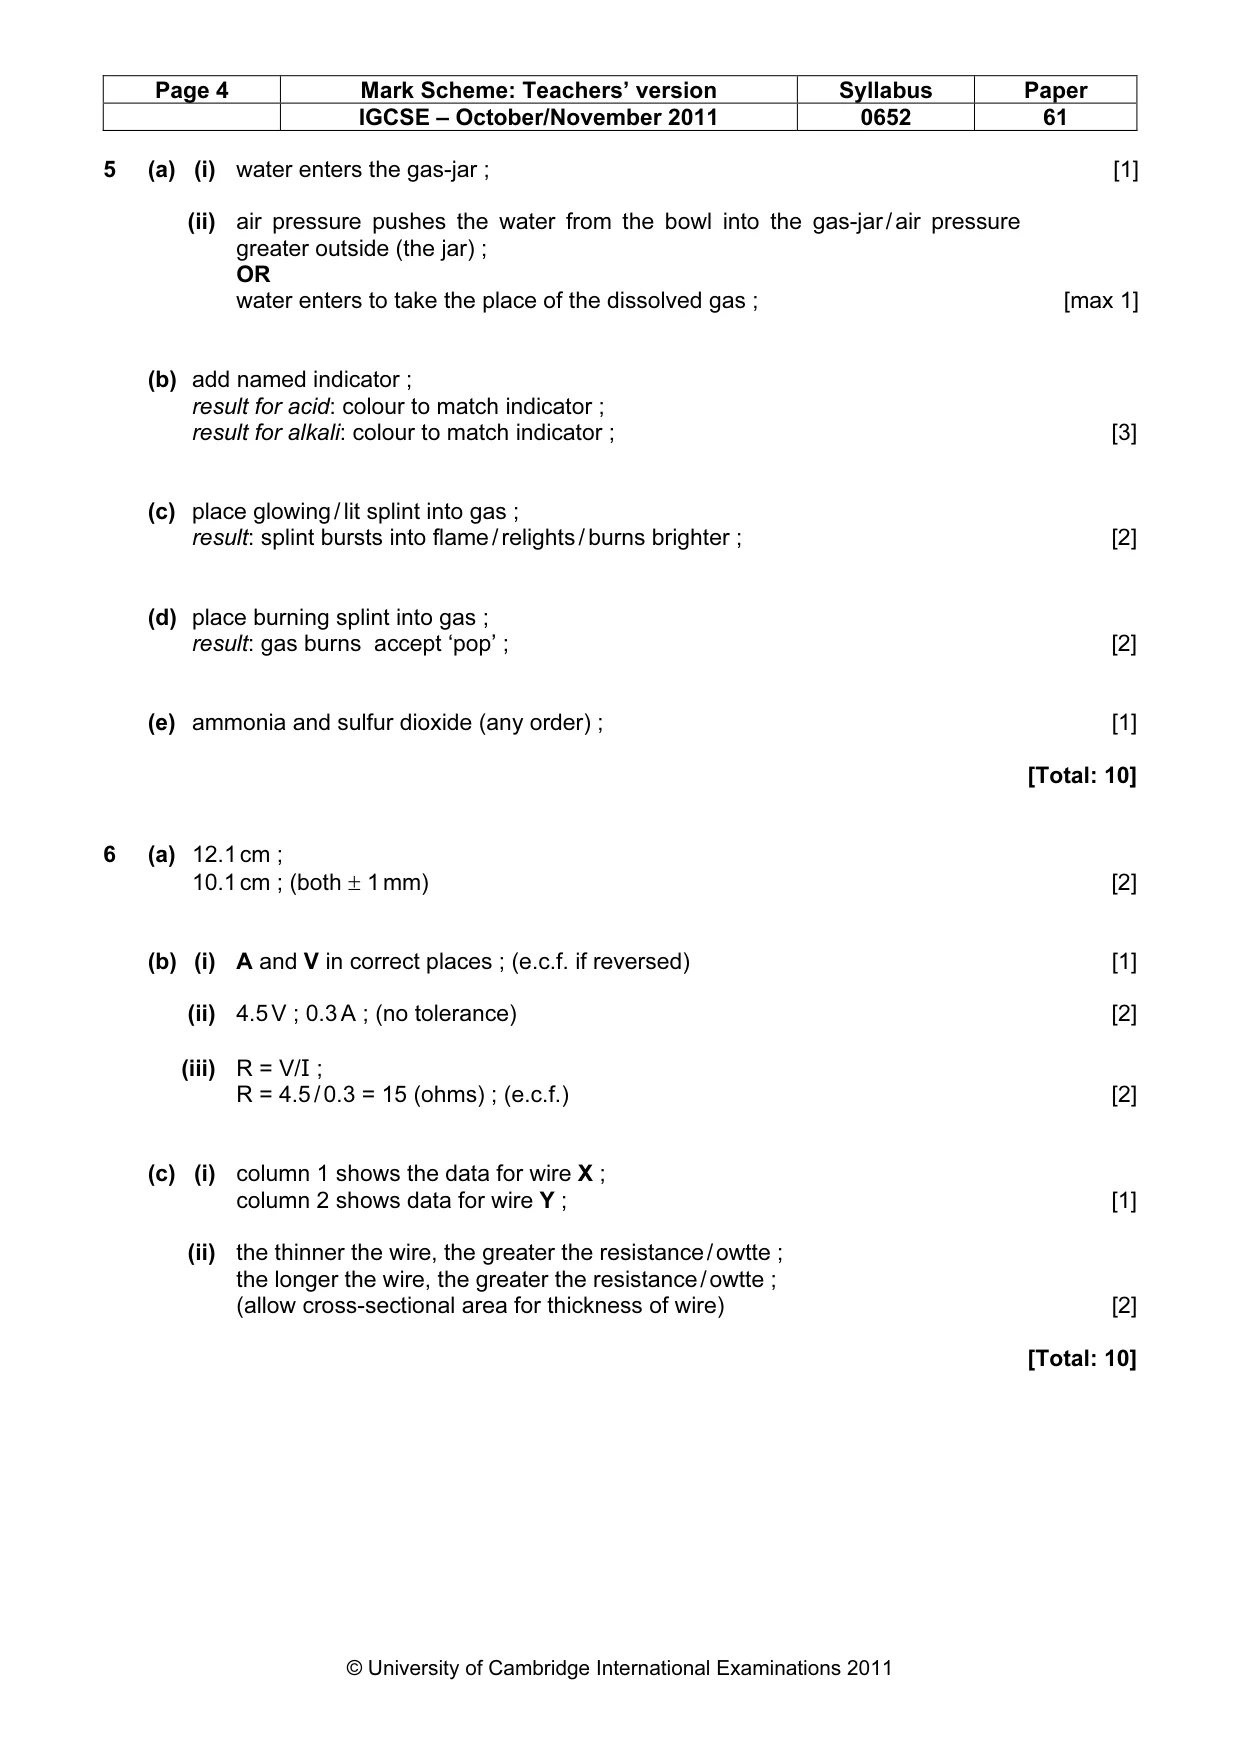
Page 4 Mark Scheme: Teachers’ version Syllabus Paper IGCSE – October/November 2011 0652 61 © University of Cambridge International Examinations 2011 5 (a) (i) water enters the gas-jar ; [1] (ii) air pressure pushes the water from the bowl into the gas-jar / air pressure greater outside (the jar) ; OR water enters to take the place of the dissolved gas ; [max 1] (b) add named indicator ; result for acid: colour to match indicator ; result for alkali: colour to match indicator ; [3] (c) place glowing / lit splint into gas ; result: splint bursts into flame / relights / burns brighter ; [2] (d) place burning splint into gas ; result: gas burns accept ‘pop’ ; [2] (e) ammonia and sulfur dioxide (any order) ; [1] [Total: 10] 6 (a) 12.1 cm ; 10.1 cm ; (both ± 1 mm) [2] (b) (i) A and V in correct places ; (e.c.f. if reversed) [1] (ii) 4.5 V ; 0.3 A ; (no tolerance) [2] (iii) R = V/I ; R = 4.5 / 0.3 = 15 (ohms) ; (e.c.f.) [2] (c) (i) column 1 shows the data for wire X ; column 2 shows data for wire Y ; [1] (ii) the thinner the wire, the greater the resistance / owtte ; the longer the wire, the greater the resistance / owtte ; (allow cross-sectional area for thickness of wire) [2] [Total: 10]
What you needed in this session
Cambridge’s own grade thresholds for 2011 Oct/Nov, Paper 6 · Variant 1. A higher threshold means an easier paper — the bar moves with how the cohort did.