Cambridge IGCSE Physical Science 0652 — 2005 Oct/Nov Paper 6 · Variant 1
0652/61/O/N/05
The question paper and its mark scheme, free to read here and free to download. This is Cambridge’s own paper, exactly as it was sat.
Question paper16 pages
Mark scheme4 pages
Answers below. Sit the paper first if you are practising.
Paper as text
Question paper, page 1
Centre Number Candidate Number Name UNIVERSITY OF CAMBRIDGE INTERNATIONAL EXAMINATIONS International General Certificate of Secondary Education PHYSICAL SCIENCE 0652/06 Paper 6 Alternative to Practical October/November 2005 1 hour Candidates answer on the Question Paper. No Additional Materials required. READ THESE INSTRUCTIONS FIRST Write your Centre number, candidate number and name on all the work you hand in. Write in dark blue or black pen in the spaces provided on the Question Paper. You may use a soft pencil for any diagrams, graphs or rough working. Do not use staples, paper clips, highlighters, glue or correction fluid. Answer all questions. The number of marks is given in brackets [ ] at the end of each question or part question. For Examiner’s Use 1 2 3 4 5 6 Total This document consists of 14 printed pages and 2 blank pages. IB05 11_0652_06/2RP UCLES 2005 [Turn over If you have been given a label, look at the details. If any details are incorrect or missing, please fill in your correct details in the space given at the top of this page. Stick your personal label here, if provided. www.XtremePapers.com
Question paper, page 2
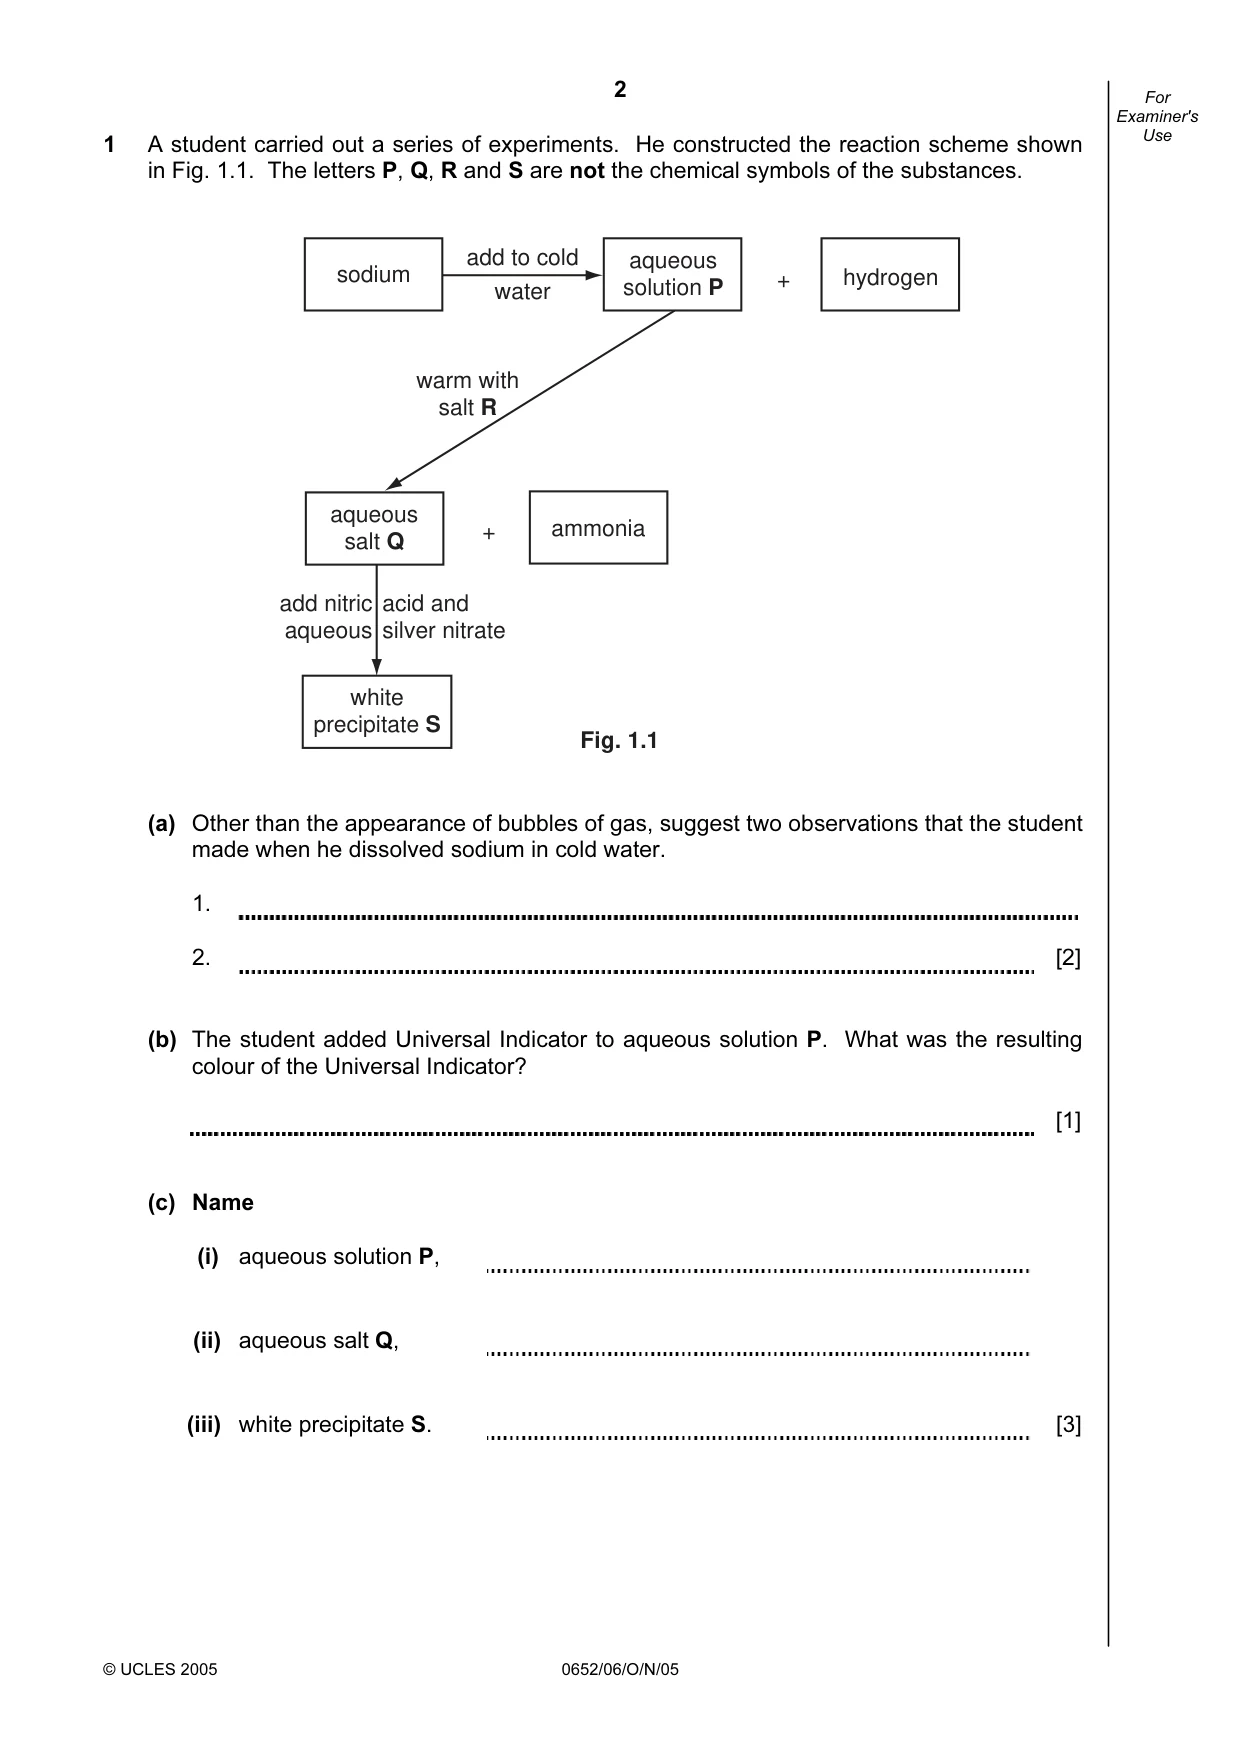
2 © UCLES 2005 0652/06/O/N/05 For Examiner's Use 1 A student carried out a series of experiments. He constructed the reaction scheme shown in Fig. 1.1. The letters P, Q, R and S are not the chemical symbols of the substances. sodium add to cold water aqueous solution P + hydrogen warm with salt R aqueous salt Q + ammonia white precipitate S Fig. 1.1 add nitric aqueous acid and silver nitrate (a) Other than the appearance of bubbles of gas, suggest two observations that the student made when he dissolved sodium in cold water. 1. 2. [2] (b) The student added Universal Indicator to aqueous solution P. What was the resulting colour of the Universal Indicator? [1] (c) Name (i) aqueous solution P, (ii) aqueous salt Q, (iii) white precipitate S. [3]
Question paper, page 3
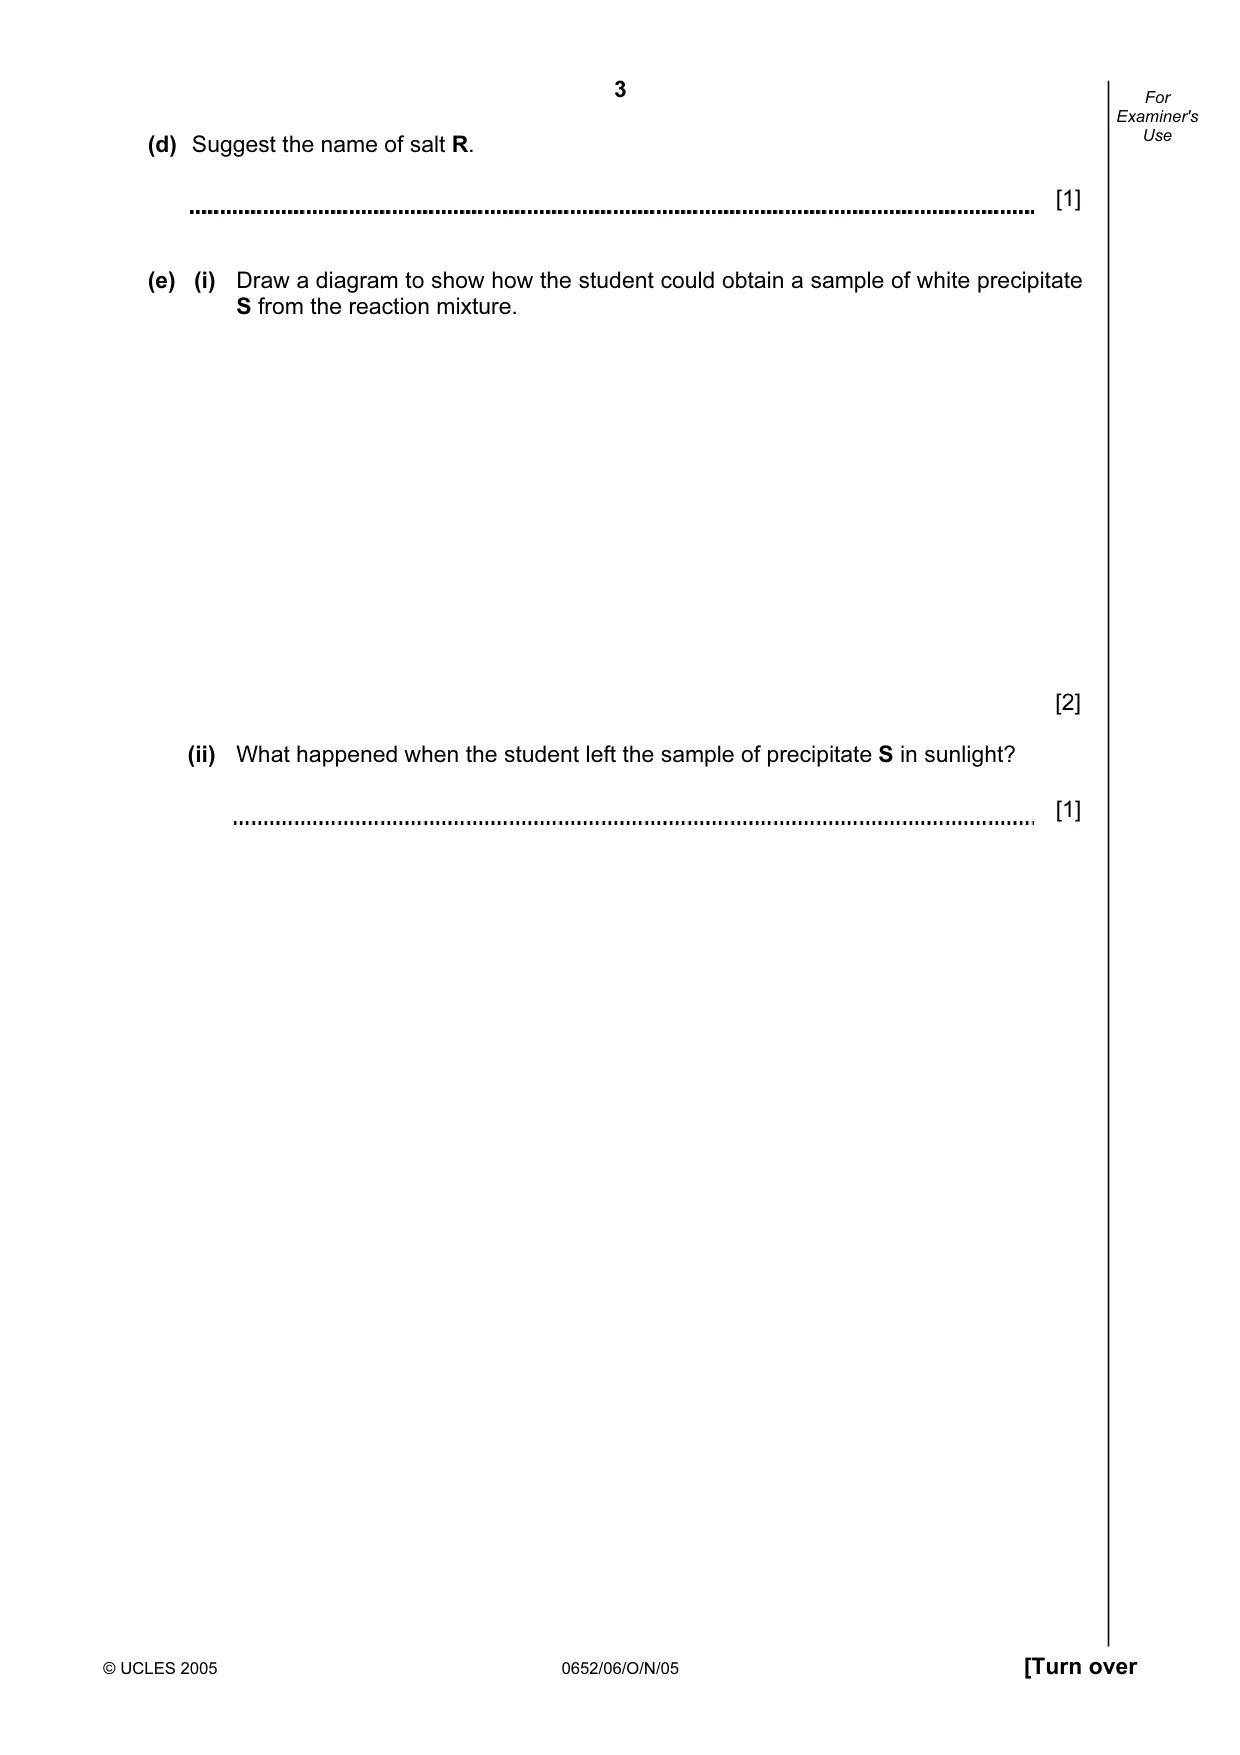
3 © UCLES 2005 0652/06/O/N/05 [Turn over For Examiner's Use (d) Suggest the name of salt R. [1] (e) (i) Draw a diagram to show how the student could obtain a sample of white precipitate S from the reaction mixture. [2] (ii) What happened when the student left the sample of precipitate S in sunlight? [1]
Question paper, page 4
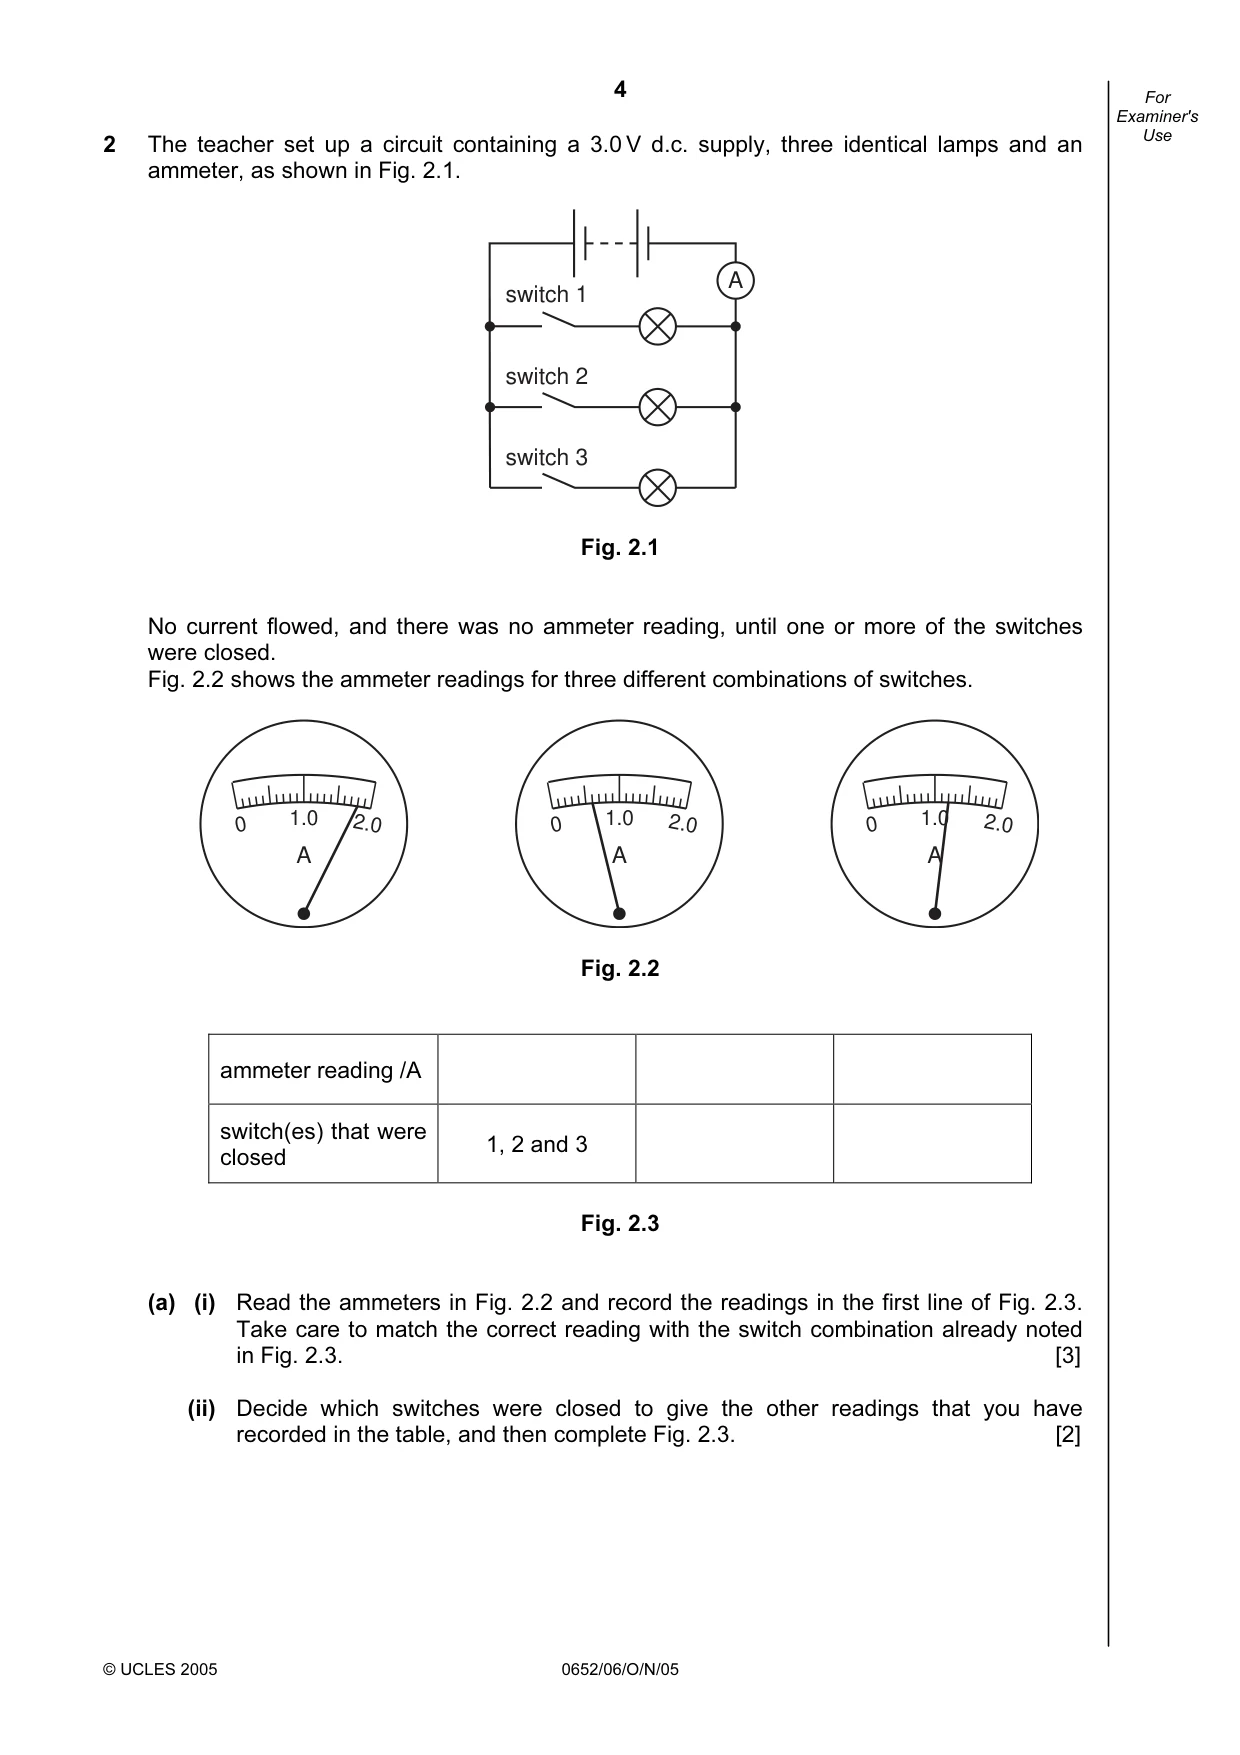
4 © UCLES 2005 0652/06/O/N/05 For Examiner's Use 2 The teacher set up a circuit containing a 3.0 V d.c. supply, three identical lamps and an ammeter, as shown in Fig. 2.1. switch 1 switch 2 switch 3 A Fig. 2.1 No current flowed, and there was no ammeter reading, until one or more of the switches were closed. Fig. 2.2 shows the ammeter readings for three different combinations of switches. A 0 1.0 2.0 A 0 1.0 2.0 A 0 1.0 2.0 Fig. 2.2 ammeter reading /A switch(es) that were closed 1, 2 and 3 Fig. 2.3 (a) (i) Read the ammeters in Fig. 2.2 and record the readings in the first line of Fig. 2.3. Take care to match the correct reading with the switch combination already noted in Fig. 2.3. [3] (ii) Decide which switches were closed to give the other readings that you have recorded in the table, and then complete Fig. 2.3. [2]
Question paper, page 5
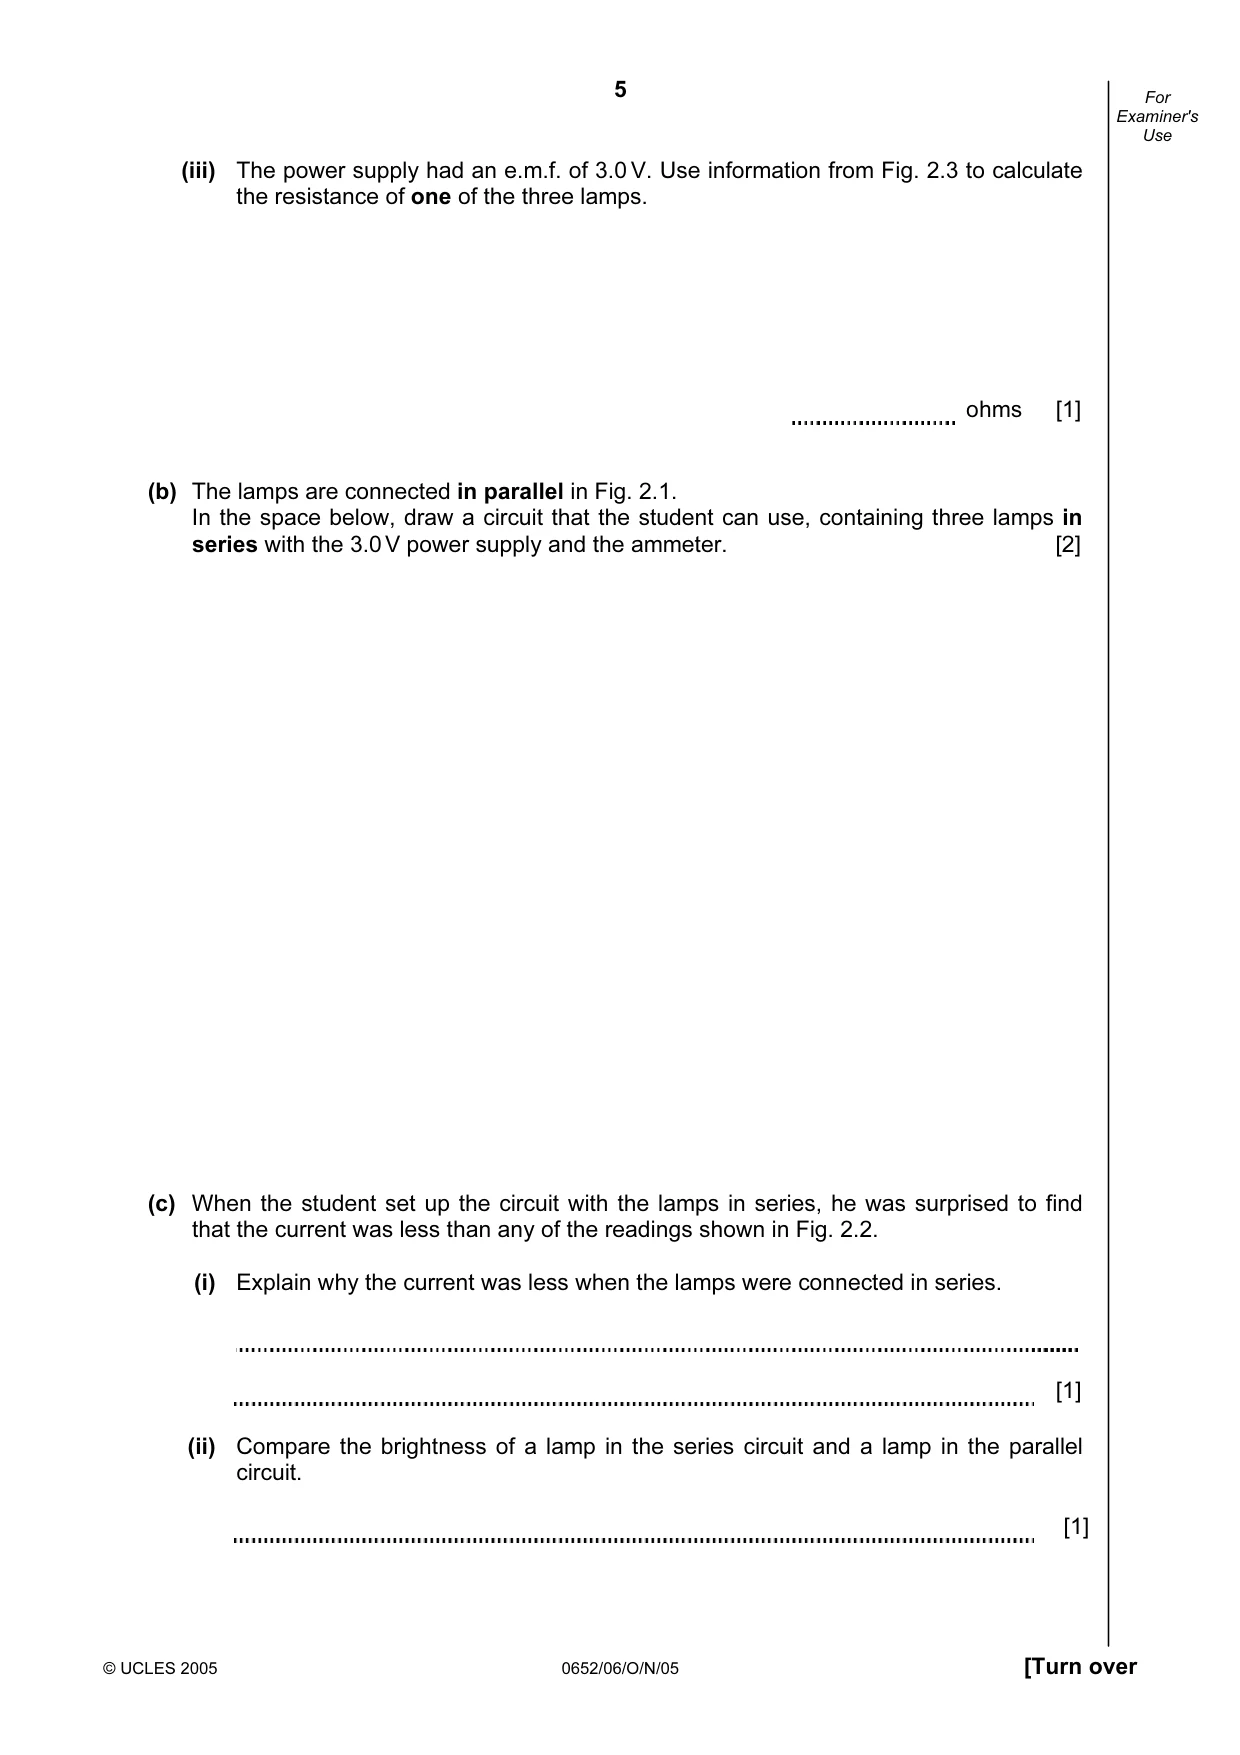
5 © UCLES 2005 0652/06/O/N/05 [Turn over For Examiner's Use (iii) The power supply had an e.m.f. of 3.0 V. Use information from Fig. 2.3 to calculate the resistance of one of the three lamps. ohms [1] (b) The lamps are connected in parallel in Fig. 2.1. In the space below, draw a circuit that the student can use, containing three lamps in series with the 3.0 V power supply and the ammeter. [2] (c) When the student set up the circuit with the lamps in series, he was surprised to find that the current was less than any of the readings shown in Fig. 2.2. (i) Explain why the current was less when the lamps were connected in series. [1] (ii) Compare the brightness of a lamp in the series circuit and a lamp in the parallel circuit. [1]
Question paper, page 6
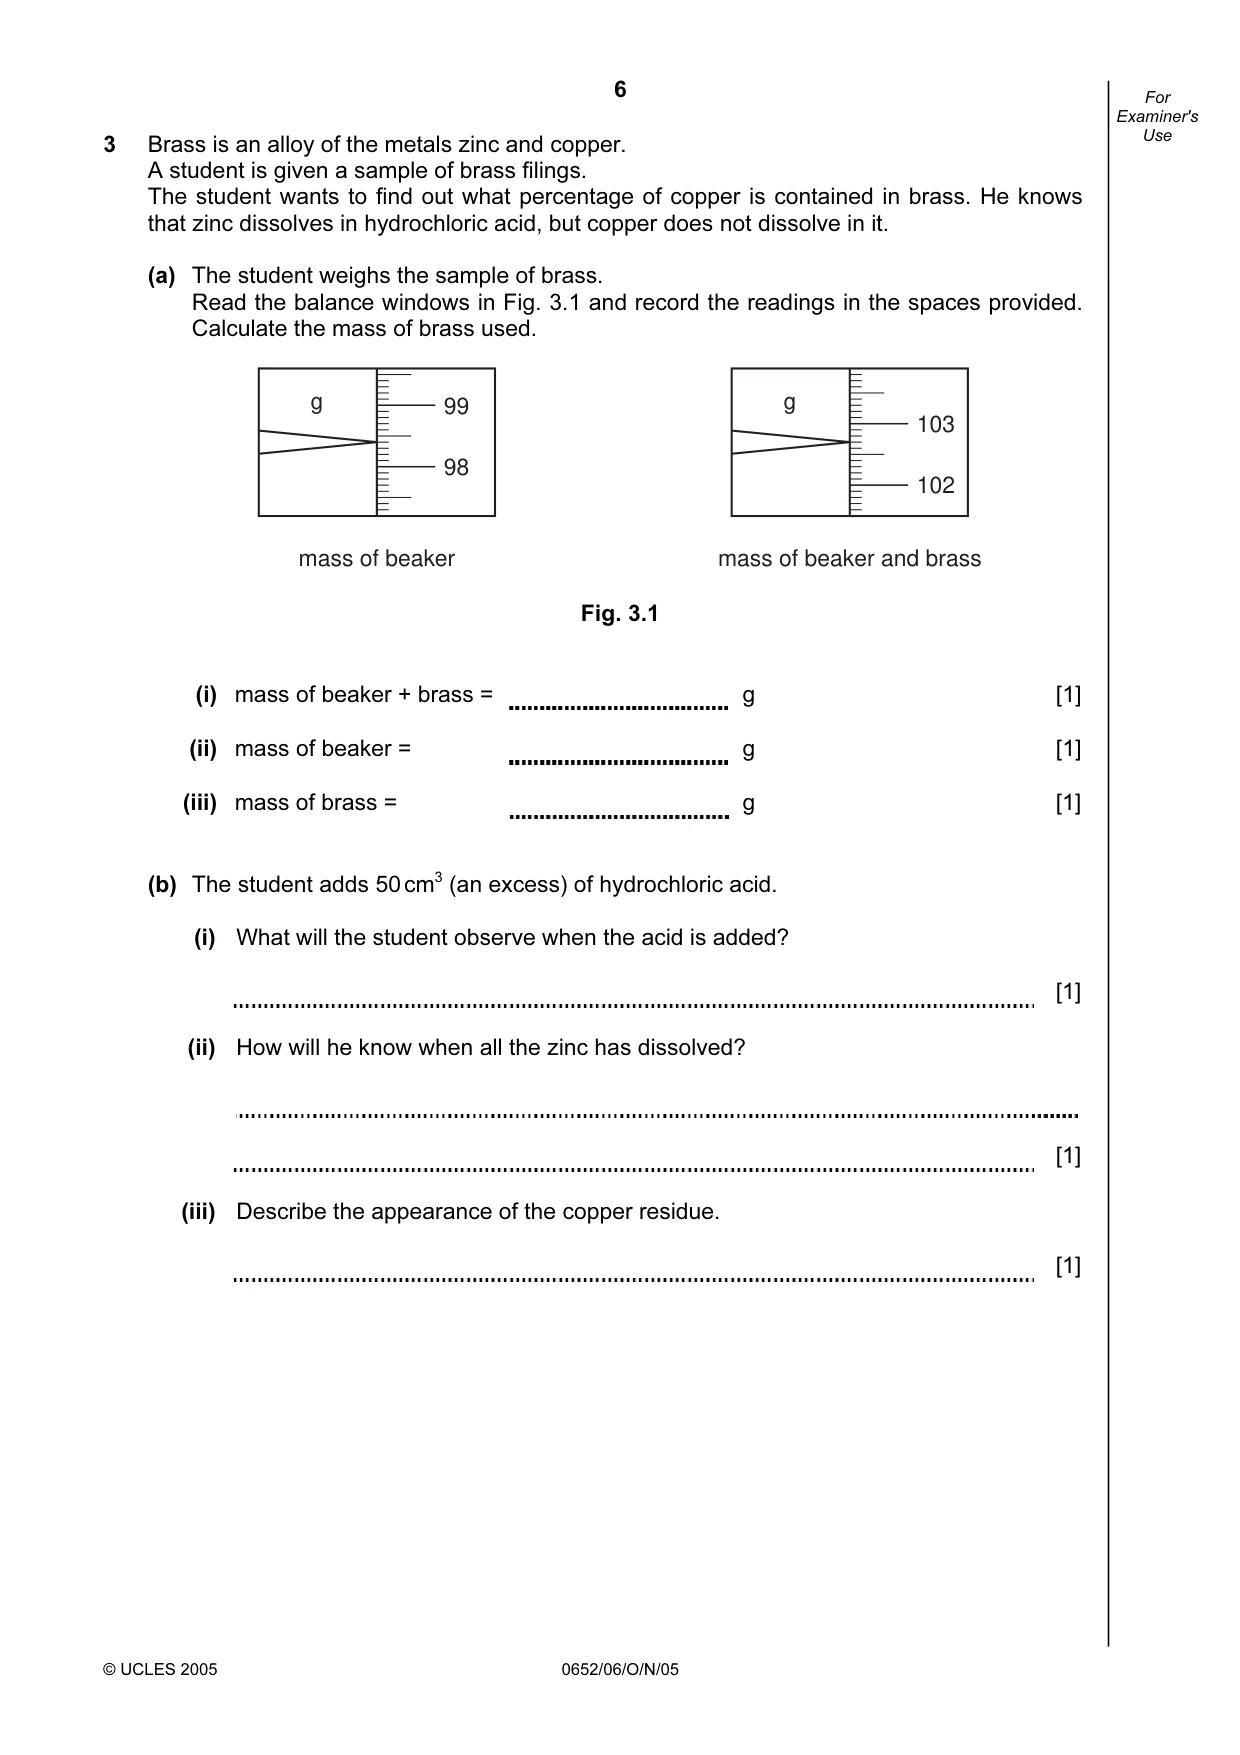
6 © UCLES 2005 0652/06/O/N/05 For Examiner's Use 3 Brass is an alloy of the metals zinc and copper. A student is given a sample of brass filings. The student wants to find out what percentage of copper is contained in brass. He knows that zinc dissolves in hydrochloric acid, but copper does not dissolve in it. (a) The student weighs the sample of brass. Read the balance windows in Fig. 3.1 and record the readings in the spaces provided. Calculate the mass of brass used. 99 98 103 102 mass of beaker g mass of beaker and brass g Fig. 3.1 (i) mass of beaker + brass = g [1] (ii) mass of beaker = g [1] (iii) mass of brass = g [1] (b) The student adds 50 cm3 (an excess) of hydrochloric acid. (i) What will the student observe when the acid is added? [1] (ii) How will he know when all the zinc has dissolved? [1] (iii) Describe the appearance of the copper residue. [1]
Question paper, page 7
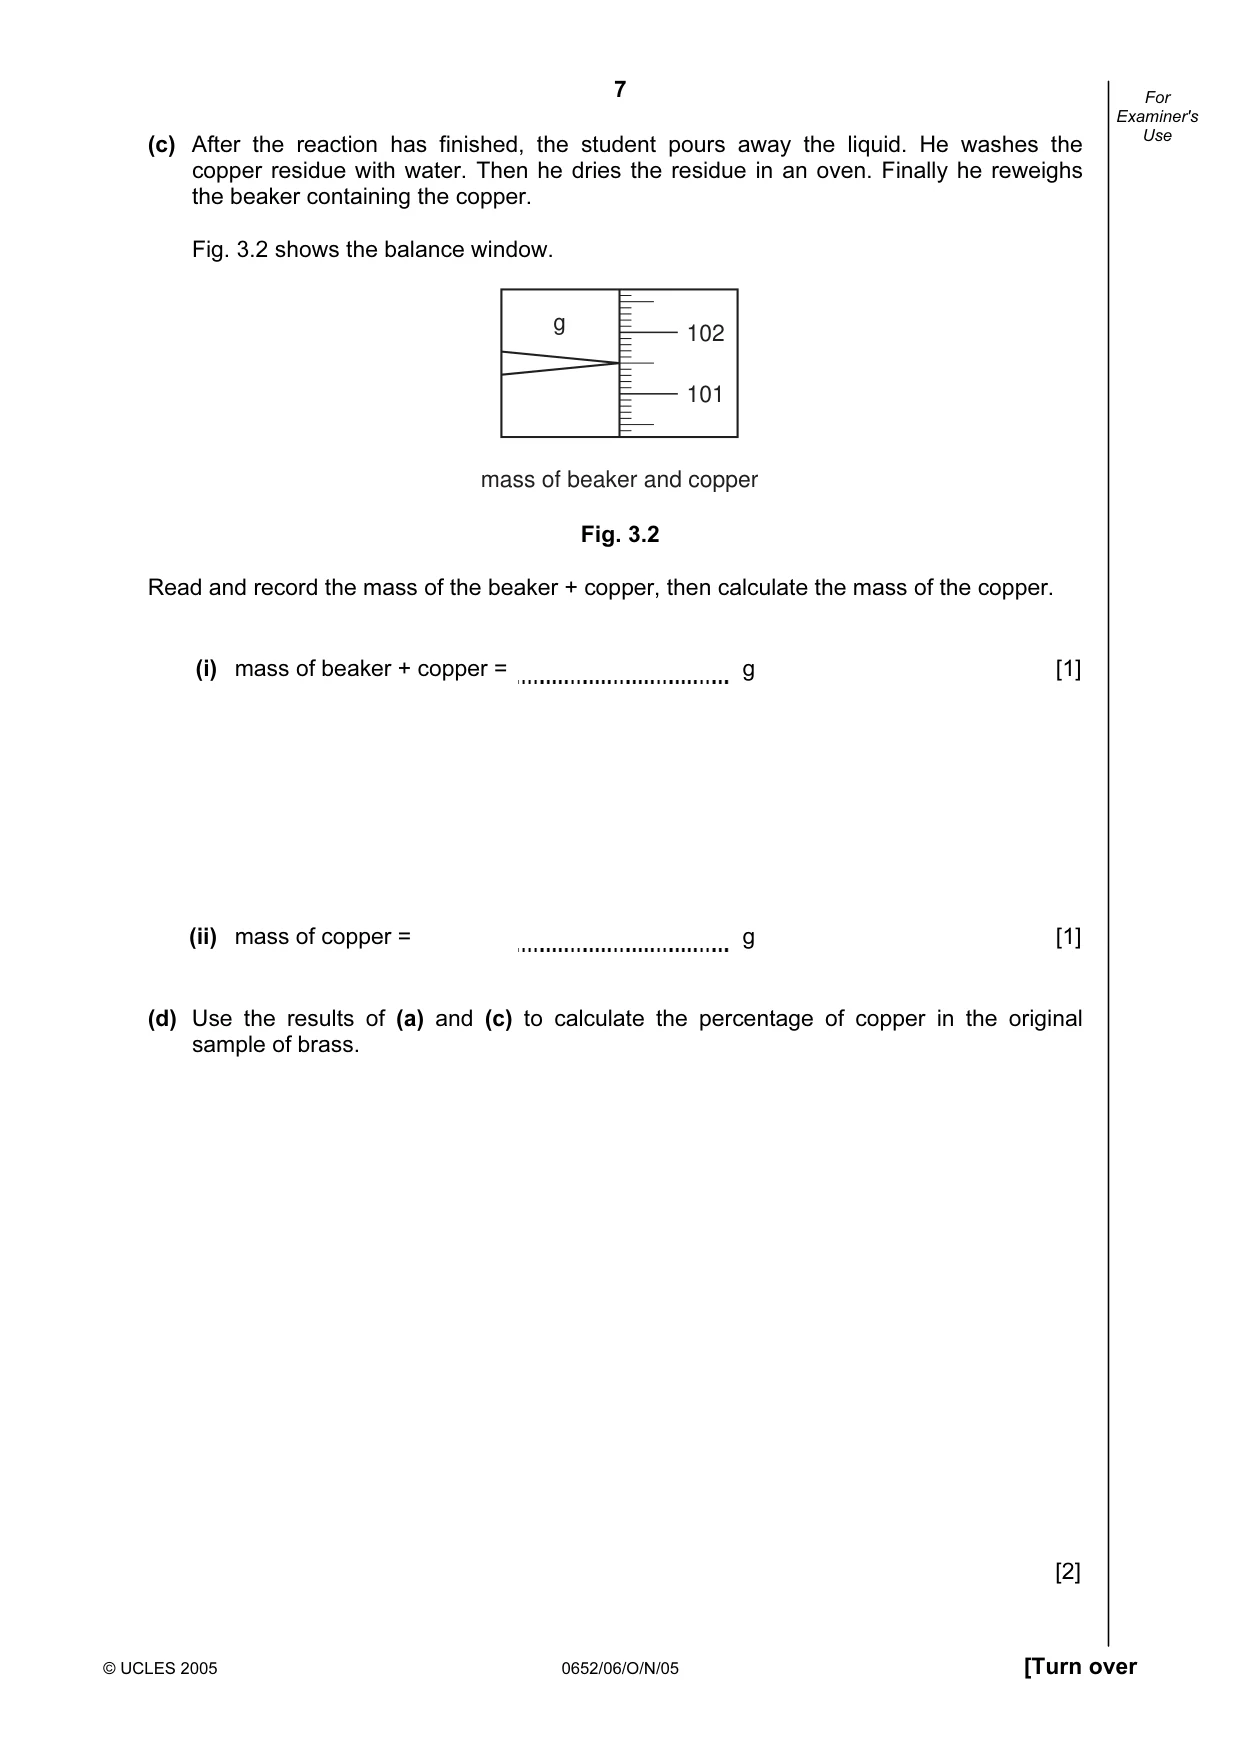
7 © UCLES 2005 0652/06/O/N/05 [Turn over For Examiner's Use (c) After the reaction has finished, the student pours away the liquid. He washes the copper residue with water. Then he dries the residue in an oven. Finally he reweighs the beaker containing the copper. Fig. 3.2 shows the balance window. 102 101 mass of beaker and copper g Fig. 3.2 Read and record the mass of the beaker + copper, then calculate the mass of the copper. (i) mass of beaker + copper = g [1] (ii) mass of copper = g [1] (d) Use the results of (a) and (c) to calculate the percentage of copper in the original sample of brass. [2]
Question paper, page 8
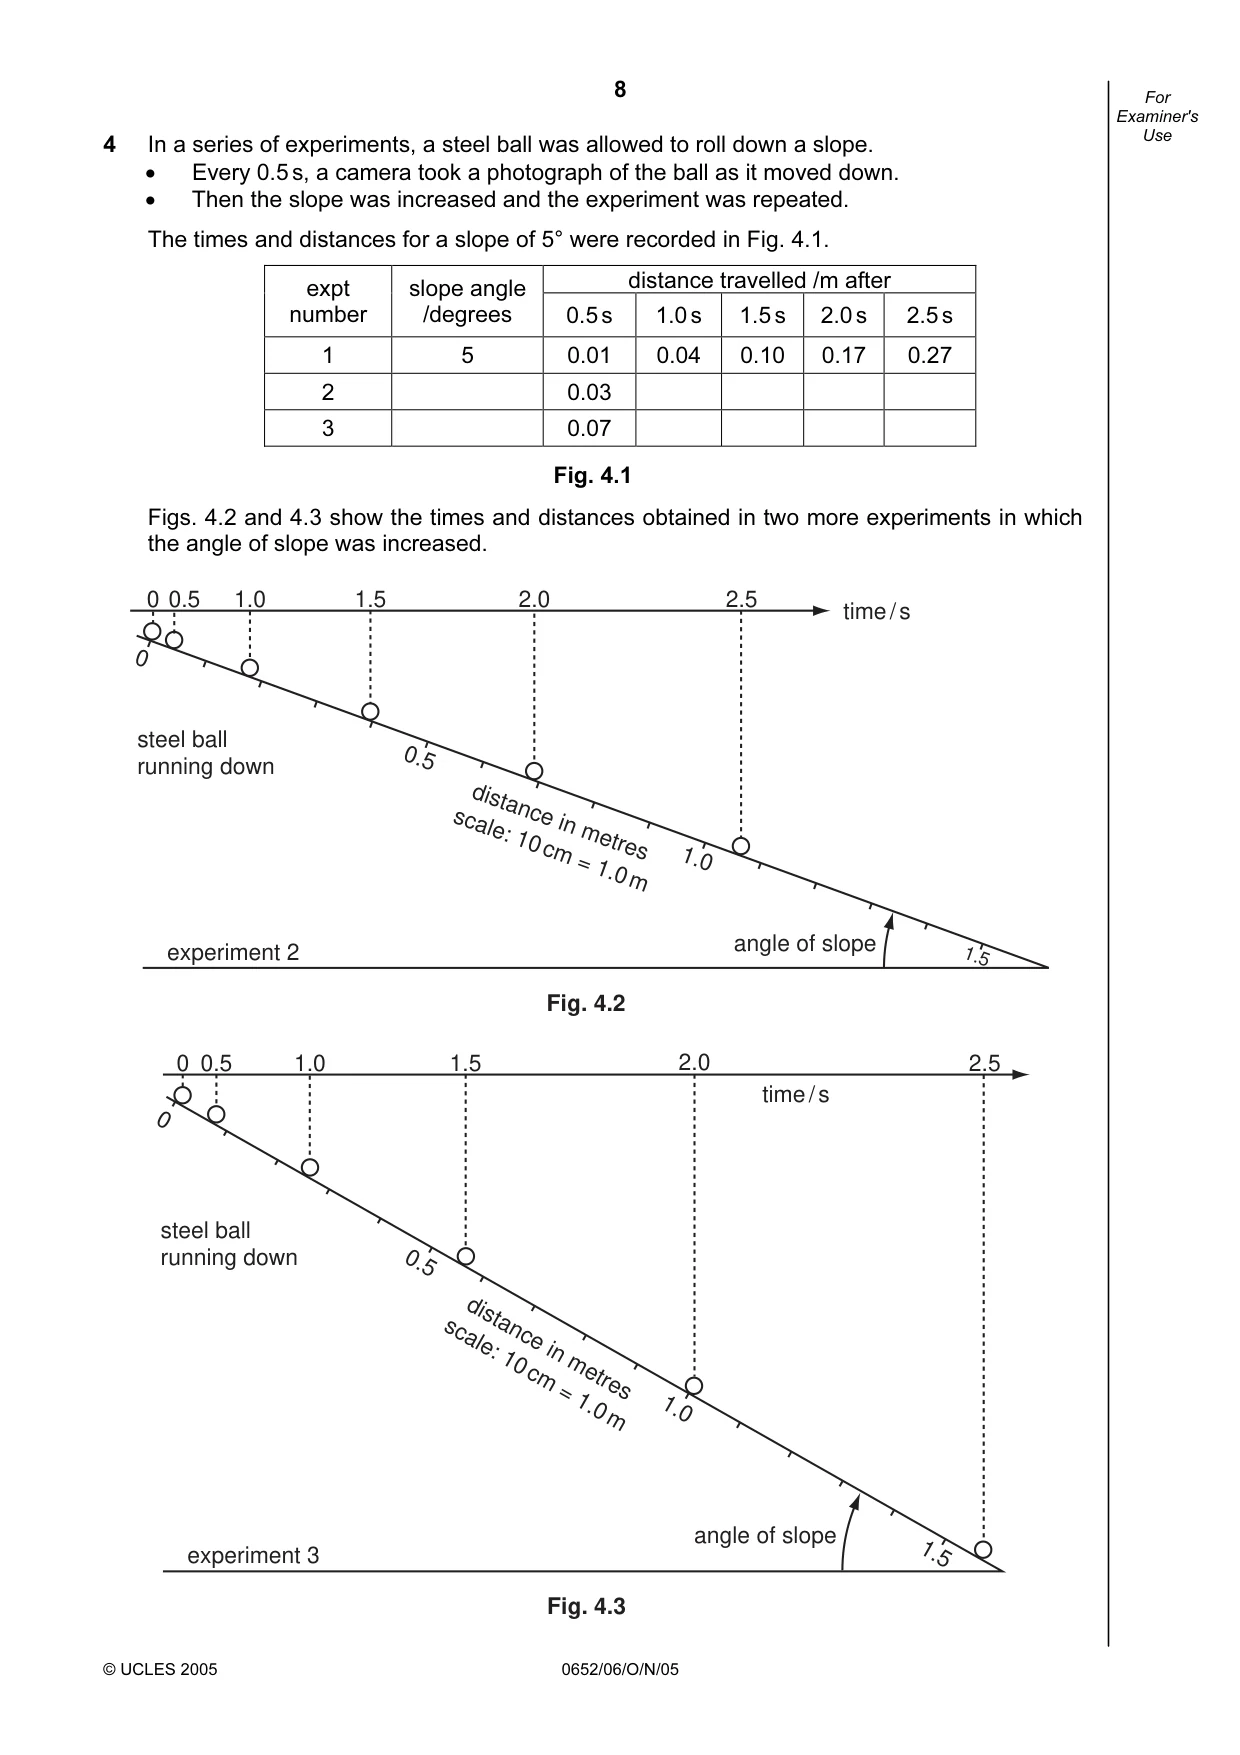
8 © UCLES 2005 0652/06/O/N/05 For Examiner's Use 4 In a series of experiments, a steel ball was allowed to roll down a slope. • Every 0.5 s, a camera took a photograph of the ball as it moved down. • Then the slope was increased and the experiment was repeated. The times and distances for a slope of 5° were recorded in Fig. 4.1. distance travelled /m after expt number slope angle /degrees 0.5 s 1.0 s 1.5 s 2.0 s 2.5 s 1 5 0.01 0.04 0.10 0.17 0.27 2 0.03 3 0.07 Fig. 4.1 Figs. 4.2 and 4.3 show the times and distances obtained in two more experiments in which the angle of slope was increased. steel ball running down experiment 2 time / s 0 0.5 1.0 1.5 0 0.5 1.0 1.5 2.0 2.5 angle of slope distance in metres scale: 10 cm = 1.0 m Fig. 4.2 experiment 3 time / s 0 0.5 1.0 1.5 2.0 2.5 angle of slope 0 0.5 1.0 1.5 distance in metres scale: 10 cm = 1.0 m Fig. 4.3 steel ball running down
Question paper, page 9
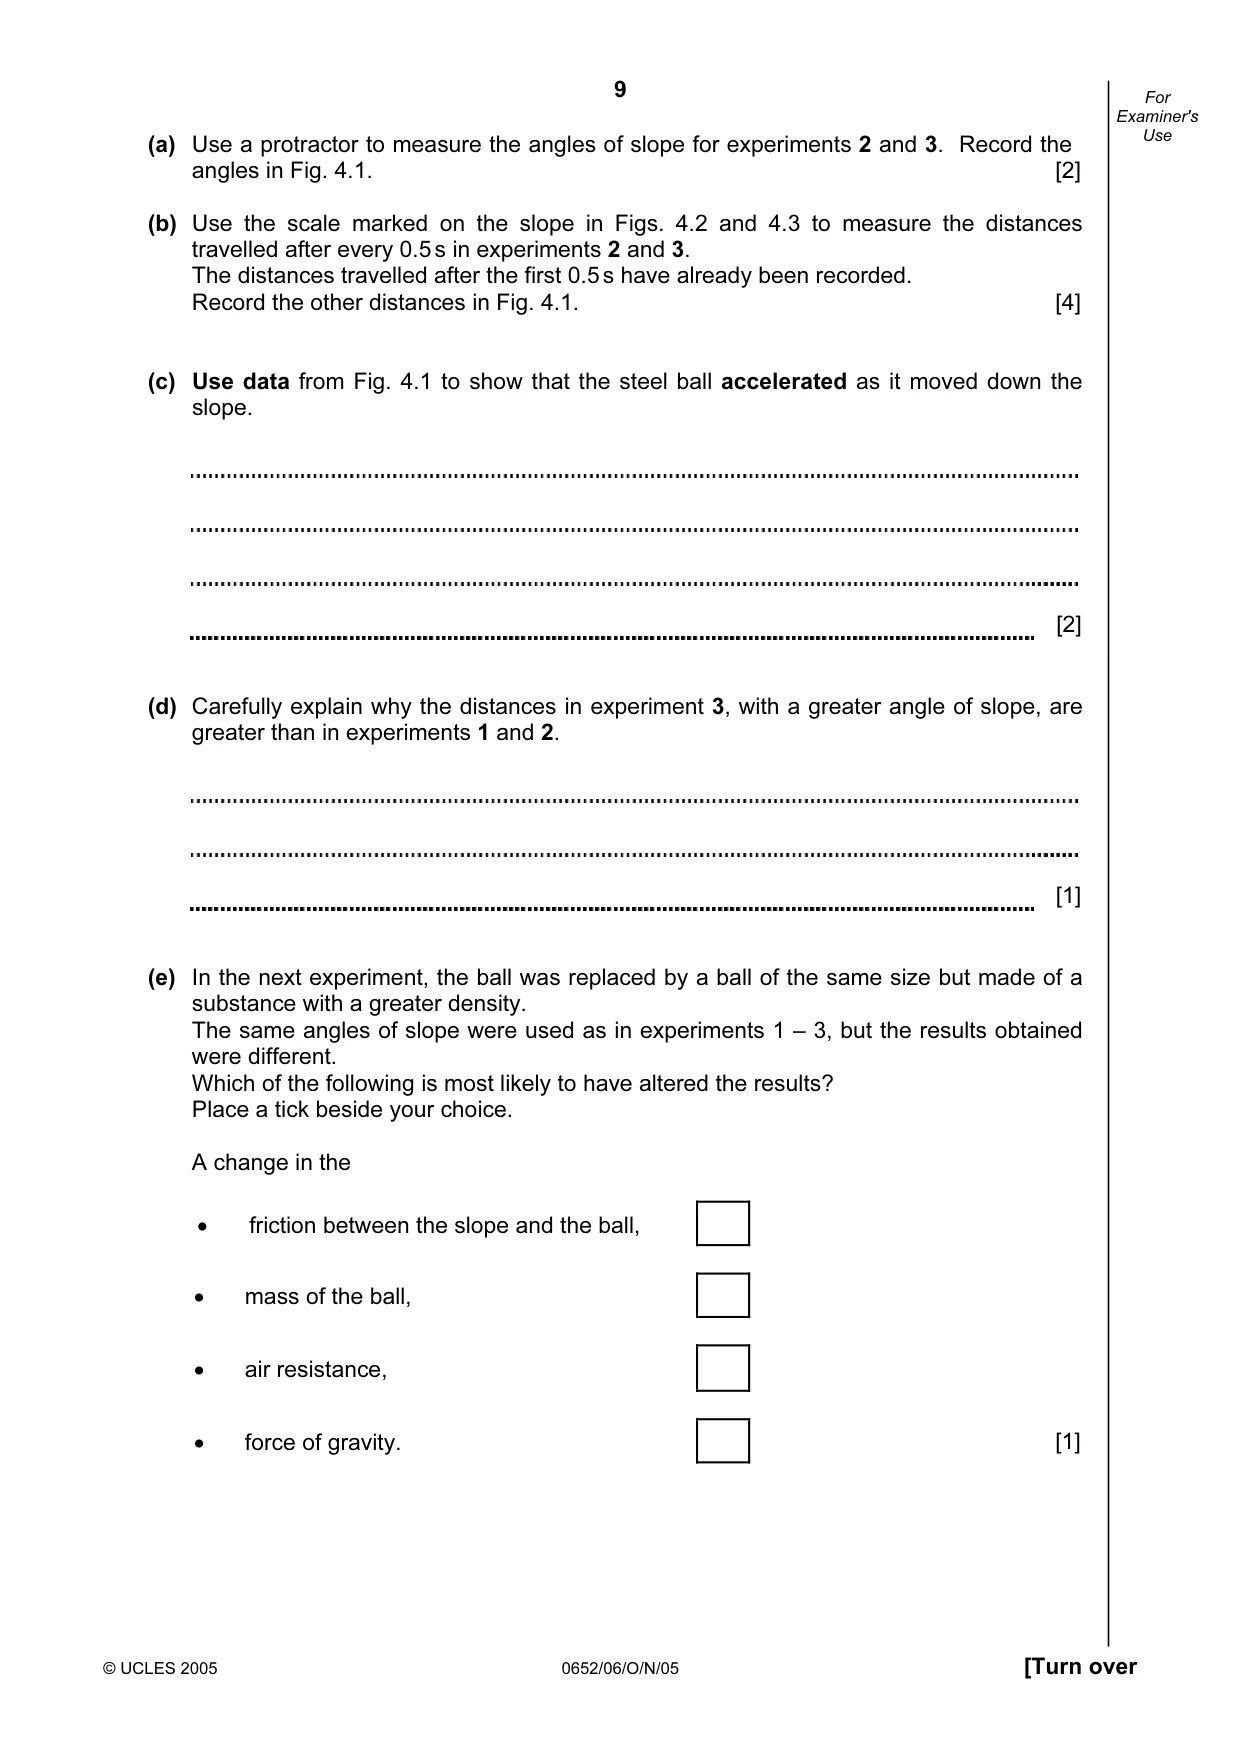
9 © UCLES 2005 0652/06/O/N/05 [Turn over For Examiner's Use (a) Use a protractor to measure the angles of slope for experiments 2 and 3. Record the angles in Fig. 4.1. [2] (b) Use the scale marked on the slope in Figs. 4.2 and 4.3 to measure the distances travelled after every 0.5 s in experiments 2 and 3. The distances travelled after the first 0.5 s have already been recorded. Record the other distances in Fig. 4.1. [4] (c) Use data from Fig. 4.1 to show that the steel ball accelerated as it moved down the slope. [2] (d) Carefully explain why the distances in experiment 3, with a greater angle of slope, are greater than in experiments 1 and 2. [1] (e) In the next experiment, the ball was replaced by a ball of the same size but made of a substance with a greater density. The same angles of slope were used as in experiments 1 – 3, but the results obtained were different. Which of the following is most likely to have altered the results? Place a tick beside your choice. A change in the • friction between the slope and the ball, • mass of the ball, • air resistance, • force of gravity. [1]
Question paper, page 10
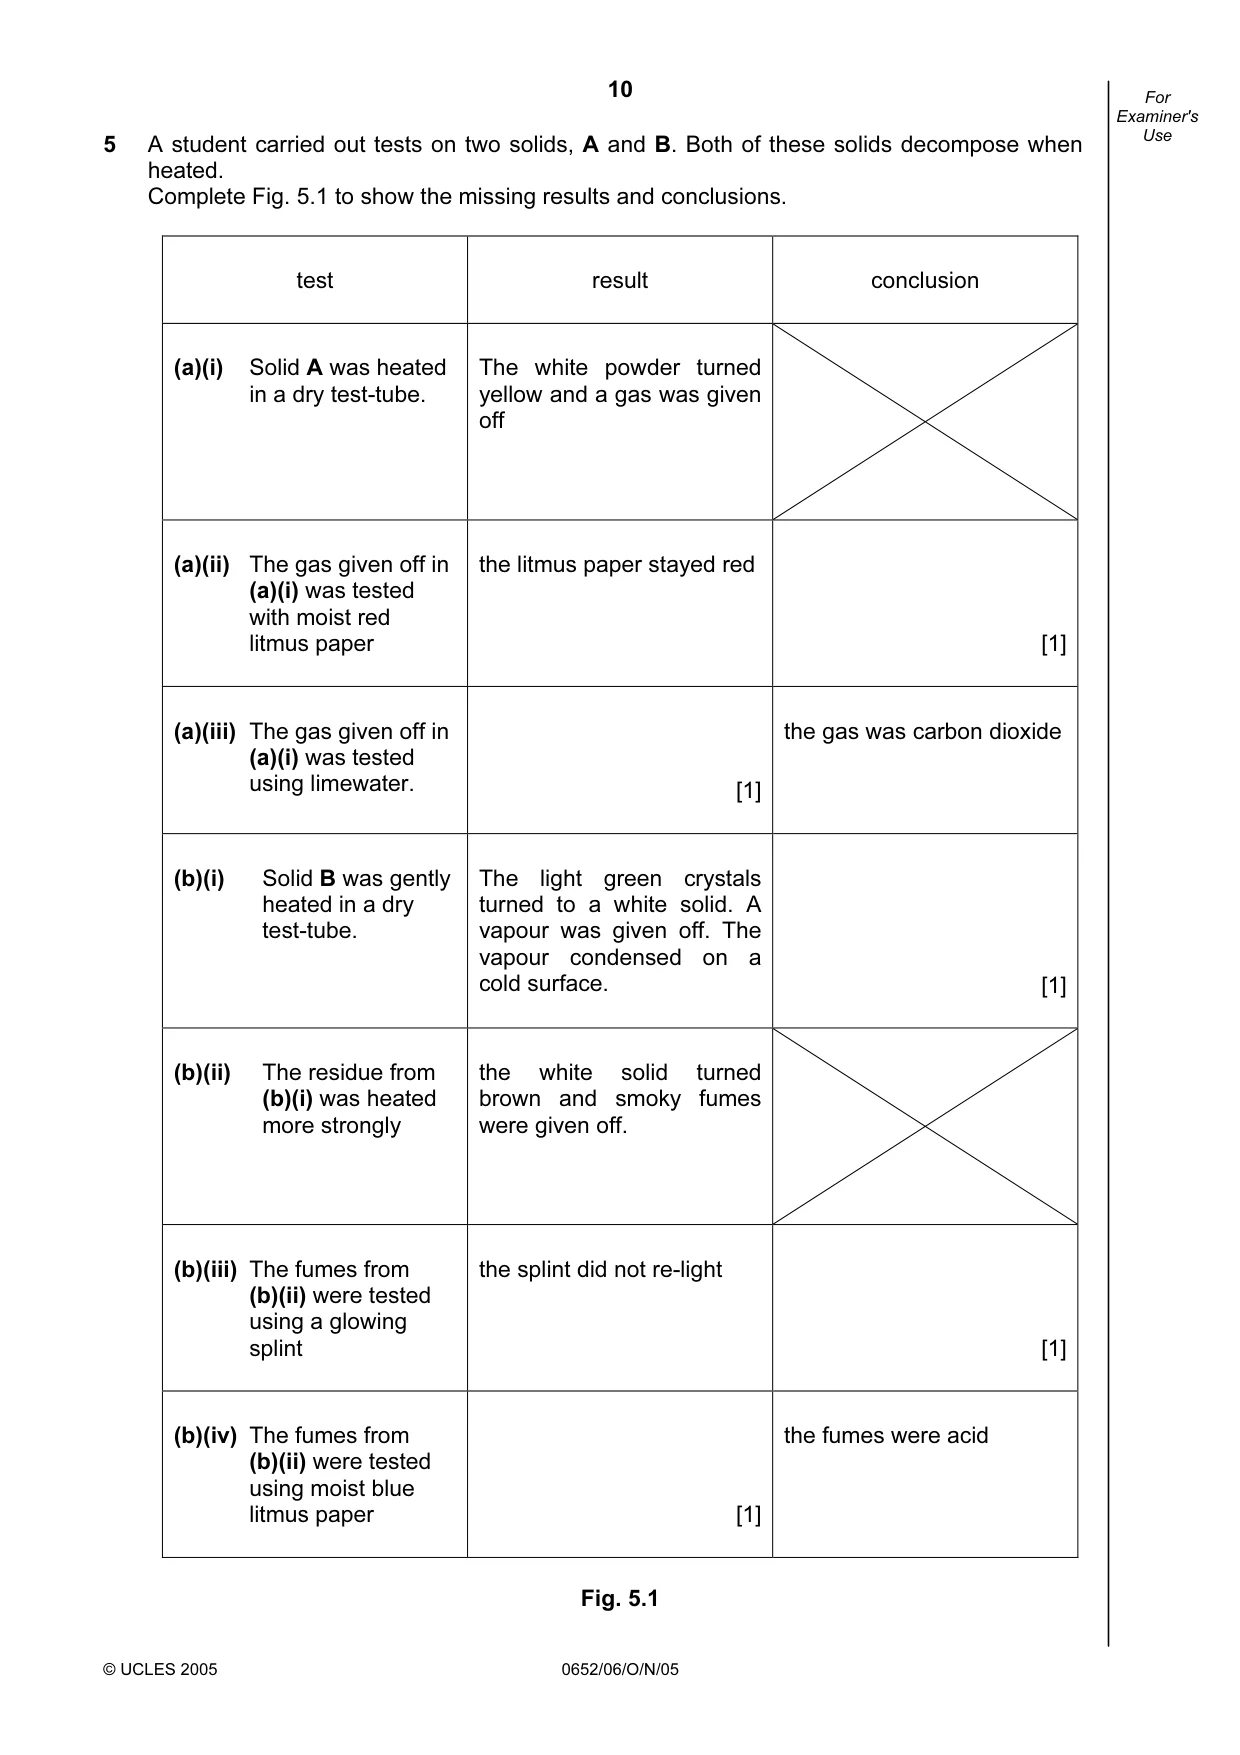
10 © UCLES 2005 0652/06/O/N/05 For Examiner's Use 5 A student carried out tests on two solids, A and B. Both of these solids decompose when heated. Complete Fig. 5.1 to show the missing results and conclusions. test result conclusion (a)(i) Solid A was heated in a dry test-tube. The white powder turned yellow and a gas was given off (a)(ii) The gas given off in (a)(i) was tested with moist red litmus paper the litmus paper stayed red [1] (a)(iii) The gas given off in (a)(i) was tested using limewater. [1] the gas was carbon dioxide (b)(i) Solid B was gently heated in a dry test-tube. The light green crystals turned to a white solid. A vapour was given off. The vapour condensed on a cold surface. [1] (b)(ii) The residue from (b)(i) was heated more strongly the white solid turned brown and smoky fumes were given off. (b)(iii) The fumes from (b)(ii) were tested using a glowing splint the splint did not re-light [1] (b)(iv) The fumes from (b)(ii) were tested using moist blue litmus paper [1] the fumes were acid Fig. 5.1
Question paper, page 11
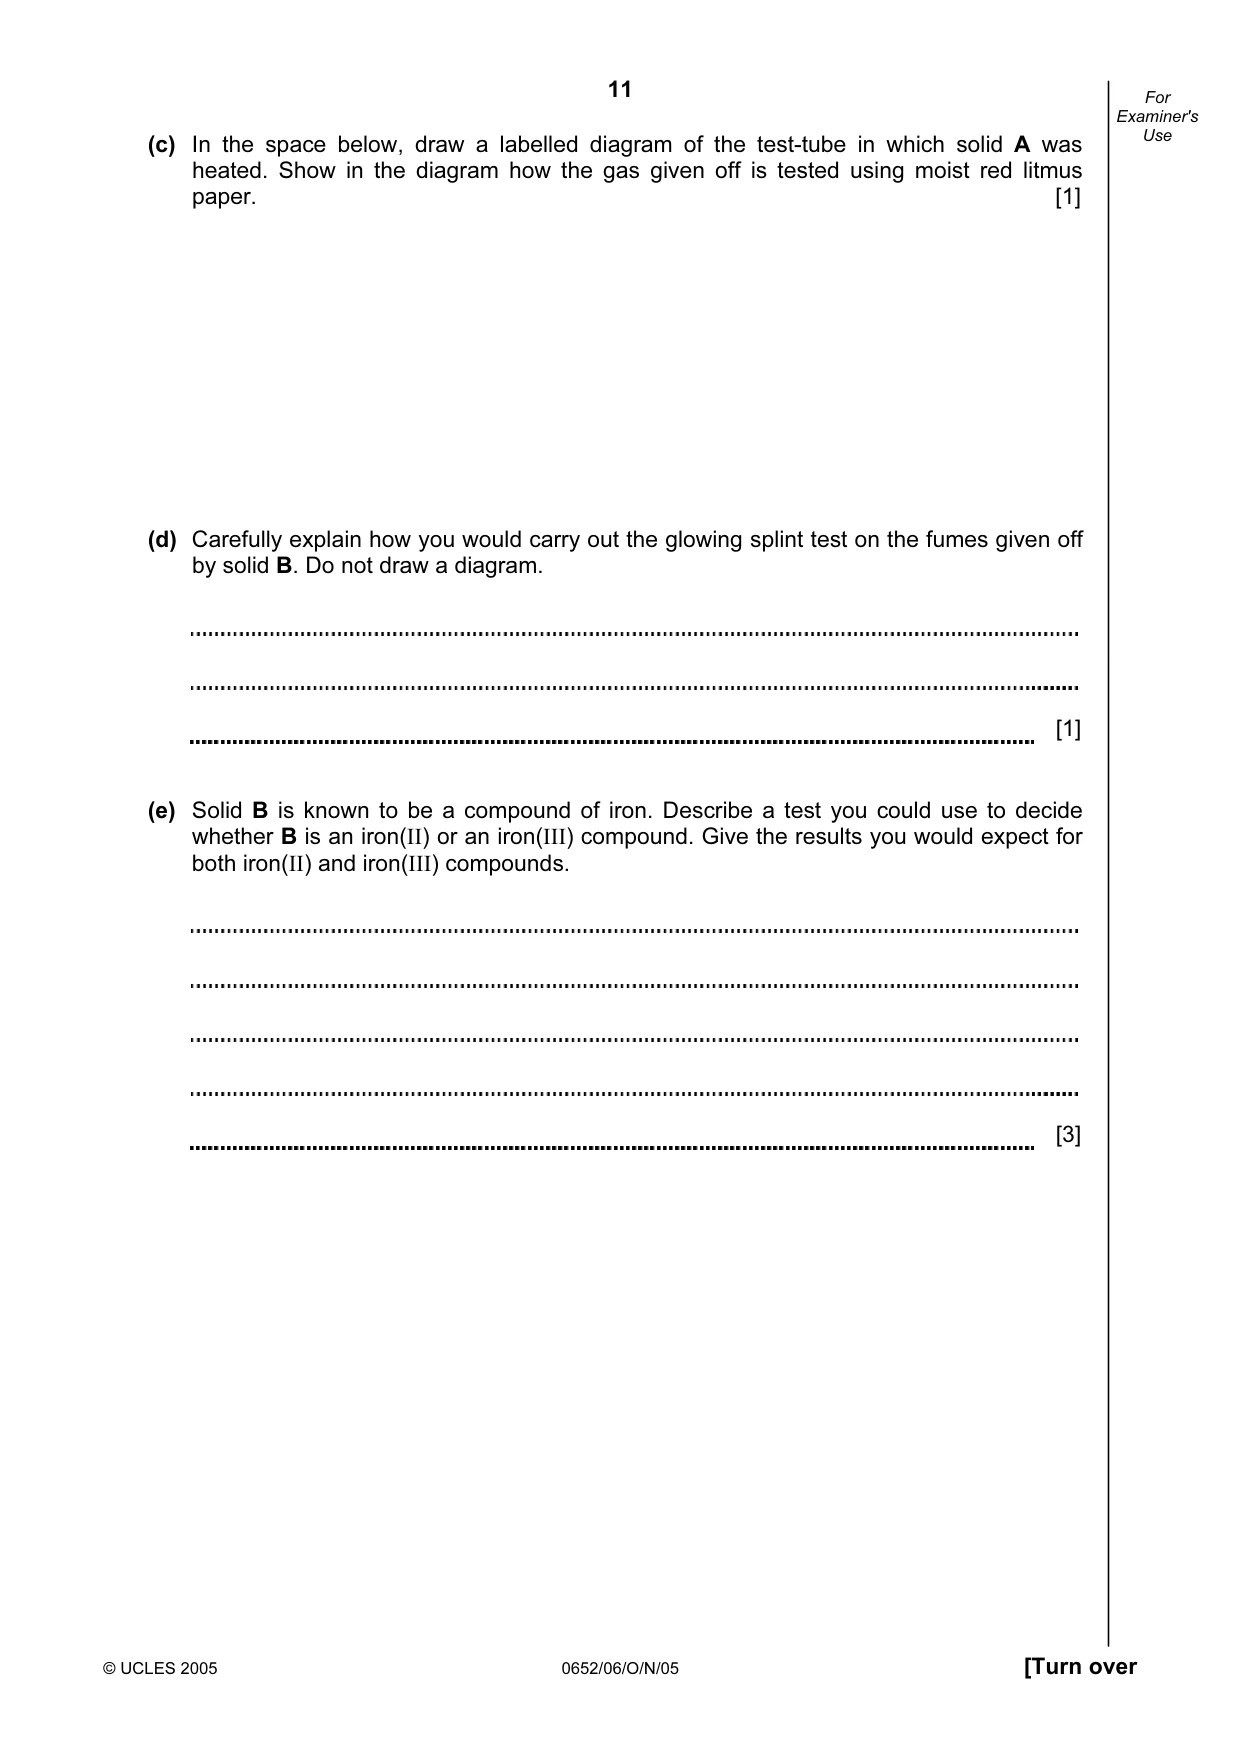
11 © UCLES 2005 0652/06/O/N/05 [Turn over For Examiner's Use (c) In the space below, draw a labelled diagram of the test-tube in which solid A was heated. Show in the diagram how the gas given off is tested using moist red litmus paper. [1] (d) Carefully explain how you would carry out the glowing splint test on the fumes given off by solid B. Do not draw a diagram. [1] (e) Solid B is known to be a compound of iron. Describe a test you could use to decide whether B is an iron(II) or an iron(III) compound. Give the results you would expect for both iron(II) and iron(III) compounds. [3]
Question paper, page 12
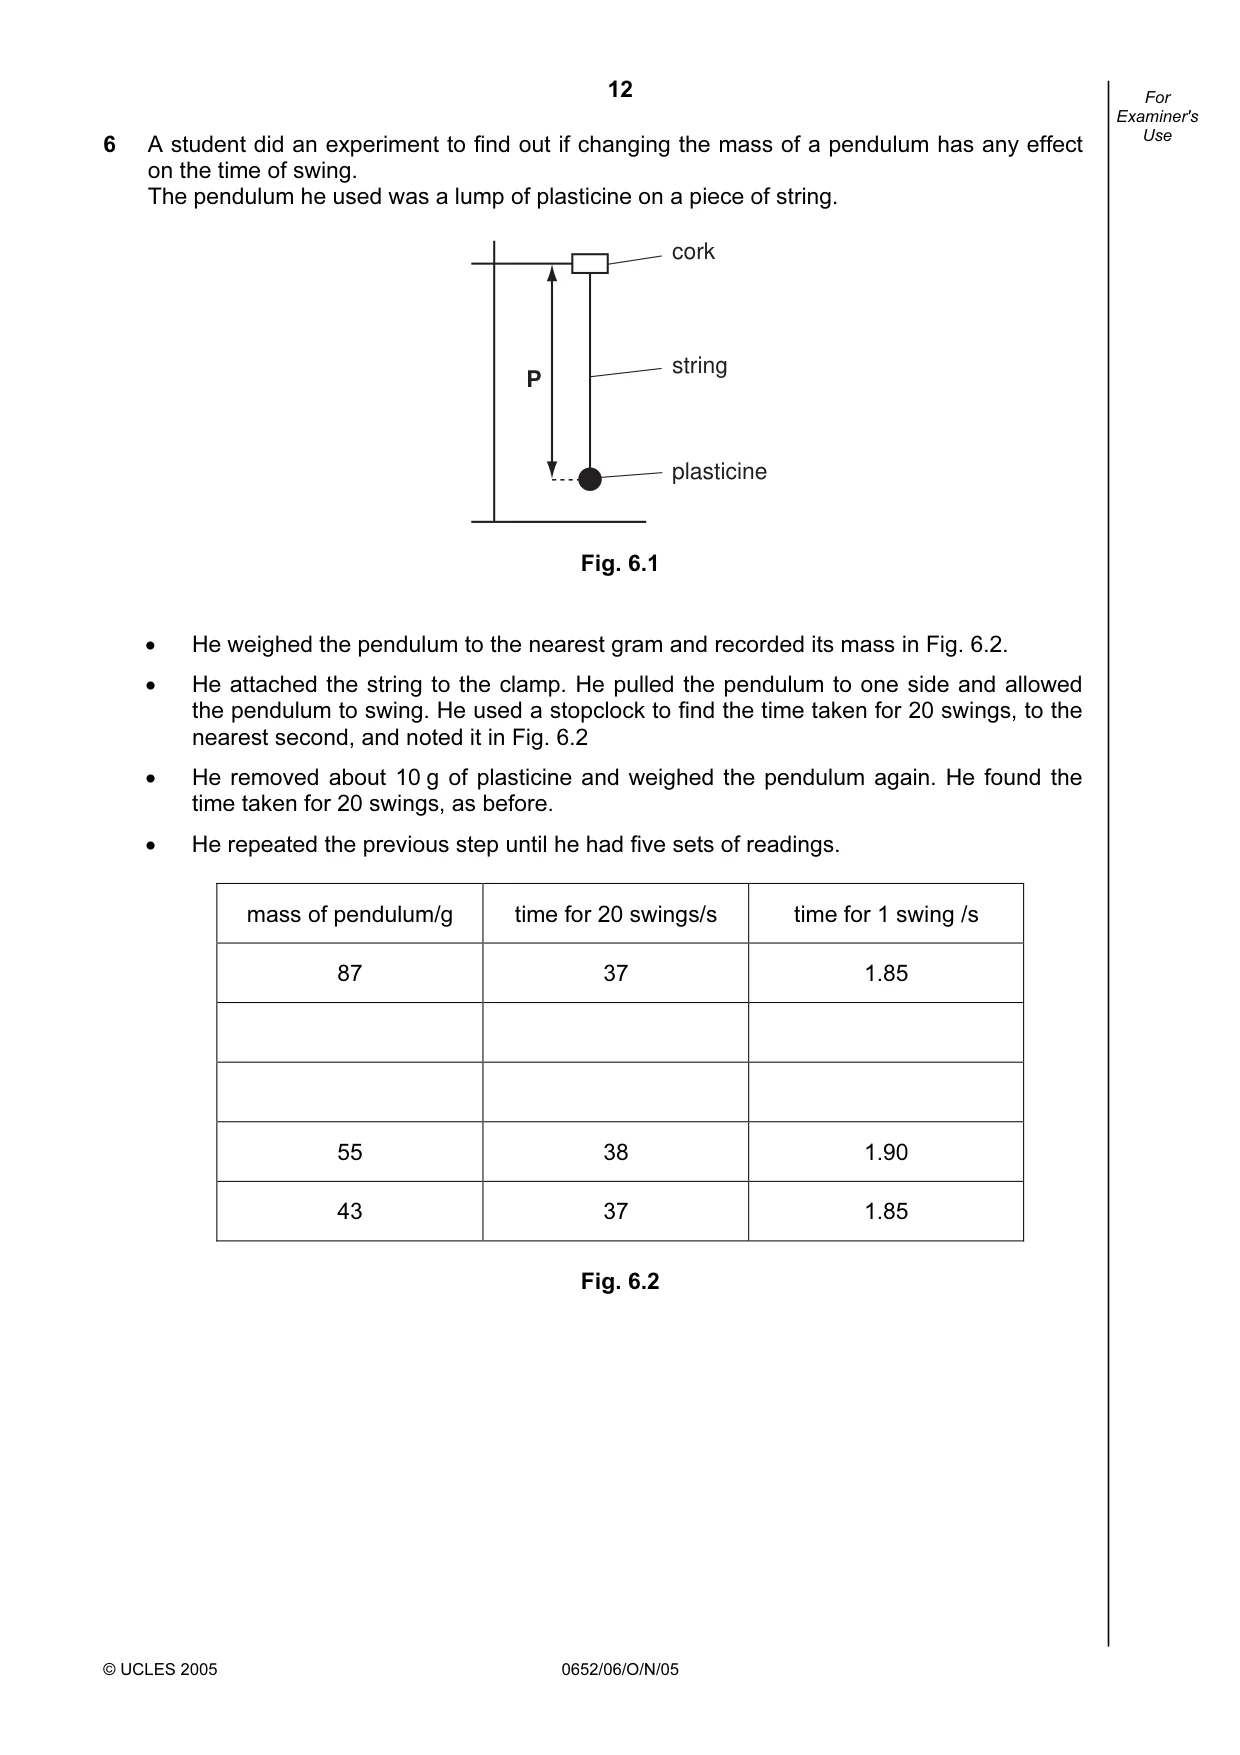
12 © UCLES 2005 0652/06/O/N/05 For Examiner's Use 6 A student did an experiment to find out if changing the mass of a pendulum has any effect on the time of swing. The pendulum he used was a lump of plasticine on a piece of string. P cork string plasticine Fig. 6.1 • He weighed the pendulum to the nearest gram and recorded its mass in Fig. 6.2. • He attached the string to the clamp. He pulled the pendulum to one side and allowed the pendulum to swing. He used a stopclock to find the time taken for 20 swings, to the nearest second, and noted it in Fig. 6.2 • He removed about 10 g of plasticine and weighed the pendulum again. He found the time taken for 20 swings, as before. • He repeated the previous step until he had five sets of readings. mass of pendulum/g time for 20 swings/s time for 1 swing /s 87 37 1.85 55 38 1.90 43 37 1.85 Fig. 6.2
Question paper, page 13
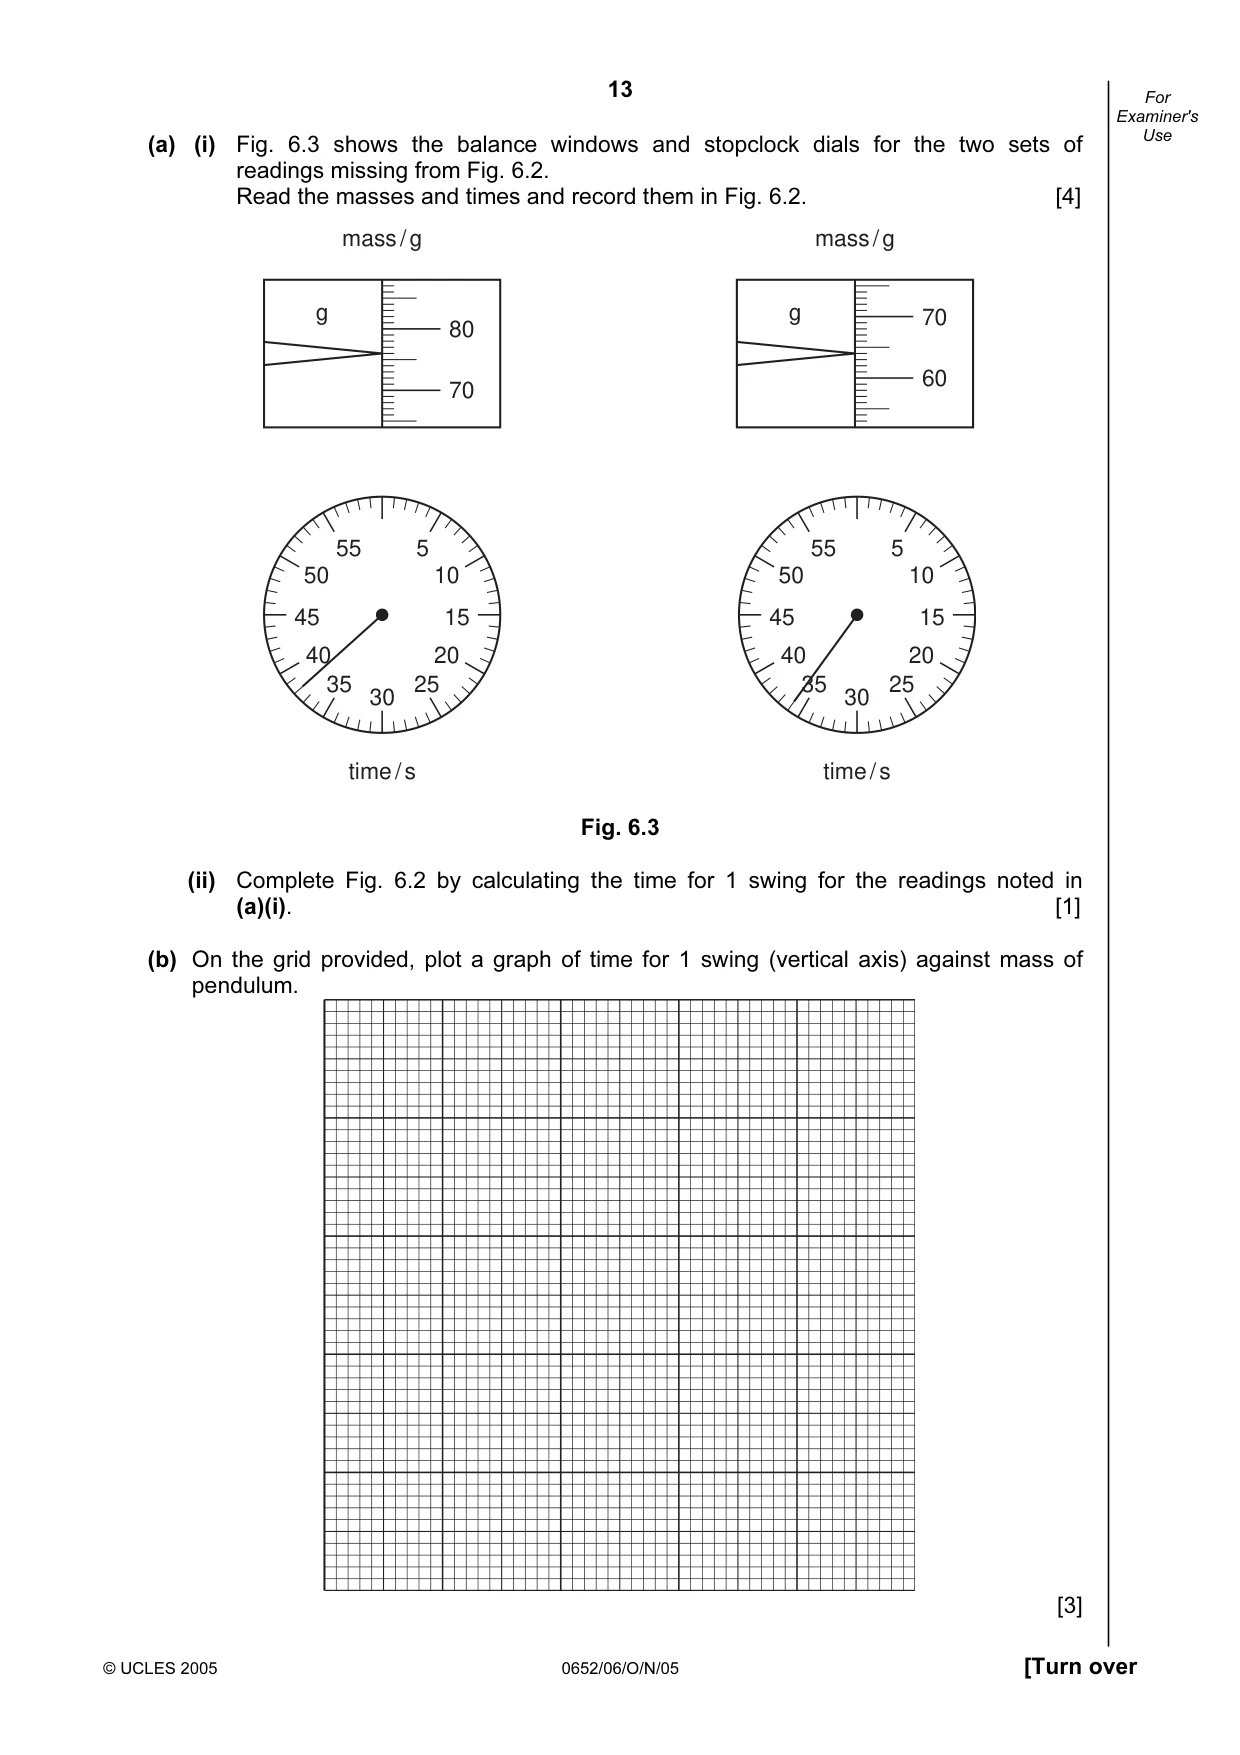
13 © UCLES 2005 0652/06/O/N/05 [Turn over For Examiner's Use (a) (i) Fig. 6.3 shows the balance windows and stopclock dials for the two sets of readings missing from Fig. 6.2. Read the masses and times and record them in Fig. 6.2. [4] 80 70 70 60 mass / g time / s g mass / g g 5 55 10 50 20 40 15 45 25 35 30 time / s 5 55 10 50 20 40 15 45 25 35 30 Fig. 6.3 (ii) Complete Fig. 6.2 by calculating the time for 1 swing for the readings noted in (a)(i). [1] (b) On the grid provided, plot a graph of time for 1 swing (vertical axis) against mass of pendulum. [3]
Question paper, page 14
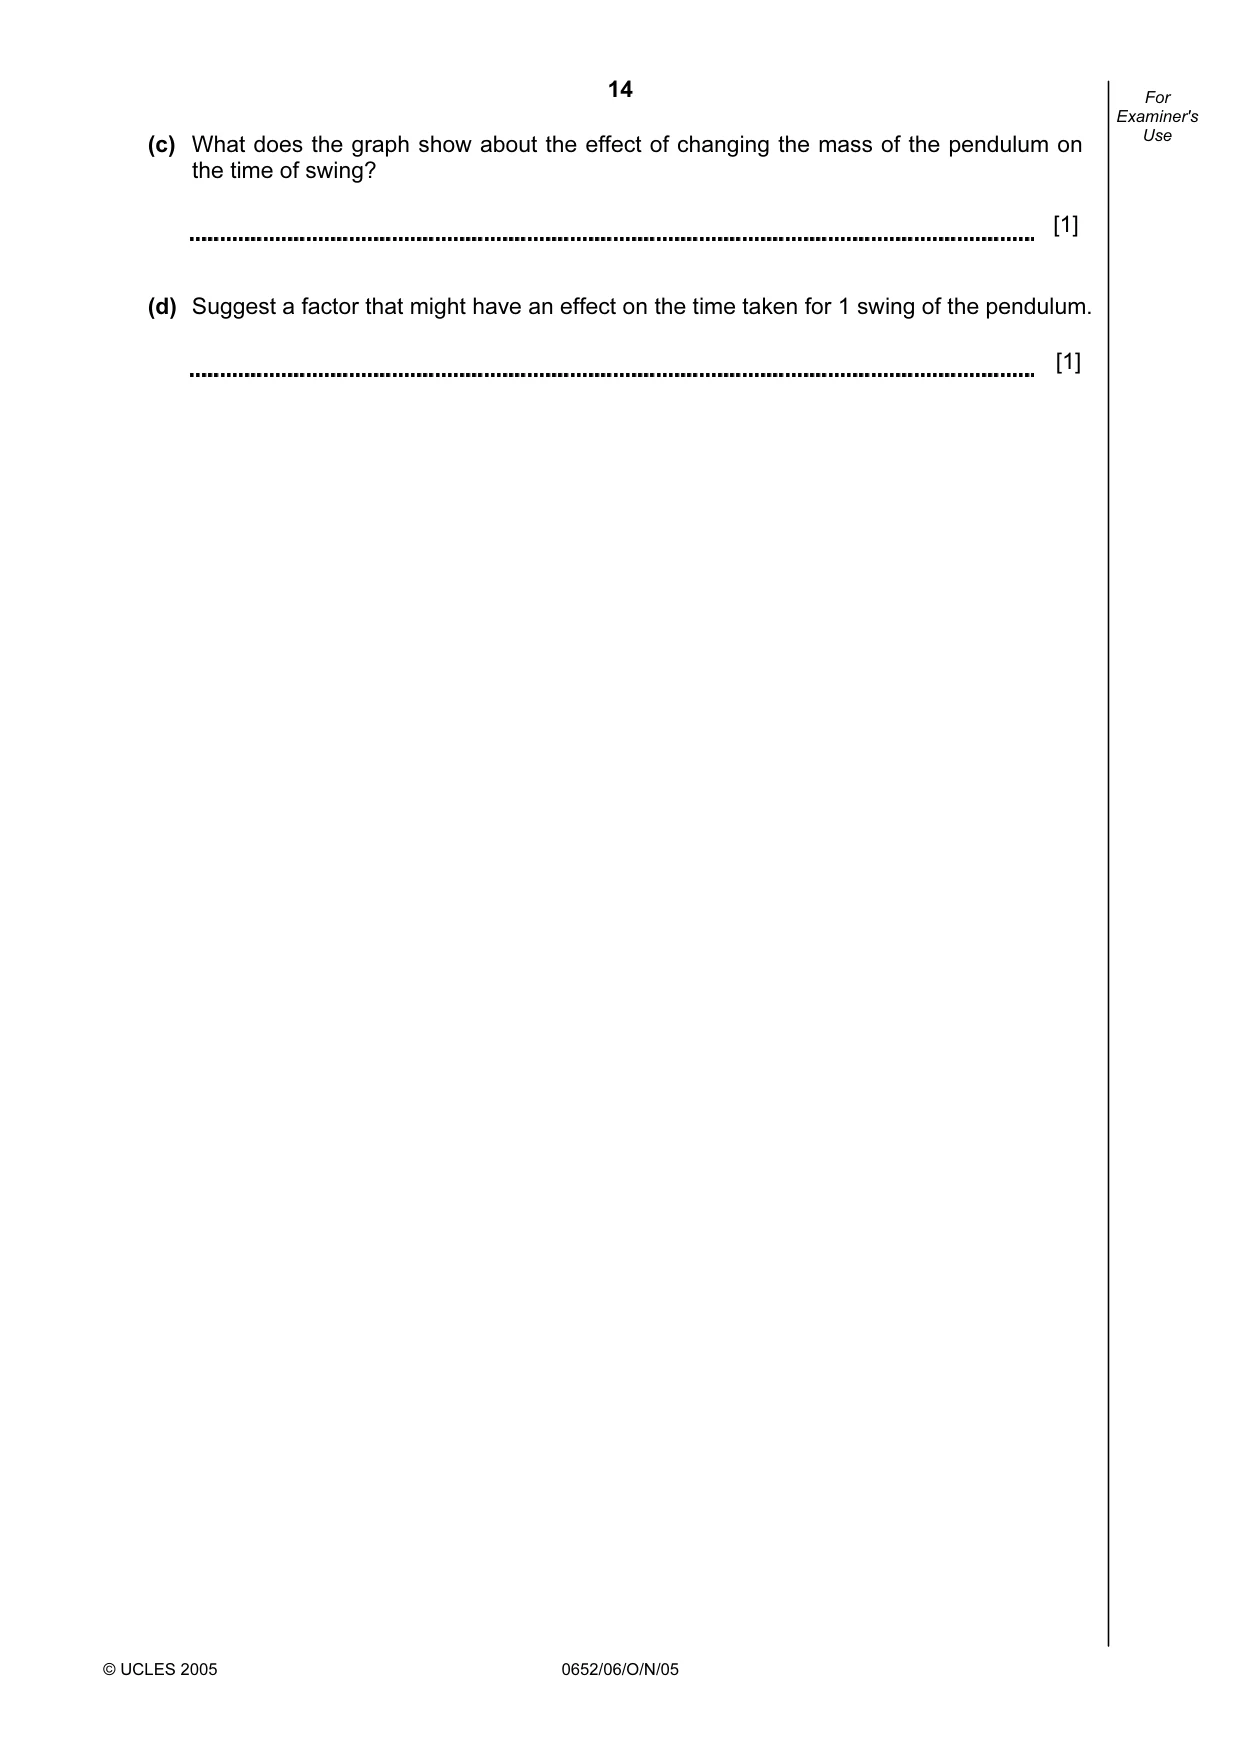
14 © UCLES 2005 0652/06/O/N/05 For Examiner's Use (c) What does the graph show about the effect of changing the mass of the pendulum on the time of swing? [1] (d) Suggest a factor that might have an effect on the time taken for 1 swing of the pendulum. [1]
Question paper, page 16
16 Permission to reproduce items where third-party owned material protected by copyright is included has been sought and cleared where possible. Every reasonable effort has been made by the publisher (UCLES) to trace copyright holders, but if any items requiring clearance have unwittingly been included, the publisher will be pleased to make amends at the earliest possible opportunity. University of Cambridge International Examinations is part of the University of Cambridge Local Examinations Syndicate (UCLES), which is itself a department of the University of Cambridge. 0652/06/O/N/05 BLANK PAGE
Mark scheme, page 1
UNIVERSITY OF CAMBRIDGE INTERNATIONAL EXAMINATIONS International General Certificate of Secondary Education MARK SCHEME for the November 2005 question paper 0652 PHYSICAL SCIENCE 0652/06 Paper 6 maximum raw mark 60 This mark scheme is published as an aid to teachers and students, to indicate the requirements of the examination. It shows the basis on which Examiners were initially instructed to award marks. It does not indicate the details of the discussions that took place at an Examiners’ meeting before marking began. Any substantial changes to the mark scheme that arose from these discussions will be recorded in the published Report on the Examination. All Examiners are instructed that alternative correct answers and unexpected approaches in candidates’ scripts must be given marks that fairly reflect the relevant knowledge and skills demonstrated. Mark schemes must be read in conjunction with the question papers and the Report on the Examination. The minimum marks in these components needed for various grades were previously published with these mark schemes, but are now instead included in the Report on the Examination for this session. • CIE will not enter into discussion or correspondence in connection with these mark schemes. CIE is publishing the mark schemes for the November 2005 question papers for most IGCSE and GCE Advanced Level and Advanced Subsidiary Level syllabuses and some Ordinary Level syllabuses. www.XtremePapers.com
Mark scheme, page 2
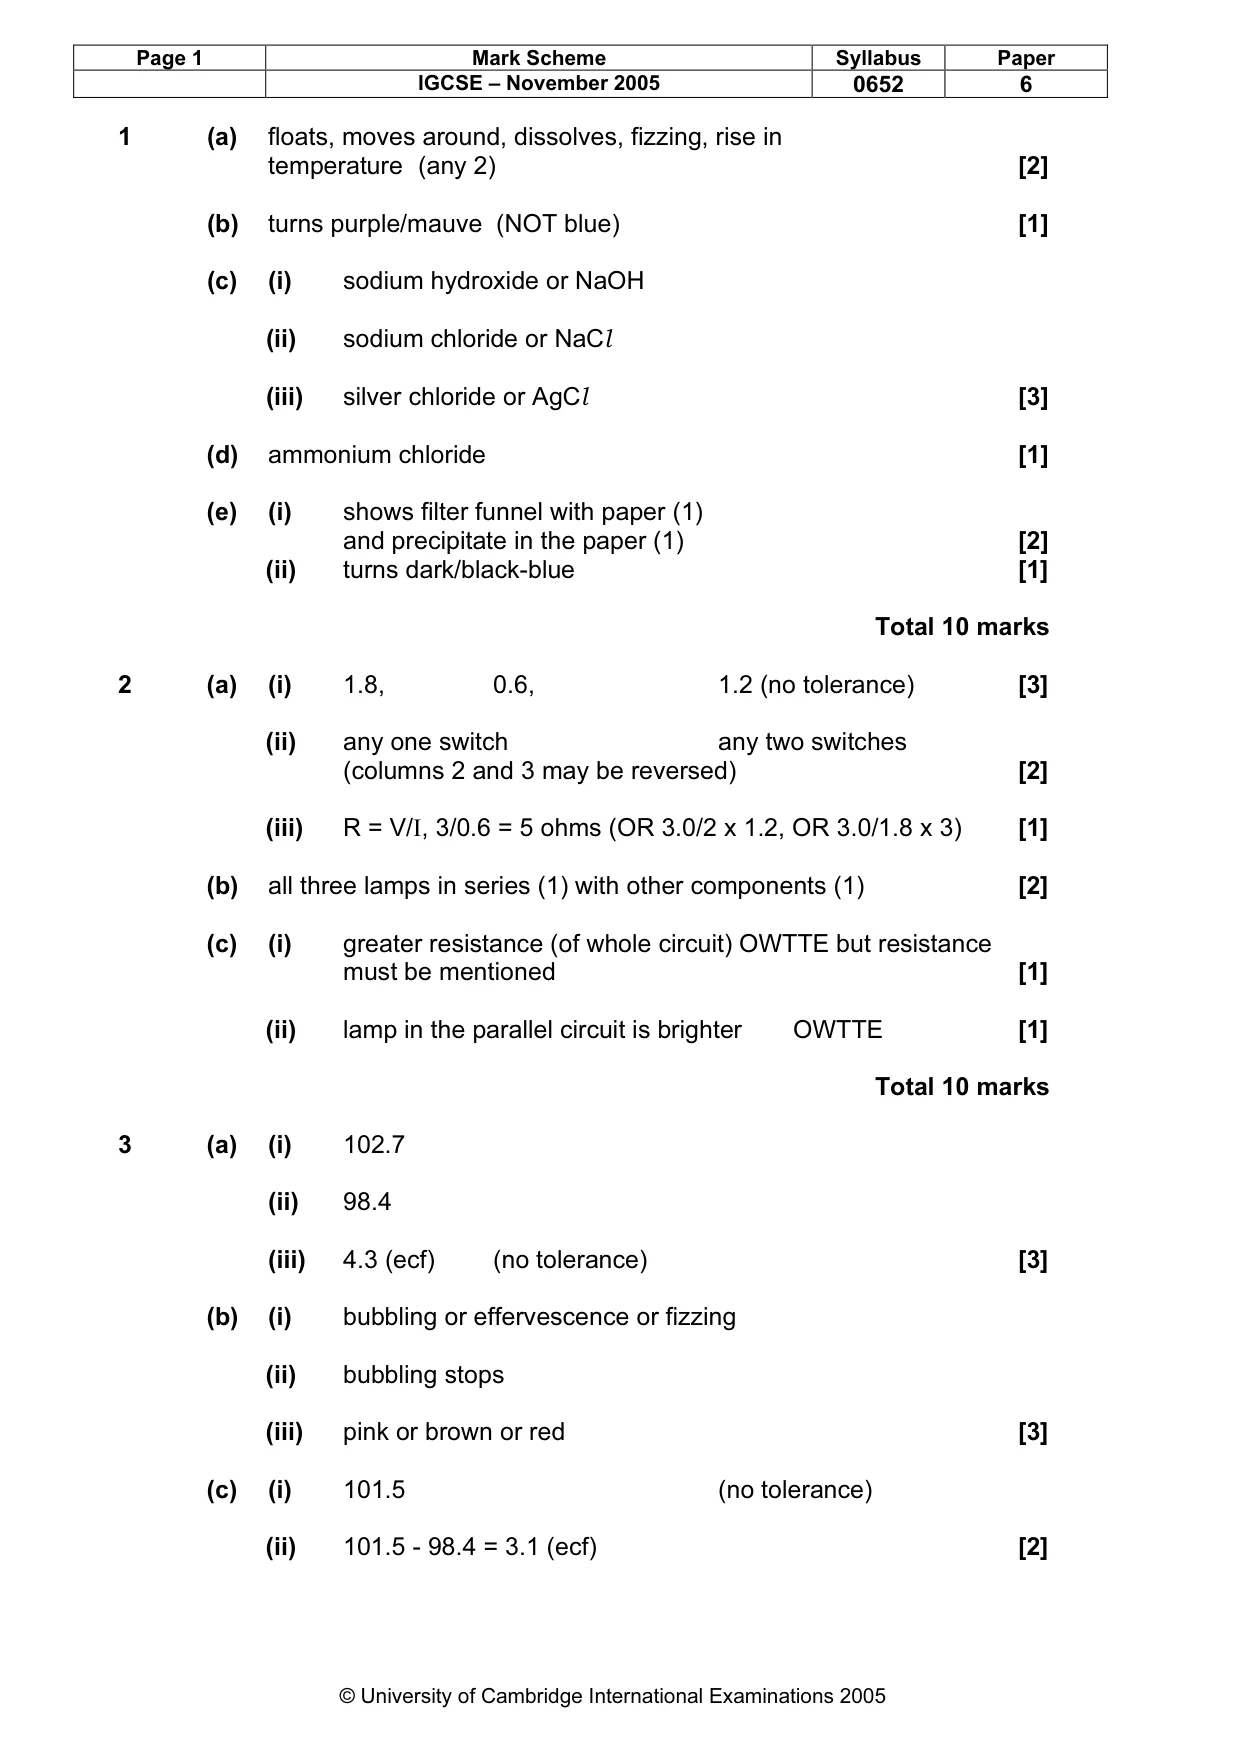
Page 1 Mark Scheme Syllabus Paper IGCSE – November 2005 0652 6 © University of Cambridge International Examinations 2005 1 (a) floats, moves around, dissolves, fizzing, rise in temperature (any 2) [2] (b) turns purple/mauve (NOT blue) [1] (c) (i) sodium hydroxide or NaOH (ii) sodium chloride or NaCl (iii) silver chloride or AgCl [3] (d) ammonium chloride [1] (e) (i) shows filter funnel with paper (1) and precipitate in the paper (1) [2] (ii) turns dark/black-blue [1] Total 10 marks 2 (a) (i) 1.8, 0.6, 1.2 (no tolerance) [3] (ii) any one switch any two switches (columns 2 and 3 may be reversed) [2] (iii) R = V/I, 3/0.6 = 5 ohms (OR 3.0/2 x 1.2, OR 3.0/1.8 x 3) [1] (b) all three lamps in series (1) with other components (1) [2] (c) (i) greater resistance (of whole circuit) OWTTE but resistance must be mentioned [1] (ii) lamp in the parallel circuit is brighter OWTTE [1] Total 10 marks 3 (a) (i) 102.7 (ii) 98.4 (iii) 4.3 (ecf) (no tolerance) [3] (b) (i) bubbling or effervescence or fizzing (ii) bubbling stops (iii) pink or brown or red [3] (c) (i) 101.5 (no tolerance) (ii) 101.5 - 98.4 = 3.1 (ecf) [2]
Mark scheme, page 3
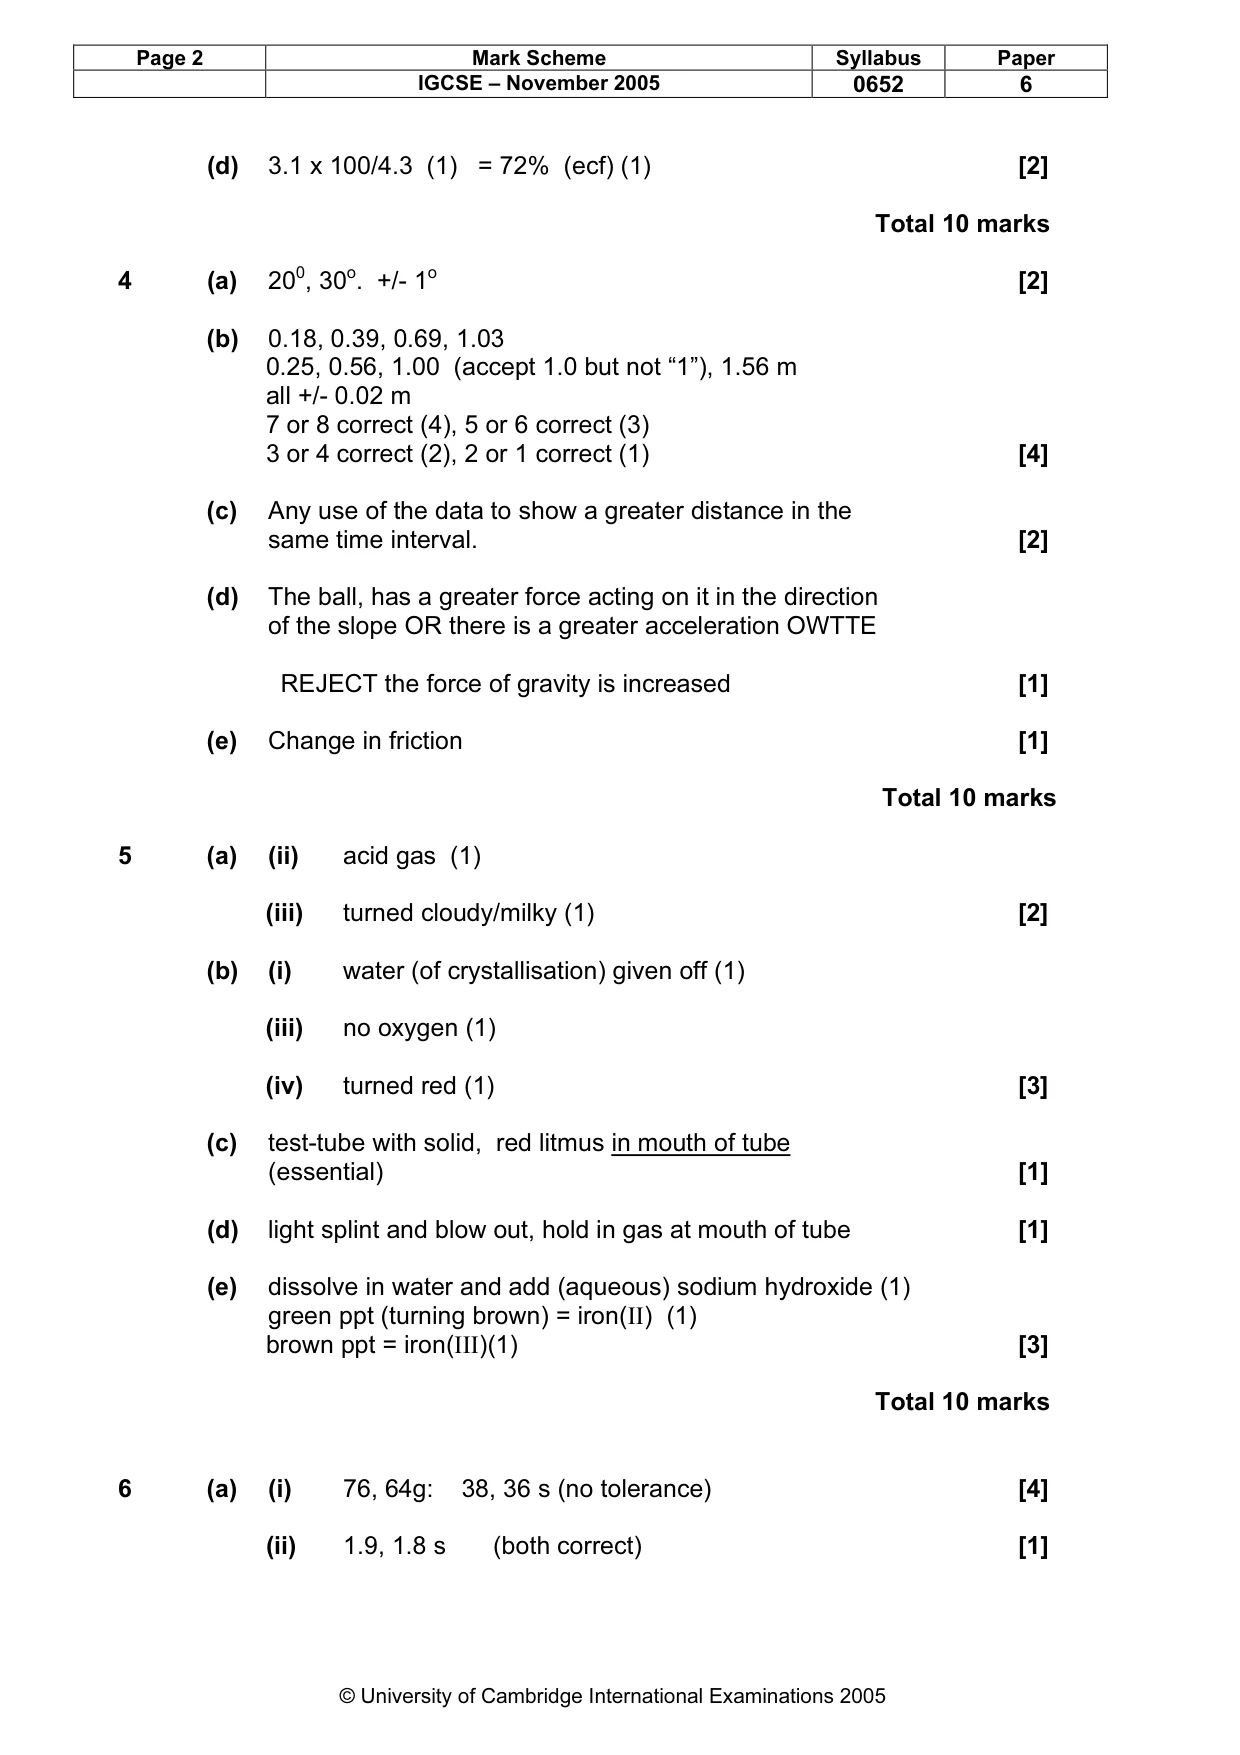
Page 2 Mark Scheme Syllabus Paper IGCSE – November 2005 0652 6 © University of Cambridge International Examinations 2005 (d) 3.1 x 100/4.3 (1) = 72% (ecf) (1) [2] Total 10 marks 4 (a) 200, 30o. +/- 1o [2] (b) 0.18, 0.39, 0.69, 1.03 0.25, 0.56, 1.00 (accept 1.0 but not “1”), 1.56 m all +/- 0.02 m 7 or 8 correct (4), 5 or 6 correct (3) 3 or 4 correct (2), 2 or 1 correct (1) [4] (c) Any use of the data to show a greater distance in the same time interval. [2] (d) The ball, has a greater force acting on it in the direction of the slope OR there is a greater acceleration OWTTE REJECT the force of gravity is increased [1] (e) Change in friction [1] Total 10 marks 5 (a) (ii) acid gas (1) (iii) turned cloudy/milky (1) [2] (b) (i) water (of crystallisation) given off (1) (iii) no oxygen (1) (iv) turned red (1) [3] (c) test-tube with solid, red litmus in mouth of tube (essential) [1] (d) light splint and blow out, hold in gas at mouth of tube [1] (e) dissolve in water and add (aqueous) sodium hydroxide (1) green ppt (turning brown) = iron(II) (1) brown ppt = iron(III)(1) [3] Total 10 marks 6 (a) (i) 76, 64g: 38, 36 s (no tolerance) [4] (ii) 1.9, 1.8 s (both correct) [1]
Mark scheme, page 4
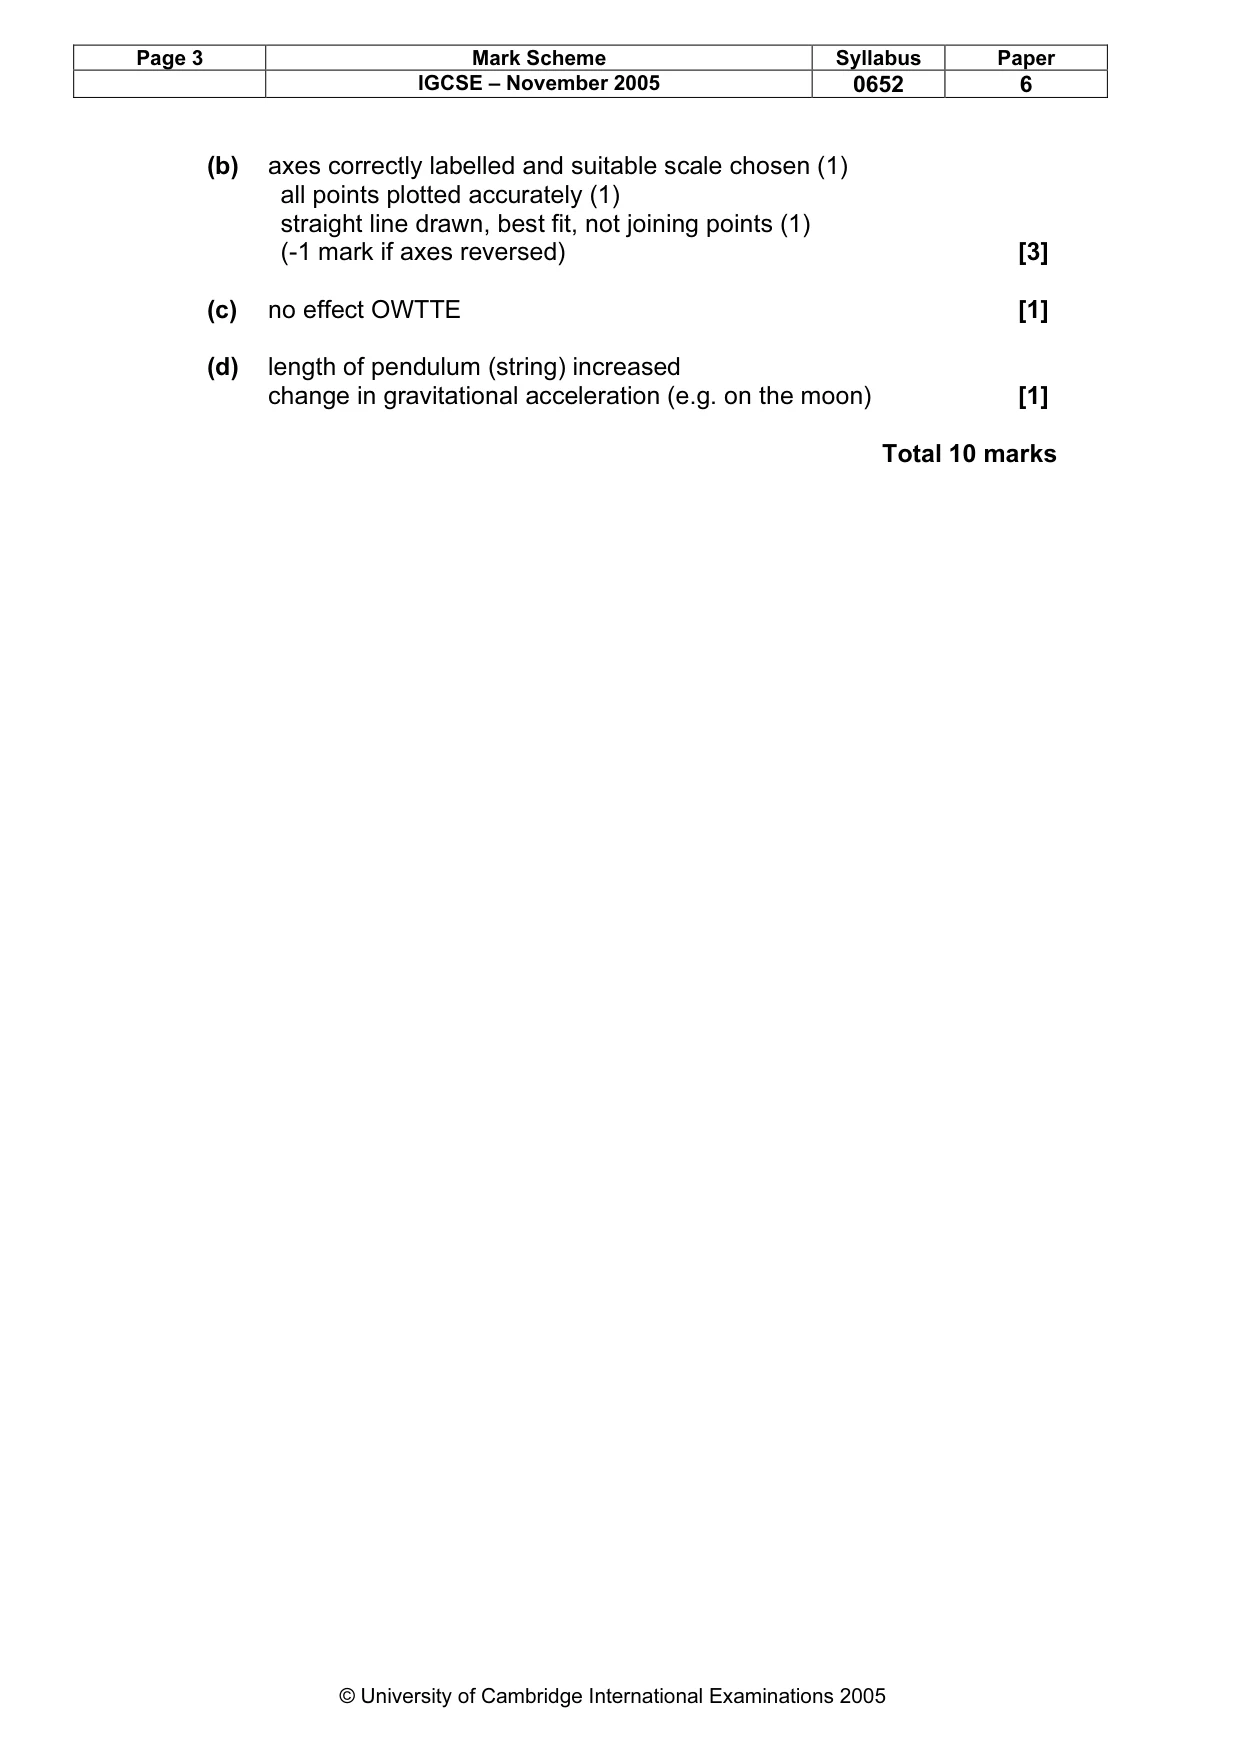
Page 3 Mark Scheme Syllabus Paper IGCSE – November 2005 0652 6 © University of Cambridge International Examinations 2005 (b) axes correctly labelled and suitable scale chosen (1) all points plotted accurately (1) straight line drawn, best fit, not joining points (1) (-1 mark if axes reversed) [3] (c) no effect OWTTE [1] (d) length of pendulum (string) increased change in gravitational acceleration (e.g. on the moon) [1] Total 10 marks