Cambridge IGCSE Physical Science 0652 — 2004 May/June Paper 6 · Variant 1
0652/61/M/J/04
The question paper and its mark scheme, free to read here and free to download. This is Cambridge’s own paper, exactly as it was sat.
Question paper20 pages
Mark scheme
No mark scheme is in the library for this paper.
Paper as text
Question paper, page 1
This document consists of 18 printed pages and 2 blank pages. SP (SLM/AR) S69259/2 © UCLES 2004 [Turn over UNIVERSITY OF CAMBRIDGE INTERNATIONAL EXAMINATIONS International General Certificate of Secondary Education PHYSICAL SCIENCE 0652/06 Paper 6 Alternative to Practical May/June 2004 1 hour Candidates answer on the Question Paper. No Additional Materials are required. READ THESE INSTRUCTIONS FIRST Write your Centre number, candidate number and name on all the work you hand in. Write in dark blue or black pen in the spaces provided on the Question Paper. You may use a soft pencil for any diagrams, graphs or rough working. Do not use staples, paper clips, highlighters, glue or correction fluid. Answer all questions. The number of marks is given in brackets [ ] at the end of each question or part question. Centre Number Candidate Number Name If you have been given a label, look at the details. If any details are incorrect or missing, please fill in your correct details in the space given at the top of this page. Stick your personal label here, if provided. For Examiner’s Use 1 2 3 4 5 6 Total www.XtremePapers.com
Question paper, page 2
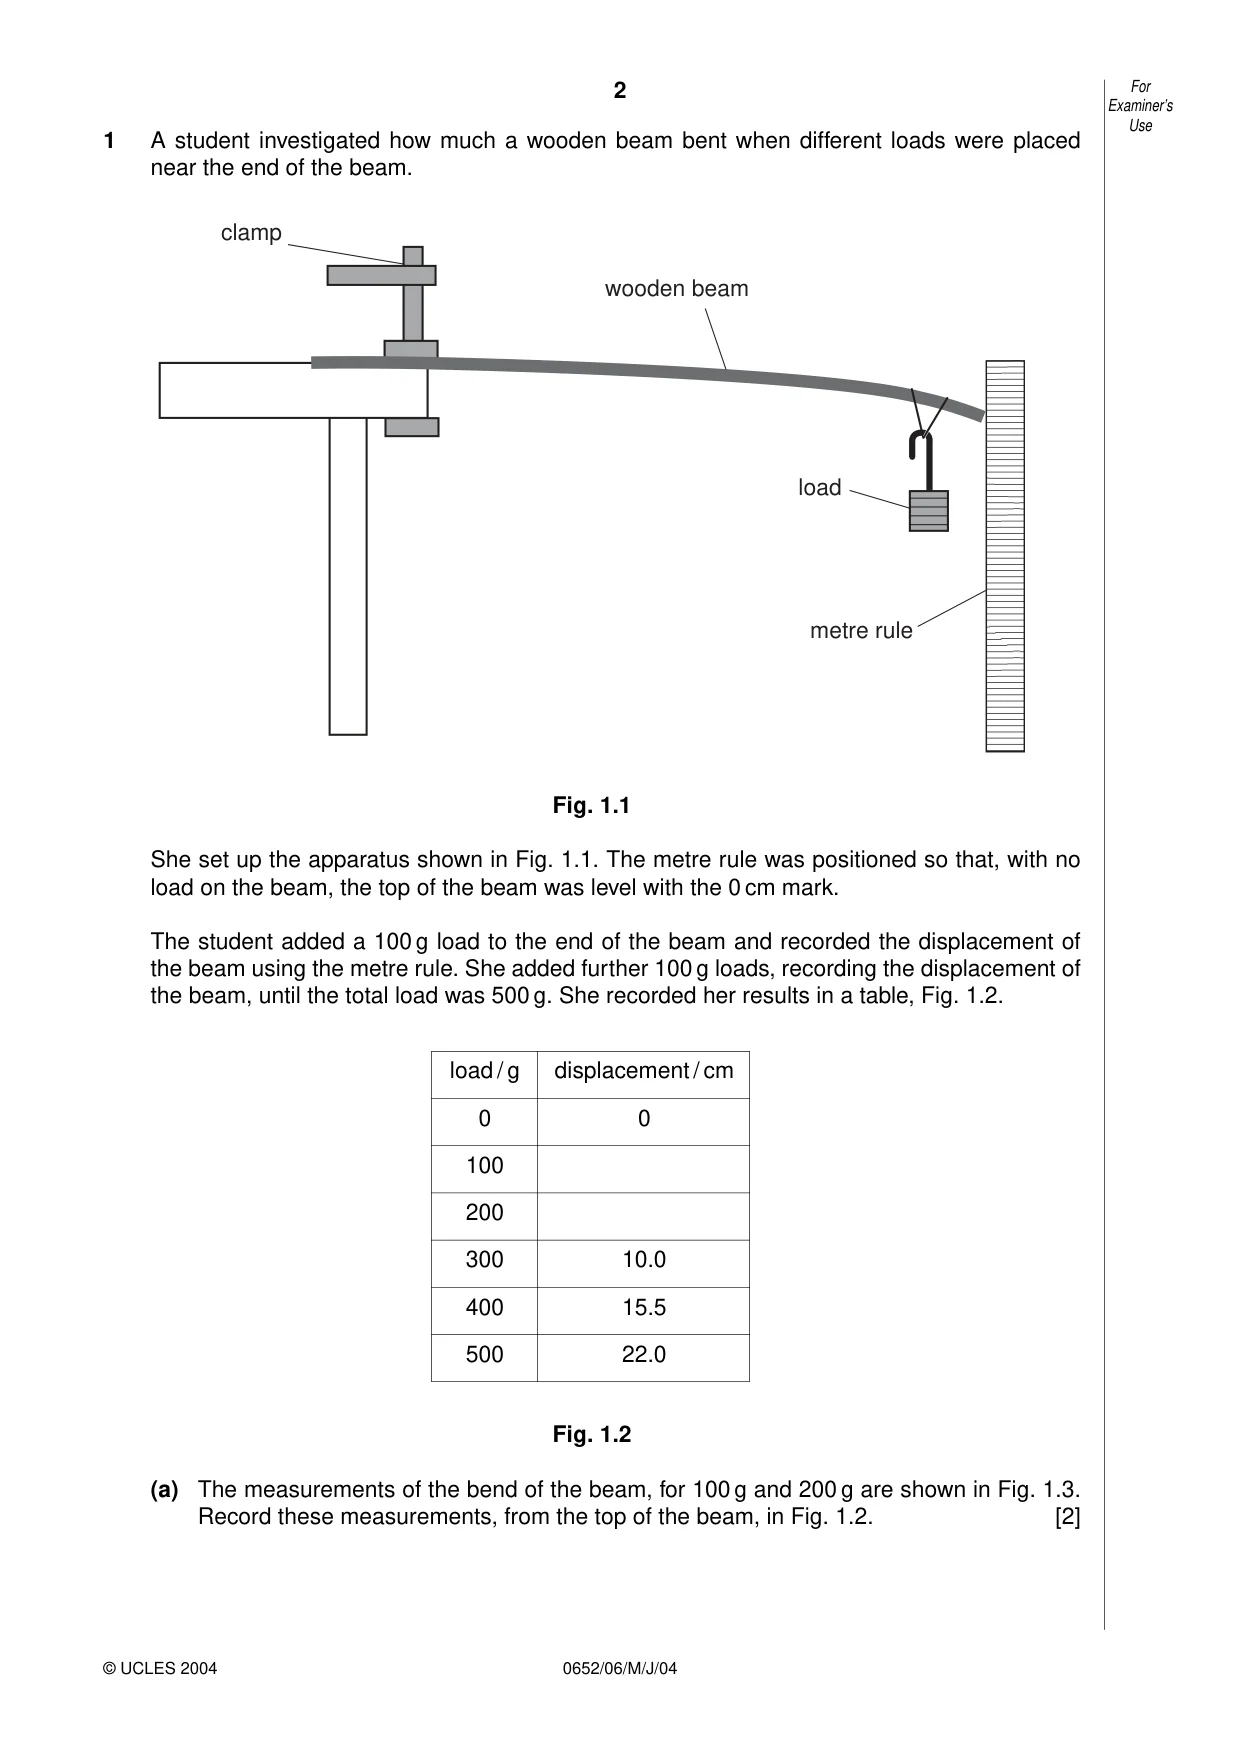
2 0652/06/M/J/04 1 A student investigated how much a wooden beam bent when different loads were placed near the end of the beam. Fig. 1.1 She set up the apparatus shown in Fig. 1.1. The metre rule was positioned so that, with no load on the beam, the top of the beam was level with the 0 cm mark. The student added a 100 g load to the end of the beam and recorded the displacement of the beam using the metre rule. She added further 100 g loads, recording the displacement of the beam, until the total load was 500 g. She recorded her results in a table, Fig. 1.2. Fig. 1.2 (a) The measurements of the bend of the beam, for 100 g and 200 g are shown in Fig. 1.3. Record these measurements, from the top of the beam, in Fig. 1.2. [2] load metre rule wooden beam clamp For Examiner’s Use © UCLES 2004 load / g displacement / cm 0 0 100 200 300 10.0 400 15.5 500 22.0
Question paper, page 3
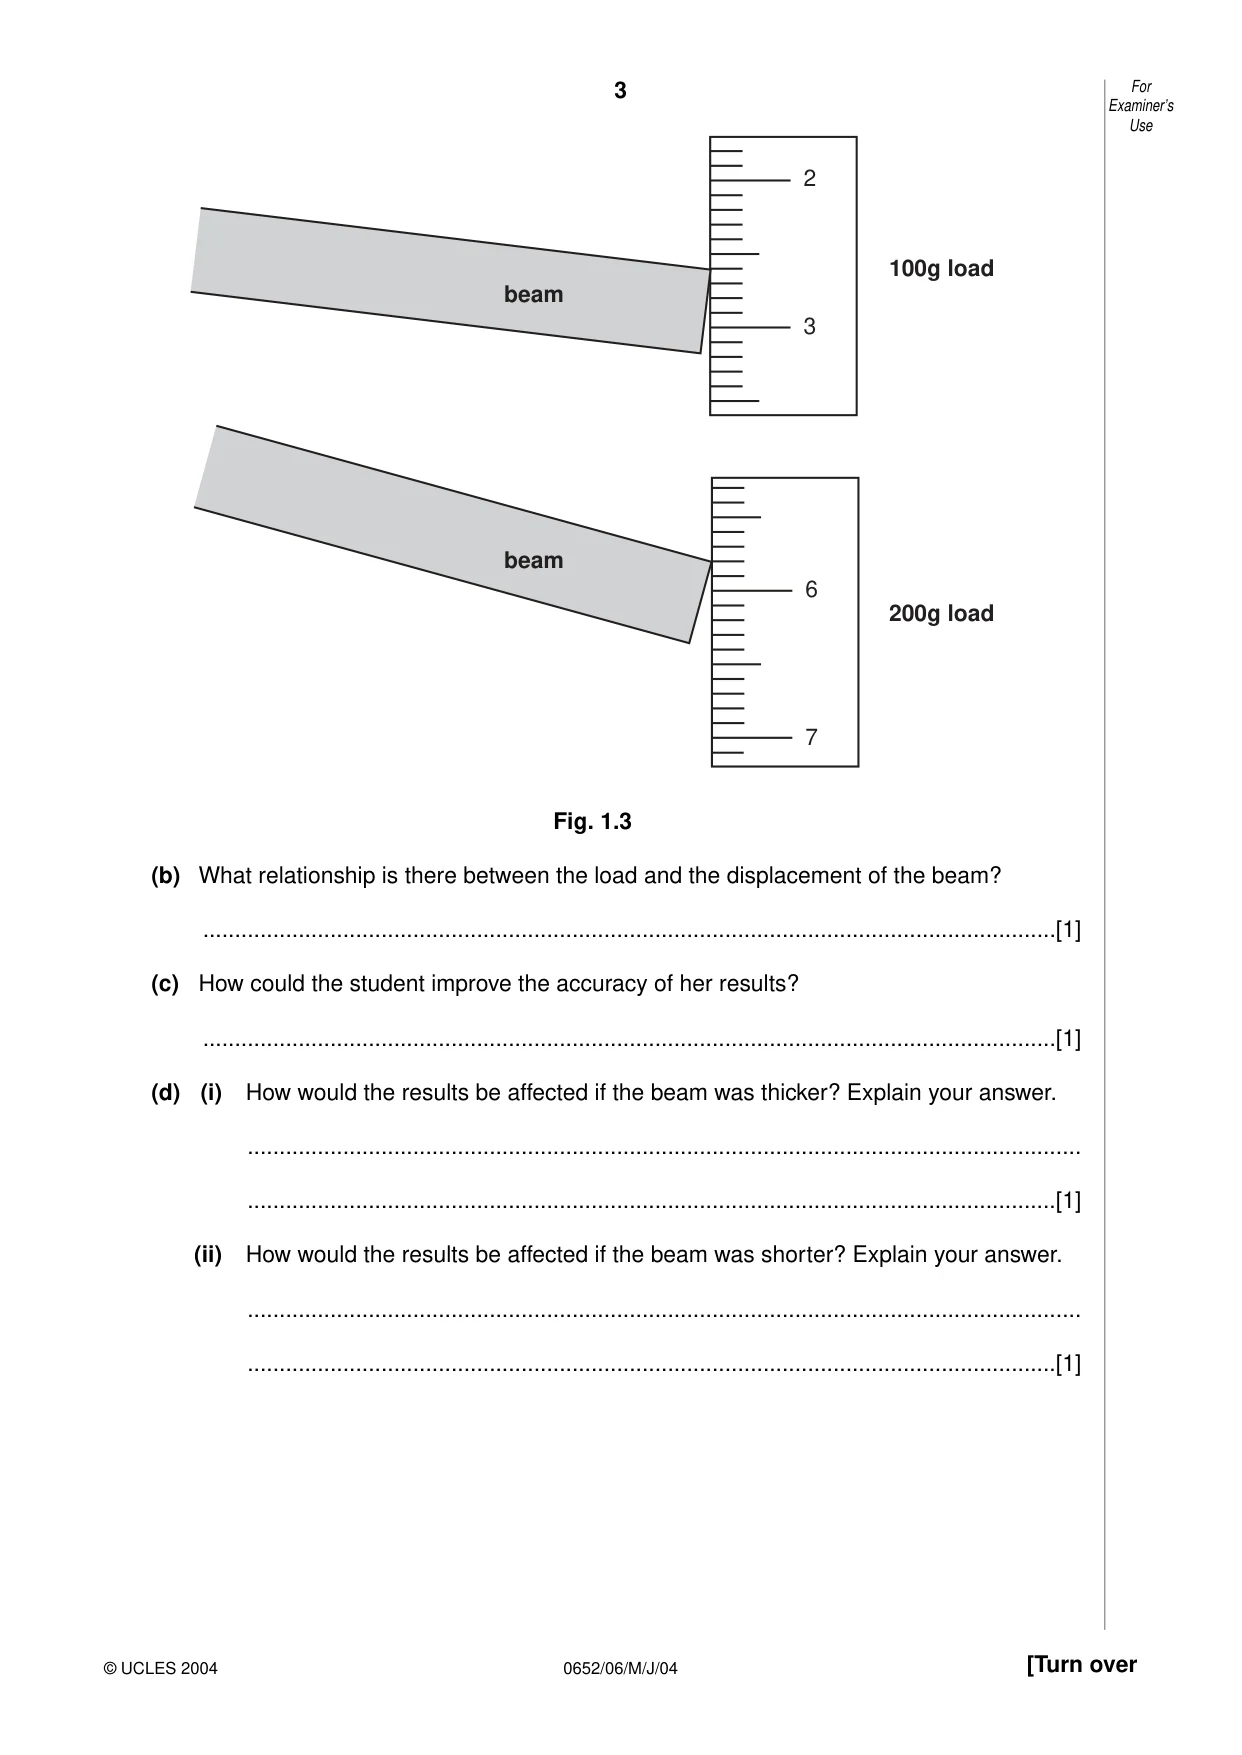
3 0652/06/M/J/04 [Turn over Fig. 1.3 (b) What relationship is there between the load and the displacement of the beam? …[1] (c) How could the student improve the accuracy of her results? …[1] (d) (i) How would the results be affected if the beam was thicker? Explain your answer. … …[1] (ii) How would the results be affected if the beam was shorter? Explain your answer. … …[1] 2 3 6 7 beam beam 100g load 200g load For Examiner’s Use © UCLES 2004
Question paper, page 4
4 0652/06/M/J/04 (e) Describe how the student could use this apparatus to measure the mass of an object that weighed between 200 g and 500 g. … … … … … … … …[4] For Examiner’s Use © UCLES 2004
Question paper, page 5
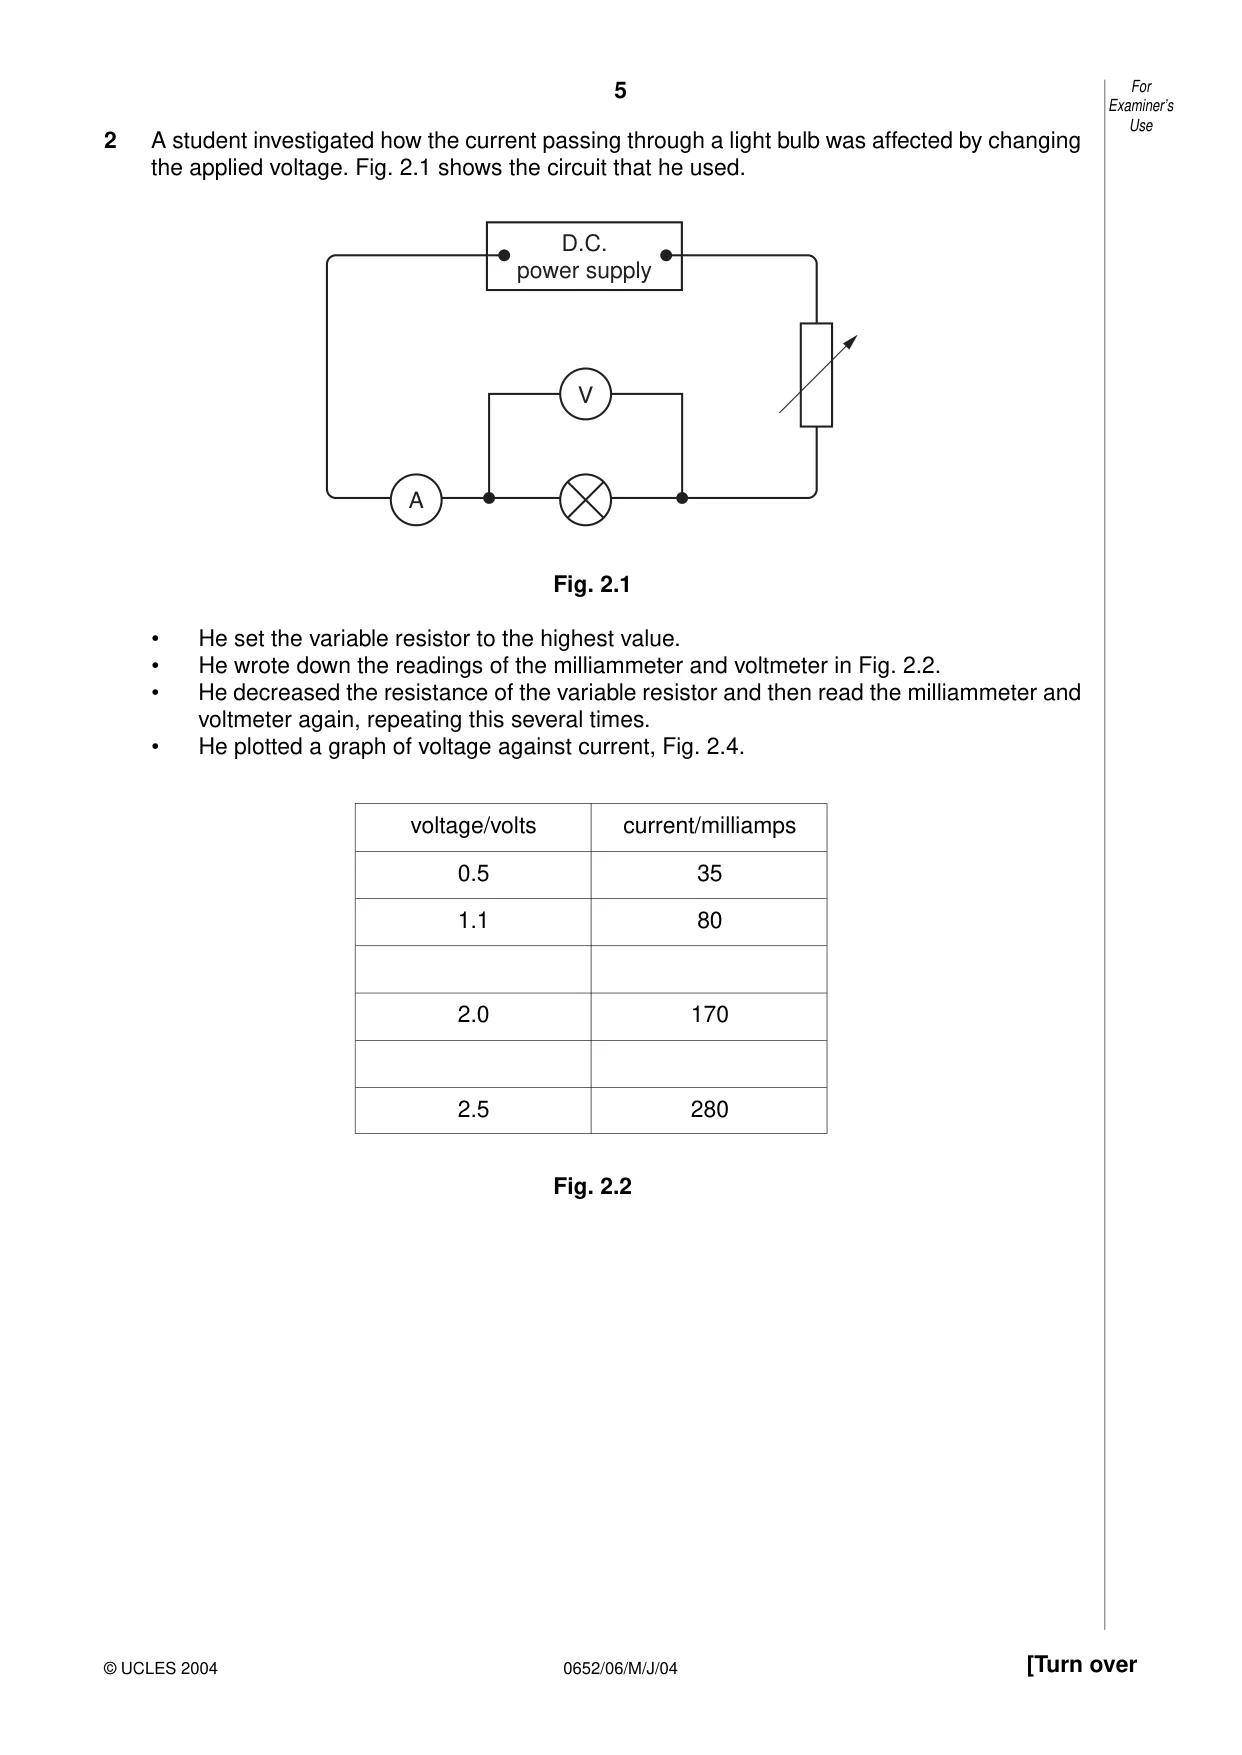
5 0652/06/M/J/04 [Turn over 2 A student investigated how the current passing through a light bulb was affected by changing the applied voltage. Fig. 2.1 shows the circuit that he used. Fig. 2.1 • He set the variable resistor to the highest value. • He wrote down the readings of the milliammeter and voltmeter in Fig. 2.2. • He decreased the resistance of the variable resistor and then read the milliammeter and voltmeter again, repeating this several times. • He plotted a graph of voltage against current, Fig. 2.4. Fig. 2.2 D.C. power supply For Examiner’s Use © UCLES 2004 voltage/volts current/milliamps 0.5 35 1.1 80 2.0 170 2.5 280
Question paper, page 6
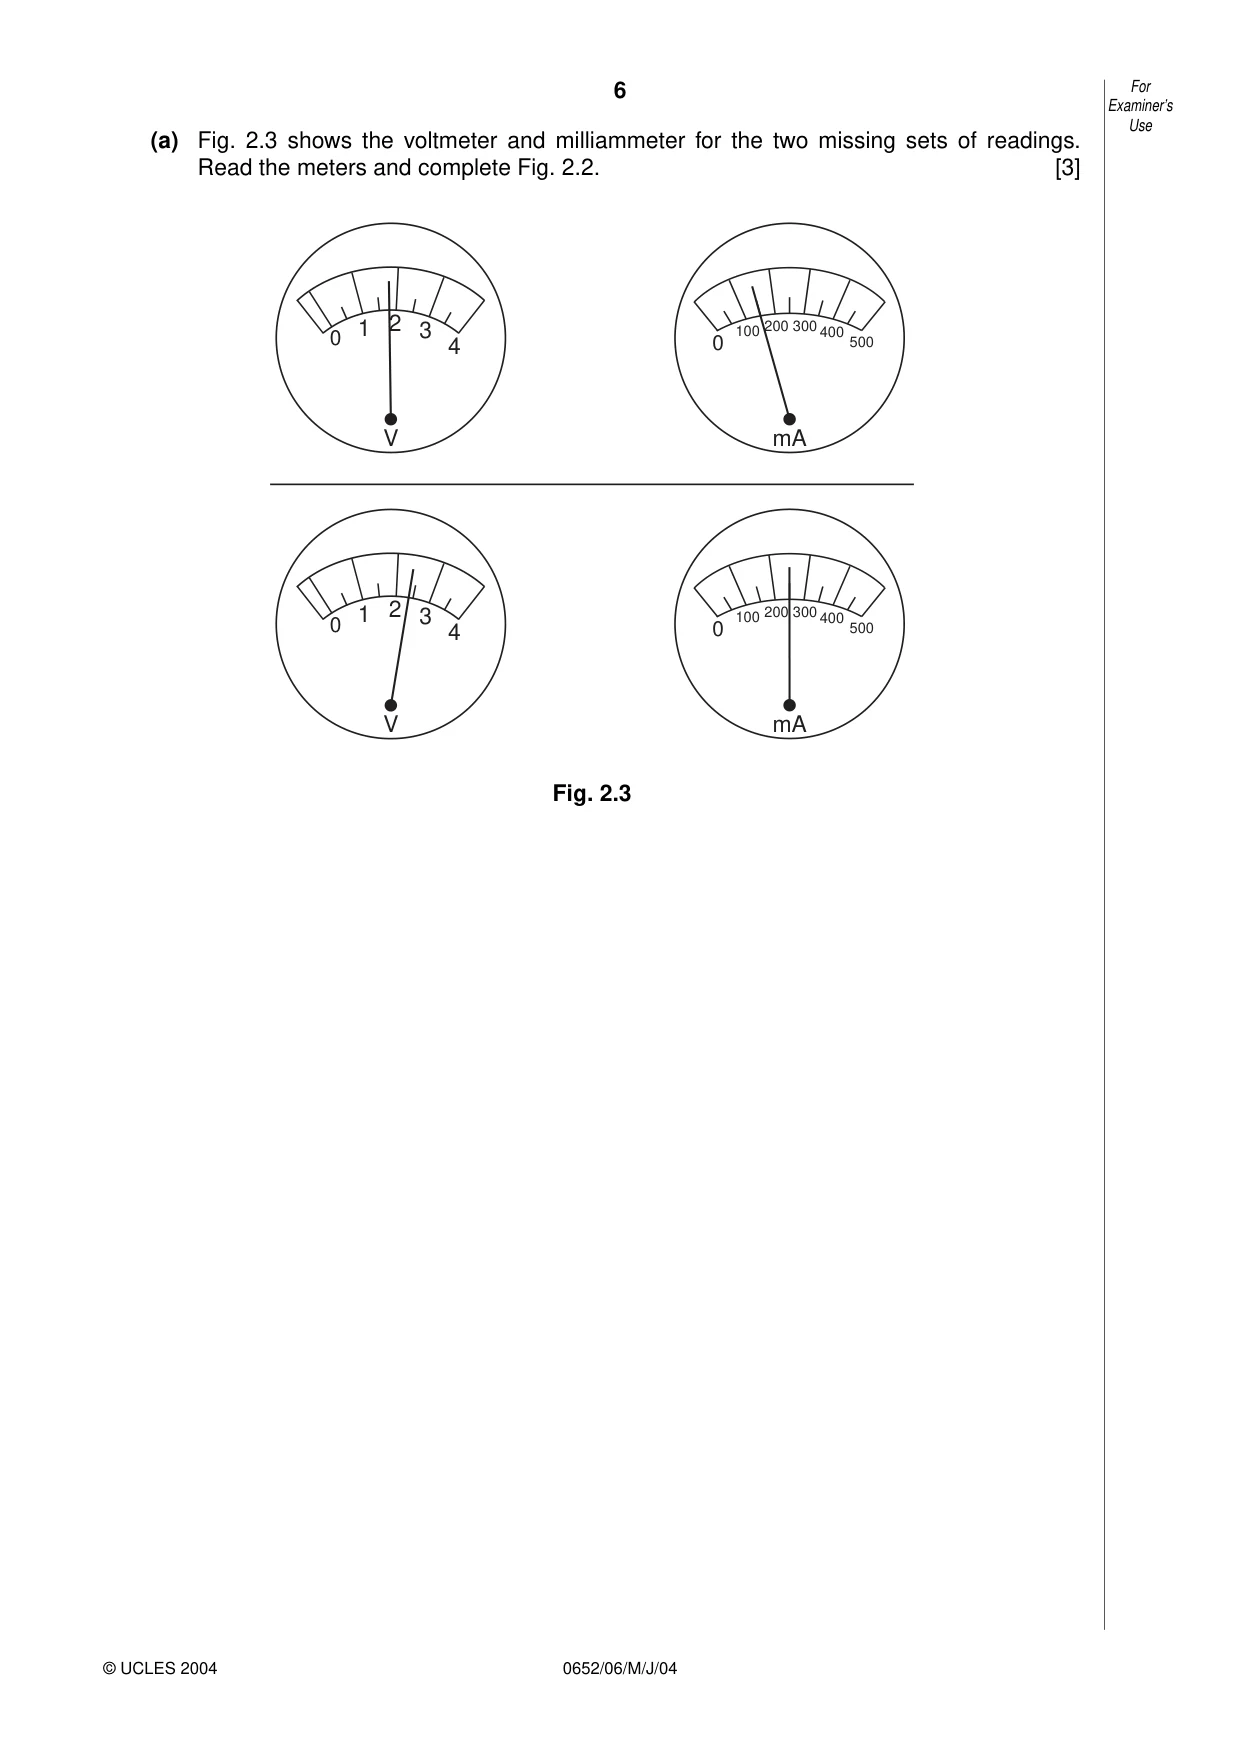
6 0652/06/M/J/04 (a) Fig. 2.3 shows the voltmeter and milliammeter for the two missing sets of readings. Read the meters and complete Fig. 2.2. [3] Fig. 2.3 0 500 400 300 200 100 mA 0 4 3 2 1 V 0 500 400 300 200 100 mA 0 4 3 2 1 V For Examiner’s Use © UCLES 2004
Question paper, page 7
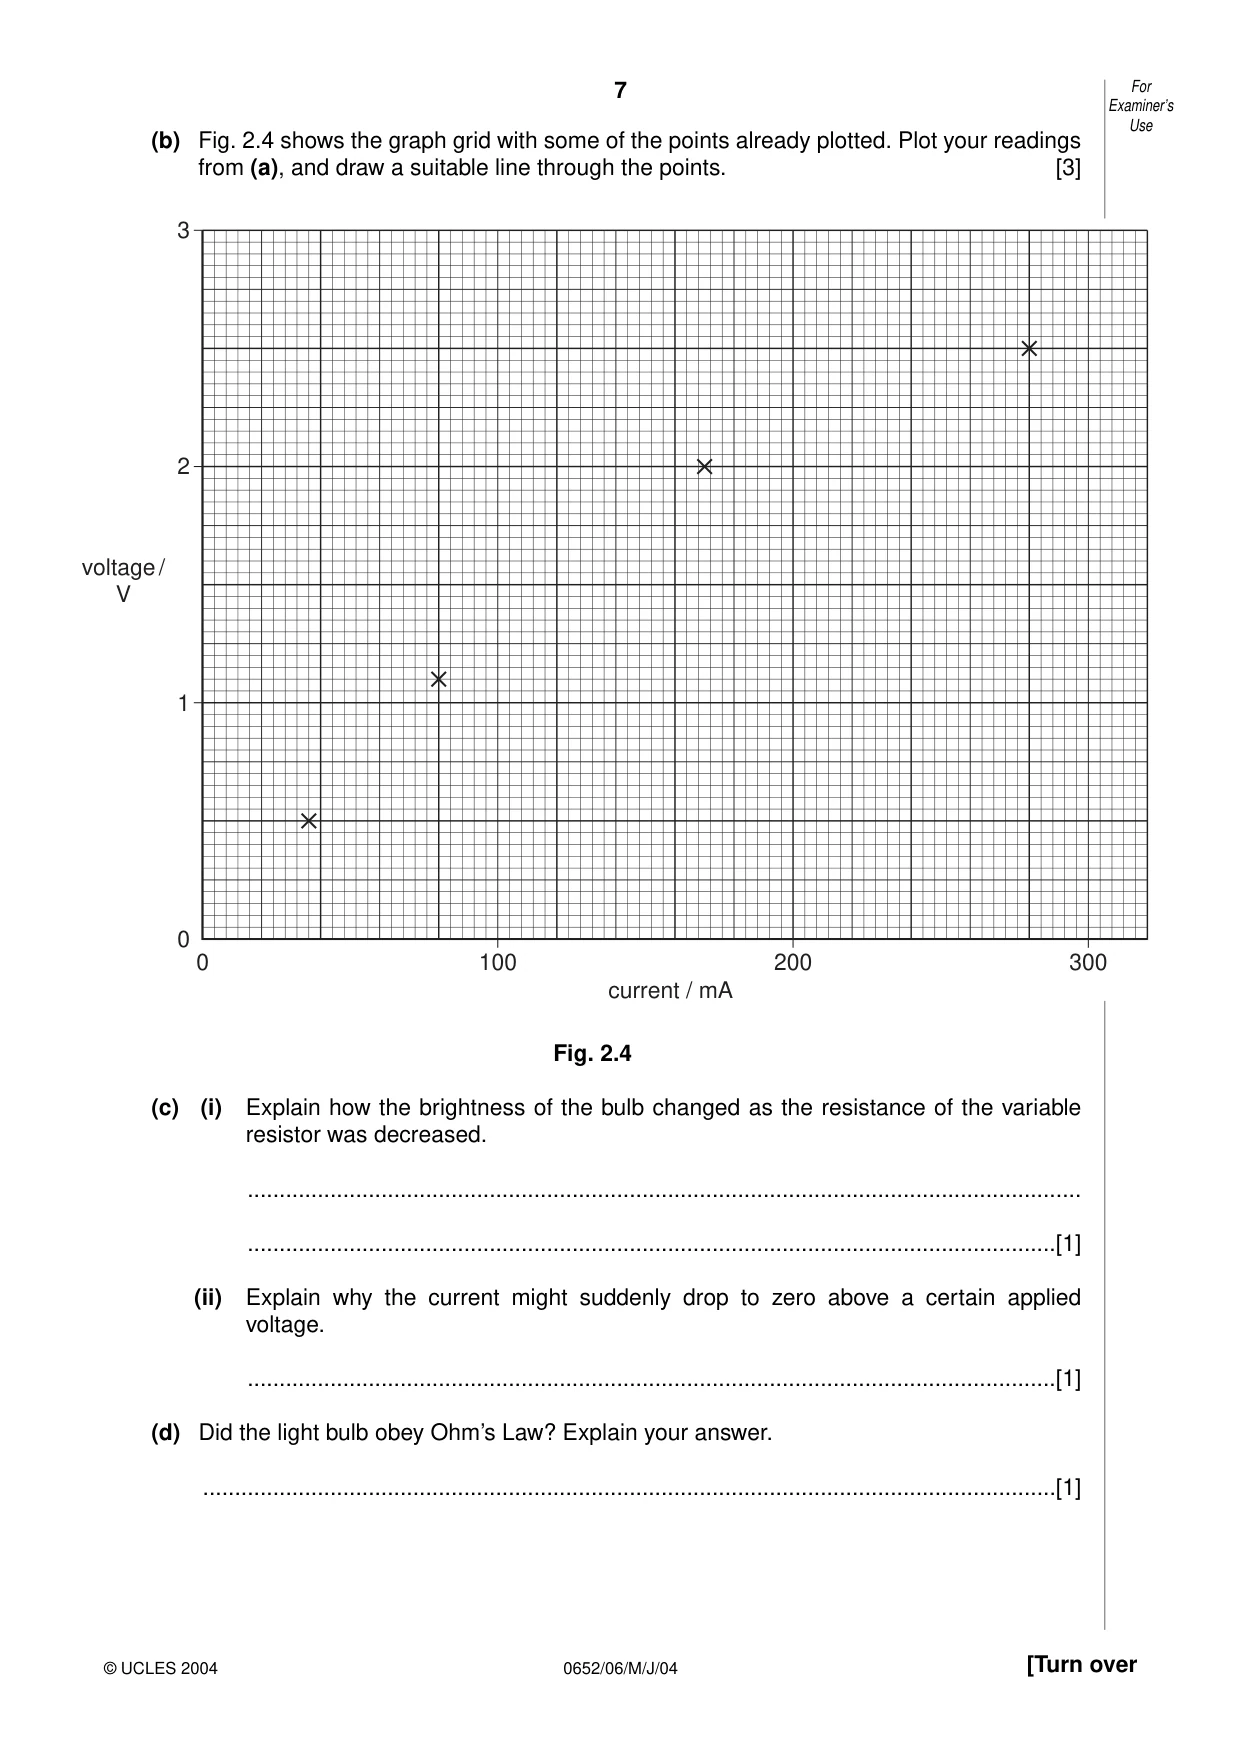
7 0652/06/M/J/04 [Turn over (b) Fig. 2.4 shows the graph grid with some of the points already plotted. Plot your readings from (a), and draw a suitable line through the points. [3] Fig. 2.4 (c) (i) Explain how the brightness of the bulb changed as the resistance of the variable resistor was decreased. … …[1] (ii) Explain why the current might suddenly drop to zero above a certain applied voltage. …[1] (d) Did the light bulb obey Ohm’s Law? Explain your answer. …[1] For Examiner’s Use © UCLES 2004 0 1 2 3 0 100 200 300 current / mA voltage / V
Question paper, page 8
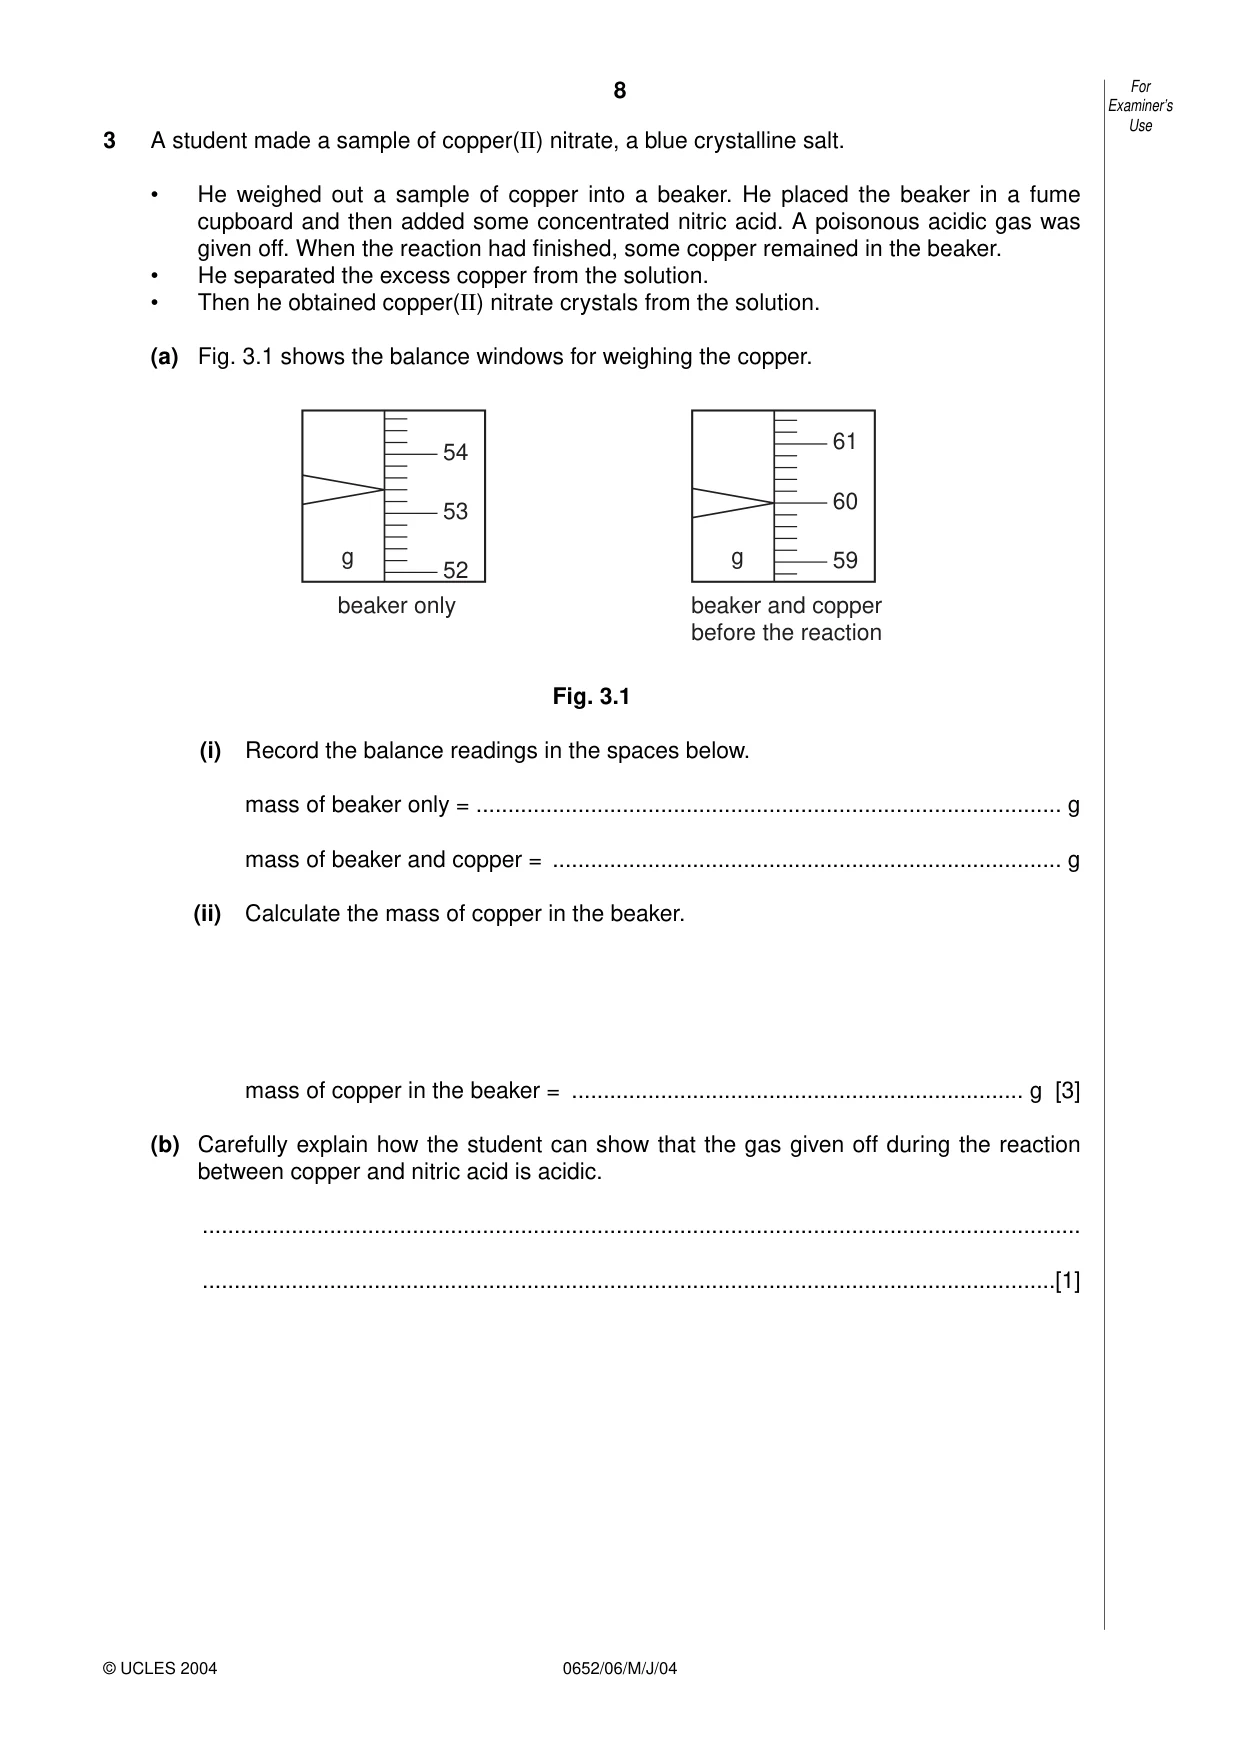
8 0652/06/M/J/04 3 A student made a sample of copper(II) nitrate, a blue crystalline salt. • He weighed out a sample of copper into a beaker. He placed the beaker in a fume cupboard and then added some concentrated nitric acid. A poisonous acidic gas was given off. When the reaction had finished, some copper remained in the beaker. • He separated the excess copper from the solution. • Then he obtained copper(II) nitrate crystals from the solution. (a) Fig. 3.1 shows the balance windows for weighing the copper. Fig. 3.1 (i) Record the balance readings in the spaces below. mass of beaker only = … g mass of beaker and copper = … g (ii) Calculate the mass of copper in the beaker. mass of copper in the beaker = … g [3] (b) Carefully explain how the student can show that the gas given off during the reaction between copper and nitric acid is acidic. … …[1] beaker only g 52 53 54 beaker and copper before the reaction g 59 60 61 For Examiner’s Use © UCLES 2004
Question paper, page 9
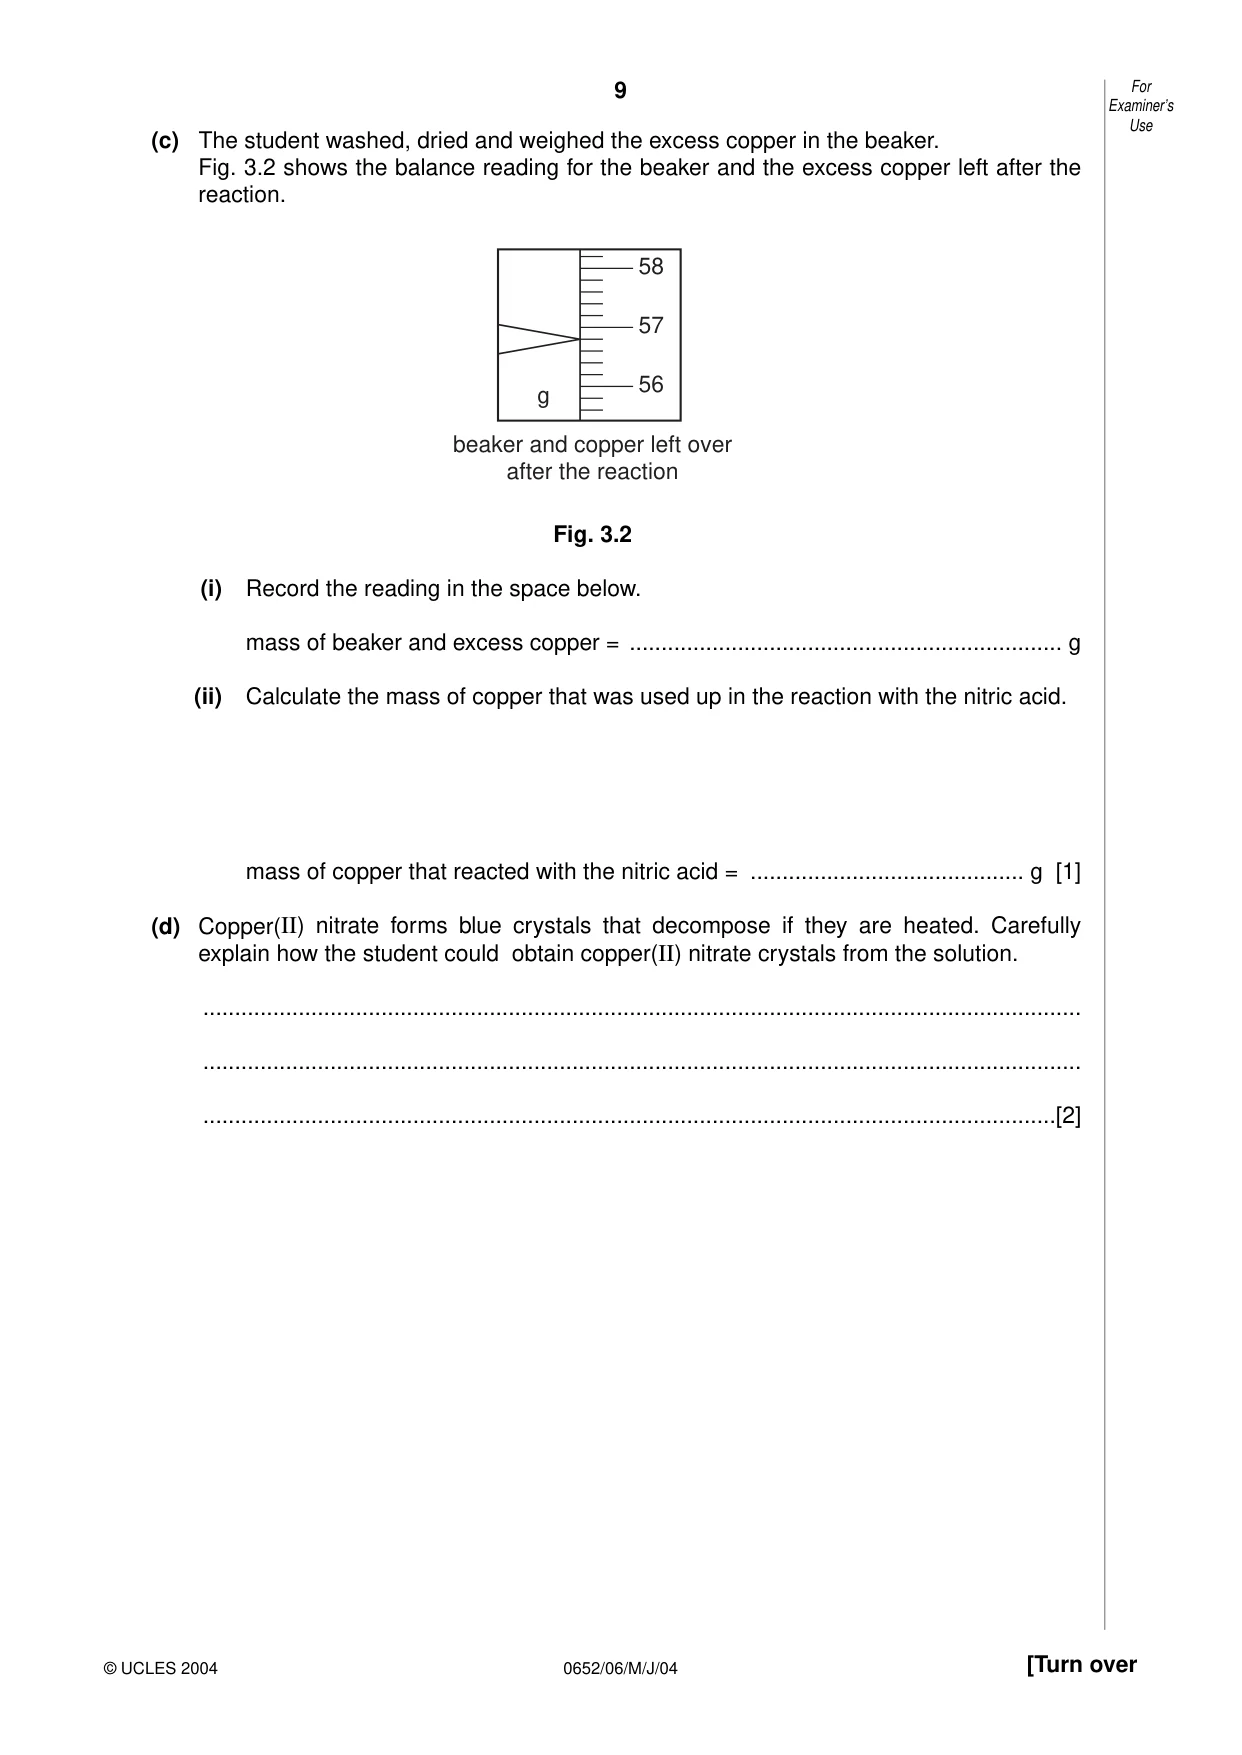
9 0652/06/M/J/04 [Turn over (c) The student washed, dried and weighed the excess copper in the beaker. Fig. 3.2 shows the balance reading for the beaker and the excess copper left after the reaction. Fig. 3.2 (i) Record the reading in the space below. mass of beaker and excess copper = … g (ii) Calculate the mass of copper that was used up in the reaction with the nitric acid. mass of copper that reacted with the nitric acid = … g [1] (d) Copper(II) nitrate forms blue crystals that decompose if they are heated. Carefully explain how the student could obtain copper(II) nitrate crystals from the solution. … … …[2] beaker and copper left over after the reaction g 56 57 58 For Examiner’s Use © UCLES 2004
Question paper, page 10
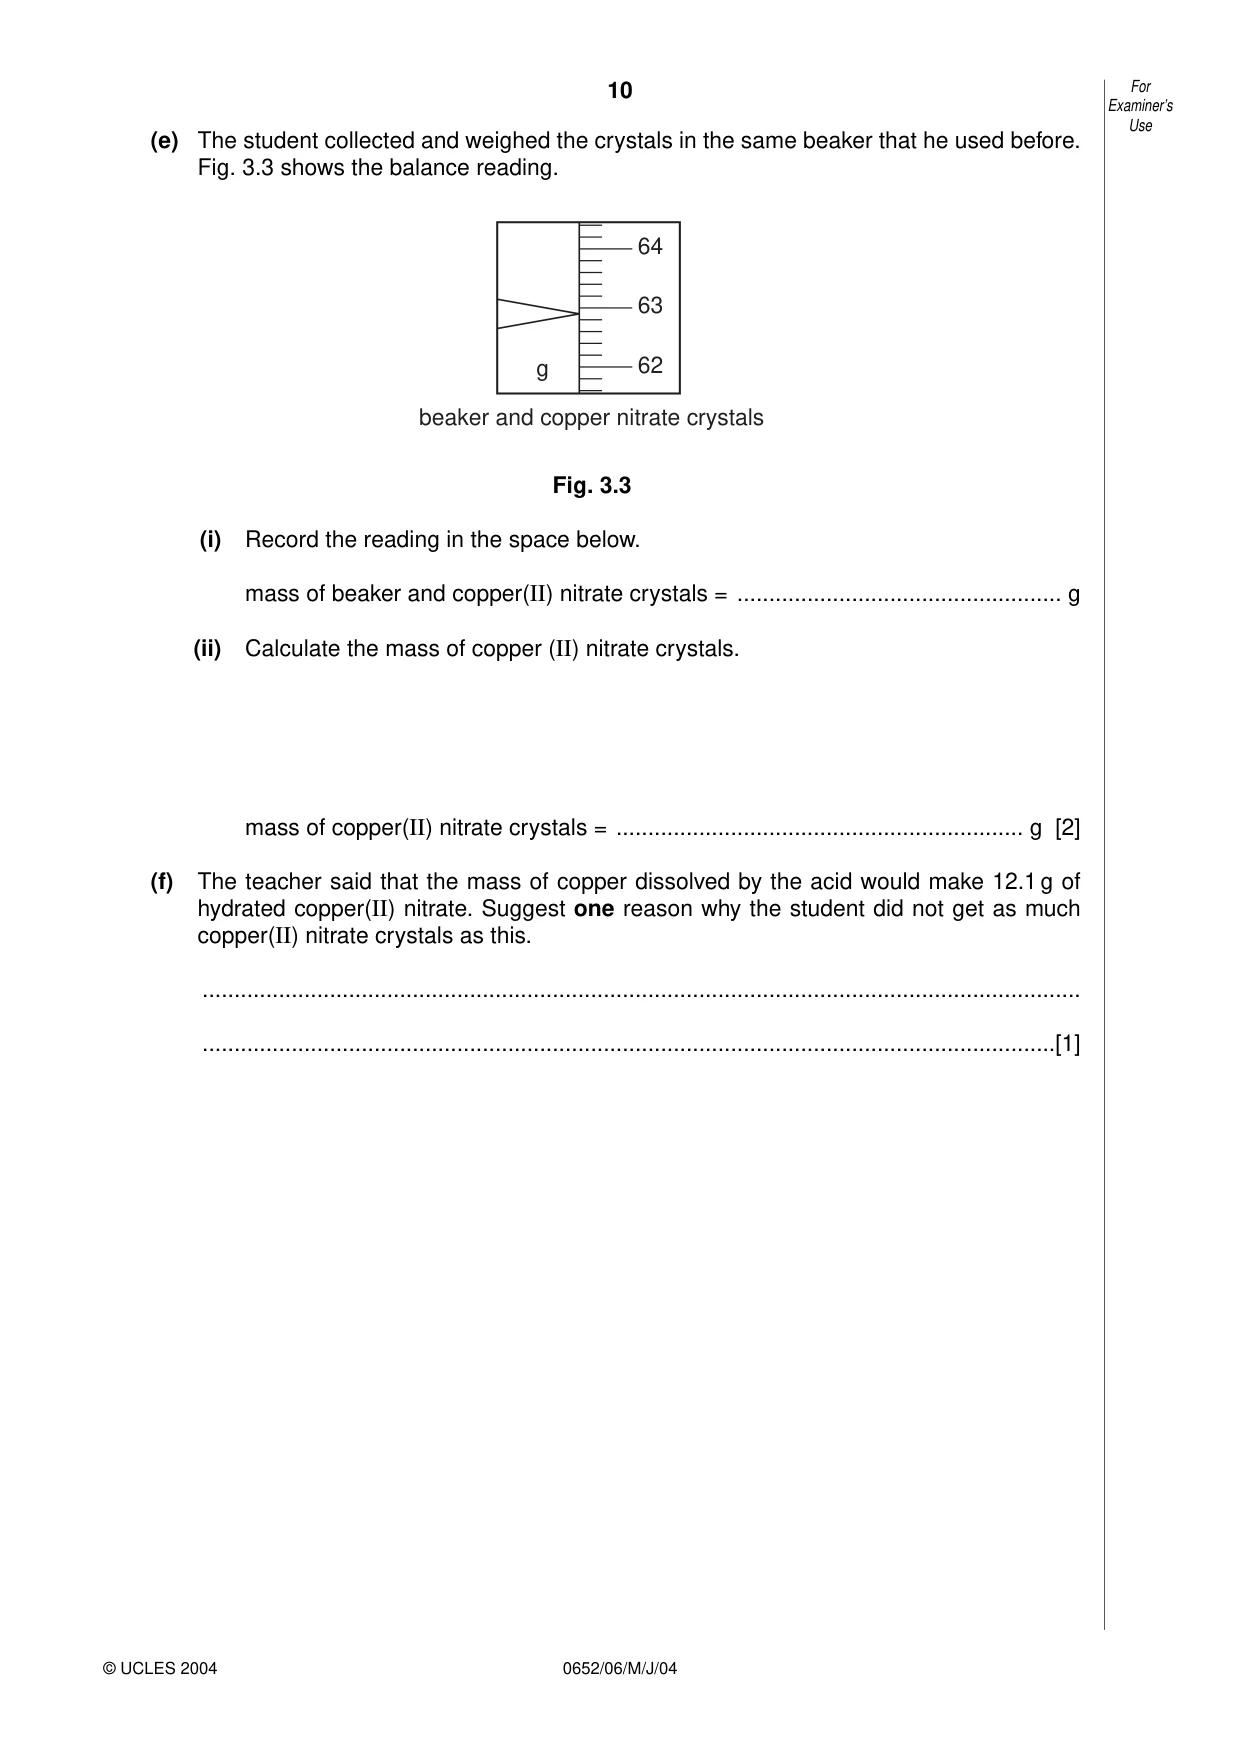
10 0652/06/M/J/04 (e) The student collected and weighed the crystals in the same beaker that he used before. Fig. 3.3 shows the balance reading. Fig. 3.3 (i) Record the reading in the space below. mass of beaker and copper(II) nitrate crystals = … g (ii) Calculate the mass of copper (II) nitrate crystals. mass of copper(II) nitrate crystals = … g [2] (f) The teacher said that the mass of copper dissolved by the acid would make 12.1 g of hydrated copper(II) nitrate. Suggest one reason why the student did not get as much copper(II) nitrate crystals as this. … …[1] beaker and copper nitrate crystals g 62 63 64 For Examiner’s Use © UCLES 2004
Question paper, page 11
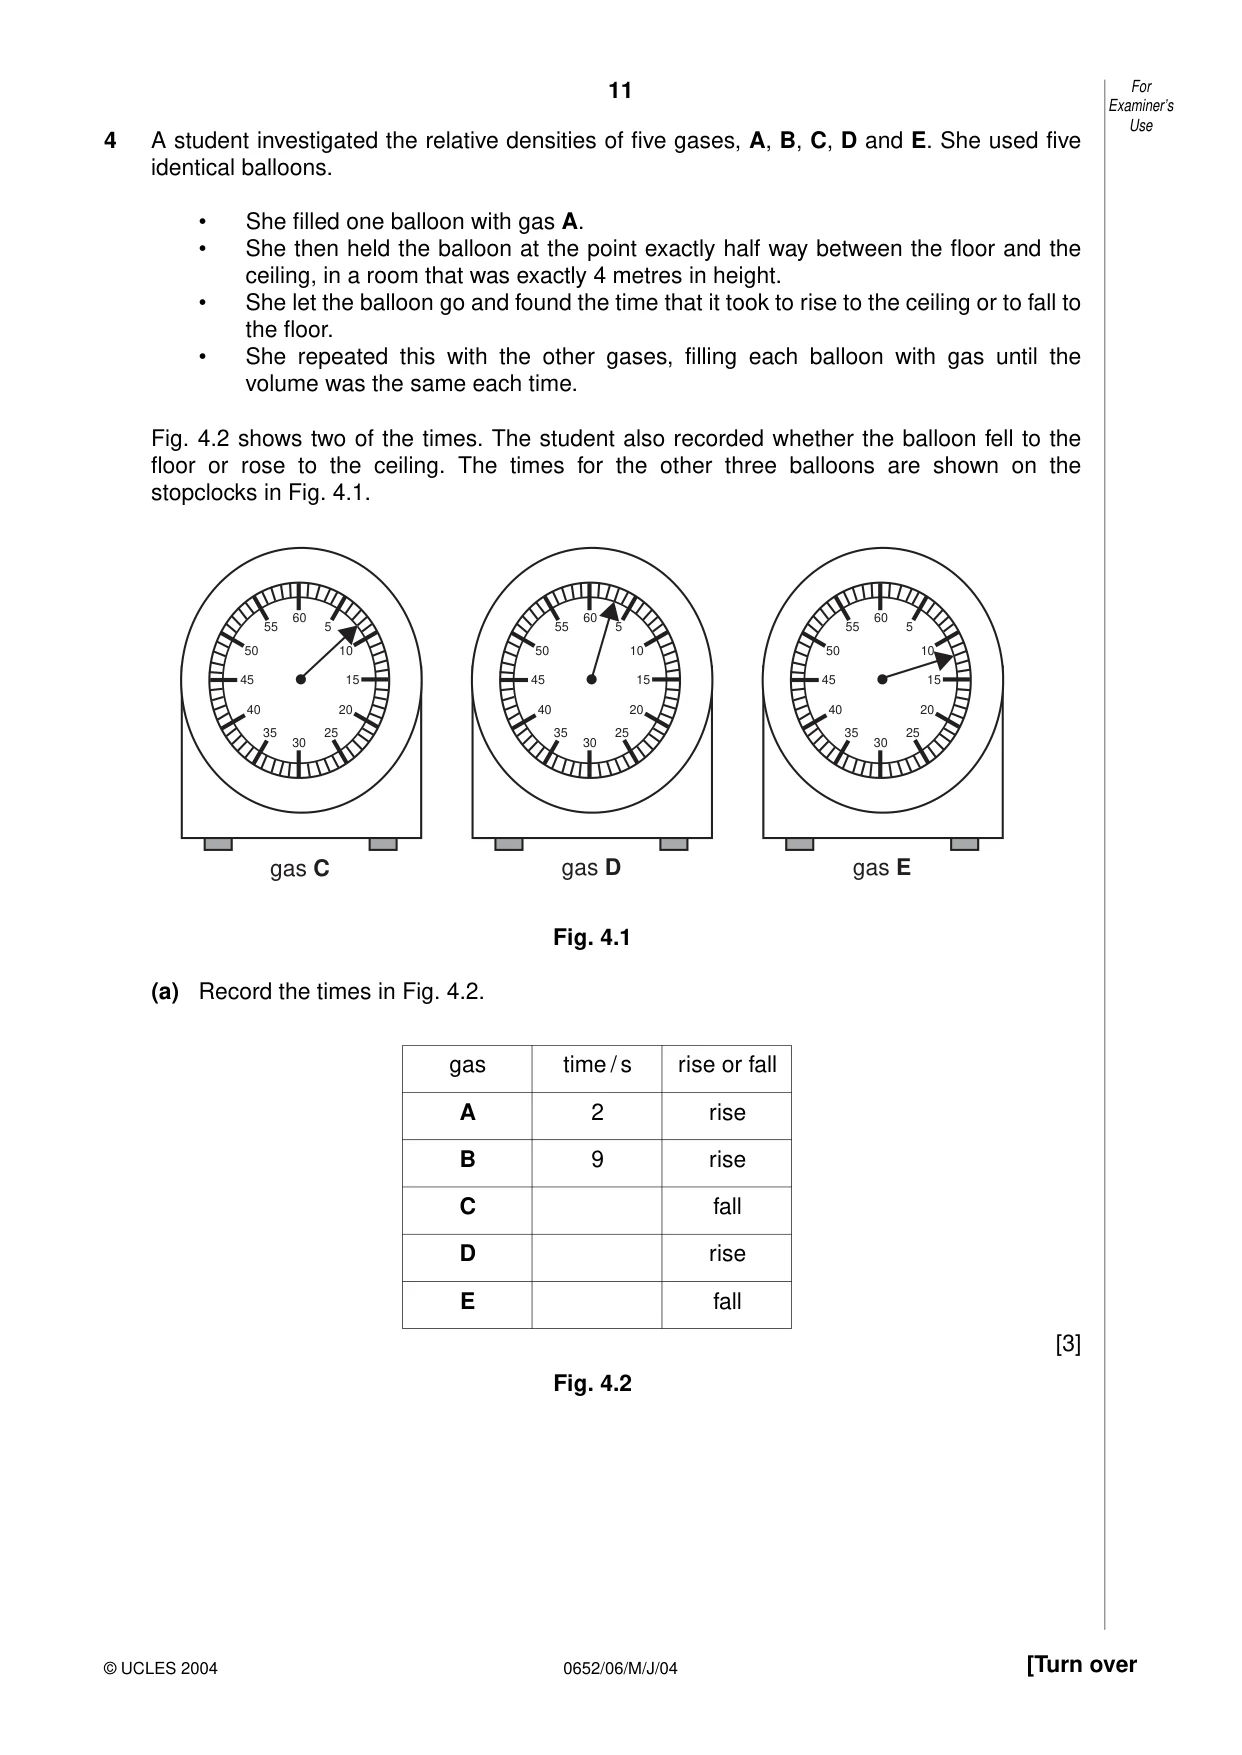
11 0652/06/M/J/04 [Turn over 4 A student investigated the relative densities of five gases, A, B, C, D and E. She used five identical balloons. • She filled one balloon with gas A. • She then held the balloon at the point exactly half way between the floor and the ceiling, in a room that was exactly 4 metres in height. • She let the balloon go and found the time that it took to rise to the ceiling or to fall to the floor. • She repeated this with the other gases, filling each balloon with gas until the volume was the same each time. Fig. 4.2 shows two of the times. The student also recorded whether the balloon fell to the floor or rose to the ceiling. The times for the other three balloons are shown on the stopclocks in Fig. 4.1. Fig. 4.1 (a) Record the times in Fig. 4.2. [3] Fig. 4.2 60 5 10 15 20 25 30 35 40 45 50 55 60 5 10 15 20 25 30 35 40 45 50 55 60 5 10 15 20 25 30 35 40 45 50 55 gas C gas D gas E For Examiner’s Use © UCLES 2004 gas time / s rise or fall A 2 rise B 9 rise C fall D rise E fall
Question paper, page 12
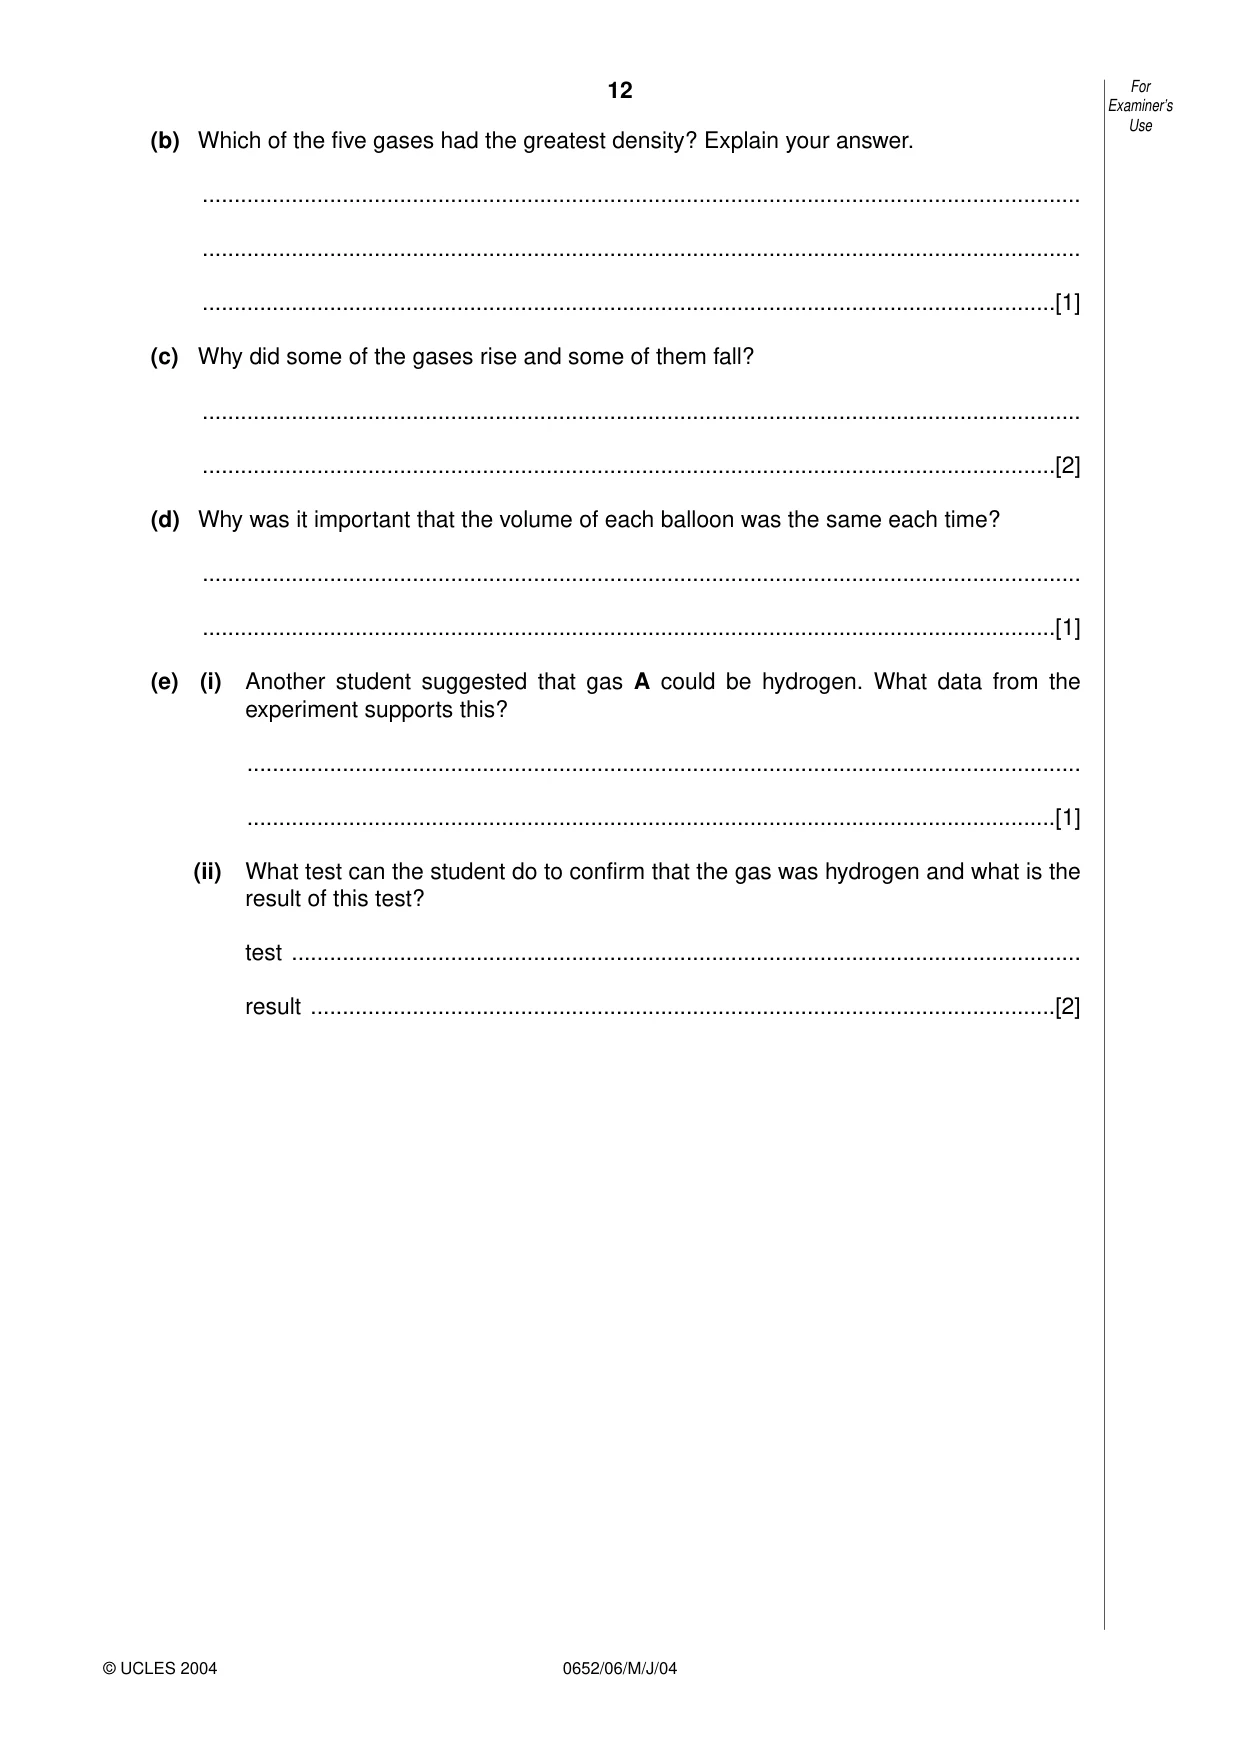
12 0652/06/M/J/04 (b) Which of the five gases had the greatest density? Explain your answer. … … …[1] (c) Why did some of the gases rise and some of them fall? … …[2] (d) Why was it important that the volume of each balloon was the same each time? … …[1] (e) (i) Another student suggested that gas A could be hydrogen. What data from the experiment supports this? … …[1] (ii) What test can the student do to confirm that the gas was hydrogen and what is the result of this test? test … result …[2] For Examiner’s Use © UCLES 2004
Question paper, page 13
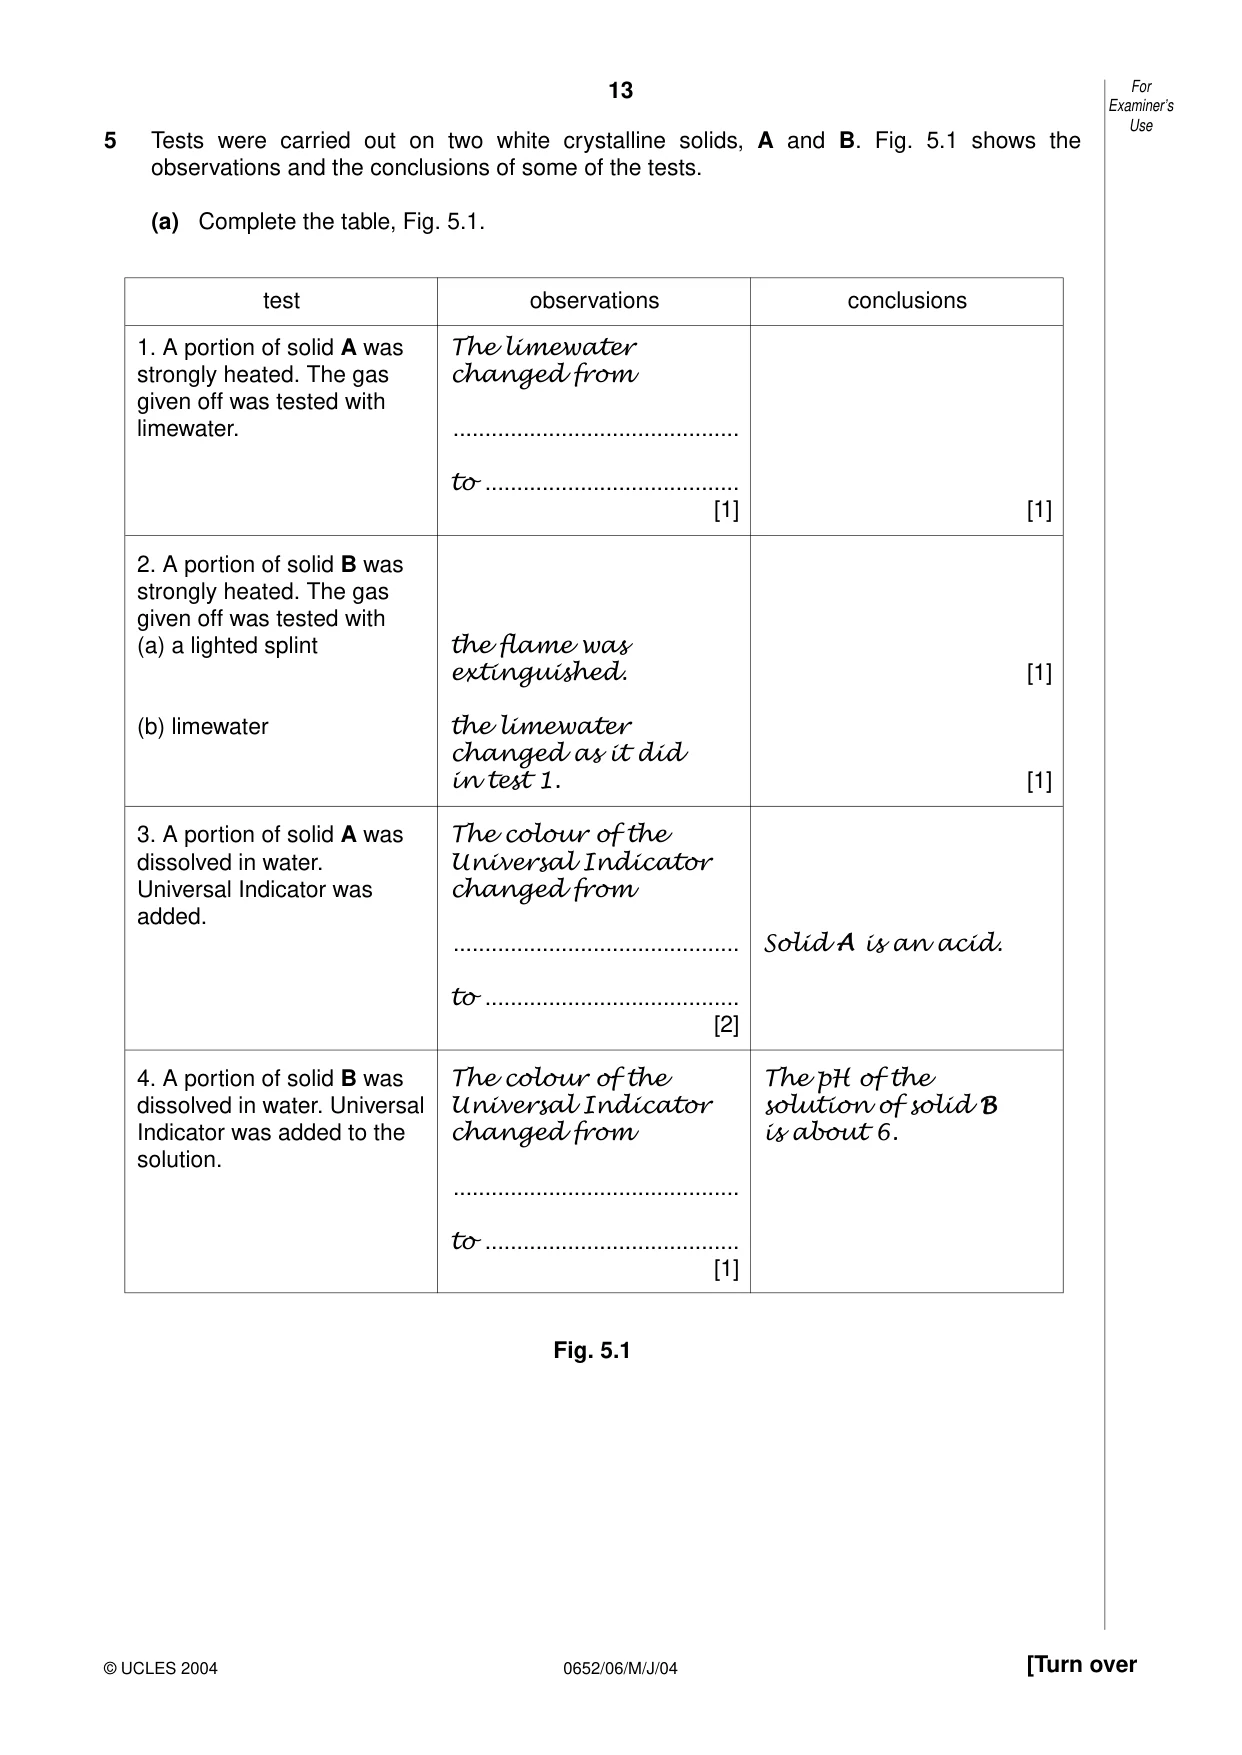
13 0652/06/M/J/04 [Turn over 5 Tests were carried out on two white crystalline solids, A and B. Fig. 5.1 shows the observations and the conclusions of some of the tests. (a) Complete the table, Fig. 5.1. Fig. 5.1 For Examiner’s Use © UCLES 2004 test observations conclusions 1. A portion of solid A was The limewater strongly heated. The gas changed from given off was tested with limewater. … to … [1] [1] 2. A portion of solid B was strongly heated. The gas given off was tested with (a) a lighted splint the flame was extinguished. [1] (b) limewater the limewater changed as it did in test 1. [1] 3. A portion of solid A was The colour of the dissolved in water. Universal Indicator Universal Indicator was changed from added. … Solid A is an acid. to … [2] 4. A portion of solid B was The colour of the The pH of the dissolved in water. Universal Universal Indicator solution of solid B Indicator was added to the changed from is about 6. solution. … to … [1]
Question paper, page 14
14 0652/06/M/J/04 (b) When solid A is mixed with solid B and water is added, a gas is given off. Describe how you would measure the volume of this gas. You can answer this question by drawing a labelled diagram in the space below. [3] 6 A student read that an object floats in water when its density is less than that of water. When the density of the object is just greater than that of water, it will sink. When the mass in g of a vessel placed in water is just greater than its volume in cm3, it will sink, since the density of water is equal to 1 g / cm3. The student decided to test this statement by carrying out an experiment using a plastic drinking cup. (a) To find the volume of water that the cup would hold, he filled a measuring cylinder up to the 250 cm3 mark. He poured water from the measuring cylinder into the cup until it was completely full. He did not let any water spill over. Suggest a way of putting the last few drops of water into the cup so that it is full but not spilling over. …[1] For Examiner’s Use © UCLES 2004
Question paper, page 15
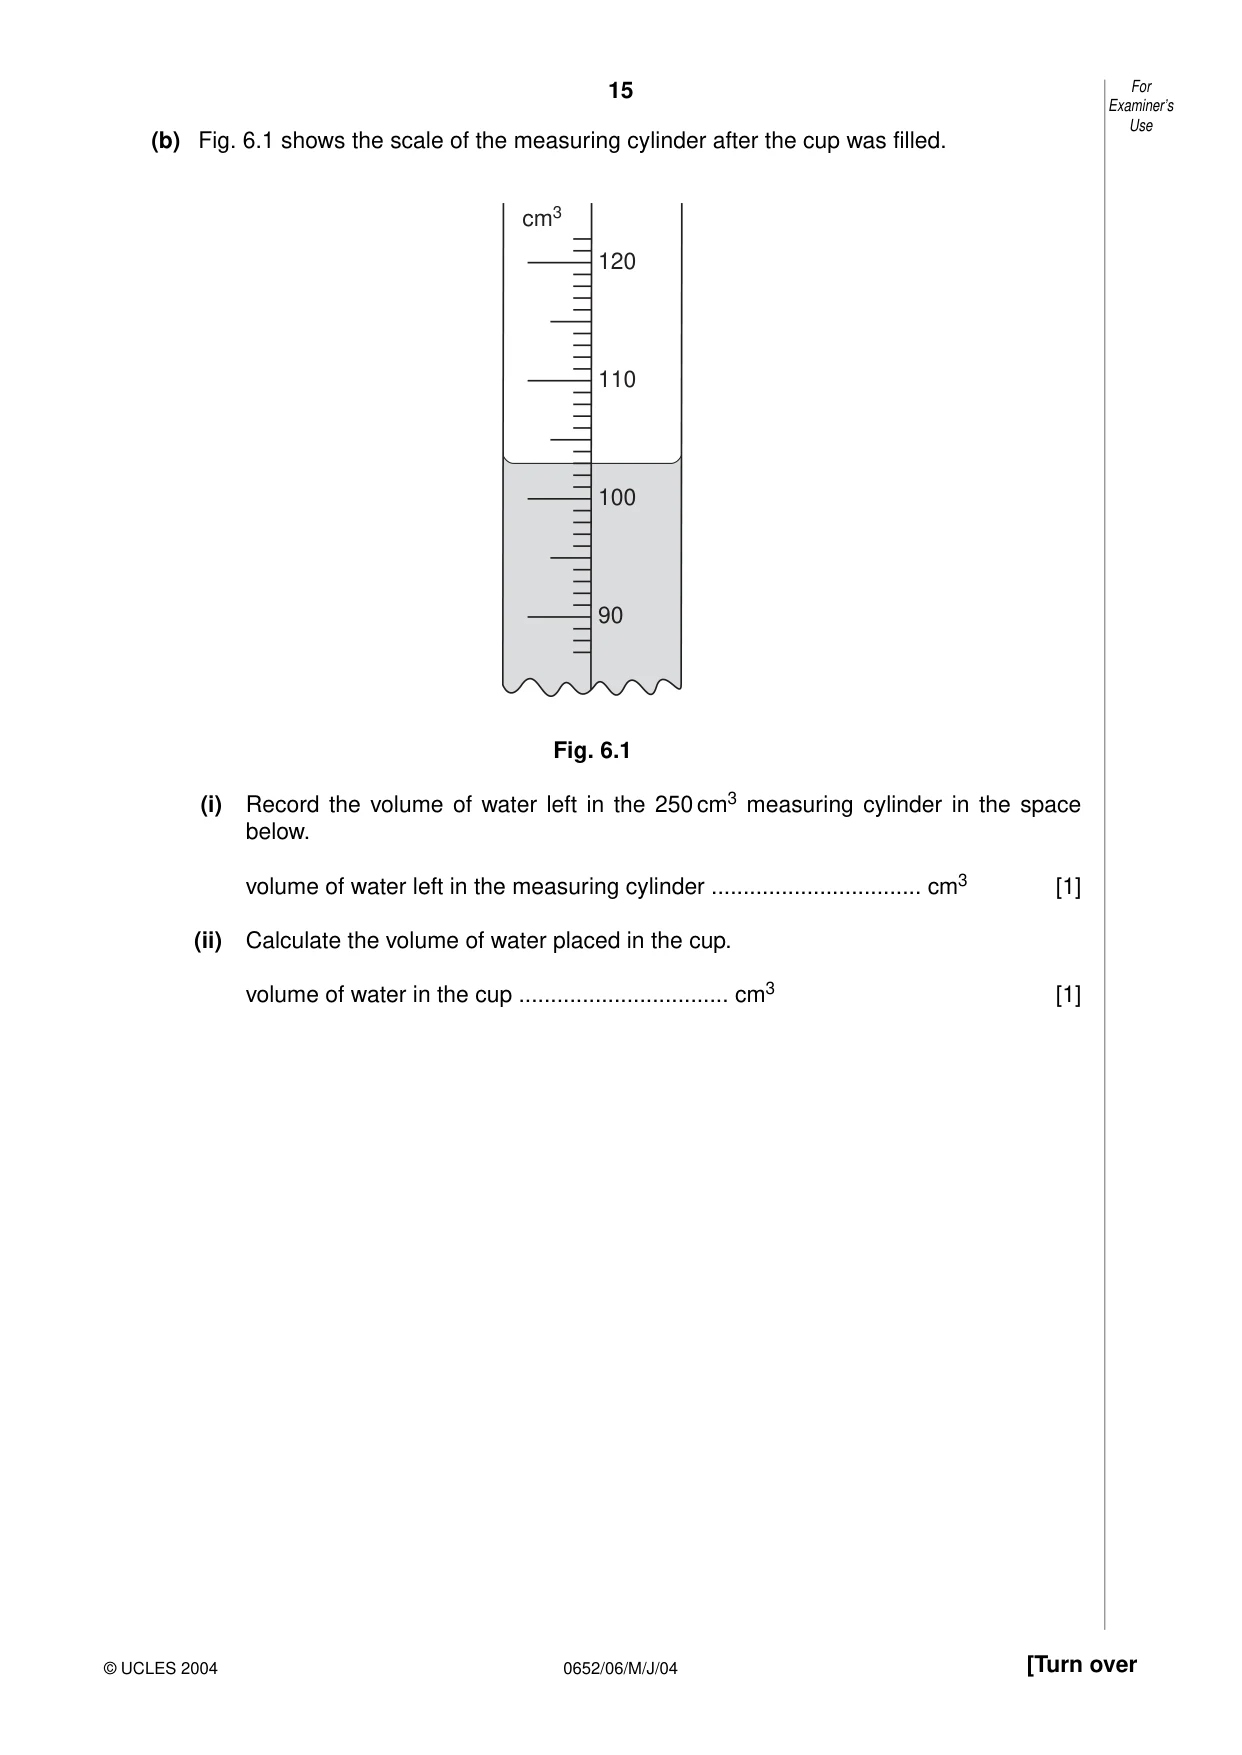
15 0652/06/M/J/04 [Turn over (b) Fig. 6.1 shows the scale of the measuring cylinder after the cup was filled. Fig. 6.1 (i) Record the volume of water left in the 250 cm3 measuring cylinder in the space below. volume of water left in the measuring cylinder … cm3 [1] (ii) Calculate the volume of water placed in the cup. volume of water in the cup … cm3 [1] cm3 120 110 100 90 For Examiner’s Use © UCLES 2004
Question paper, page 16
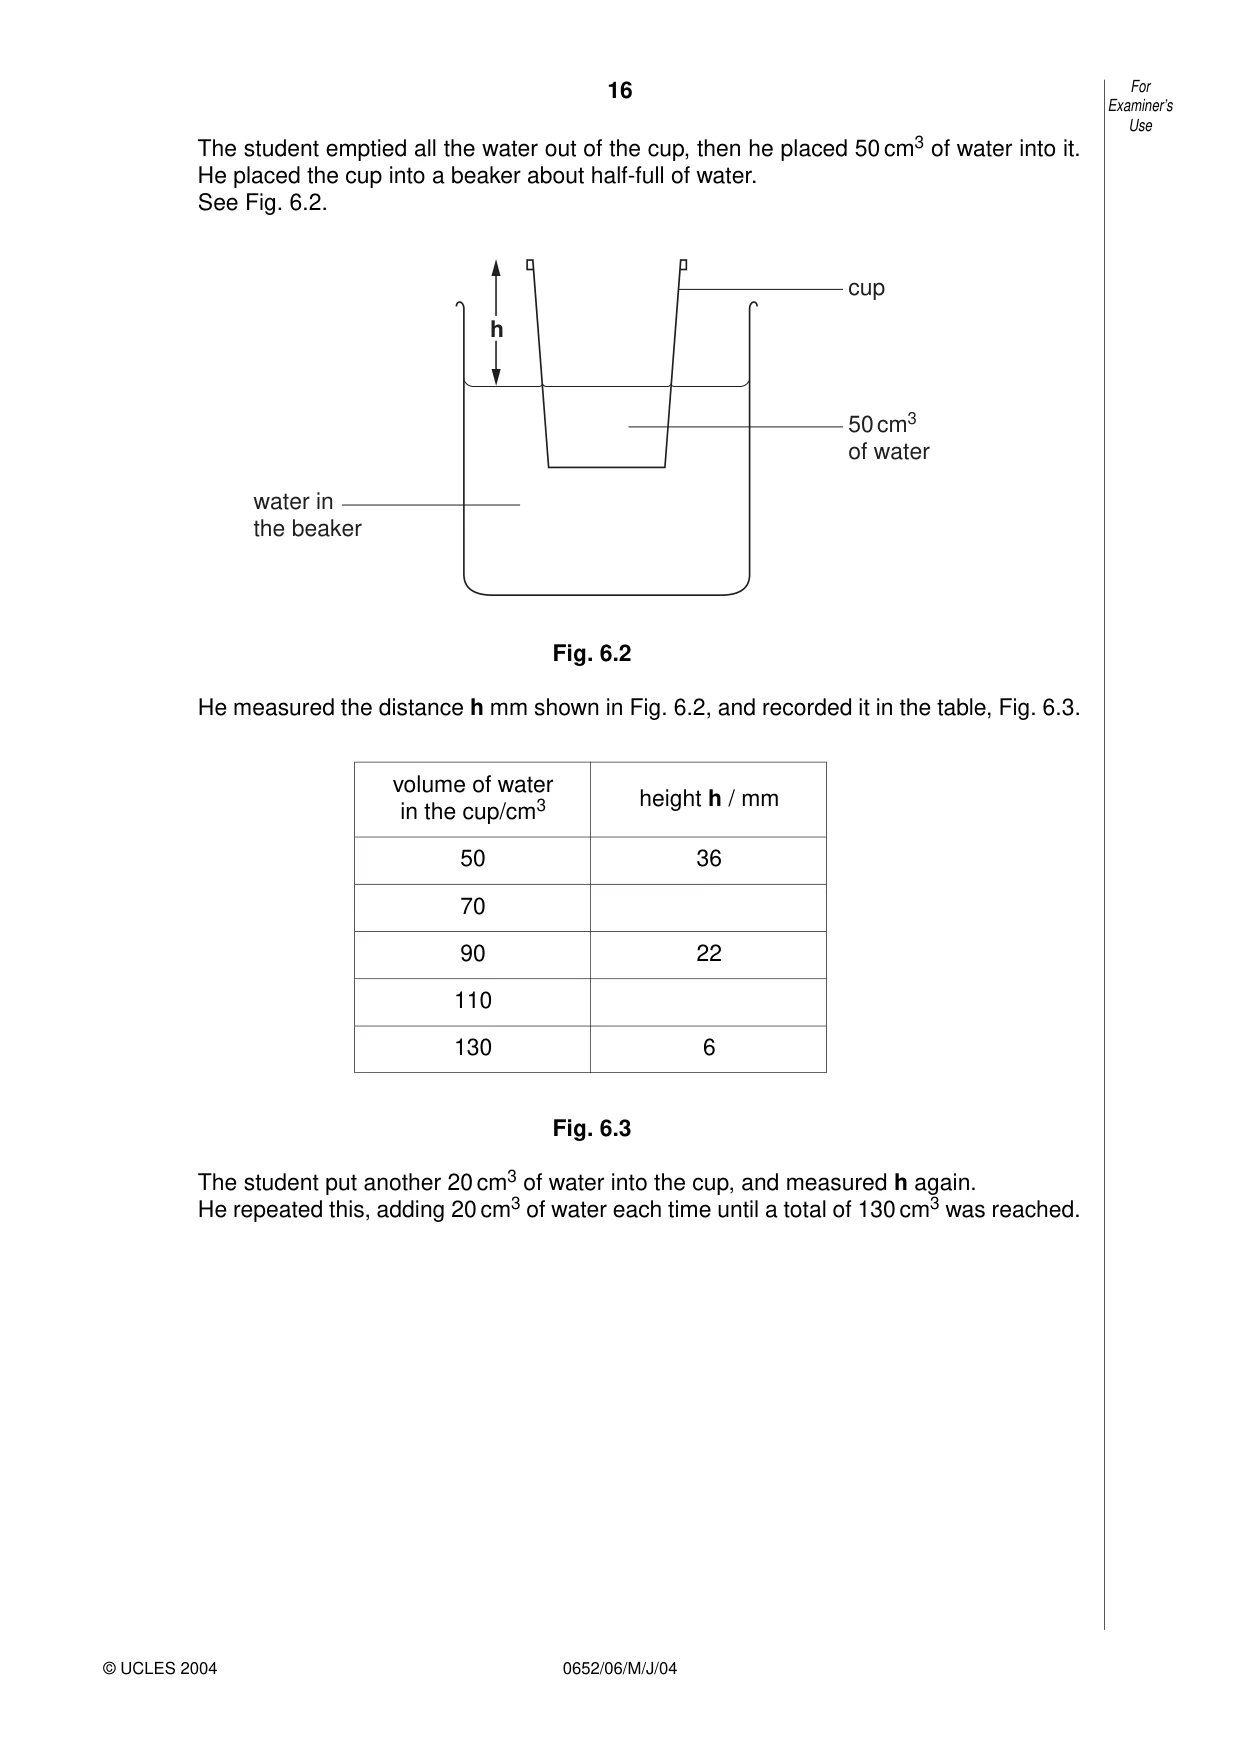
16 0652/06/M/J/04 The student emptied all the water out of the cup, then he placed 50 cm3 of water into it. He placed the cup into a beaker about half-full of water. See Fig. 6.2. Fig. 6.2 He measured the distance h mm shown in Fig. 6.2, and recorded it in the table, Fig. 6.3. Fig. 6.3 The student put another 20 cm3 of water into the cup, and measured h again. He repeated this, adding 20 cm3 of water each time until a total of 130 cm3 was reached. h cup 50 cm3 of water water in the beaker For Examiner’s Use © UCLES 2004 volume of water height h / mm in the cup/cm3 50 36 70 90 22 110 130 6
Question paper, page 17
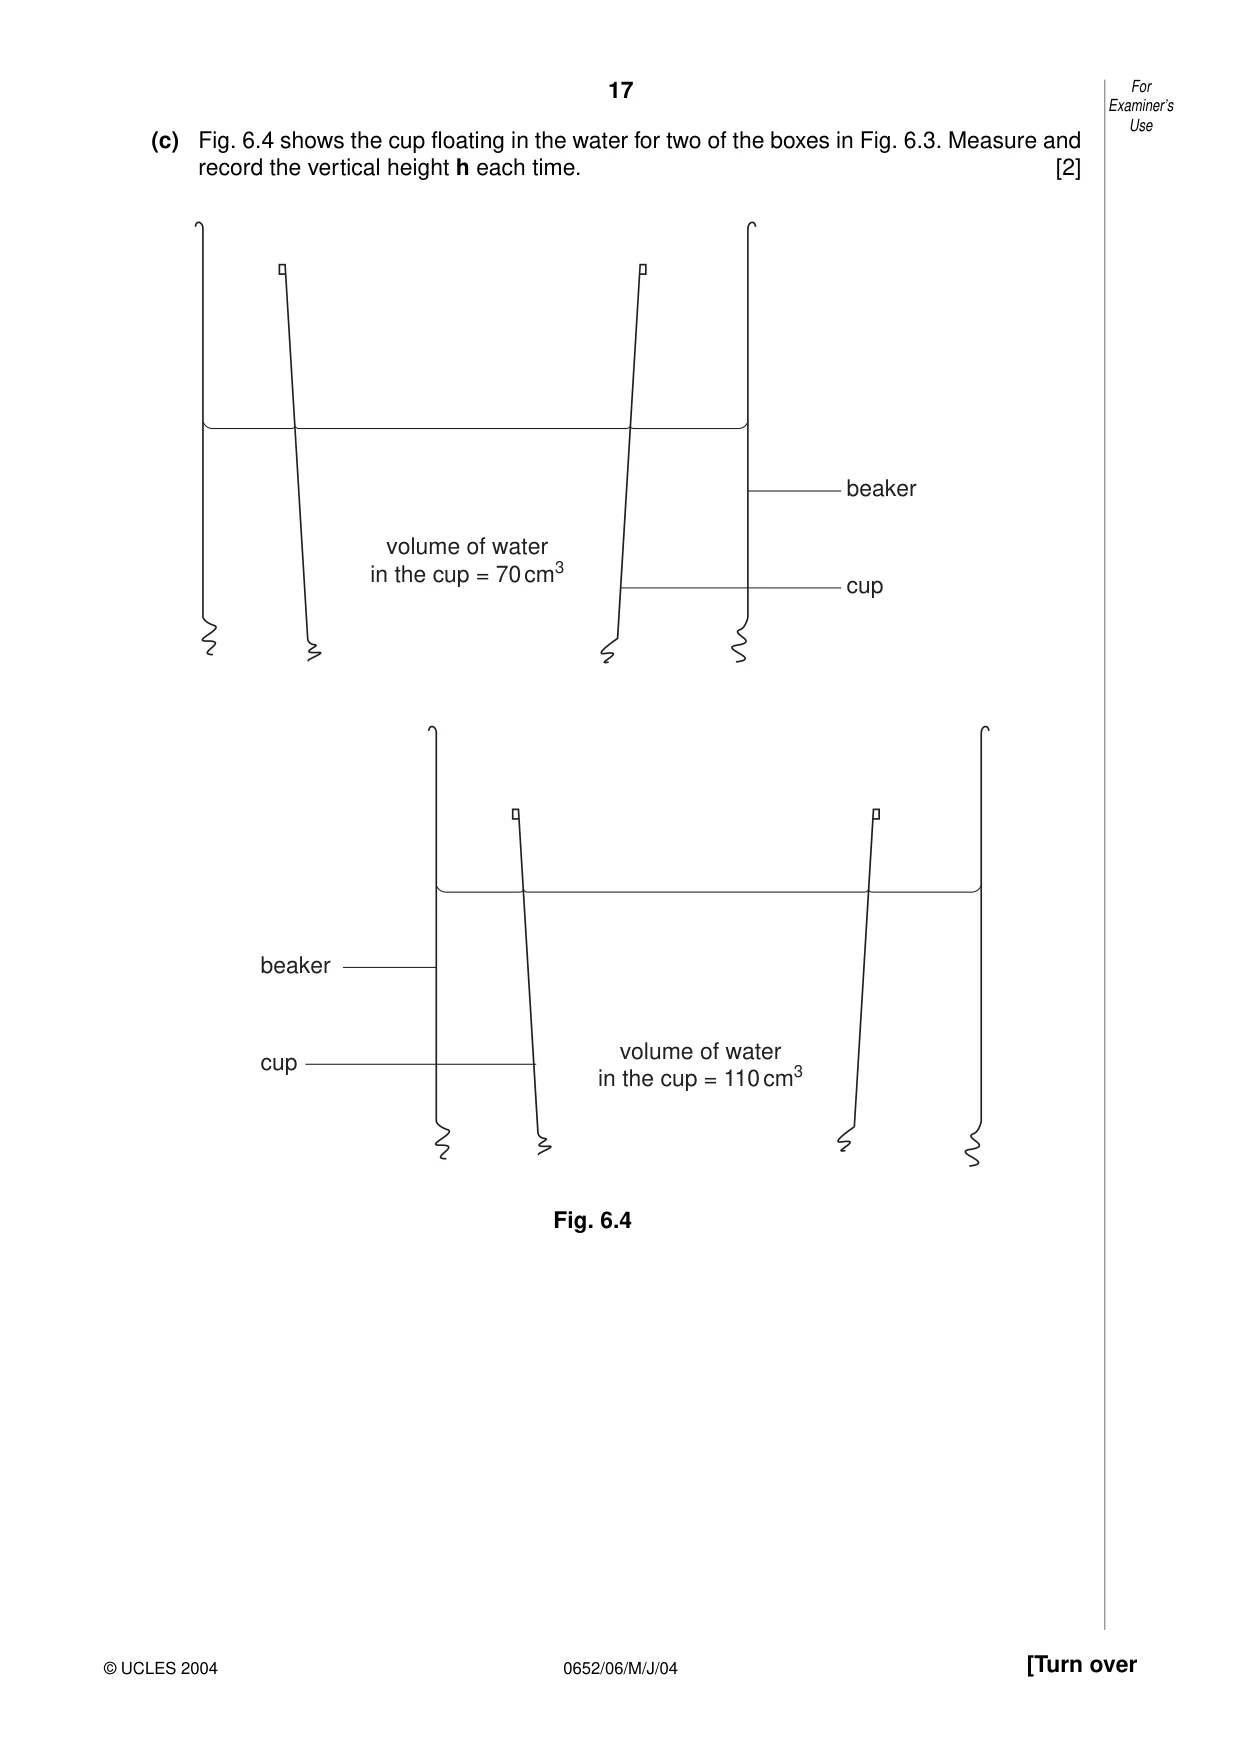
17 0652/06/M/J/04 [Turn over (c) Fig. 6.4 shows the cup floating in the water for two of the boxes in Fig. 6.3. Measure and record the vertical height h each time. [2] Fig. 6.4 cup beaker volume of water in the cup = 70 cm3 cup beaker volume of water in the cup = 110 cm3 For Examiner’s Use © UCLES 2004
Question paper, page 18
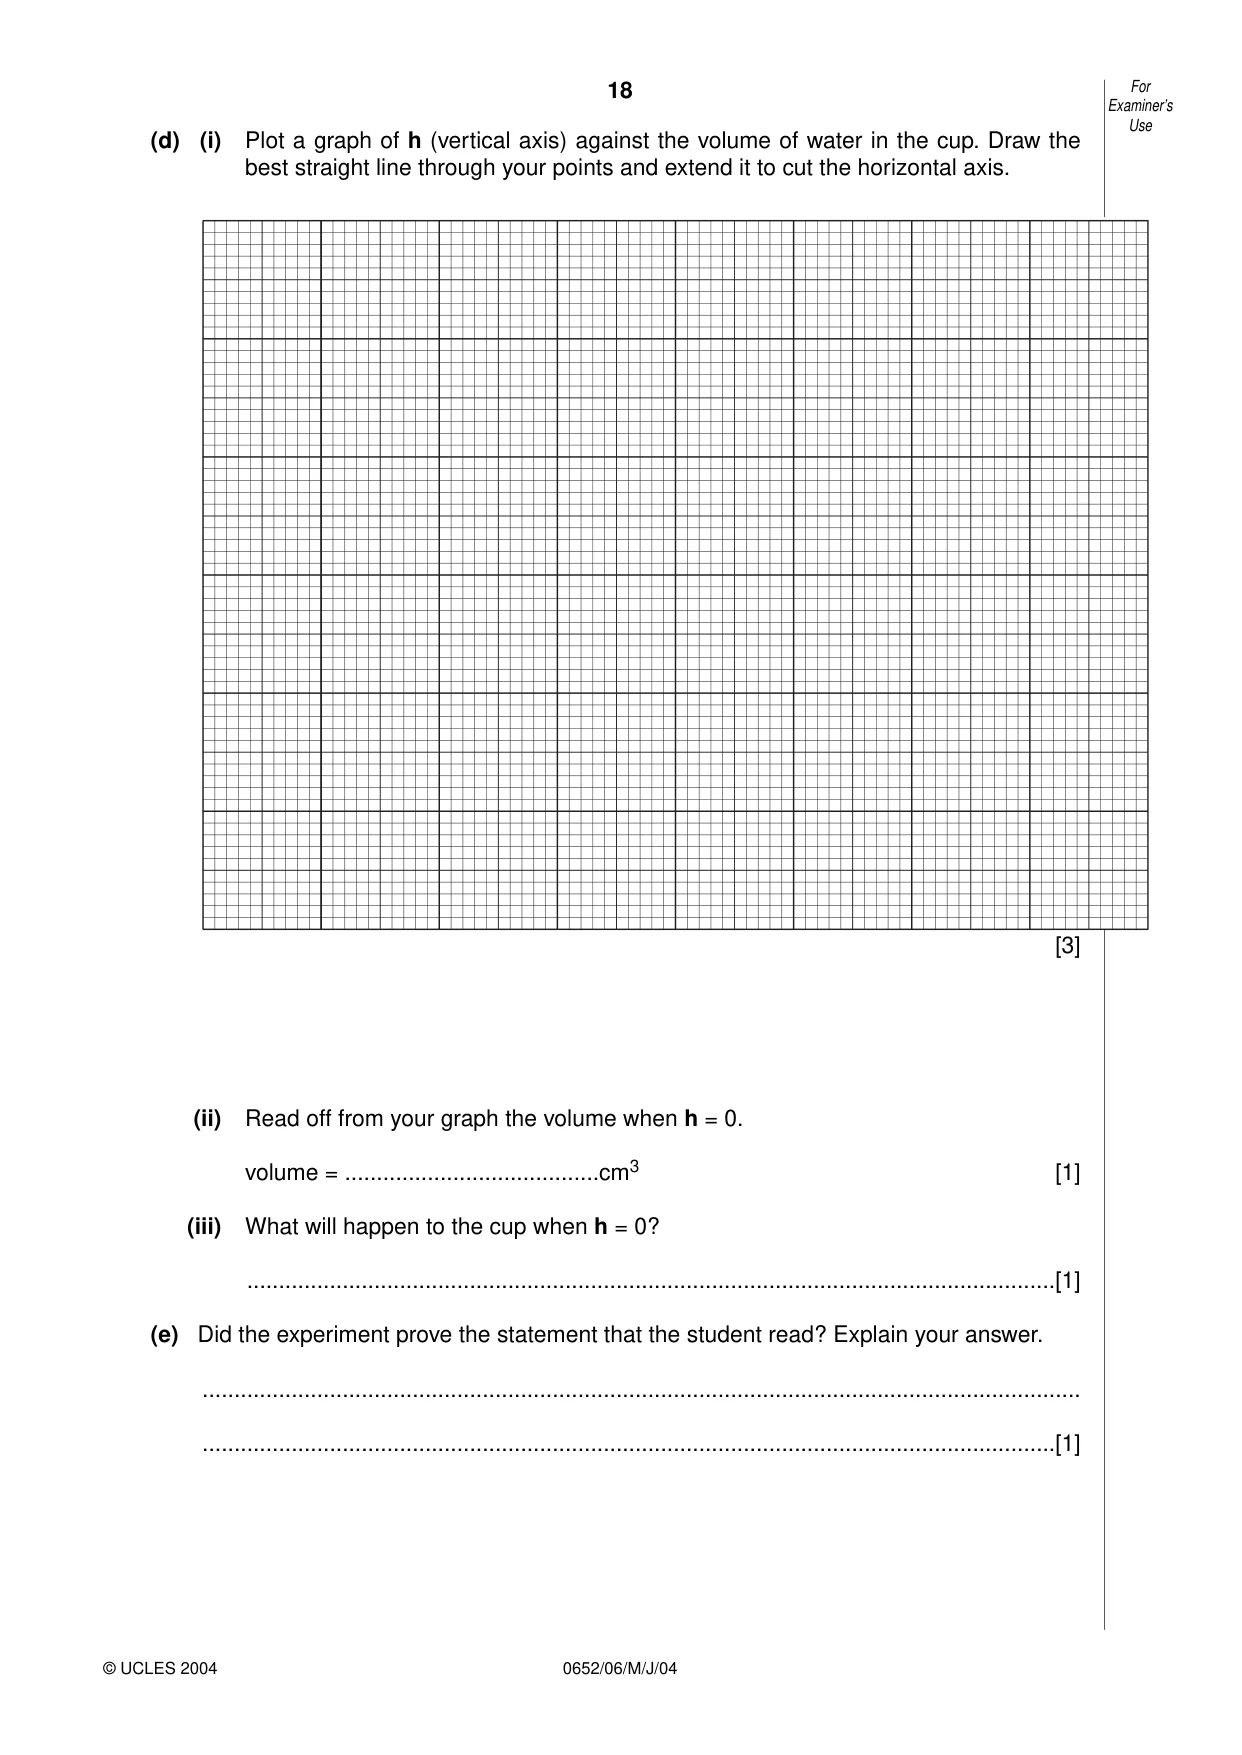
18 0652/06/M/J/04 (d) (i) Plot a graph of h (vertical axis) against the volume of water in the cup. Draw the best straight line through your points and extend it to cut the horizontal axis. [3] (ii) Read off from your graph the volume when h = 0. volume = …cm3 [1] (iii) What will happen to the cup when h = 0? …[1] (e) Did the experiment prove the statement that the student read? Explain your answer. … …[1] For Examiner’s Use © UCLES 2004
Question paper, page 20
20 0652/06/M/J/04 BLANK PAGE University of Cambridge International Examinations is part of the University of Cambridge Local Examinations Syndicate (UCLES), which is itself a department of the University of Cambridge.