Cambridge IGCSE Physical Science 0652 — 2003 Oct/Nov Paper 6 · Variant 1
0652/61/O/N/03
The question paper and its mark scheme, free to read here and free to download. This is Cambridge’s own paper, exactly as it was sat.
Question paper16 pages
Mark scheme
No mark scheme is in the library for this paper.
Paper as text
Question paper, page 1
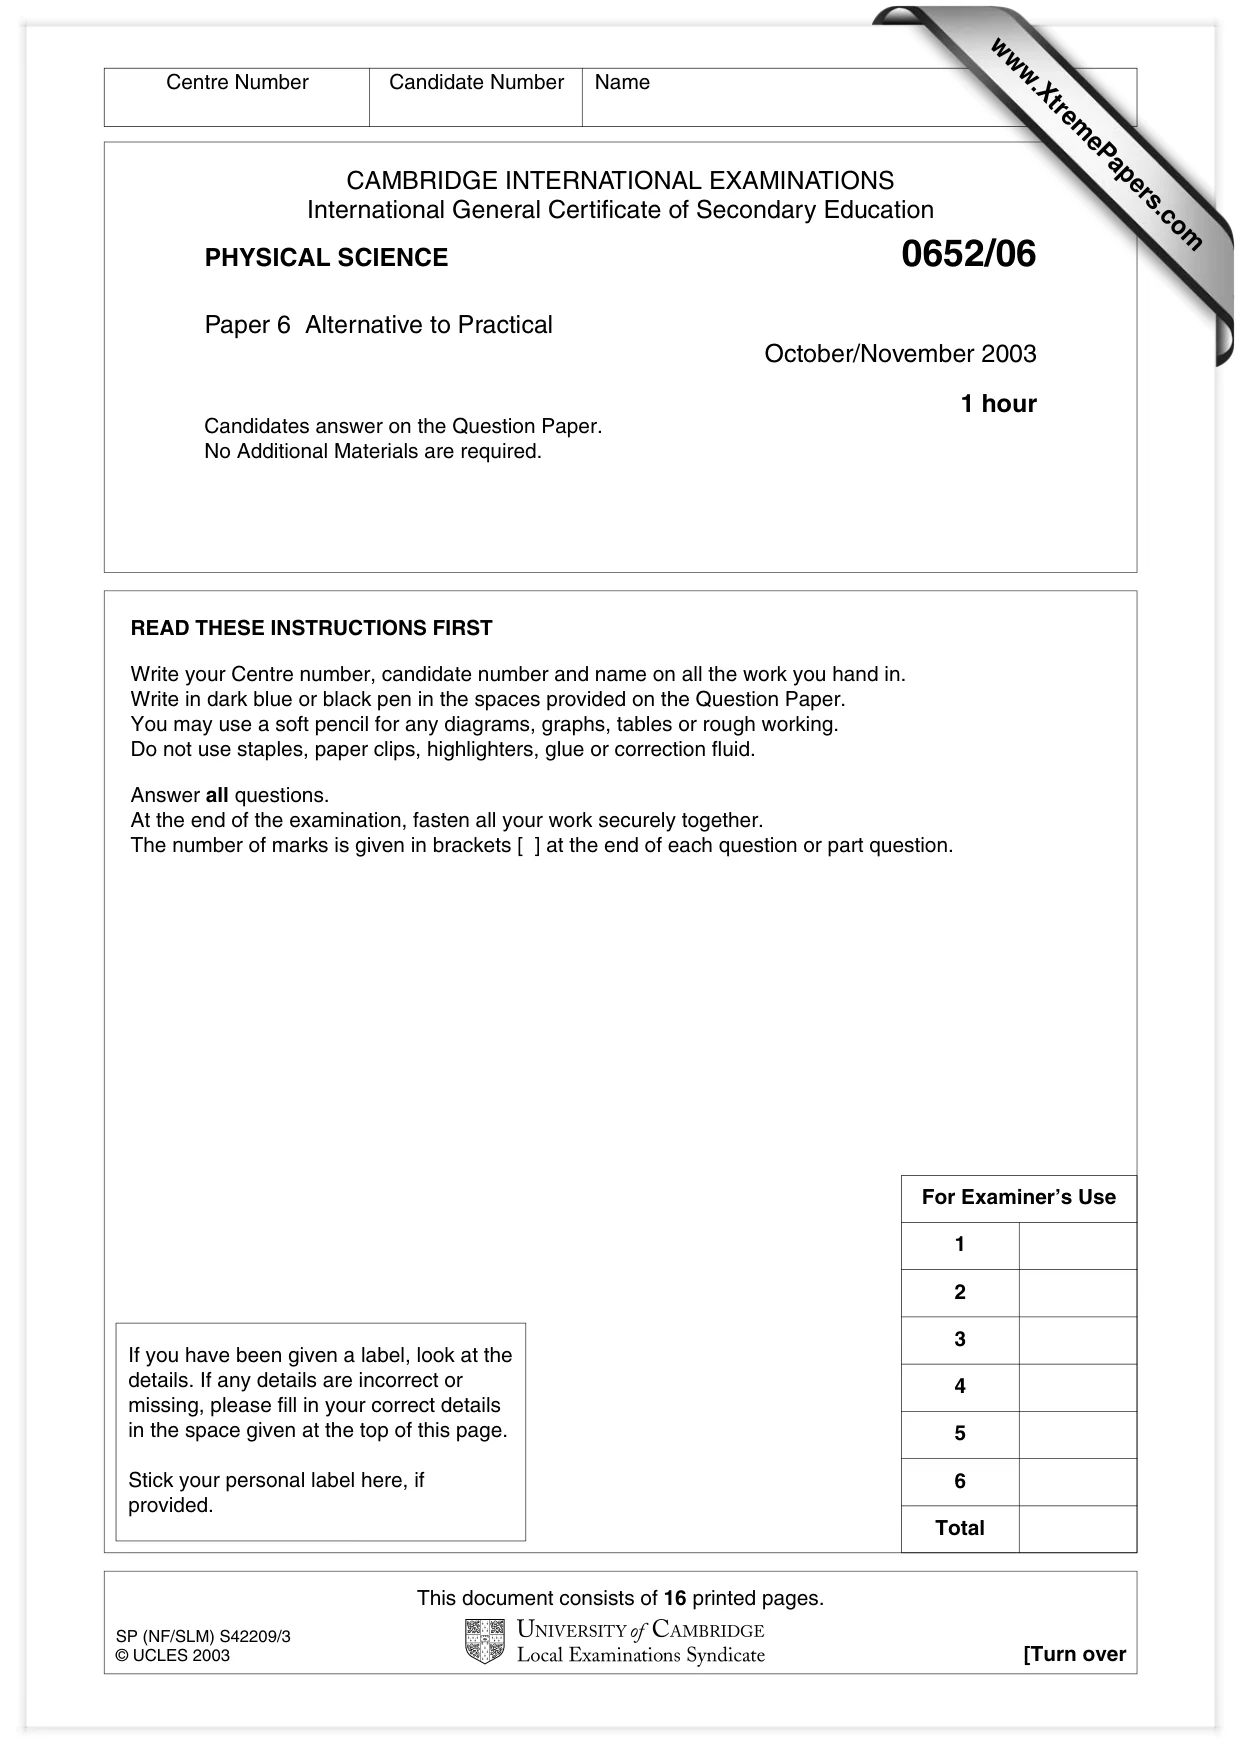
This document consists of 16 printed pages. SP (NF/SLM) S42209/3 © UCLES 2003 [Turn over CAMBRIDGE INTERNATIONAL EXAMINATIONS International General Certificate of Secondary Education PHYSICAL SCIENCE 0652/06 Paper 6 Alternative to Practical October/November 2003 1 hour Candidates answer on the Question Paper. No Additional Materials are required. READ THESE INSTRUCTIONS FIRST Write your Centre number, candidate number and name on all the work you hand in. Write in dark blue or black pen in the spaces provided on the Question Paper. You may use a soft pencil for any diagrams, graphs, tables or rough working. Do not use staples, paper clips, highlighters, glue or correction fluid. Answer all questions. At the end of the examination, fasten all your work securely together. The number of marks is given in brackets [ ] at the end of each question or part question. Centre Number Candidate Number Name If you have been given a label, look at the details. If any details are incorrect or missing, please fill in your correct details in the space given at the top of this page. Stick your personal label here, if provided. For Examiner’s Use 3 2 1 4 Total 6 5 www.XtremePapers.com
Question paper, page 2
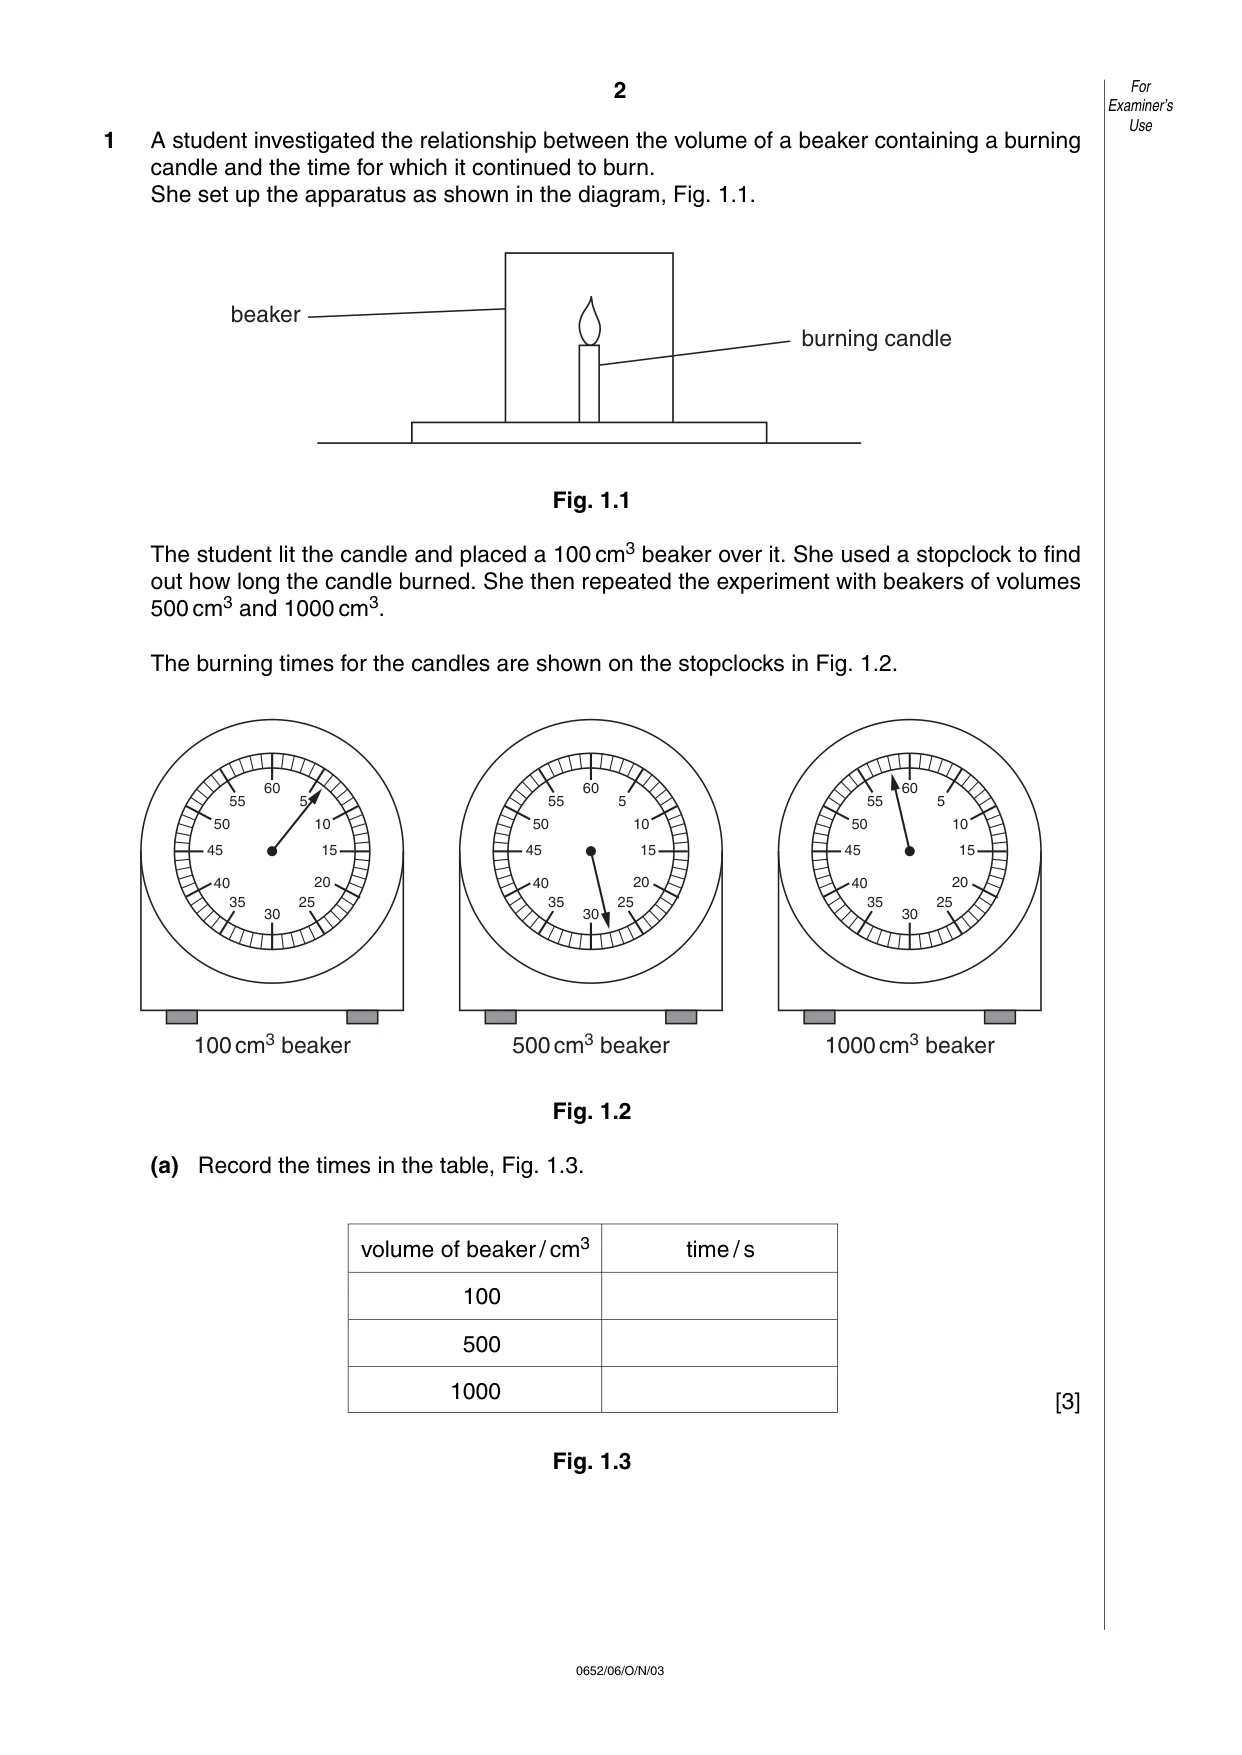
2 0652/06/O/N/03 1 A student investigated the relationship between the volume of a beaker containing a burning candle and the time for which it continued to burn. She set up the apparatus as shown in the diagram, Fig. 1.1. Fig. 1.1 The student lit the candle and placed a 100 cm3 beaker over it. She used a stopclock to find out how long the candle burned. She then repeated the experiment with beakers of volumes 500 cm3 and 1000 cm3. The burning times for the candles are shown on the stopclocks in Fig. 1.2. Fig. 1.2 (a) Record the times in the table, Fig. 1.3. [3] Fig. 1.3 100cm3 beaker 60 30 45 15 10 20 50 40 5 55 35 25 500cm3 beaker 60 30 45 15 10 20 50 40 5 55 35 25 1000cm3 beaker 60 30 45 15 10 20 50 40 5 55 35 25 beaker burning candle For Examiner’s Use volume of beaker / cm3 time / s 100 500 1000
Question paper, page 3
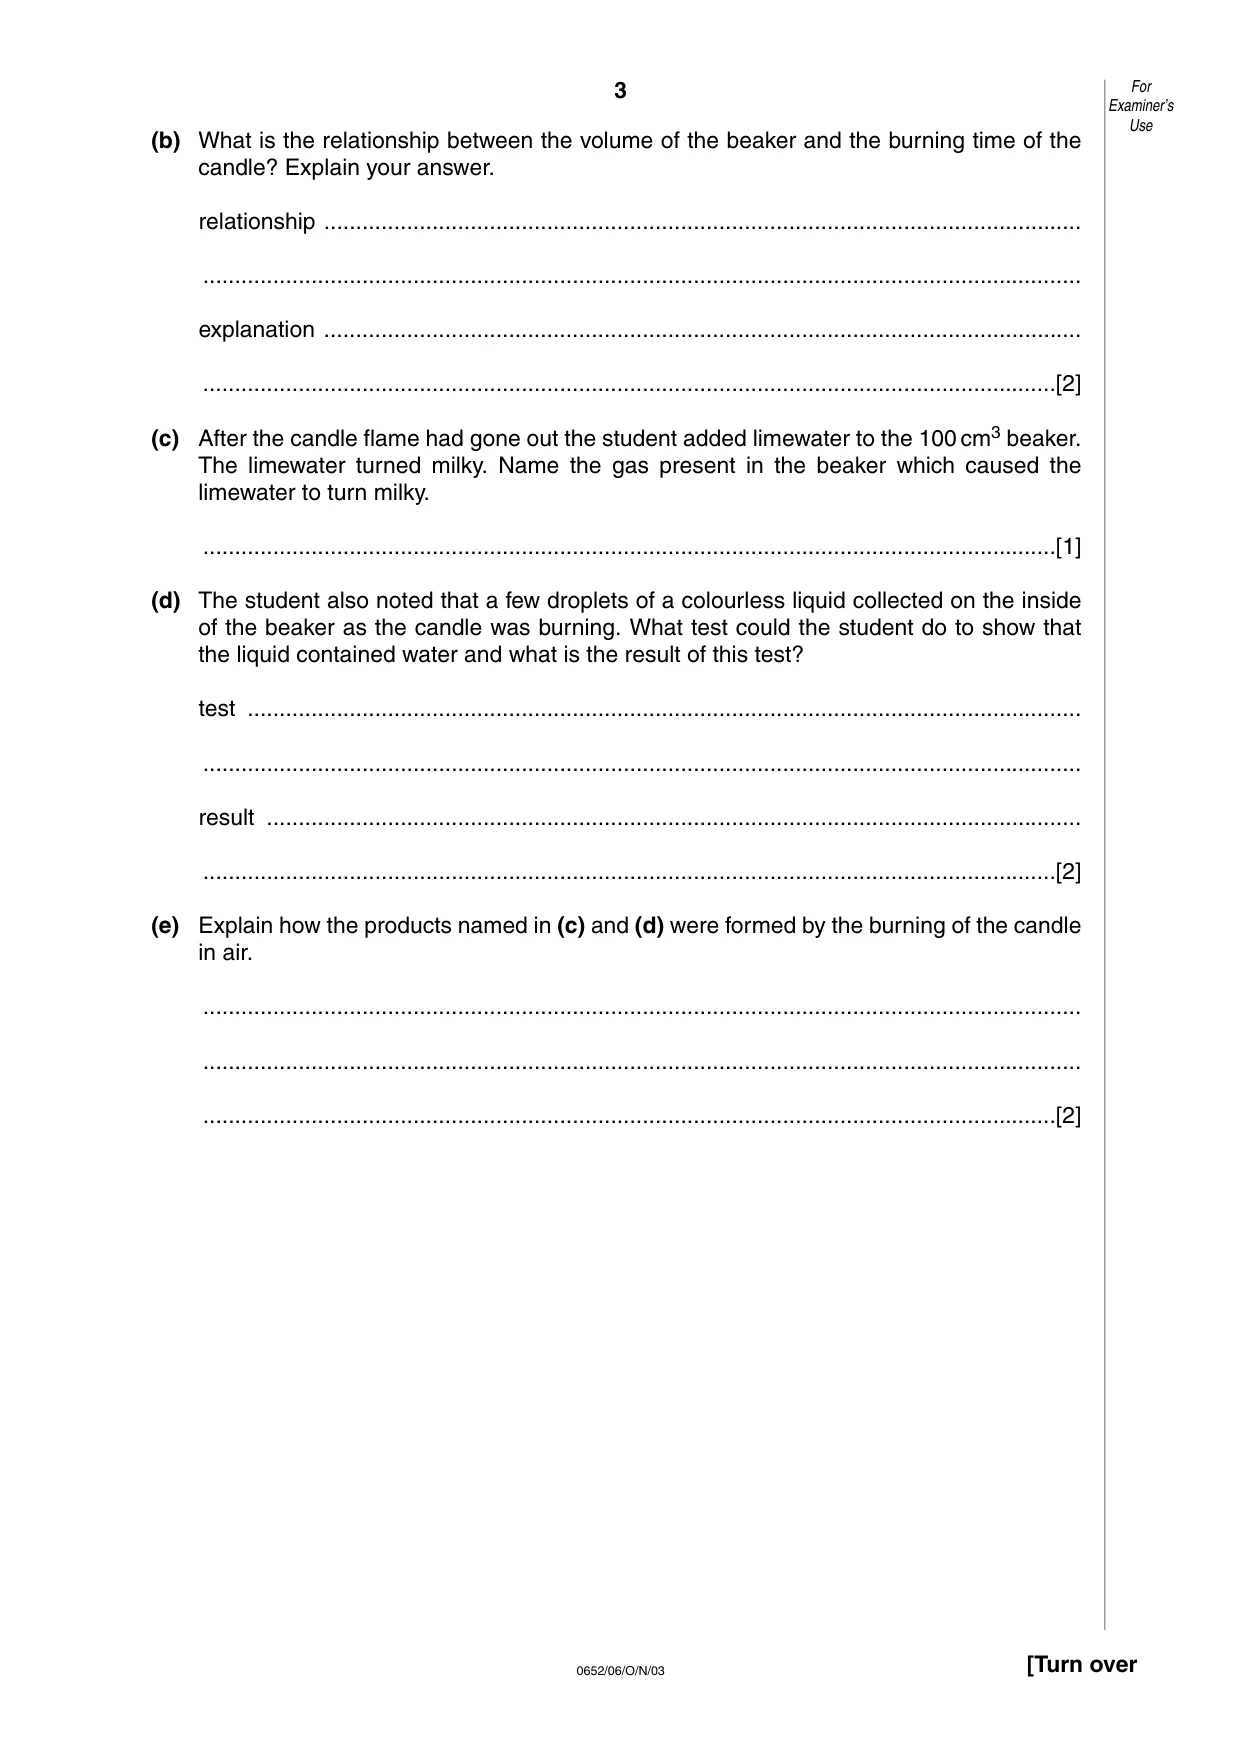
3 0652/06/O/N/03 [Turn over (b) What is the relationship between the volume of the beaker and the burning time of the candle? Explain your answer. relationship … … explanation … …[2] (c) After the candle flame had gone out the student added limewater to the 100 cm3 beaker. The limewater turned milky. Name the gas present in the beaker which caused the limewater to turn milky. …[1] (d) The student also noted that a few droplets of a colourless liquid collected on the inside of the beaker as the candle was burning. What test could the student do to show that the liquid contained water and what is the result of this test? test … … result … …[2] (e) Explain how the products named in (c) and (d) were formed by the burning of the candle in air. … … …[2] For Examiner’s Use
Question paper, page 4
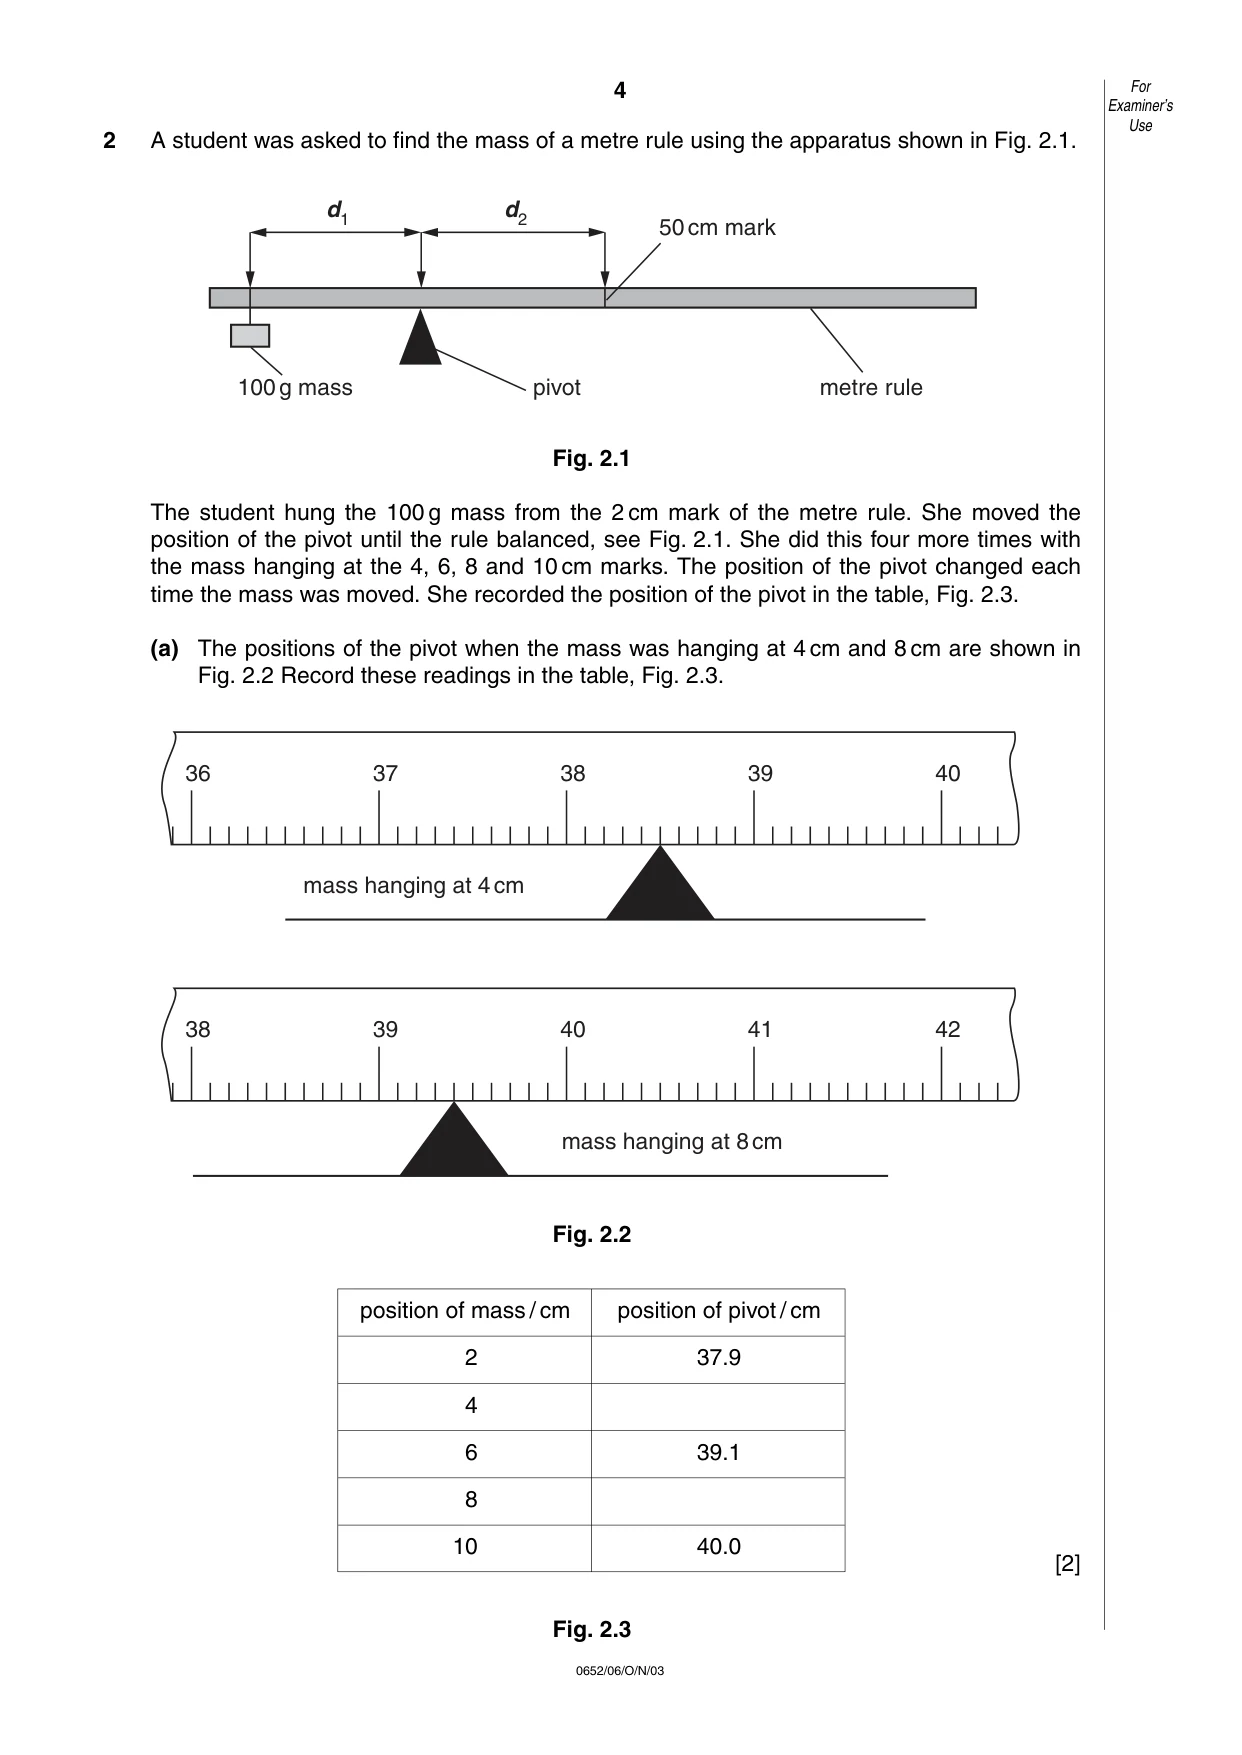
4 0652/06/O/N/03 2 A student was asked to find the mass of a metre rule using the apparatus shown in Fig. 2.1. Fig. 2.1 The student hung the 100 g mass from the 2 cm mark of the metre rule. She moved the position of the pivot until the rule balanced, see Fig. 2.1. She did this four more times with the mass hanging at the 4, 6, 8 and 10 cm marks. The position of the pivot changed each time the mass was moved. She recorded the position of the pivot in the table, Fig. 2.3. (a) The positions of the pivot when the mass was hanging at 4 cm and 8 cm are shown in Fig. 2.2 Record these readings in the table, Fig. 2.3. Fig. 2.2 [2] Fig. 2.3 36 37 38 39 40 mass hanging at 4cm 38 39 40 41 42 mass hanging at 8cm d1 d2 pivot metre rule 50cm mark 100g mass For Examiner’s Use position of mass / cm position of pivot / cm 2 37.9 4 6 39.1 8 10 40.0
Question paper, page 5
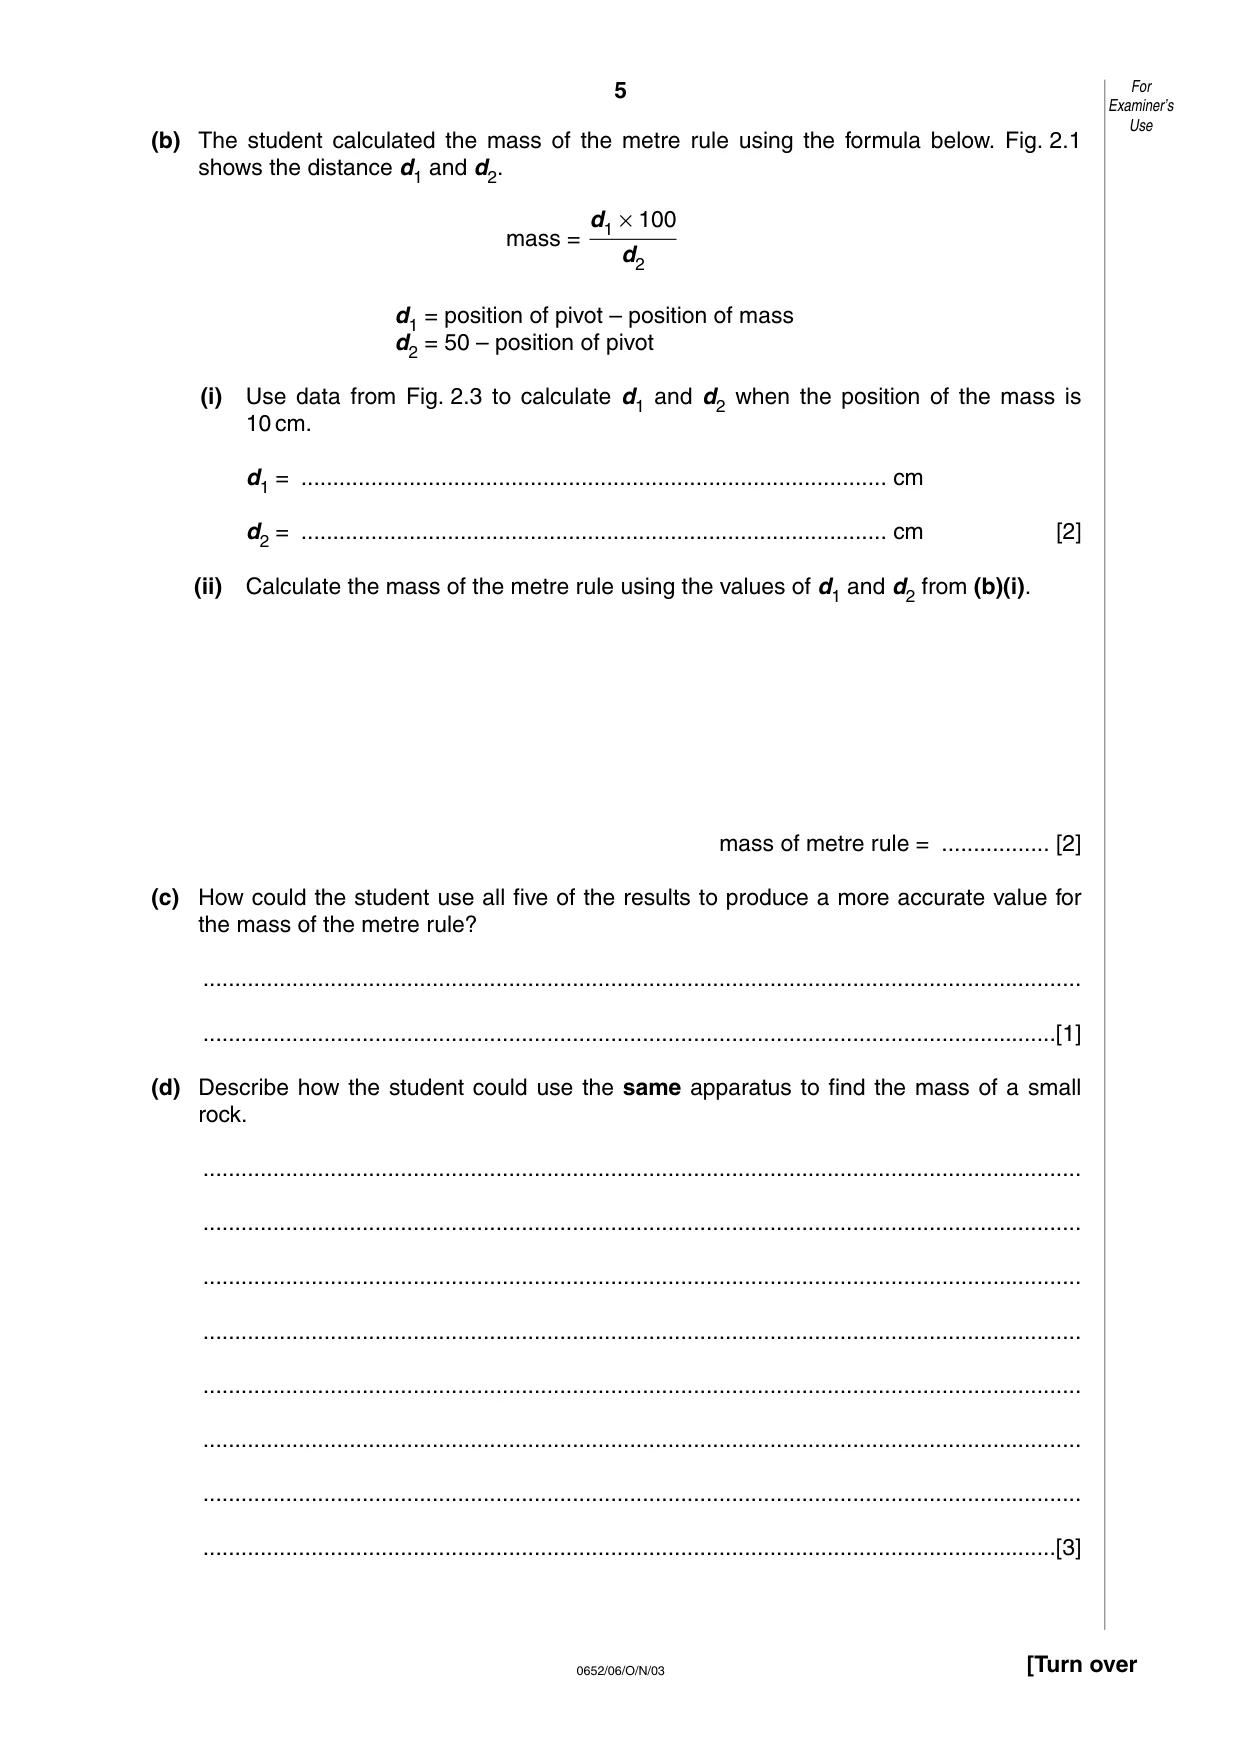
5 0652/06/O/N/03 [Turn over (b) The student calculated the mass of the metre rule using the formula below. Fig. 2.1 shows the distance d1 and d2. mass = d1 = position of pivot – position of mass d2 = 50 – position of pivot (i) Use data from Fig. 2.3 to calculate d1 and d2 when the position of the mass is 10 cm. d1 = … cm d2 = … cm [2] (ii) Calculate the mass of the metre rule using the values of d1 and d2 from (b)(i). mass of metre rule = … [2] (c) How could the student use all five of the results to produce a more accurate value for the mass of the metre rule? … …[1] (d) Describe how the student could use the same apparatus to find the mass of a small rock. … … … … … … … …[3] d1 × 100 d2 For Examiner’s Use
Question paper, page 6
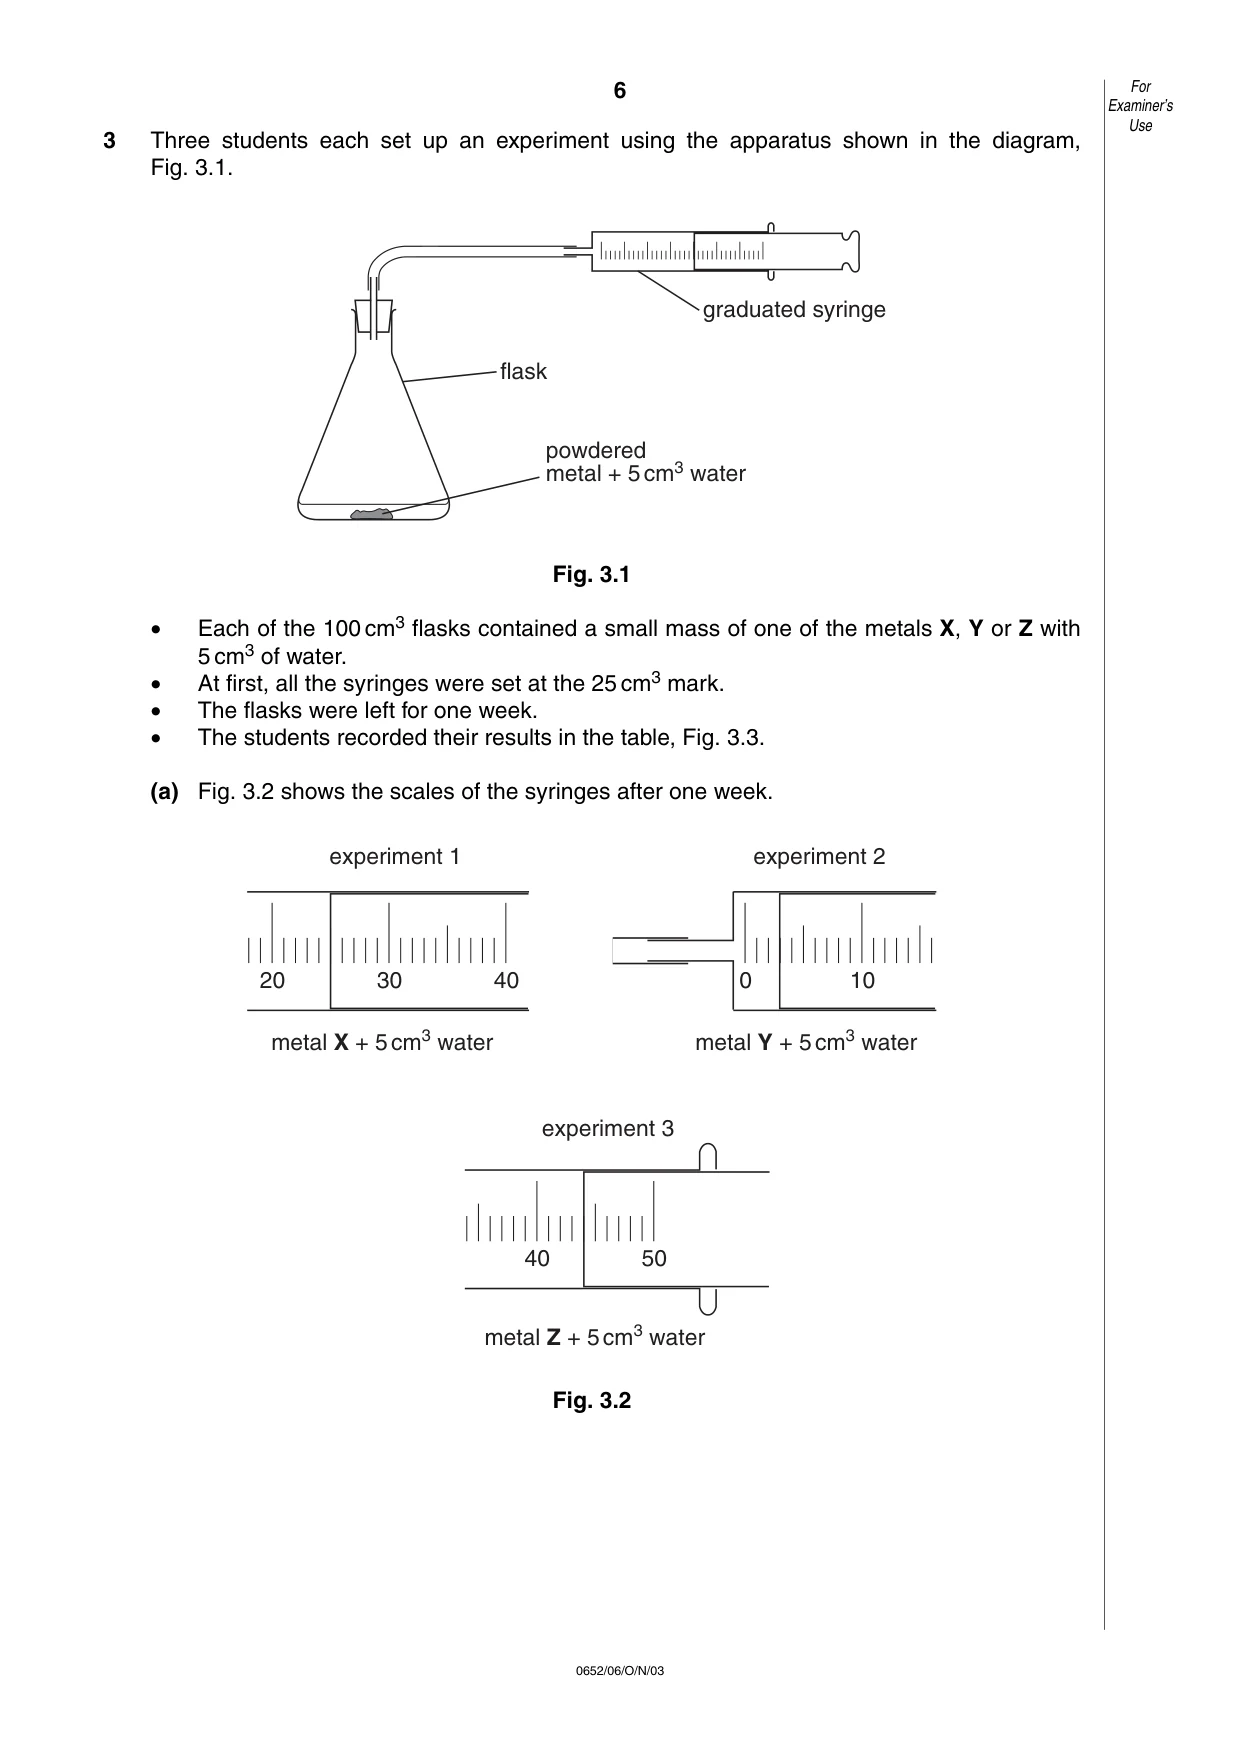
6 0652/06/O/N/03 3 Three students each set up an experiment using the apparatus shown in the diagram, Fig. 3.1. Fig. 3.1 • Each of the 100 cm3 flasks contained a small mass of one of the metals X, Y or Z with 5 cm3 of water. • At first, all the syringes were set at the 25 cm3 mark. • The flasks were left for one week. • The students recorded their results in the table, Fig. 3.3. (a) Fig. 3.2 shows the scales of the syringes after one week. Fig. 3.2 experiment 1 20 30 40 metal X + 5cm3 water experiment 3 40 50 metal Z + 5cm3 water experiment 2 0 10 metal Y + 5cm3 water graduated syringe flask powdered metal + 5cm3 water For Examiner’s Use
Question paper, page 7
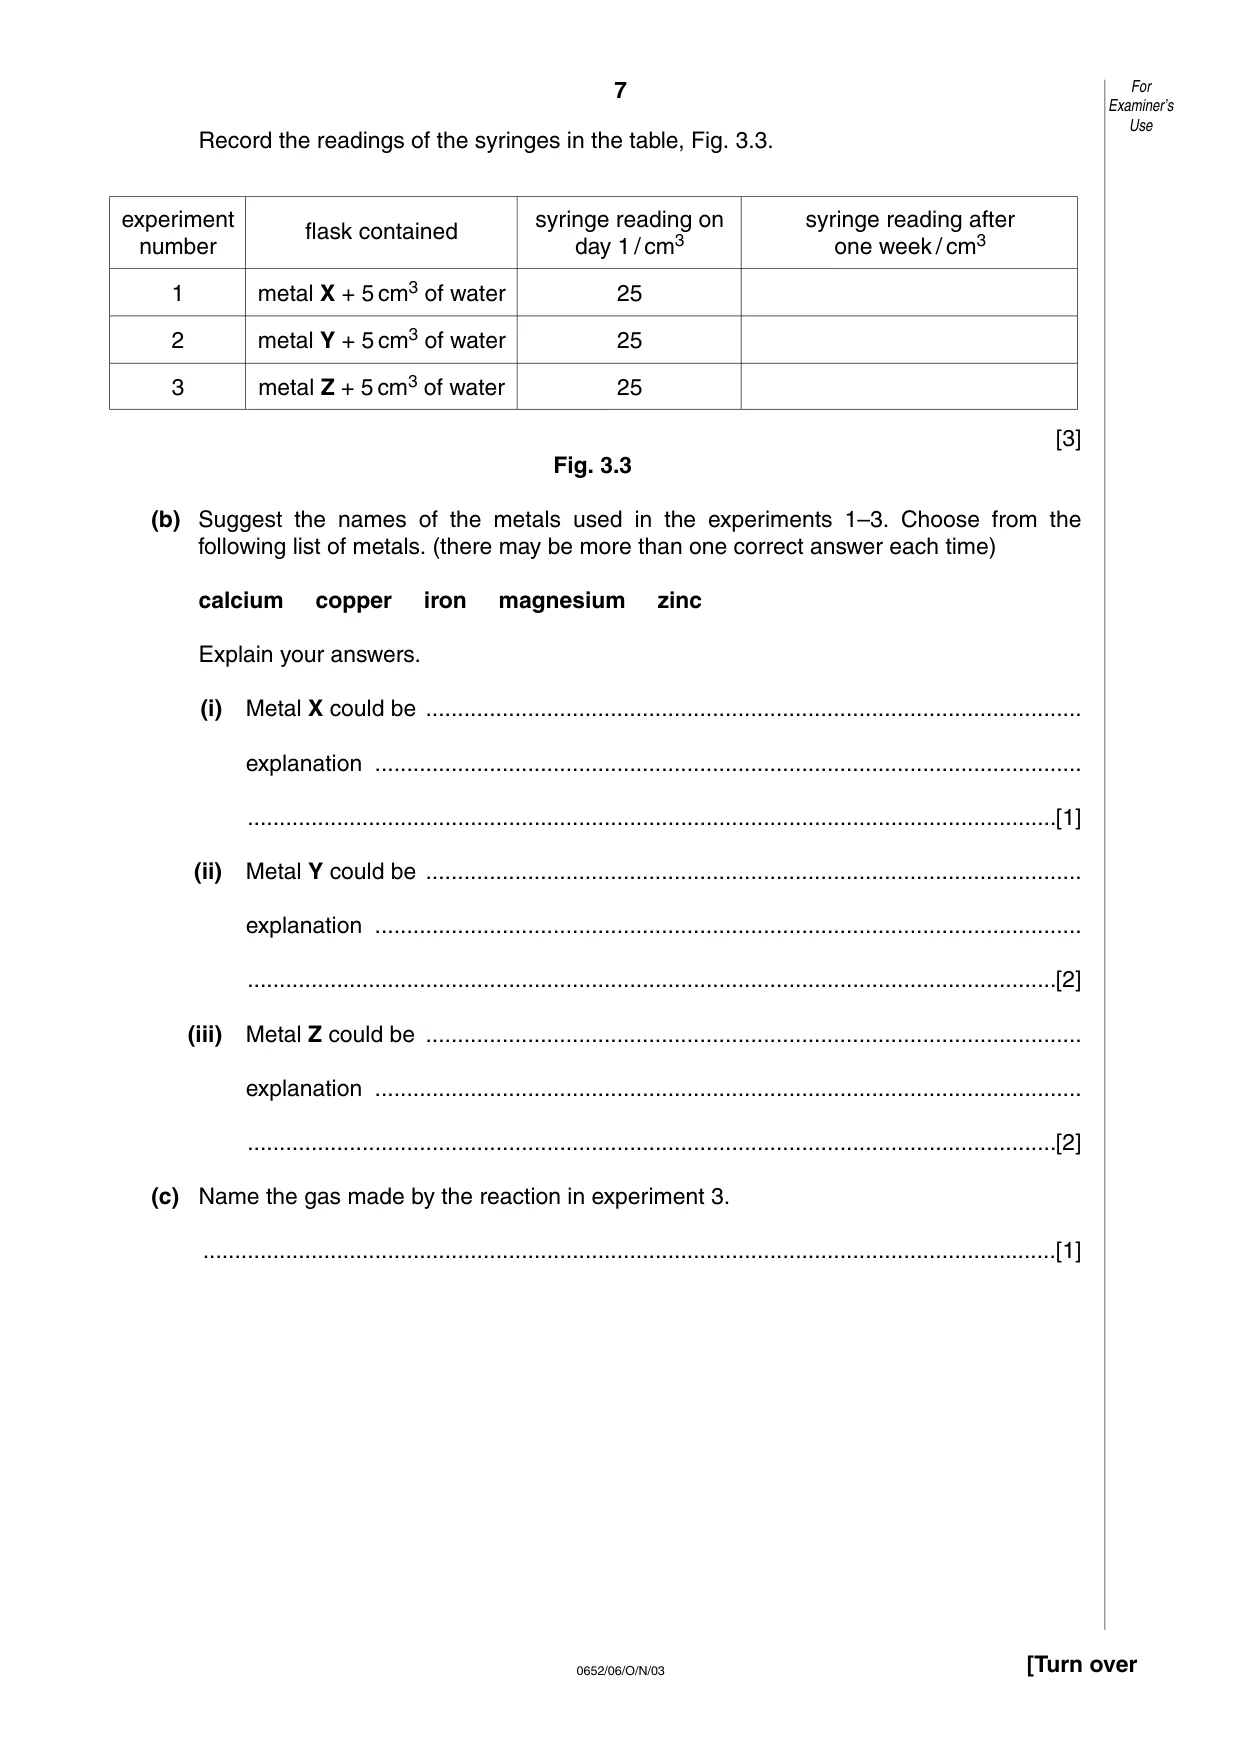
7 0652/06/O/N/03 [Turn over Record the readings of the syringes in the table, Fig. 3.3. [3] Fig. 3.3 (b) Suggest the names of the metals used in the experiments 1–3. Choose from the following list of metals. (there may be more than one correct answer each time) calcium copper iron magnesium zinc Explain your answers. (i) Metal X could be … explanation … …[1] (ii) Metal Y could be … explanation … …[2] (iii) Metal Z could be … explanation … …[2] (c) Name the gas made by the reaction in experiment 3. …[1] For Examiner’s Use experiment flask contained syringe reading on syringe reading after number day 1 / cm3 one week / cm3 1 metal X + 5 cm3 of water 25 2 metal Y + 5 cm3 of water 25 3 metal Z + 5 cm3 of water 25
Question paper, page 8
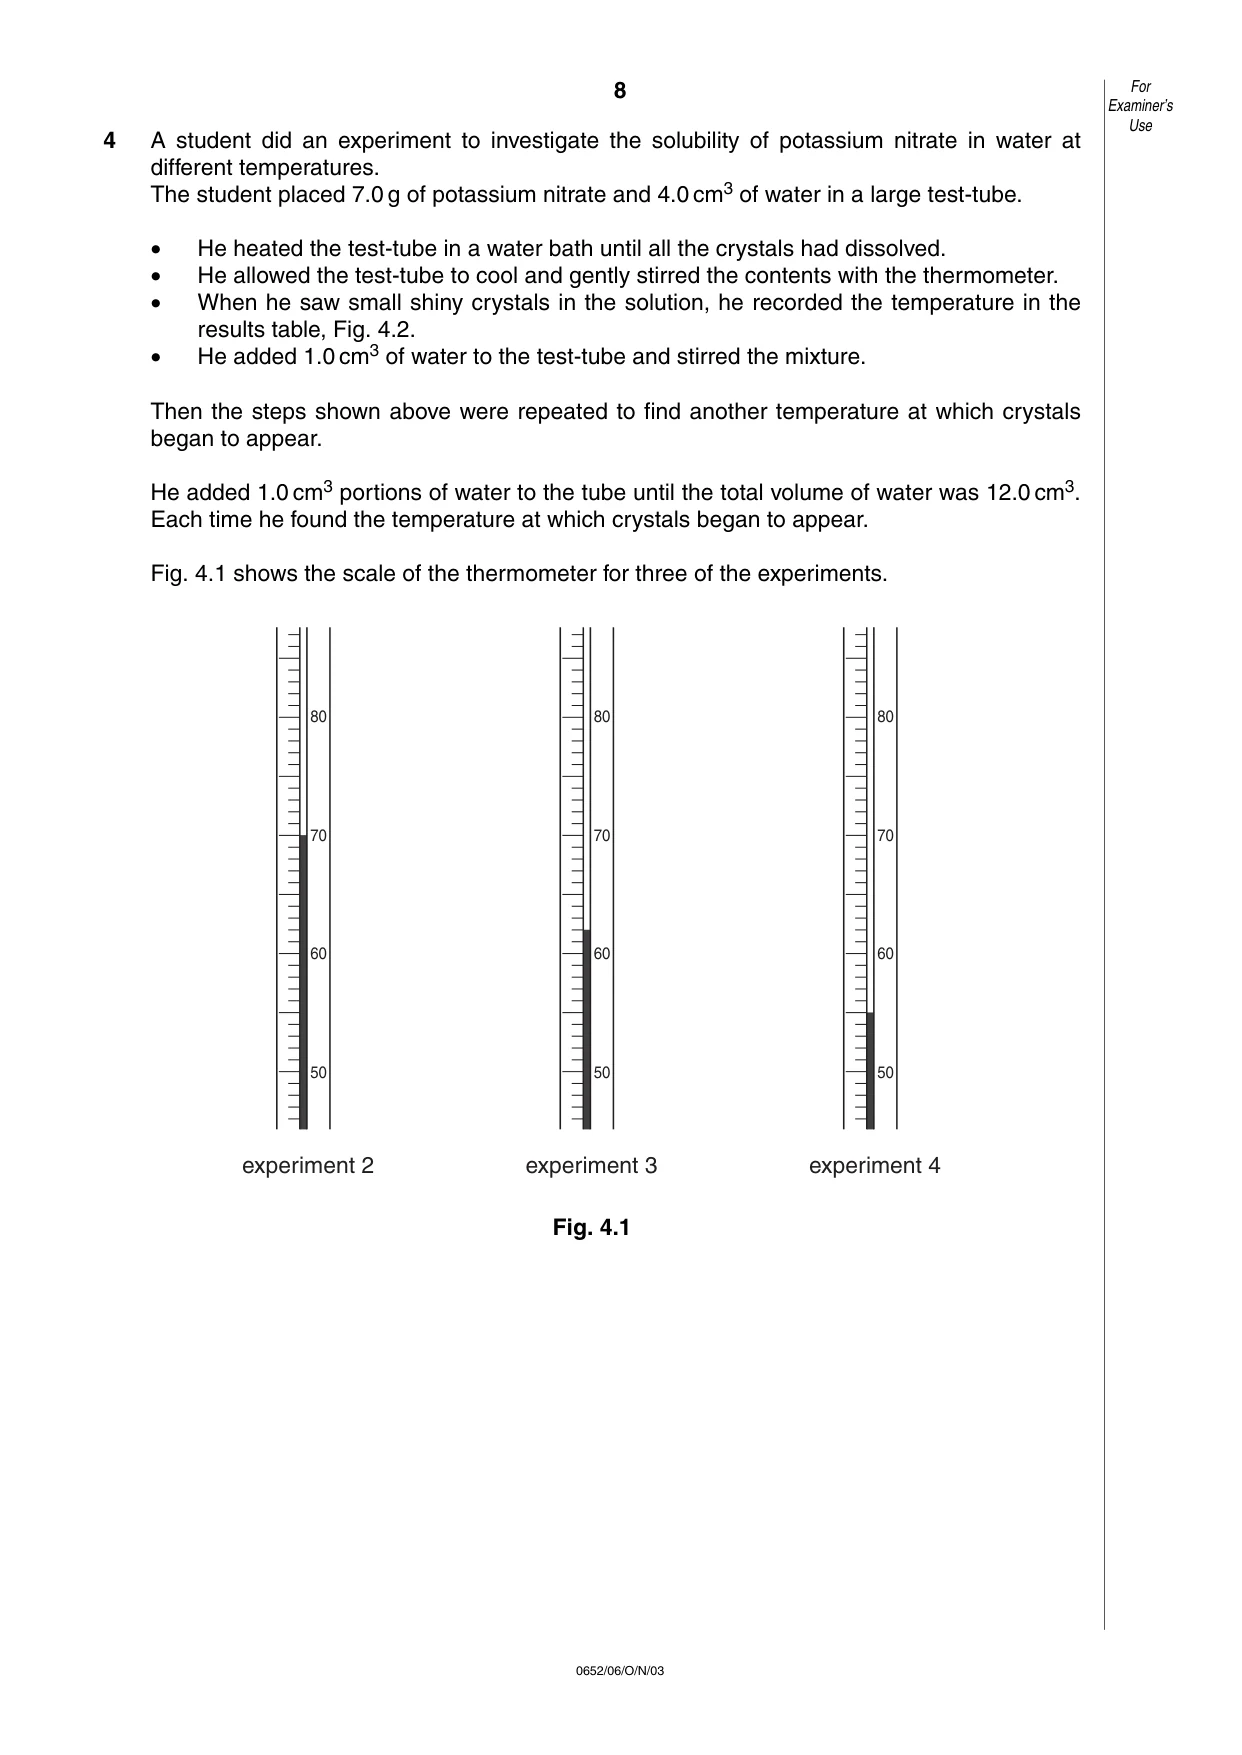
8 0652/06/O/N/03 4 A student did an experiment to investigate the solubility of potassium nitrate in water at different temperatures. The student placed 7.0 g of potassium nitrate and 4.0 cm3 of water in a large test-tube. • He heated the test-tube in a water bath until all the crystals had dissolved. • He allowed the test-tube to cool and gently stirred the contents with the thermometer. • When he saw small shiny crystals in the solution, he recorded the temperature in the results table, Fig. 4.2. • He added 1.0 cm3 of water to the test-tube and stirred the mixture. Then the steps shown above were repeated to find another temperature at which crystals began to appear. He added 1.0 cm3 portions of water to the tube until the total volume of water was 12.0 cm3. Each time he found the temperature at which crystals began to appear. Fig. 4.1 shows the scale of the thermometer for three of the experiments. Fig. 4.1 50 60 70 80 experiment 2 50 60 70 80 experiment 3 50 60 70 80 experiment 4 For Examiner’s Use
Question paper, page 9
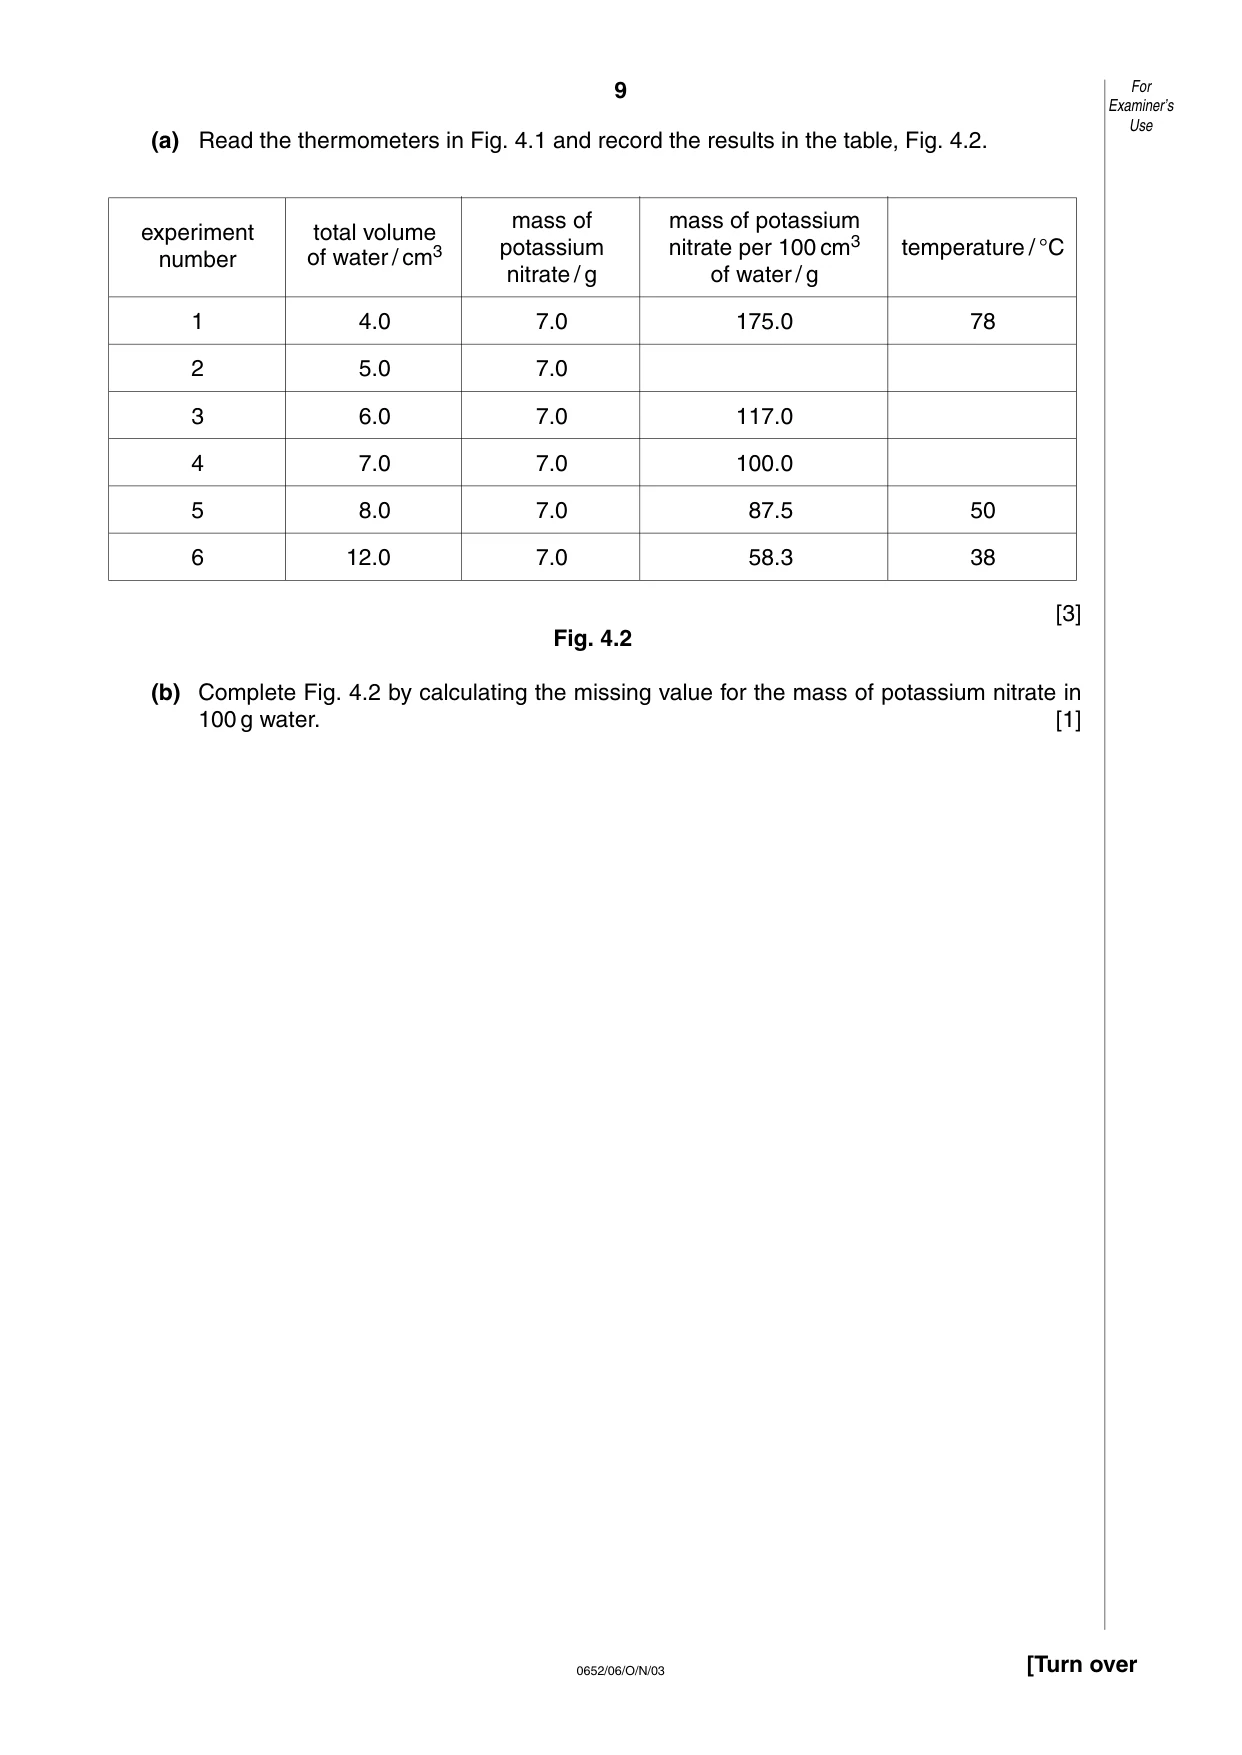
9 0652/06/O/N/03 [Turn over (a) Read the thermometers in Fig. 4.1 and record the results in the table, Fig. 4.2. [3] Fig. 4.2 (b) Complete Fig. 4.2 by calculating the missing value for the mass of potassium nitrate in 100 g water. [1] For Examiner’s Use experiment total volume mass of mass of potassium number of water / cm3 potassium nitrate per 100 cm3 temperature / °C nitrate / g of water / g 1 4.0 7.0 175.0 78 2 5.0 7.0 3 6.0 7.0 117.0 4 7.0 7.0 100.0 5 8.0 7.0 87.5 50 6 12.0 7.0 58.3 38
Question paper, page 10
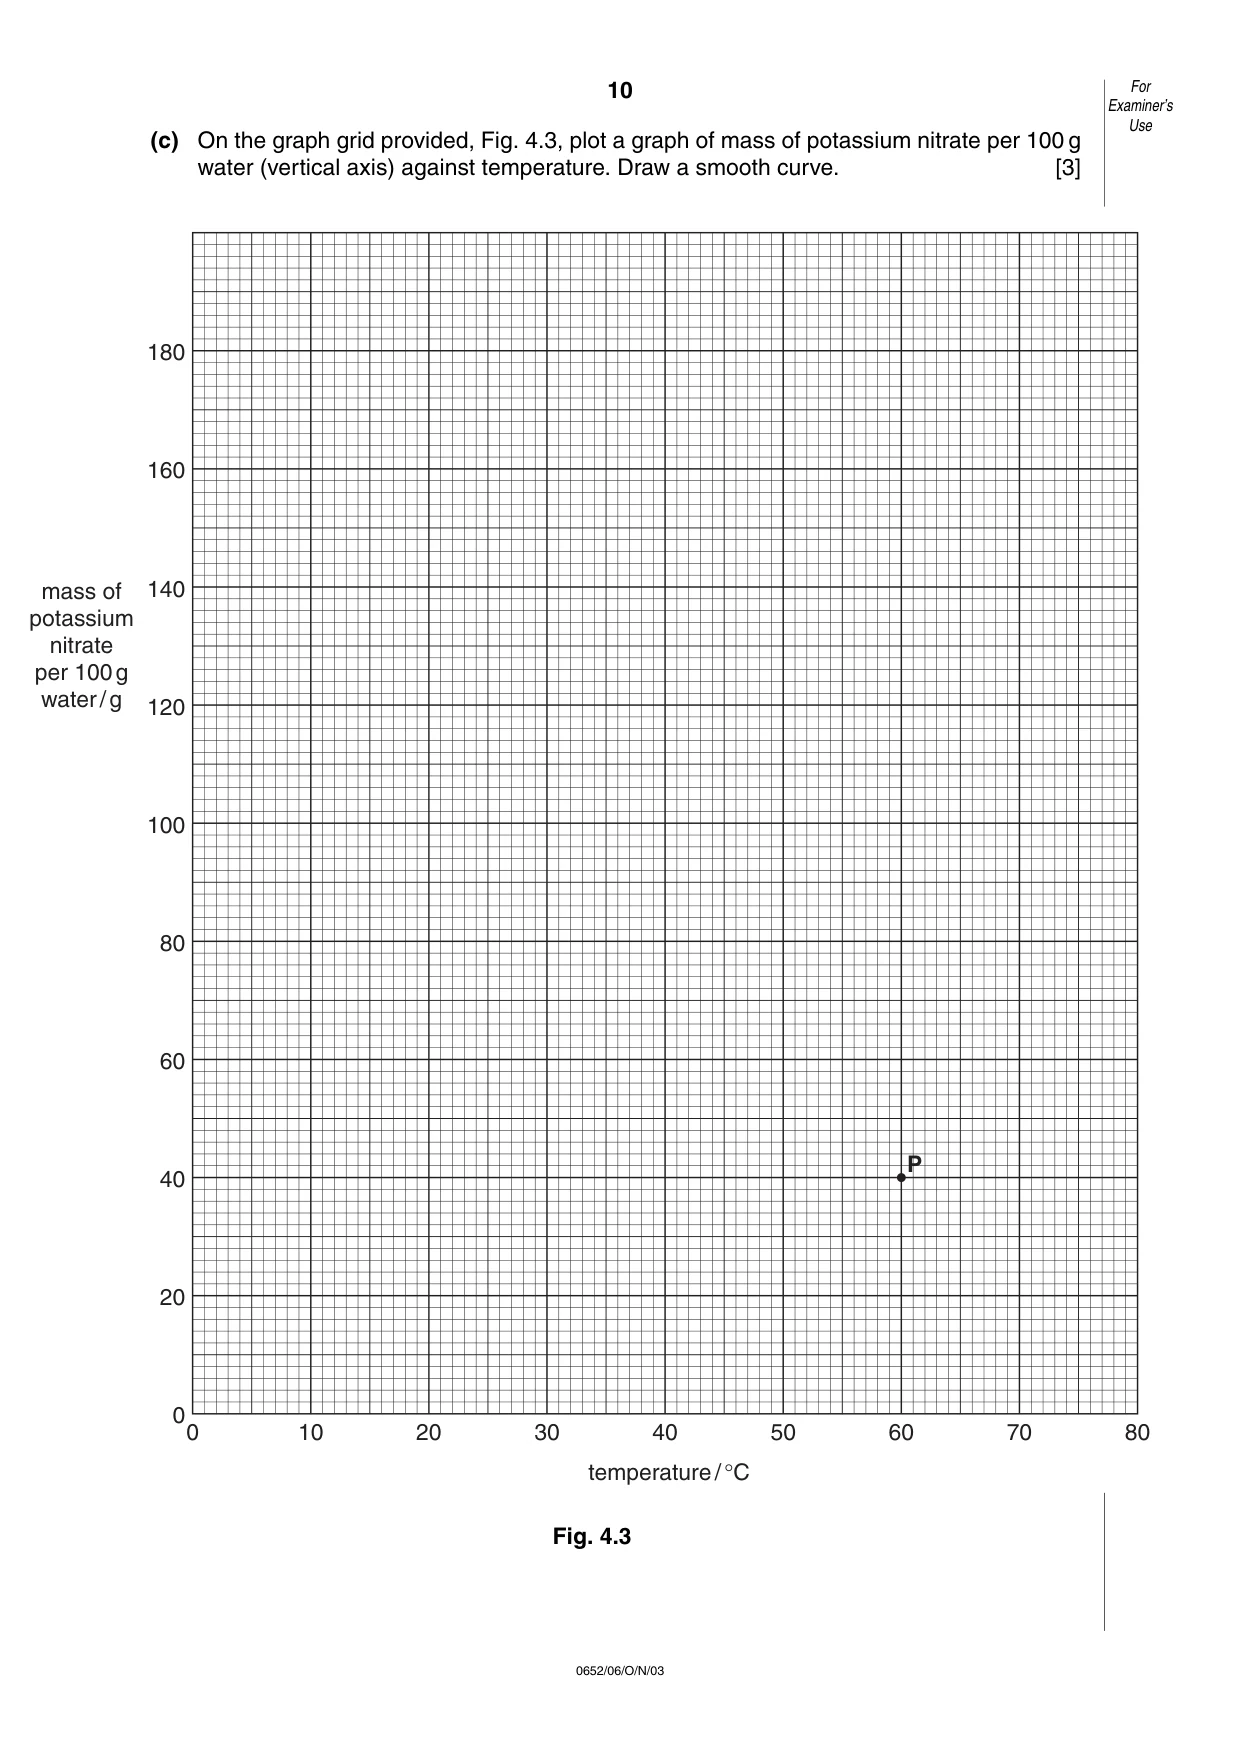
10 0652/06/O/N/03 (c) On the graph grid provided, Fig. 4.3, plot a graph of mass of potassium nitrate per 100 g water (vertical axis) against temperature. Draw a smooth curve. [3] Fig. 4.3 For Examiner’s Use 0 20 40 60 80 100 120 140 160 180 0 10 20 30 40 50 60 70 80 mass of potassium nitrate per 100g water/g temperature/°C P
Question paper, page 11
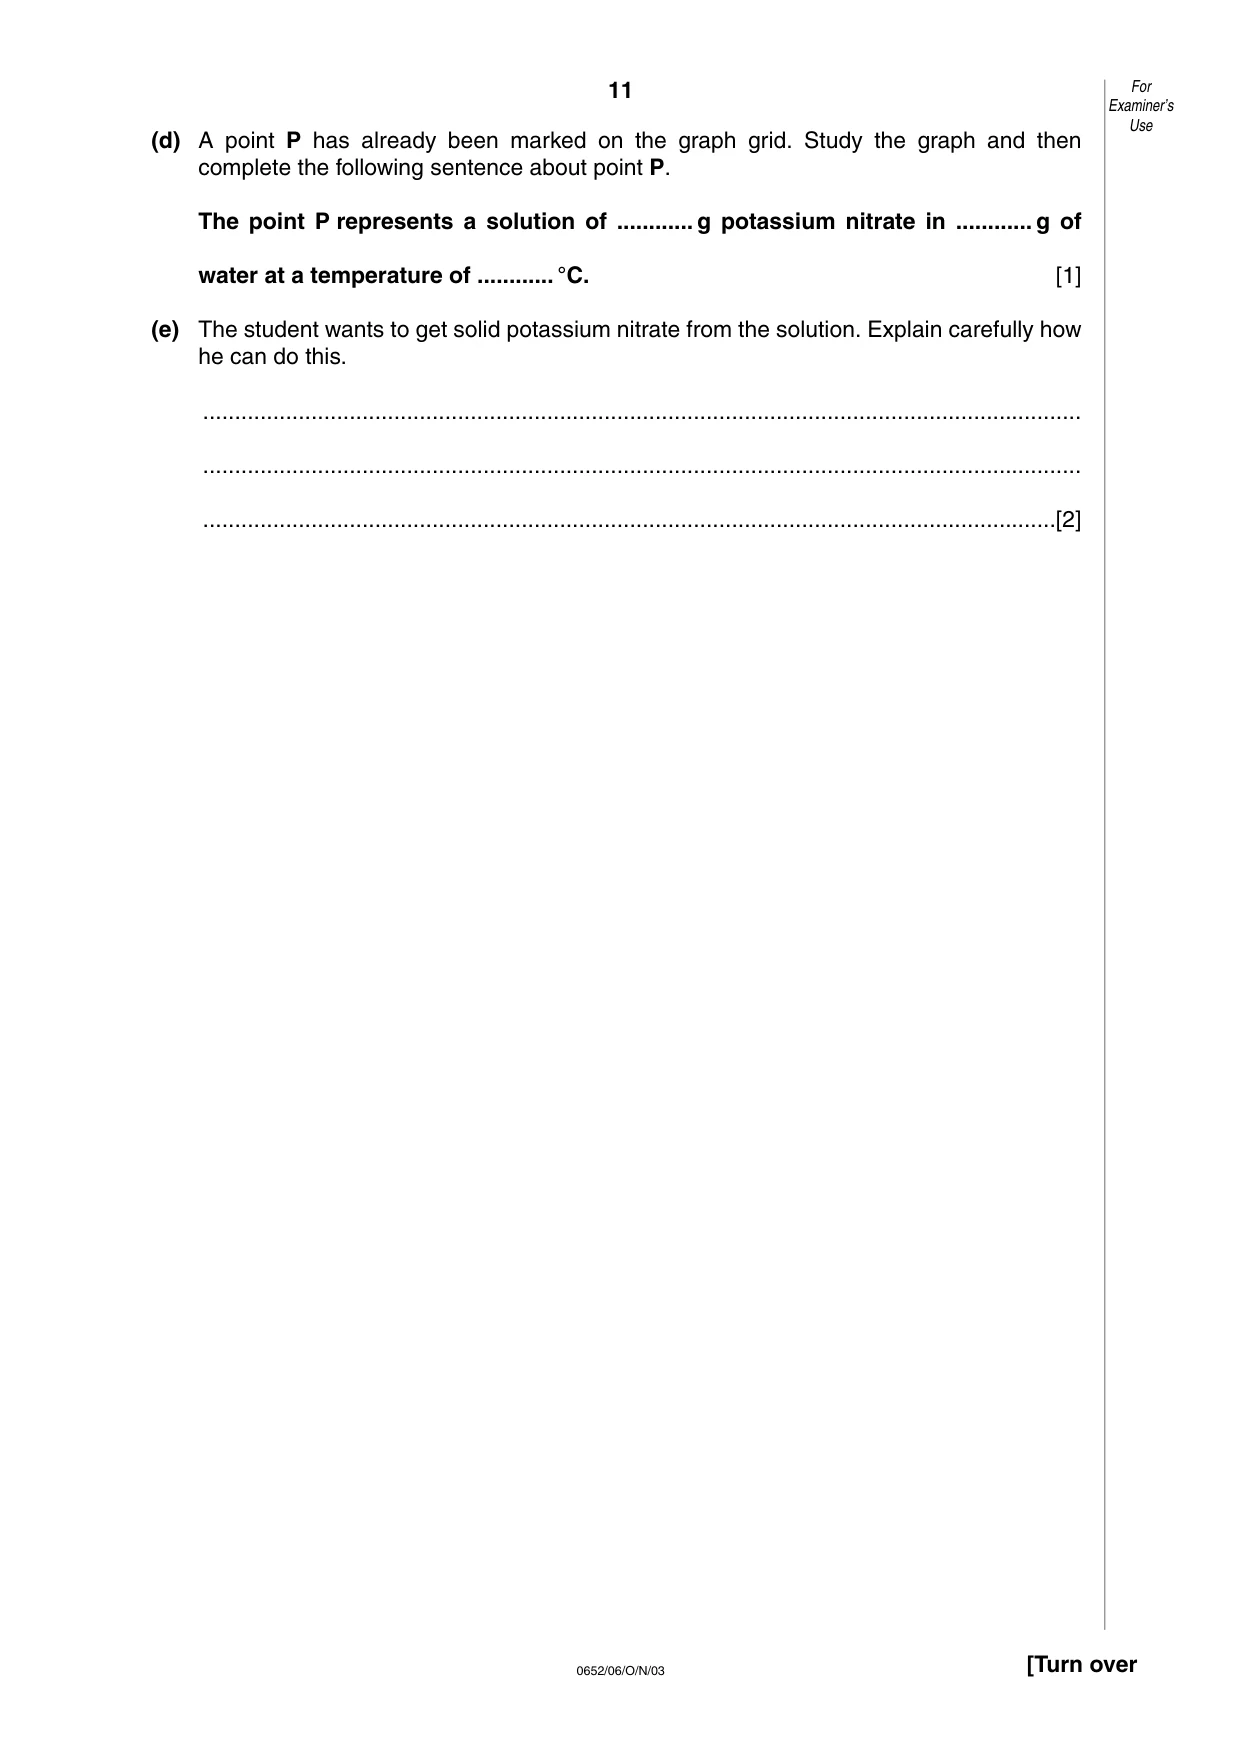
11 0652/06/O/N/03 [Turn over (d) A point P has already been marked on the graph grid. Study the graph and then complete the following sentence about point P. The point P represents a solution of … g potassium nitrate in … g of water at a temperature of … °C. [1] (e) The student wants to get solid potassium nitrate from the solution. Explain carefully how he can do this. … … …[2] For Examiner’s Use
Question paper, page 12
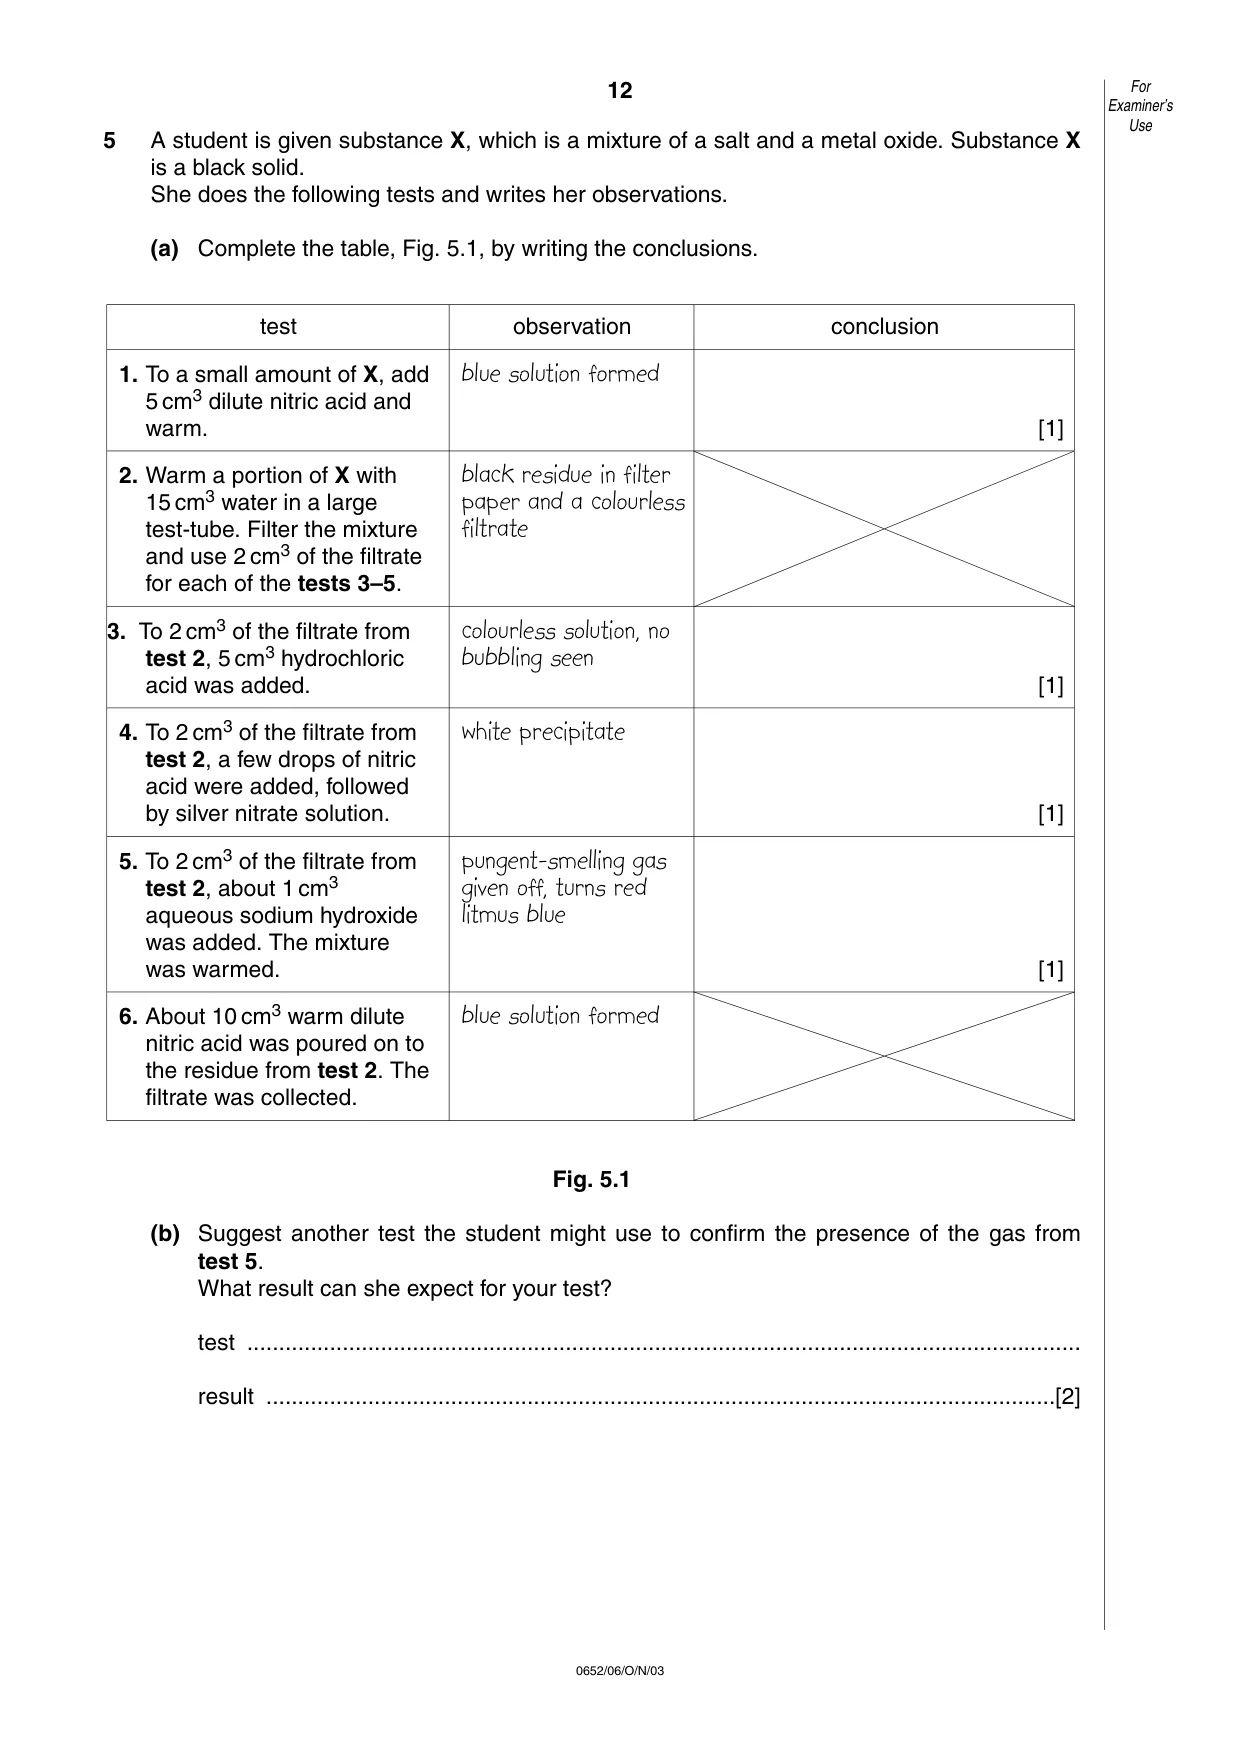
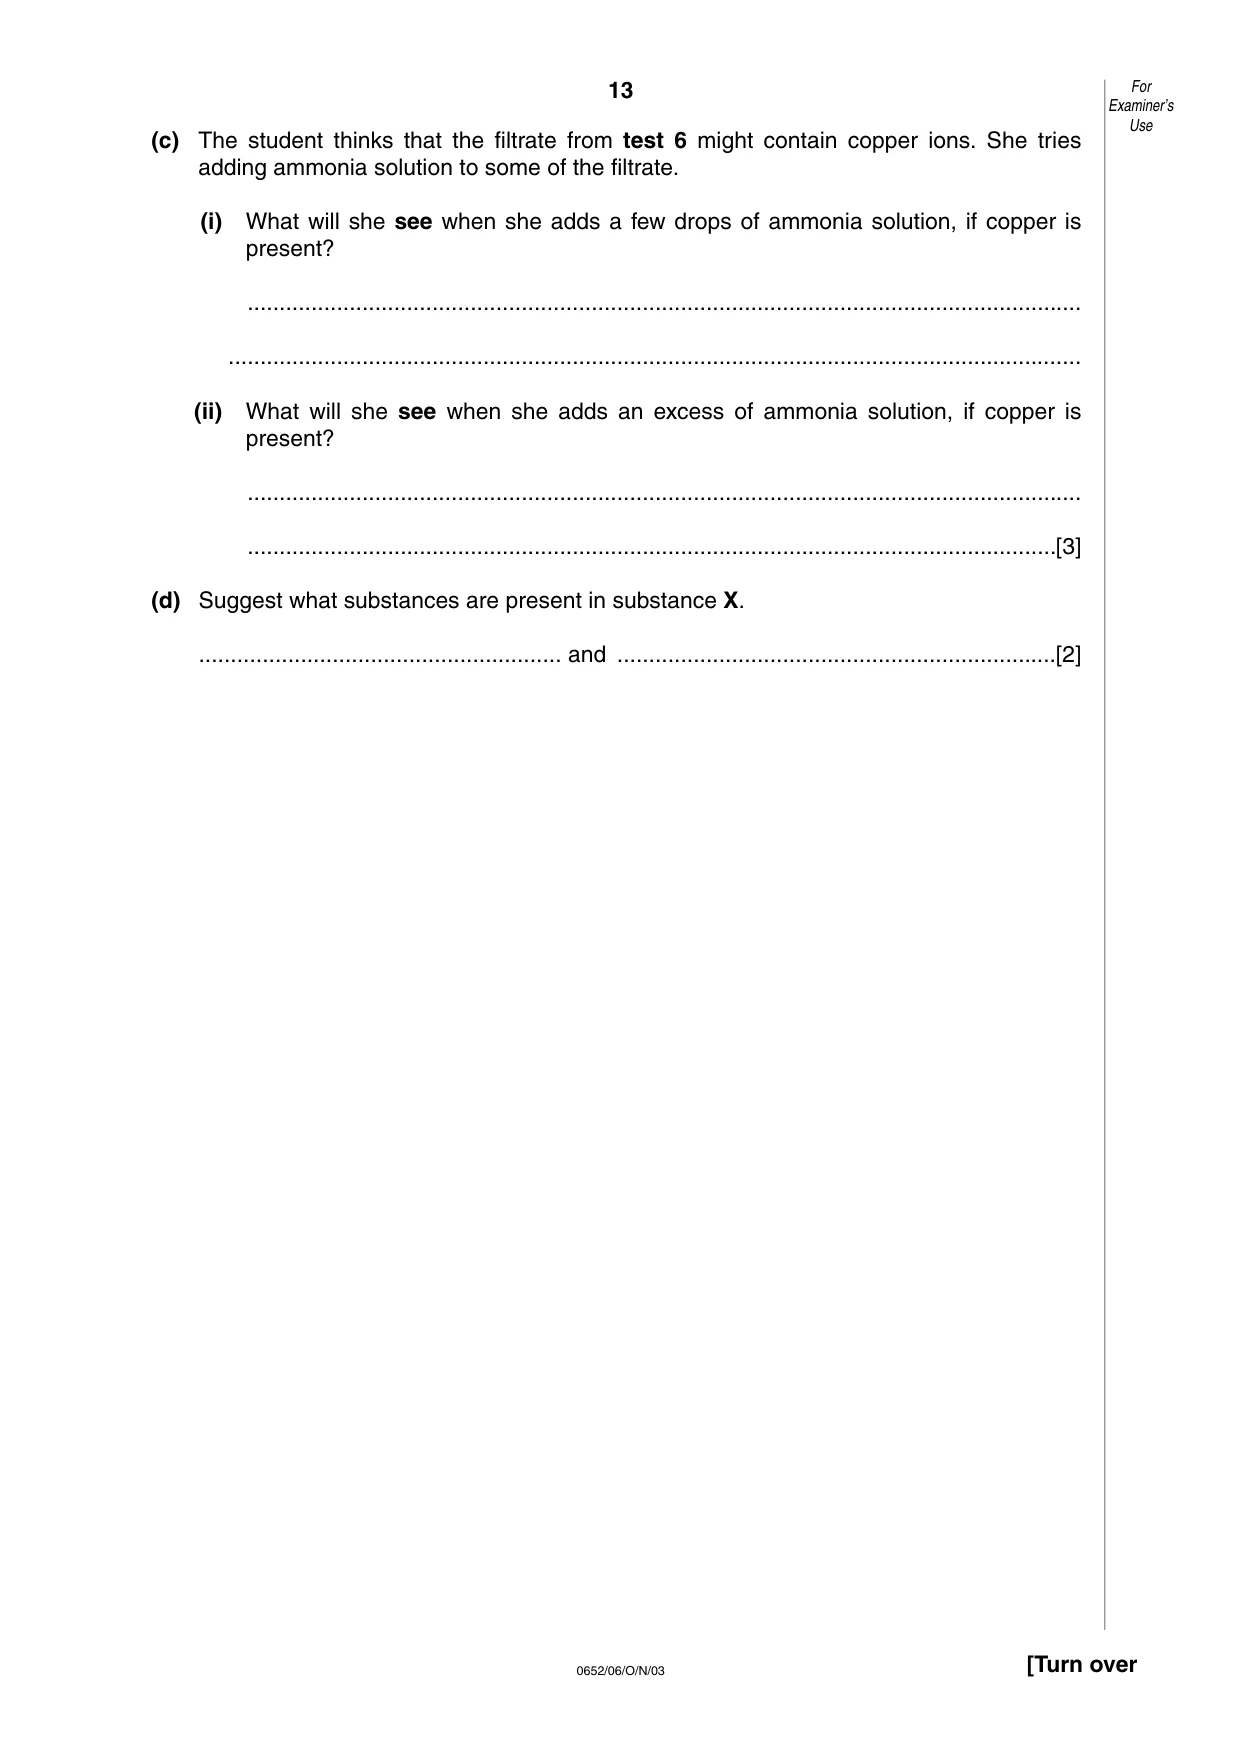
12 0652/06/O/N/03 5 A student is given substance X, which is a mixture of a salt and a metal oxide. Substance X is a black solid. She does the following tests and writes her observations. (a) Complete the table, Fig. 5.1, by writing the conclusions. Fig. 5.1 (b) Suggest another test the student might use to confirm the presence of the gas from test 5. What result can she expect for your test? test … result …[2] For Examiner’s Use test observation conclusion 1. To a small amount of X, add blue solution formed 5 cm3 dilute nitric acid and warm. [1] 2. Warm a portion of X with black residue in filter 15 cm3 water in a large paper and a colourless test-tube. Filter the mixture filtrate and use 2 cm3 of the filtrate for each of the tests 3–5. 3. To 2 cm3 of the filtrate from colourless solution, no test 2, 5 cm3 hydrochloric bubbling seen acid was added. [1] 4. To 2 cm3 of the filtrate from white precipitate test 2, a few drops of nitric acid were added, followed by silver nitrate solution. [1] 5. To 2 cm3 of the filtrate from pungent-smelling gas test 2, about 1 cm3 given off, turns red aqueous sodium hydroxide litmus blue was added. The mixture was warmed. [1] 6. About 10 cm3 warm dilute blue solution formed nitric acid was poured on to the residue from test 2. The filtrate was collected.
Question paper, page 13
13 0652/06/O/N/03 [Turn over (c) The student thinks that the filtrate from test 6 might contain copper ions. She tries adding ammonia solution to some of the filtrate. (i) What will she see when she adds a few drops of ammonia solution, if copper is present? … … (ii) What will she see when she adds an excess of ammonia solution, if copper is present? … …[3] (d) Suggest what substances are present in substance X. … and …[2] For Examiner’s Use
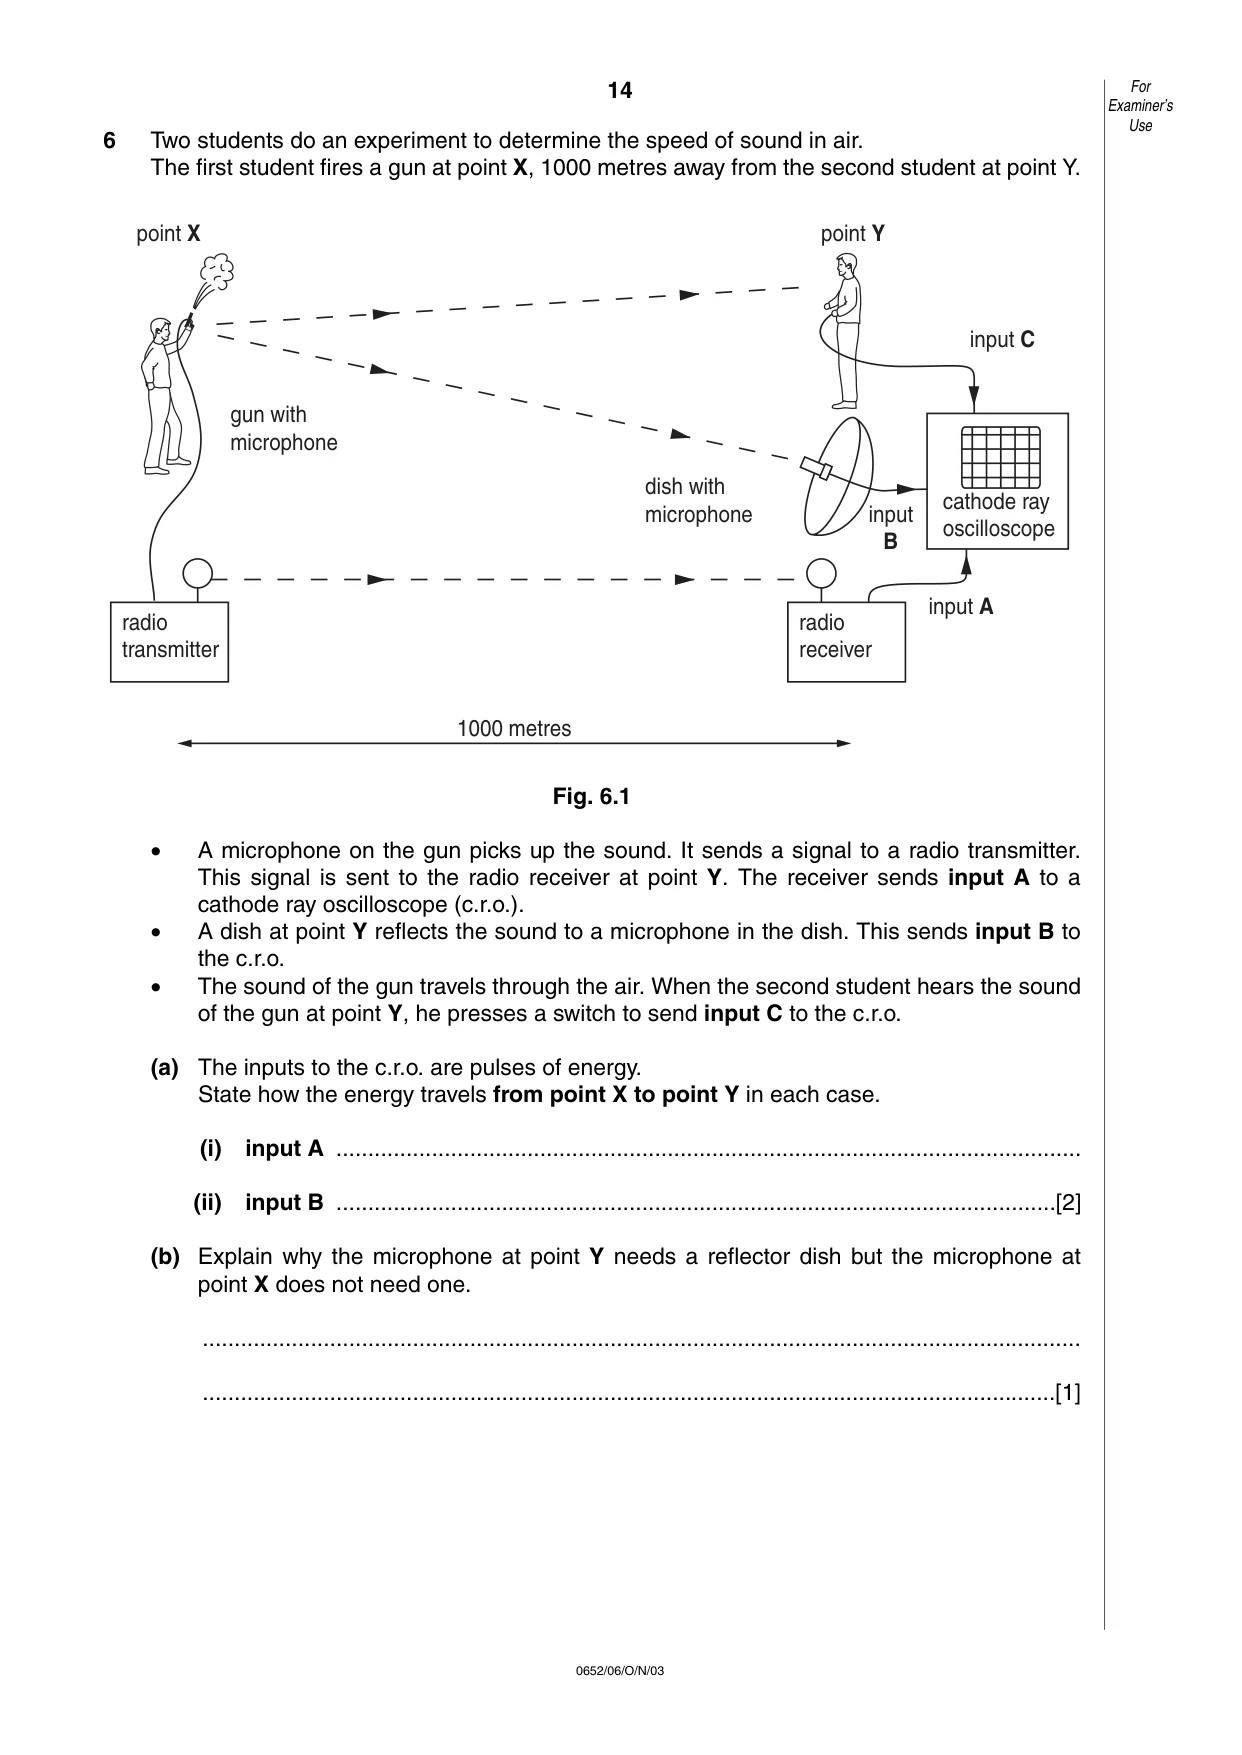
Question paper, page 14
14 0652/06/O/N/03 6 Two students do an experiment to determine the speed of sound in air. The first student fires a gun at point X, 1000 metres away from the second student at point Y. Fig. 6.1 • A microphone on the gun picks up the sound. It sends a signal to a radio transmitter. This signal is sent to the radio receiver at point Y. The receiver sends input A to a cathode ray oscilloscope (c.r.o.). • A dish at point Y reflects the sound to a microphone in the dish. This sends input B to the c.r.o. • The sound of the gun travels through the air. When the second student hears the sound of the gun at point Y, he presses a switch to send input C to the c.r.o. (a) The inputs to the c.r.o. are pulses of energy. State how the energy travels from point X to point Y in each case. (i) input A … (ii) input B …[2] (b) Explain why the microphone at point Y needs a reflector dish but the microphone at point X does not need one. … …[1] radio transmitter radio receiver cathode ray oscilloscope point X point Y input C input A input B gun with microphone dish with microphone 1000 metres For Examiner’s Use
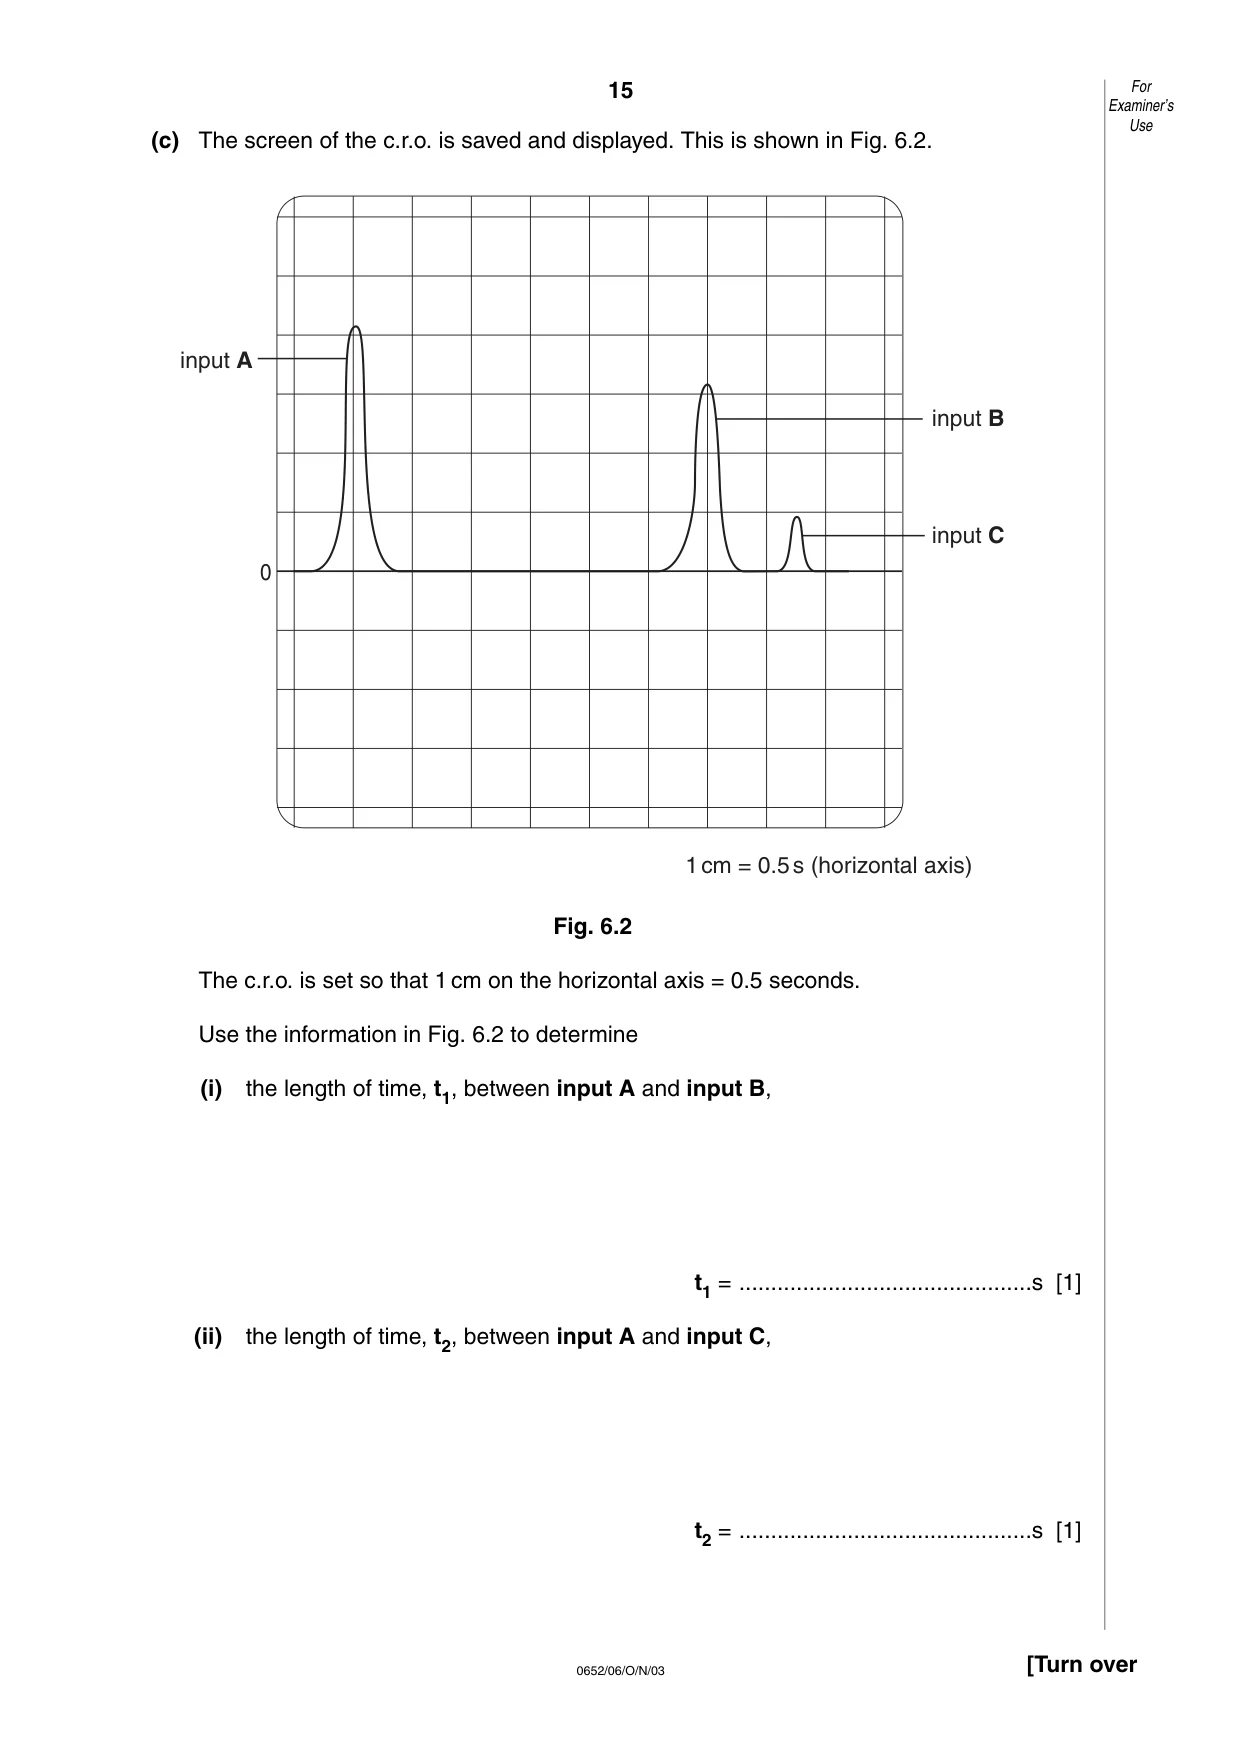
Question paper, page 15
15 0652/06/O/N/03 [Turn over (c) The screen of the c.r.o. is saved and displayed. This is shown in Fig. 6.2. Fig. 6.2 The c.r.o. is set so that 1 cm on the horizontal axis = 0.5 seconds. Use the information in Fig. 6.2 to determine (i) the length of time, t1, between input A and input B, t1 = …s [1] (ii) the length of time, t2, between input A and input C, t2 = …s [1] 0 input A input B input C 1cm = 0.5s (horizontal axis) For Examiner’s Use
Question paper, page 16
16 0652/06/O/N/03 (d) Calculate the speed of sound in metres per second as it travels from point X to point Y (i) using t1 from (c)(i), speed of sound = …m / s [1] (ii) using t2 from (c)(ii), speed of sound = …m / s [1] (e) Which result, (d)(i) or (d)(ii), for the speed of sound is more reliable? Explain your answer. … …[2] (f) How can all of the results from this experiment be made more reliable? … …[1] For Examiner’s Use