Cambridge IGCSE Marine Science (Maldives only) 0697 — 2024 May/June Paper 2 · Variant 2
0697/22/M/J/24 · 6 questions · 80 marks · 105 min
The question paper and its mark scheme, free to read here and free to download. This is Cambridge’s own paper, exactly as it was sat.
Question paper24 pages




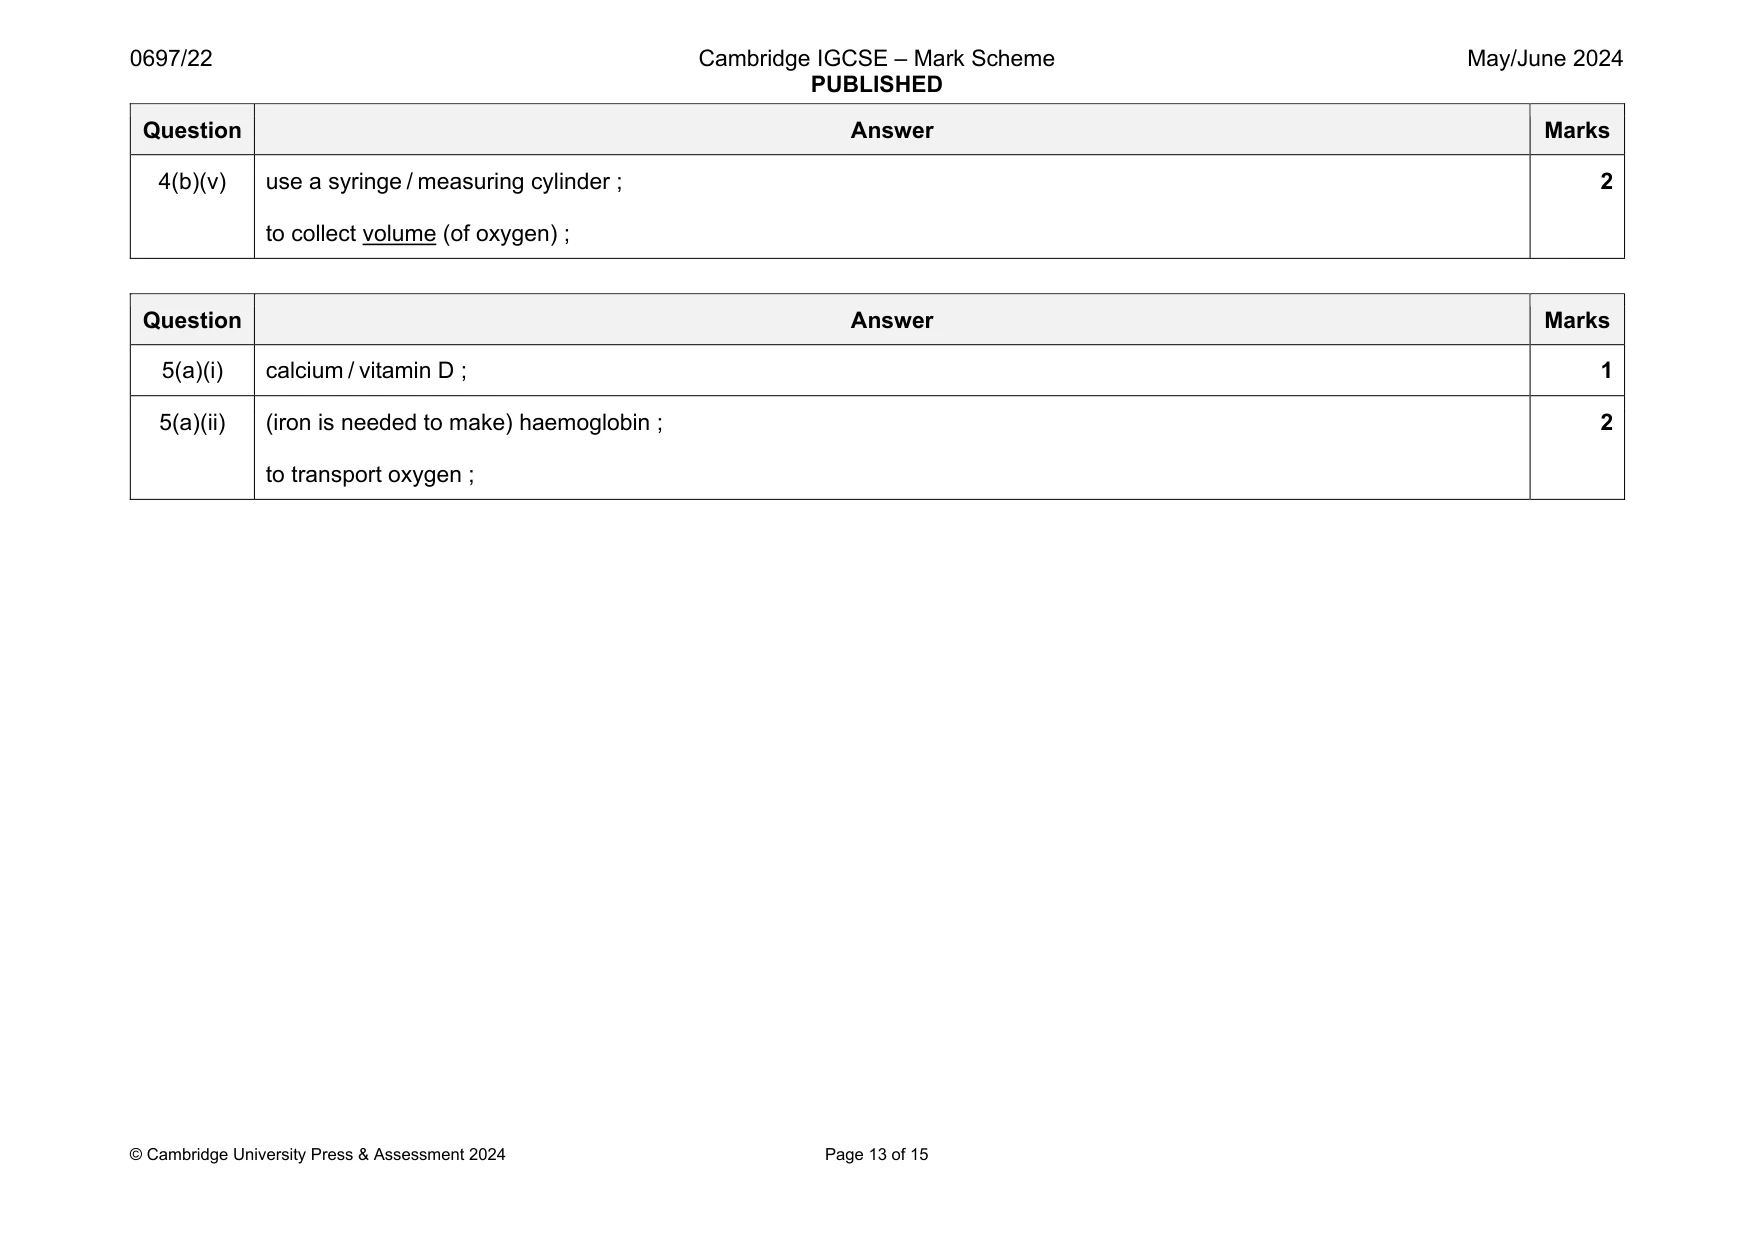
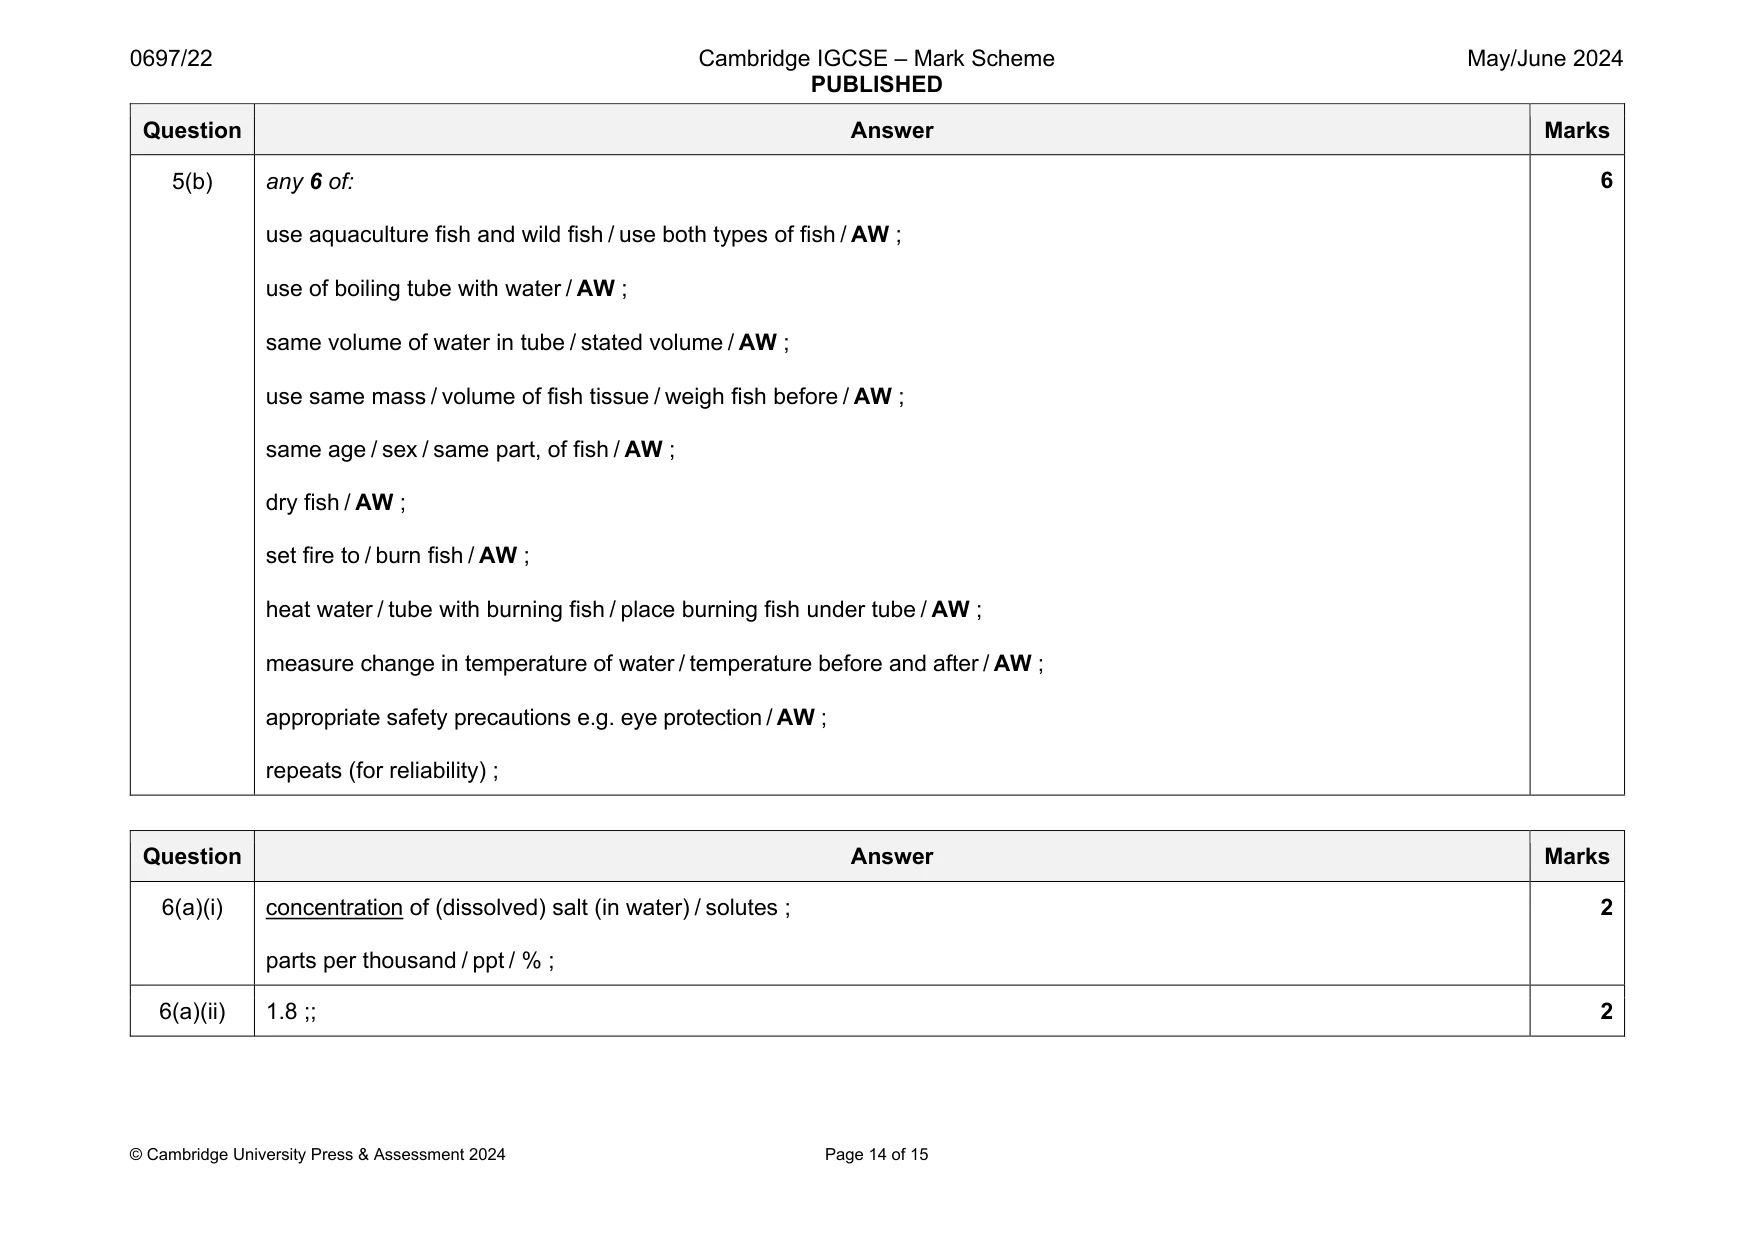
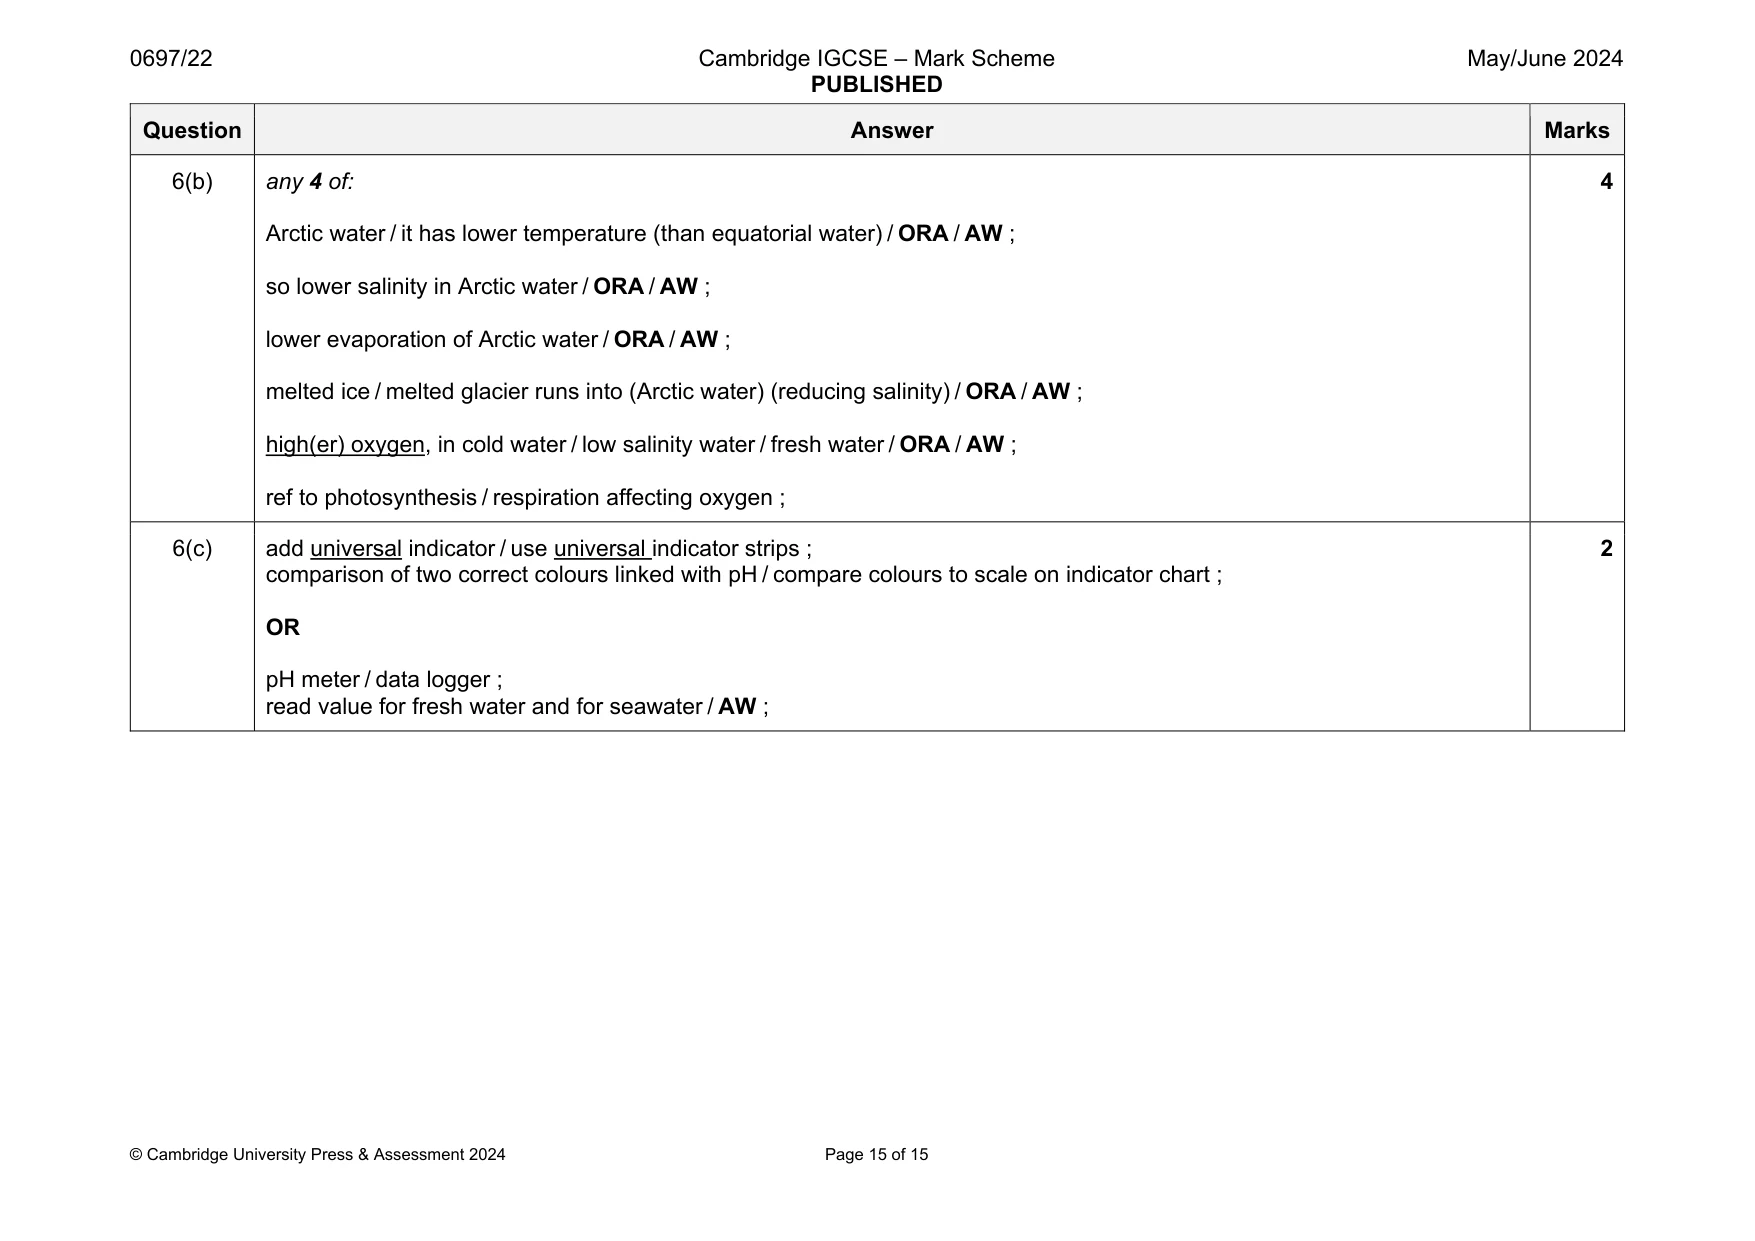
Mark scheme15 pages
Answers below. Sit the paper first if you are practising.
Questions as text
Q1 · The geomorphology of the seabed for an area of the Pacific Ocean that extends from…
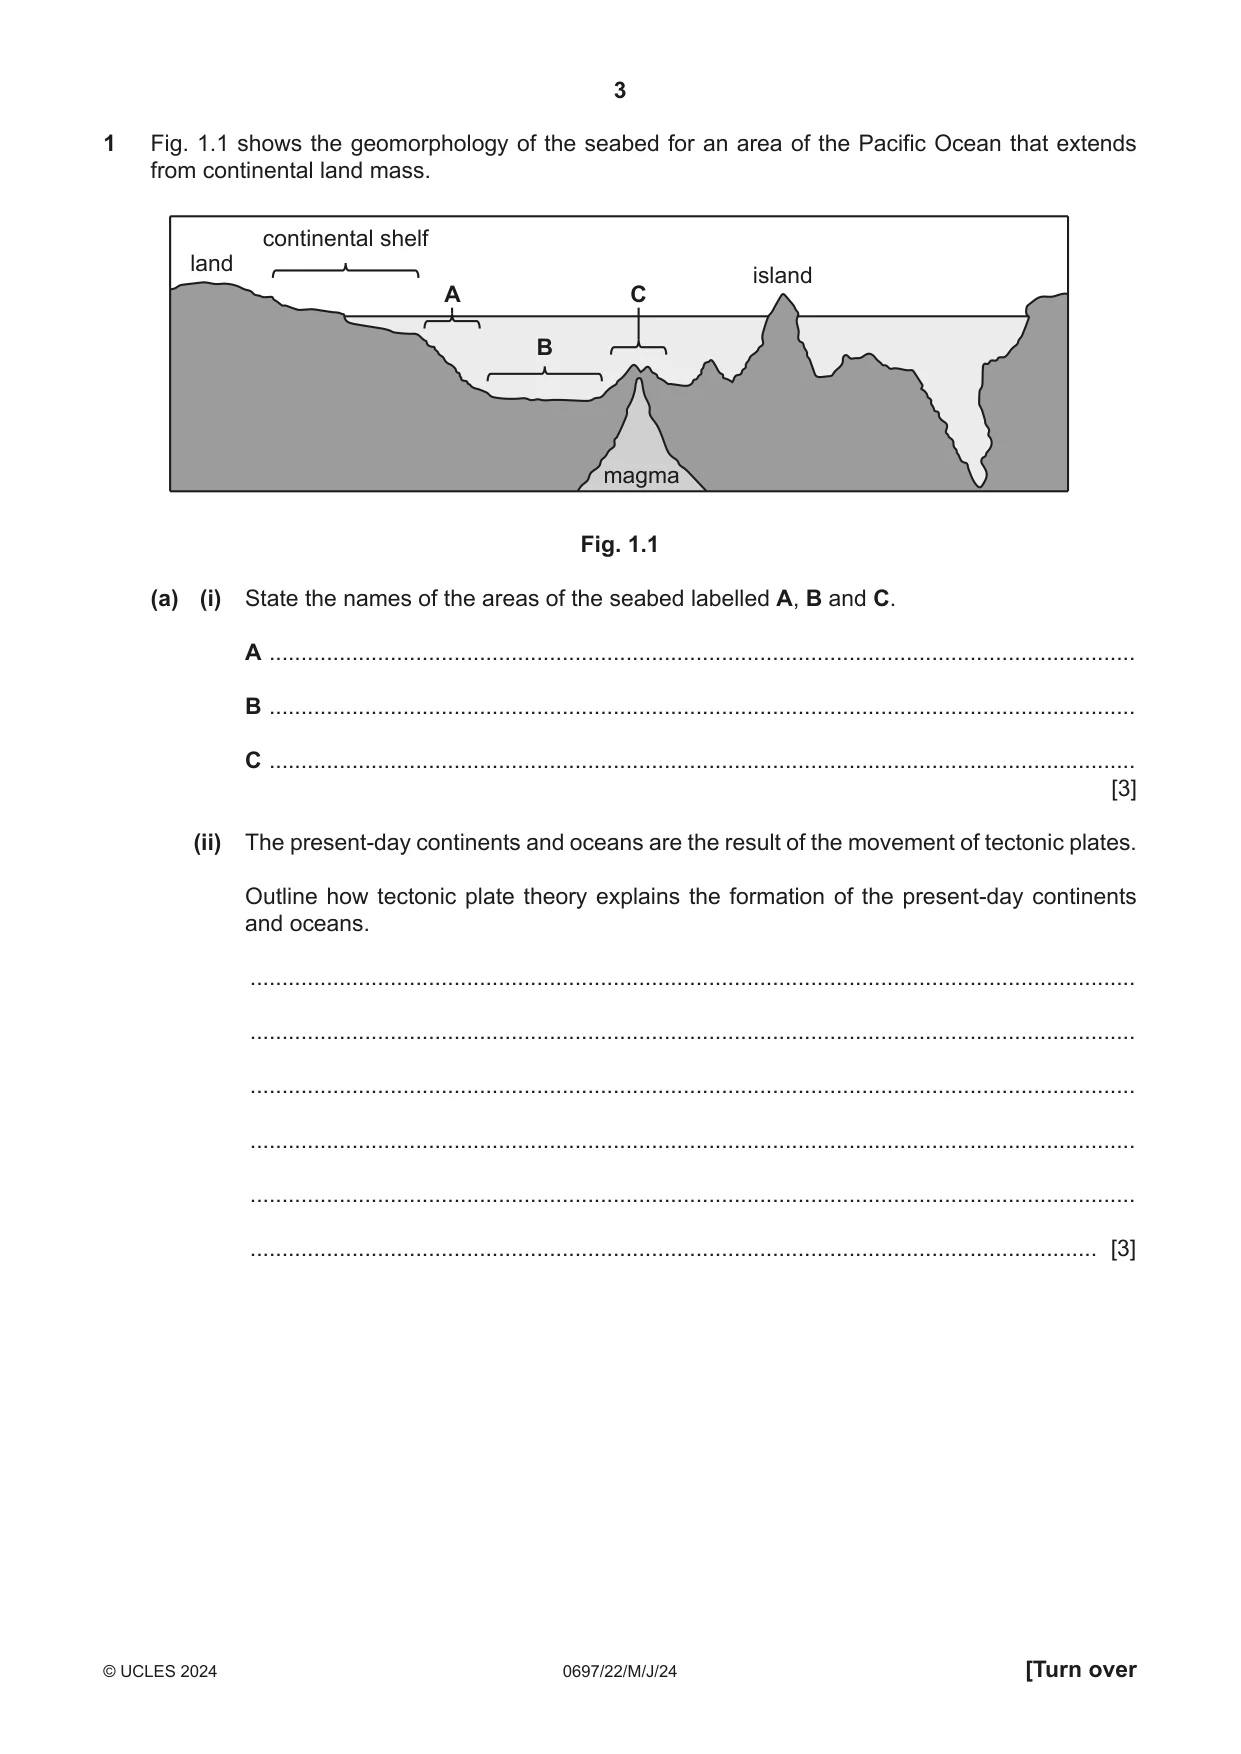
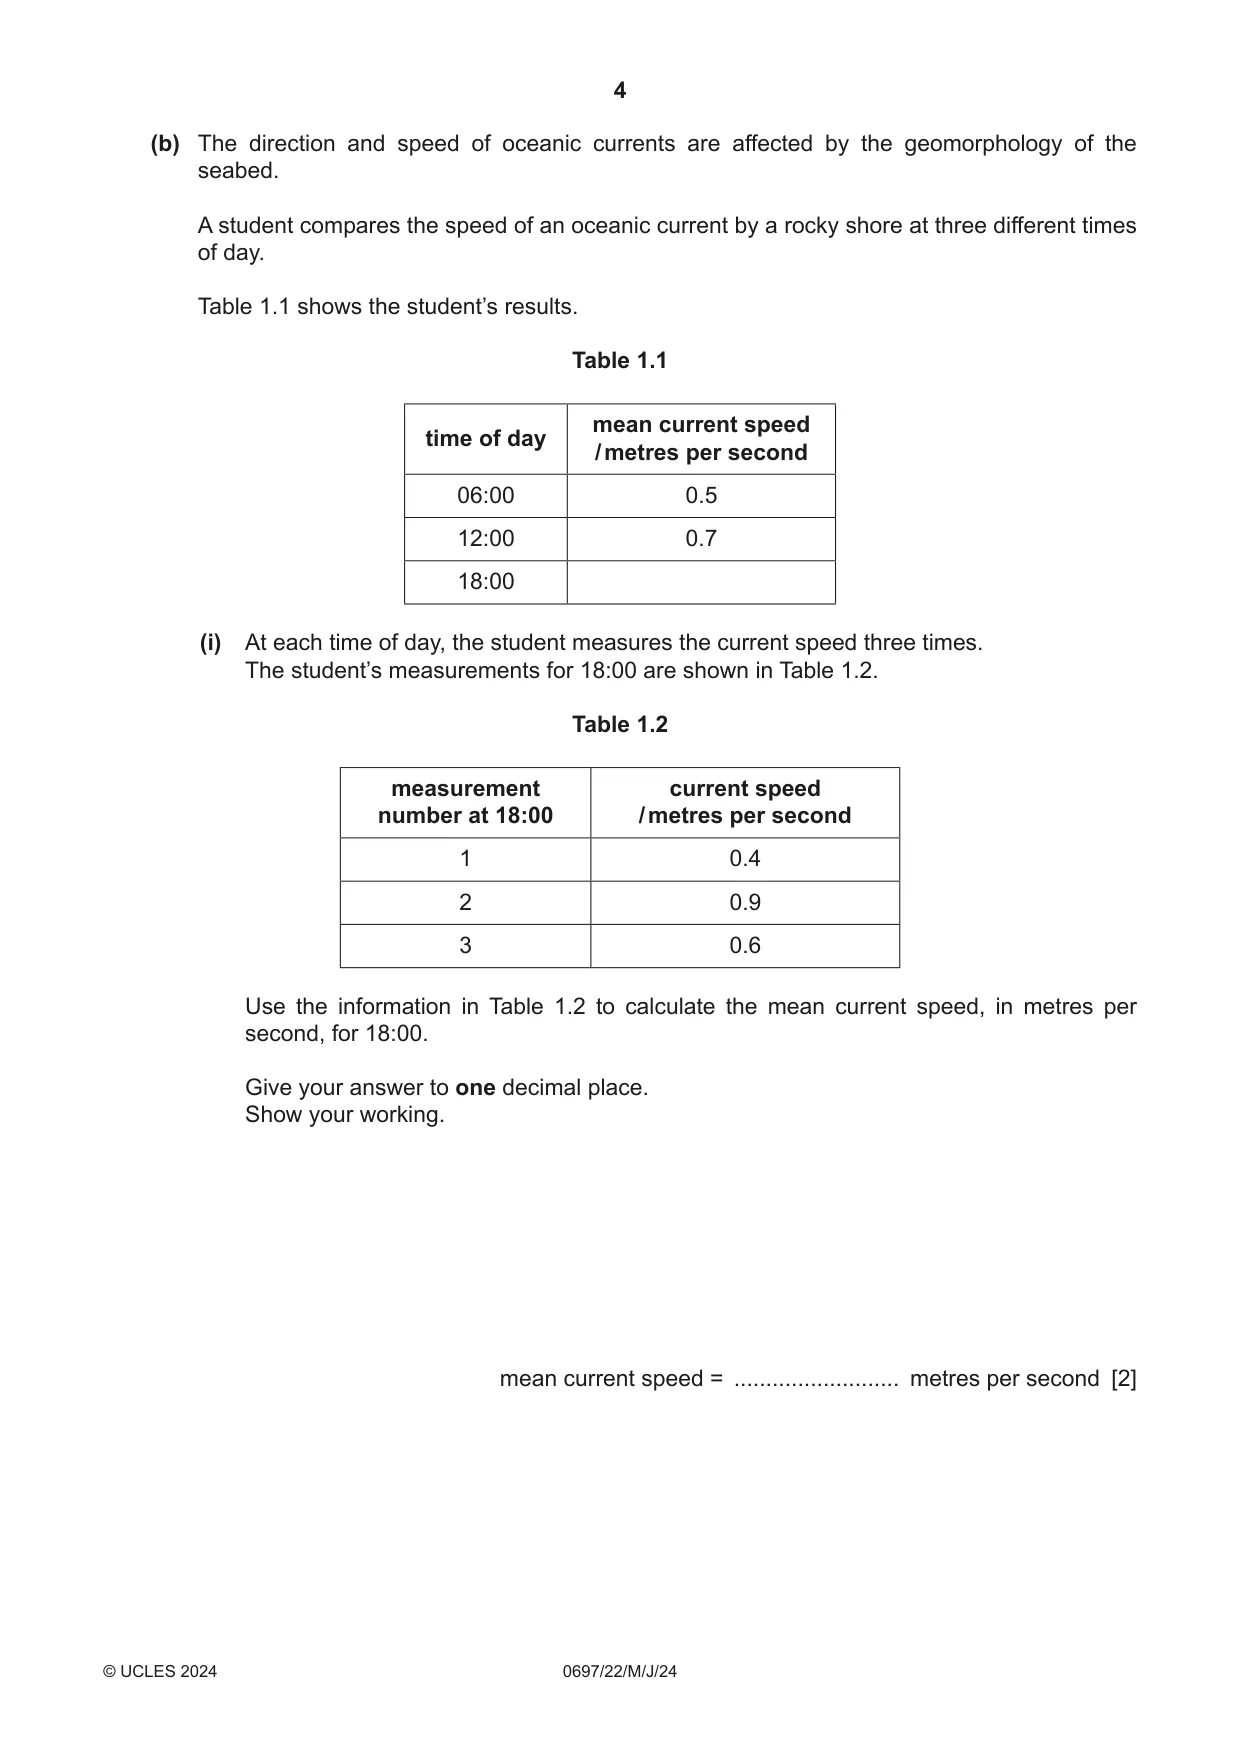
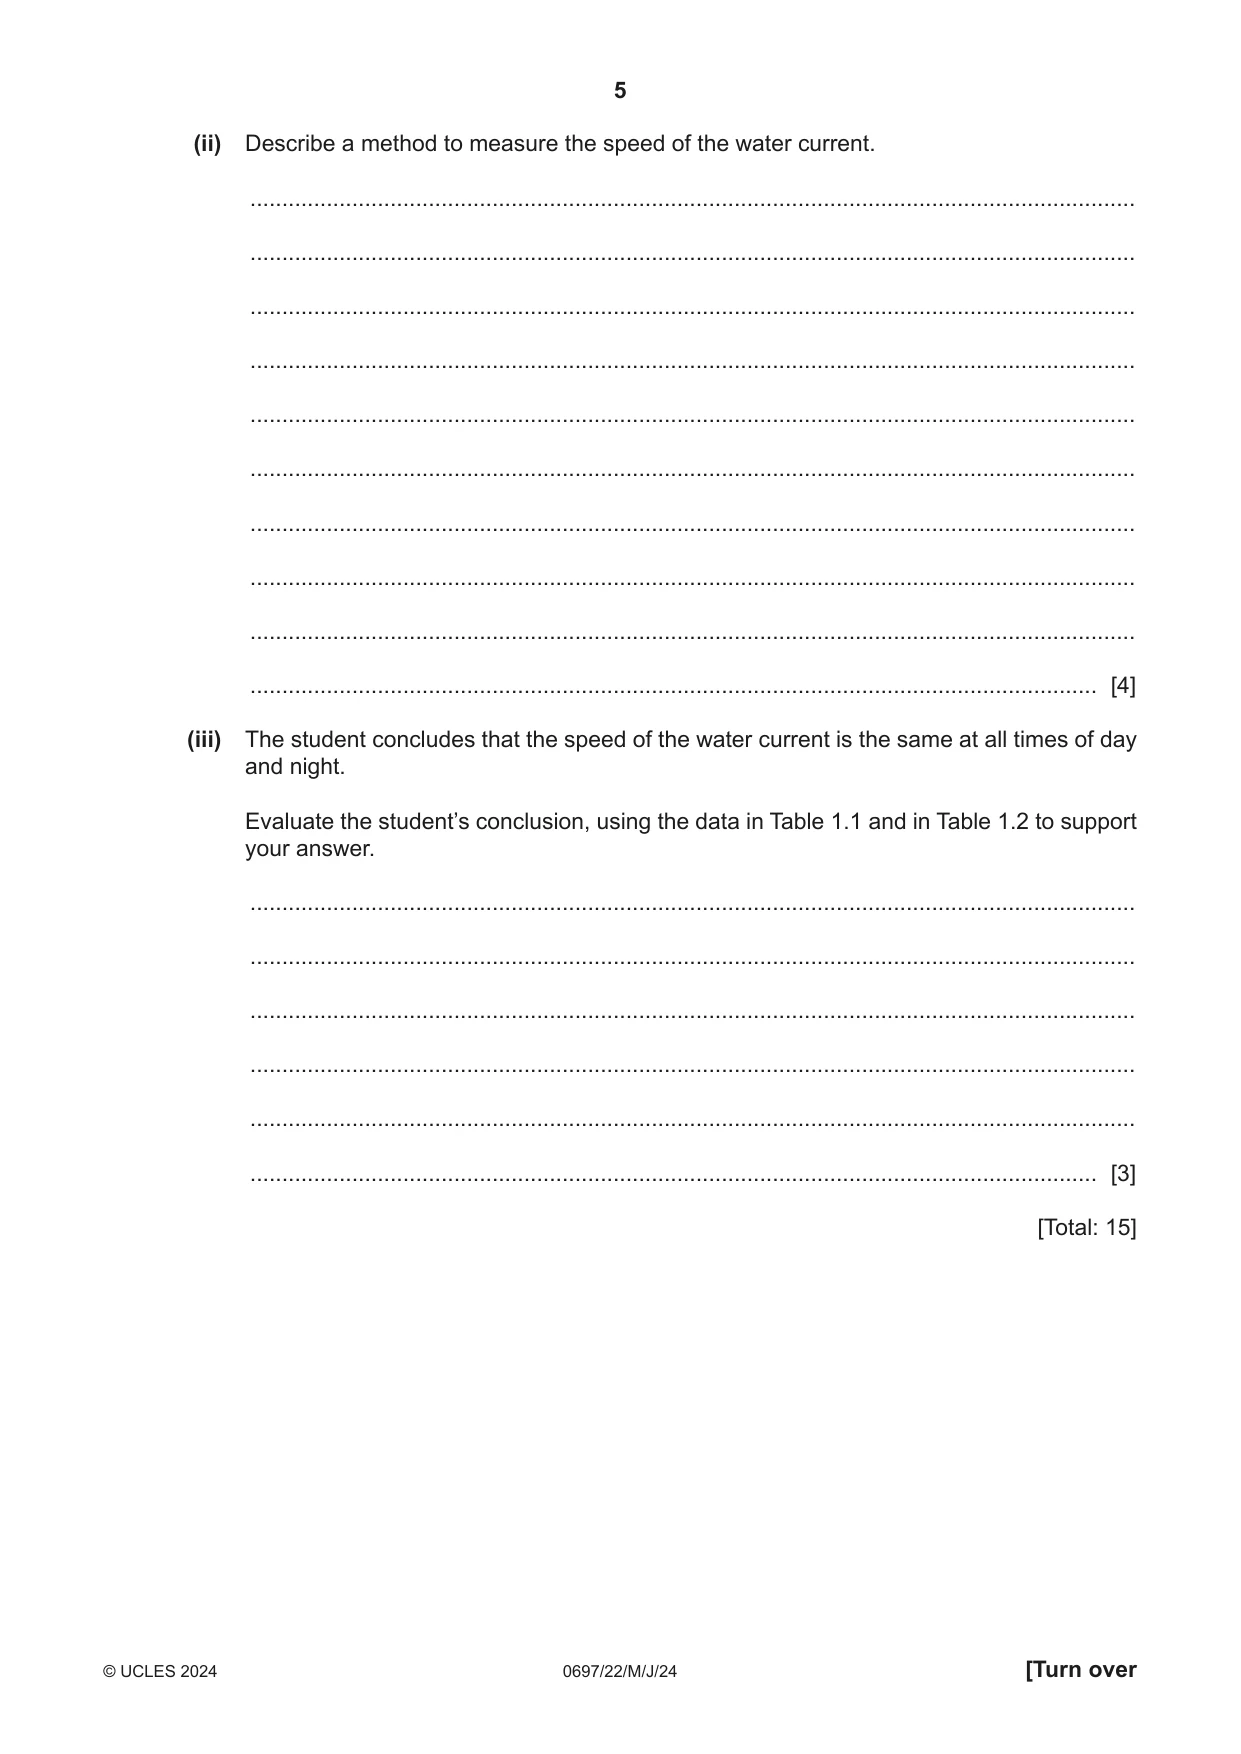
1 Fig. 1.1 shows the geomorphology of the seabed for an area of the Pacific Ocean that extends from continental land mass. continental shelf land island A C B magma Fig. 1.1 (a) (i) State the names of the areas of the seabed labelled A, B and C. A ........................................................................................................................................ B ........................................................................................................................................ C ........................................................................................................................................ [3] (ii) The present‑day continents and oceans are the result of the movement of tectonic plates. Outline how tectonic plate theory explains the formation of the present‑day continents and oceans. ........................................................................................................................................... ........................................................................................................................................... ........................................................................................................................................... ........................................................................................................................................... ........................................................................................................................................... ..................................................................................................................................... [3] (b) The direction and speed of oceanic currents are affected by the geomorphology of the seabed. A student compares the speed of an oceanic current by a rocky shore at three different times of day. Table 1.1 shows the student’s results. Table 1.1 mean current speed time of day / metres per second 06:00 0.5 12:00 0.7 18:00 (i) At each time of day, the student measures the current speed three times. The student’s measurements for 18:00 are shown in Table 1.2. Table 1.2 measurement current speed number at 18:00 / metres per second 1 0.4 2 0.9 3 0.6 Use the information in Table 1.2 to calculate the mean current speed, in metres per second, for 18:00. Give your answer to one decimal place. Show your working. mean current speed = .......................... metres per second [2] (ii) Describe a method to measure the speed of the water current. ........................................................................................................................................... ........................................................................................................................................... ........................................................................................................................................... ........................................................................................................................................... ........................................................................................................................................... ........................................................................................................................................... ........................................................................................................................................... ........................................................................................................................................... ........................................................................................................................................... ..................................................................................................................................... [4] (iii) The student concludes that the speed of the water current is the same at all times of day and night. Evaluate the student’s conclusion, using the data in Table 1.1 and in Table 1.2 to support your answer. ........................................................................................................................................... ........................................................................................................................................... ........................................................................................................................................... ........................................................................................................................................... ........................................................................................................................................... ..................................................................................................................................... [3] [Total: 15]
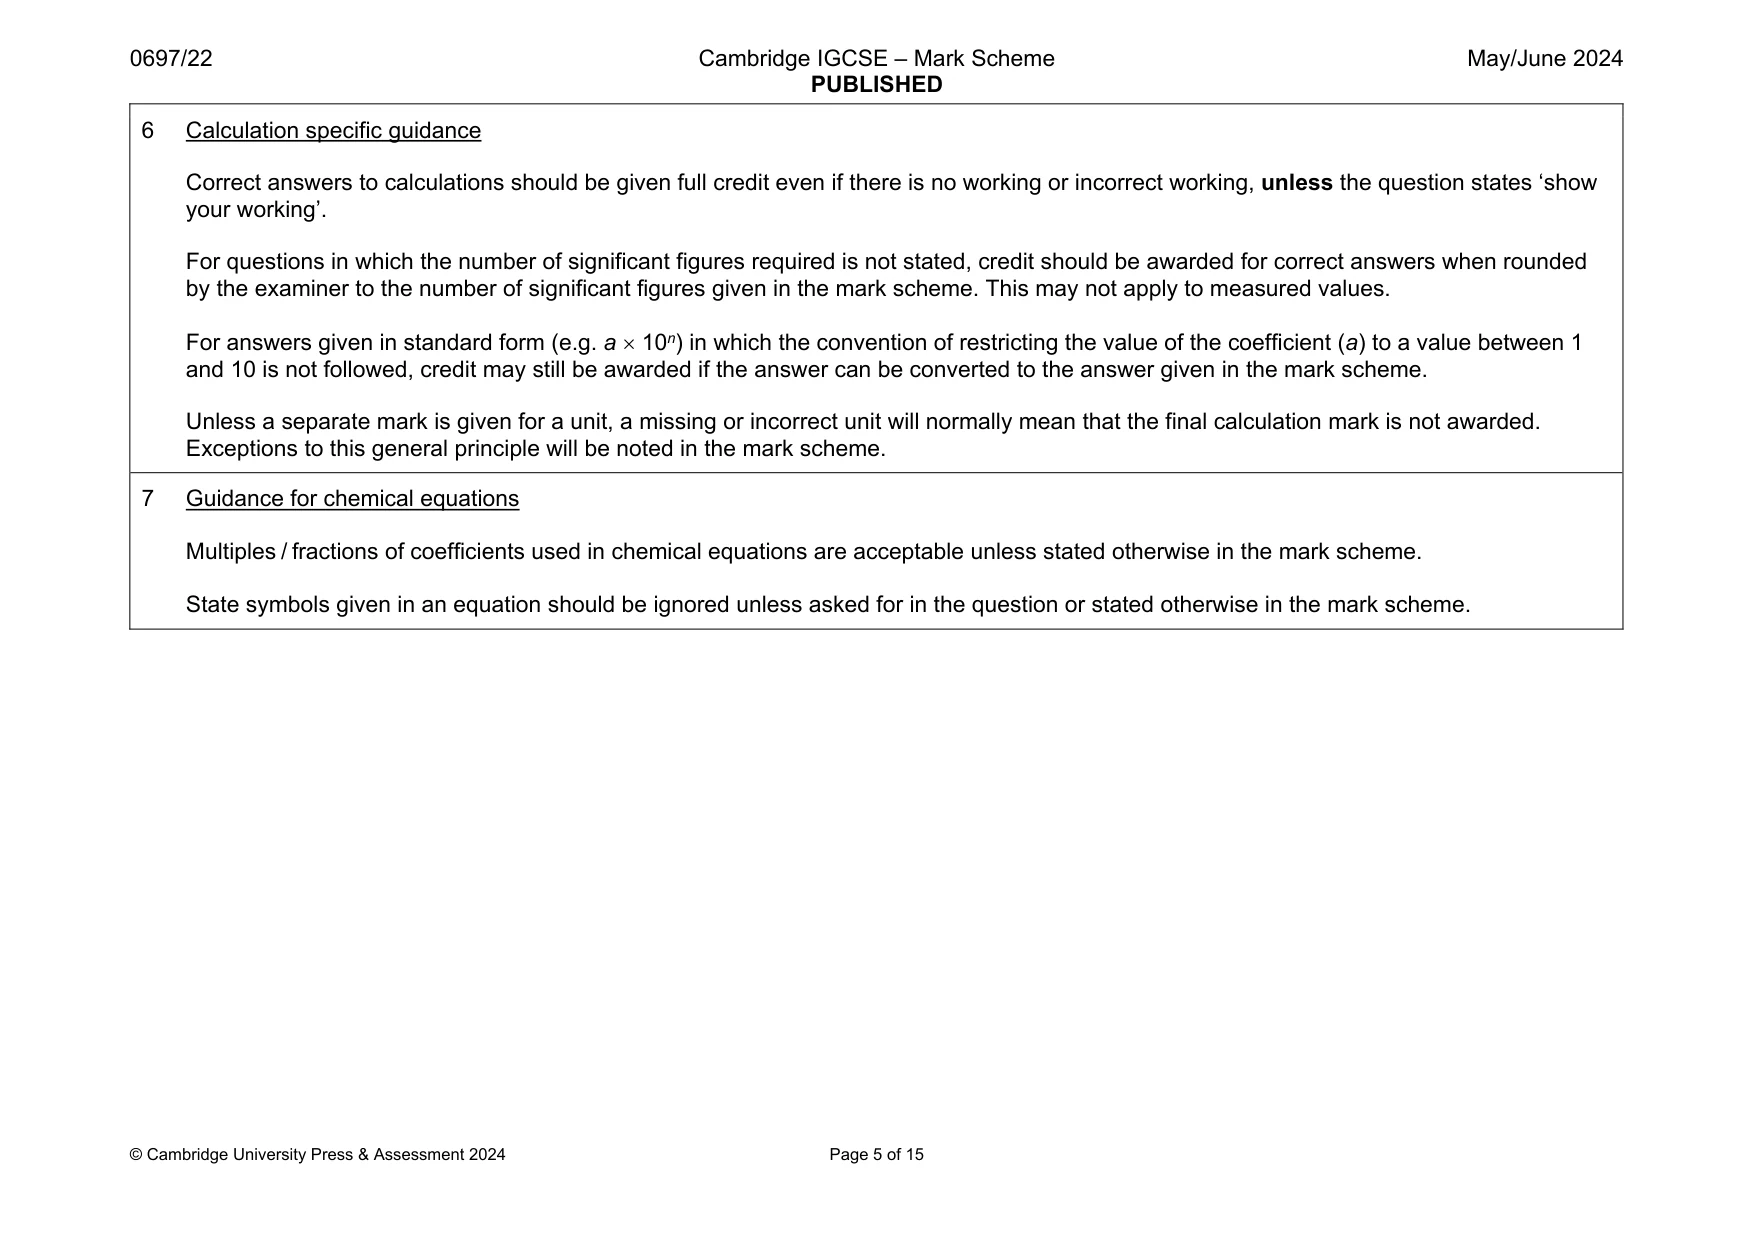
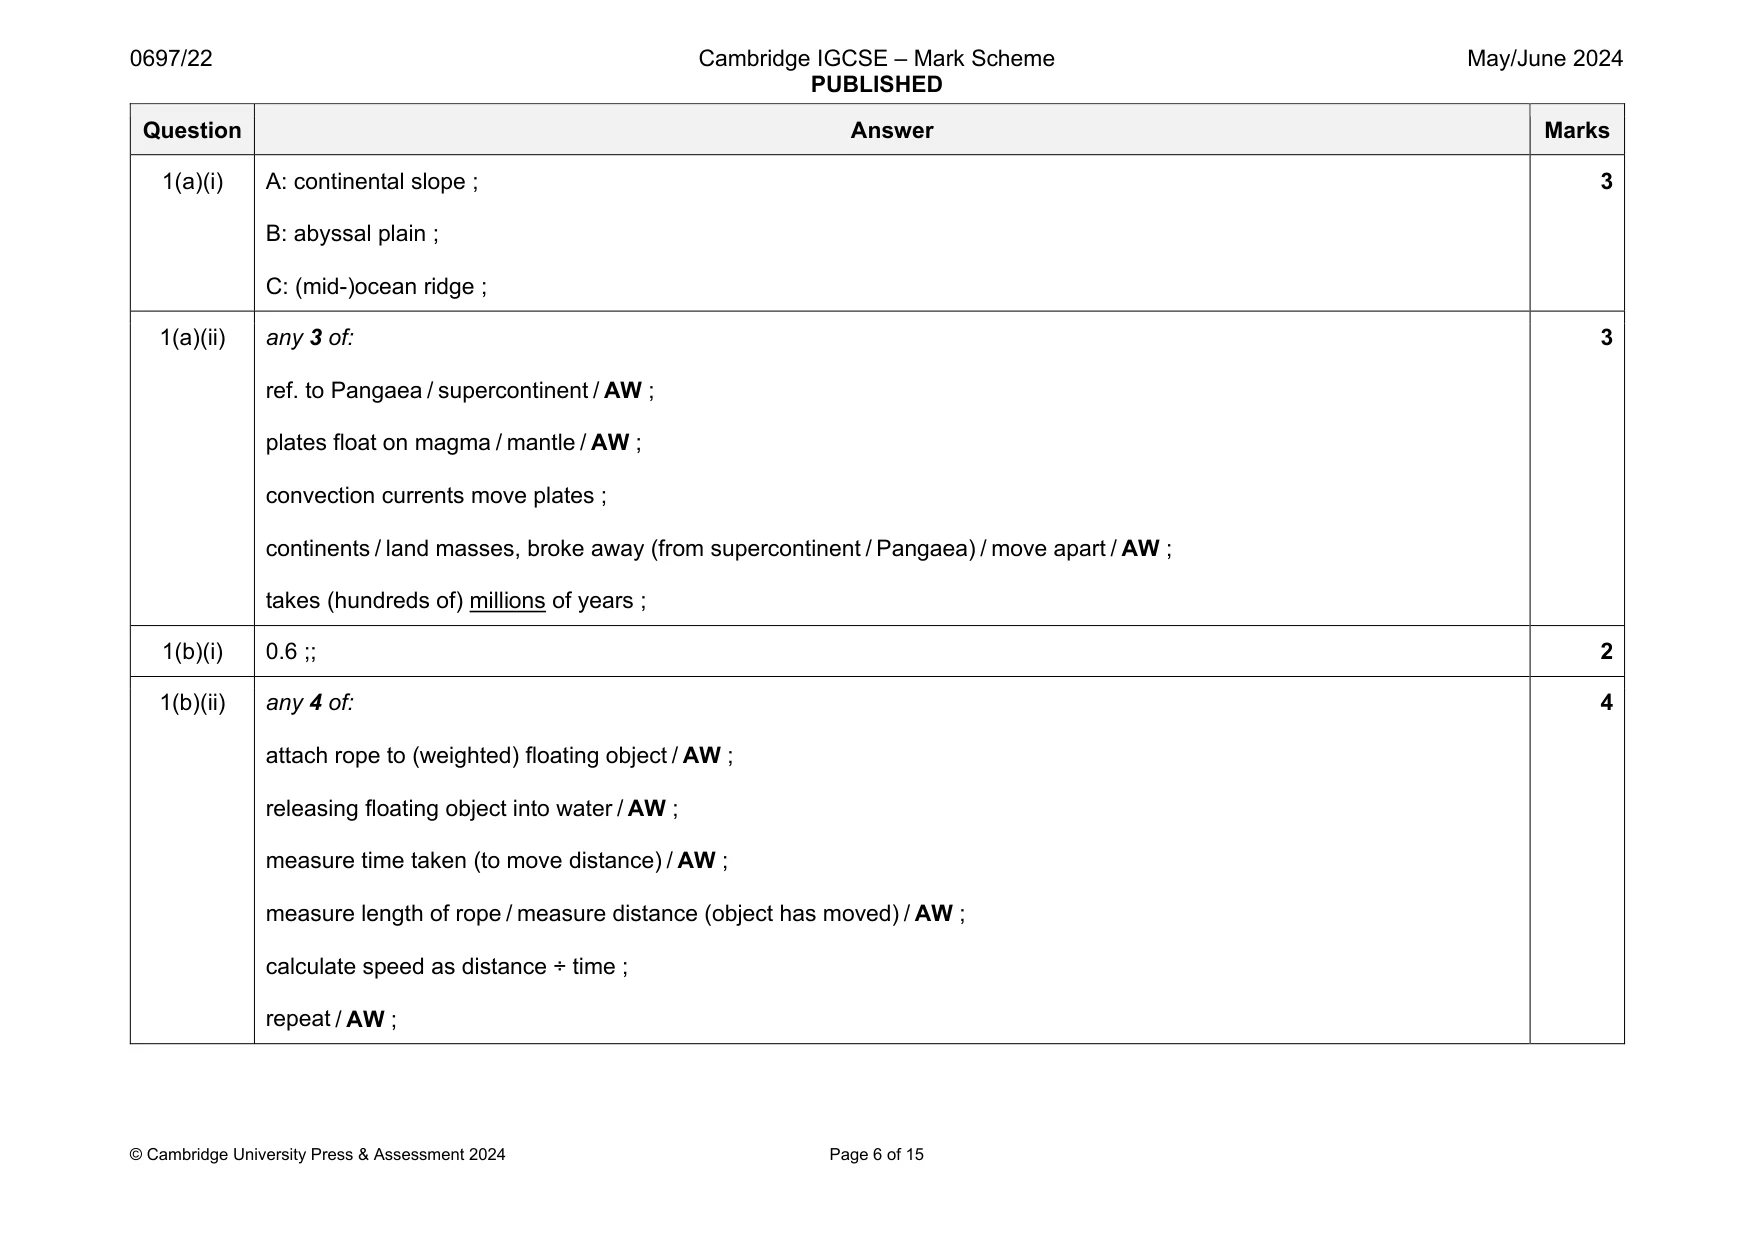
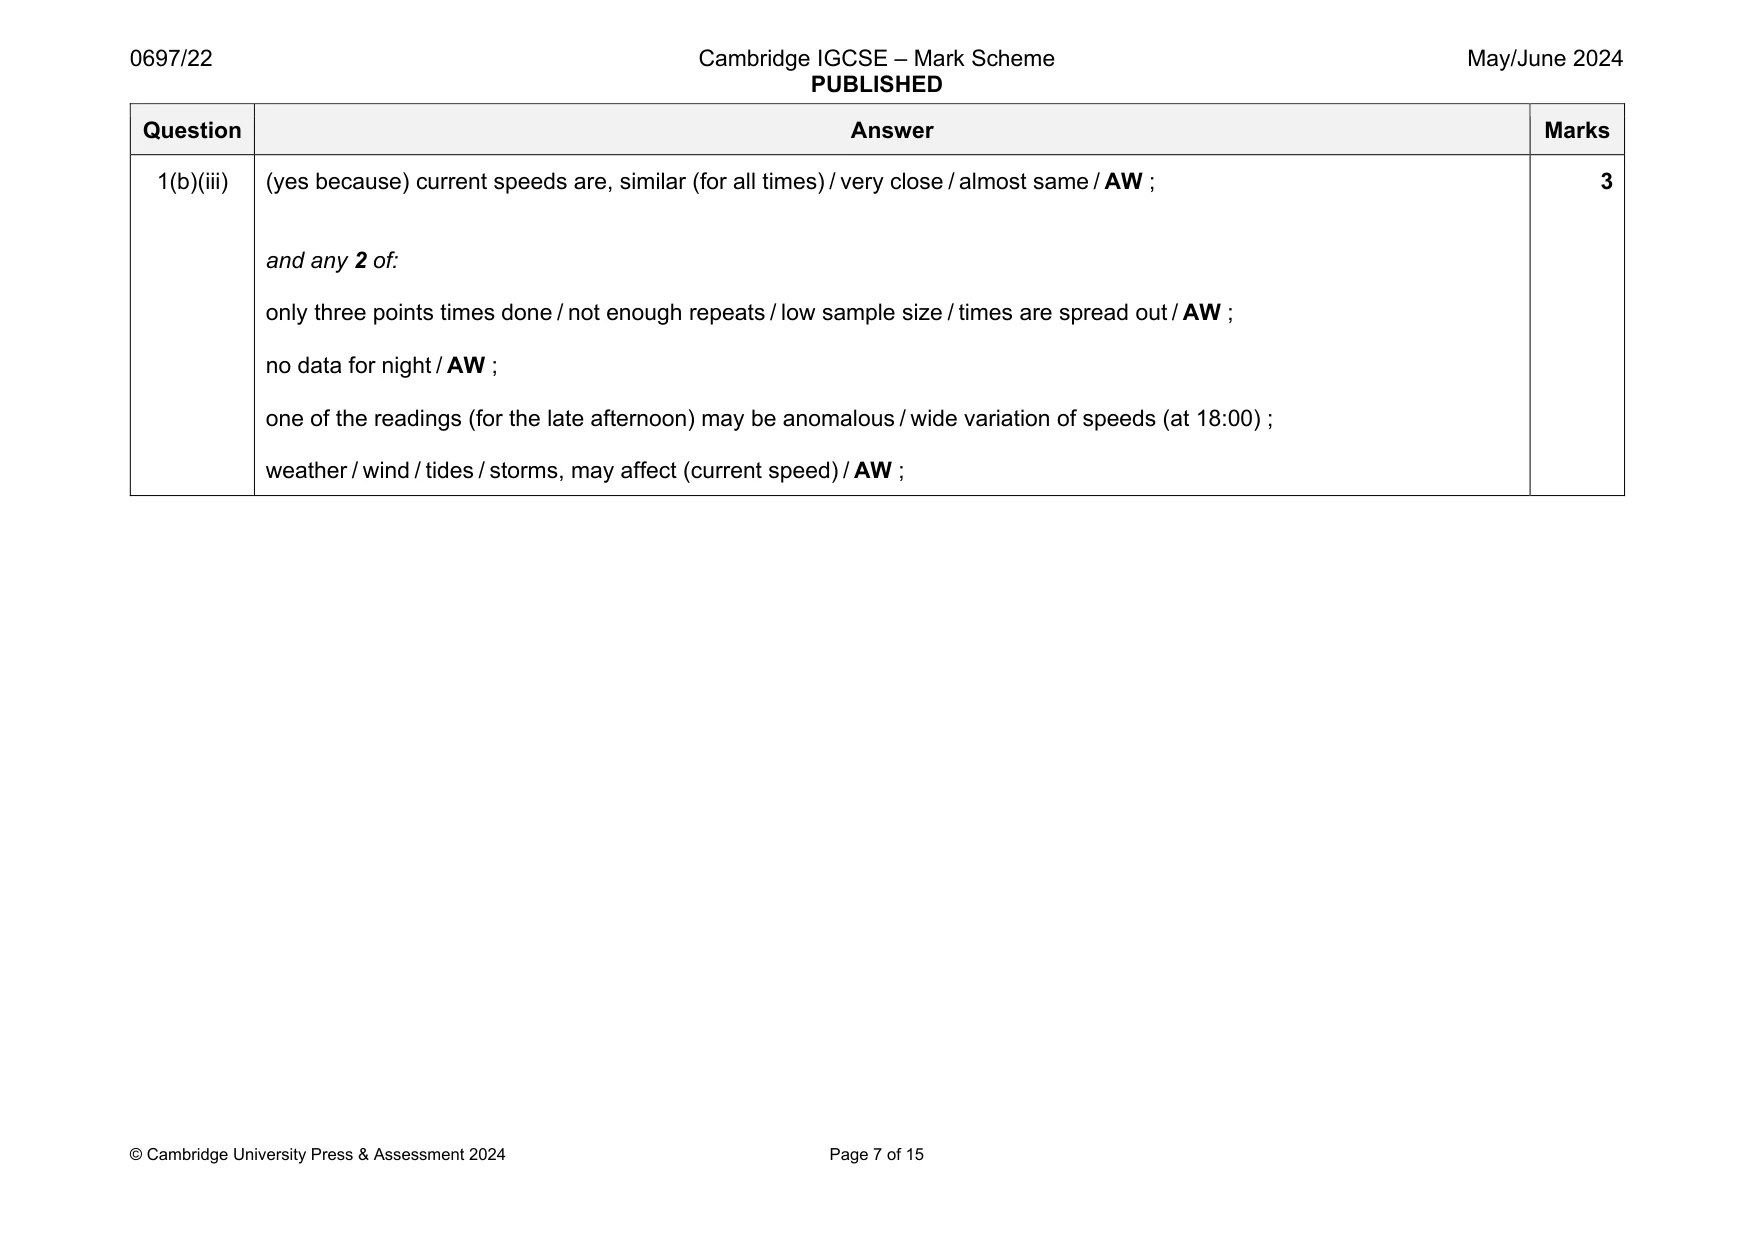
Mark scheme: 1(a)(i) A: continental slope ; B: abyssal plain ; C: (mid-)ocean ridge ; 3 1(a)(ii) any 3 of: ref. to Pangaea / supercontinent / AW ; plates float on magma / mantle / AW ; convection currents move plates ; continents / land masses, broke away (from supercontinent / Pangaea) / move apart / AW ; takes (hundreds of) millions of years ; 3 1(b)(i) 0.6 ;; 2 1(b)(ii) any 4 of: attach rope to (weighted) floating object / AW ; releasing floating object into water / AW ; measure time taken (to move distance) / AW ; measure length of rope / measure distance (object has moved) / AW ; calculate speed as distance ÷ time ; repeat / AW ; 4 Question Answer Marks 1(b)(iii) (yes because) current speeds are, similar (for all times) / very close / almost same / AW ; and any 2 of: only three points times done / not enough repeats / low sample size / times are spread out / AW ; no data for night / AW ; one of the readings (for the late afternoon) may be anomalous / wide variation of speeds (at 18:00) ; weather / wind / tides / storms, may affect (current speed) / AW ; 3
Q2 · Mackerel are pelagic fish that are often caught by using purse seine nets
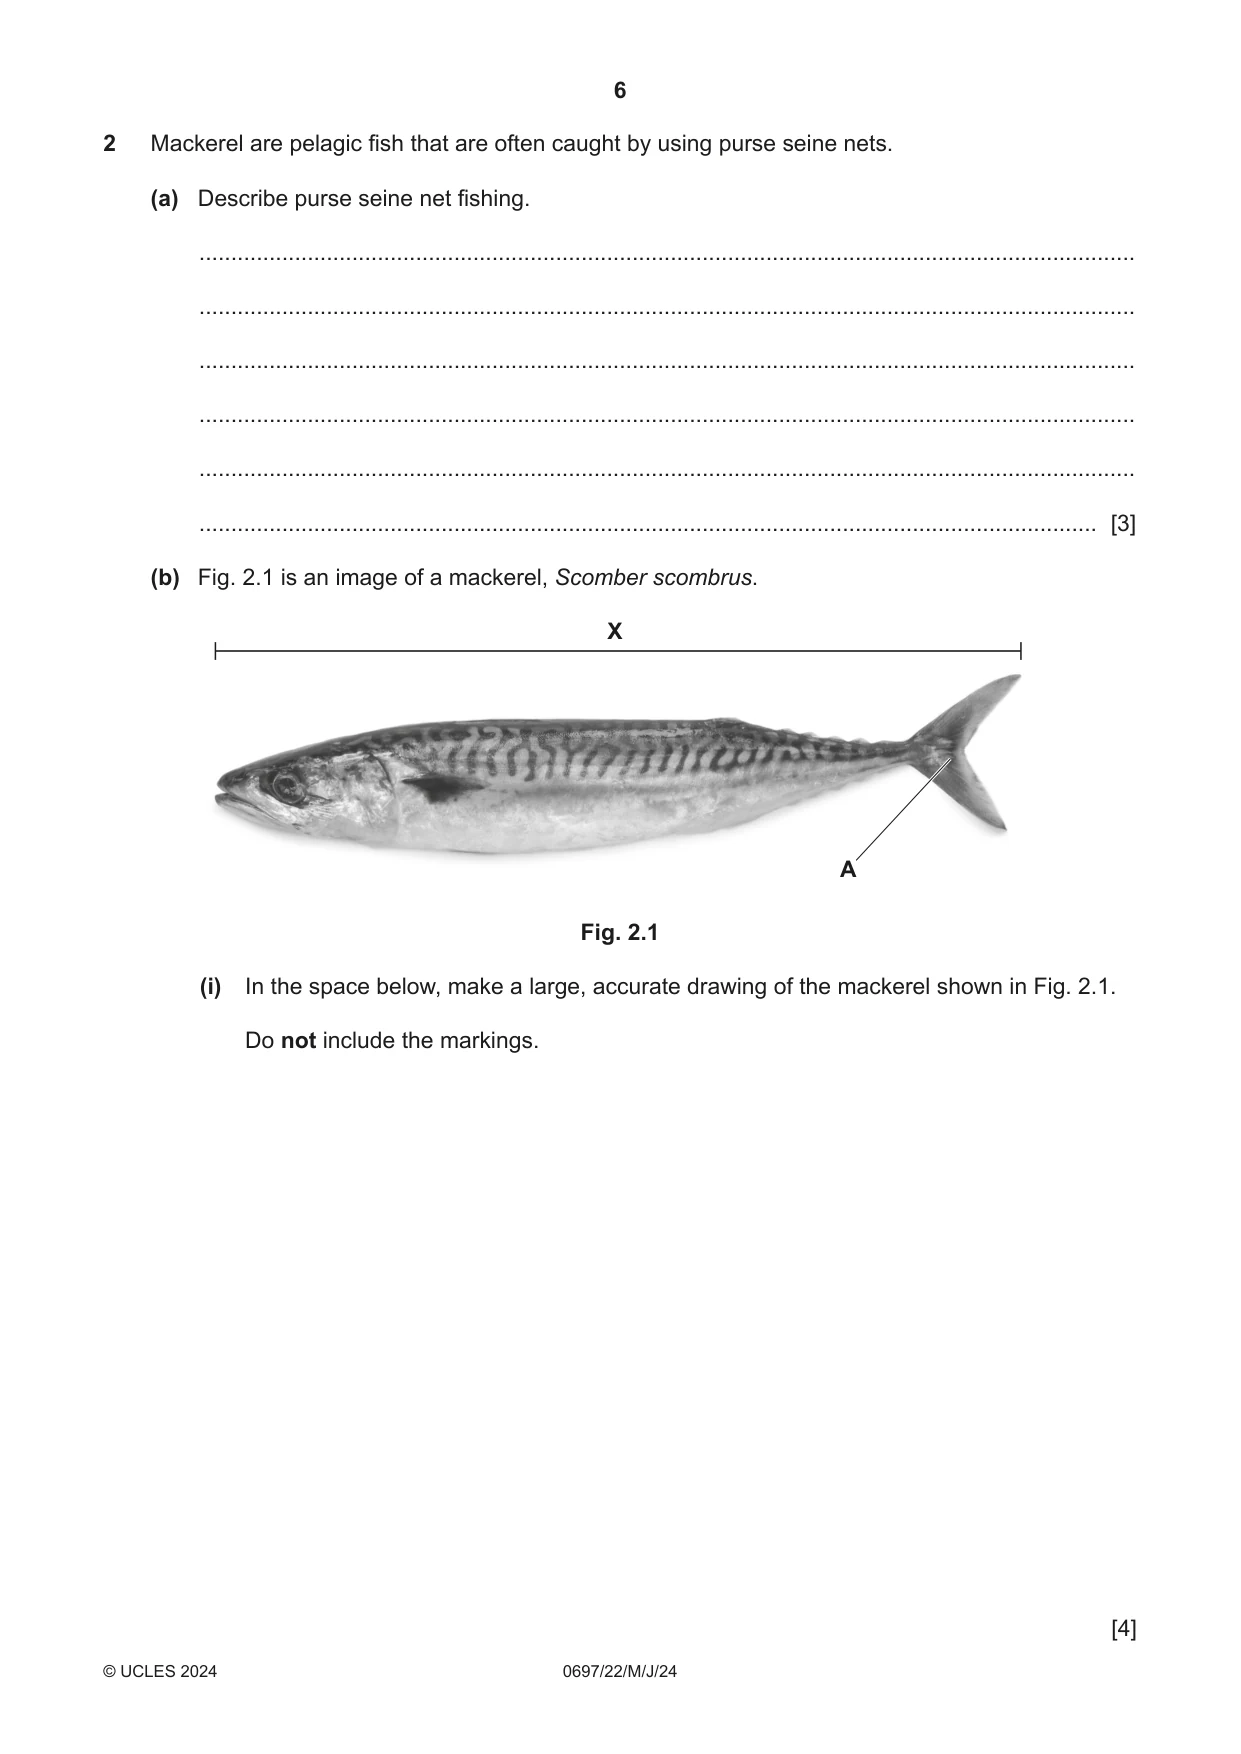
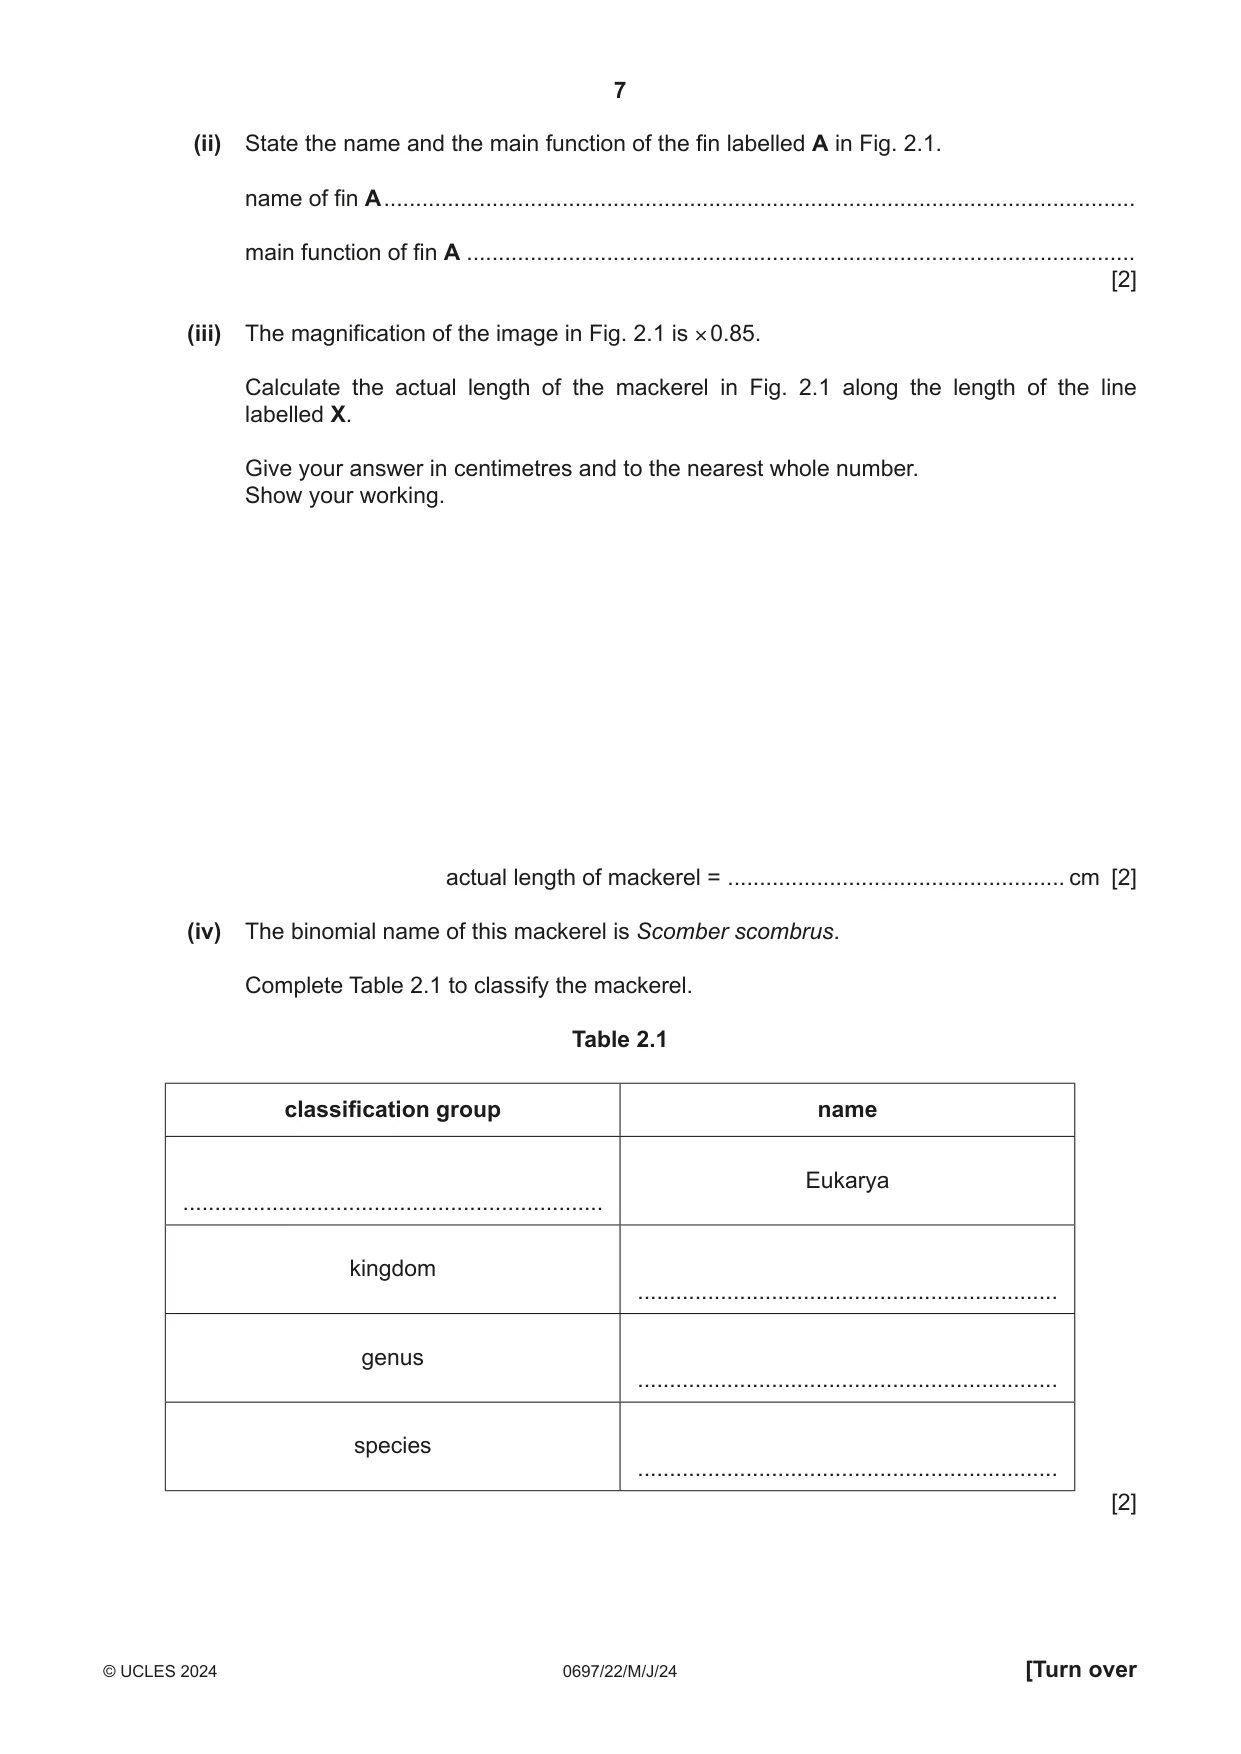
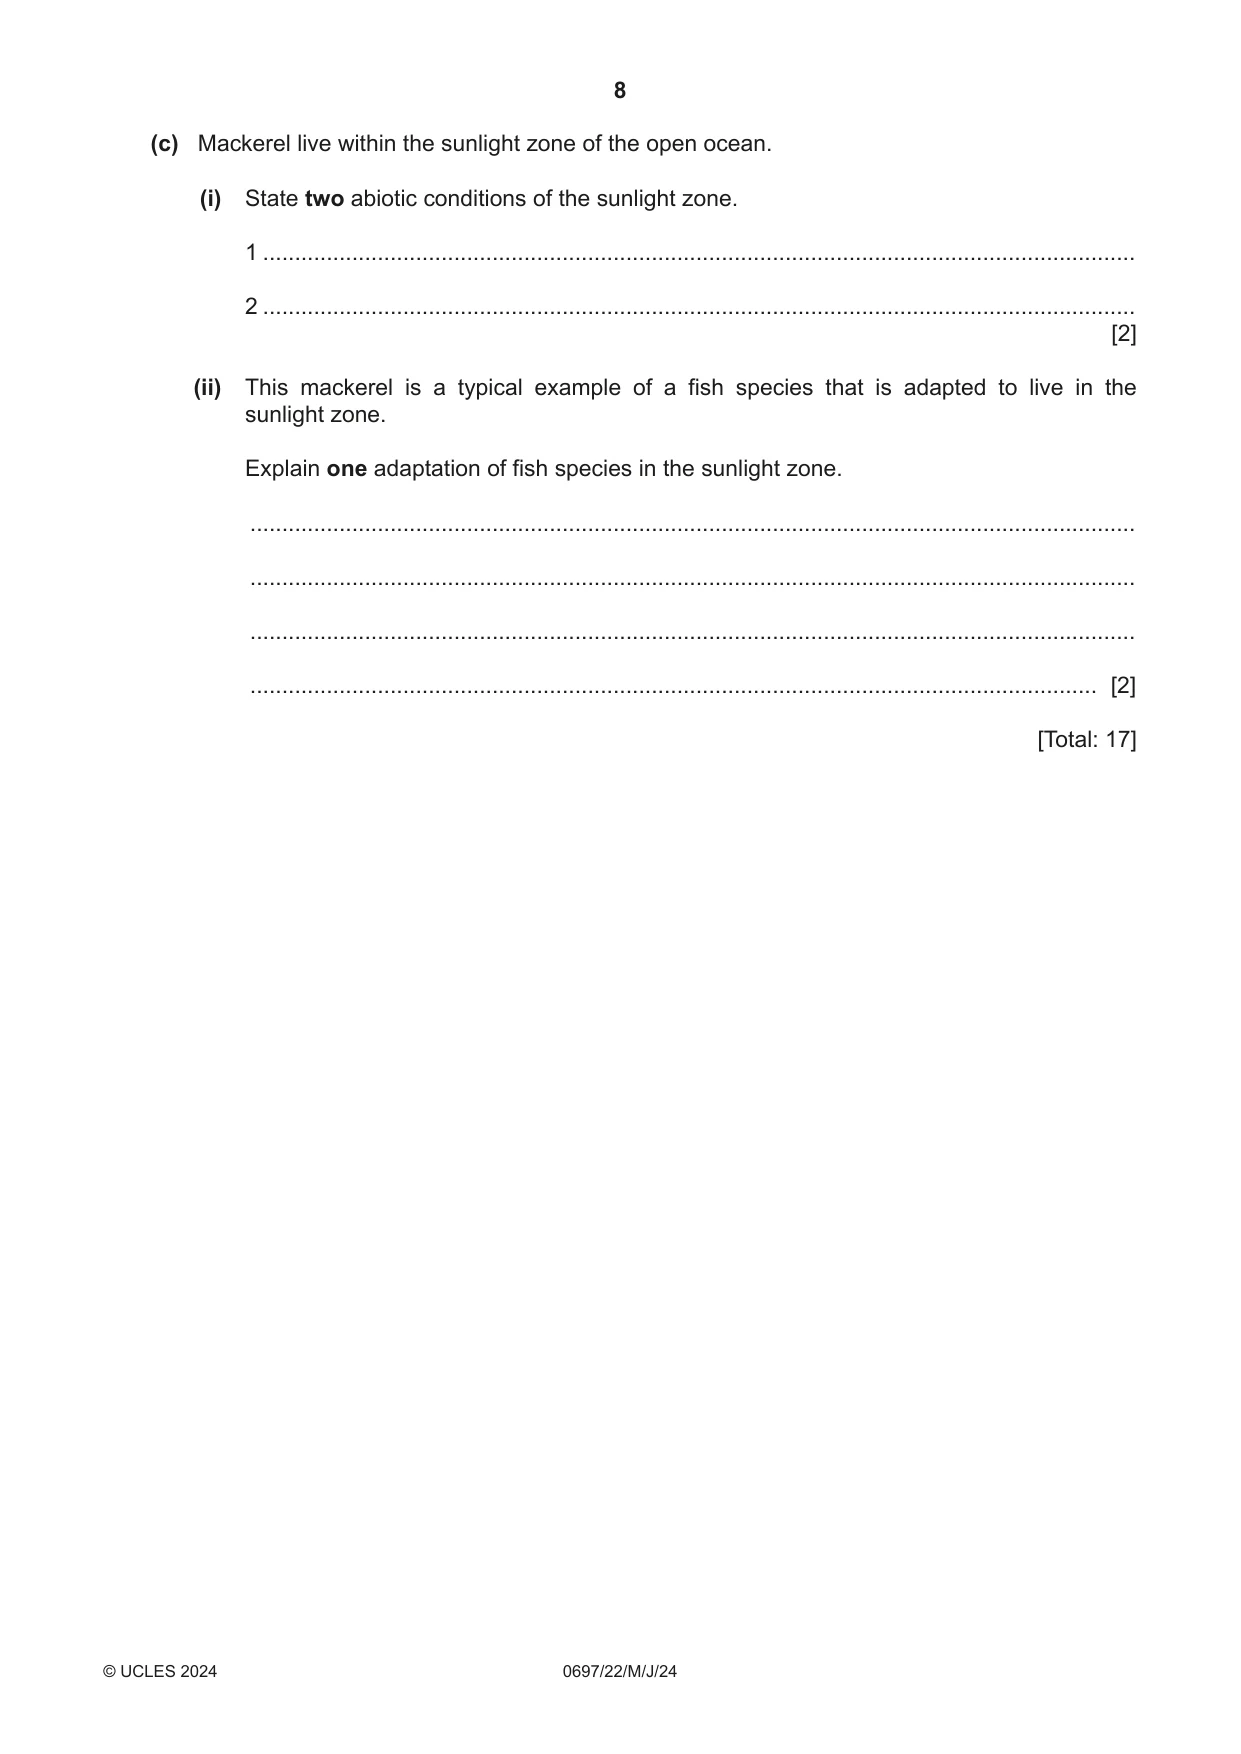
2 Mackerel are pelagic fish that are often caught by using purse seine nets. (a) Describe purse seine net fishing. ................................................................................................................................................... ................................................................................................................................................... ................................................................................................................................................... ................................................................................................................................................... ................................................................................................................................................... ............................................................................................................................................. [3] (b) Fig. 2.1 is an image of a mackerel, Scomber scombrus. X A Fig. 2.1 (i) In the space below, make a large, accurate drawing of the mackerel shown in Fig. 2.1. Do not include the markings. [4] (ii) State the name and the main function of the fin labelled A in Fig. 2.1. name of fin A ...................................................................................................................... main function of fin A ......................................................................................................... [2] (iii) The magnification of the image in Fig. 2.1 is × 0.85. Calculate the actual length of the mackerel in Fig. 2.1 along the length of the line labelled X. Give your answer in centimetres and to the nearest whole number. Show your working. actual length of mackerel = ..................................................... cm [2] (iv) The binomial name of this mackerel is Scomber scombrus. Complete Table 2.1 to classify the mackerel. Table 2.1 classification group name Eukarya .................................................................. kingdom .................................................................. genus .................................................................. species .................................................................. [2] (c) Mackerel live within the sunlight zone of the open ocean. (i) State two abiotic conditions of the sunlight zone. 1 ......................................................................................................................................... 2 ......................................................................................................................................... [2] (ii) This mackerel is a typical example of a fish species that is adapted to live in the sunlight zone. Explain one adaptation of fish species in the sunlight zone. ........................................................................................................................................... ........................................................................................................................................... ........................................................................................................................................... ..................................................................................................................................... [2] [Total: 17]
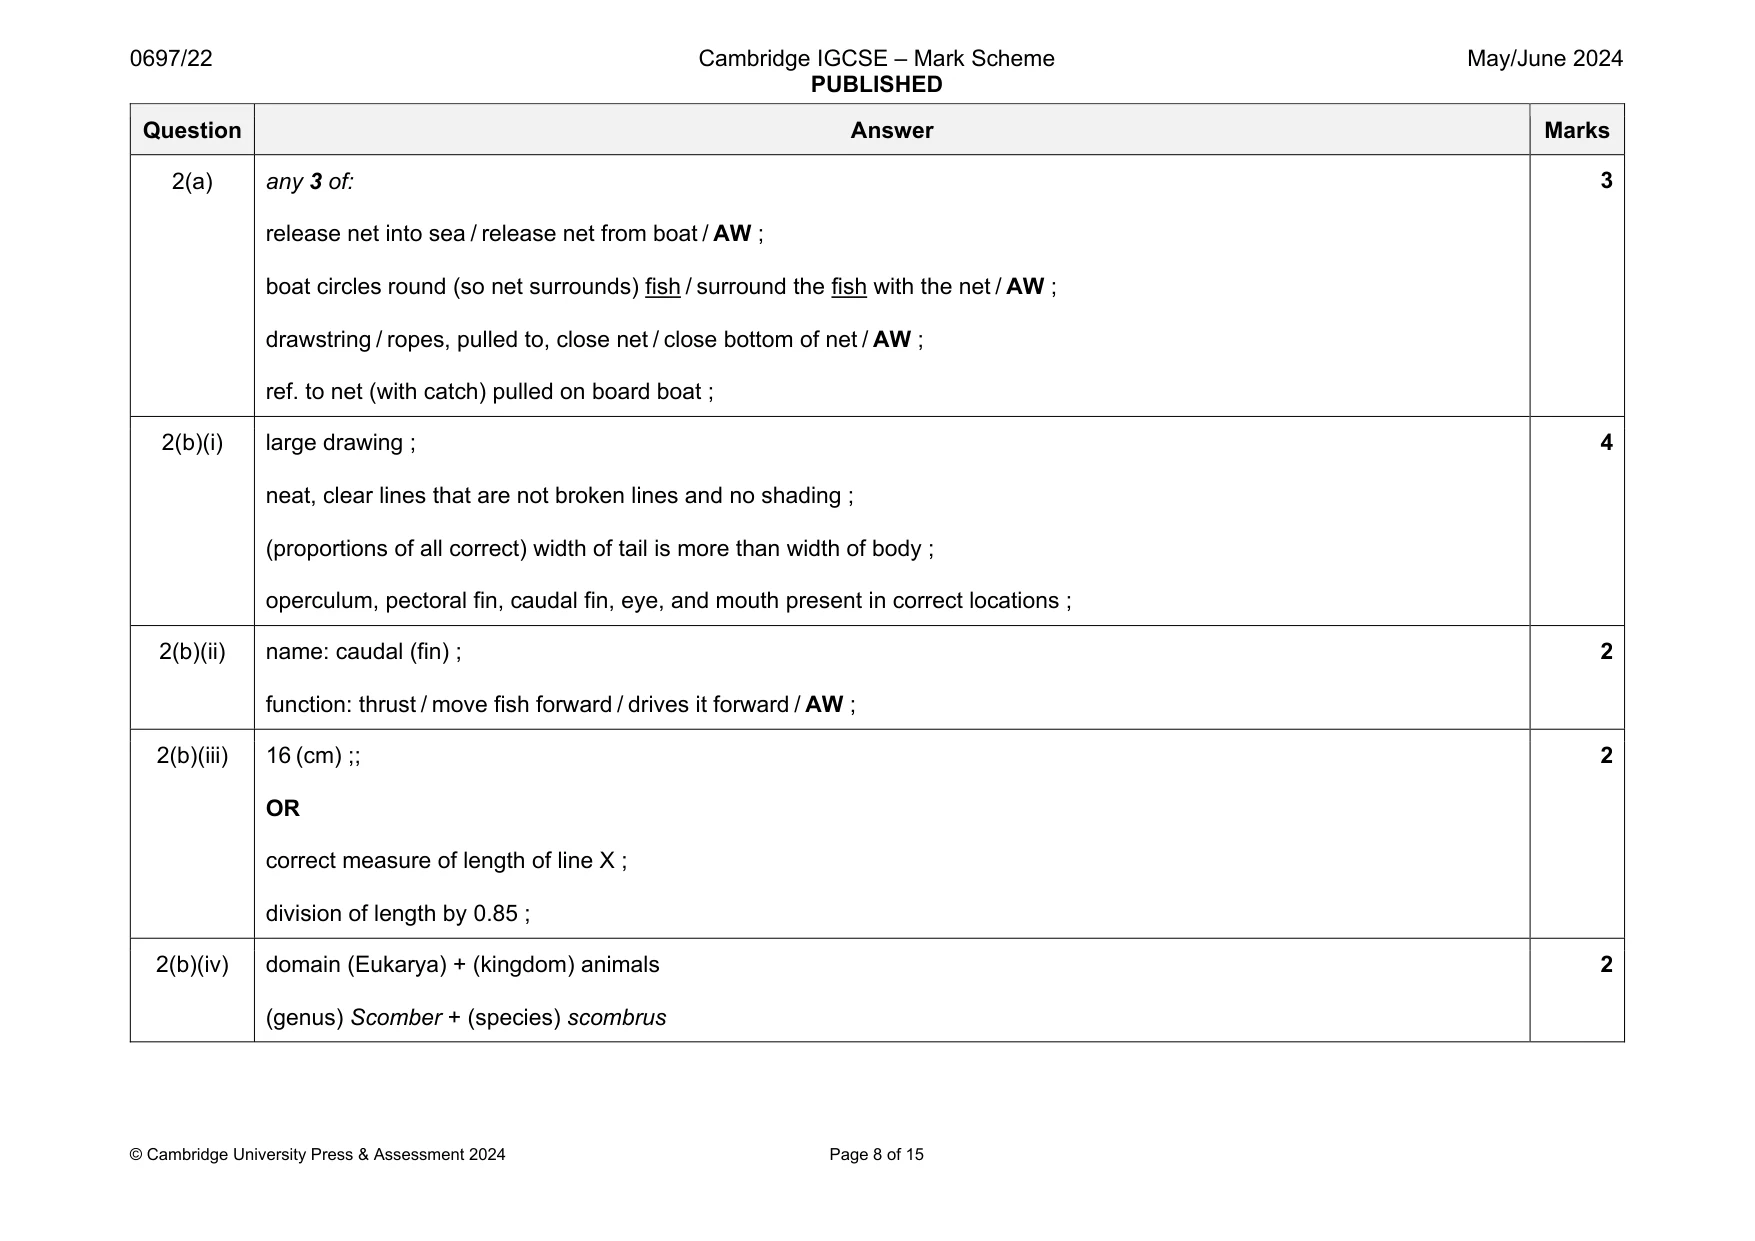
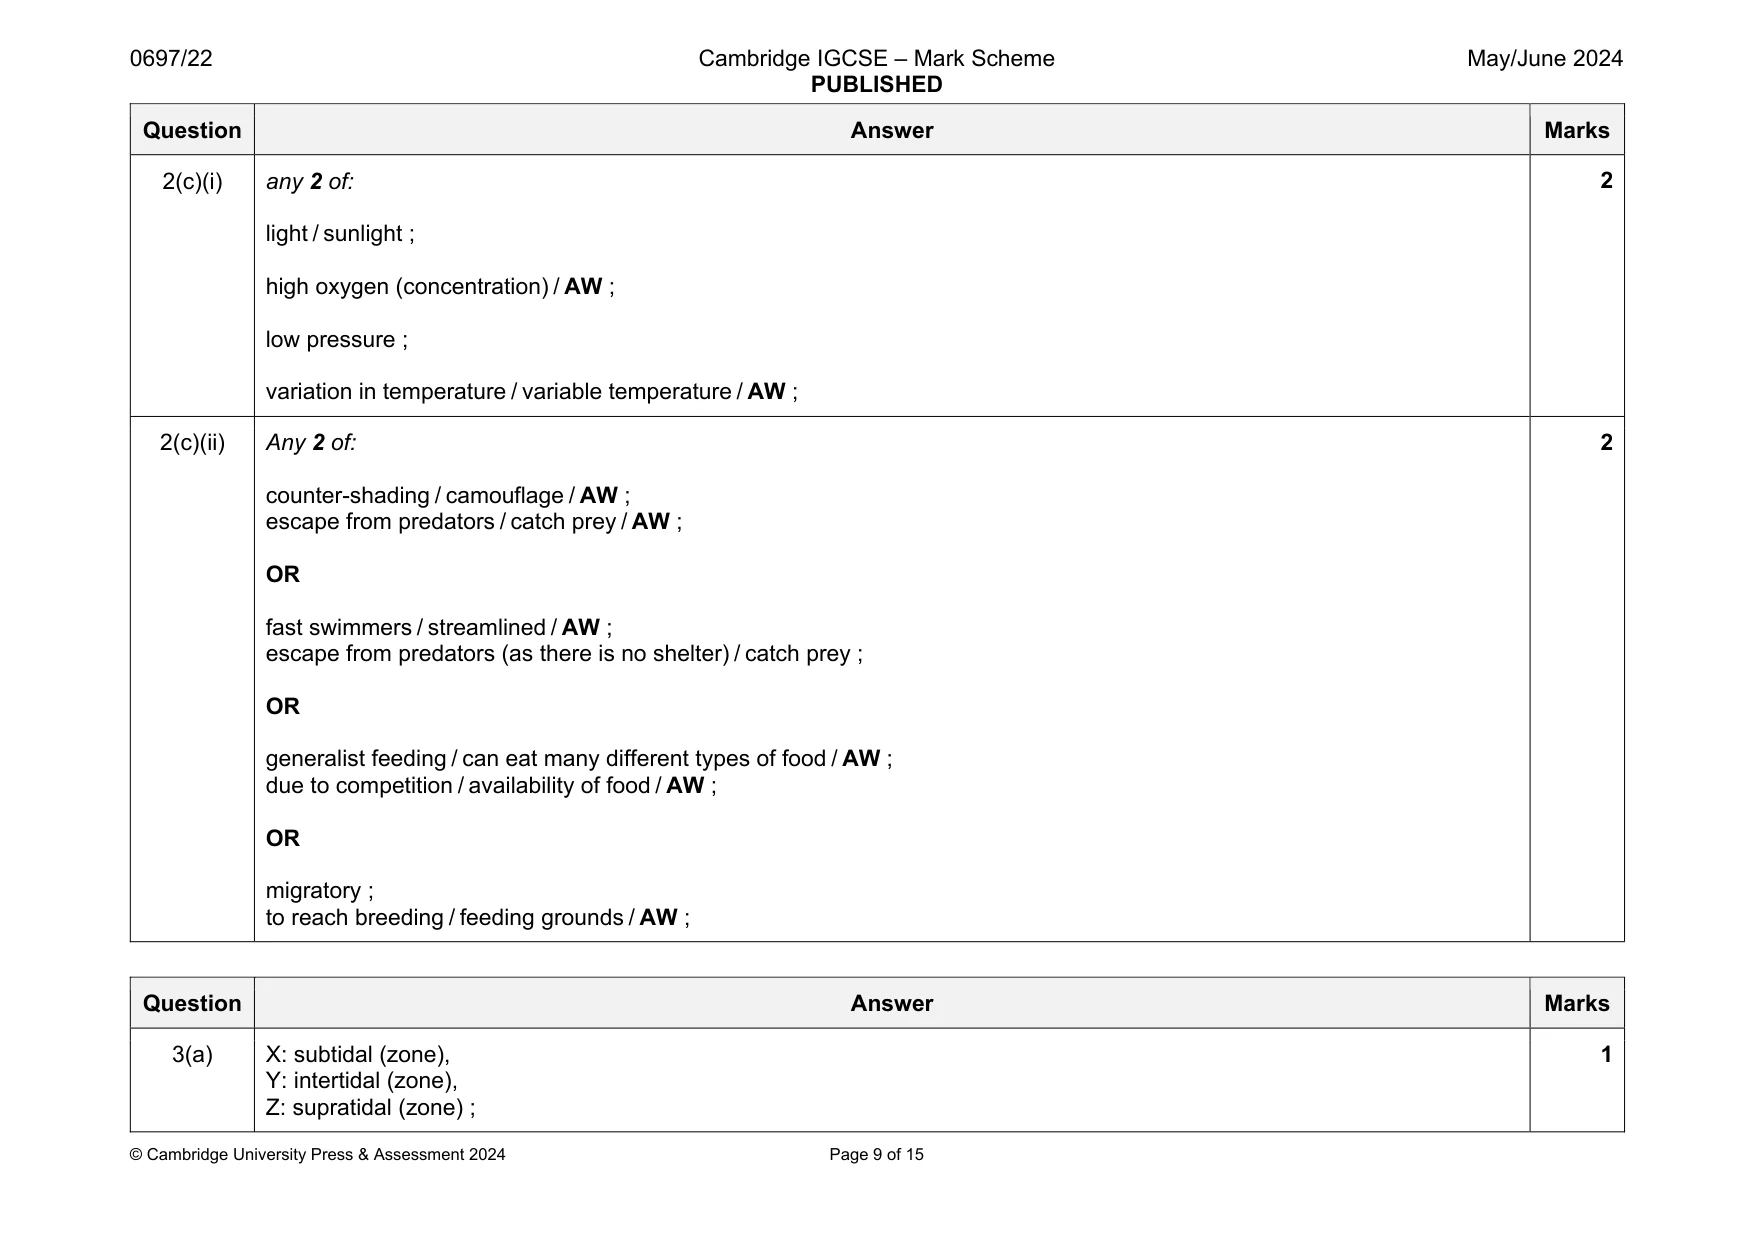
Mark scheme: 2(a) any 3 of: release net into sea / release net from boat / AW ; boat circles round (so net surrounds) fish / surround the fish with the net / AW ; drawstring / ropes, pulled to, close net / close bottom of net / AW ; ref. to net (with catch) pulled on board boat ; 2(b)(i) large drawing ; neat, clear lines that are not broken lines and no shading ; (proportions of all correct) width of tail is more than width of body ; operculum, pectoral fin, caudal fin, eye, and mouth present in correct locations ; 4 2(b)(ii) name: caudal (fin) ; function: thrust / move fish forward / drives it forward / AW ; 2 2(b)(iii) 16 (cm) ;; OR correct measure of length of line X ; division of length by 0.85 ; 2 2(b)(iv) domain (Eukarya) + (kingdom) animals (genus) Scomber + (species) scombrus 2 Question Answer Marks 2(c)(i) any 2 of: light / sunlight ; high oxygen (concentration) / AW ; low pressure ; variation in temperature / variable temperature / AW ; 2 2(c)(ii) Any 2 of: counter-shading / camouflage / AW ; escape from predators / catch prey / AW ; OR fast swimmers / streamlined / AW ; escape from predators (as there is no shelter) / catch prey ; OR generalist feeding / can eat many different types of food / AW ; due to competition / availability of food / AW ; OR migratory ; to reach breeding / feeding grounds / AW ; 2
Q3 · Rocky shores can be divided up into different zones
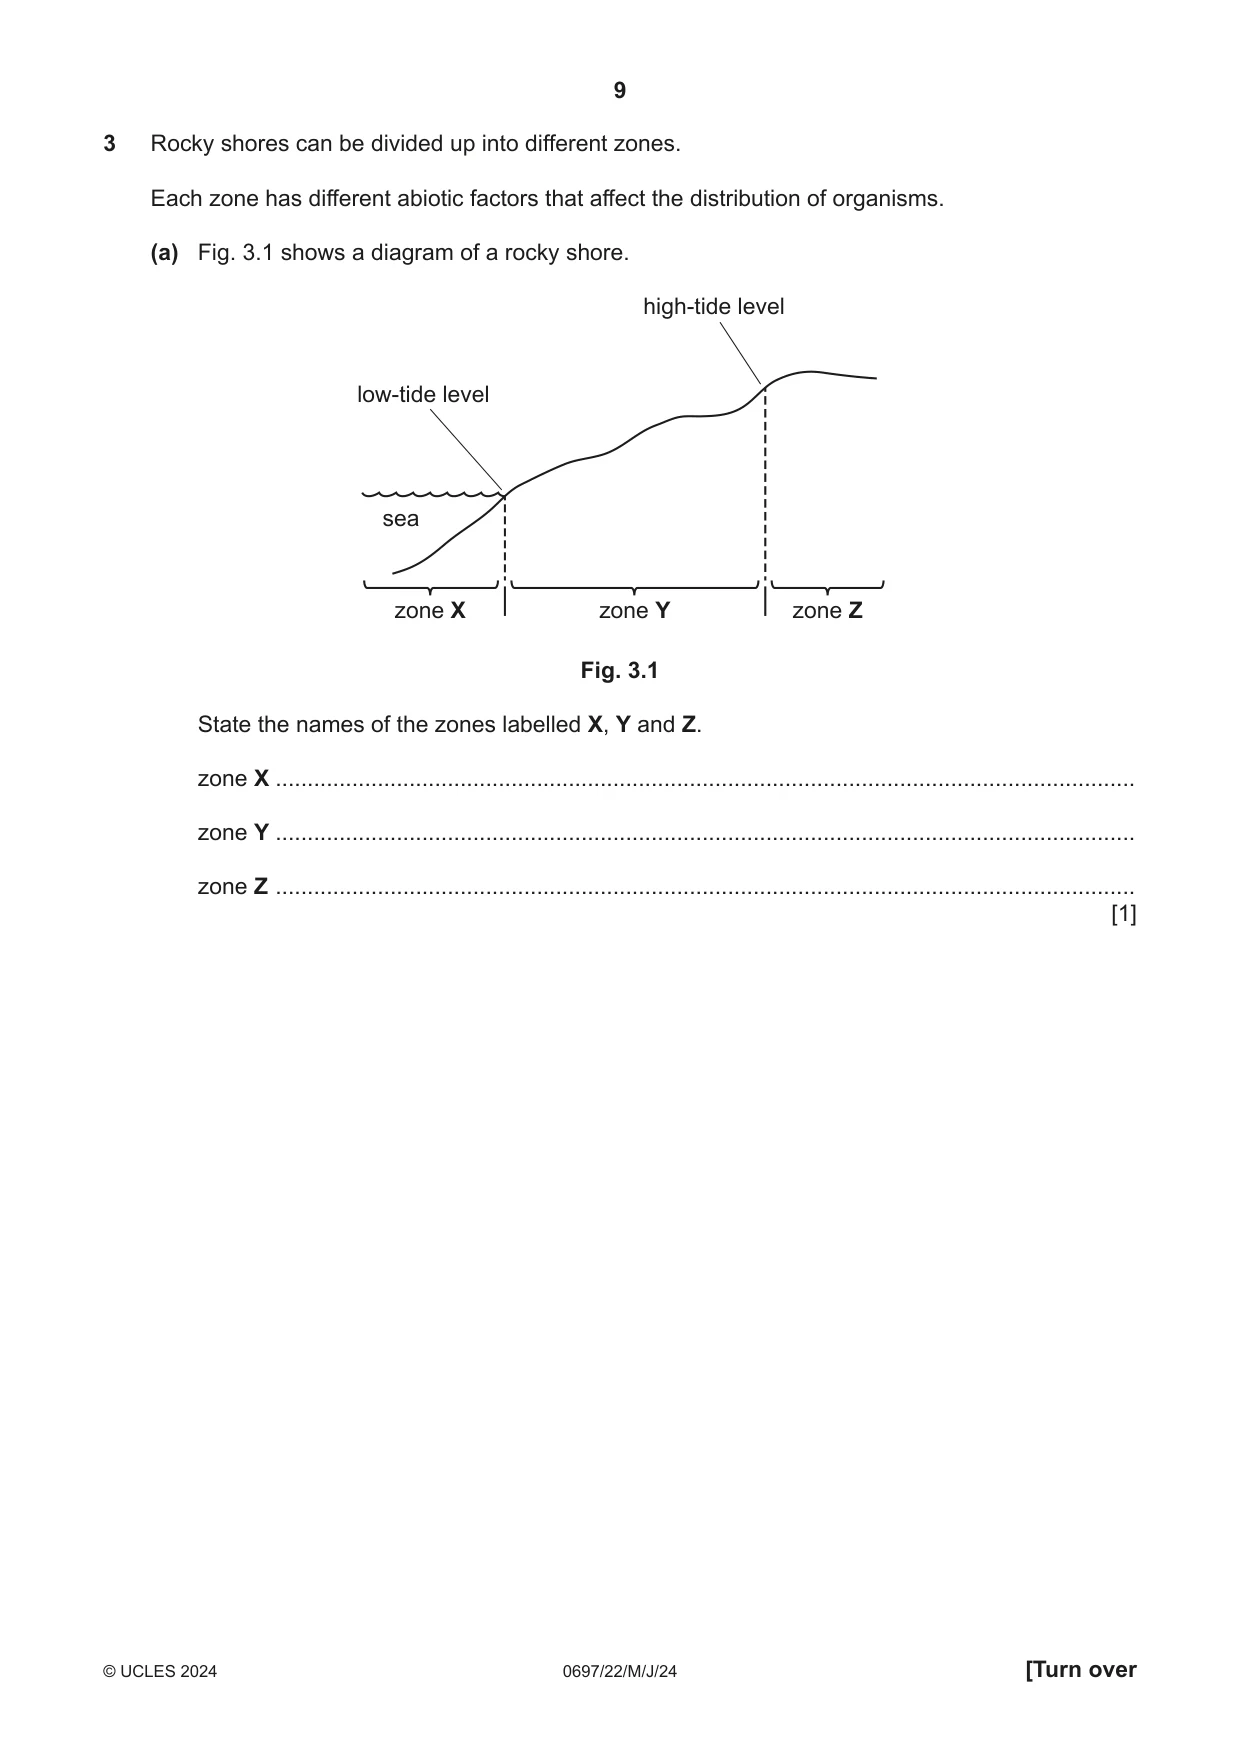
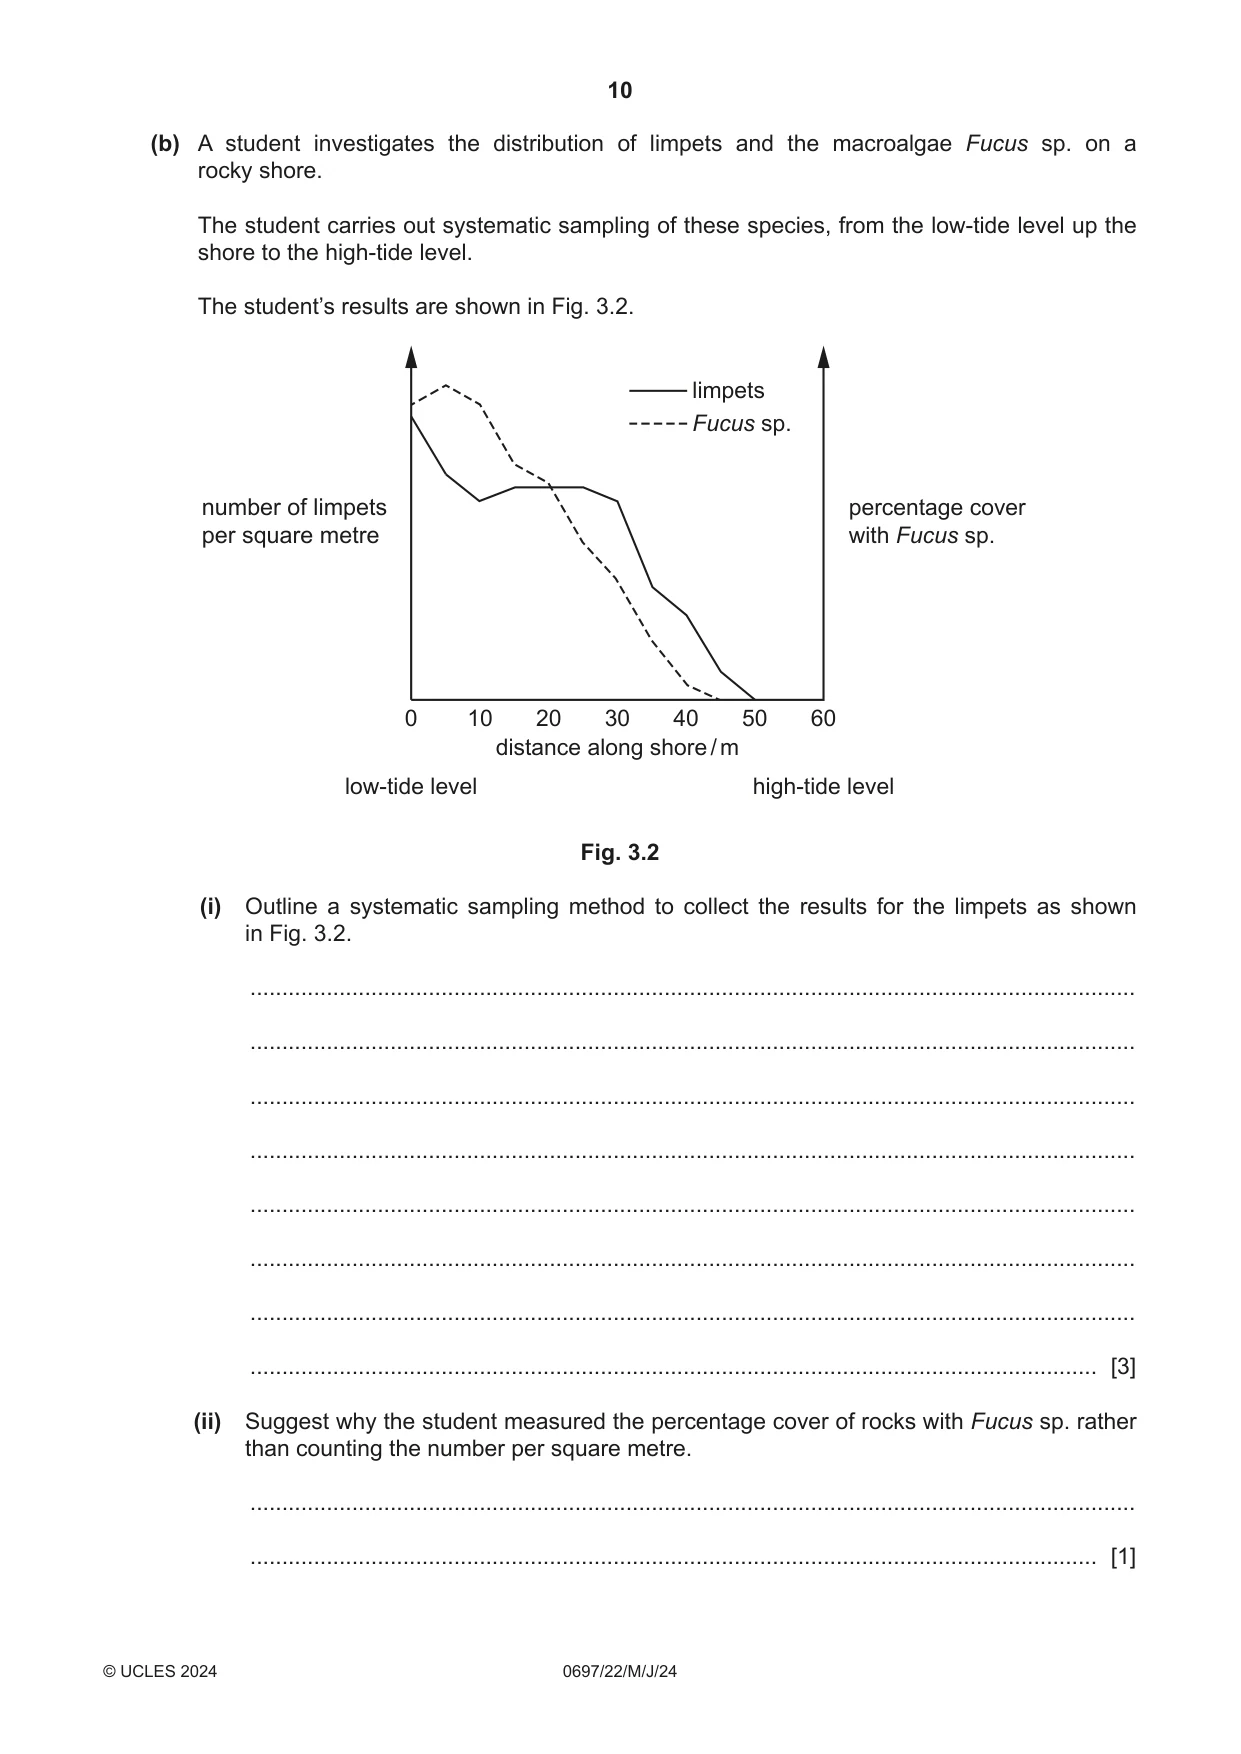
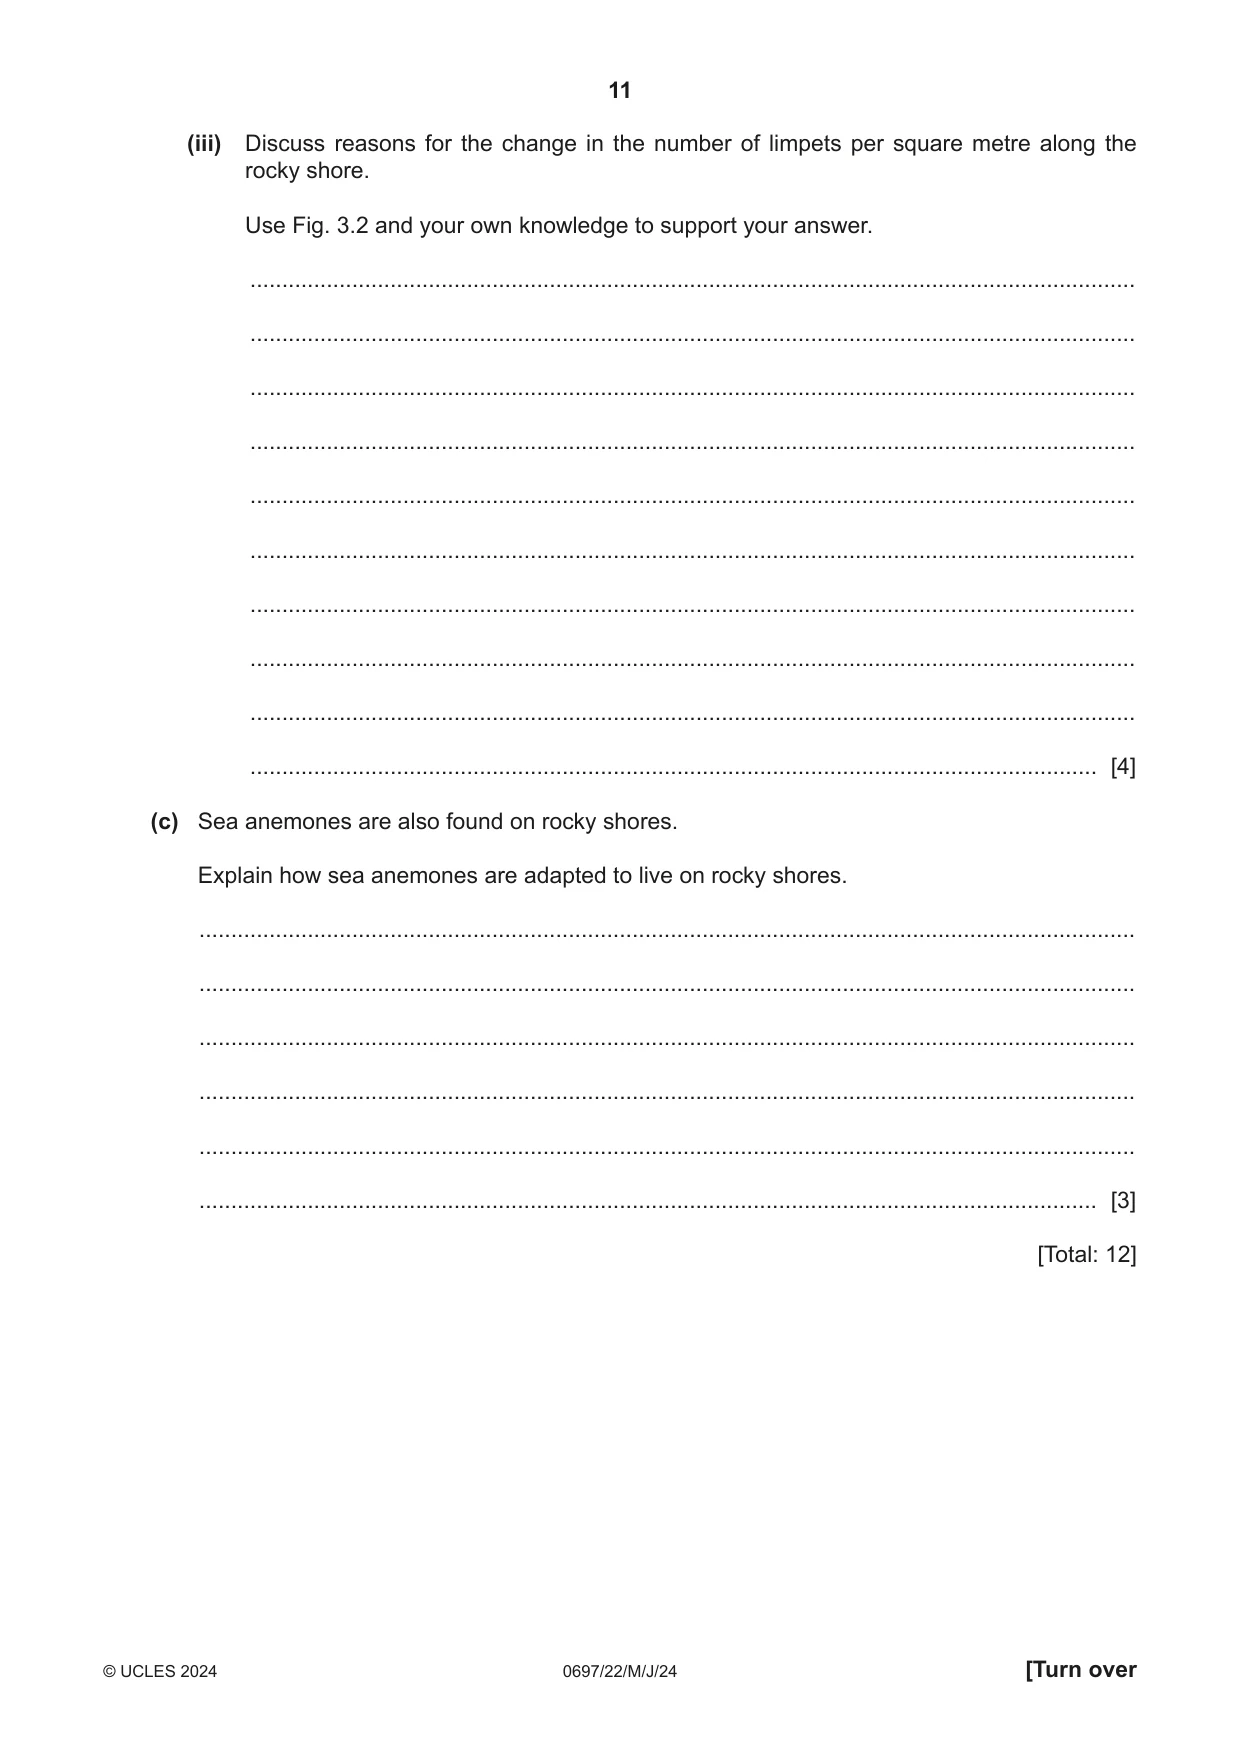
3 Rocky shores can be divided up into different zones. Each zone has different abiotic factors that affect the distribution of organisms. (a) Fig. 3.1 shows a diagram of a rocky shore. high-tide level low-tide level sea zone X zone Y zone Z Fig. 3.1 State the names of the zones labelled X, Y and Z. zone X ....................................................................................................................................... zone Y ....................................................................................................................................... zone Z ....................................................................................................................................... [1] (b) A student investigates the distribution of limpets and the macroalgae Fucus sp. on a rocky shore. The student carries out systematic sampling of these species, from the low‑tide level up the shore to the high‑tide level. The student’s results are shown in Fig. 3.2. limpets Fucus sp. number of limpets percentage cover per square metre with Fucus sp. 0 10 20 30 40 50 60 distance along shore / m low-tide level high-tide level Fig. 3.2 (i) Outline a systematic sampling method to collect the results for the limpets as shown in Fig. 3.2. ........................................................................................................................................... ........................................................................................................................................... ........................................................................................................................................... ........................................................................................................................................... ........................................................................................................................................... ........................................................................................................................................... ........................................................................................................................................... ..................................................................................................................................... [3] (ii) Suggest why the student measured the percentage cover of rocks with Fucus sp. rather than counting the number per square metre. ........................................................................................................................................... ..................................................................................................................................... [1] (iii) Discuss reasons for the change in the number of limpets per square metre along the rocky shore. Use Fig. 3.2 and your own knowledge to support your answer. ........................................................................................................................................... ........................................................................................................................................... ........................................................................................................................................... ........................................................................................................................................... ........................................................................................................................................... ........................................................................................................................................... ........................................................................................................................................... ........................................................................................................................................... ........................................................................................................................................... ..................................................................................................................................... [4] (c) Sea anemones are also found on rocky shores. Explain how sea anemones are adapted to live on rocky shores. ................................................................................................................................................... ................................................................................................................................................... ................................................................................................................................................... ................................................................................................................................................... ................................................................................................................................................... ............................................................................................................................................. [3] [Total: 12]
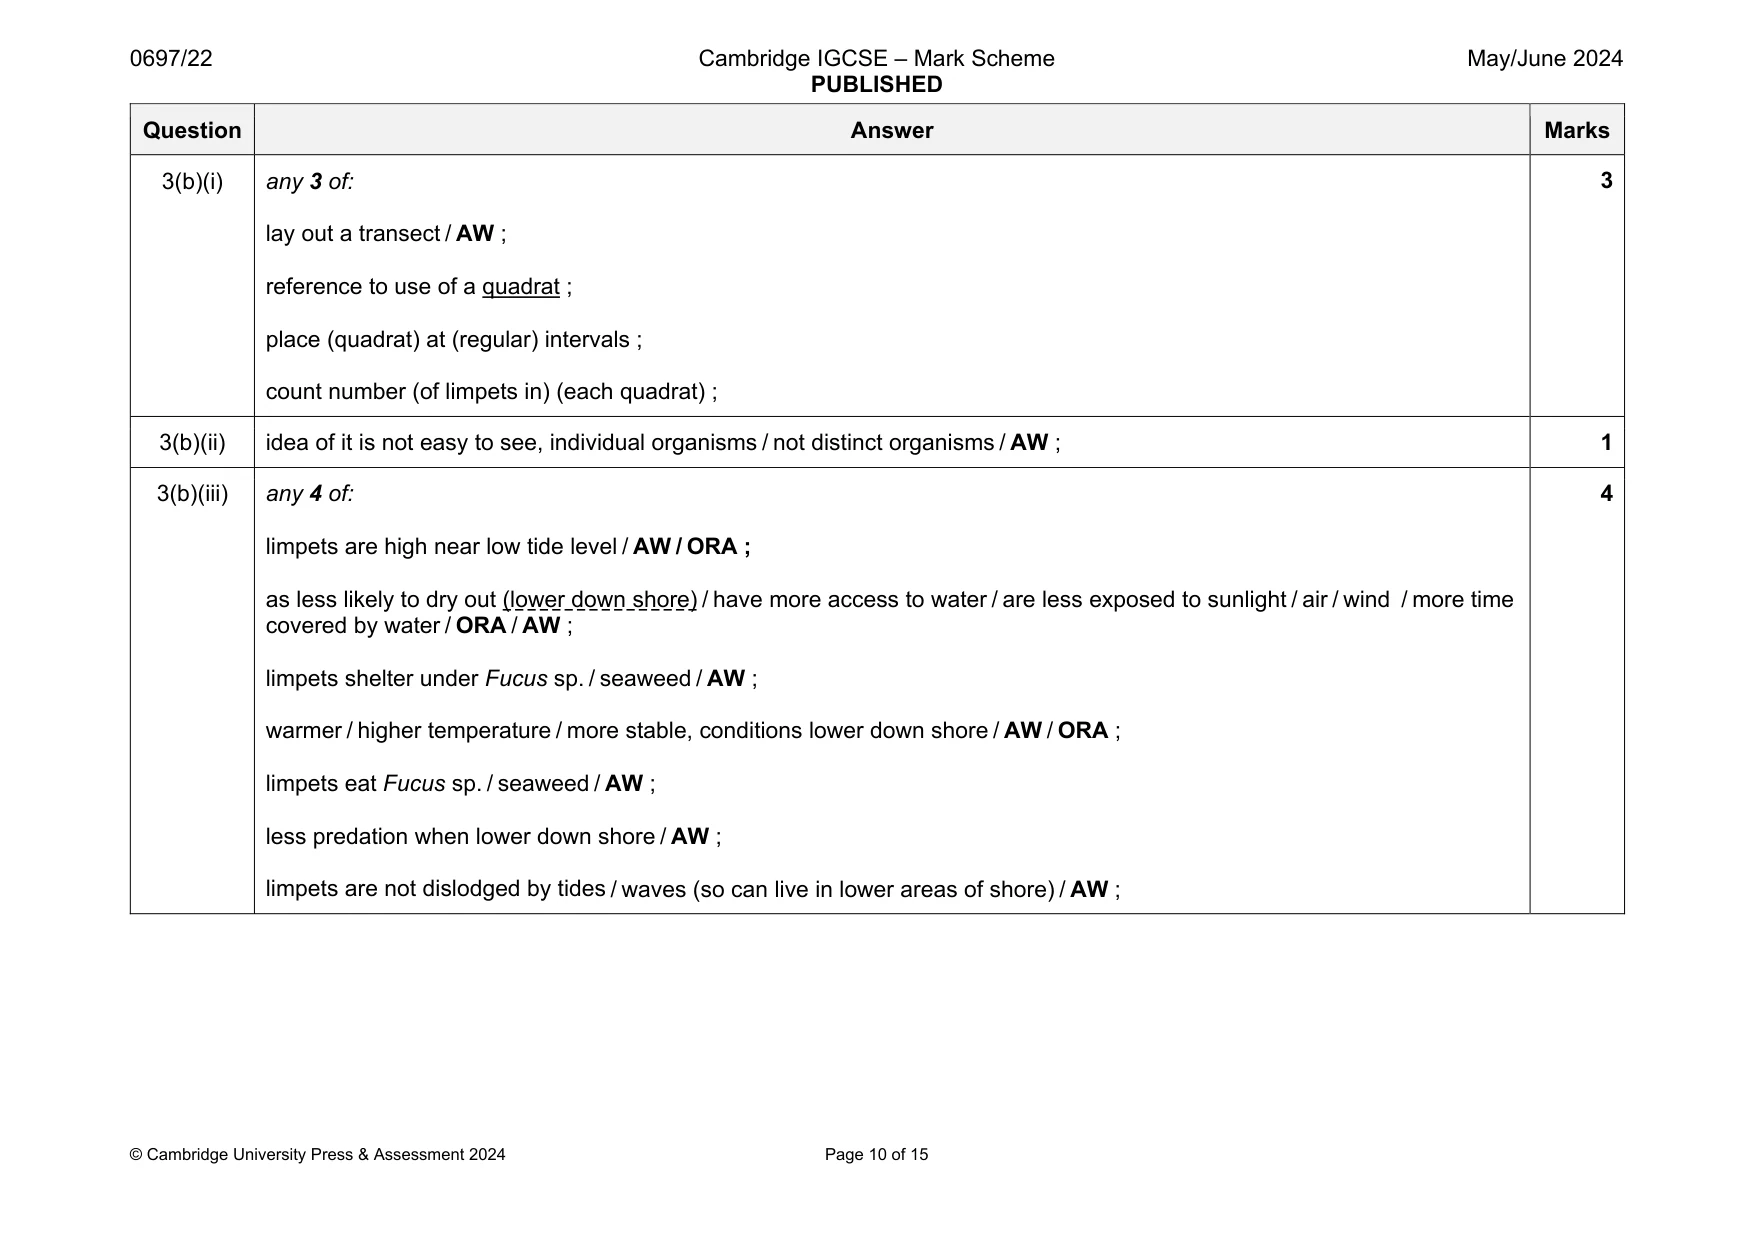
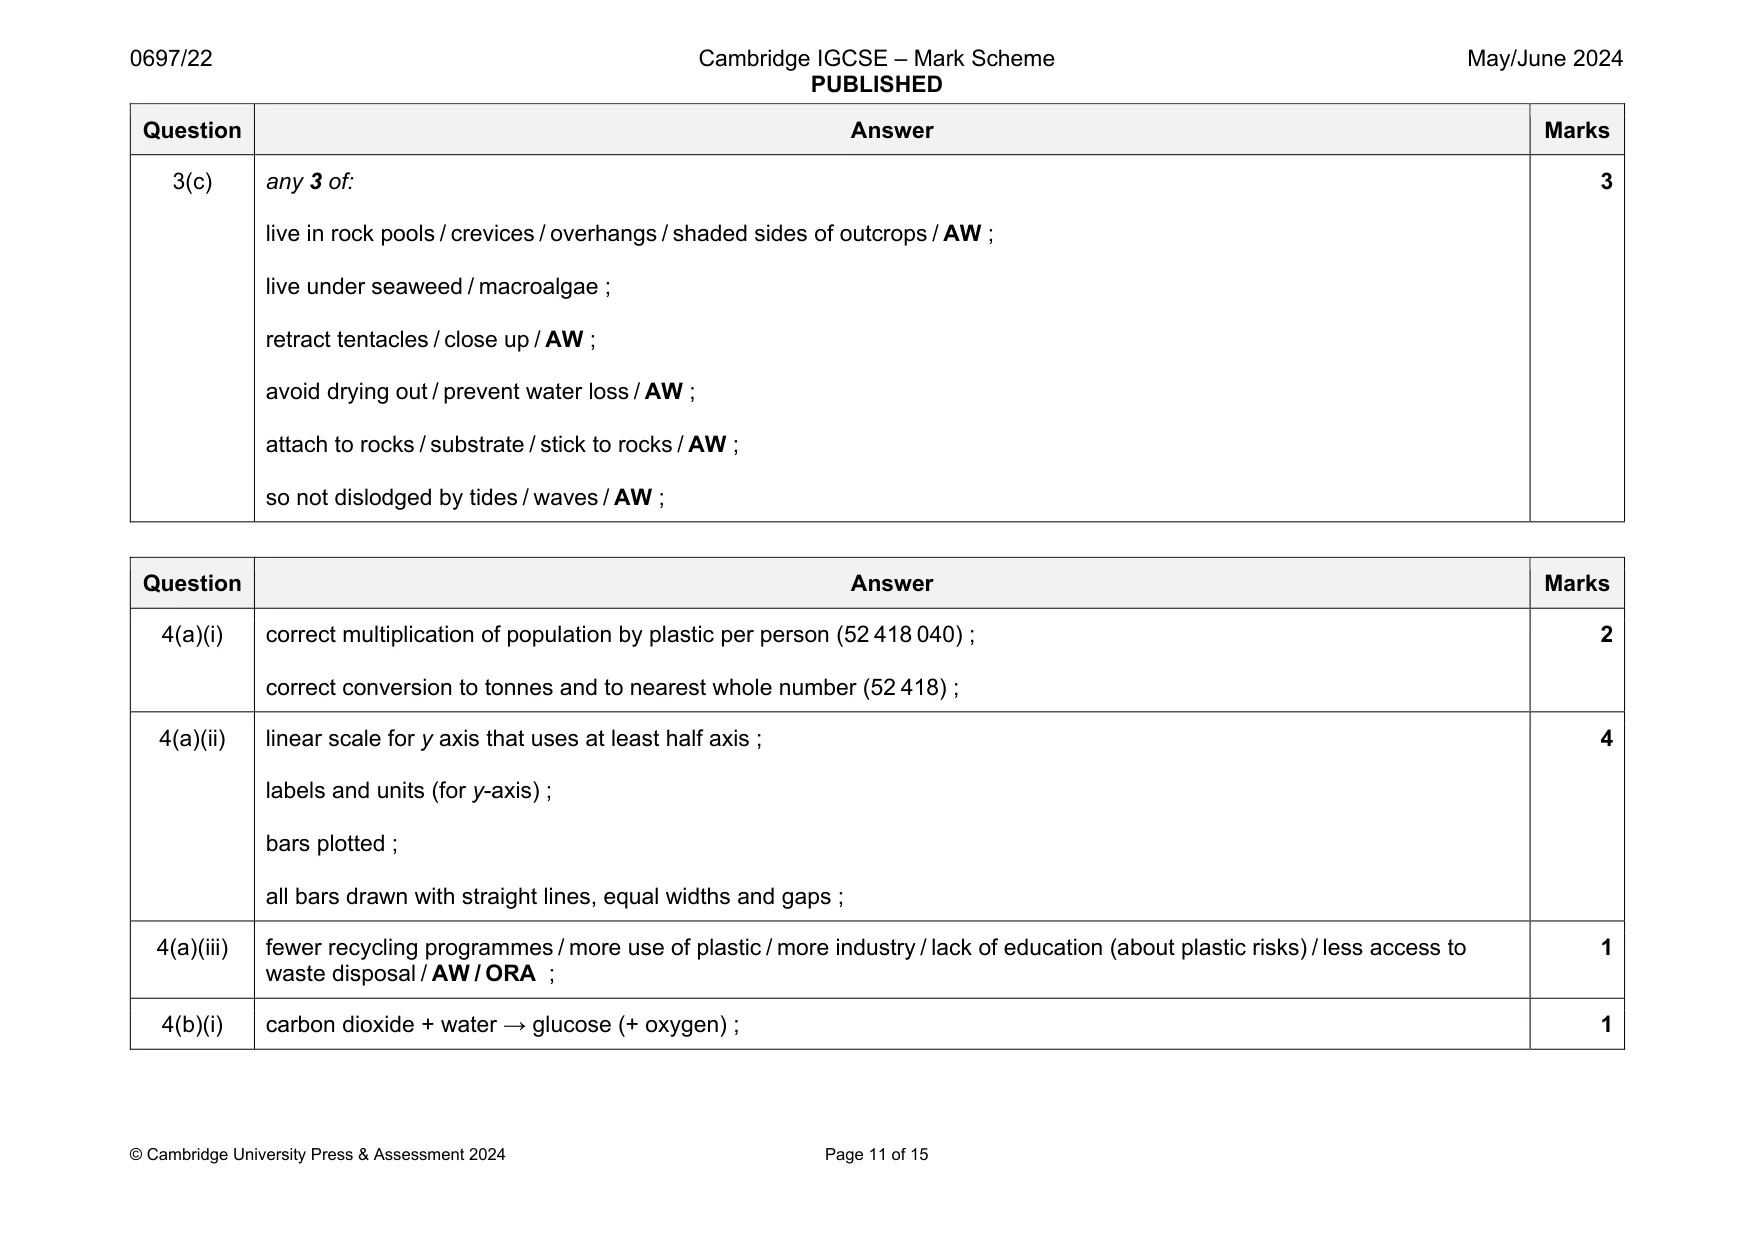
Mark scheme: 3(a) X: subtidal (zone), Y: intertidal (zone), Z: supratidal (zone) ; Question Answer Marks 3(b)(i) any 3 of: lay out a transect / AW ; reference to use of a quadrat ; place (quadrat) at (regular) intervals ; count number (of limpets in) (each quadrat) ; 3 3(b)(ii) idea of it is not easy to see, individual organisms / not distinct organisms / AW ; 1 3(b)(iii) any 4 of: limpets are high near low tide level / AW / ORA ; as less likely to dry out (lower down shore) / have more access to water / are less exposed to sunlight / air / wind / more time covered by water / ORA / AW ; limpets shelter under Fucus sp. / seaweed / AW ; warmer / higher temperature / more stable, conditions lower down shore / AW / ORA ; limpets eat Fucus sp. / seaweed / AW ; less predation when lower down shore / AW ; limpets are not dislodged by tides / waves (so can live in lower areas of shore) / AW ; 4 Question Answer Marks 3(c) any 3 of: live in rock pools / crevices / overhangs / shaded sides of outcrops / AW ; live under seaweed / macroalgae ; retract tentacles / close up / AW ; avoid drying out / prevent water loss / AW ; attach to rocks / substrate / stick to rocks / AW ; so not dislodged by tides / waves / AW ; 3
Q4 · Plastic pollution is a threat to marine ecosystems
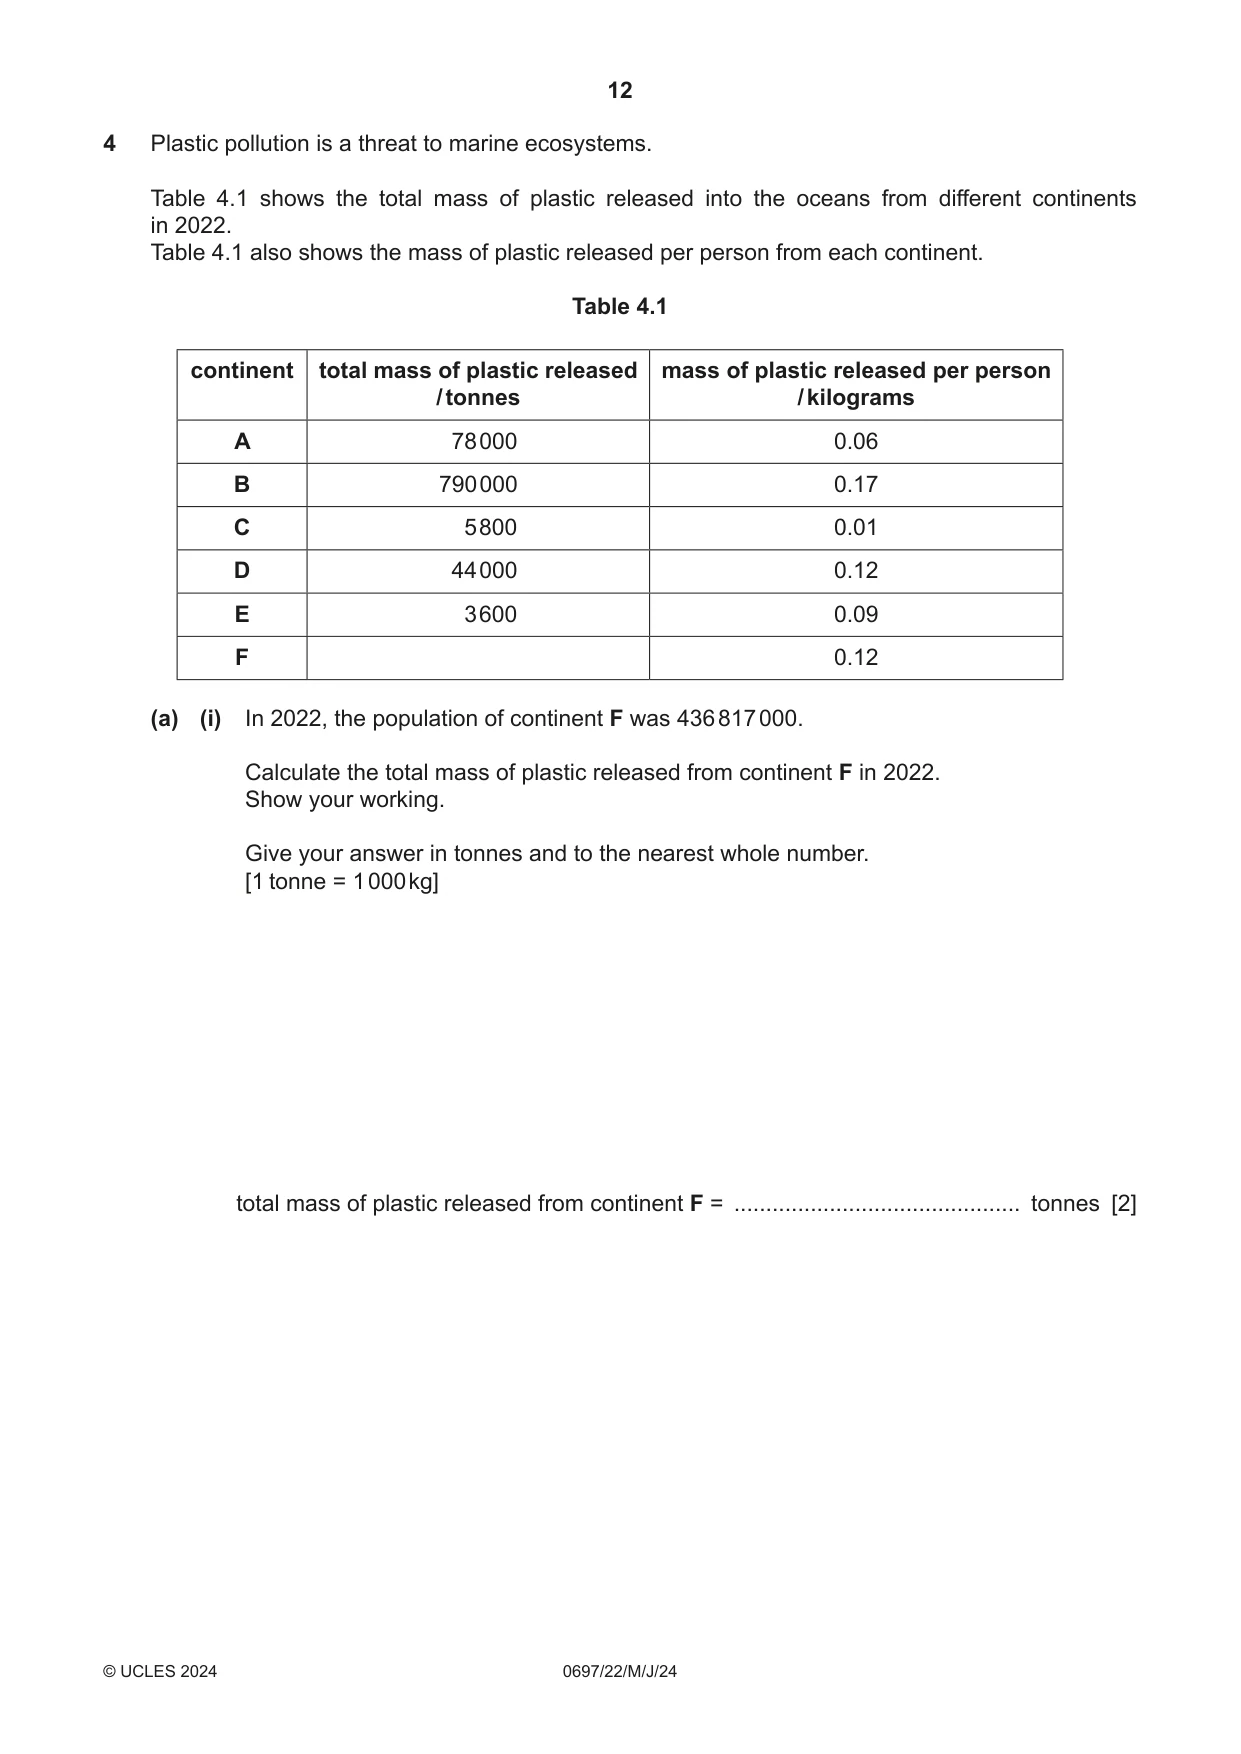
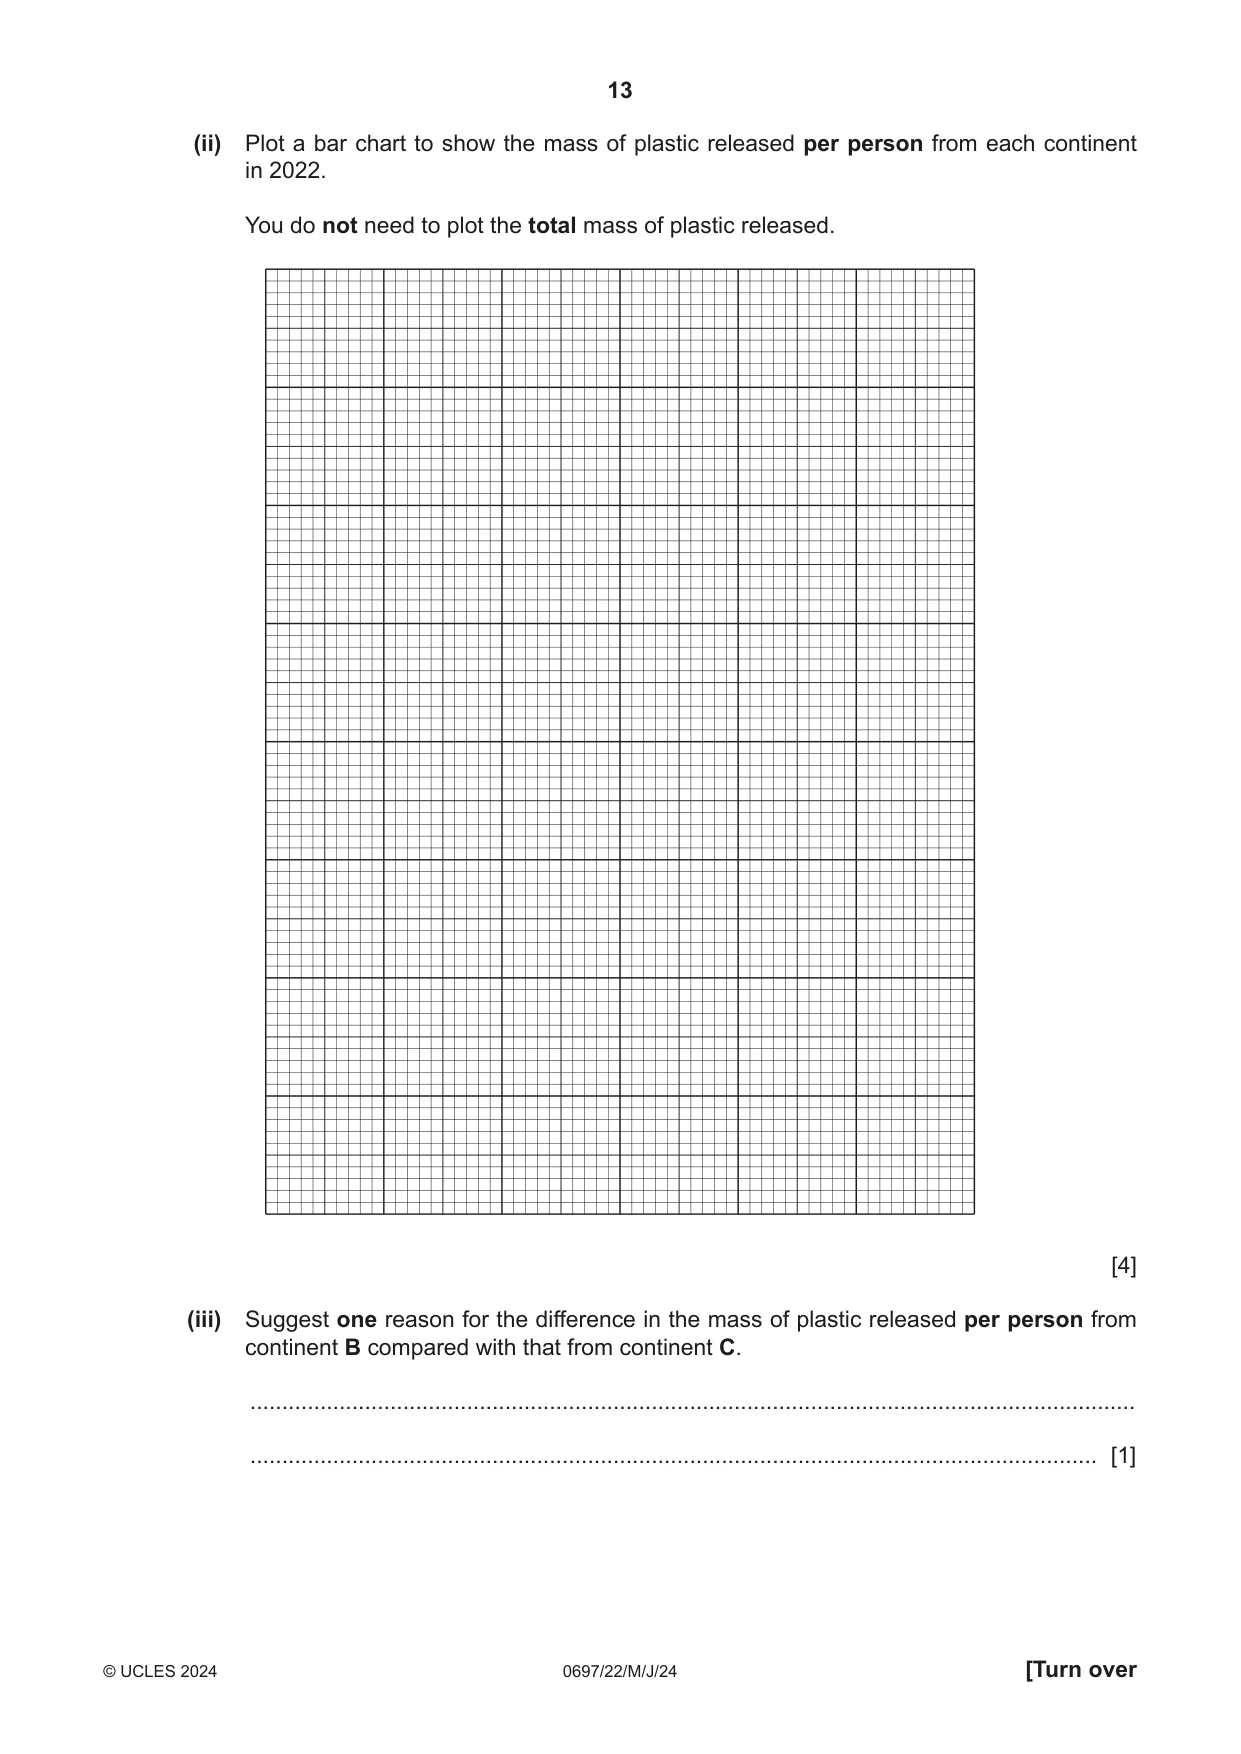
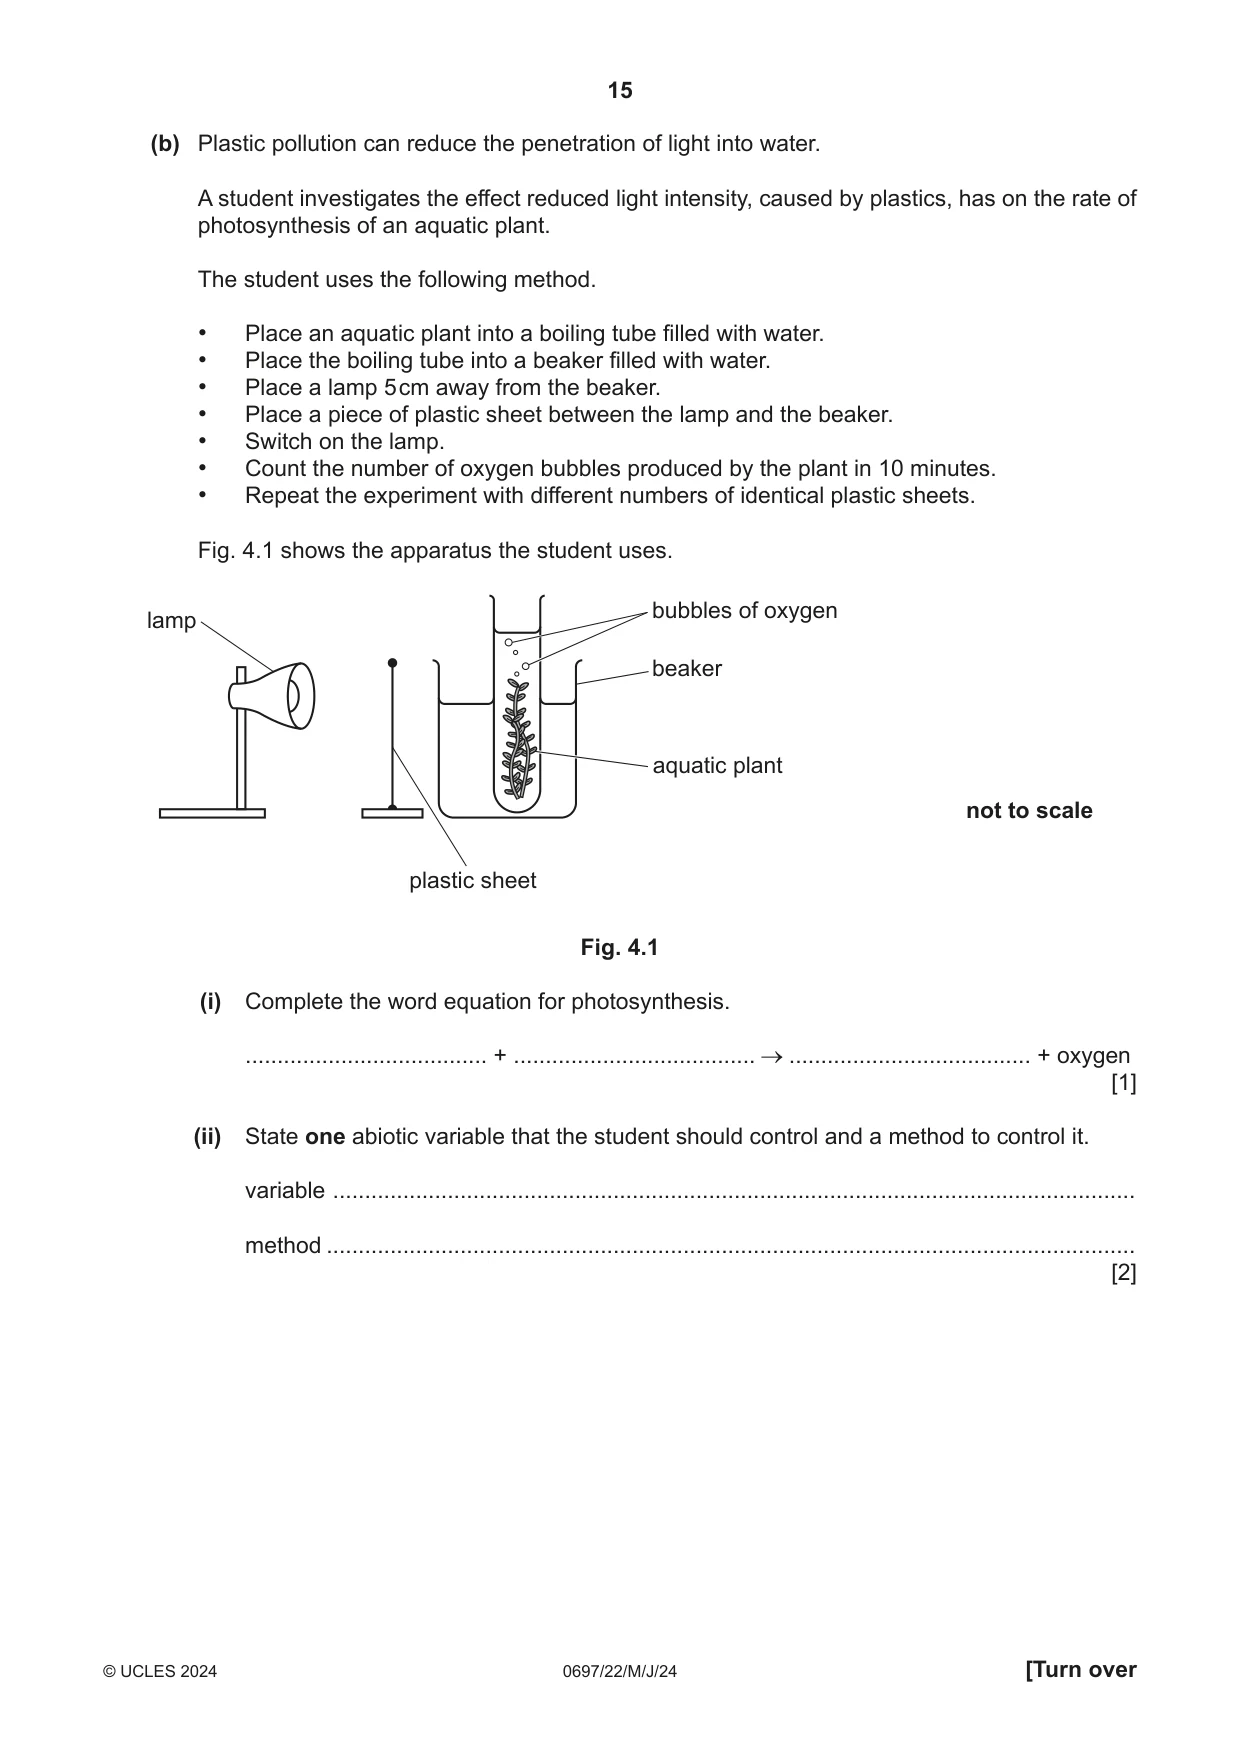
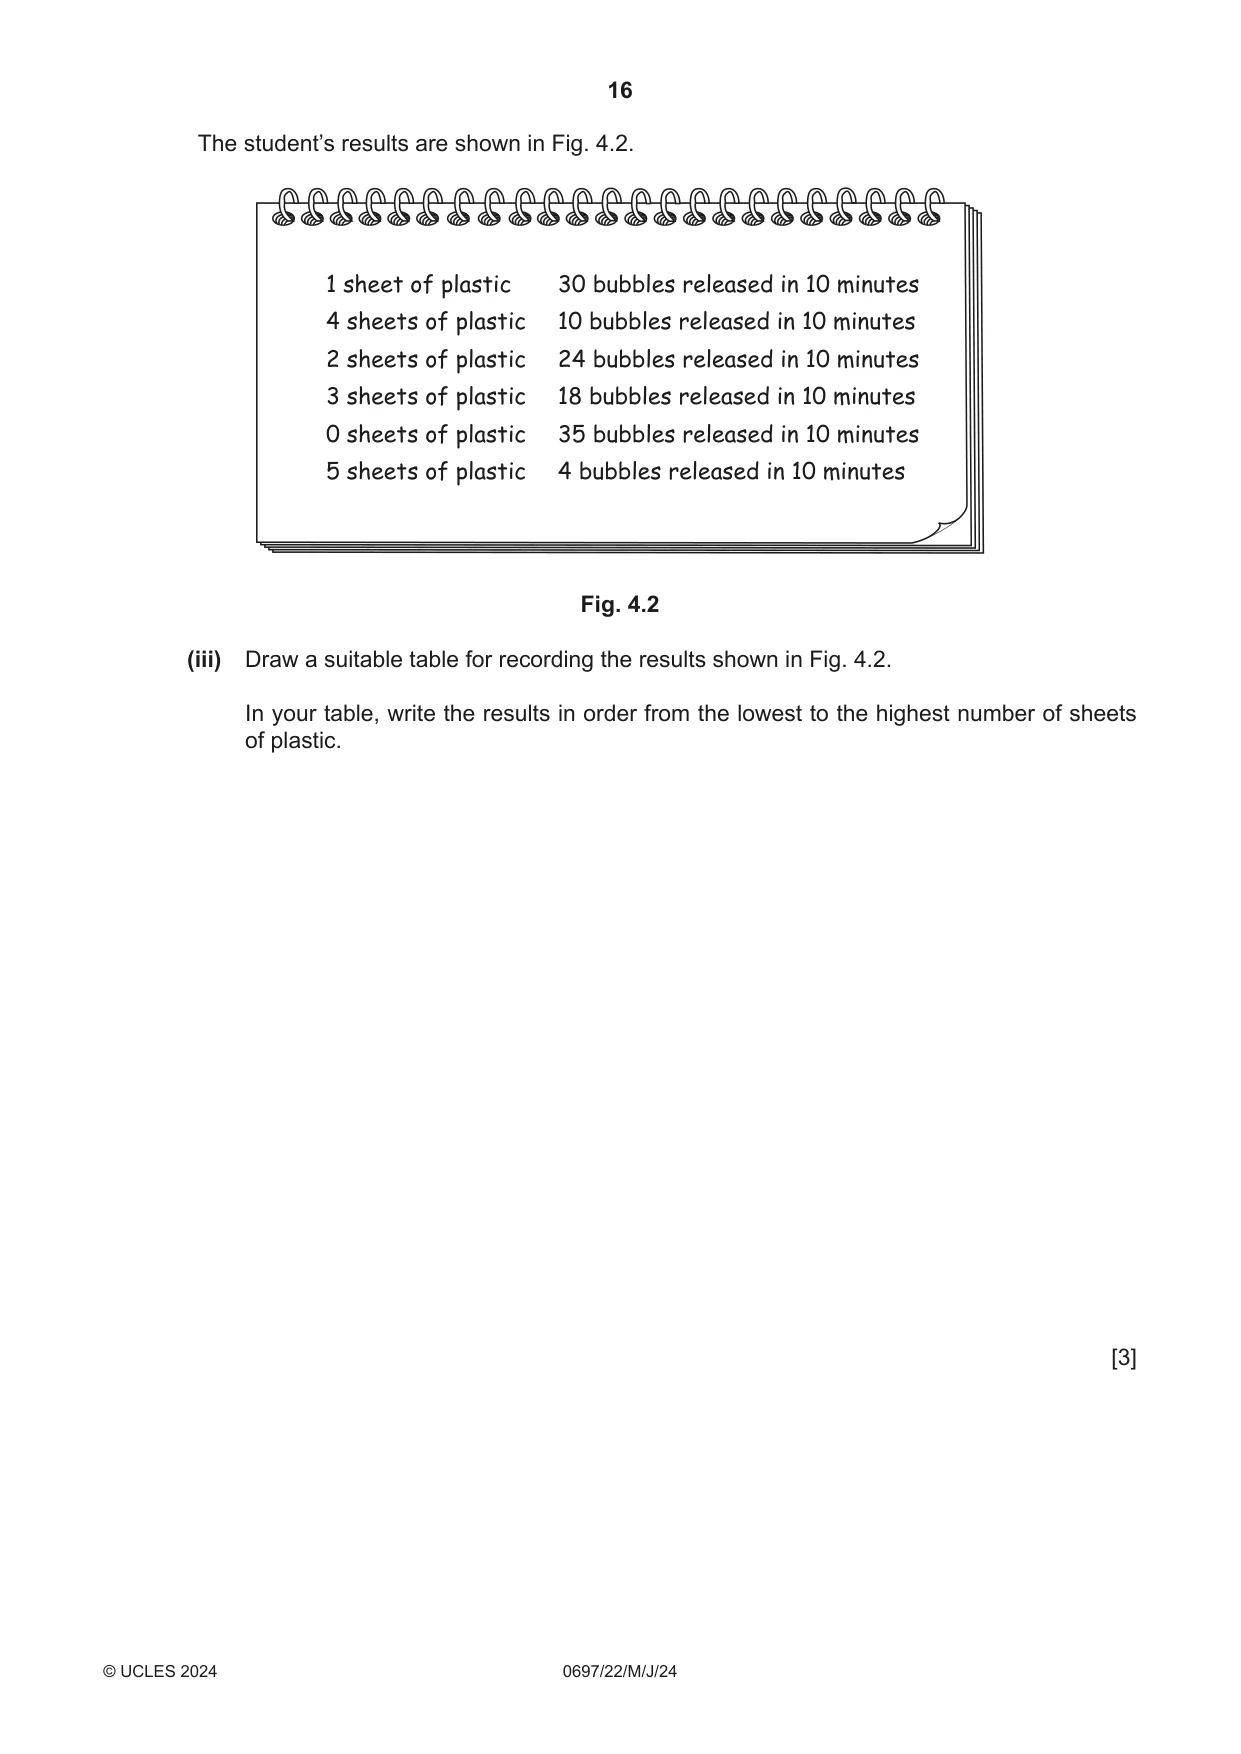
4 Plastic pollution is a threat to marine ecosystems. Table 4.1 shows the total mass of plastic released into the oceans from different continents in 2022. Table 4.1 also shows the mass of plastic released per person from each continent. Table 4.1 continent total mass of plastic released mass of plastic released per person / tonnes / kilograms A 78 000 0.06 B 790 000 0.17 C 5 800 0.01 D 44 000 0.12 E 3 600 0.09 F 0.12 (a) (i) In 2022, the population of continent F was 436 817 000. Calculate the total mass of plastic released from continent F in 2022. Show your working. Give your answer in tonnes and to the nearest whole number. [1 tonne = 1 000 kg] total mass of plastic released from continent F = ............................................. tonnes [2] (ii) Plot a bar chart to show the mass of plastic released per person from each continent in 2022. You do not need to plot the total mass of plastic released. [4] (iii) Suggest one reason for the difference in the mass of plastic released per person from continent B compared with that from continent C. ........................................................................................................................................... ..................................................................................................................................... [1] (b) Plastic pollution can reduce the penetration of light into water. A student investigates the effect reduced light intensity, caused by plastics, has on the rate of photosynthesis of an aquatic plant. The student uses the following method. • Place an aquatic plant into a boiling tube filled with water. • Place the boiling tube into a beaker filled with water. • Place a lamp 5 cm away from the beaker. • Place a piece of plastic sheet between the lamp and the beaker. • Switch on the lamp. • Count the number of oxygen bubbles produced by the plant in 10 minutes. • Repeat the experiment with different numbers of identical plastic sheets. Fig. 4.1 shows the apparatus the student uses. bubbles of oxygenlamp beaker aquatic plant not to scale plastic sheet Fig. 4.1 (i) Complete the word equation for photosynthesis. ...................................... + ...................................... ...................................... + oxygen [1] (ii) State one abiotic variable that the student should control and a method to control it. variable .............................................................................................................................. method ............................................................................................................................... [2] The student’s results are shown in Fig. 4.2. 1 sheet of plastic 30 bubbles released in 10 minutes 4 sheets of plastic 10 bubbles released in 10 minutes 2 sheets of plastic 24 bubbles released in 10 minutes 3 sheets of plastic 18 bubbles released in 10 minutes 0 sheets of plastic 35 bubbles released in 10 minutes 5 sheets of plastic 4 bubbles released in 10 minutes Fig. 4.2 (iii) Draw a suitable table for recording the results shown in Fig. 4.2. In your table, write the results in order from the lowest to the highest number of sheets of plastic. [3] (iv) Explain how the results of this investigation show that plastic pollution leads to reduced productivity in oceans. ........................................................................................................................................... ........................................................................................................................................... ........................................................................................................................................... ..................................................................................................................................... [2] (v) Describe one change to the student’s method that improves the accuracy of the results. ........................................................................................................................................... ........................................................................................................................................... ........................................................................................................................................... ..................................................................................................................................... [2] [Total: 17]
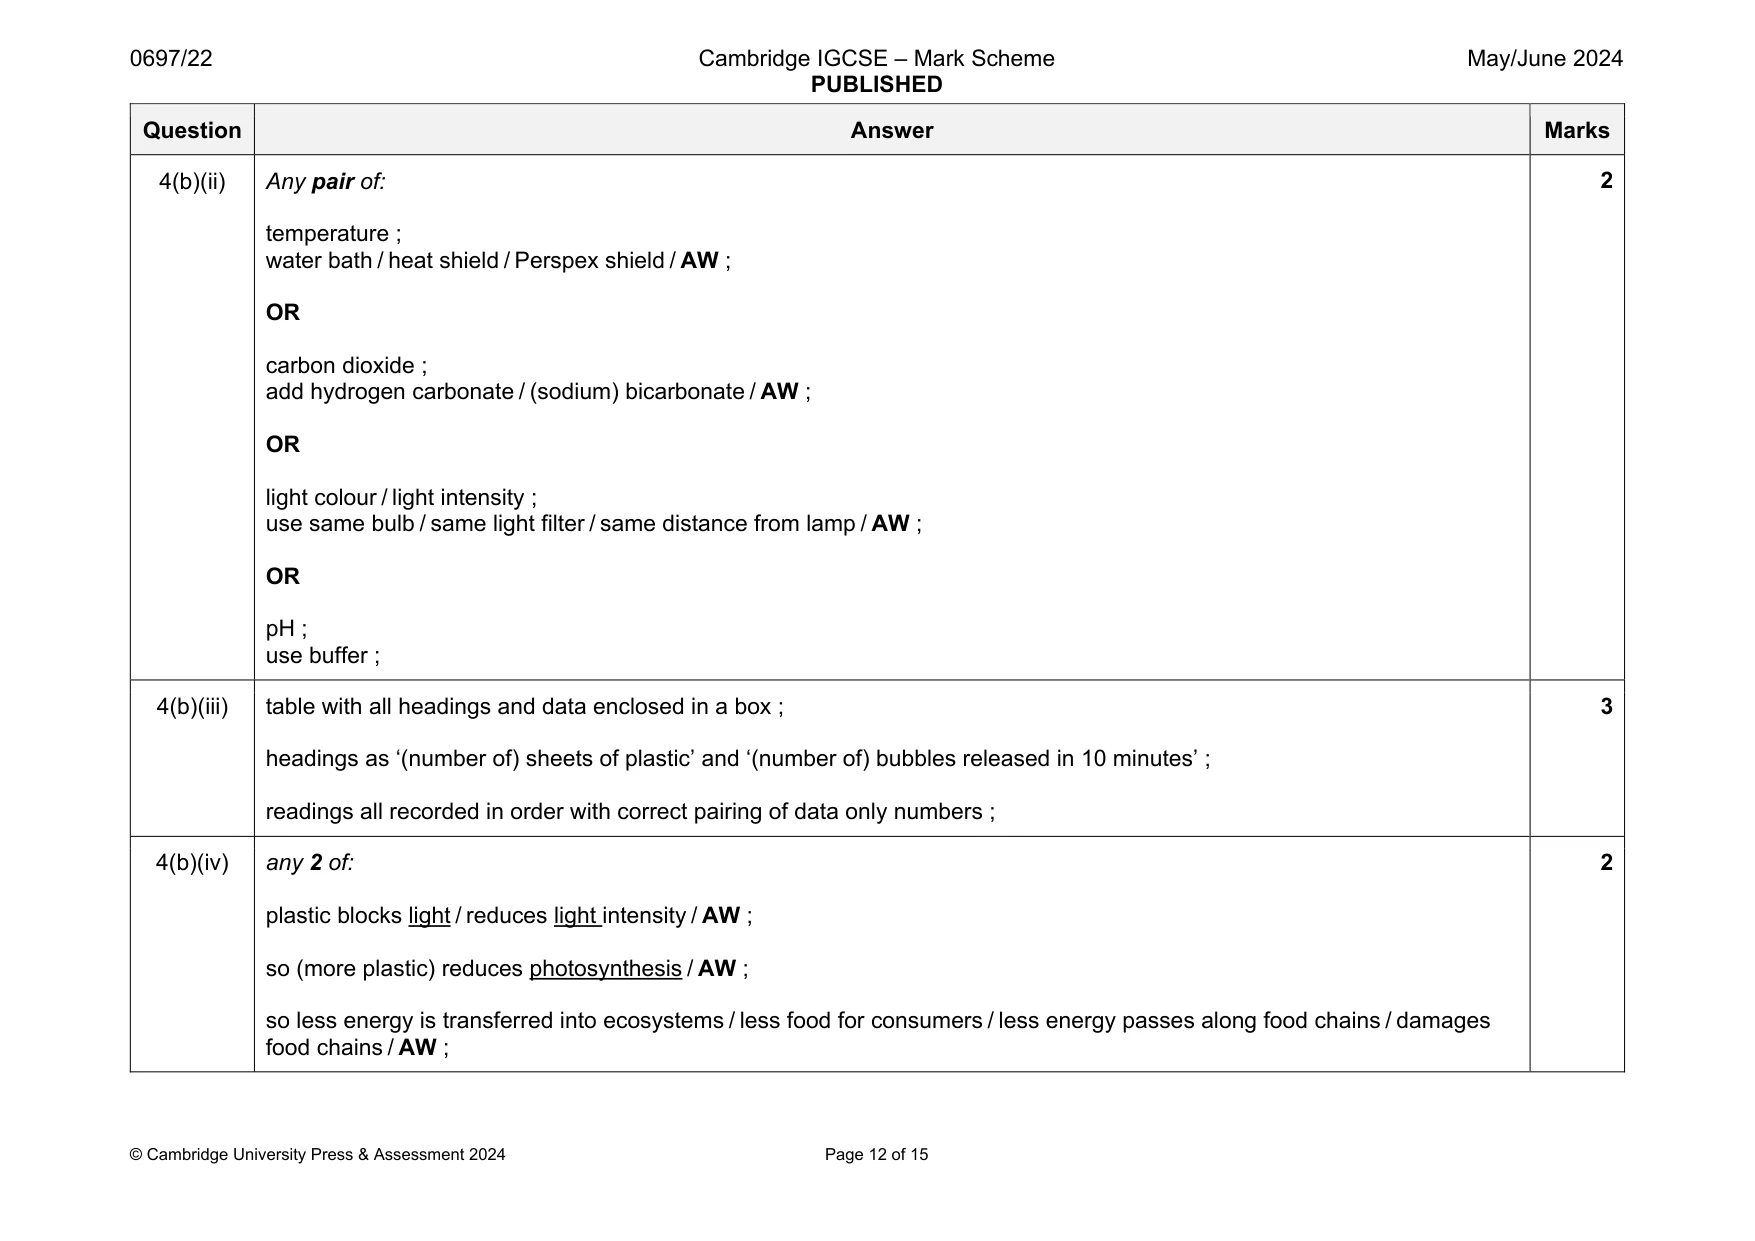
Mark scheme: 4(a)(i) correct multiplication of population by plastic per person (52 418 040) ; correct conversion to tonnes and to nearest whole number (52 418) ; 2 4(a)(ii) linear scale for y axis that uses at least half axis ; labels and units (for y-axis) ; bars plotted ; all bars drawn with straight lines, equal widths and gaps ; 4 4(a)(iii) fewer recycling programmes / more use of plastic / more industry / lack of education (about plastic risks) / less access to waste disposal / AW / ORA ; 1 4(b)(i) carbon dioxide + water → glucose (+ oxygen) ; 1 Question Answer Marks 4(b)(ii) Any pair of: temperature ; water bath / heat shield / Perspex shield / AW ; OR carbon dioxide ; add hydrogen carbonate / (sodium) bicarbonate / AW ; OR light colour / light intensity ; use same bulb / same light filter / same distance from lamp / AW ; OR pH ; use buffer ; 2 4(b)(iii) table with all headings and data enclosed in a box ; headings as ‘(number of) sheets of plastic’ and ‘(number of) bubbles released in 10 minutes’ ; readings all recorded in order with correct pairing of data only numbers ; 3 4(b)(iv) any 2 of: plastic blocks light / reduces light intensity / AW ; so (more plastic) reduces photosynthesis / AW ; so less energy is transferred into ecosystems / less food for consumers / less energy passes along food chains / damages food chains / AW ; 2 Question Answer Marks 4(b)(v) use a syringe / measuring cylinder ; to collect volume (of oxygen) ; 2
Q5 · Some nutritional information for salmon produced by aquaculture and wild‑caught salmon
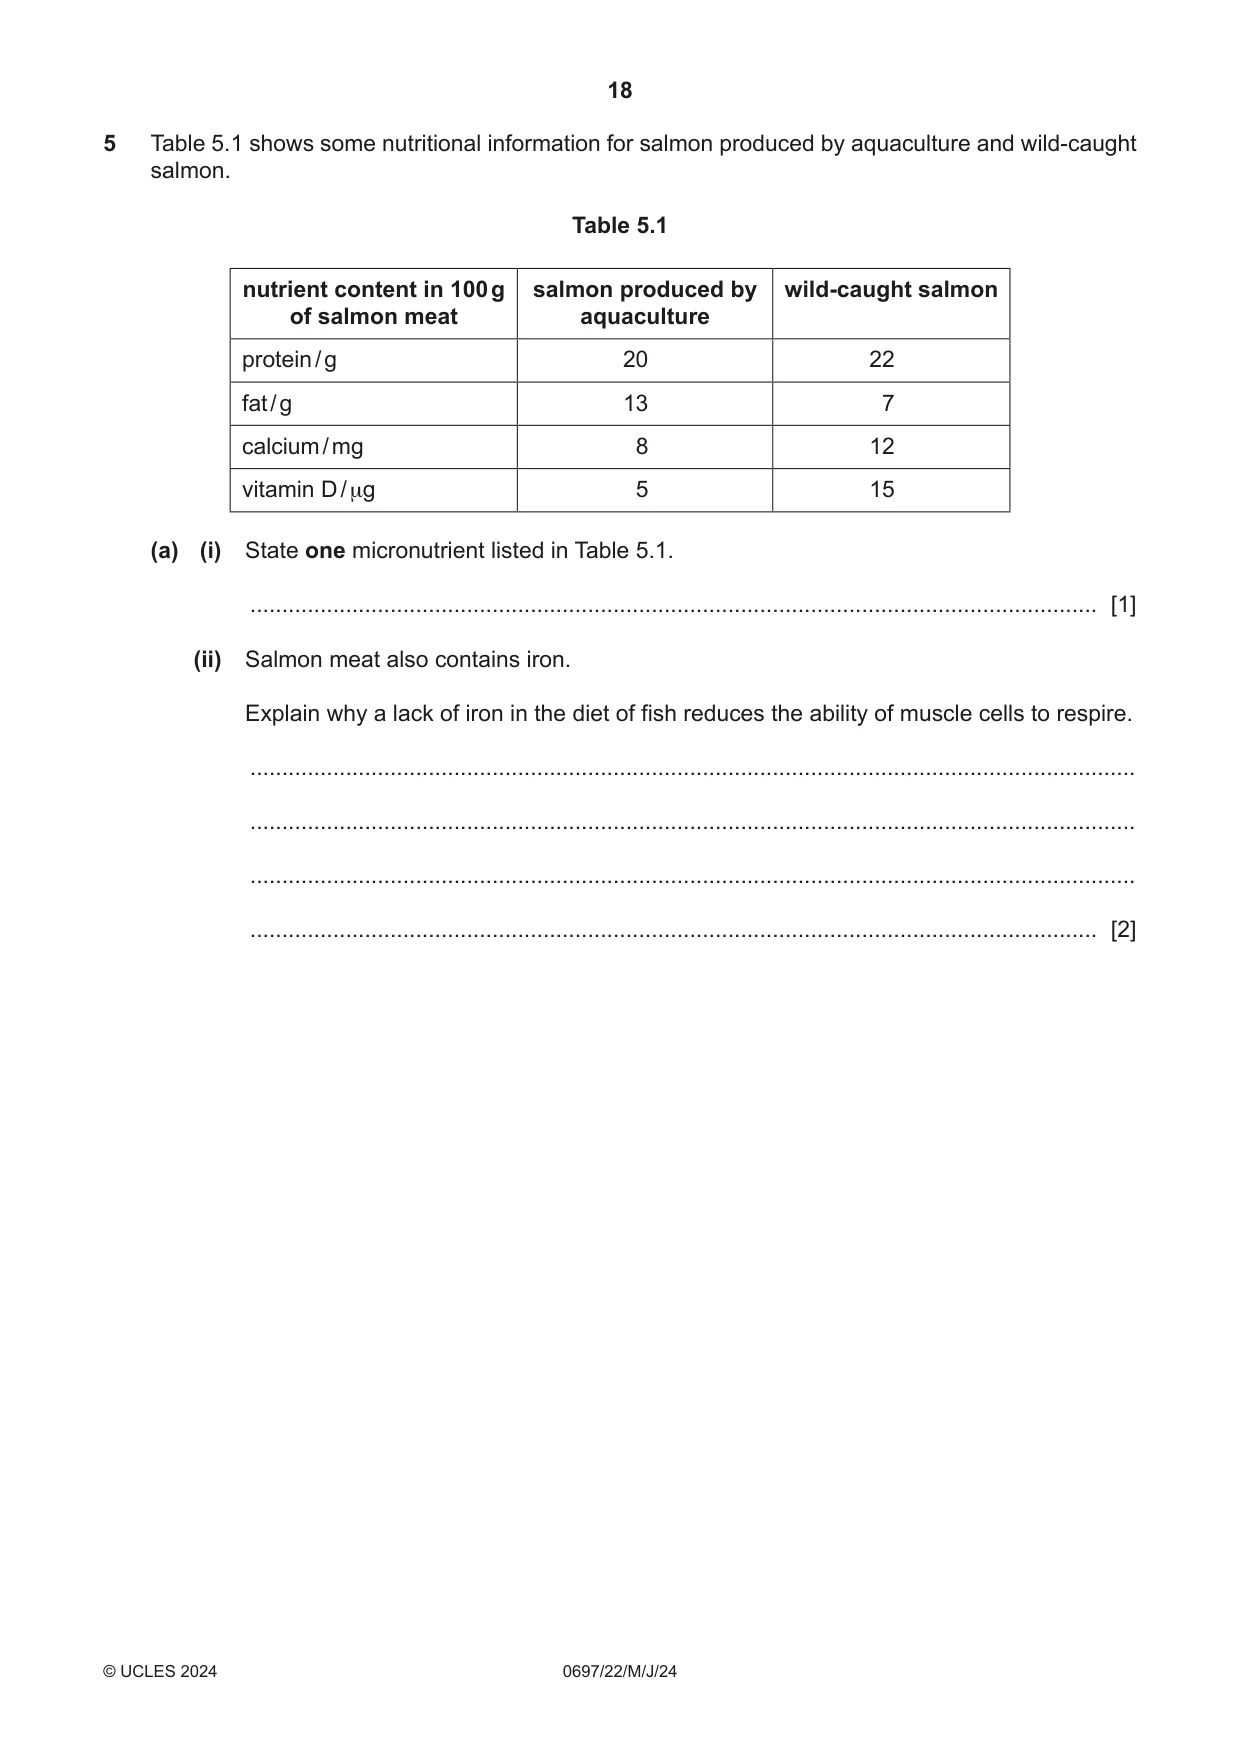
5 Table 5.1 shows some nutritional information for salmon produced by aquaculture and wild‑caught salmon. Table 5.1 nutrient content in 100 g salmon produced by wild-caught salmon of salmon meat aquaculture protein / g 20 22 fat / g 13 7 calcium / mg 8 12 vitamin D / μg 5 15 (a) (i) State one micronutrient listed in Table 5.1. ..................................................................................................................................... [1] (ii) Salmon meat also contains iron. Explain why a lack of iron in the diet of fish reduces the ability of muscle cells to respire. ........................................................................................................................................... ........................................................................................................................................... ........................................................................................................................................... ..................................................................................................................................... [2] (b) Salmon meat produced by aquaculture has a higher fat content than meat from wild‑caught salmon. Describe an investigation to test if meat from salmon produced by aquaculture has a higher energy content than meat from wild‑caught salmon. Your method should include a relevant safety precaution. ................................................................................................................................................... ................................................................................................................................................... ................................................................................................................................................... ................................................................................................................................................... ................................................................................................................................................... ................................................................................................................................................... ................................................................................................................................................... ................................................................................................................................................... ................................................................................................................................................... ................................................................................................................................................... ................................................................................................................................................... ................................................................................................................................................... ................................................................................................................................................... ............................................................................................................................................. [6] [Total: 9]
Mark scheme: 5(a)(i) calcium / vitamin D ; 1 5(a)(ii) (iron is needed to make) haemoglobin ; to transport oxygen ; 2 Question Answer Marks 5(b) any 6 of: use aquaculture fish and wild fish / use both types of fish / AW ; use of boiling tube with water / AW ; same volume of water in tube / stated volume / AW ; use same mass / volume of fish tissue / weigh fish before / AW ; same age / sex / same part, of fish / AW ; dry fish / AW ; set fire to / burn fish / AW ; heat water / tube with burning fish / place burning fish under tube / AW ; measure change in temperature of water / temperature before and after / AW ; appropriate safety precautions e.g. eye protection / AW ; repeats (for reliability) ; 6
Q6 · The effect of temperature on the dissolved oxygen concentration of fresh water and of sea…
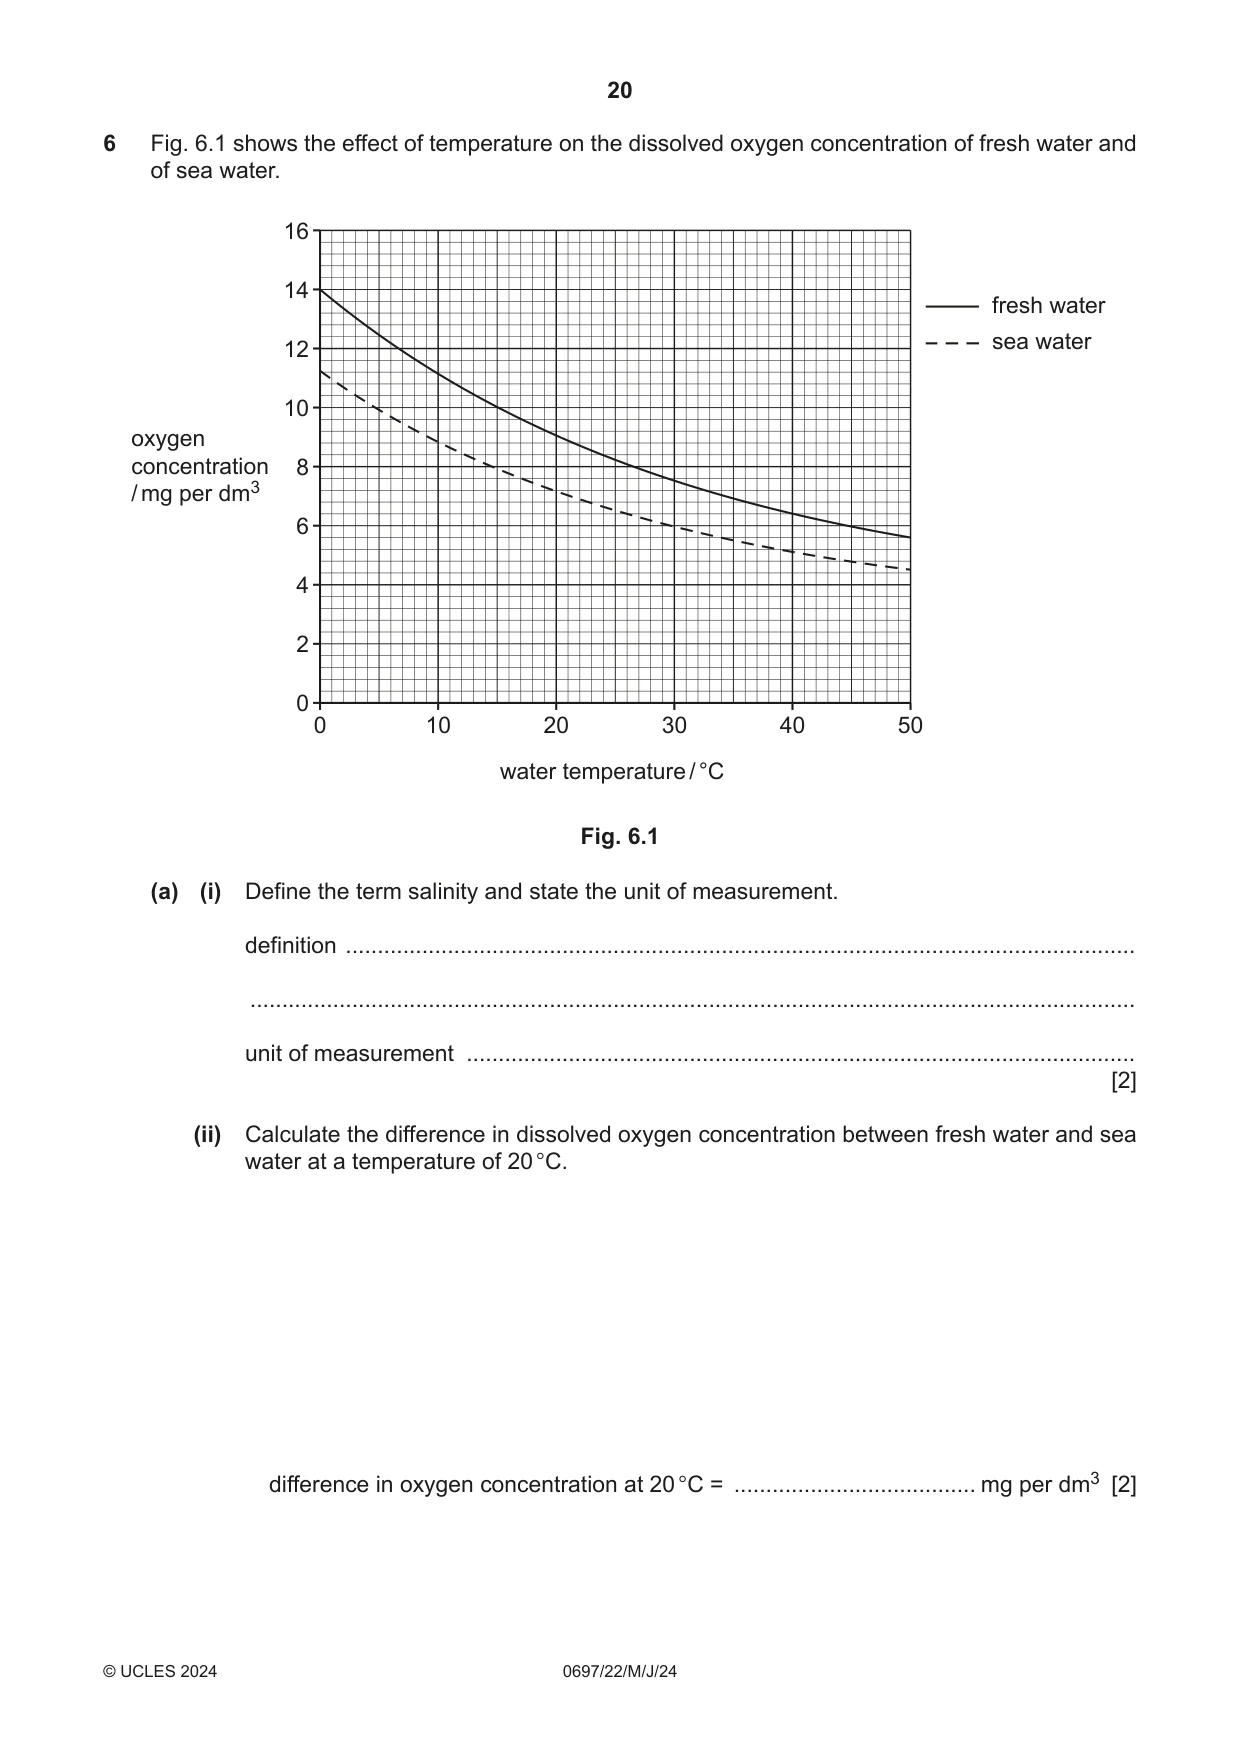
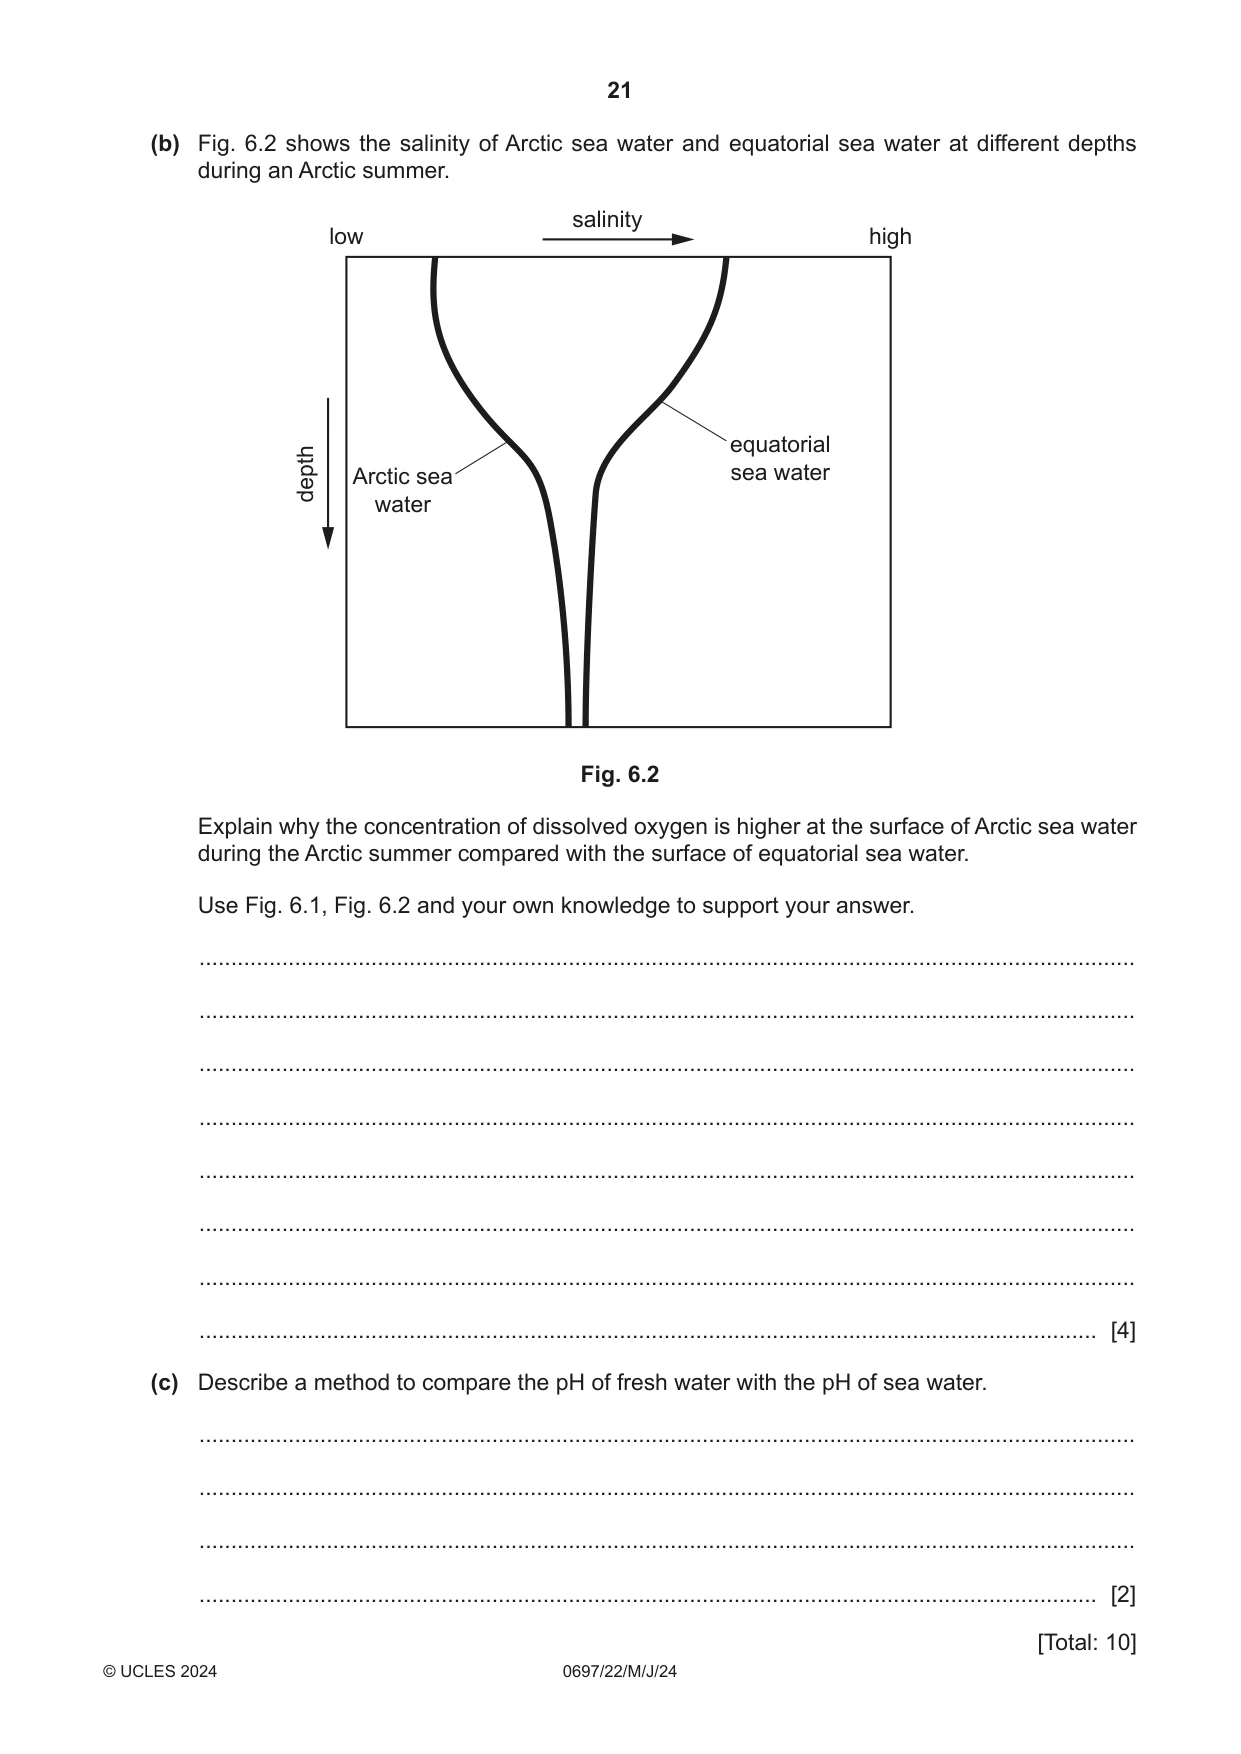
6 Fig. 6.1 shows the effect of temperature on the dissolved oxygen concentration of fresh water and of sea water. 16 14 fresh water sea water 12 10 oxygen concentration 8 / mg per dm3 6 4 2 0 0 10 20 30 40 50 water temperature / °C Fig. 6.1 (a) (i) Define the term salinity and state the unit of measurement. definition ............................................................................................................................ ........................................................................................................................................... unit of measurement ......................................................................................................... [2] (ii) Calculate the difference in dissolved oxygen concentration between fresh water and sea water at a temperature of 20 °C. difference in oxygen concentration at 20 °C = ...................................... mg per dm3 [2] (b) Fig. 6.2 shows the salinity of Arctic sea water and equatorial sea water at different depths during an Arctic summer. salinity low high equatorial Arctic sea sea water depth water Fig. 6.2 Explain why the concentration of dissolved oxygen is higher at the surface of Arctic sea water during the Arctic summer compared with the surface of equatorial sea water. Use Fig. 6.1, Fig. 6.2 and your own knowledge to support your answer. ................................................................................................................................................... ................................................................................................................................................... ................................................................................................................................................... ................................................................................................................................................... ................................................................................................................................................... ................................................................................................................................................... ................................................................................................................................................... ............................................................................................................................................. [4] (c) Describe a method to compare the pH of fresh water with the pH of sea water. ................................................................................................................................................... ................................................................................................................................................... ................................................................................................................................................... ............................................................................................................................................. [2]
Mark scheme: 6(a)(i) concentration of (dissolved) salt (in water) / solutes ; parts per thousand / ppt / % ; 2 6(a)(ii) 1.8 ;; 2 Question Answer Marks 6(b) any 4 of: Arctic water / it has lower temperature (than equatorial water) / ORA / AW ; so lower salinity in Arctic water / ORA / AW ; lower evaporation of Arctic water / ORA / AW ; melted ice / melted glacier runs into (Arctic water) (reducing salinity) / ORA / AW ; high(er) oxygen, in cold water / low salinity water / fresh water / ORA / AW ; ref to photosynthesis / respiration affecting oxygen ; 4 6(c) add universal indicator / use universal indicator strips ; comparison of two correct colours linked with pH / compare colours to scale on indicator chart ; OR pH meter / data logger ; read value for fresh water and for seawater / AW ; 2
What was in this paper
The subtopics covered by these 6 questions, and how many questions each got. Open one in a new tab to see every Cambridge question on it.
What you needed in this session
Cambridge’s own grade thresholds for 2024 May/June, Paper 2 · Variant 2. A higher threshold means an easier paper — the bar moves with how the cohort did.