Cambridge IGCSE Marine Science (Maldives only) 0697 — 2024 May/June Paper 2 · Variant 1
0697/21/M/J/24 · 6 questions · 80 marks · 105 min
The question paper and its mark scheme, free to read here and free to download. This is Cambridge’s own paper, exactly as it was sat.
Question paper20 pages


Mark scheme16 pages
Answers below. Sit the paper first if you are practising.
Questions as text
Q1 · An image of a coral polyp
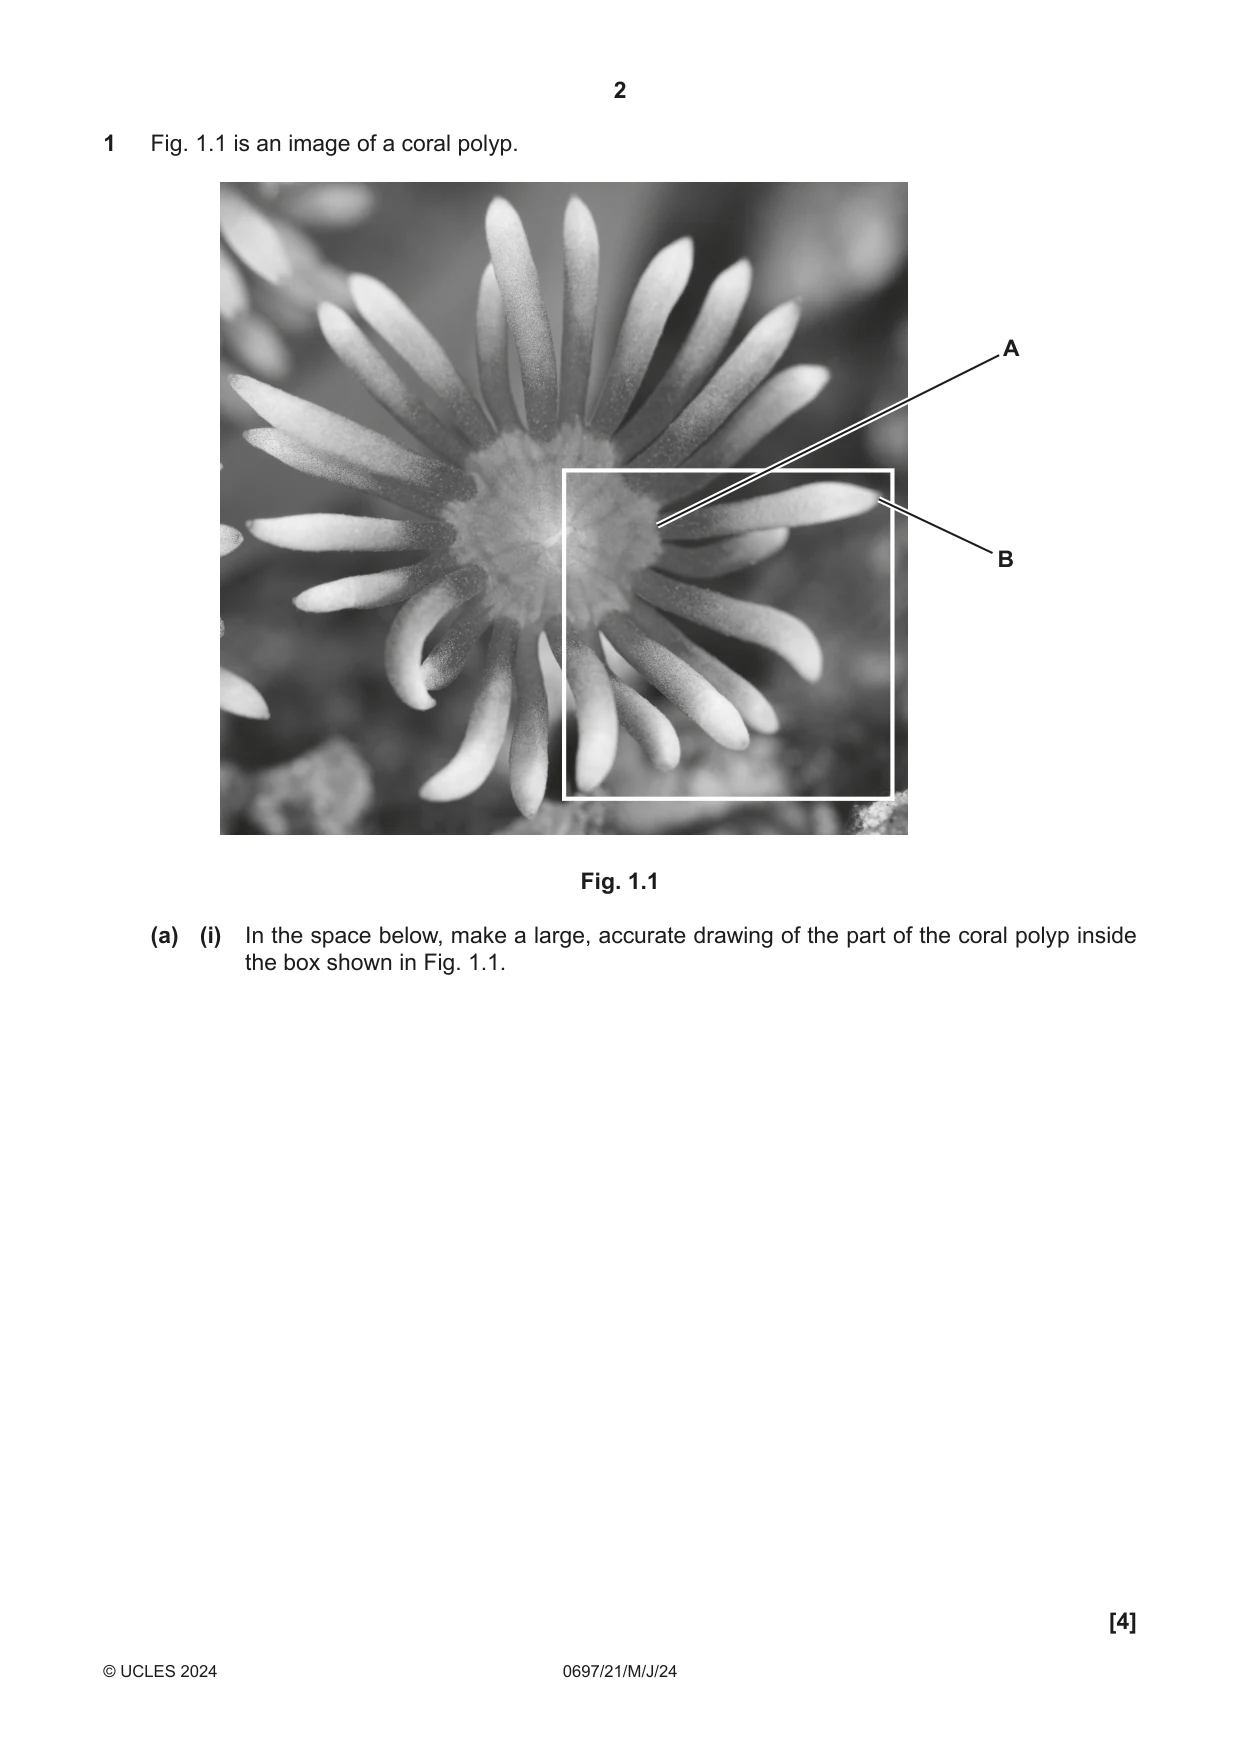
1 Fig. 1.1 is an image of a coral polyp. A B Fig. 1.1 (a) (i) In the space below, make a large, accurate drawing of the part of the coral polyp inside the box shown in Fig. 1.1. [4] (ii) On Fig. 1.1, draw a line to show the length of the tentacle between A and B. Measure the line that you have drawn in millimetres. length of line = ................................................... mm [1] (iii) The image in Fig. 1.1 has a magnification of × 50. Use your answer to (a)(ii) to calculate the actual length of the tentacle between A and B. Show your working. Give your answer in millimetres and to one decimal place. actual length = ................................................... mm [2] (b) (i) State the name of the domain and kingdom for the classification of this coral polyp. domain .............................................................................................................................. kingdom ............................................................................................................................. [2] (ii) State how the symmetry of the coral polyp is different to the symmetry shown by echinoderms. ........................................................................................................................................... ..................................................................................................................................... [1] (c) Outline the life cycle of coral polyps. ................................................................................................................................................... ................................................................................................................................................... ................................................................................................................................................... ................................................................................................................................................... ................................................................................................................................................... ................................................................................................................................................... ................................................................................................................................................... ............................................................................................................................................. [4] [Total: 14]
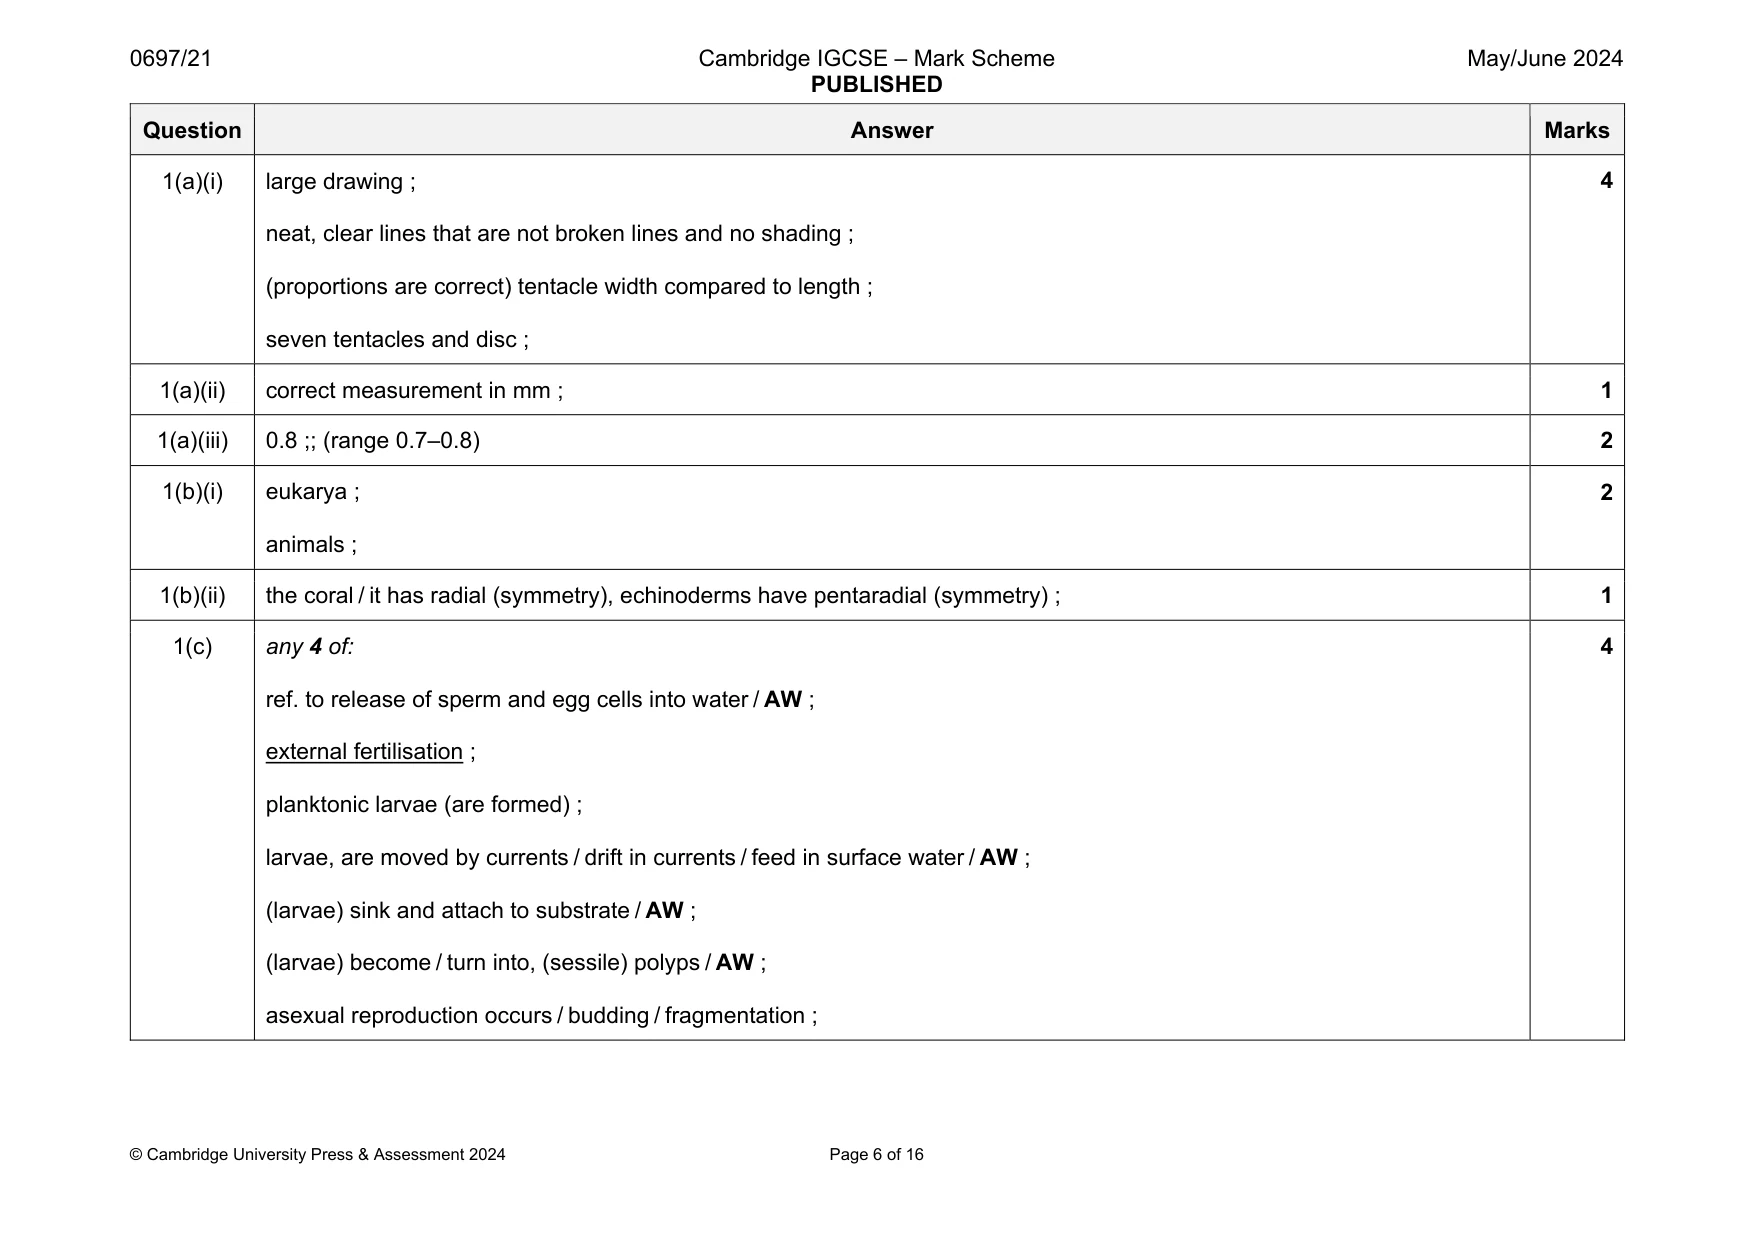
Mark scheme: 1(a)(i) large drawing ; neat, clear lines that are not broken lines and no shading ; (proportions are correct) tentacle width compared to length ; seven tentacles and disc ; 1(a)(ii) correct measurement in mm ; 1 1(a)(iii) 0.8 ;; (range 0.7–0.8) 2 1(b)(i) eukarya ; animals ; 2 1(b)(ii) the coral / it has radial (symmetry), echinoderms have pentaradial (symmetry) ; 1 1(c) any 4 of: ref. to release of sperm and egg cells into water / AW ; external fertilisation ; planktonic larvae (are formed) ; larvae, are moved by currents / drift in currents / feed in surface water / AW ; (larvae) sink and attach to substrate / AW ; (larvae) become / turn into, (sessile) polyps / AW ; asexual reproduction occurs / budding / fragmentation ; 4
Q2 · Oceanic currents and gyres circulate water around the World Ocean
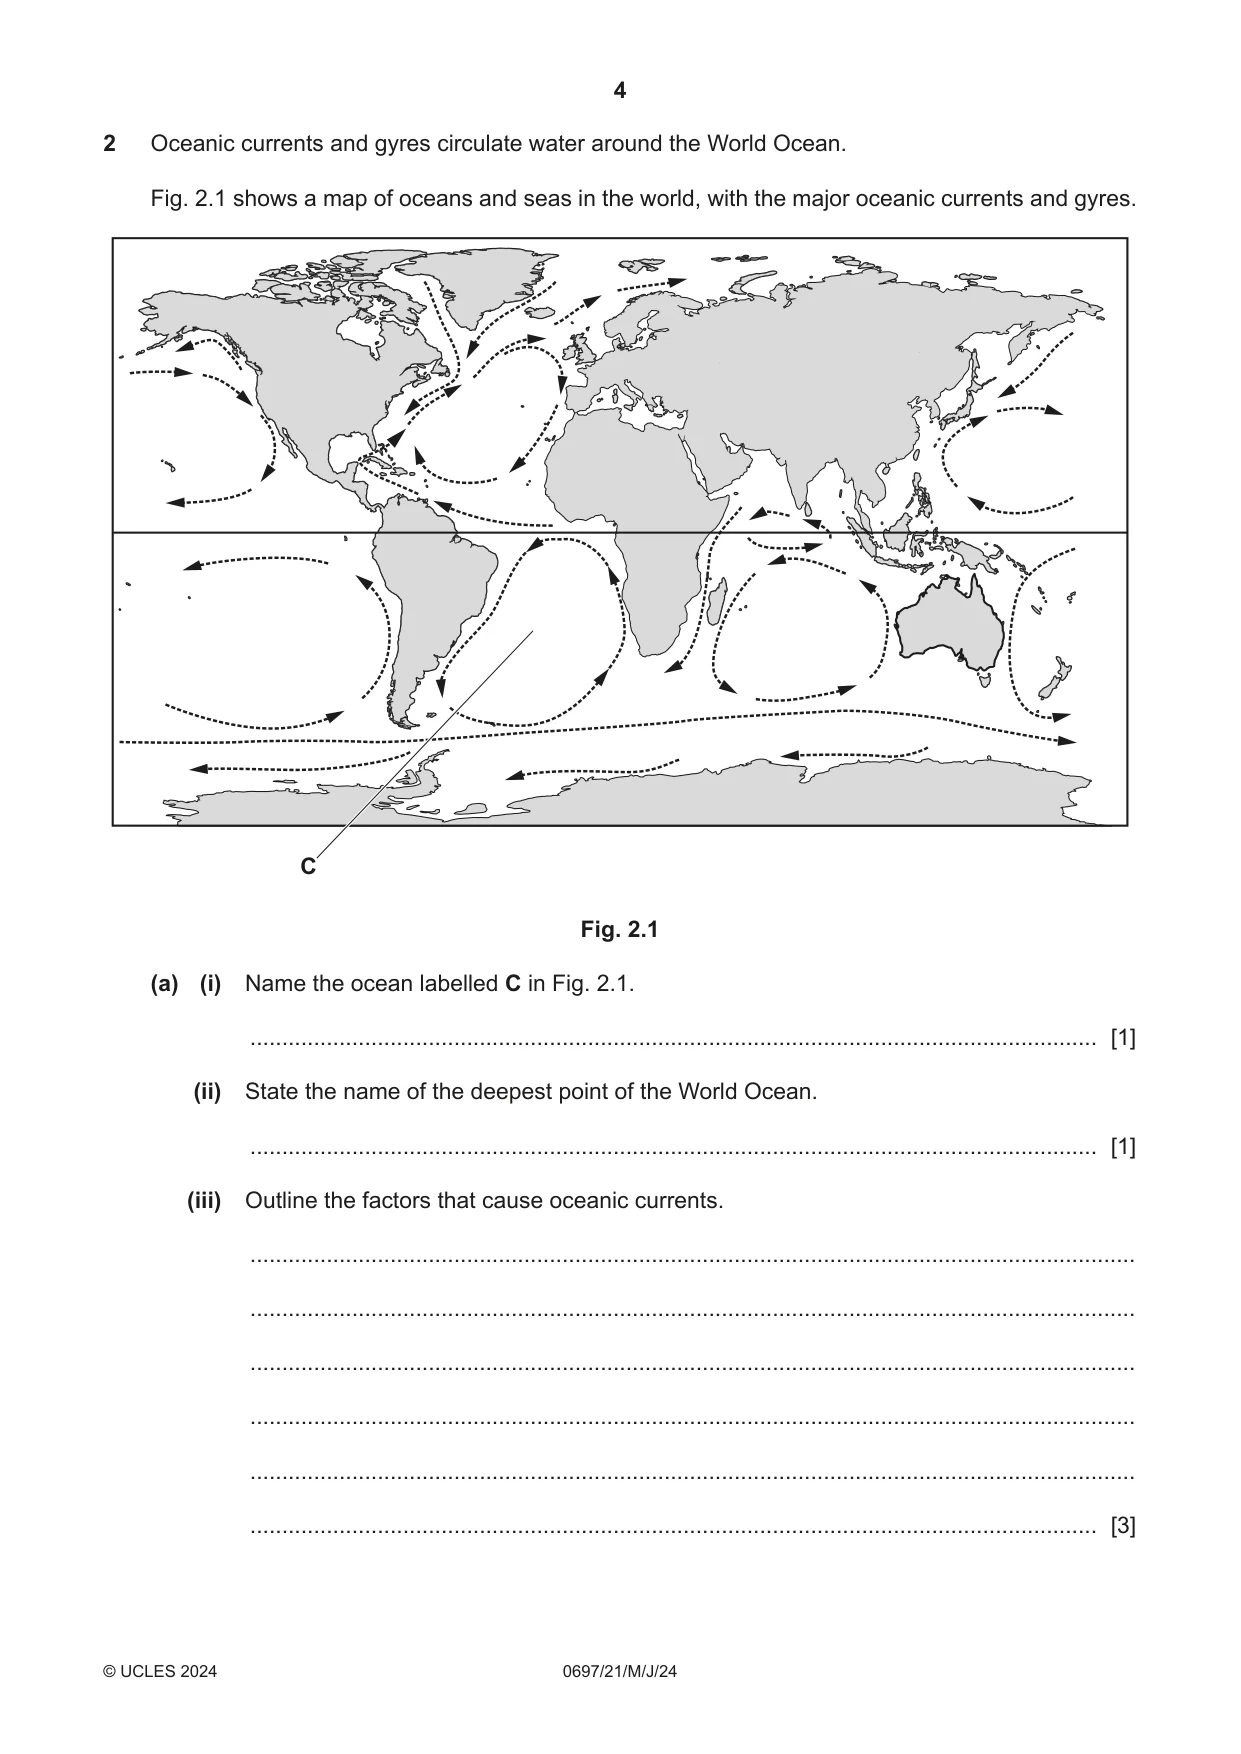
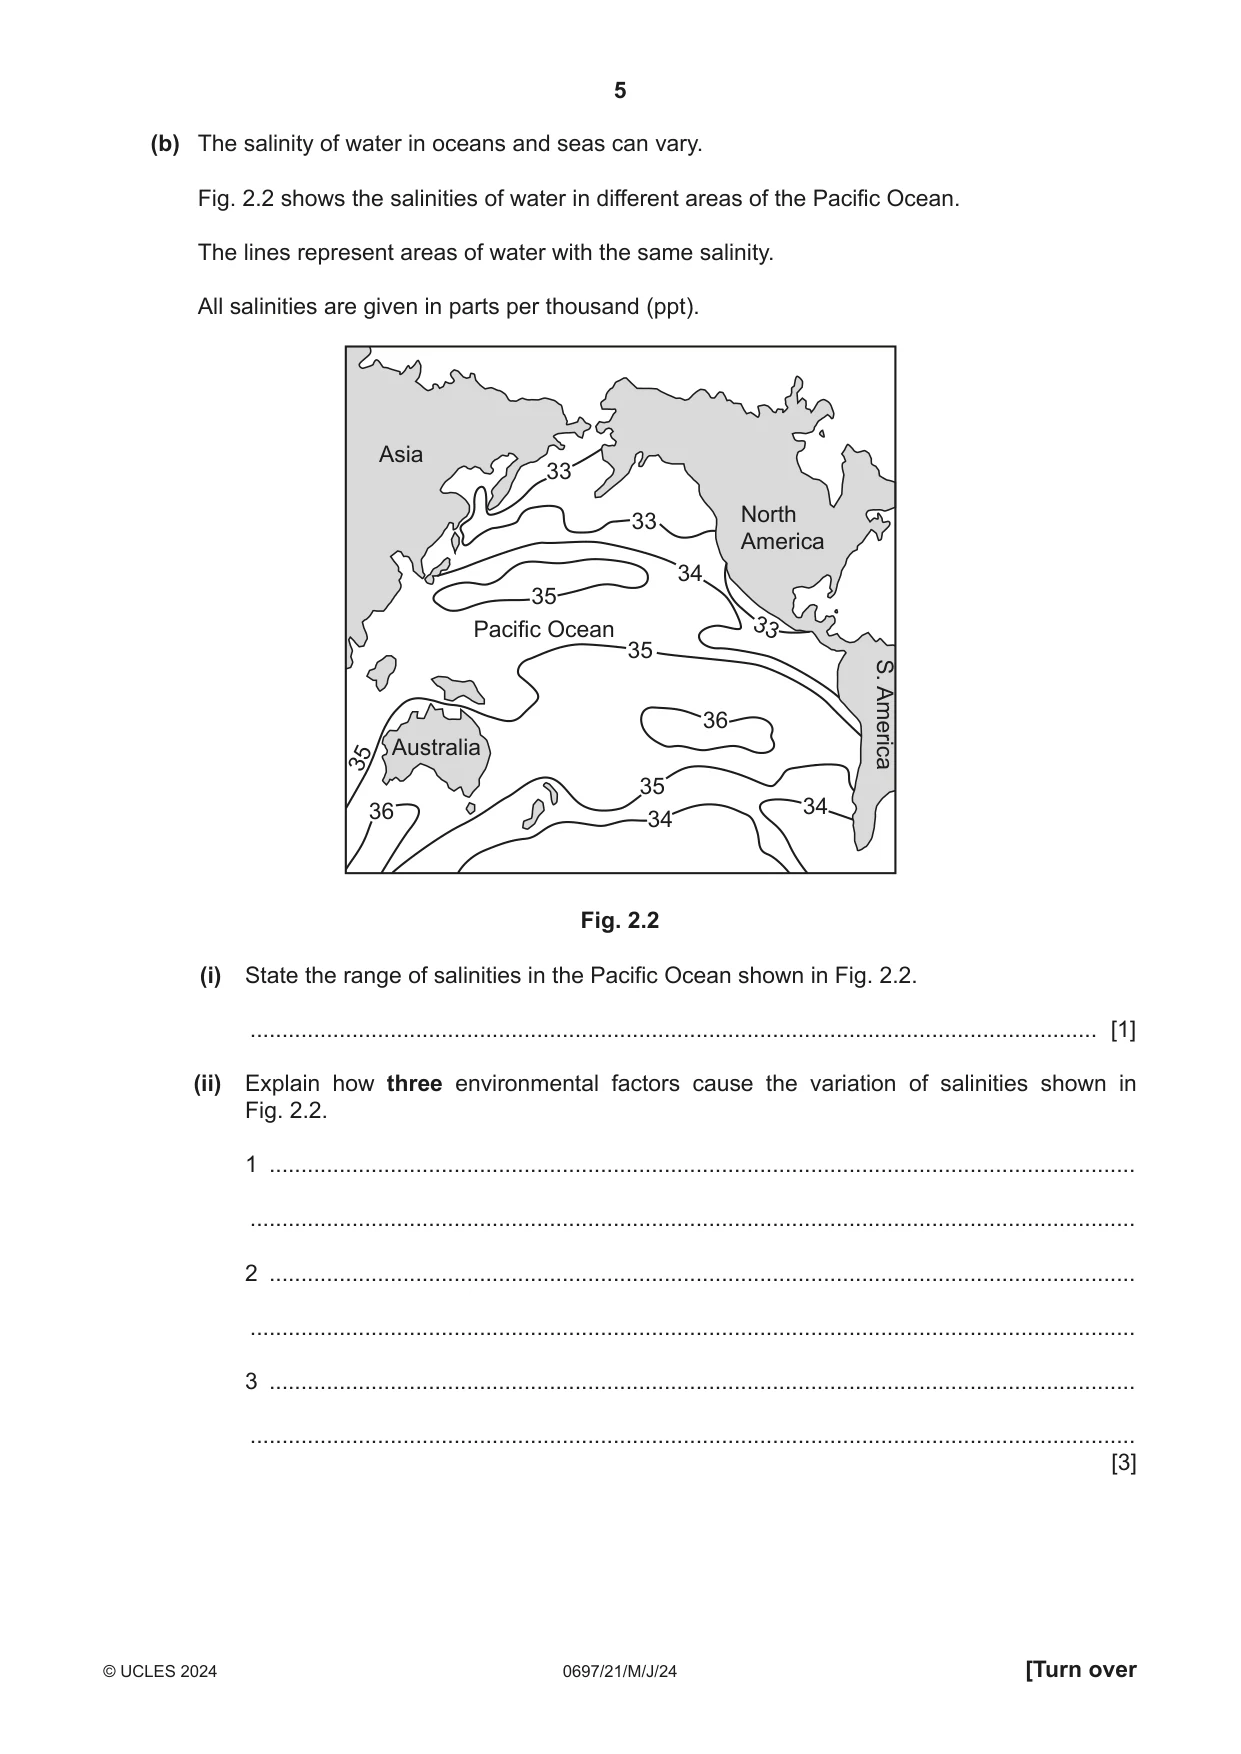
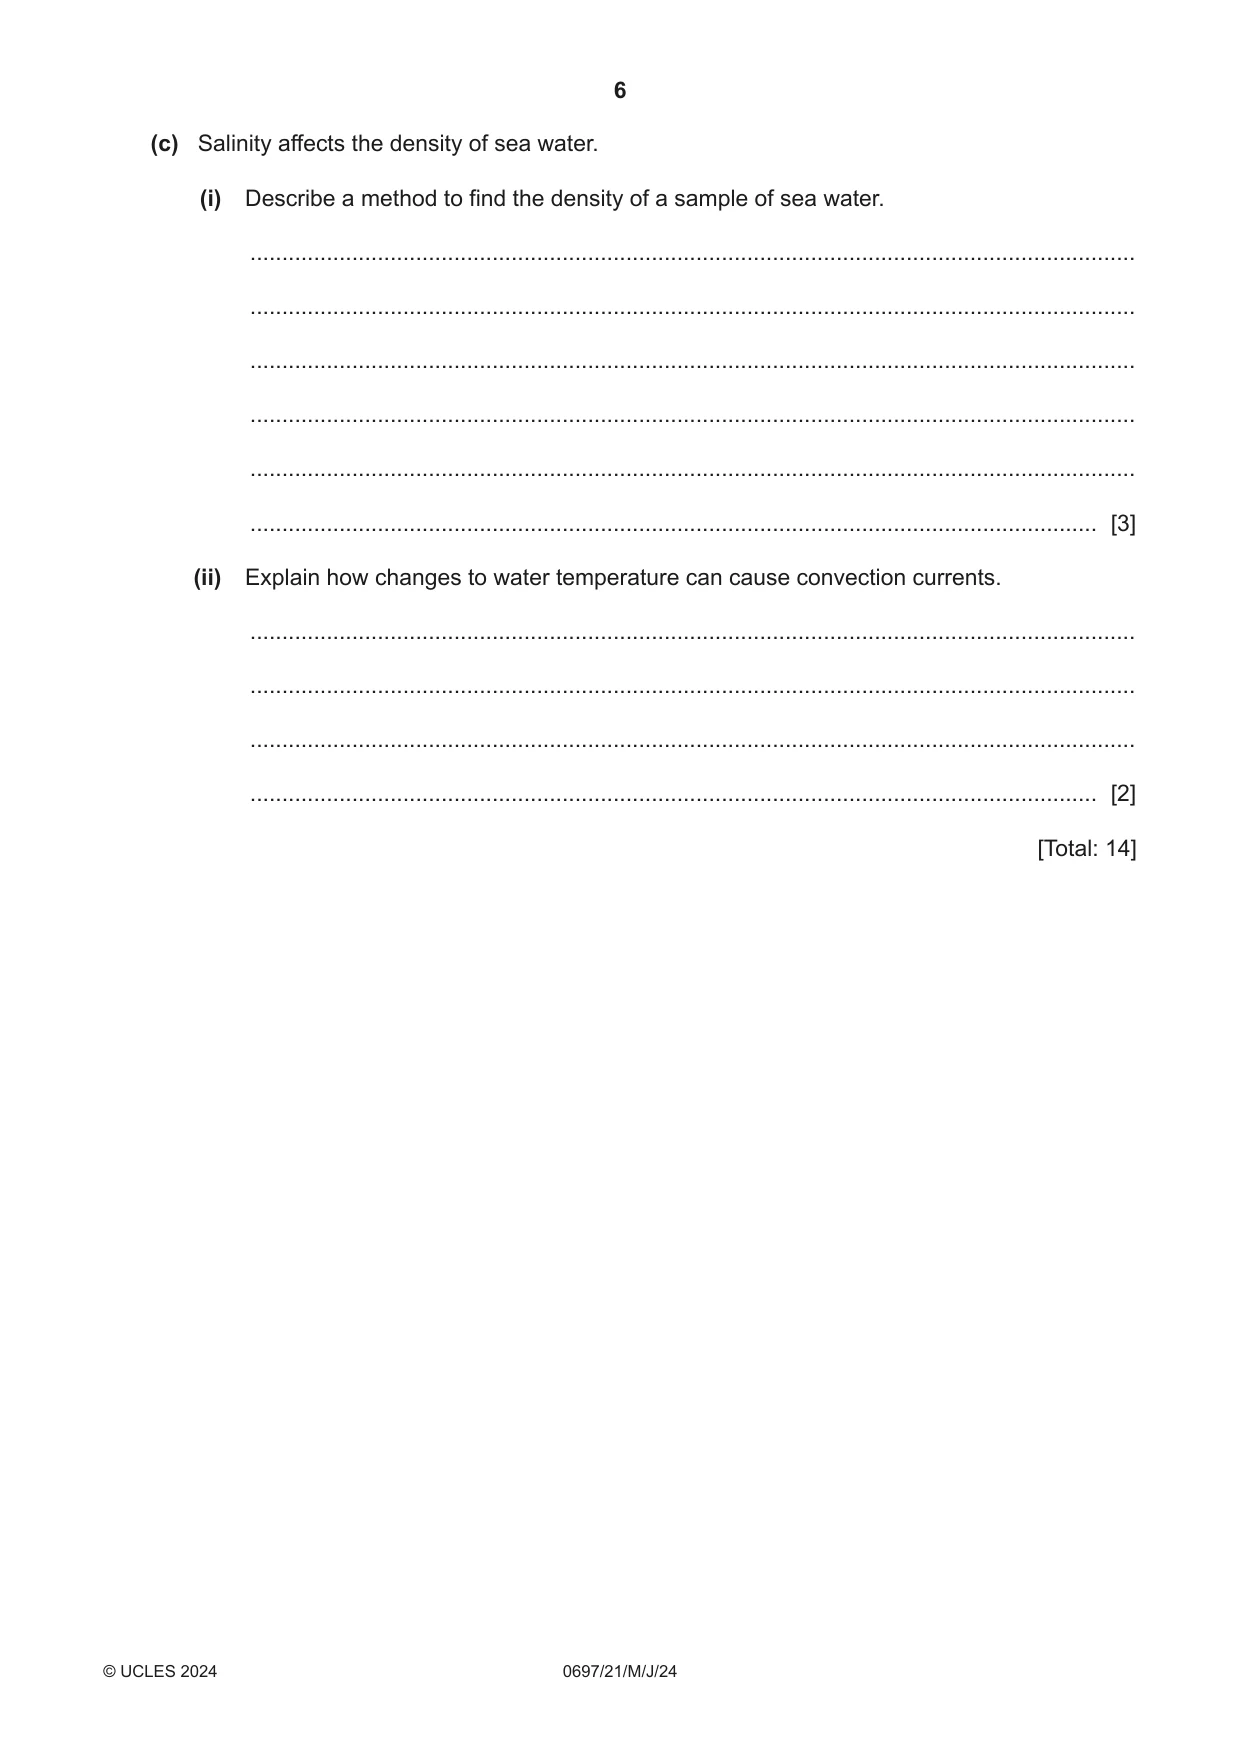
2 Oceanic currents and gyres circulate water around the World Ocean. Fig. 2.1 shows a map of oceans and seas in the world, with the major oceanic currents and gyres. C Fig. 2.1 (a) (i) Name the ocean labelled C in Fig. 2.1. ..................................................................................................................................... [1] (ii) State the name of the deepest point of the World Ocean. ..................................................................................................................................... [1] (iii) Outline the factors that cause oceanic currents. ........................................................................................................................................... ........................................................................................................................................... ........................................................................................................................................... ........................................................................................................................................... ........................................................................................................................................... ..................................................................................................................................... [3] (b) The salinity of water in oceans and seas can vary. Fig. 2.2 shows the salinities of water in different areas of the Pacific Ocean. The lines represent areas of water with the same salinity. All salinities are given in parts per thousand (ppt). Asia 33 North 33 America 34 35 Pacific Ocean 33 35 S. 36 Australia 35 America 35 36 34 34 Fig. 2.2 (i) State the range of salinities in the Pacific Ocean shown in Fig. 2.2. ..................................................................................................................................... [1] (ii) Explain how three environmental factors cause the variation of salinities shown in Fig. 2.2. 1 ........................................................................................................................................ ........................................................................................................................................... 2 ........................................................................................................................................ ........................................................................................................................................... 3 ........................................................................................................................................ ........................................................................................................................................... [3] (c) Salinity affects the density of sea water. (i) Describe a method to find the density of a sample of sea water. ........................................................................................................................................... ........................................................................................................................................... ........................................................................................................................................... ........................................................................................................................................... ........................................................................................................................................... ..................................................................................................................................... [3] (ii) Explain how changes to water temperature can cause convection currents. ........................................................................................................................................... ........................................................................................................................................... ........................................................................................................................................... ..................................................................................................................................... [2] [Total: 14]
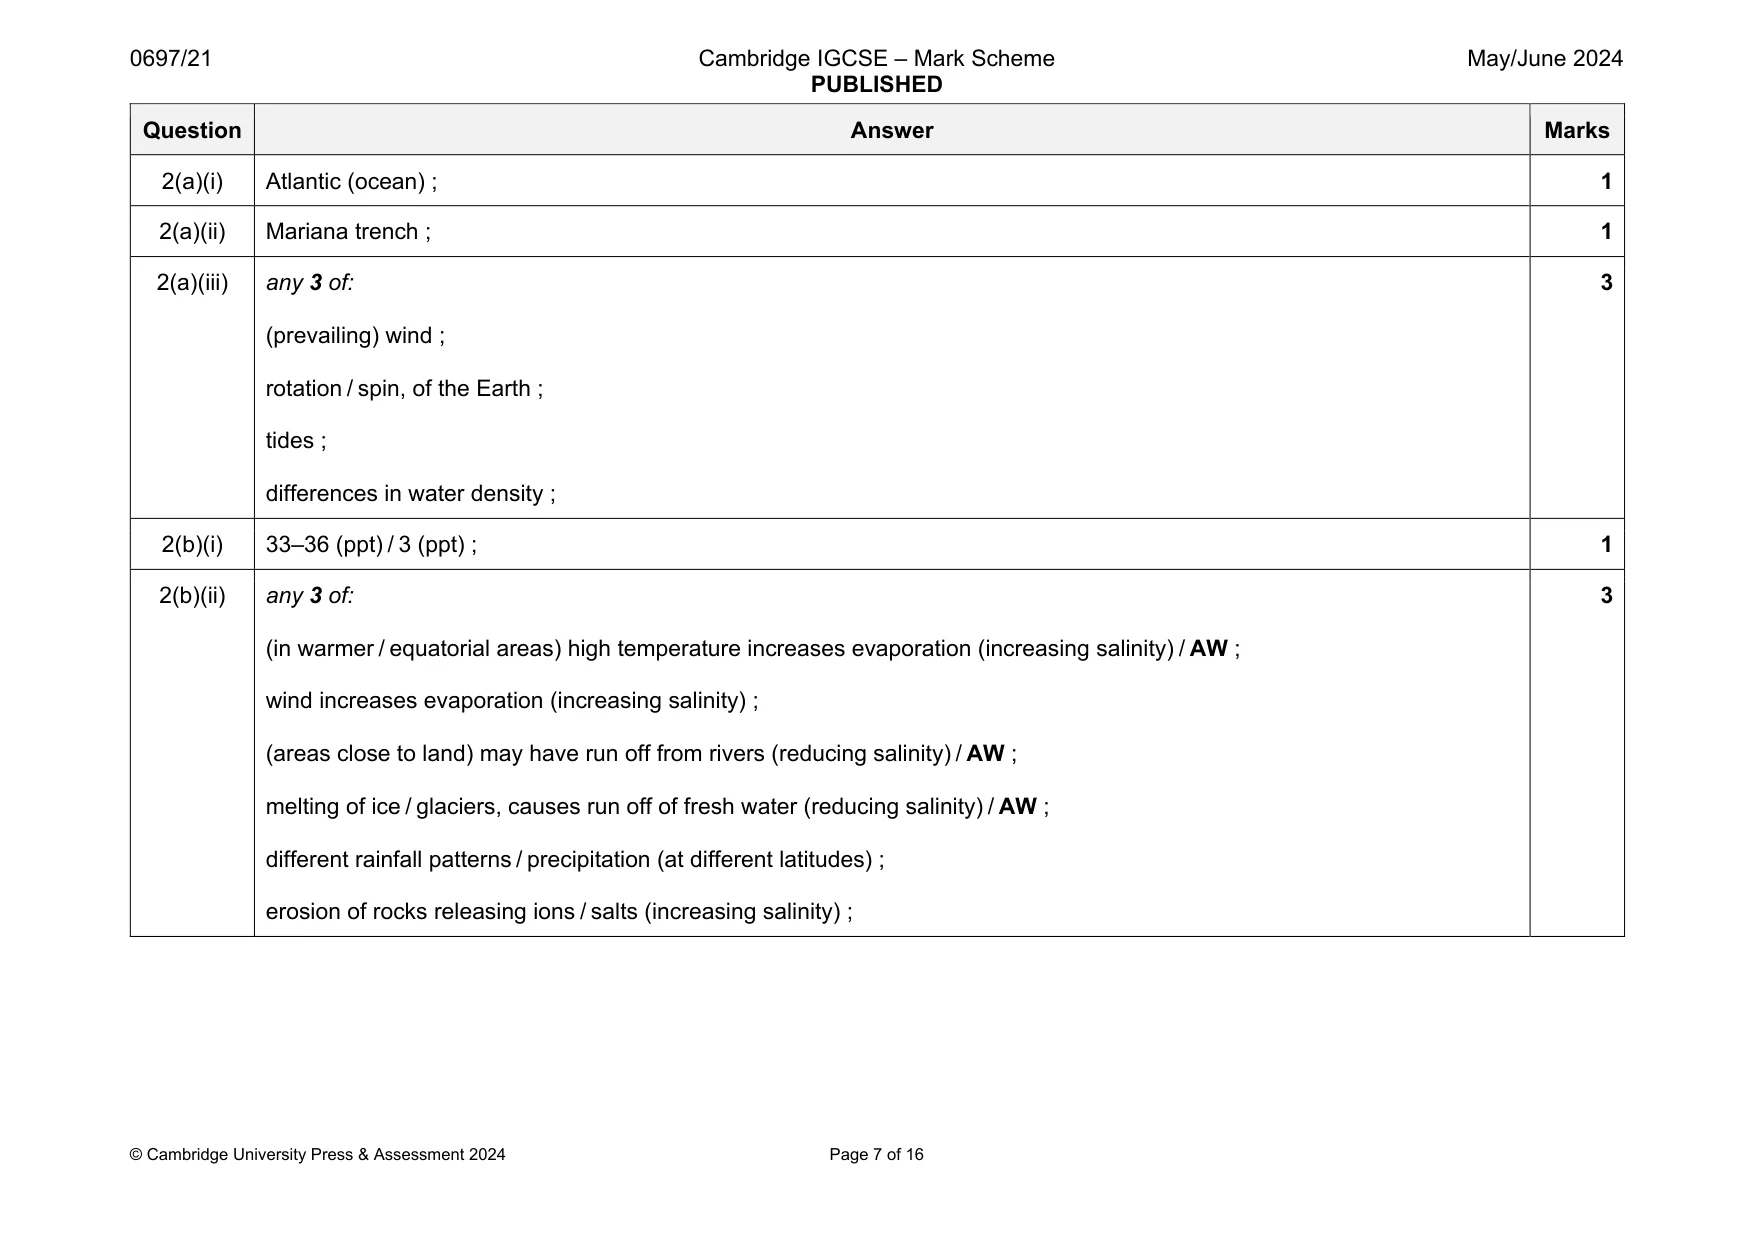
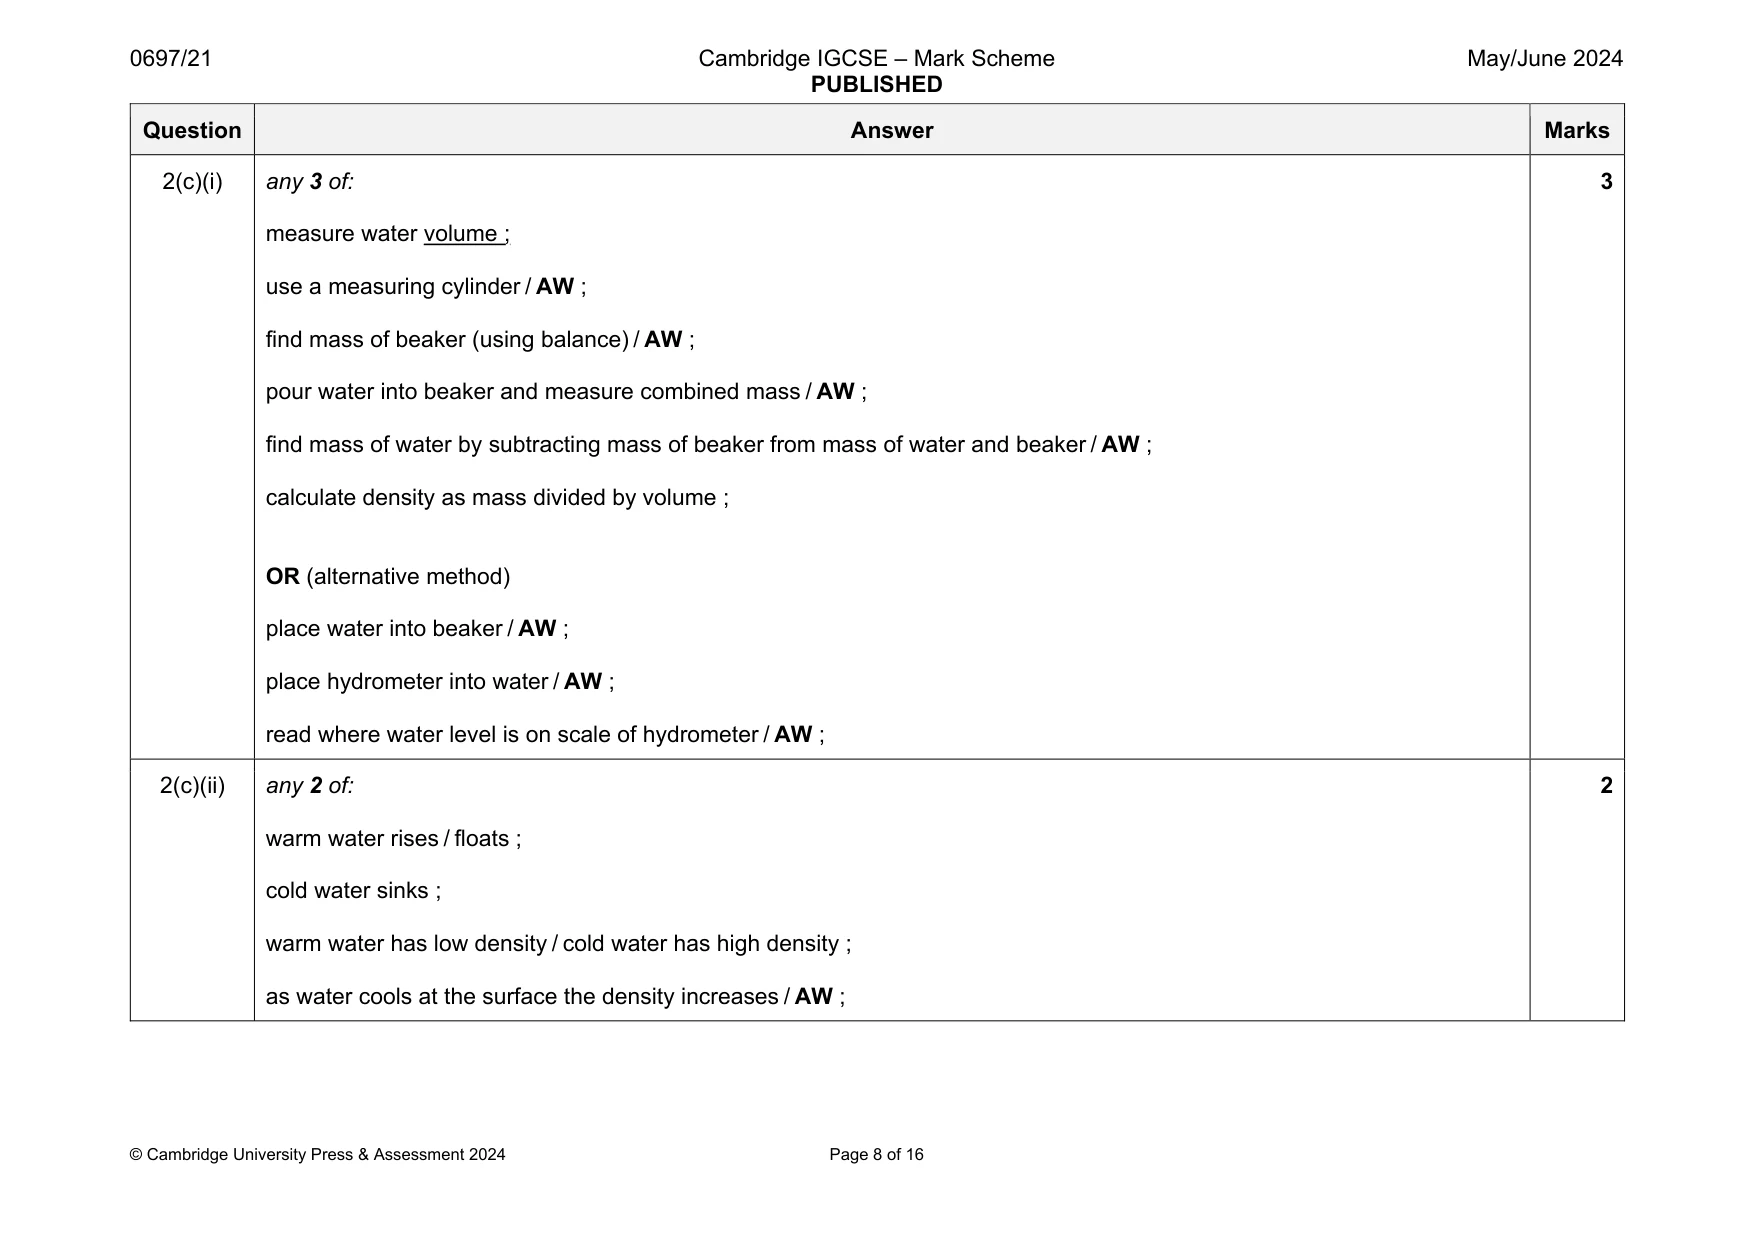
Mark scheme: 2(a)(i) Atlantic (ocean) ; 1 2(a)(ii) Mariana trench ; 1 2(a)(iii) any 3 of: (prevailing) wind ; rotation / spin, of the Earth ; tides ; differences in water density ; 3 2(b)(i) 33–36 (ppt) / 3 (ppt) ; 1 2(b)(ii) any 3 of: (in warmer / equatorial areas) high temperature increases evaporation (increasing salinity) / AW ; wind increases evaporation (increasing salinity) ; (areas close to land) may have run off from rivers (reducing salinity) / AW ; melting of ice / glaciers, causes run off of fresh water (reducing salinity) / AW ; different rainfall patterns / precipitation (at different latitudes) ; erosion of rocks releasing ions / salts (increasing salinity) ; 3 Question Answer Marks 2(c)(i) any 3 of: measure water volume ; use a measuring cylinder / AW ; find mass of beaker (using balance) / AW ; pour water into beaker and measure combined mass / AW ; find mass of water by subtracting mass of beaker from mass of water and beaker / AW ; calculate density as mass divided by volume ; OR (alternative method) place water into beaker / AW ; place hydrometer into water / AW ; read where water level is on scale of hydrometer / AW ; 3 2(c)(ii) any 2 of: warm water rises / floats ; cold water sinks ; warm water has low density / cold water has high density ; as water cools at the surface the density increases / AW ; 2
Q3 · Aquaculture can be used to produce large quantities of grouper for human consumption
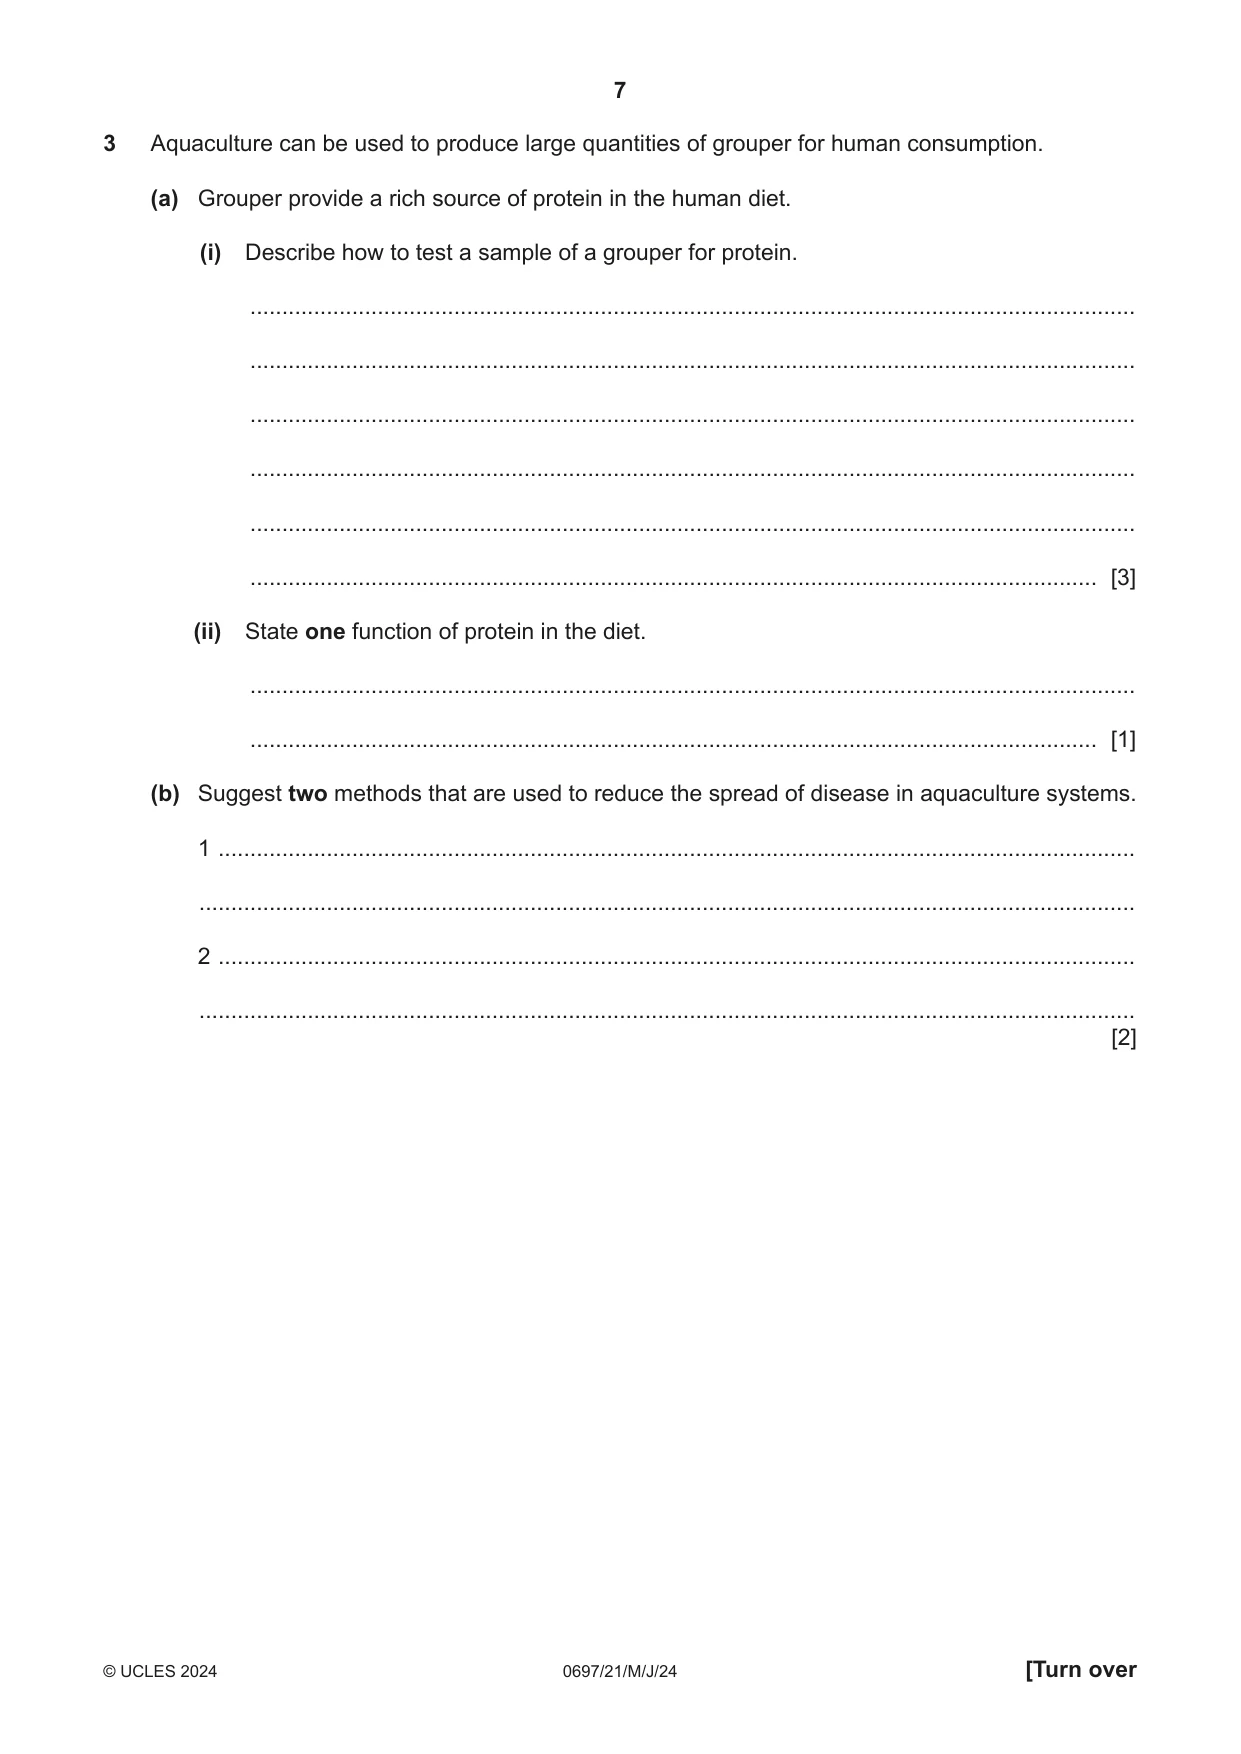
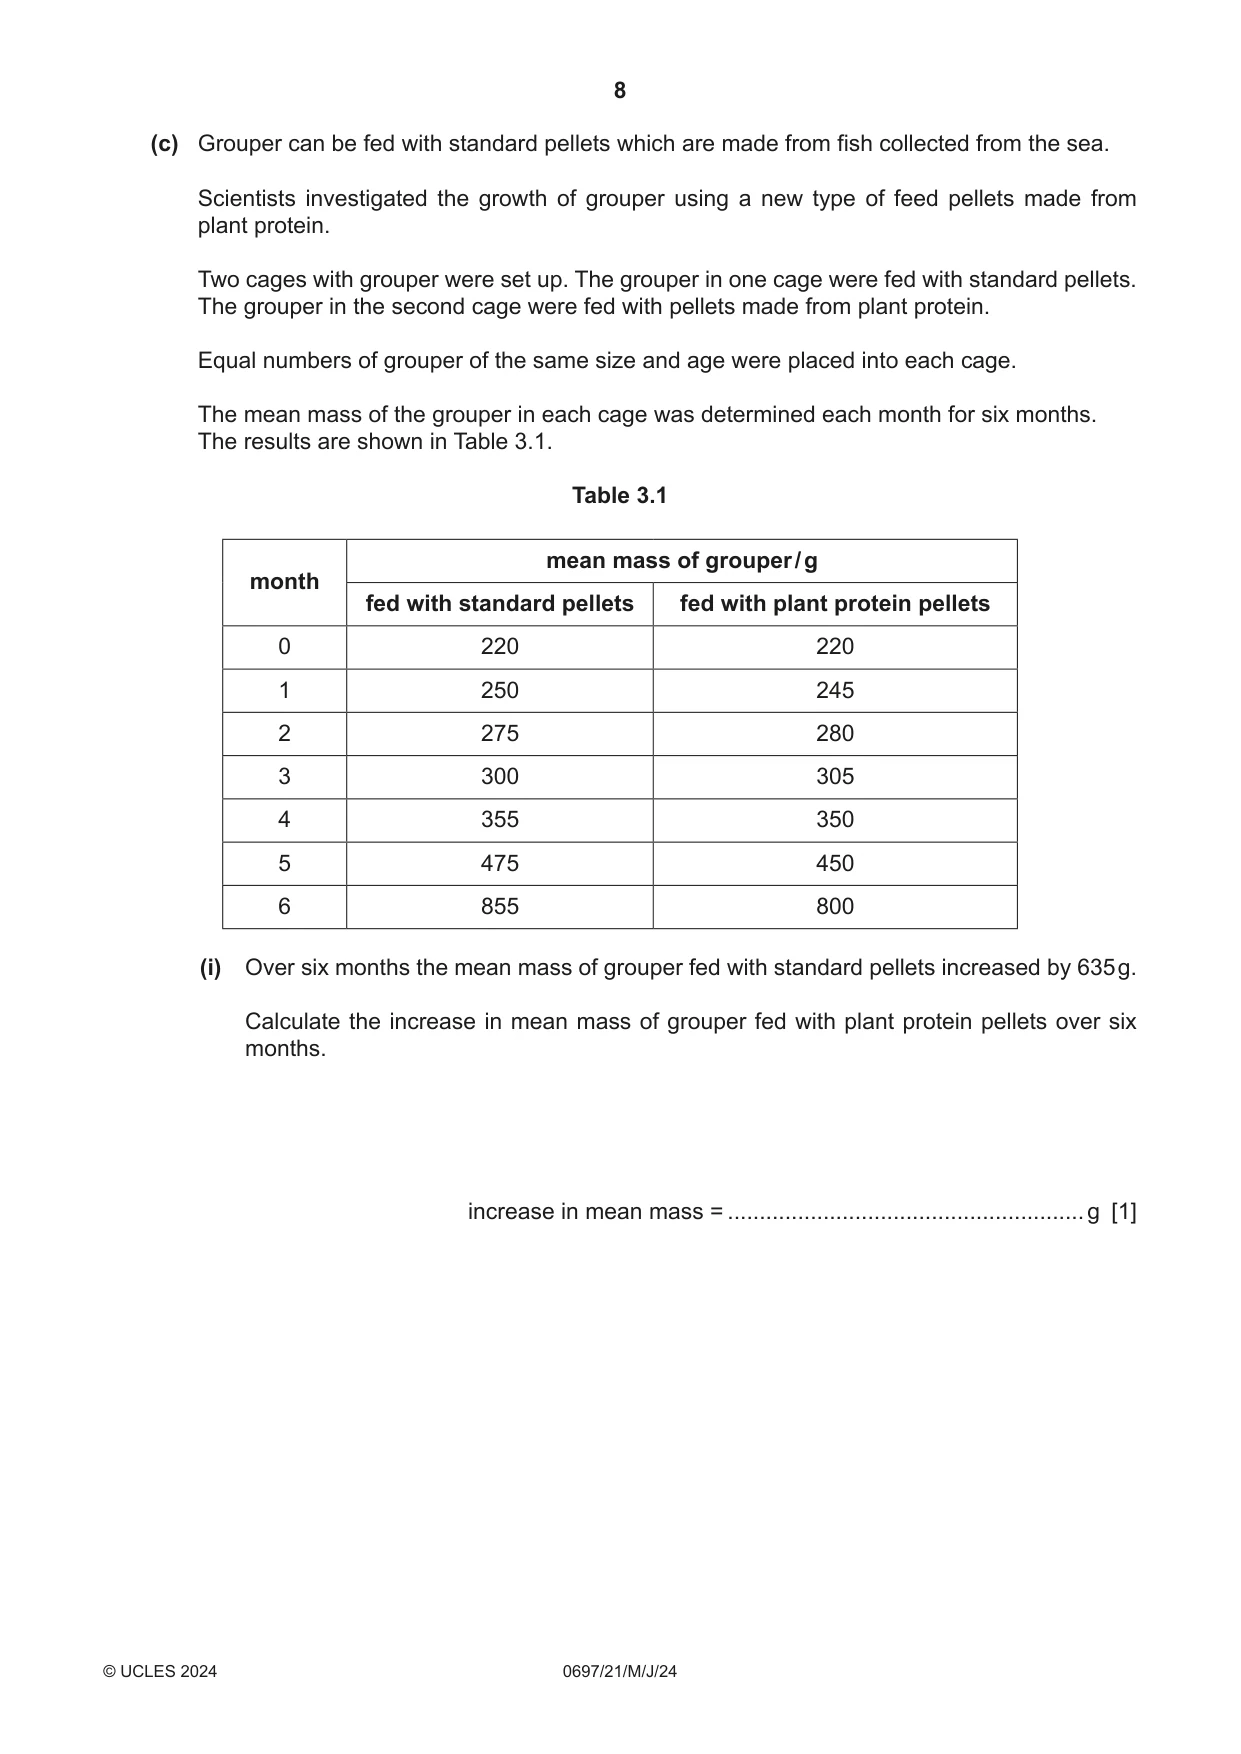
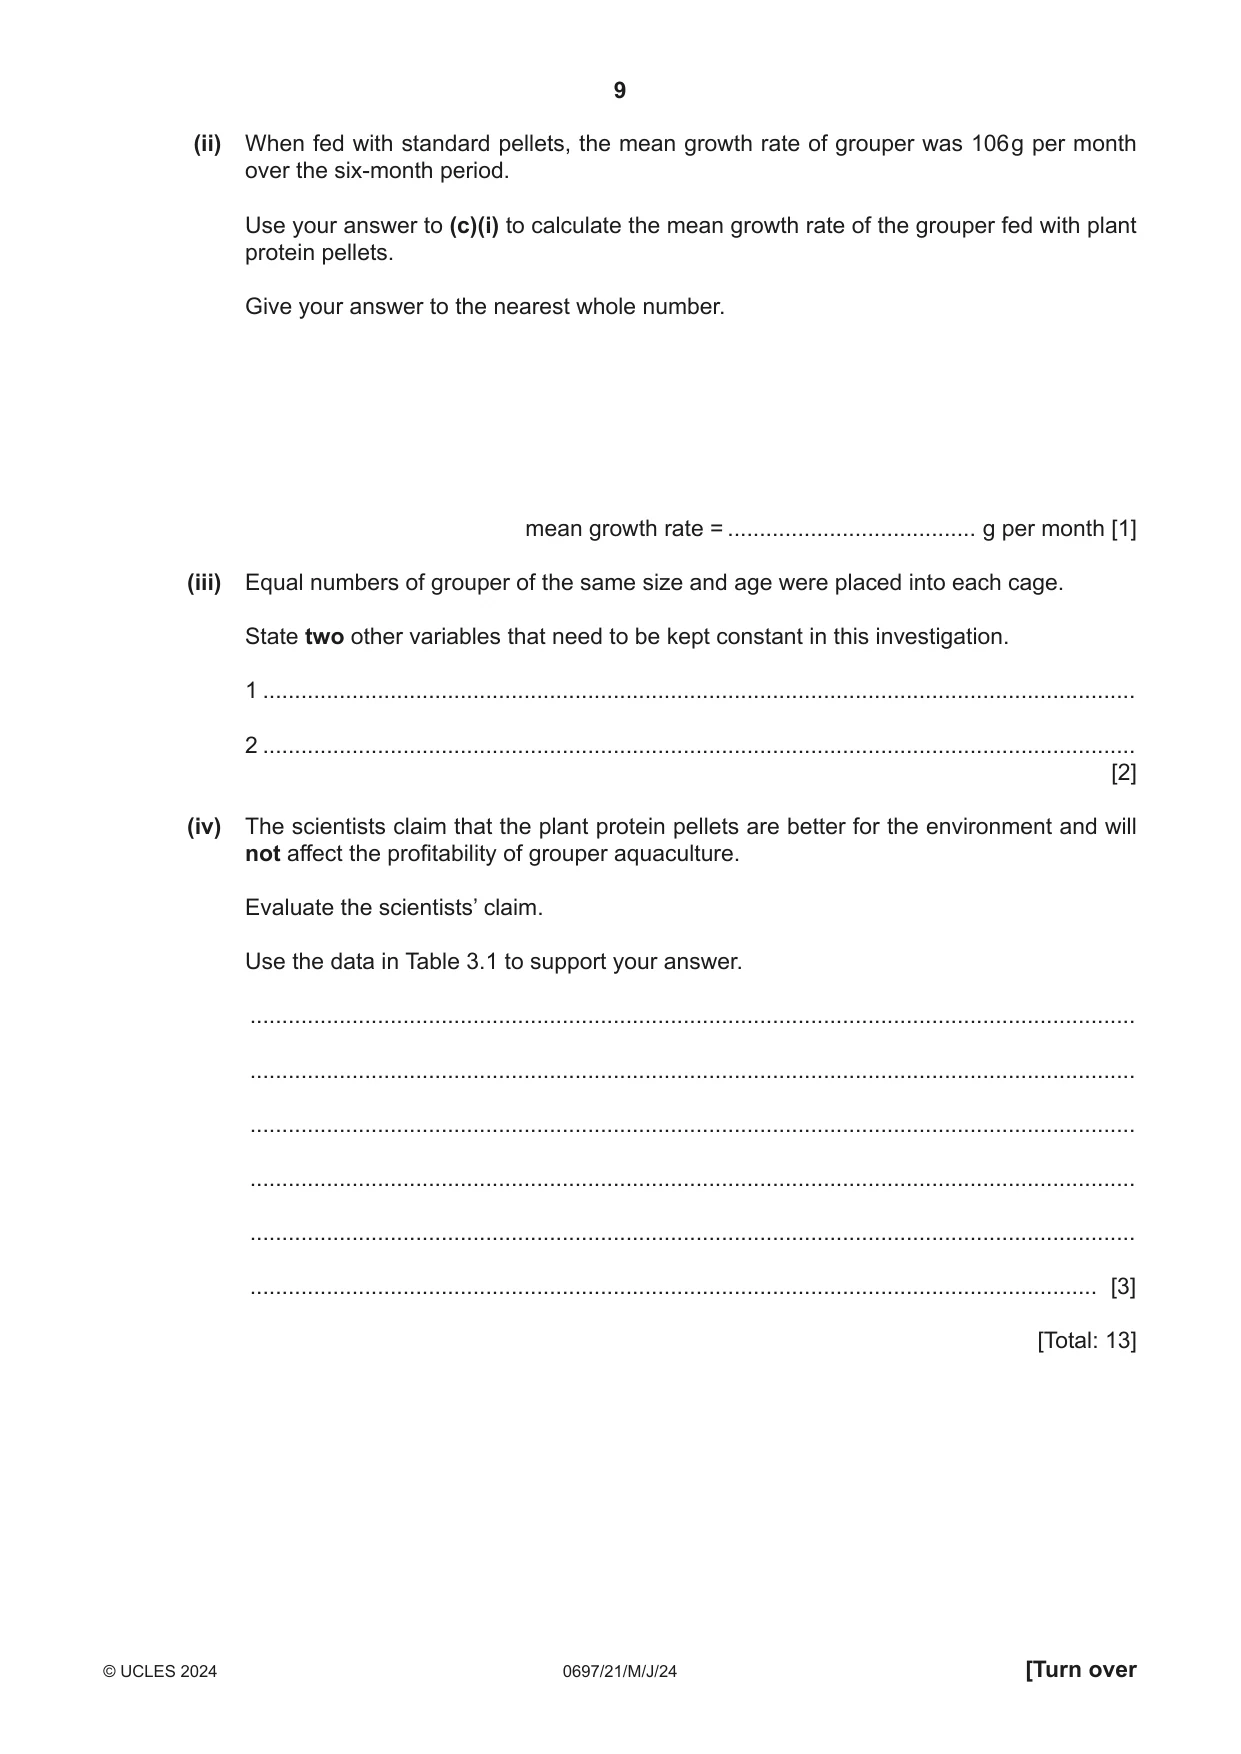
3 Aquaculture can be used to produce large quantities of grouper for human consumption. (a) Grouper provide a rich source of protein in the human diet. (i) Describe how to test a sample of a grouper for protein. ........................................................................................................................................... ........................................................................................................................................... ........................................................................................................................................... ........................................................................................................................................... ........................................................................................................................................... ..................................................................................................................................... [3] (ii) State one function of protein in the diet. ........................................................................................................................................... ..................................................................................................................................... [1] (b) Suggest two methods that are used to reduce the spread of disease in aquaculture systems. 1 ................................................................................................................................................ ................................................................................................................................................... 2 ................................................................................................................................................ ................................................................................................................................................... [2] (c) Grouper can be fed with standard pellets which are made from fish collected from the sea. Scientists investigated the growth of grouper using a new type of feed pellets made from plant protein. Two cages with grouper were set up. The grouper in one cage were fed with standard pellets. The grouper in the second cage were fed with pellets made from plant protein. Equal numbers of grouper of the same size and age were placed into each cage. The mean mass of the grouper in each cage was determined each month for six months. The results are shown in Table 3.1. Table 3.1 mean mass of grouper / g month fed with standard pellets fed with plant protein pellets 0 220 220 1 250 245 2 275 280 3 300 305 4 355 350 5 475 450 6 855 800 (i) Over six months the mean mass of grouper fed with standard pellets increased by 635 g. Calculate the increase in mean mass of grouper fed with plant protein pellets over six months. increase in mean mass = ........................................................ g [1] (ii) When fed with standard pellets, the mean growth rate of grouper was 106 g per month over the six‑month period. Use your answer to (c)(i) to calculate the mean growth rate of the grouper fed with plant protein pellets. Give your answer to the nearest whole number. mean growth rate = ....................................... g per month [1] (iii) Equal numbers of grouper of the same size and age were placed into each cage. State two other variables that need to be kept constant in this investigation. 1 ......................................................................................................................................... 2 ......................................................................................................................................... [2] (iv) The scientists claim that the plant protein pellets are better for the environment and will not affect the profitability of grouper aquaculture. Evaluate the scientists’ claim. Use the data in Table 3.1 to support your answer. ........................................................................................................................................... ........................................................................................................................................... ........................................................................................................................................... ........................................................................................................................................... ........................................................................................................................................... ..................................................................................................................................... [3] [Total: 13]
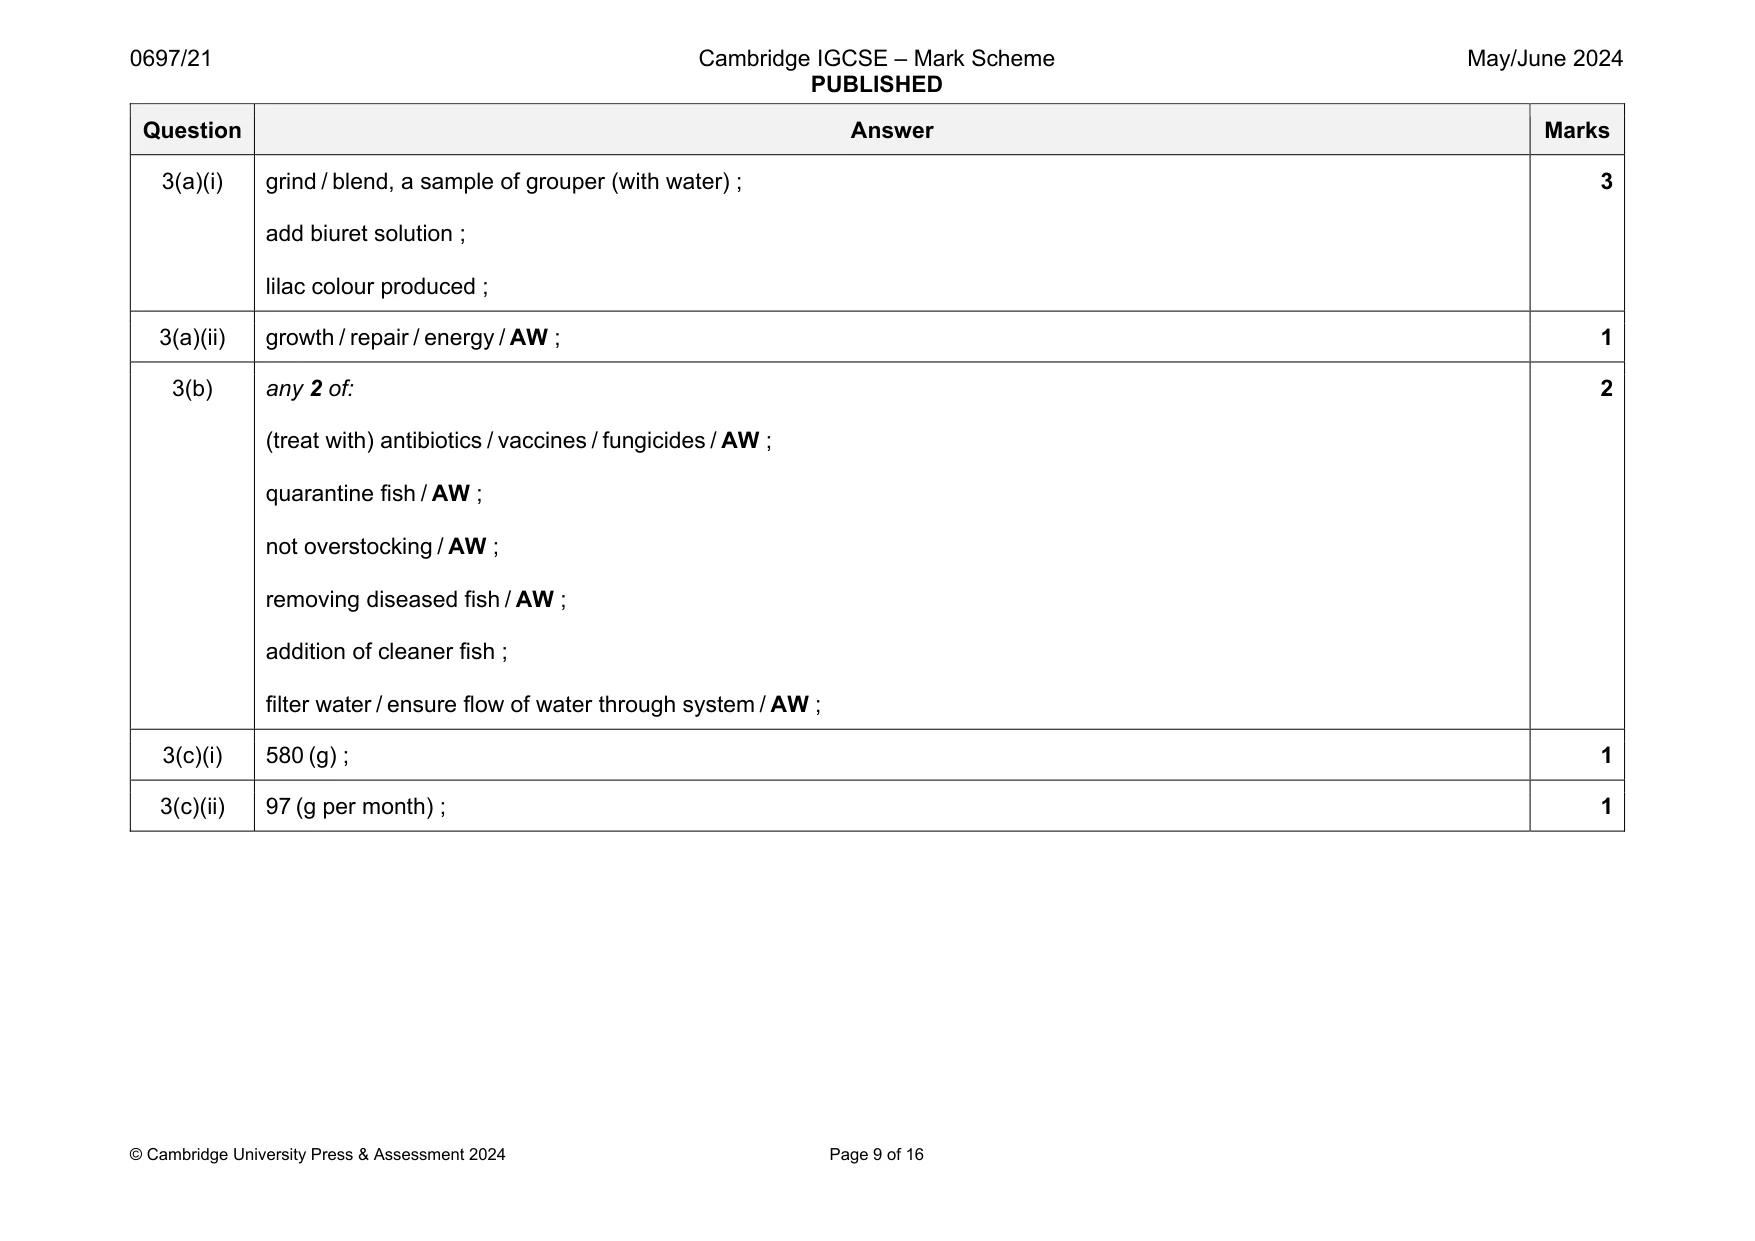
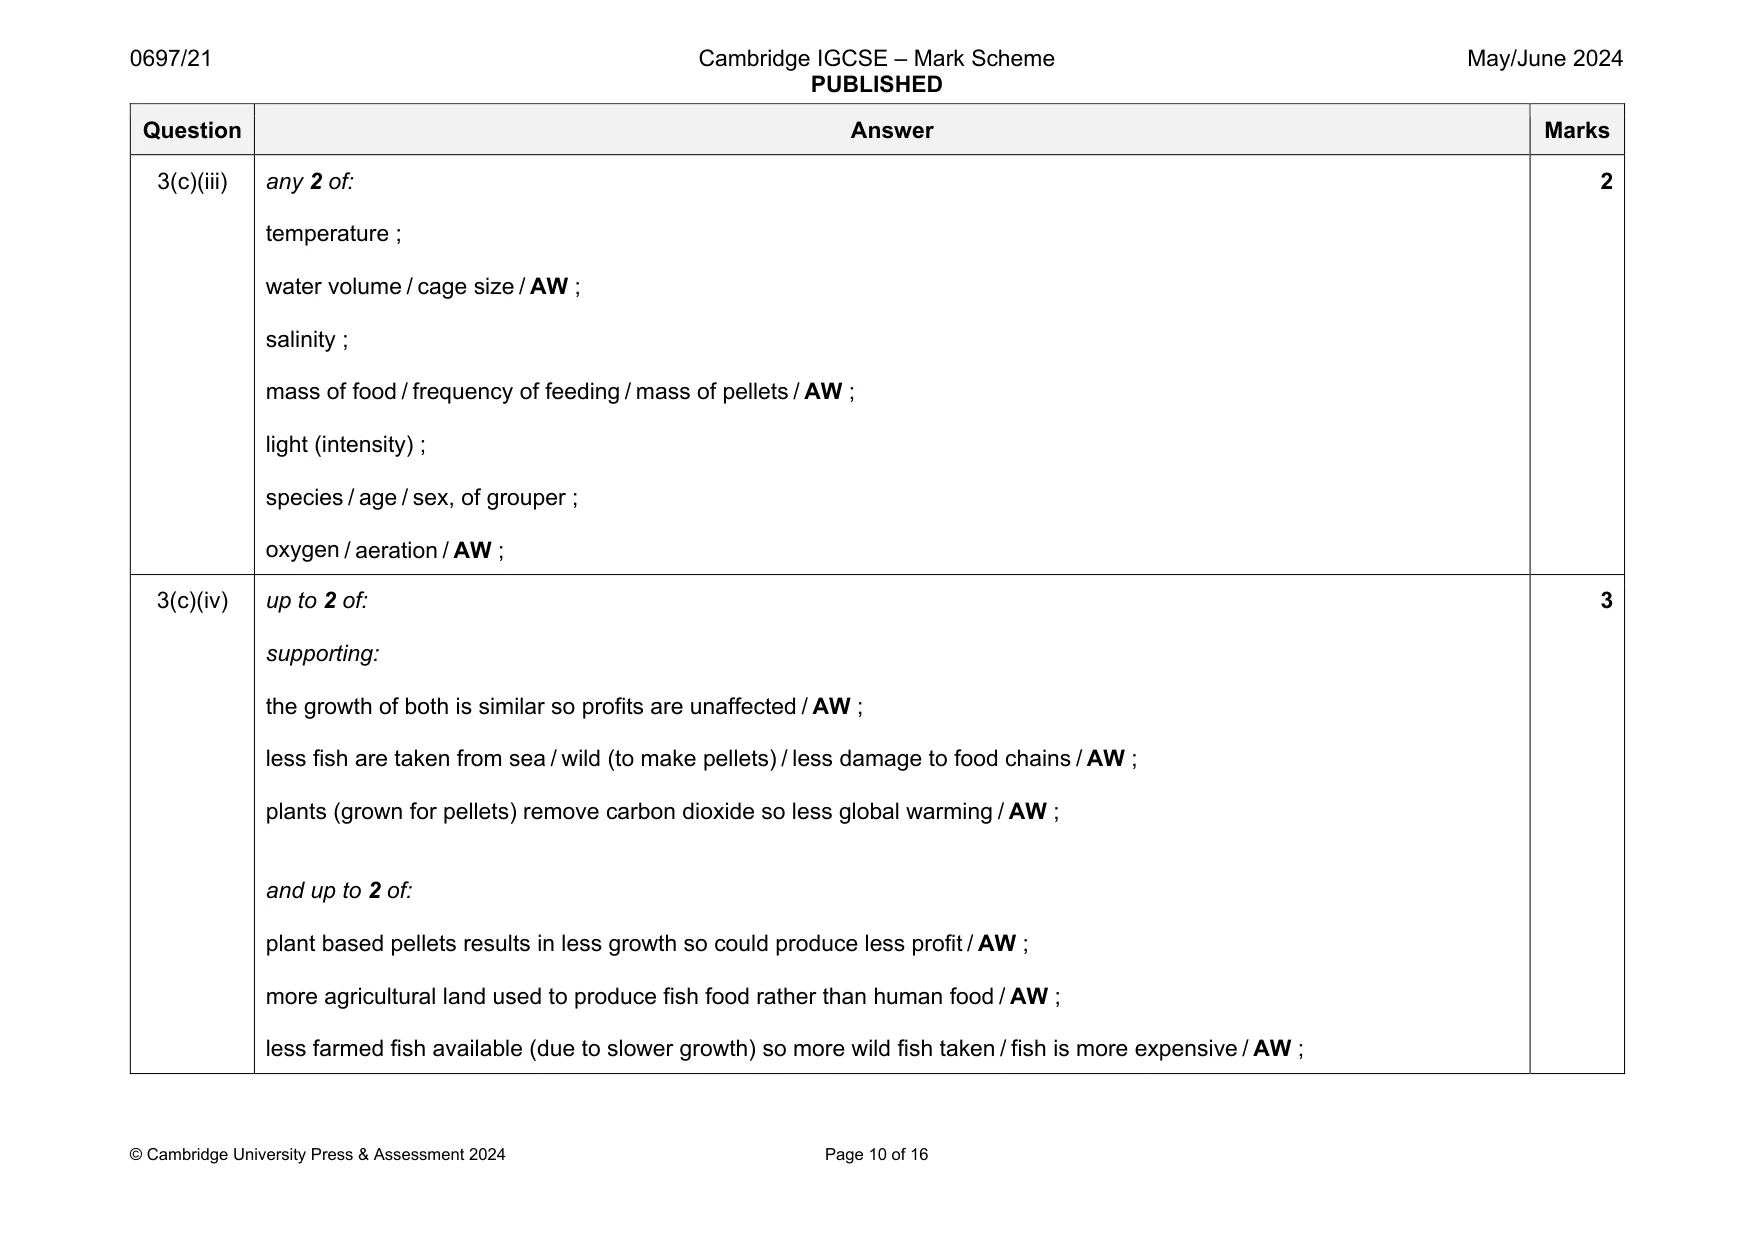
Mark scheme: 3(a)(i) grind / blend, a sample of grouper (with water) ; add biuret solution ; lilac colour produced ; 3 3(a)(ii) growth / repair / energy / AW ; 1 3(b) any 2 of: (treat with) antibiotics / vaccines / fungicides / AW ; quarantine fish / AW ; not overstocking / AW ; removing diseased fish / AW ; addition of cleaner fish ; filter water / ensure flow of water through system / AW ; 2 3(c)(i) 580 (g) ; 1 3(c)(ii) 97 (g per month) ; 1 Question Answer Marks 3(c)(iii) any 2 of: temperature ; water volume / cage size / AW ; salinity ; mass of food / frequency of feeding / mass of pellets / AW ; light (intensity) ; species / age / sex, of grouper ; oxygen / aeration / AW ; 2 3(c)(iv) up to 2 of: supporting: the growth of both is similar so profits are unaffected / AW ; less fish are taken from sea / wild (to make pellets) / less damage to food chains / AW ; plants (grown for pellets) remove carbon dioxide so less global warming / AW ; and up to 2 of: plant based pellets results in less growth so could produce less profit / AW ; more agricultural land used to produce fish food rather than human food / AW ; less farmed fish available (due to slower growth) so more wild fish taken / fish is more expensive / AW ; 3
Q4 · A student investigates the distribution of lugworms and clams in the intertidal zone of a…
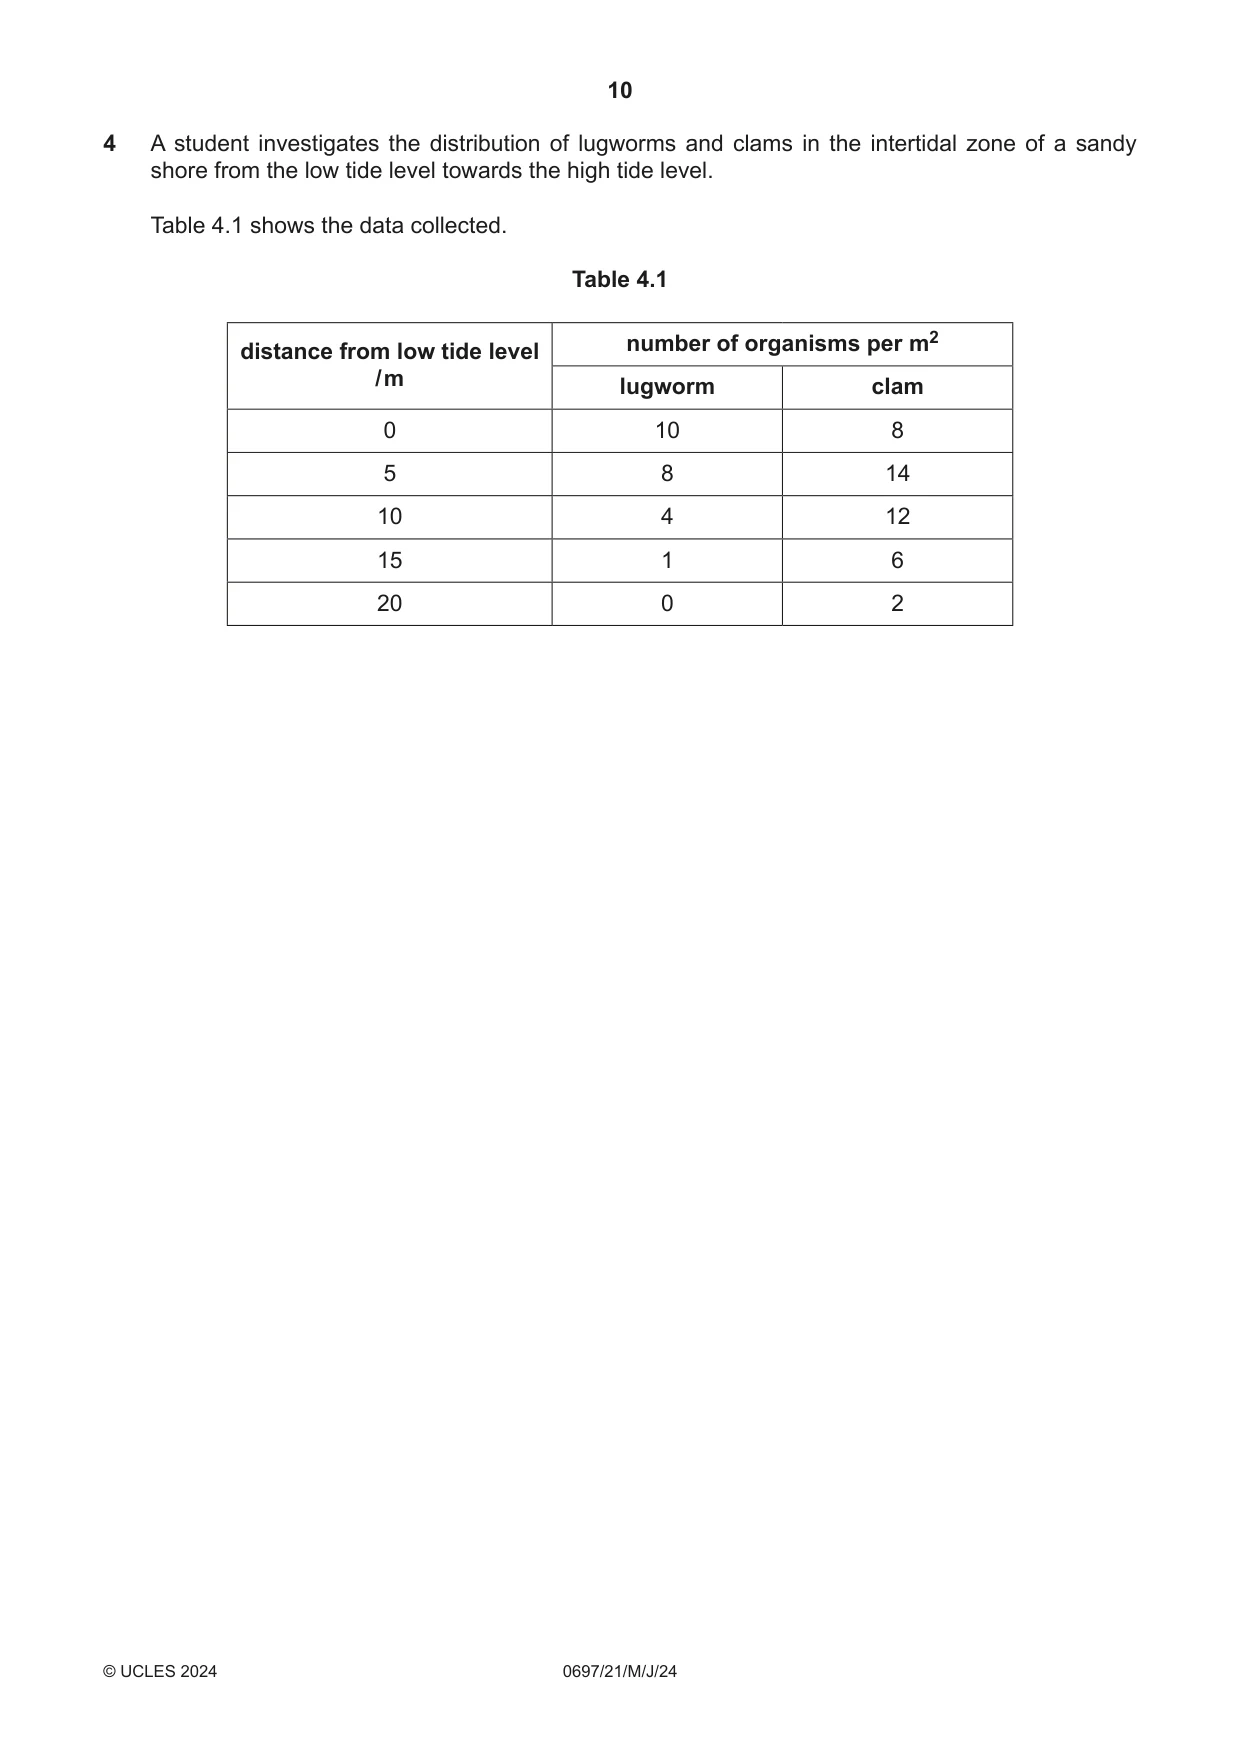
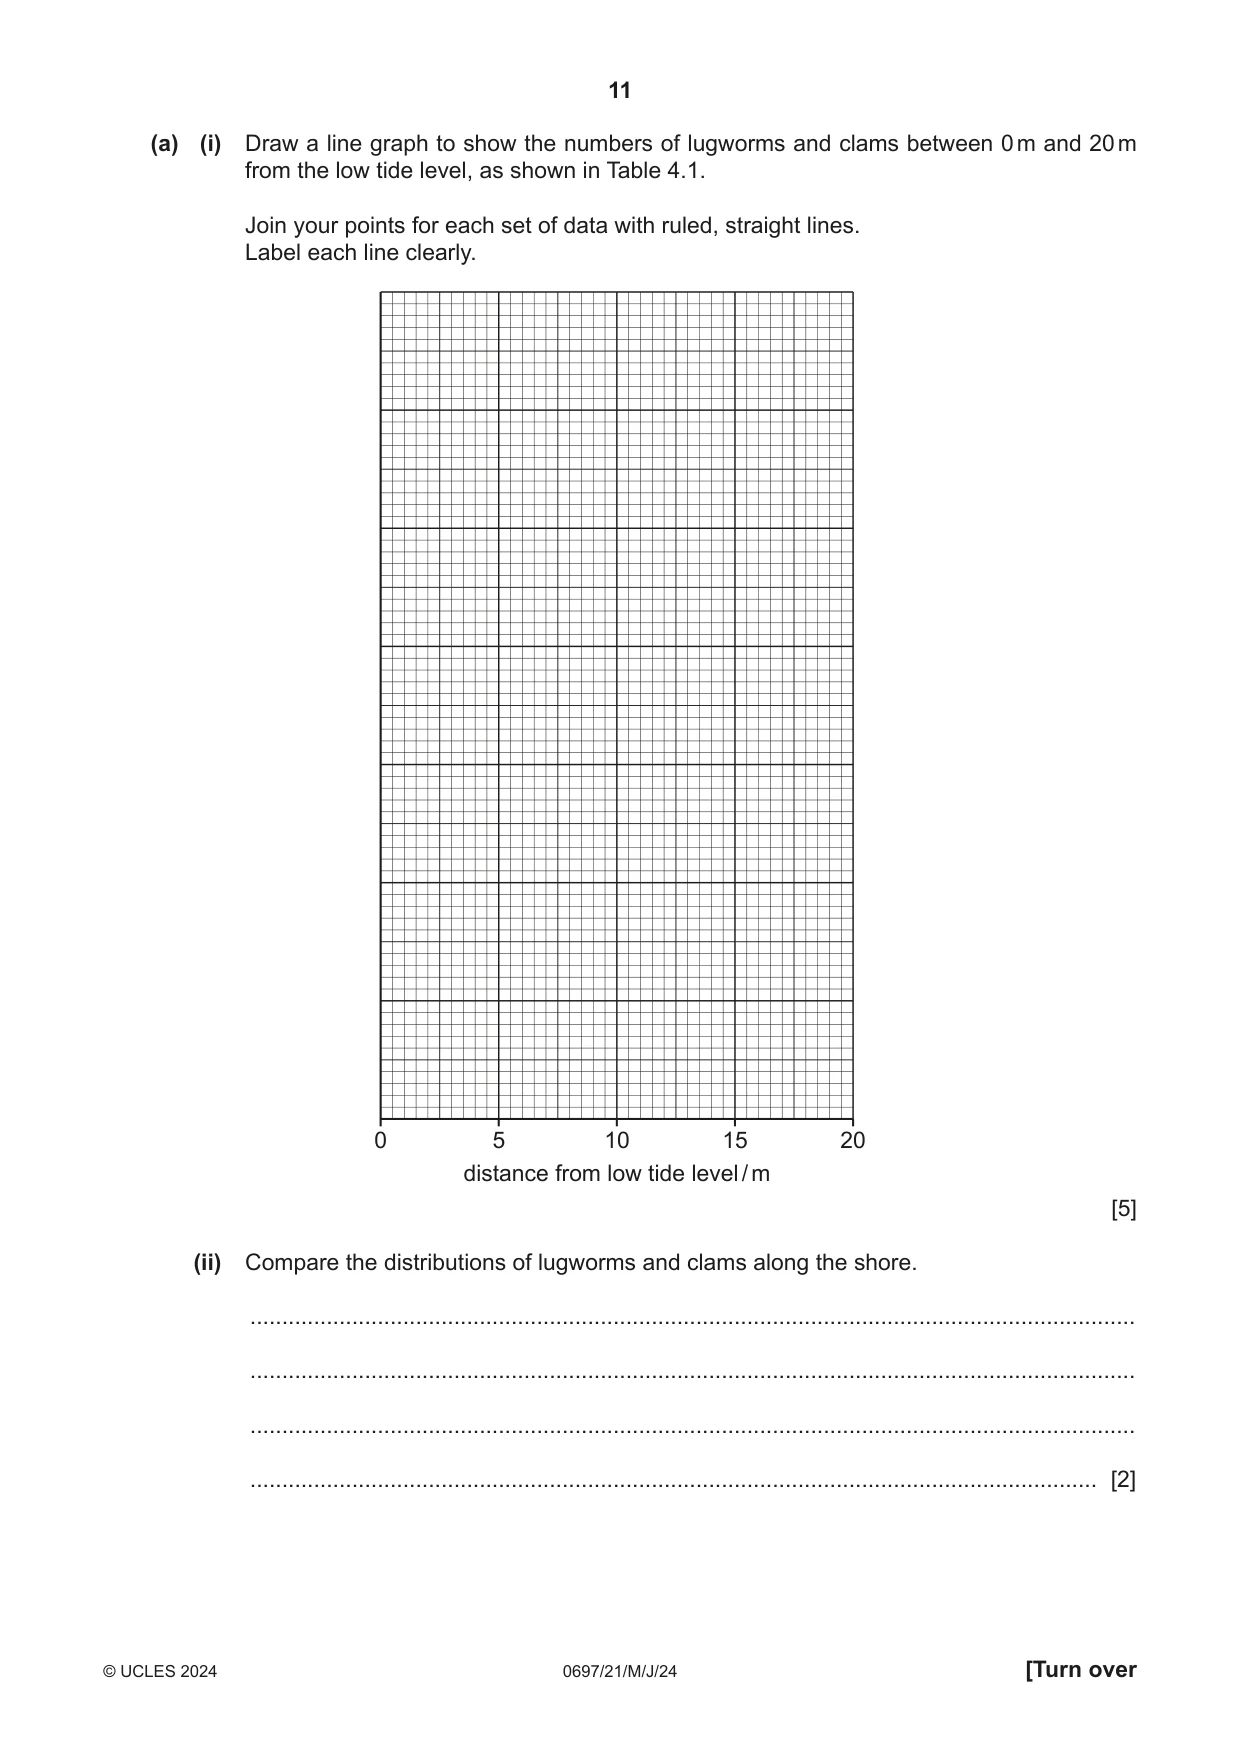
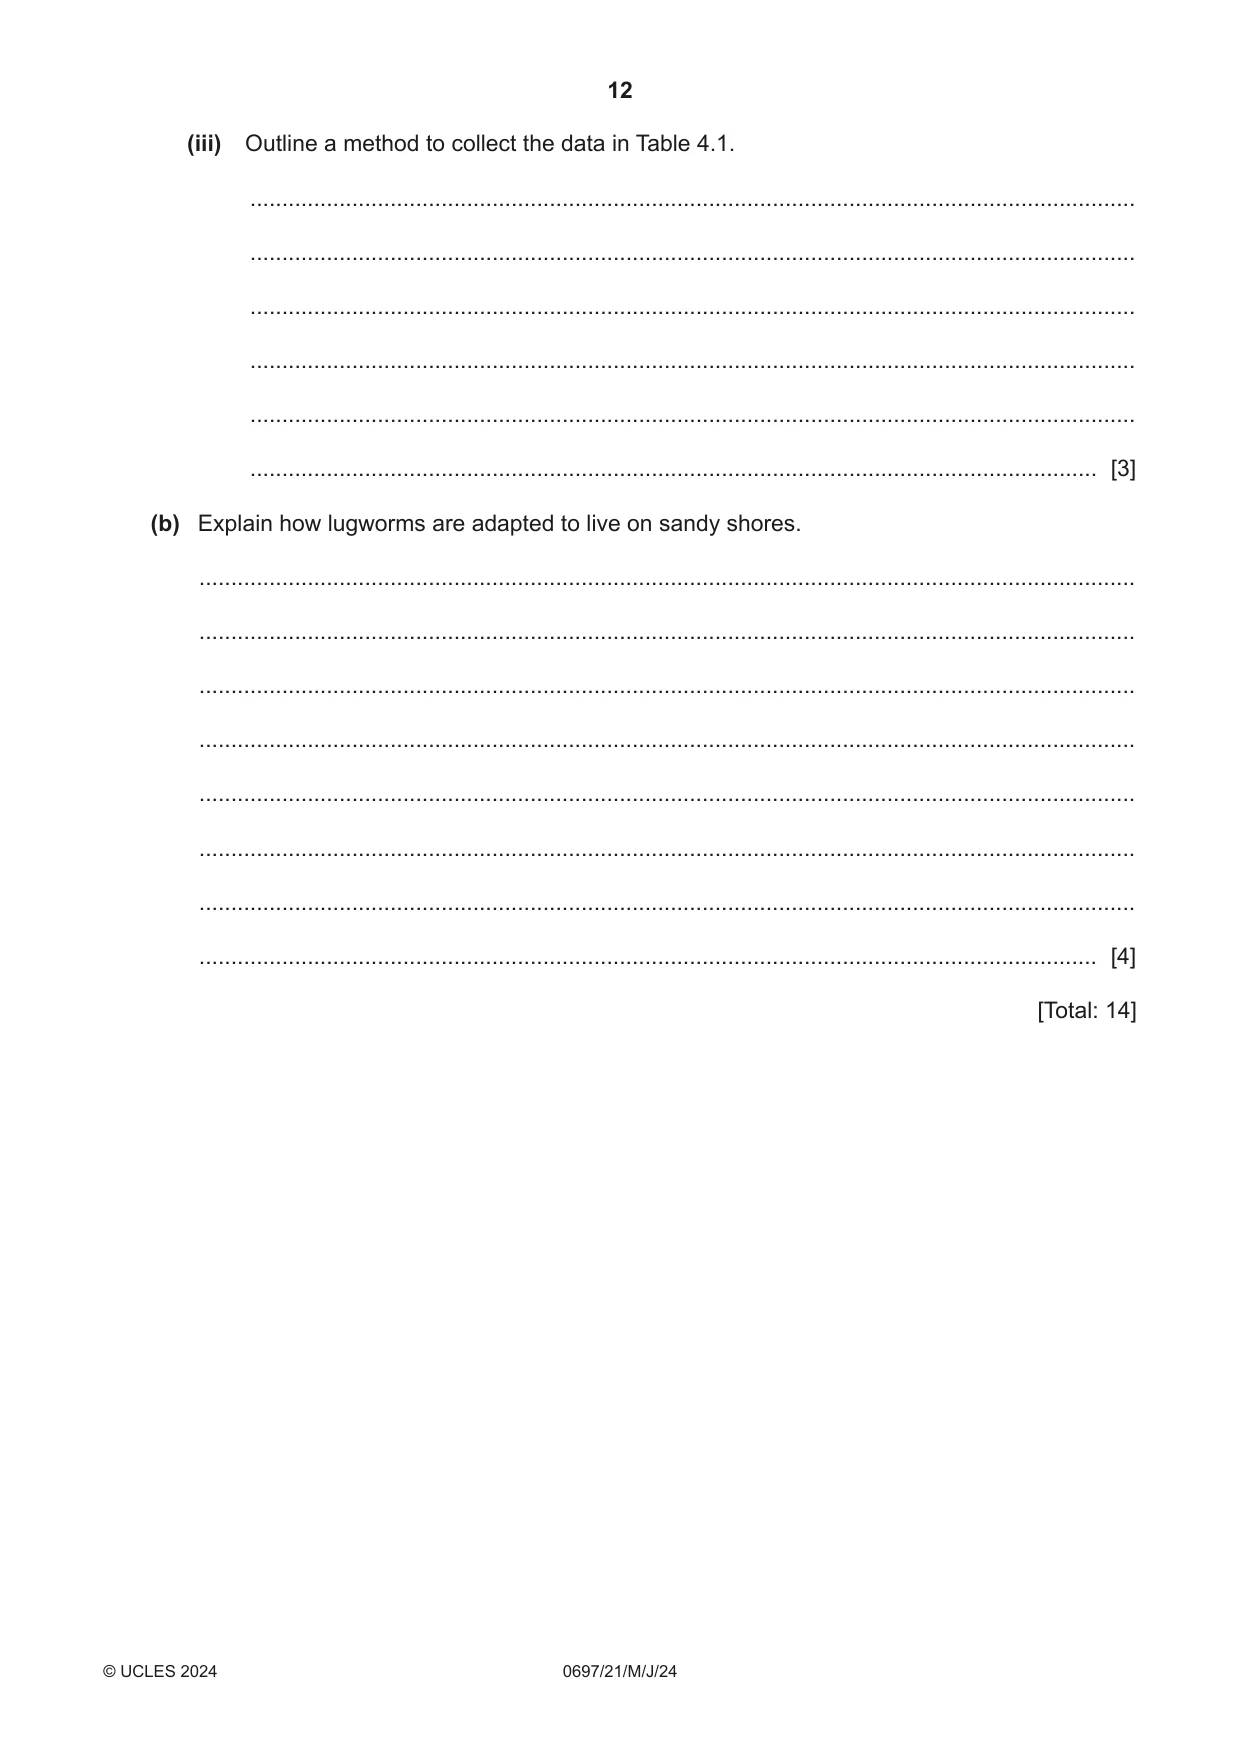
4 A student investigates the distribution of lugworms and clams in the intertidal zone of a sandy shore from the low tide level towards the high tide level. Table 4.1 shows the data collected. Table 4.1 number of organisms per m2 distance from low tide level / m lugworm clam 0 10 8 5 8 14 10 4 12 15 1 6 20 0 2 (a) (i) Draw a line graph to show the numbers of lugworms and clams between 0 m and 20 m from the low tide level, as shown in Table 4.1. Join your points for each set of data with ruled, straight lines. Label each line clearly. 0 5 10 15 20 distance from low tide level / m [5] (ii) Compare the distributions of lugworms and clams along the shore. ........................................................................................................................................... ........................................................................................................................................... ........................................................................................................................................... ..................................................................................................................................... [2] (iii) Outline a method to collect the data in Table 4.1. ........................................................................................................................................... ........................................................................................................................................... ........................................................................................................................................... ........................................................................................................................................... ........................................................................................................................................... ..................................................................................................................................... [3] (b) Explain how lugworms are adapted to live on sandy shores. ................................................................................................................................................... ................................................................................................................................................... ................................................................................................................................................... ................................................................................................................................................... ................................................................................................................................................... ................................................................................................................................................... ................................................................................................................................................... ............................................................................................................................................. [4] [Total: 14] Question 5 starts on the next page.
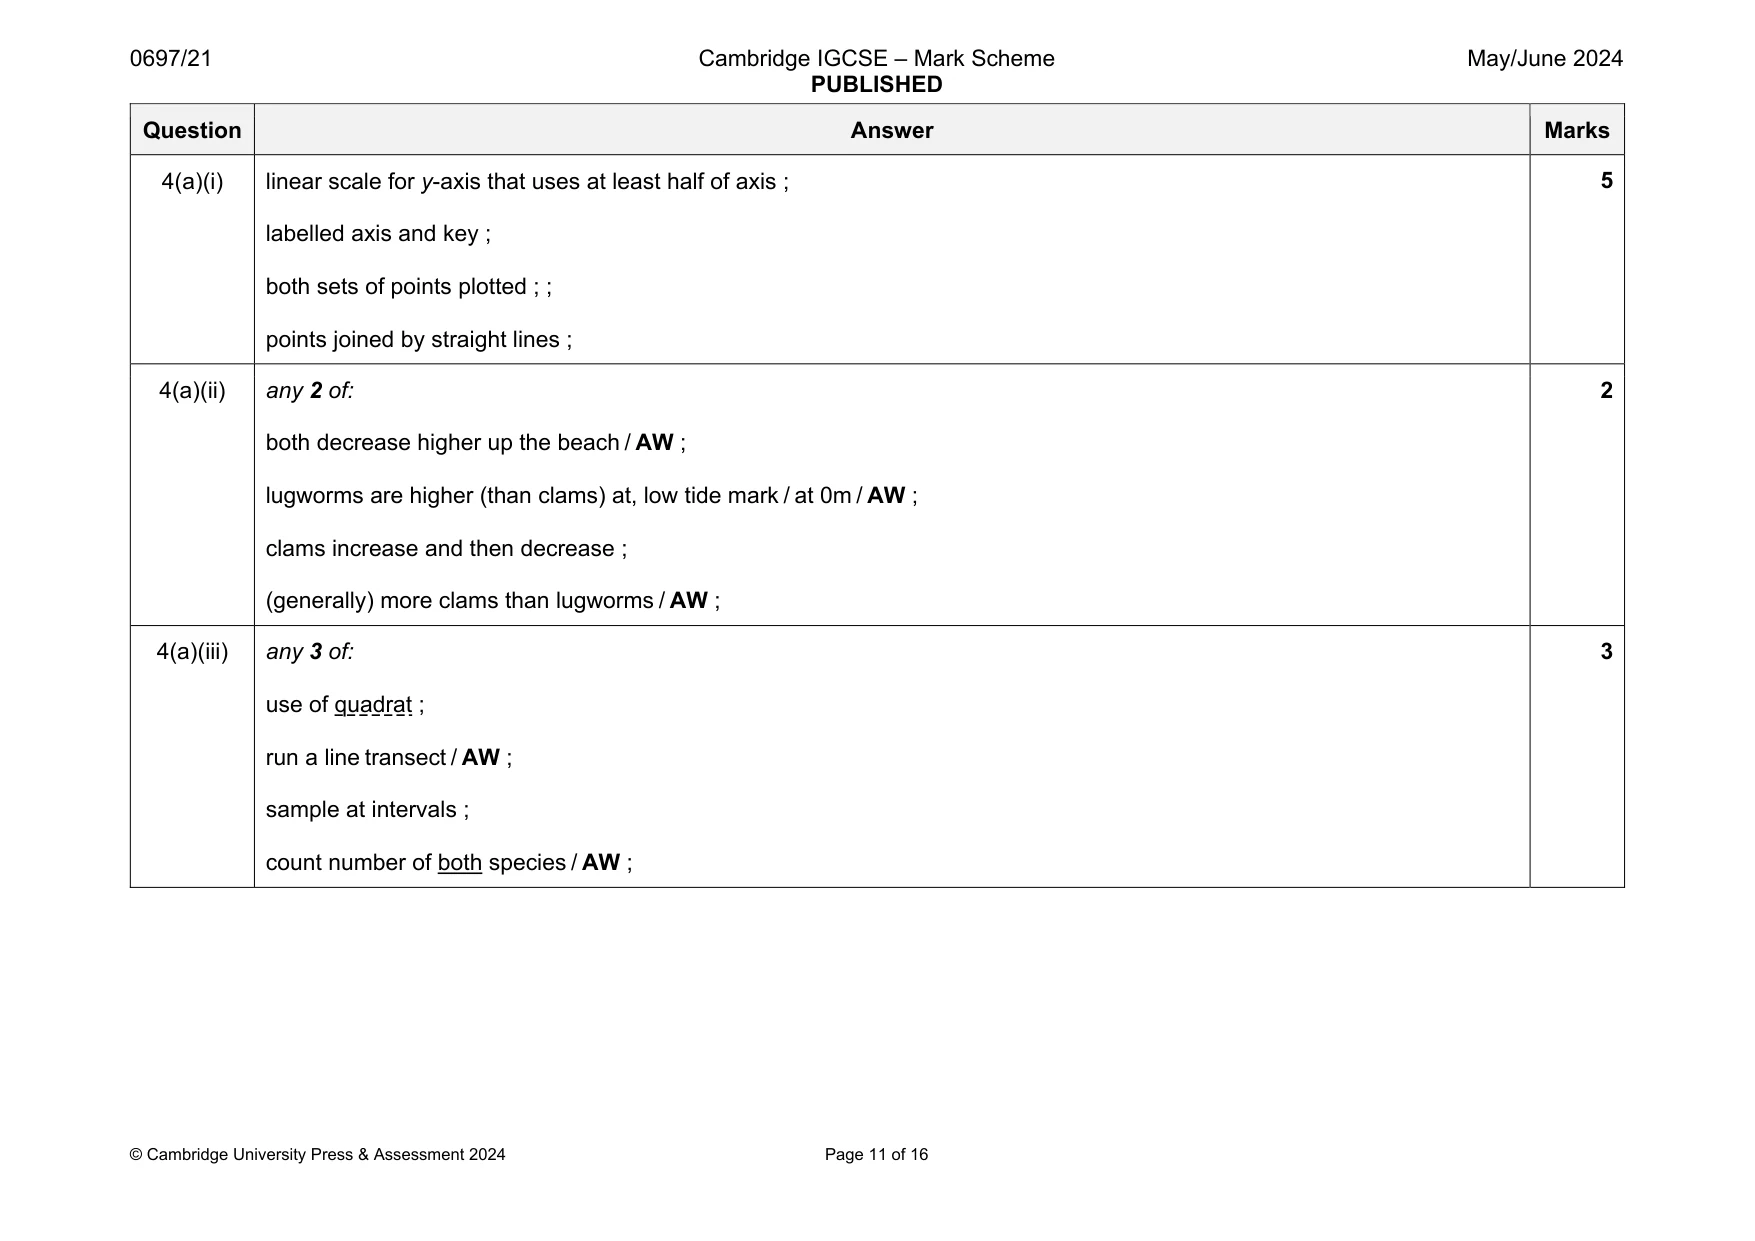
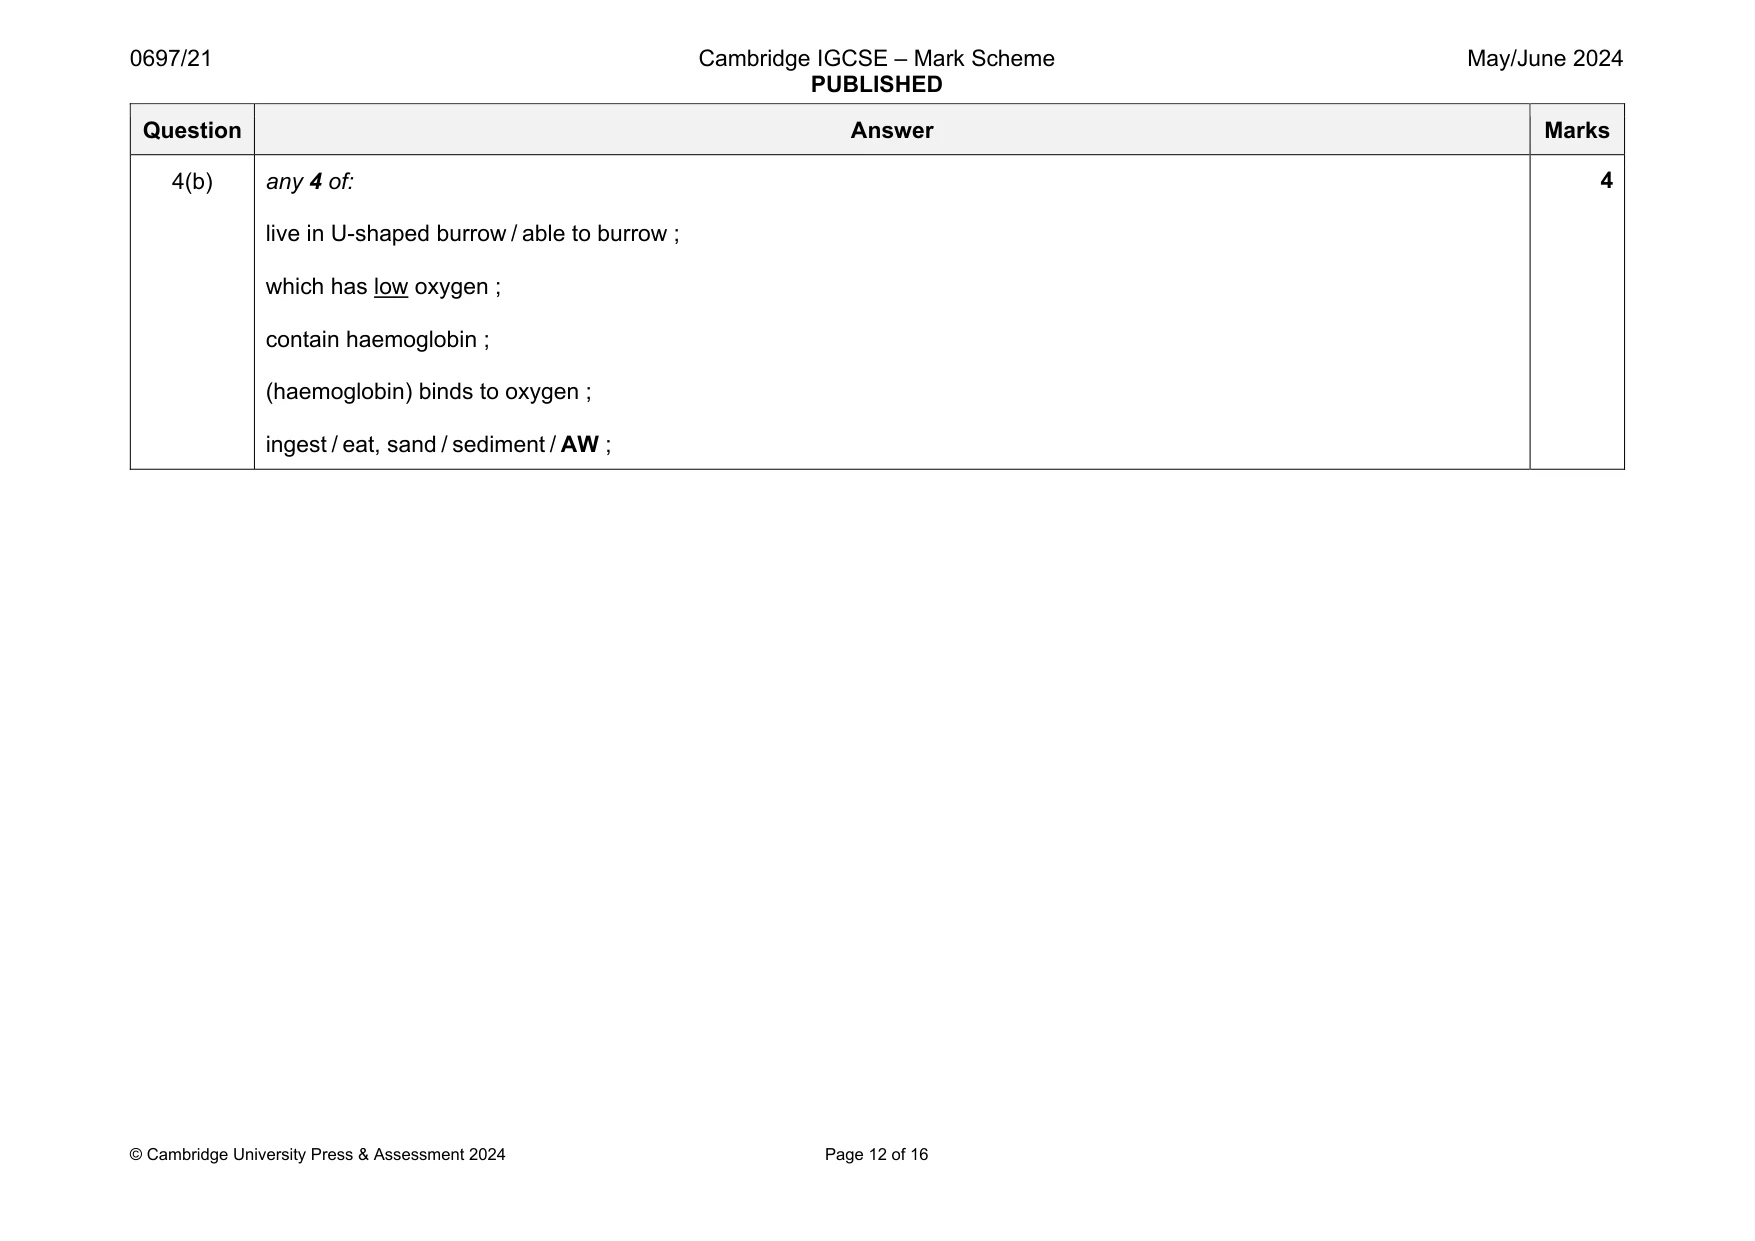
Mark scheme: 4(a)(i) linear scale for y-axis that uses at least half of axis ; labelled axis and key ; both sets of points plotted ; ; points joined by straight lines ; 4(a)(ii) any 2 of: both decrease higher up the beach / AW ; lugworms are higher (than clams) at, low tide mark / at 0m / AW ; clams increase and then decrease ; (generally) more clams than lugworms / AW ; 2 4(a)(iii) any 3 of: use of quadrat ; run a line transect / AW ; sample at intervals ; count number of both species / AW ; 3 Question Answer Marks 4(b) any 4 of: live in U-shaped burrow / able to burrow ; which has low oxygen ; contain haemoglobin ; (haemoglobin) binds to oxygen ; ingest / eat, sand / sediment / AW ; 4
Q5 · Nutrients, such as nitrogen, cycle through marine ecosystems
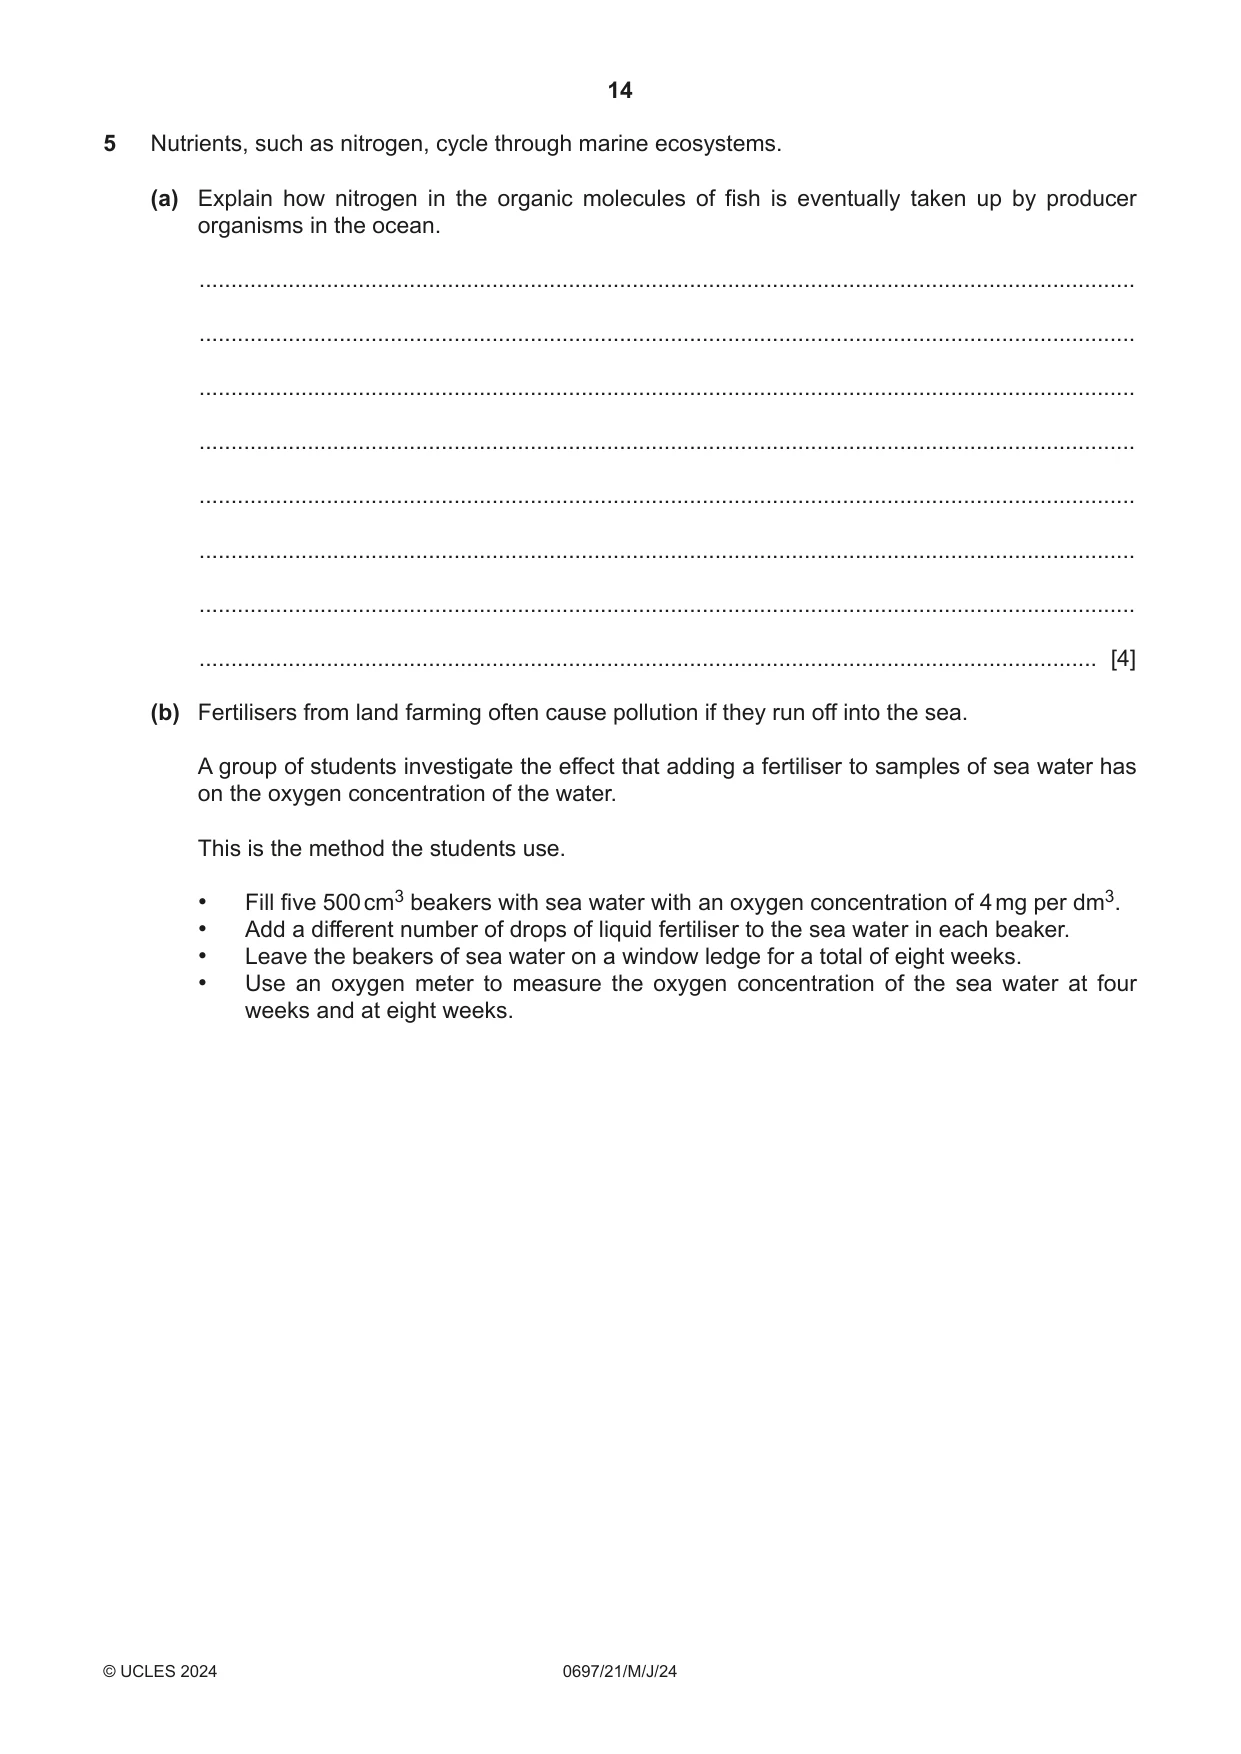
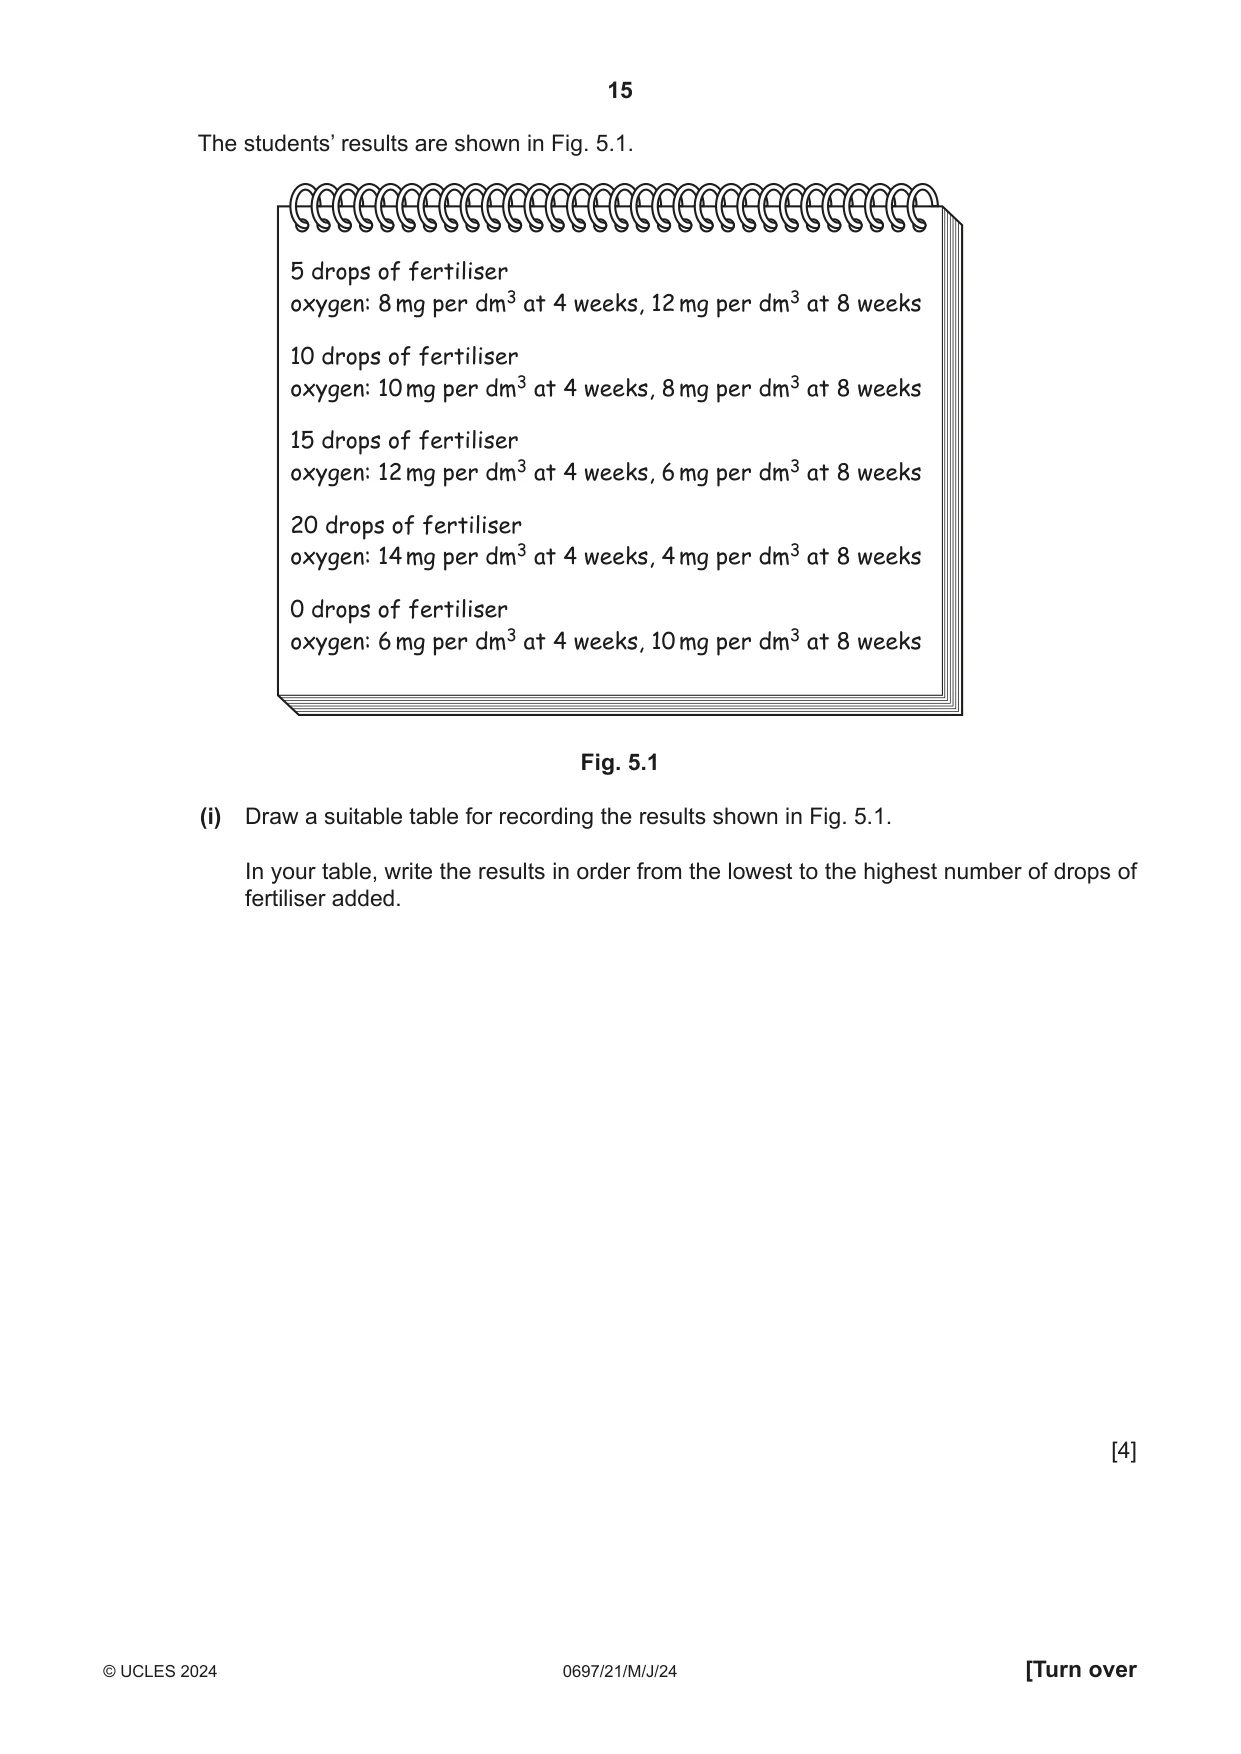
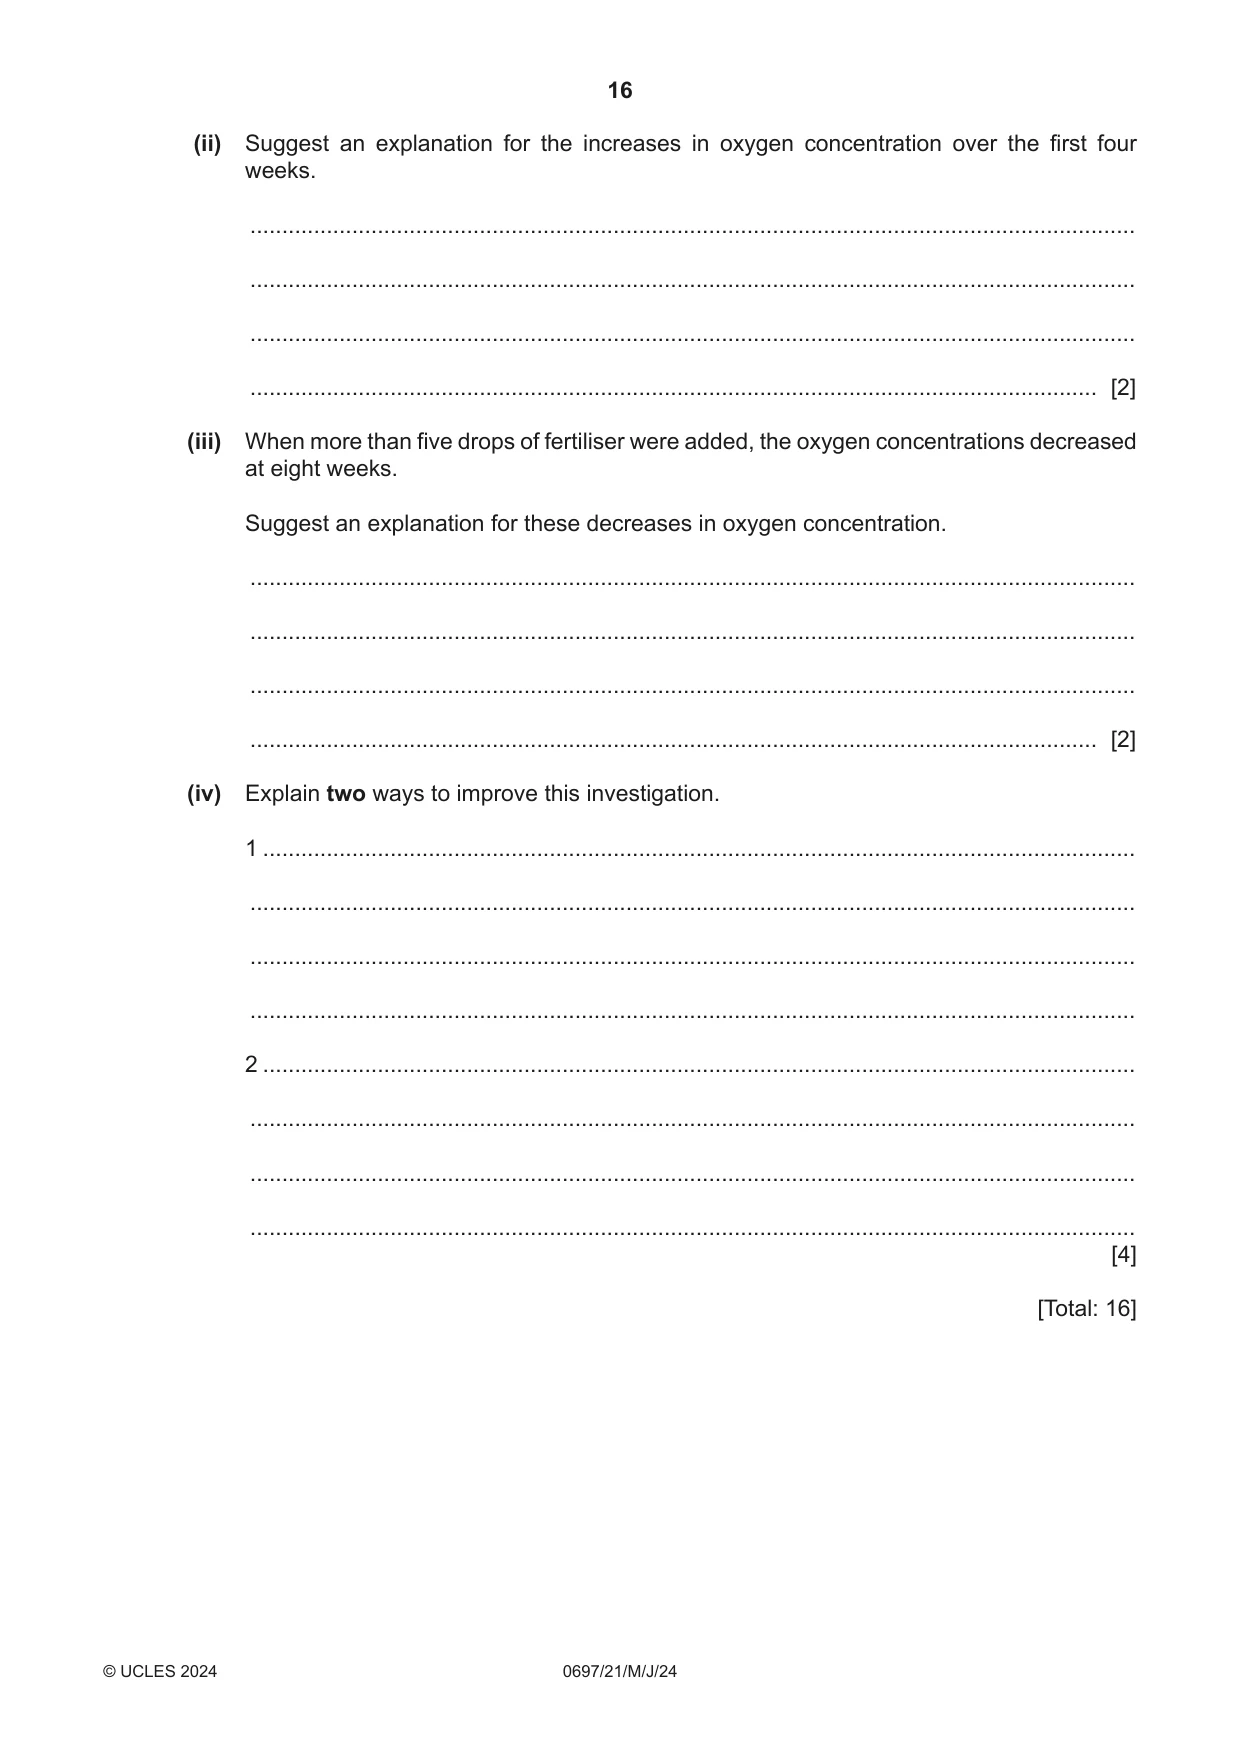
5 Nutrients, such as nitrogen, cycle through marine ecosystems. (a) Explain how nitrogen in the organic molecules of fish is eventually taken up by producer organisms in the ocean. ................................................................................................................................................... ................................................................................................................................................... ................................................................................................................................................... ................................................................................................................................................... ................................................................................................................................................... ................................................................................................................................................... ................................................................................................................................................... ............................................................................................................................................. [4] (b) Fertilisers from land farming often cause pollution if they run off into the sea. A group of students investigate the effect that adding a fertiliser to samples of sea water has on the oxygen concentration of the water. This is the method the students use. • Fill five 500 cm3 beakers with sea water with an oxygen concentration of 4 mg per dm3. • Add a different number of drops of liquid fertiliser to the sea water in each beaker. • Leave the beakers of sea water on a window ledge for a total of eight weeks. • Use an oxygen meter to measure the oxygen concentration of the sea water at four weeks and at eight weeks. The students’ results are shown in Fig. 5.1. 5 drops of fertiliser oxygen: 8 mg per dm3 at 4 weeks, 12 mg per dm3 at 8 weeks 10 drops of fertiliser oxygen: 10 mg per dm3 at 4 weeks, 8 mg per dm3 at 8 weeks 15 drops of fertiliser oxygen: 12 mg per dm3 at 4 weeks, 6 mg per dm3 at 8 weeks 20 drops of fertiliser oxygen: 14 mg per dm3 at 4 weeks, 4 mg per dm3 at 8 weeks 0 drops of fertiliser oxygen: 6 mg per dm3 at 4 weeks, 10 mg per dm3 at 8 weeks Fig. 5.1 (i) Draw a suitable table for recording the results shown in Fig. 5.1. In your table, write the results in order from the lowest to the highest number of drops of fertiliser added. [4] (ii) Suggest an explanation for the increases in oxygen concentration over the first four weeks. ........................................................................................................................................... ........................................................................................................................................... ........................................................................................................................................... ..................................................................................................................................... [2] (iii) When more than five drops of fertiliser were added, the oxygen concentrations decreased at eight weeks. Suggest an explanation for these decreases in oxygen concentration. ........................................................................................................................................... ........................................................................................................................................... ........................................................................................................................................... ..................................................................................................................................... [2] (iv) Explain two ways to improve this investigation. 1 ......................................................................................................................................... ........................................................................................................................................... ........................................................................................................................................... ........................................................................................................................................... 2 ......................................................................................................................................... ........................................................................................................................................... ........................................................................................................................................... ........................................................................................................................................... [4] [Total: 16] Question 6 starts on the next page.
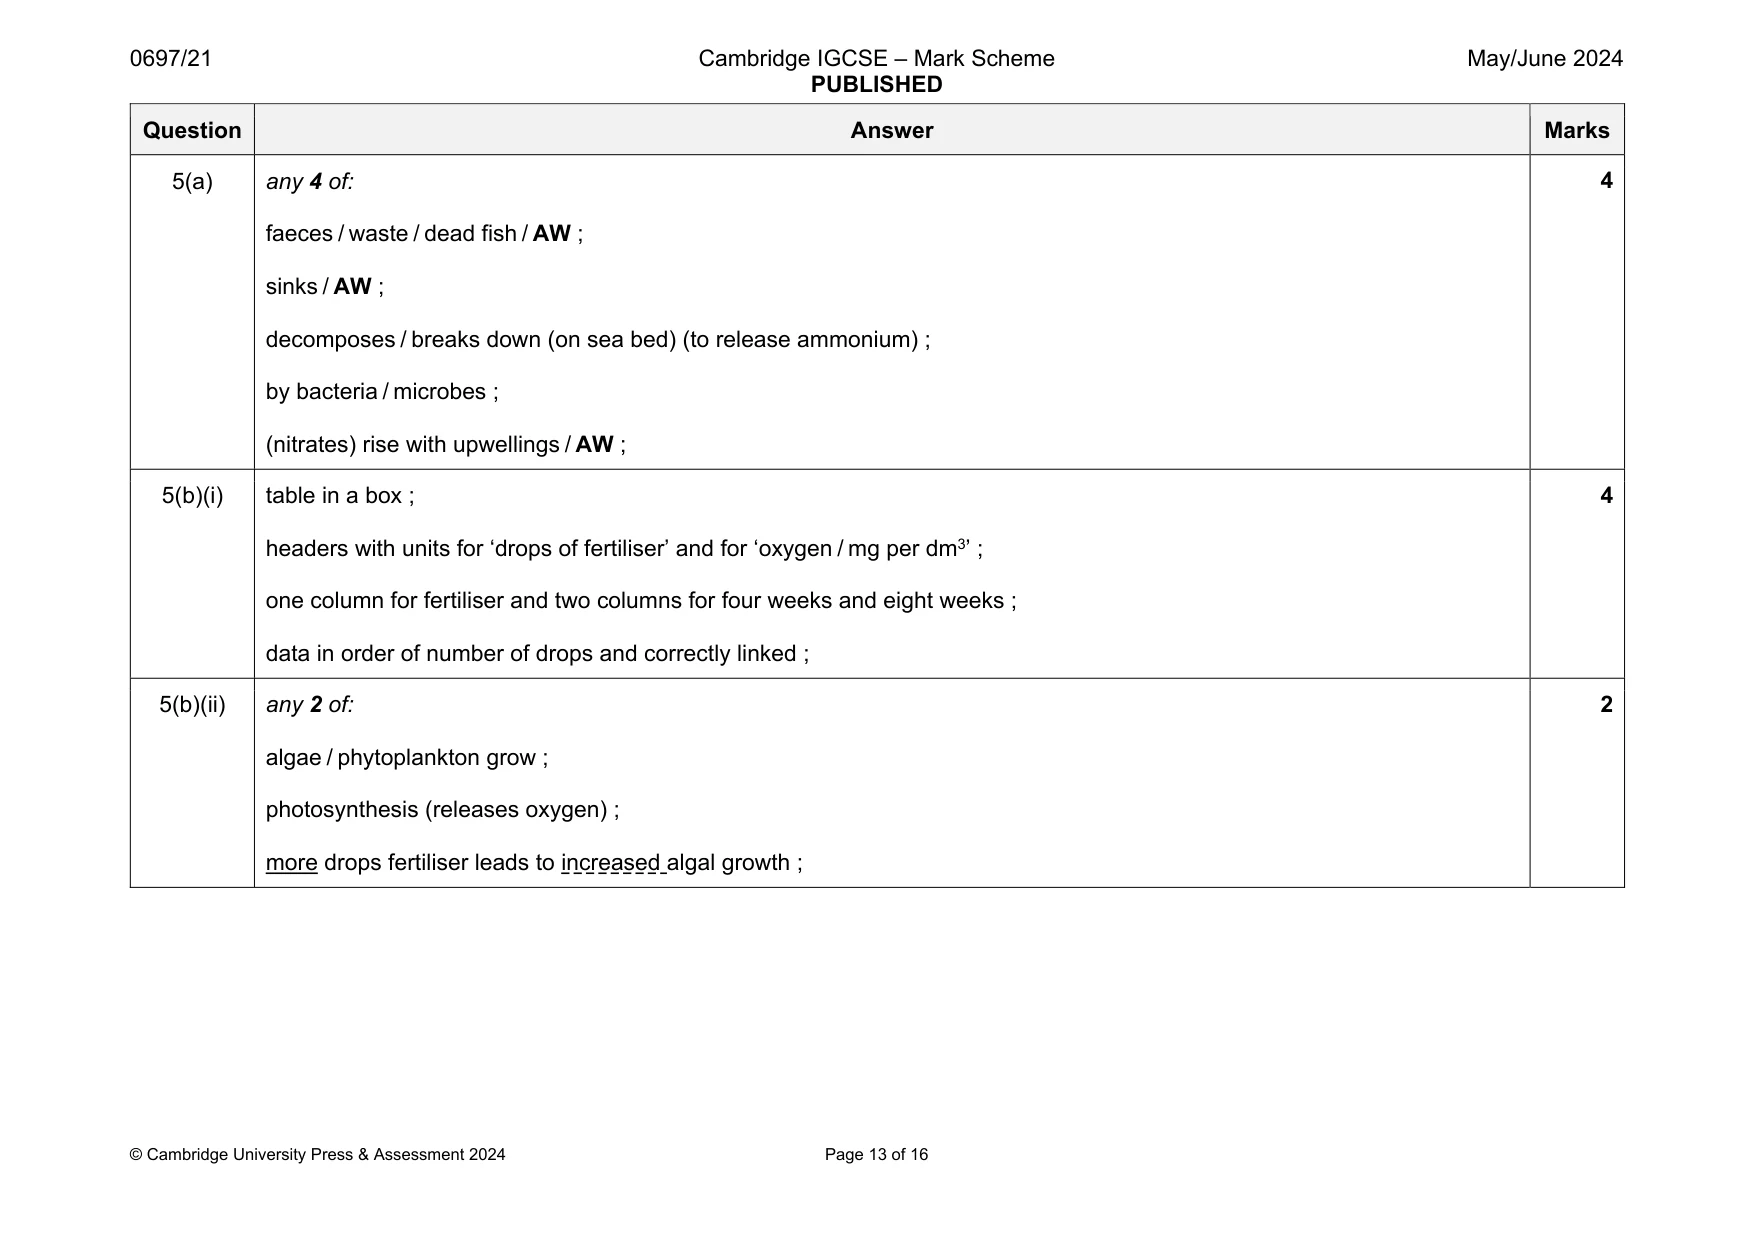
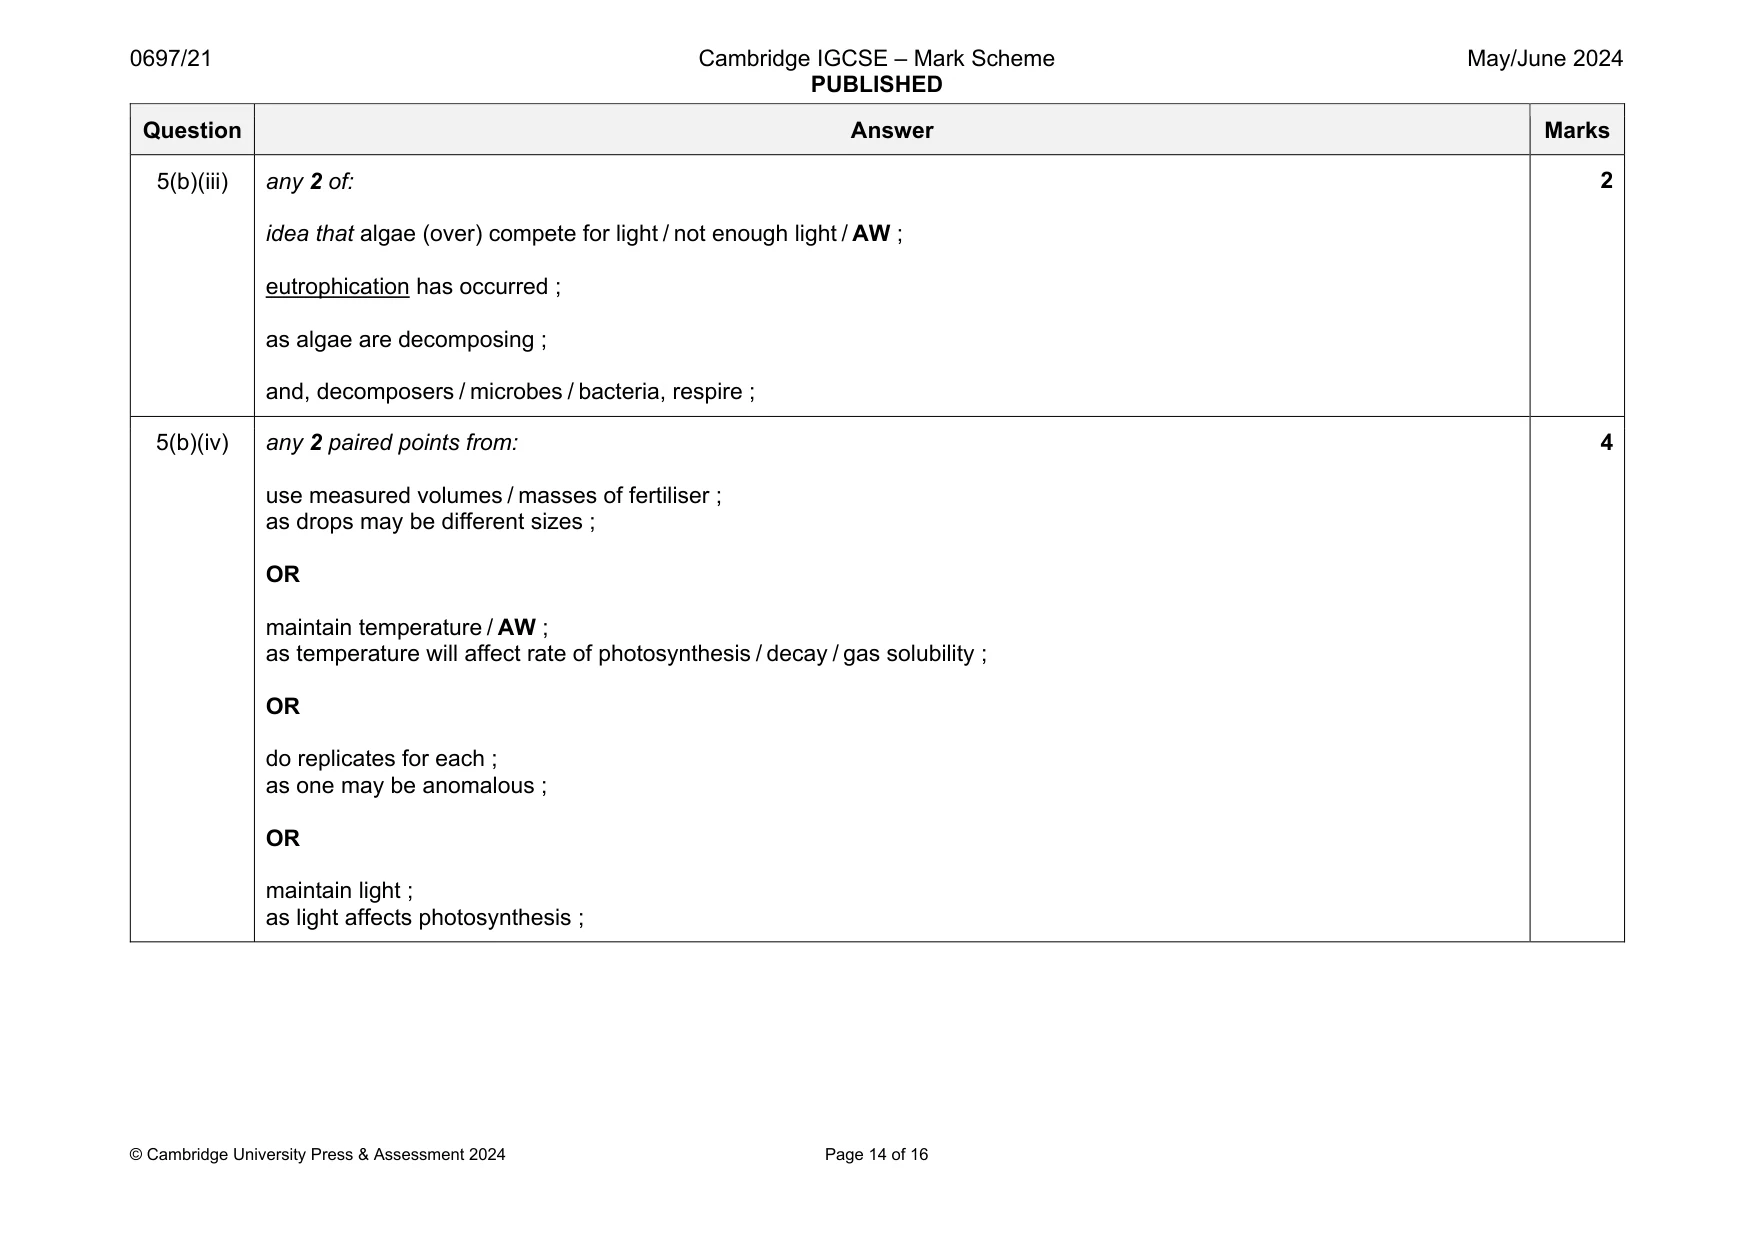
Mark scheme: 5(a) any 4 of: faeces / waste / dead fish / AW ; sinks / AW ; decomposes / breaks down (on sea bed) (to release ammonium) ; by bacteria / microbes ; (nitrates) rise with upwellings / AW ; 5(b)(i) table in a box ; headers with units for ‘drops of fertiliser’ and for ‘oxygen / mg per dm3’ ; one column for fertiliser and two columns for four weeks and eight weeks ; data in order of number of drops and correctly linked ; 4 5(b)(ii) any 2 of: algae / phytoplankton grow ; photosynthesis (releases oxygen) ; more drops fertiliser leads to increased algal growth ; 2 Question Answer Marks 5(b)(iii) any 2 of: idea that algae (over) compete for light / not enough light / AW ; eutrophication has occurred ; as algae are decomposing ; and, decomposers / microbes / bacteria, respire ; 2 5(b)(iv) any 2 paired points from: use measured volumes / masses of fertiliser ; as drops may be different sizes ; OR maintain temperature / AW ; as temperature will affect rate of photosynthesis / decay / gas solubility ; OR do replicates for each ; as one may be anomalous ; OR maintain light ; as light affects photosynthesis ; 4
Q6 · Pelagic trawling is a method of fishing
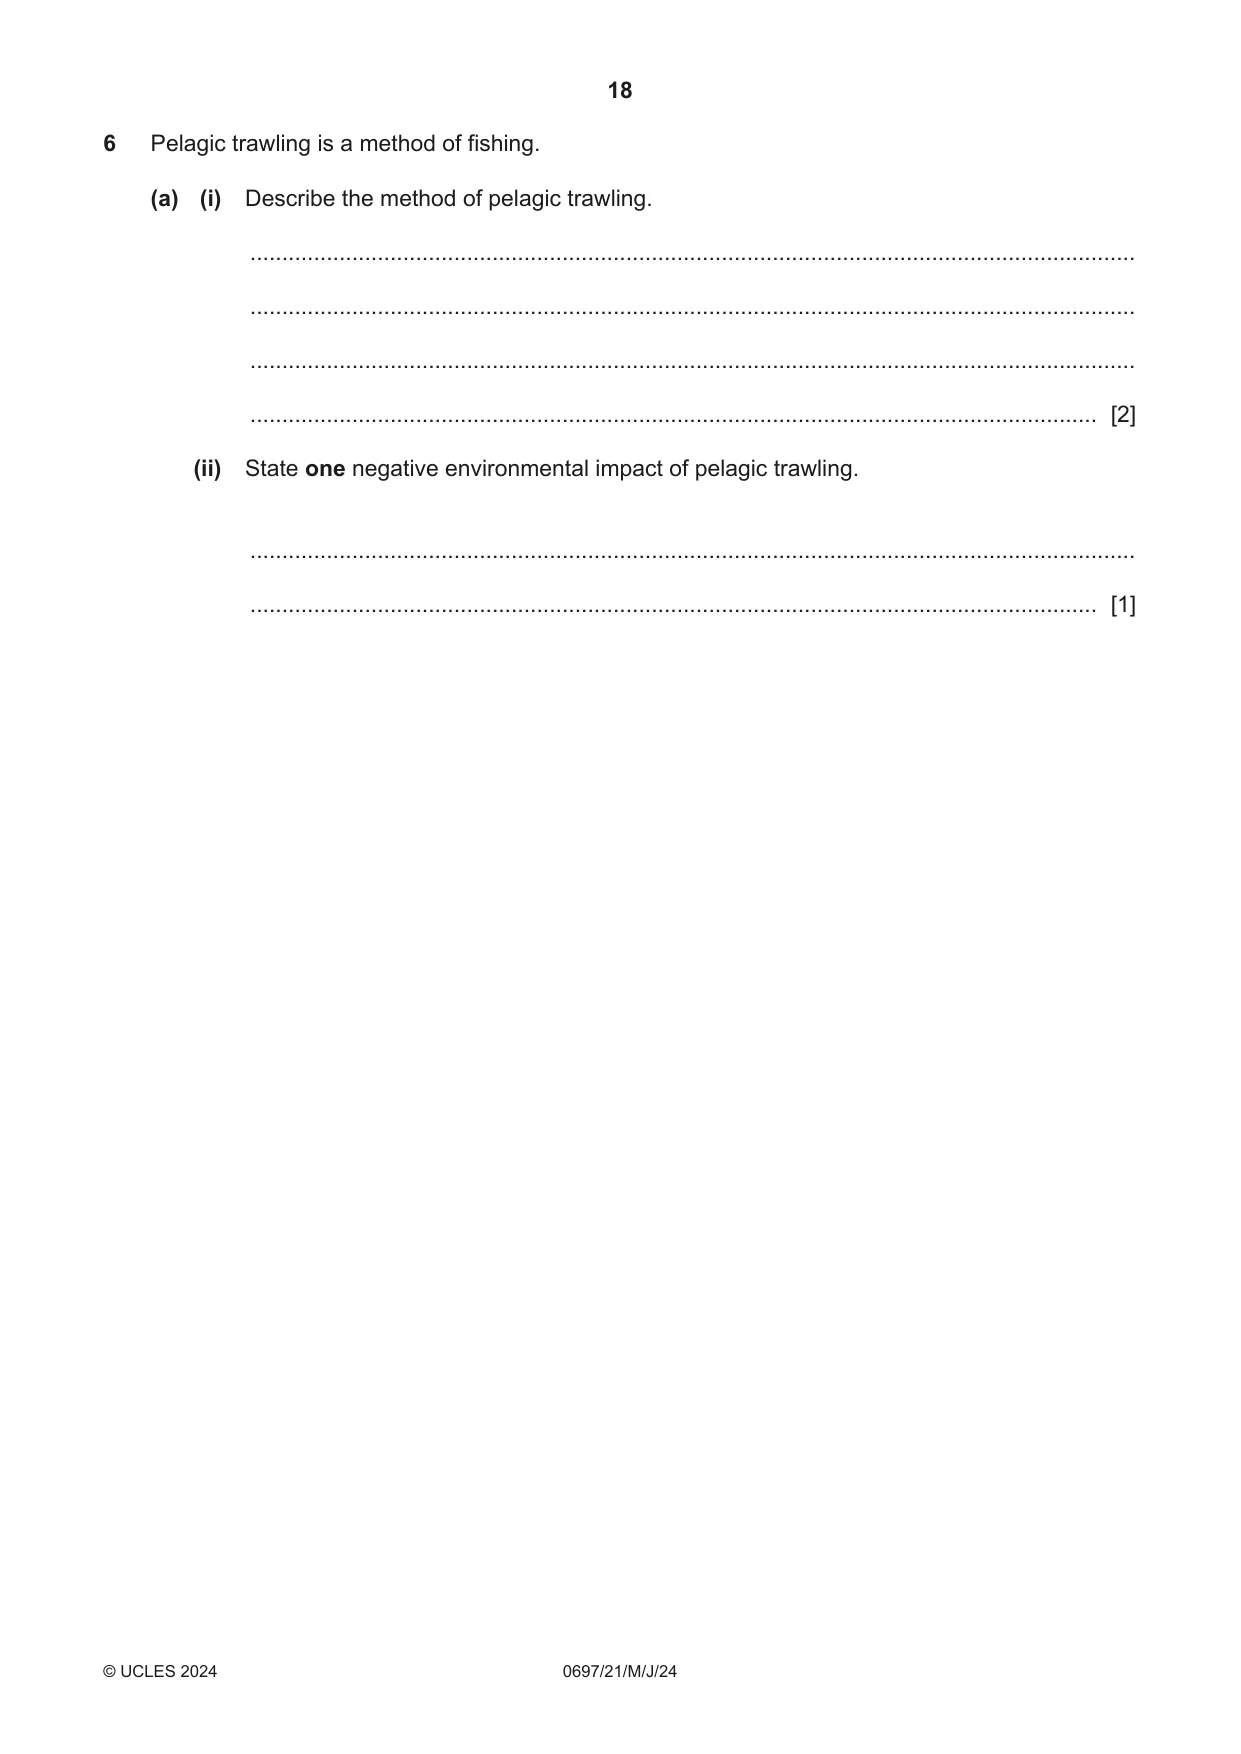
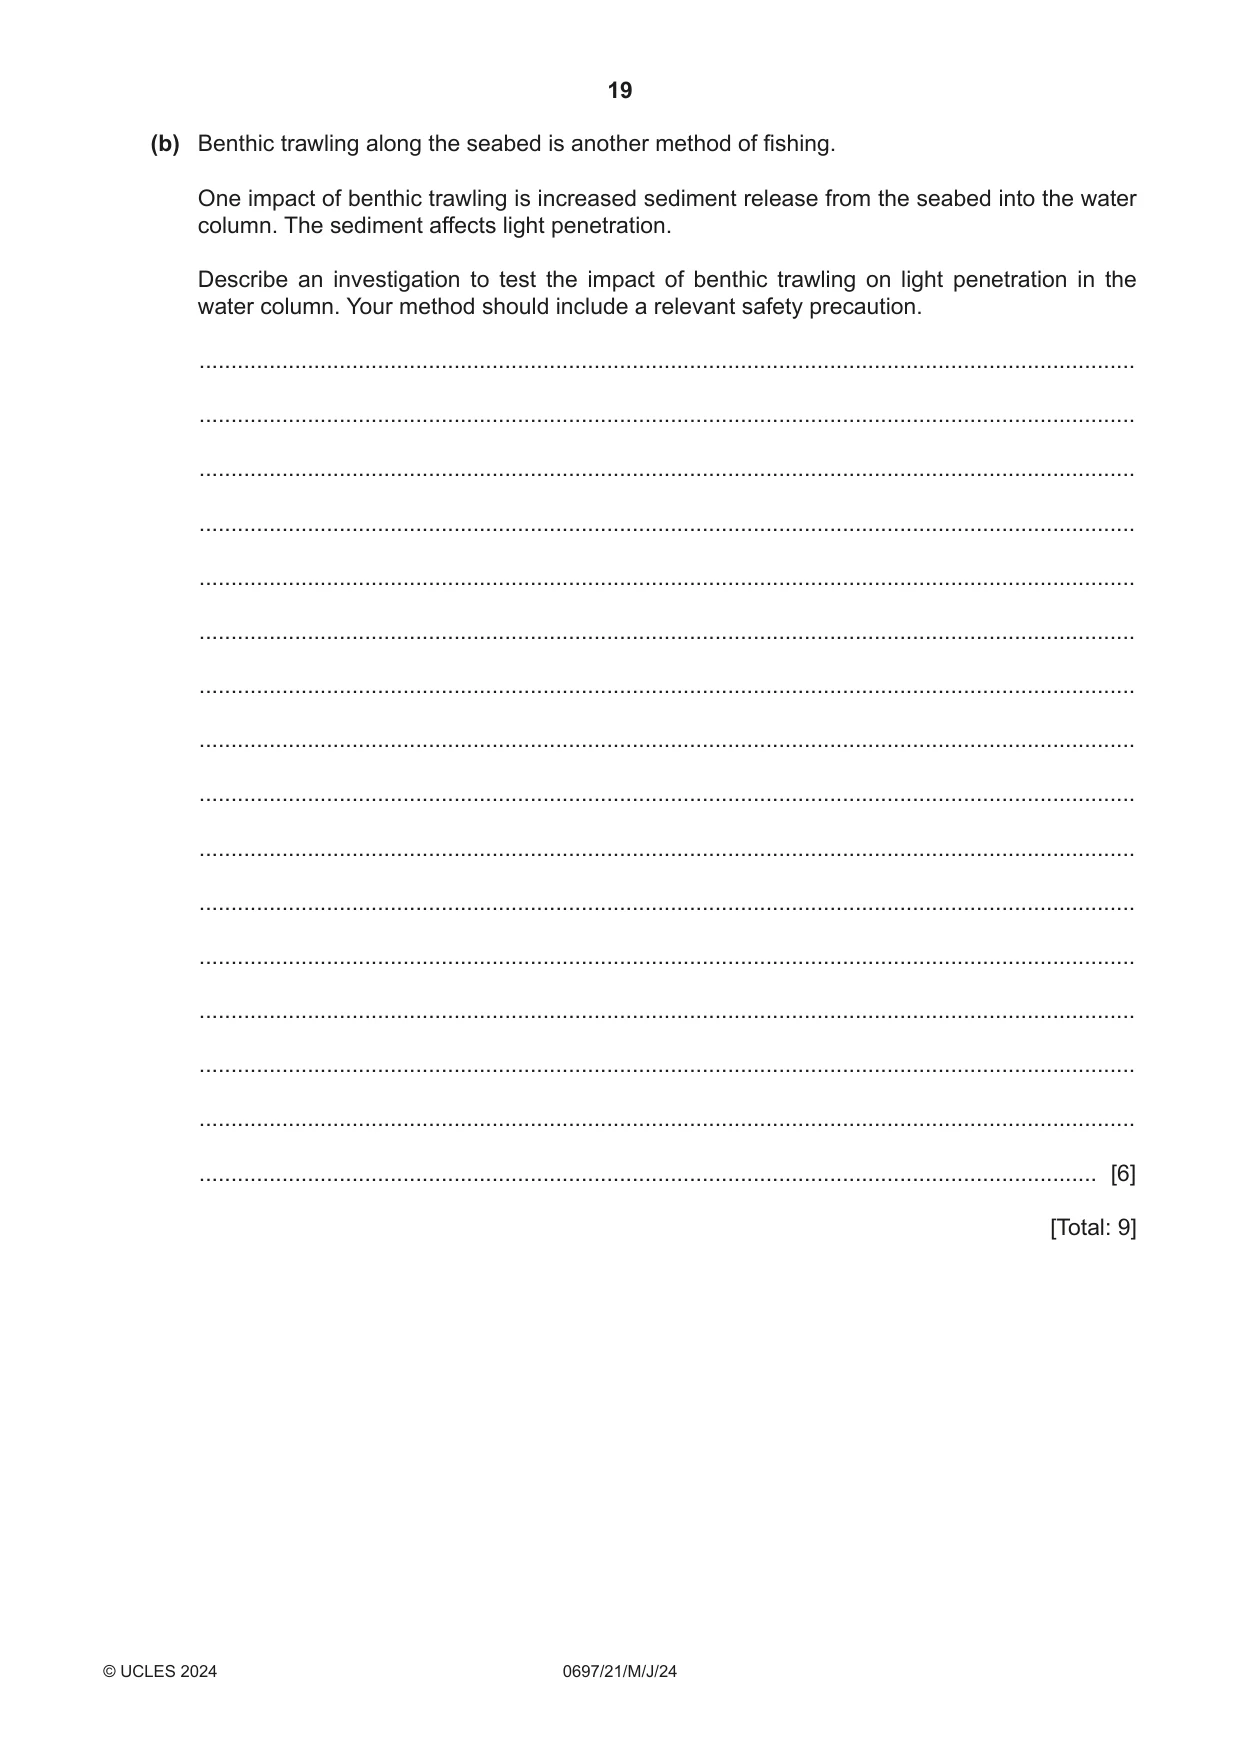
6 Pelagic trawling is a method of fishing. (a) (i) Describe the method of pelagic trawling. ........................................................................................................................................... ........................................................................................................................................... ........................................................................................................................................... ..................................................................................................................................... [2] (ii) State one negative environmental impact of pelagic trawling. ........................................................................................................................................... ..................................................................................................................................... [1] (b) Benthic trawling along the seabed is another method of fishing. One impact of benthic trawling is increased sediment release from the seabed into the water column. The sediment affects light penetration. Describe an investigation to test the impact of benthic trawling on light penetration in the water column. Your method should include a relevant safety precaution. ................................................................................................................................................... ................................................................................................................................................... ................................................................................................................................................... ................................................................................................................................................... ................................................................................................................................................... ................................................................................................................................................... ................................................................................................................................................... ................................................................................................................................................... ................................................................................................................................................... ................................................................................................................................................... ................................................................................................................................................... ................................................................................................................................................... ................................................................................................................................................... ................................................................................................................................................... ................................................................................................................................................... ............................................................................................................................................. [6] [Total: 9]
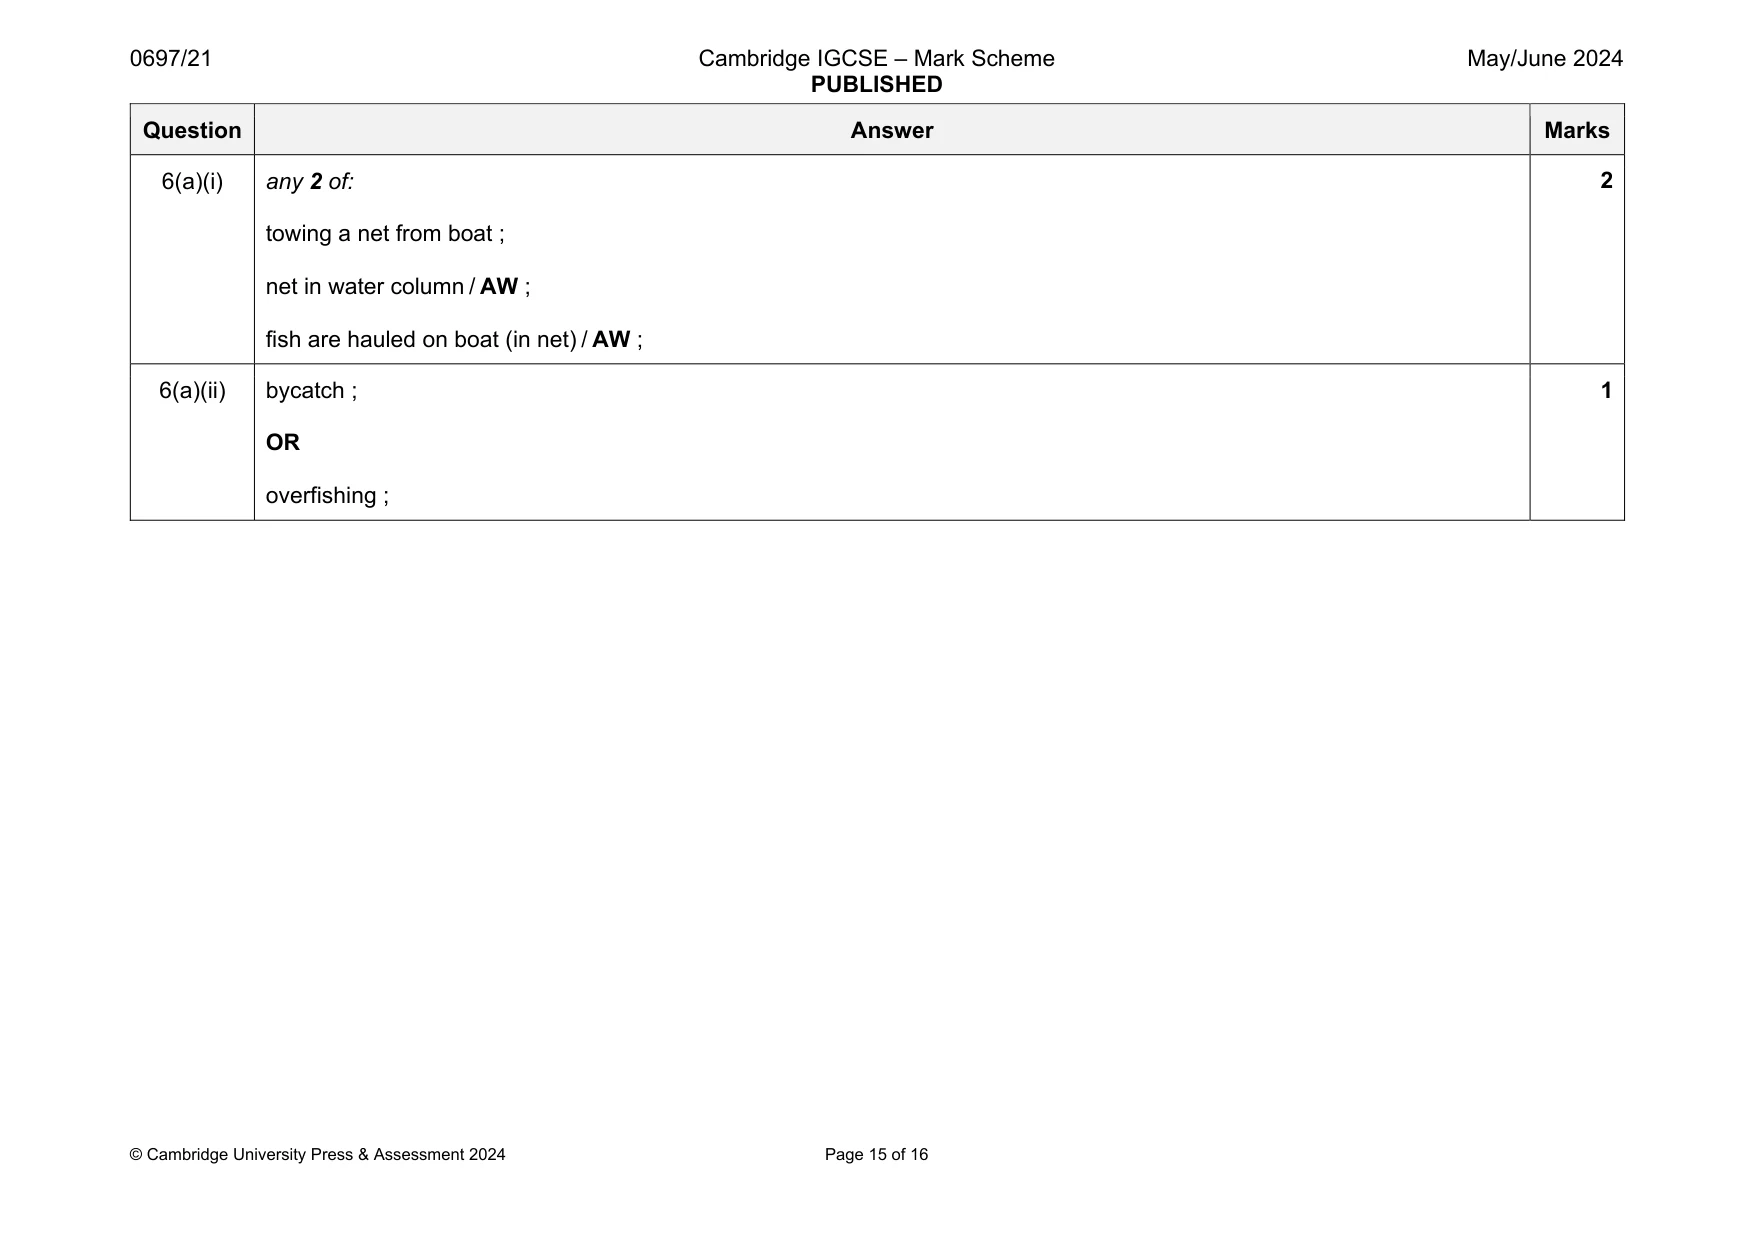
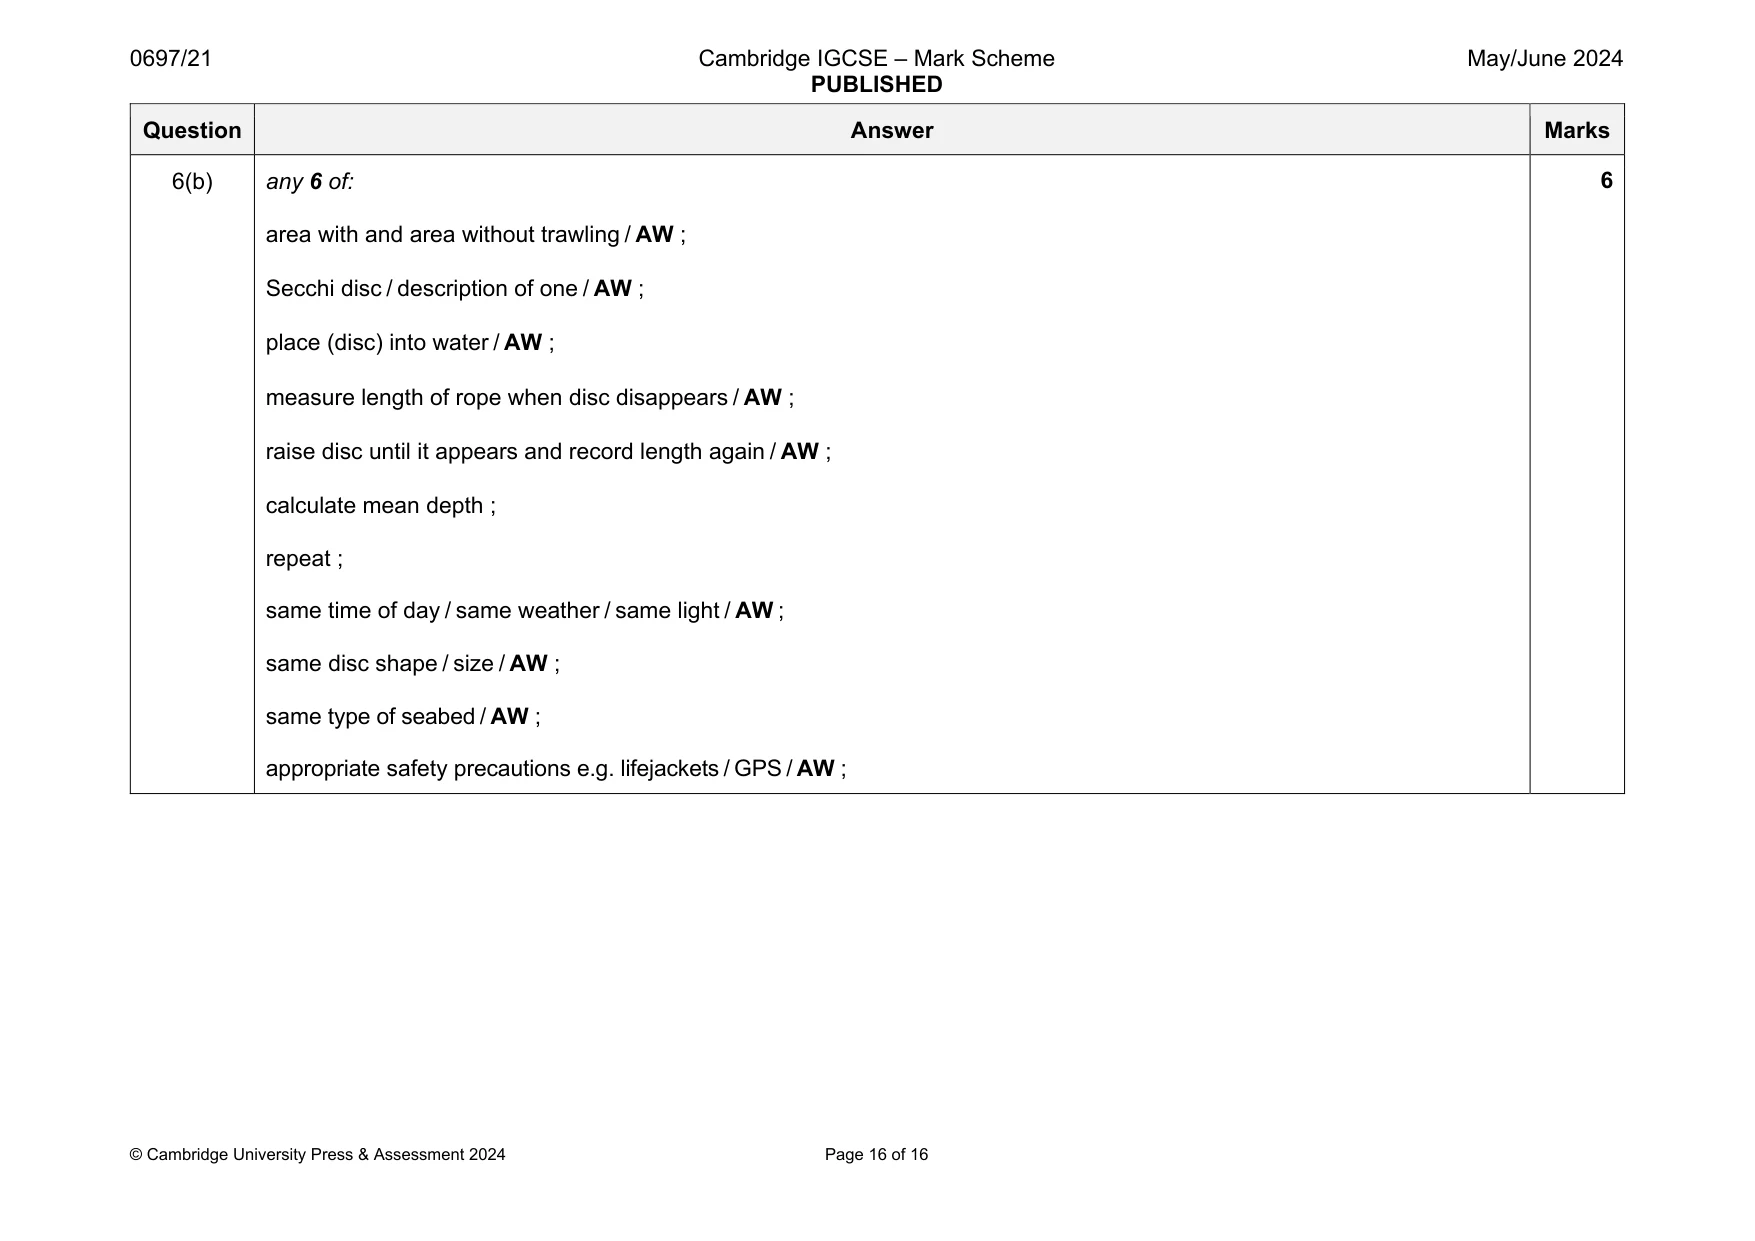
Mark scheme: 6(a)(i) any 2 of: towing a net from boat ; net in water column / AW ; fish are hauled on boat (in net) / AW ; 6(a)(ii) bycatch ; OR overfishing ; 1 Question Answer Marks 6(b) any 6 of: area with and area without trawling / AW ; Secchi disc / description of one / AW ; place (disc) into water / AW ; measure length of rope when disc disappears / AW ; raise disc until it appears and record length again / AW ; calculate mean depth ; repeat ; same time of day / same weather / same light / AW ; same disc shape / size / AW ; same type of seabed / AW ; appropriate safety precautions e.g. lifejackets / GPS / AW ; 6
What was in this paper
The subtopics covered by these 6 questions, and how many questions each got. Open one in a new tab to see every Cambridge question on it.
What you needed in this session
Cambridge’s own grade thresholds for 2024 May/June, Paper 2 · Variant 1. A higher threshold means an easier paper — the bar moves with how the cohort did.