Cambridge IGCSE Marine Science (Maldives only) 0697 — 2022 May/June Paper 2 · Variant 0
0697/20/M/J/22 · 4 questions · 60 marks · ≈68 min
The question paper and its mark scheme, free to read here and free to download. This is Cambridge’s own paper, exactly as it was sat.
Question paper12 pages
Mark scheme
No mark scheme is in the library for this paper.
Questions as text
Q1 · Information about the catch for yellowfin tuna using pole and line
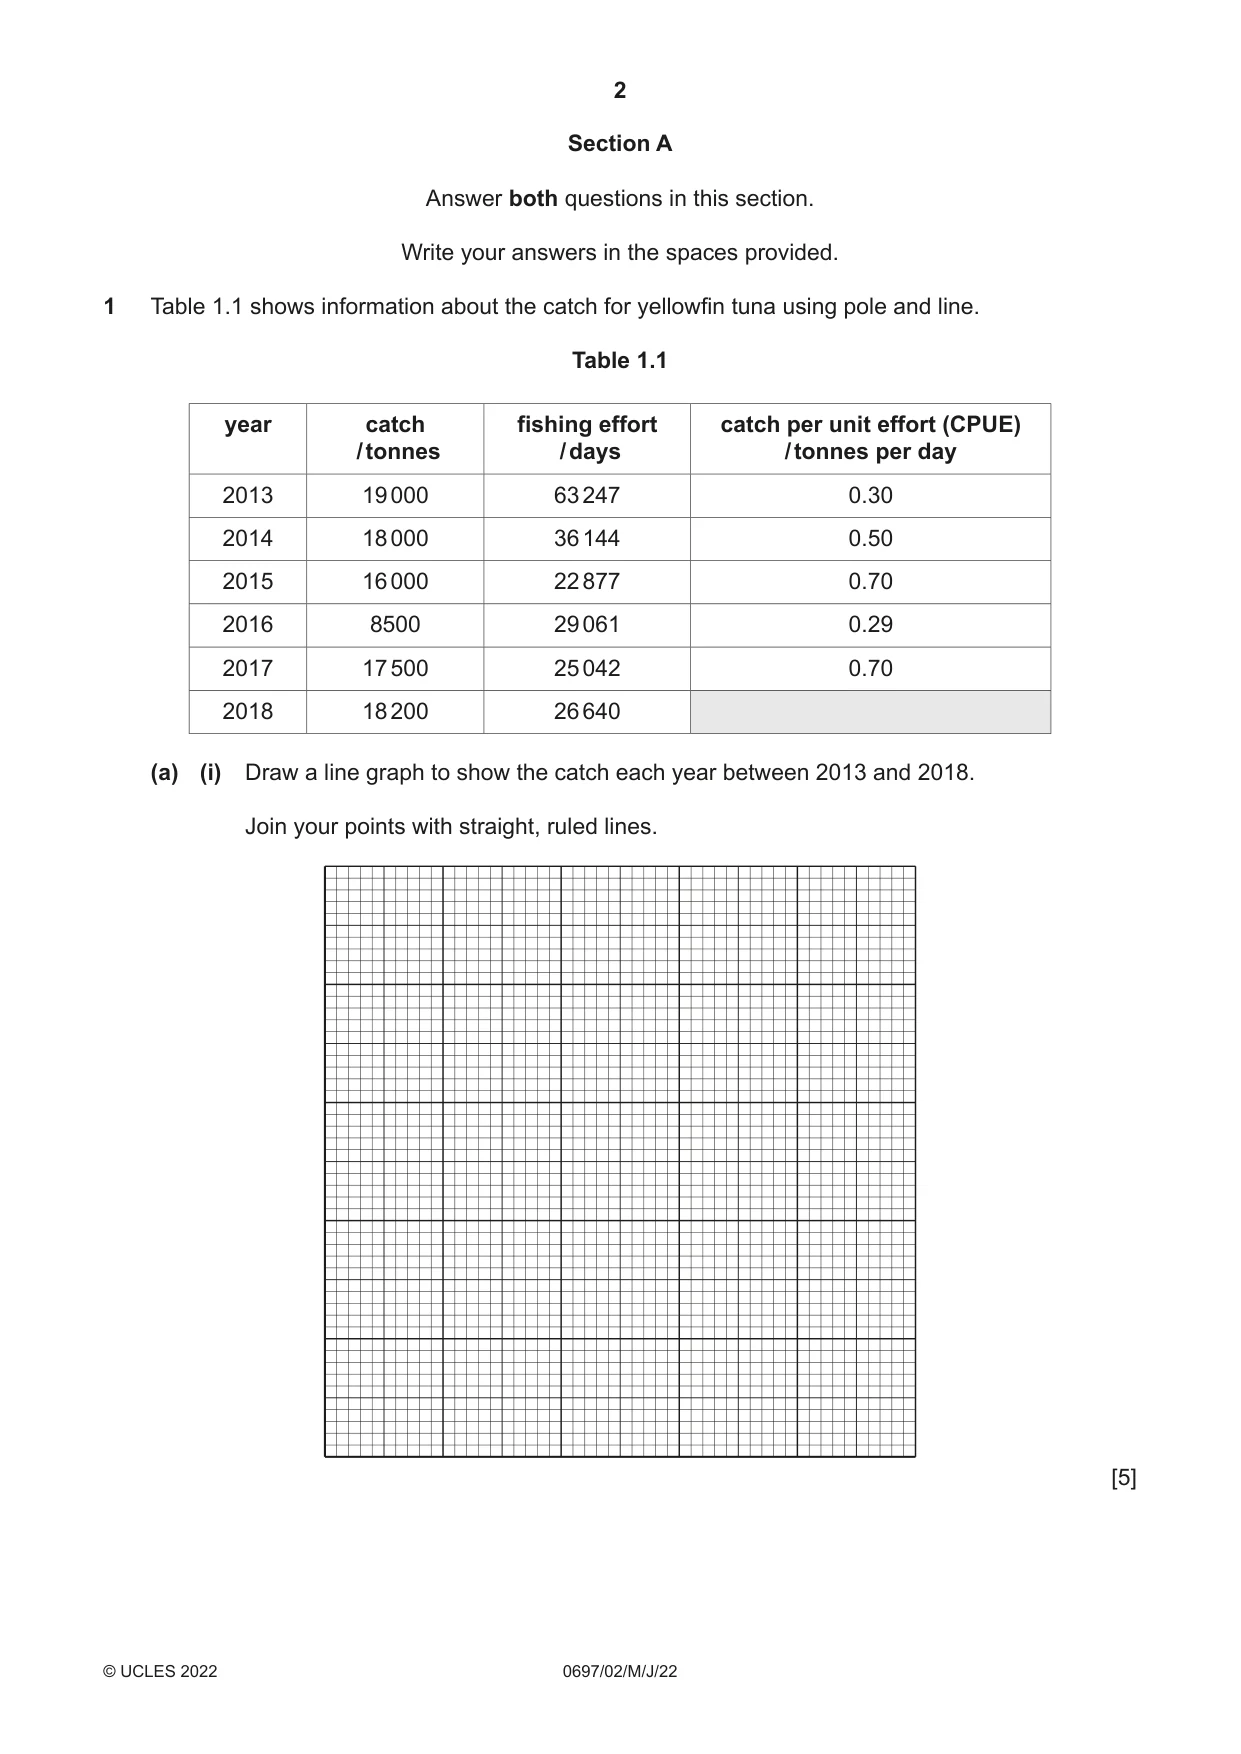
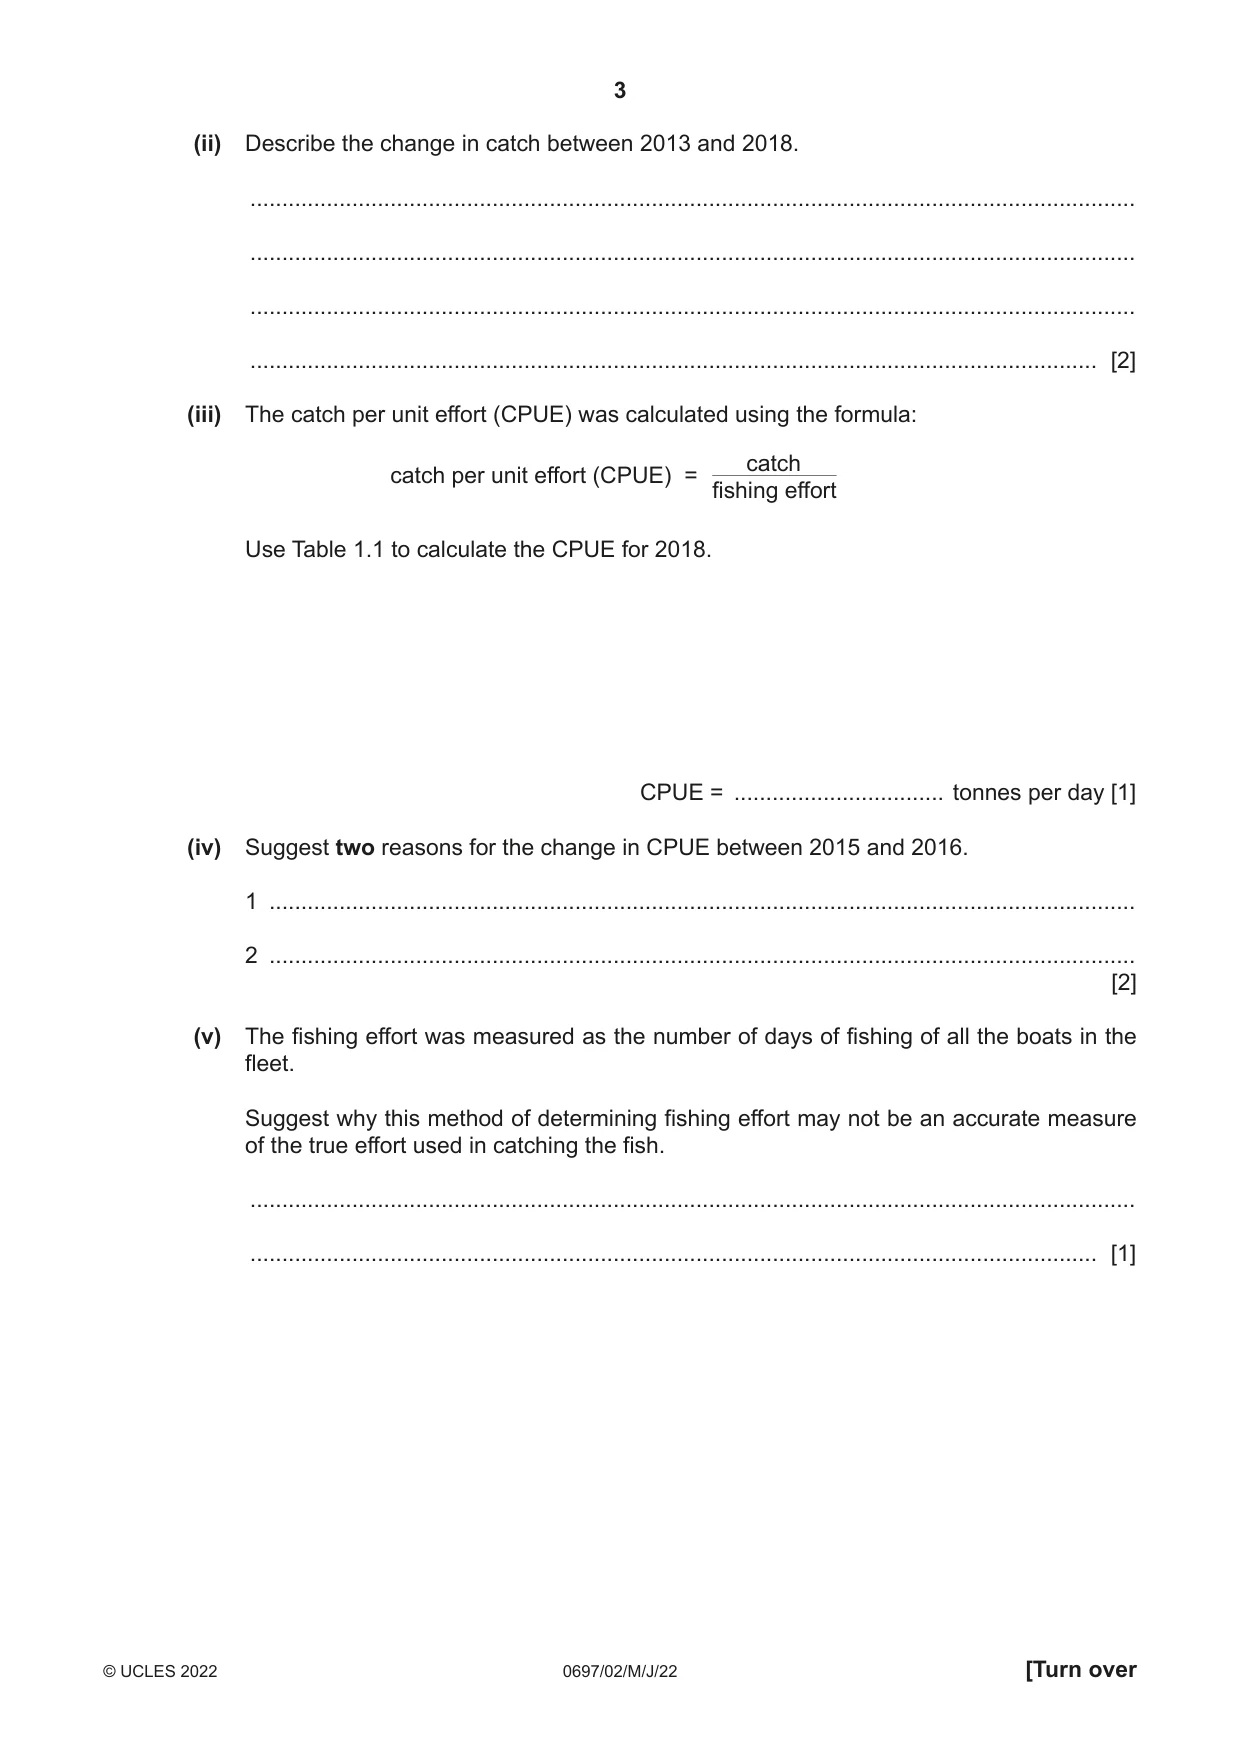
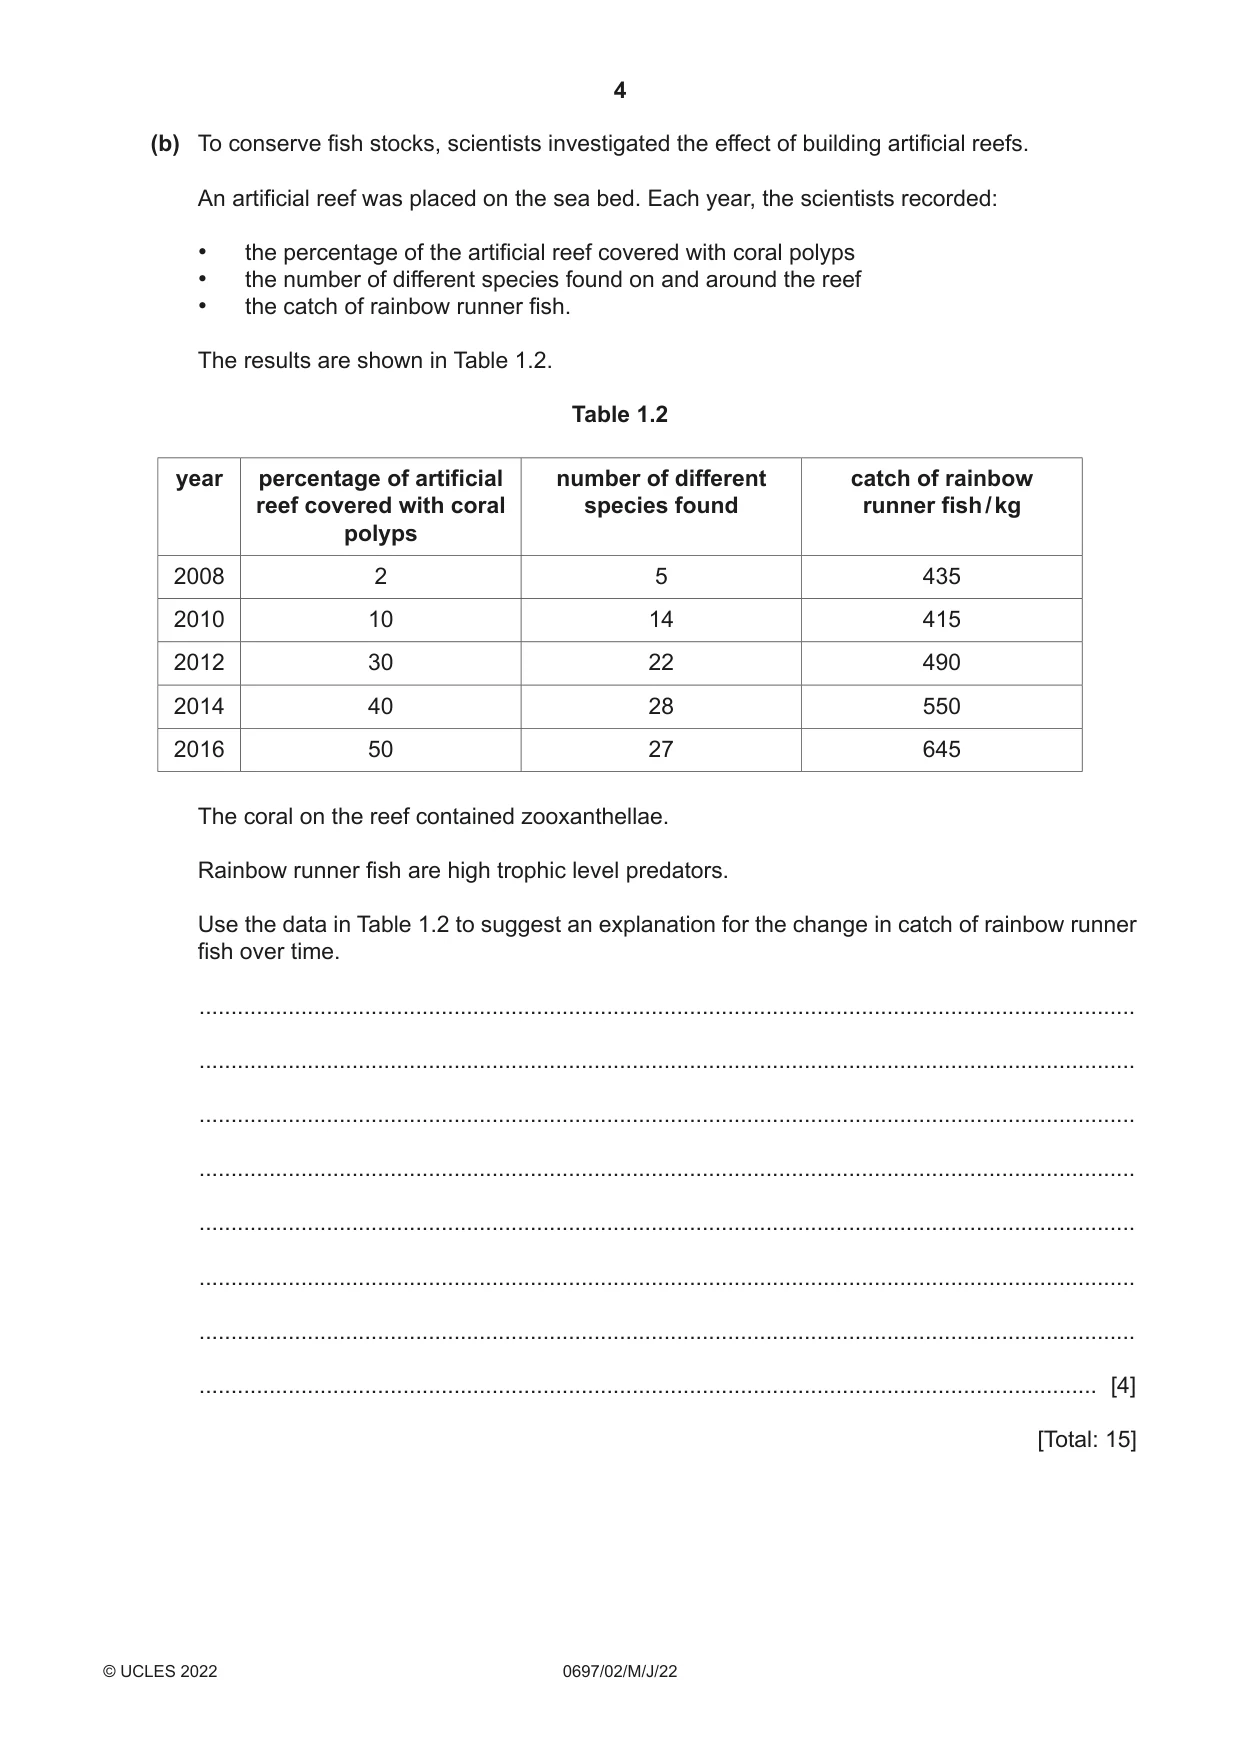
1 Table 1.1 shows information about the catch for yellowfin tuna using pole and line. Table 1.1 year catch fishing effort catch per unit effort (CPUE) / tonnes / days / tonnes per day 2013 19 000 63 247 0.30 2014 18 000 36 144 0.50 2015 16 000 22 877 0.70 2016 8500 29 061 0.29 2017 17 500 25 042 0.70 2018 18 200 26 640 (a) (i) Draw a line graph to show the catch each year between 2013 and 2018. Join your points with straight, ruled lines. [5] (ii) Describe the change in catch between 2013 and 2018. ........................................................................................................................................... ........................................................................................................................................... ........................................................................................................................................... ..................................................................................................................................... [2] (iii) The catch per unit effort (CPUE) was calculated using the formula: catch catch per unit effort (CPUE) = fishing effort Use Table 1.1 to calculate the CPUE for 2018. CPUE = ................................. tonnes per day [1] (iv) Suggest two reasons for the change in CPUE between 2015 and 2016. 1 ........................................................................................................................................ 2 ........................................................................................................................................ [2] (v) The fishing effort was measured as the number of days of fishing of all the boats in the fleet. Suggest why this method of determining fishing effort may not be an accurate measure of the true effort used in catching the fish. ........................................................................................................................................... ..................................................................................................................................... [1] (b) To conserve fish stocks, scientists investigated the effect of building artificial reefs. An artificial reef was placed on the sea bed. Each year, the scientists recorded: • the percentage of the artificial reef covered with coral polyps • the number of different species found on and around the reef • the catch of rainbow runner fish. The results are shown in Table 1.2. Table 1.2 year percentage of artificial number of different catch of rainbow reef covered with coral species found runner fish / kg polyps 2008 2 5 435 2010 10 14 415 2012 30 22 490 2014 40 28 550 2016 50 27 645 The coral on the reef contained zooxanthellae. Rainbow runner fish are high trophic level predators. Use the data in Table 1.2 to suggest an explanation for the change in catch of rainbow runner fish over time. ................................................................................................................................................... ................................................................................................................................................... ................................................................................................................................................... ................................................................................................................................................... ................................................................................................................................................... ................................................................................................................................................... ................................................................................................................................................... ............................................................................................................................................. [4] [Total: 15]
Q2 · Seafood is a major source of nutrition for humans
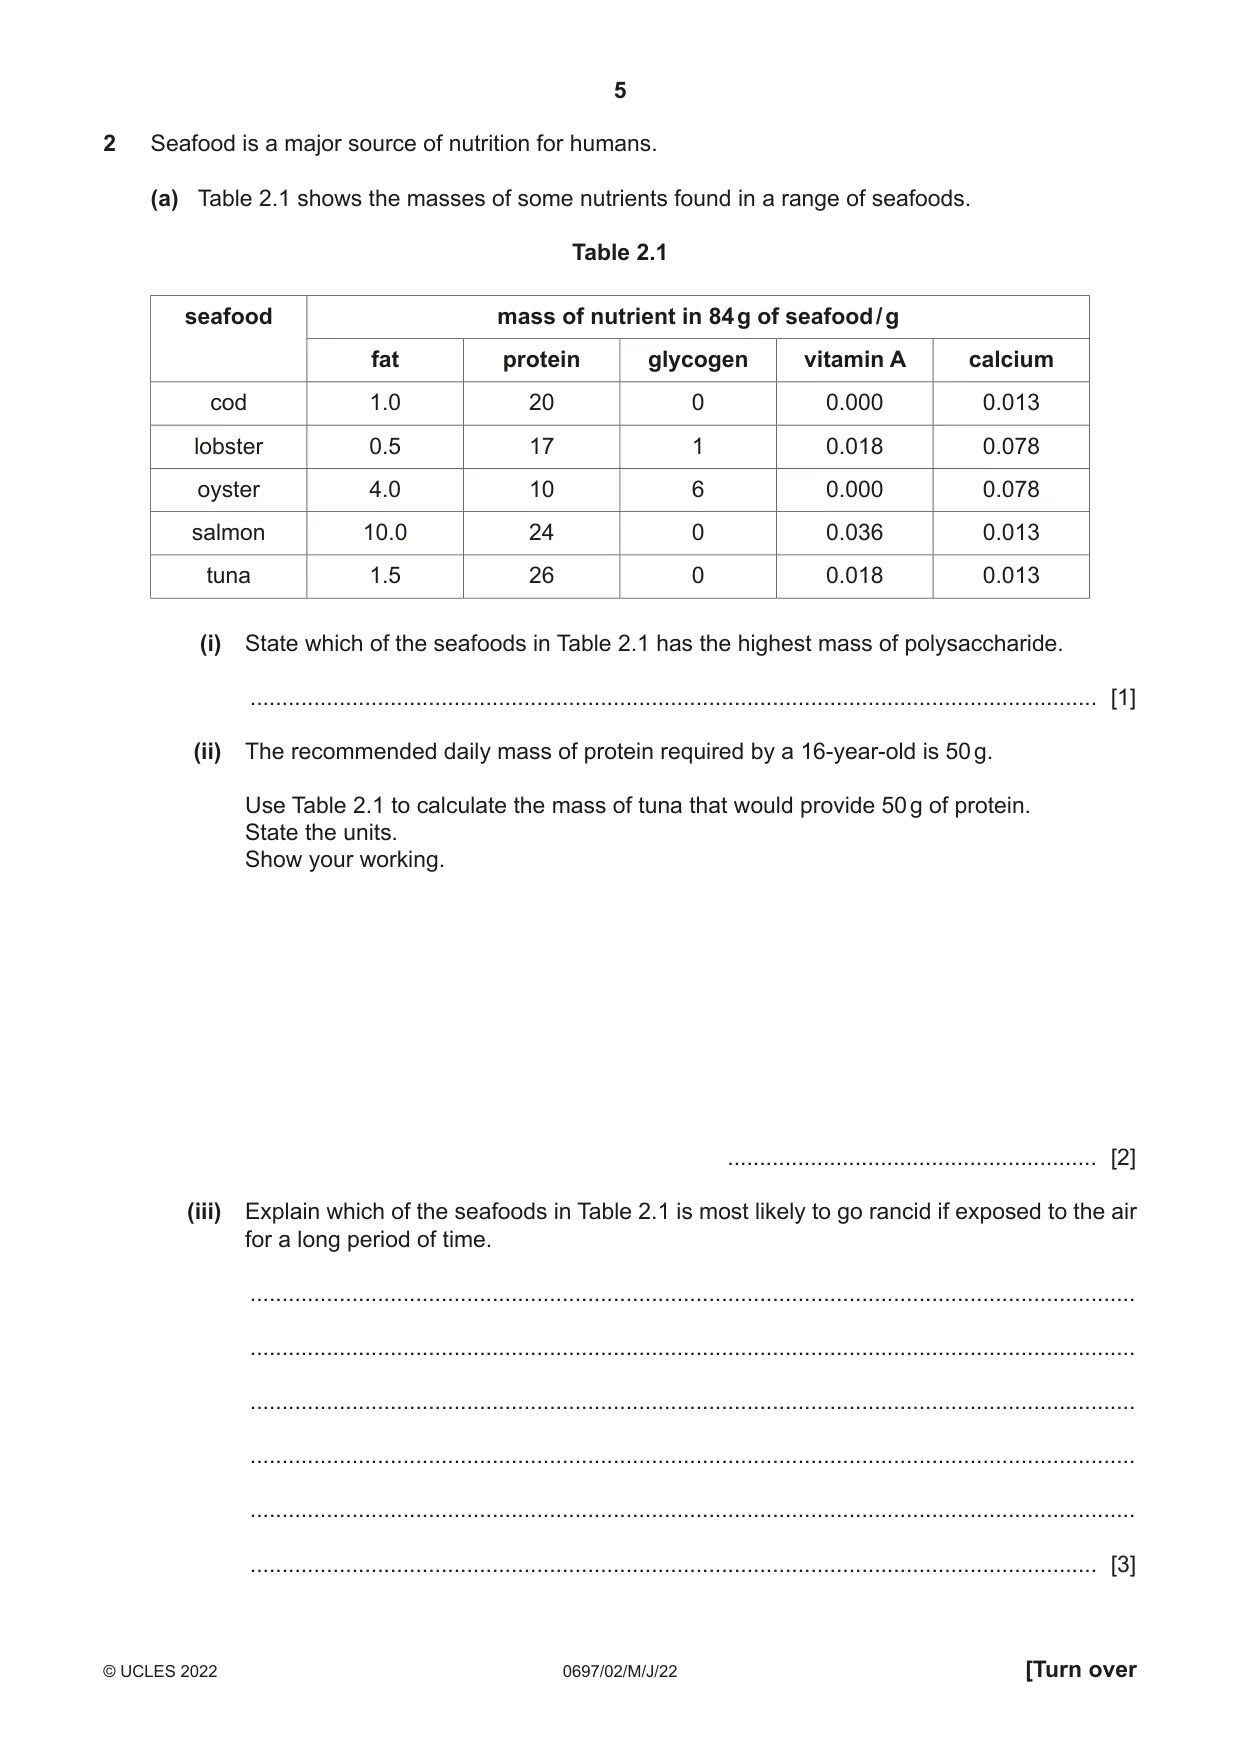
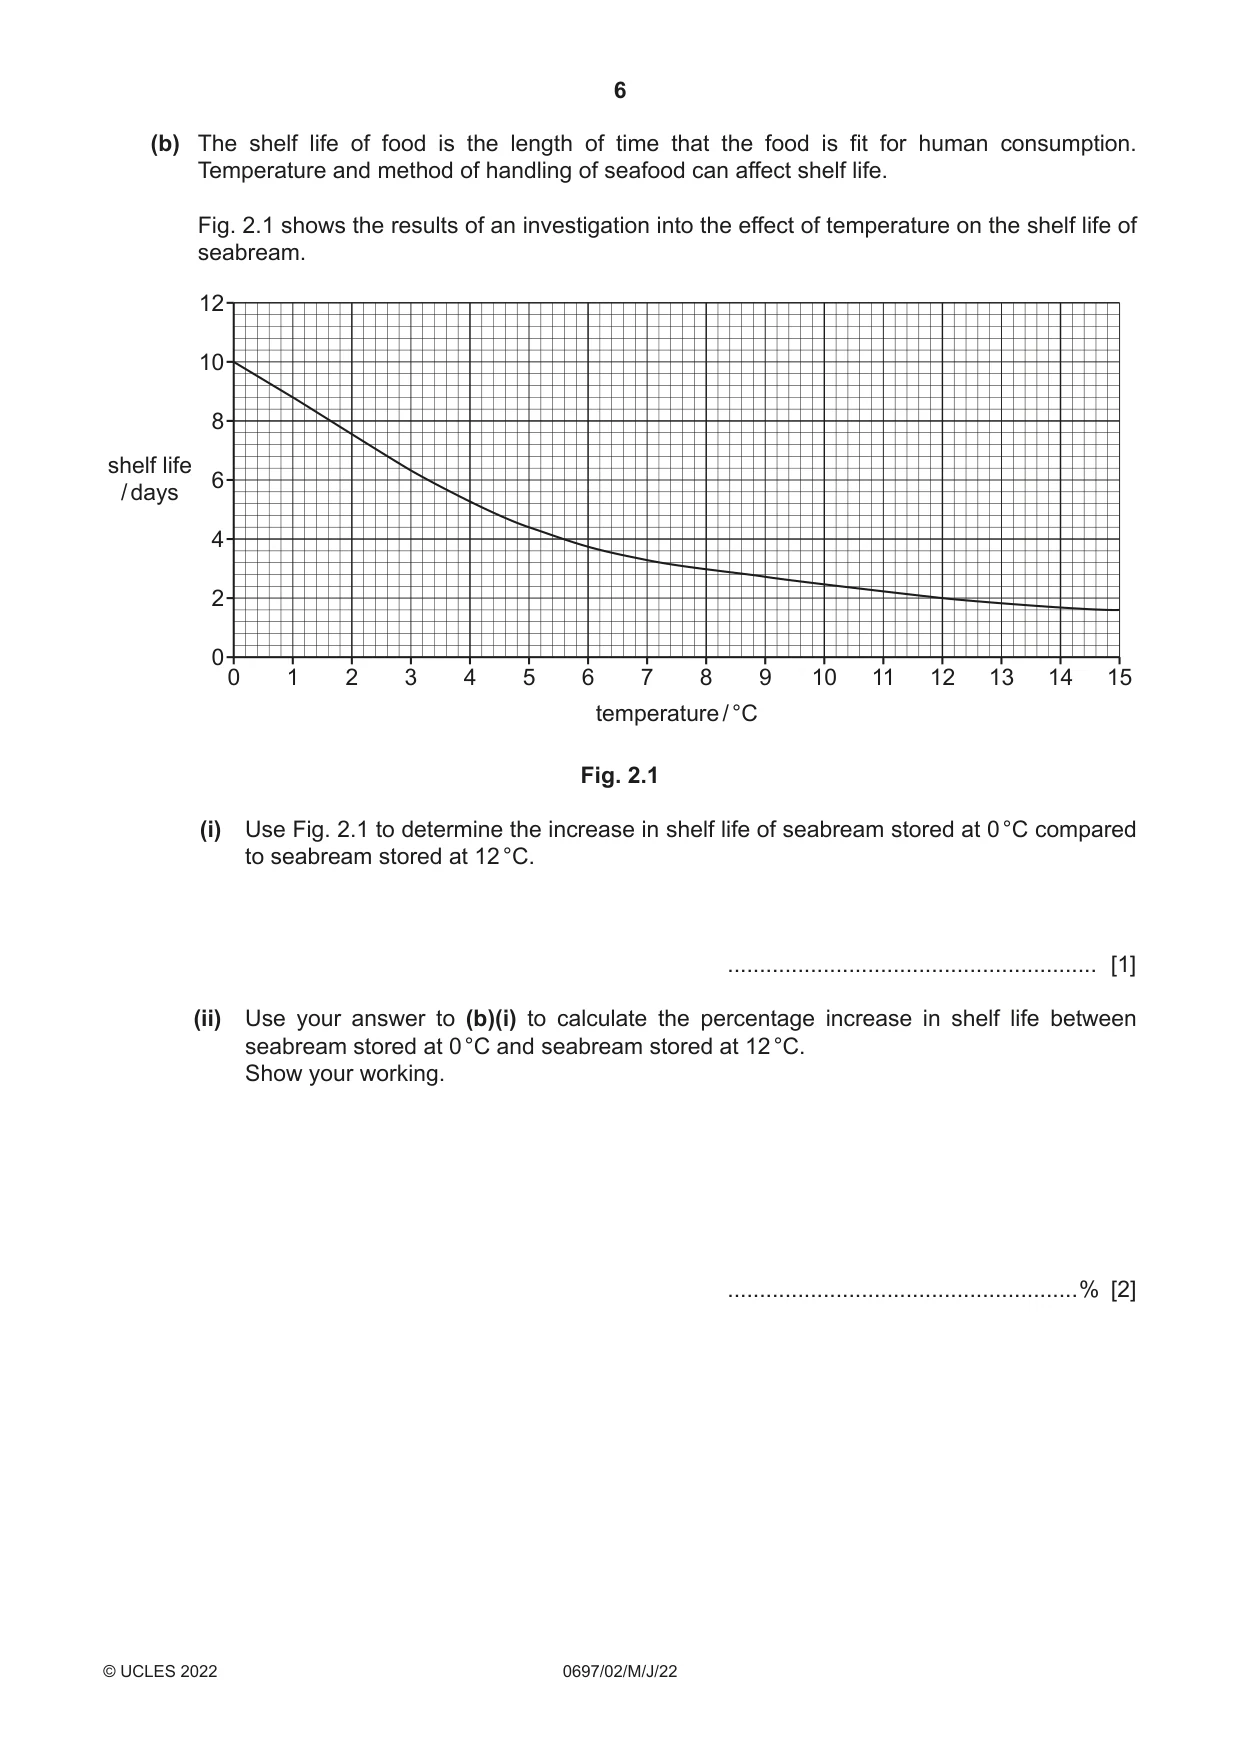
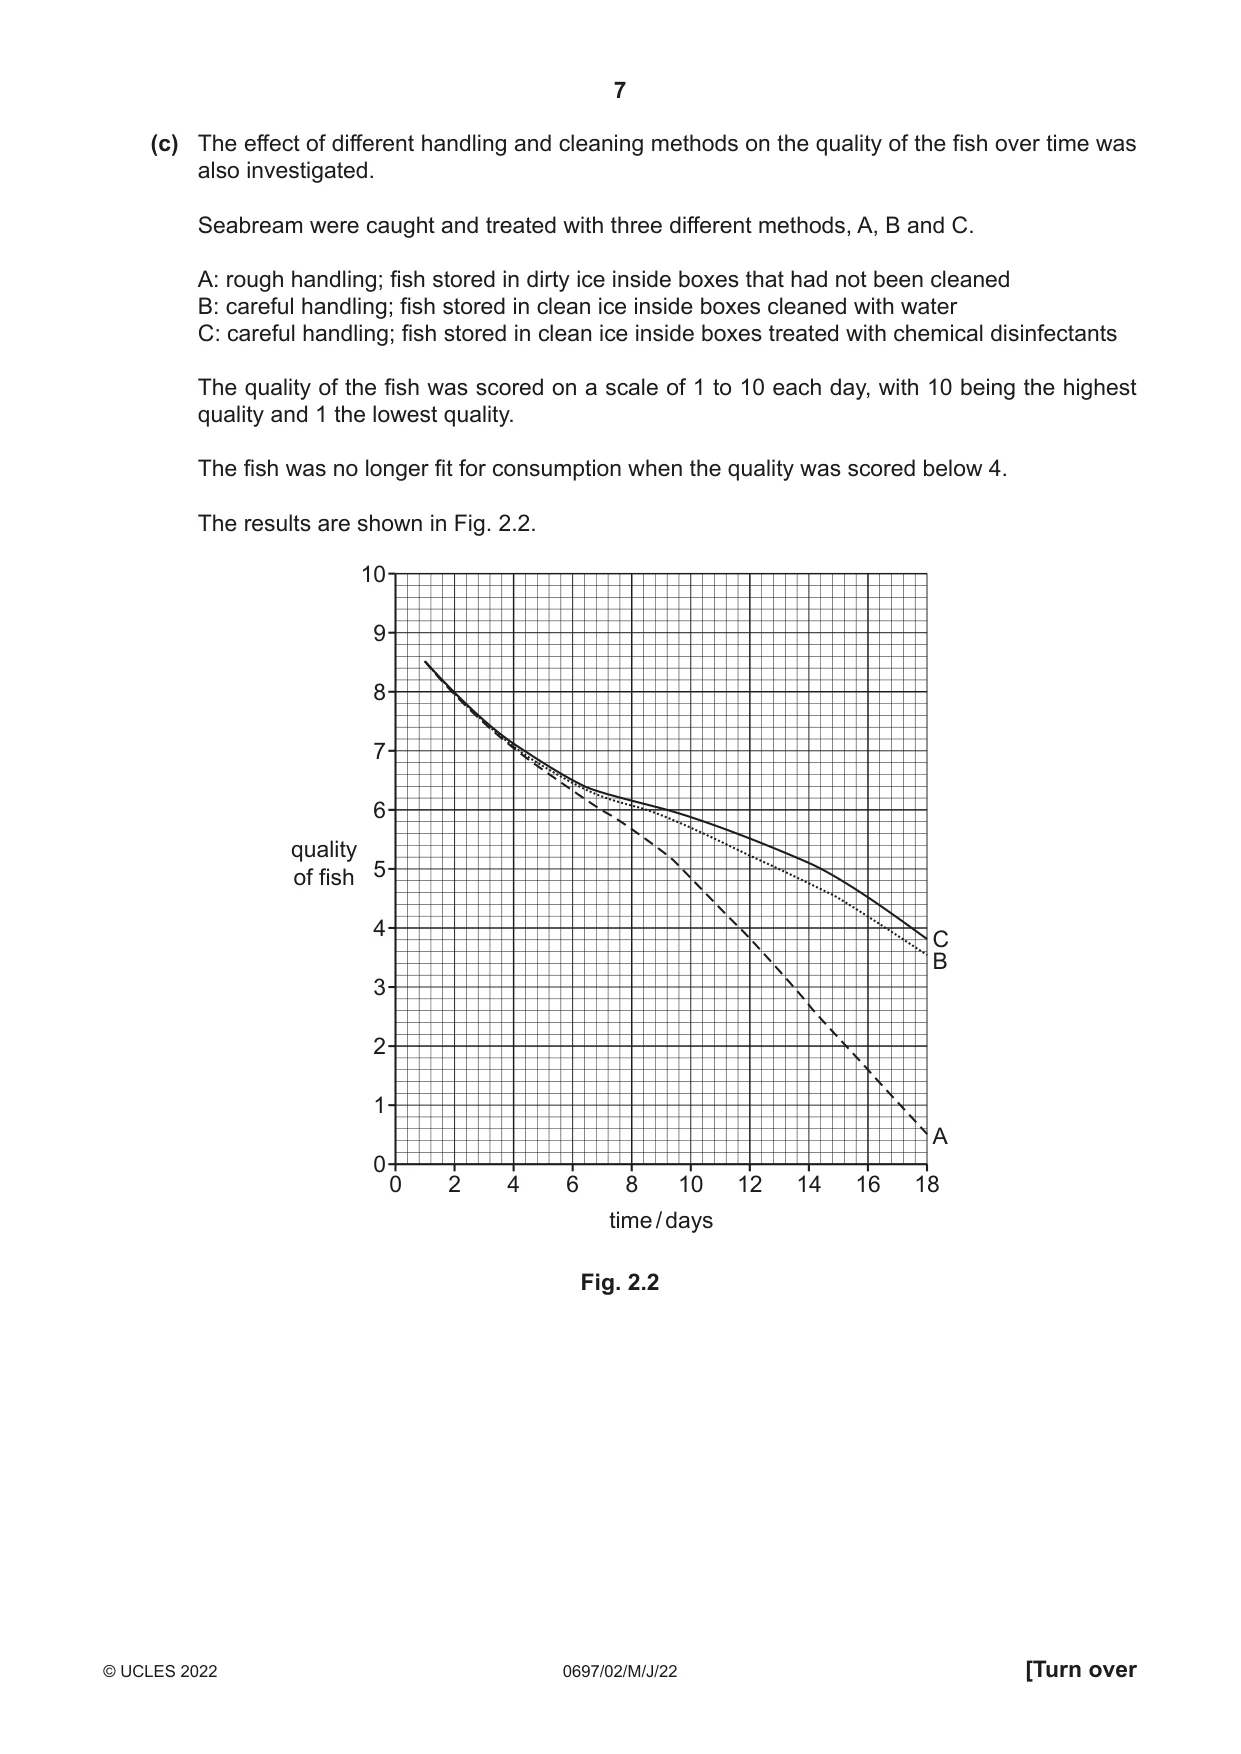
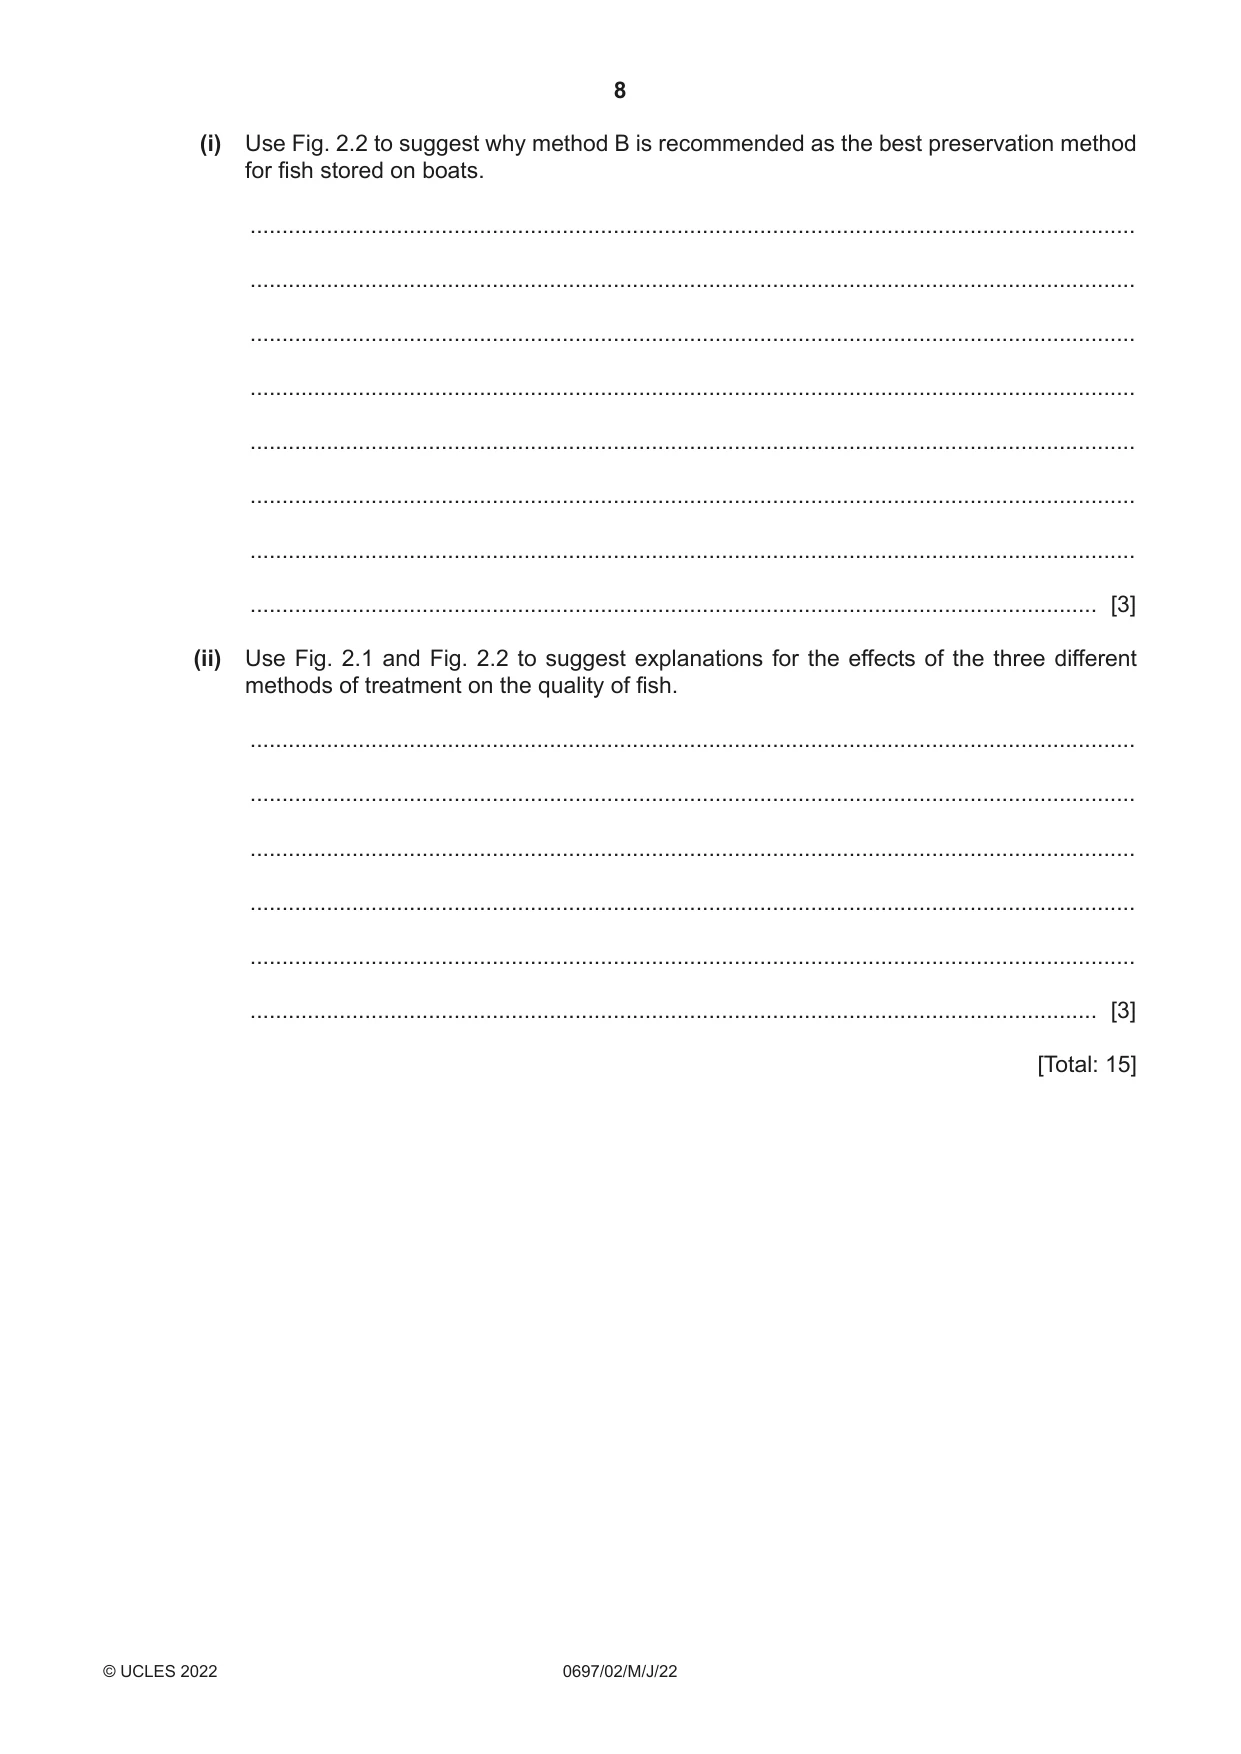
2 Seafood is a major source of nutrition for humans. (a) Table 2.1 shows the masses of some nutrients found in a range of seafoods. Table 2.1 seafood mass of nutrient in 84 g of seafood / g fat protein glycogen vitamin A calcium cod 1.0 20 0 0.000 0.013 lobster 0.5 17 1 0.018 0.078 oyster 4.0 10 6 0.000 0.078 salmon 10.0 24 0 0.036 0.013 tuna 1.5 26 0 0.018 0.013 (i) State which of the seafoods in Table 2.1 has the highest mass of polysaccharide. ..................................................................................................................................... [1] (ii) The recommended daily mass of protein required by a 16-year-old is 50 g. Use Table 2.1 to calculate the mass of tuna that would provide 50 g of protein. State the units. Show your working. .......................................................... [2] (iii) Explain which of the seafoods in Table 2.1 is most likely to go rancid if exposed to the air for a long period of time. ........................................................................................................................................... ........................................................................................................................................... ........................................................................................................................................... ........................................................................................................................................... ........................................................................................................................................... ..................................................................................................................................... [3] (b) The shelf life of food is the length of time that the food is fit for human consumption. Temperature and method of handling of seafood can affect shelf life. Fig. 2.1 shows the results of an investigation into the effect of temperature on the shelf life of seabream. 12 10 8 shelf life 6 / days 4 2 0 0 1 2 3 4 5 6 7 8 9 10 11 12 13 14 15 temperature / °C Fig. 2.1 (i) Use Fig. 2.1 to determine the increase in shelf life of seabream stored at 0 °C compared to seabream stored at 12 °C. .......................................................... [1] (ii) Use your answer to (b)(i) to calculate the percentage increase in shelf life between seabream stored at 0 °C and seabream stored at 12 °C. Show your working. .......................................................% [2] (c) The effect of different handling and cleaning methods on the quality of the fish over time was also investigated. Seabream were caught and treated with three different methods, A, B and C. A: rough handling; fish stored in dirty ice inside boxes that had not been cleaned B: careful handling; fish stored in clean ice inside boxes cleaned with water C: careful handling; fish stored in clean ice inside boxes treated with chemical disinfectants The quality of the fish was scored on a scale of 1 to 10 each day, with 10 being the highest quality and 1 the lowest quality. The fish was no longer fit for consumption when the quality was scored below 4. The results are shown in Fig. 2.2. 10 9 8 7 6 quality 5 of fish 4 C B 3 2 1 A 0 0 2 4 6 8 10 12 14 16 18 time / days Fig. 2.2 (i) Use Fig. 2.2 to suggest why method B is recommended as the best preservation method for fish stored on boats. ........................................................................................................................................... ........................................................................................................................................... ........................................................................................................................................... ........................................................................................................................................... ........................................................................................................................................... ........................................................................................................................................... ........................................................................................................................................... ..................................................................................................................................... [3] (ii) Use Fig. 2.1 and Fig. 2.2 to suggest explanations for the effects of the three different methods of treatment on the quality of fish. ........................................................................................................................................... ........................................................................................................................................... ........................................................................................................................................... ........................................................................................................................................... ........................................................................................................................................... ..................................................................................................................................... [3] [Total: 15]
Q3 · Outline the features of wet and dry monsoons
3 (a) Outline the features of wet and dry monsoons. ................................................................................................................................................... ................................................................................................................................................... ................................................................................................................................................... ................................................................................................................................................... ................................................................................................................................................... ................................................................................................................................................... ................................................................................................................................................... ................................................................................................................................................... ................................................................................................................................................... ................................................................................................................................................... ................................................................................................................................................... ................................................................................................................................................... ................................................................................................................................................... ............................................................................................................................................. [7] (b) Outline how the chemical properties of sea water affect marine life. ................................................................................................................................................... ................................................................................................................................................... ................................................................................................................................................... ................................................................................................................................................... ................................................................................................................................................... ................................................................................................................................................... ................................................................................................................................................... ................................................................................................................................................... ................................................................................................................................................... ................................................................................................................................................... ................................................................................................................................................... ................................................................................................................................................... ................................................................................................................................................... ................................................................................................................................................... ................................................................................................................................................... ................................................................................................................................................... ............................................................................................................................................. [8] [Total: 15]
Q4 · Describe the use of pelagic long-lines
4 (a) (i) Describe the use of pelagic long-lines. ........................................................................................................................................... ........................................................................................................................................... ........................................................................................................................................... ........................................................................................................................................... ........................................................................................................................................... ..................................................................................................................................... [3] (ii) Explain the principles of fish aggregating devices (FADs). ........................................................................................................................................... ........................................................................................................................................... ........................................................................................................................................... ........................................................................................................................................... ........................................................................................................................................... ........................................................................................................................................... ........................................................................................................................................... ..................................................................................................................................... [4] (b) Describe the uses of three named navigational aids found on fishing boats. ................................................................................................................................................... ................................................................................................................................................... ................................................................................................................................................... ................................................................................................................................................... ................................................................................................................................................... ................................................................................................................................................... ................................................................................................................................................... ................................................................................................................................................... ................................................................................................................................................... ................................................................................................................................................... ................................................................................................................................................... ................................................................................................................................................... ................................................................................................................................................... ................................................................................................................................................... ................................................................................................................................................... ............................................................................................................................................. [8] [Total: 15]
What was in this paper
The subtopics covered by these 4 questions, and how many questions each got. Open one in a new tab to see every Cambridge question on it.
What you needed in this session
Cambridge’s own grade thresholds for 2022 May/June, Paper 2 · Variant 0. A higher threshold means an easier paper — the bar moves with how the cohort did.