Cambridge IGCSE Geography 0460 — 2020 Feb/March Paper 1 · Variant 2
0460/12/F/M/20 · 75 marks · ≈84 min
The question paper and its mark scheme, free to read here and free to download. This is Cambridge’s own paper, exactly as it was sat.
Question paper32 pages




Mark scheme14 pages
Answers below. Sit the paper first if you are practising.
Paper as text
Question paper, page 1
Cambridge IGCSE™ * 6 3 3 0 5 3 6 8 2 7 * DC (LEG/CB) 184439/5 © UCLES 2020 [Turn over This document has 32 pages. Blank pages are indicated. GEOGRAPHY 0460/12 Paper 1 Geographical Themes February/March 2020 1 hour 45 minutes You must answer on the question paper. You will need: Insert (enclosed) Calculator Ruler INSTRUCTIONS ● Answer three questions in total, one from each section. ● Use a black or dark blue pen. You may use an HB pencil for any diagrams or graphs. ● Write your name, centre number and candidate number in the boxes at the top of the page. ● Write your answer to each question in the space provided. ● Do not use an erasable pen or correction fluid. ● Do not write on any bar codes. ● If additional space is needed, you should use the lined pages at the end of this booklet; the question number or numbers must be clearly shown. INFORMATION ● The total mark for this paper is 75. ● The number of marks for each question or part question is shown in brackets [ ]. ● The insert contains additional resources referred to in the questions. Definitions MEDCs – More Economically Developed Countries LEDCs – Less Economically Developed Countries
Question paper, page 2
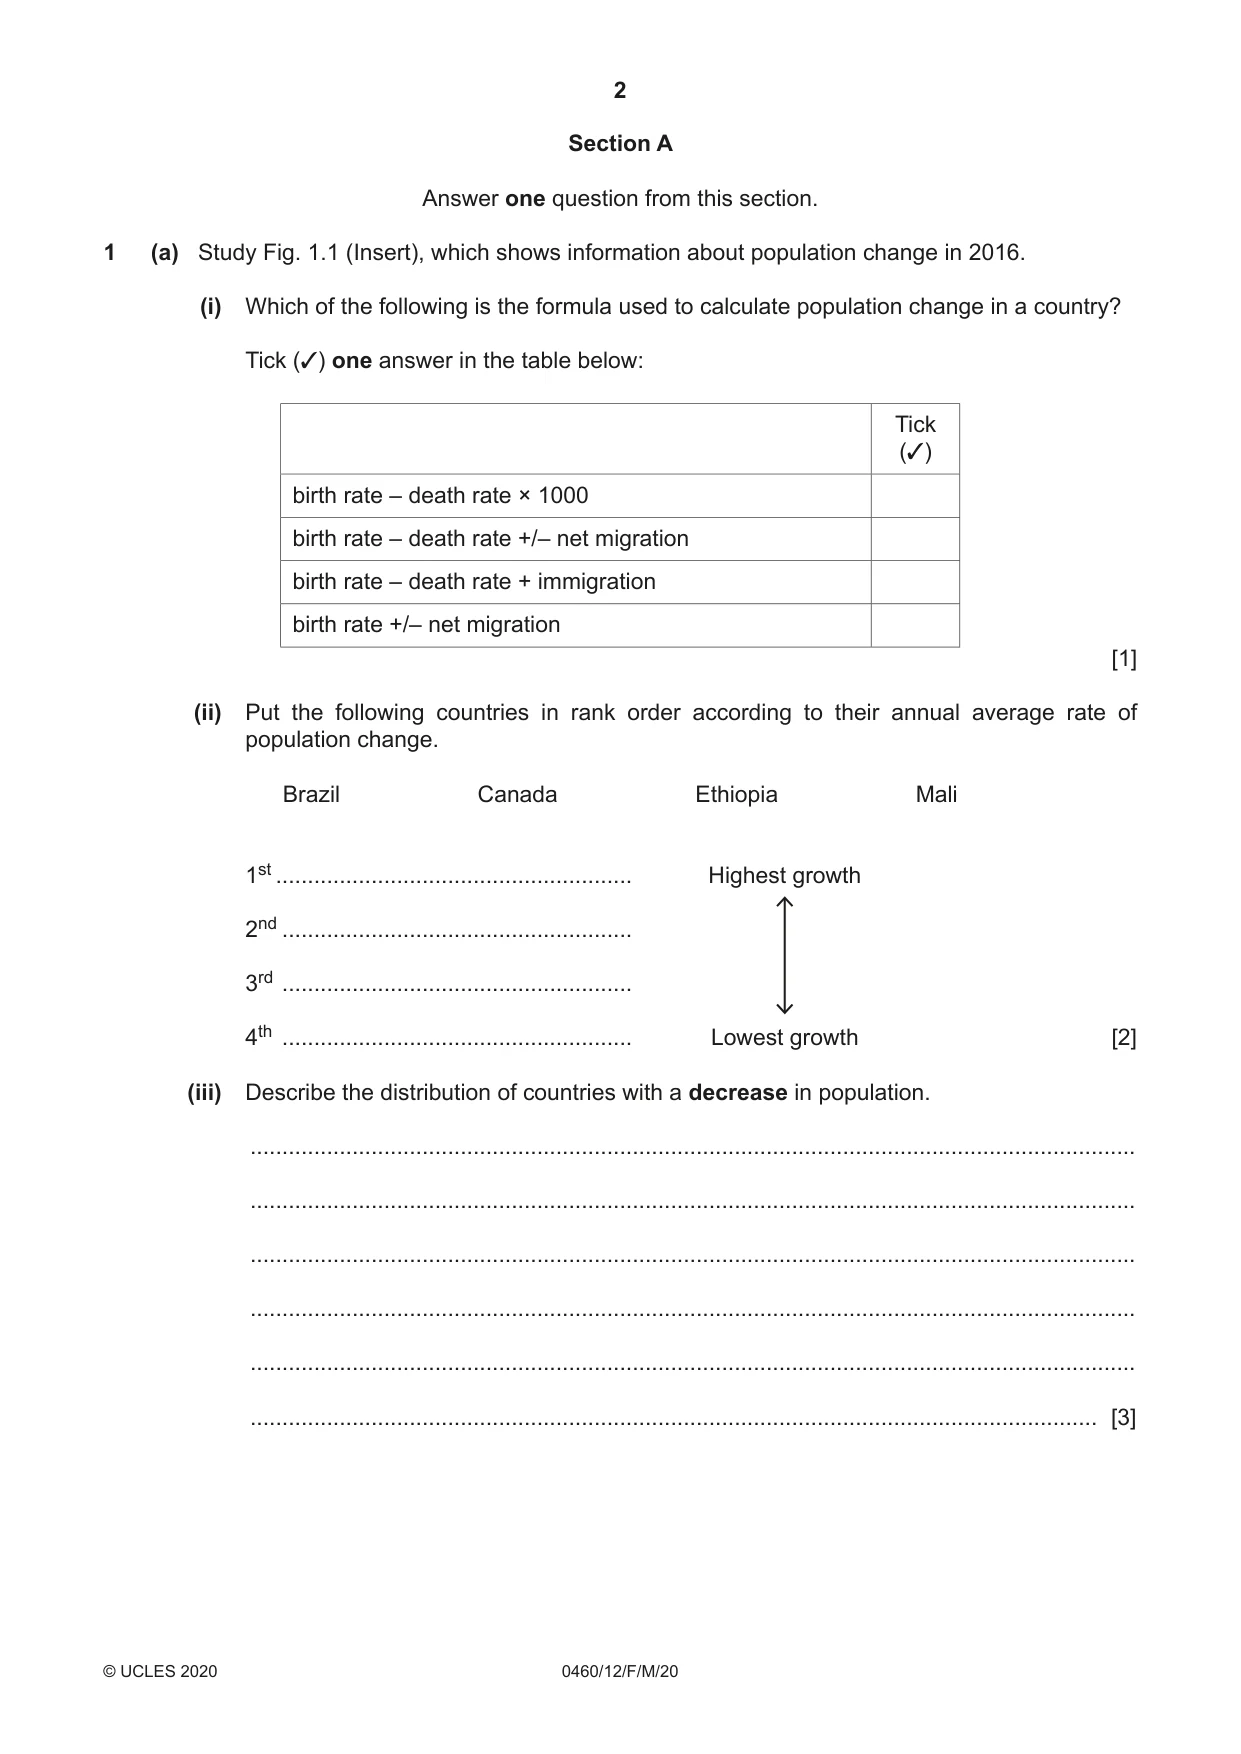
2 0460/12/F/M/20 © UCLES 2020 Section A Answer one question from this section. 1 (a) Study Fig. 1.1 (Insert), which shows information about population change in 2016. (i) Which of the following is the formula used to calculate population change in a country? Tick (✓) one answer in the table below: Tick (✓) birth rate – death rate × 1000 birth rate – death rate +/– net migration birth rate – death rate + immigration birth rate +/– net migration [1] (ii) Put the following countries in rank order according to their annual average rate of population change. Brazil Canada Ethiopia Mali 1st … Highest growth 2nd … 3rd … 4th … Lowest growth [2] (iii) Describe the distribution of countries with a decrease in population. … … … … … … [3]
Question paper, page 3
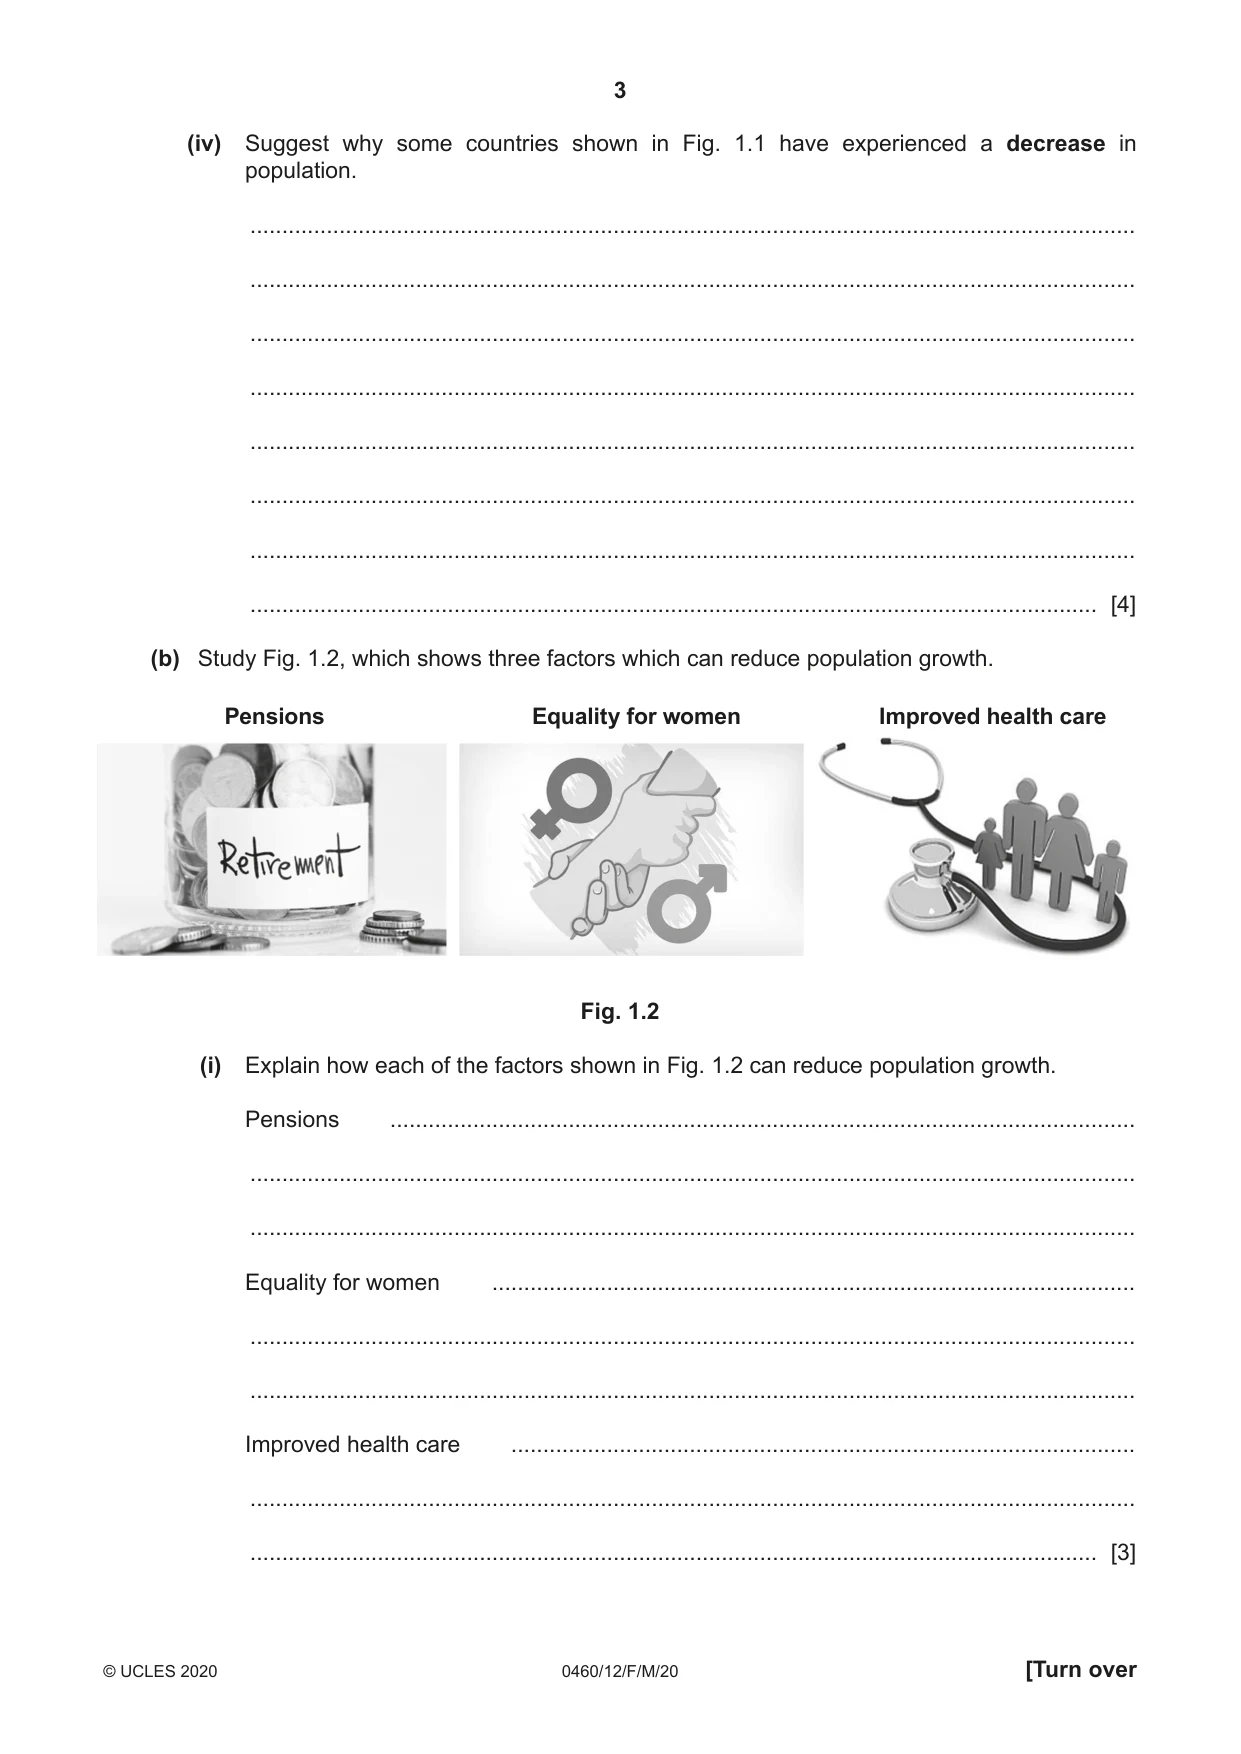
3 0460/12/F/M/20 © UCLES 2020 [Turn over (iv) Suggest why some countries shown in Fig. 1.1 have experienced a decrease in population. … … … … … … … … [4] (b) Study Fig. 1.2, which shows three factors which can reduce population growth. Pensions Equality for women Improved health care Fig. 1.2 (i) Explain how each of the factors shown in Fig. 1.2 can reduce population growth. Pensions … … … Equality for women … … … Improved health care … … … [3]
Question paper, page 4
4 0460/12/F/M/20 © UCLES 2020 (ii) Describe other population policies which governments have used to reduce population growth rates. … … … … … … … … … … [5]
Question paper, page 5
5 0460/12/F/M/20 © UCLES 2020 [Turn over (c) Explain the causes of migration of people from one named country to another. Migration from … to … Explanation … … … … … … … … … … … … … … … … … … … … … … … … … [7] [Total: 25]
Question paper, page 6
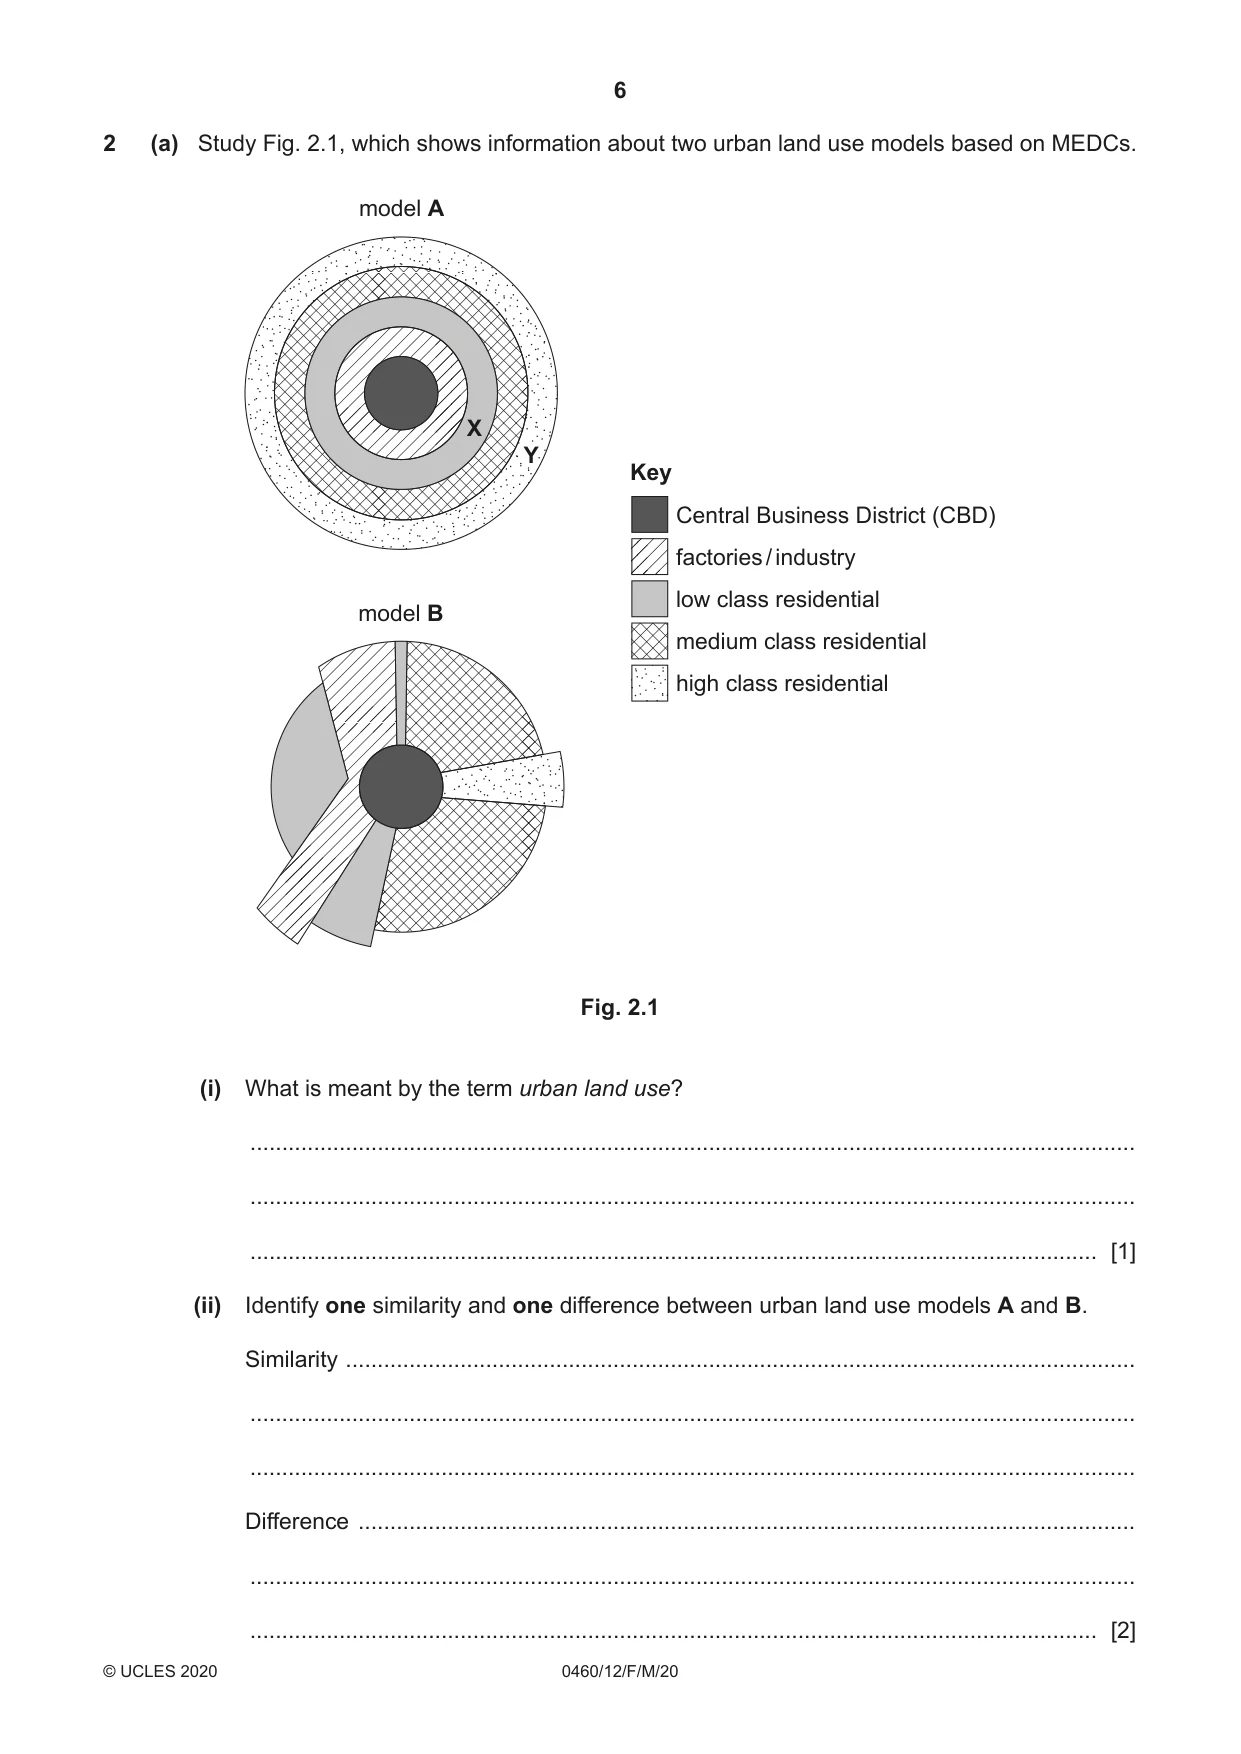
6 0460/12/F/M/20 © UCLES 2020 2 (a) Study Fig. 2.1, which shows information about two urban land use models based on MEDCs. Key Central Business District (CBD) factories / industry low class residential medium class residential high class residential model B model A X Y Fig. 2.1 (i) What is meant by the term urban land use? … … … [1] (ii) Identify one similarity and one difference between urban land use models A and B. Similarity … … … Difference … … … [2]
Question paper, page 7
7 0460/12/F/M/20 © UCLES 2020 [Turn over (iii) Suggest how the residential areas marked at X and Y in Fig. 2.1 are likely to differ from each other. … … … … … … [3] (iv) Explain why redevelopment is taking place close to the CBD in many cities. … … … … … … … … [4]
Question paper, page 8
8 0460/12/F/M/20 © UCLES 2020 (b) Study Fig. 2.2 (Insert), which is a photograph taken in Kiev, Ukraine (an MEDC in Eastern Europe). (i) Identify three pieces of evidence which show that the area in Fig. 2.2 is part of the Central Business District (CBD). 1 … … 2 … … 3 … … [3] (ii) Explain the causes of traffic congestion in the CBD of many large urban areas. … … … … … … … … … … [5]
Question paper, page 9
9 0460/12/F/M/20 © UCLES 2020 [Turn over (c) For a named urban area you have studied, describe the strategies used to reduce traffic congestion. Name of urban area … … … … … … … … … … … … … … … … … … … … … … … … … … [7] [Total: 25]
Question paper, page 10
10 0460/12/F/M/20 © UCLES 2020 Section B Answer one question from this section. 3 (a) Study Figs. 3.1, 3.2 and 3.3 (Insert), which are photographs of different types of cloud. (i) What units are used to measure the amount of cloud cover? Circle one of the following: degrees knots metres oktas [1] (ii) Complete the table below by inserting the types of cloud shown in each of Figs. 3.1, 3.2 and 3.3. Choose from the following cloud types: cirrus cumulus stratus Cloud type Fig. 3.1 Fig. 3.2 Fig. 3.3 [2] (iii) Choose one of Fig. 3.1, Fig. 3.2 or Fig. 3.3. Describe the main characteristics of the clouds shown in the photograph you have chosen. Fig. … … … … … … … [3]
Question paper, page 11
11 0460/12/F/M/20 © UCLES 2020 [Turn over (iv) Explain how cloud type and amount can be recorded over a period of two weeks. … … … … … … … … [4]
Question paper, page 12
12 0460/12/F/M/20 © UCLES 2020 (b) Study Fig. 3.4, which shows data about temperature and relative humidity recorded at a weather station in Darwin, Australia over a period of 24 hours. 0:00 20 0 10 20 30 40 50 60 70 80 90 100 21 22 23 24 25 26 27 28 29 30 31 32 33 34 35 2:00 4:00 6:00 8:00 10:0012:00 time temperature (°C) relative humidity (%) 14:0016:0018:0020:0022:00 Key relative humidity temperature Fig. 3.4 (i) Explain how the relative humidity percentage can be obtained by using a wet-and-dry bulb thermometer (hygrometer). … … … … … … [3]
Question paper, page 13
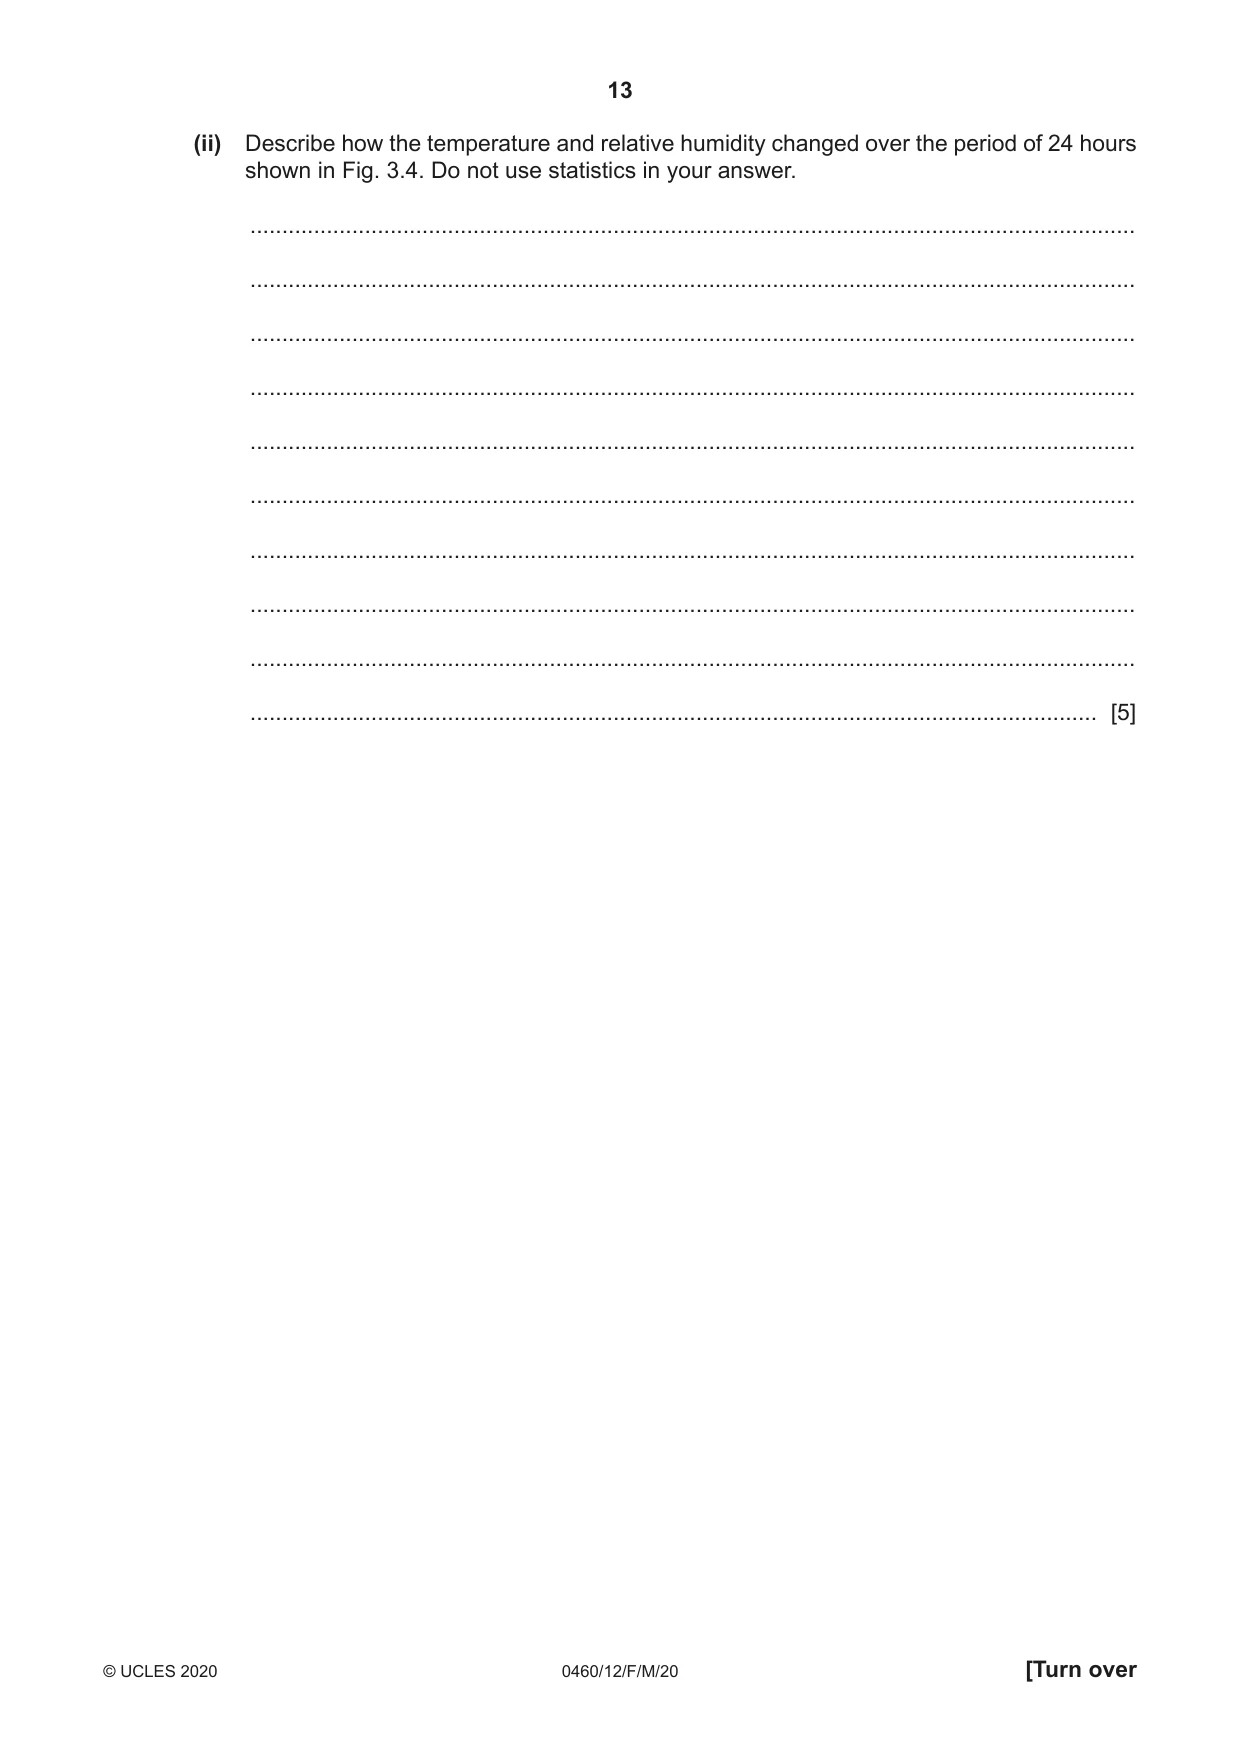
13 0460/12/F/M/20 © UCLES 2020 [Turn over (ii) Describe how the temperature and relative humidity changed over the period of 24 hours shown in Fig. 3.4. Do not use statistics in your answer. … … … … … … … … … … [5]
Question paper, page 14
14 0460/12/F/M/20 © UCLES 2020 (c) Describe and explain the climate of a named hot desert area you have studied. Name of desert area … … … … … … … … … … … … … … … … … … … … … … … … … … [7] [Total: 25]
Question paper, page 15
15 0460/12/F/M/20 © UCLES 2020 [Turn over TURN PAGE FOR QUESTION 4
Question paper, page 16
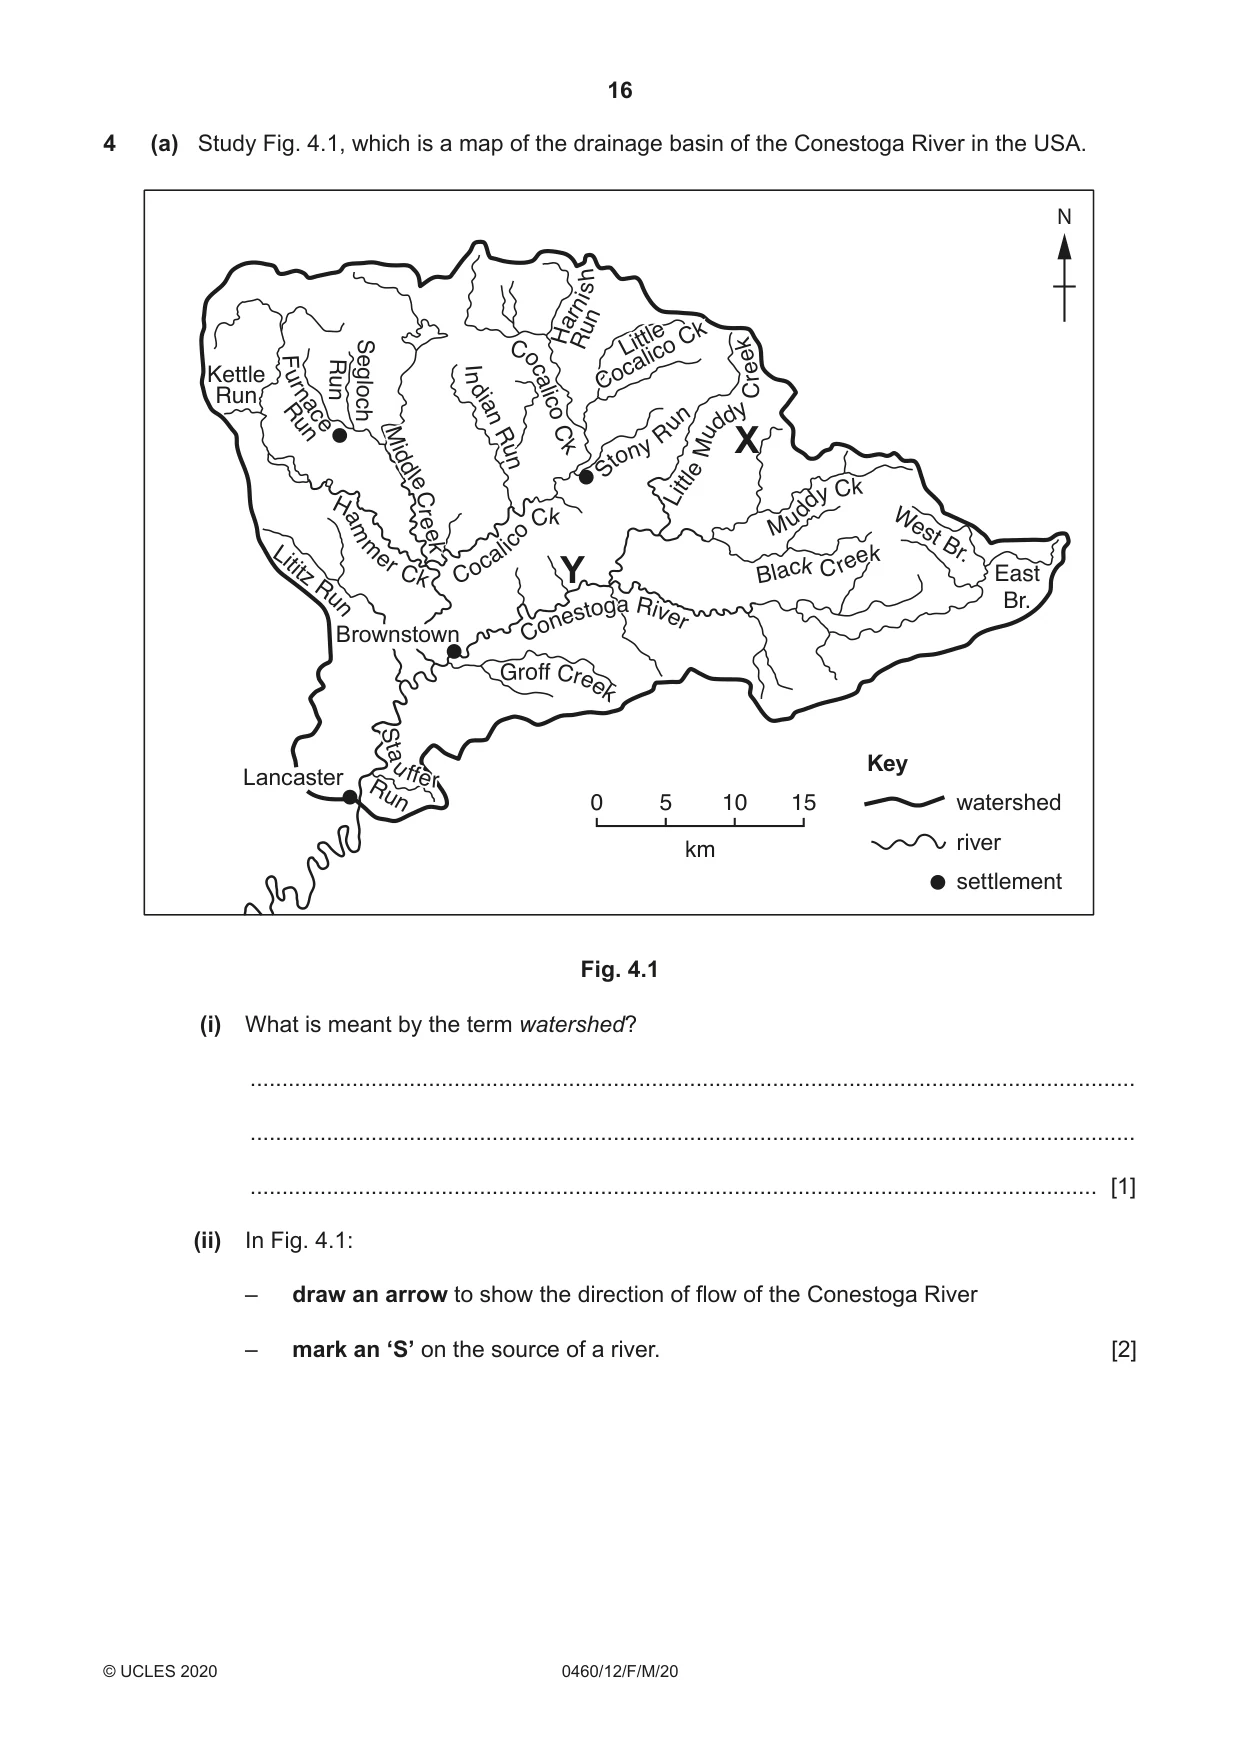
16 0460/12/F/M/20 © UCLES 2020 4 (a) Study Fig. 4.1, which is a map of the drainage basin of the Conestoga River in the USA. Lancaster N 0 15 10 5 km Brownstown Y X Key watershed river settlement Gro ff C r e ek C on es to g a R i v er C on es to g a R i v er B l a c k C r e e k L i ti tz R u n Run Kettle Run Run M id d l e C r ee k In d i a n R un Little Cocalico Ck West Br. East Br. Run Segloch Run H a m m e r C k F ur n ac e M id d l e C r ee k M u d d y C k L i ttle M u d d y C r eek In d i a n R un C o calic o C k S t o n y R u n C o cal i c o C k H a rn i s h S t a u ffe r Fig. 4.1 (i) What is meant by the term watershed? … … … [1] (ii) In Fig. 4.1: – draw an arrow to show the direction of flow of the Conestoga River – mark an ʻSʼ on the source of a river. [2]
Question paper, page 17
17 0460/12/F/M/20 © UCLES 2020 [Turn over (iii) Describe the likely differences between the cross sections of the river valleys at X and Y. … … … … … … [3] (iv) Suggest two benefits and two problems of living close to the river between Lancaster and Brownstown. Benefit 1 … … … Benefit 2 … … … Problem 1 … … … Problem 2 … … … [4]
Question paper, page 18
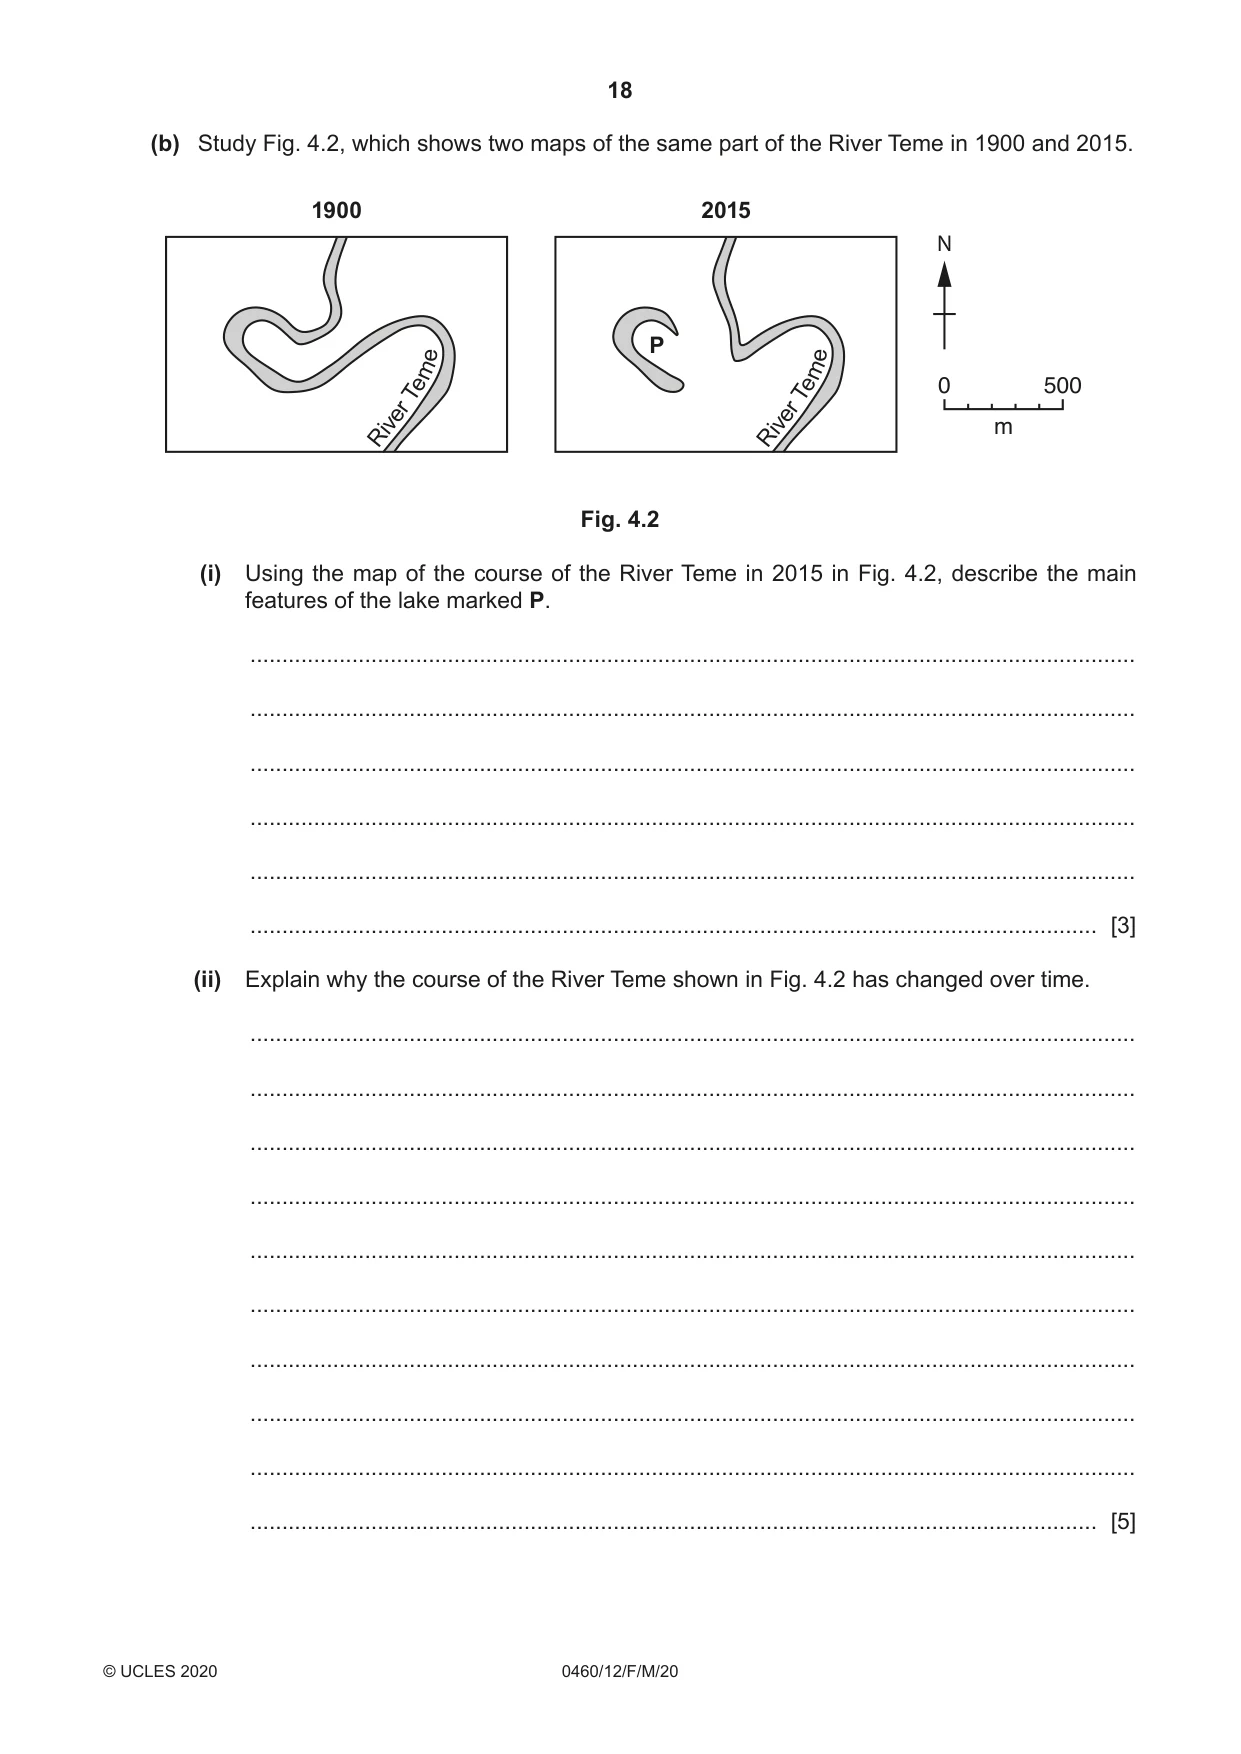
18 0460/12/F/M/20 © UCLES 2020 (b) Study Fig. 4.2, which shows two maps of the same part of the River Teme in 1900 and 2015. 1900 2015 P N Rive r T e m e Rive r T e m e 0 500 m Fig. 4.2 (i) Using the map of the course of the River Teme in 2015 in Fig. 4.2, describe the main features of the lake marked P. … … … … … … [3] (ii) Explain why the course of the River Teme shown in Fig. 4.2 has changed over time. … … … … … … … … … … [5]
Question paper, page 19
19 0460/12/F/M/20 © UCLES 2020 [Turn over (c) Describe the main features of a delta and explain its formation. You may use a labelled diagram. … … … … … … … … … … … … … … … … [7] [Total: 25]
Question paper, page 20
20 0460/12/F/M/20 © UCLES 2020 Section C Answer one question from this section. 5 (a) Study Fig. 5.1 (Insert), which is a map of Sri Lanka (an LEDC in Asia). (i) What is the main physical attraction for tourists in the south west of Sri Lanka? … [1] (ii) Using Fig. 5.1 only, state two different pieces of evidence that conservation is taking place. 1 … … 2 … … [2] (iii) Describe the location of the international airport shown in Fig. 5.1. … … … … … … [3] (iv) Suggest how the infrastructures of LEDCs such as Sri Lanka have been developed as a result of tourism. … … … … … … … … [4]
Question paper, page 21
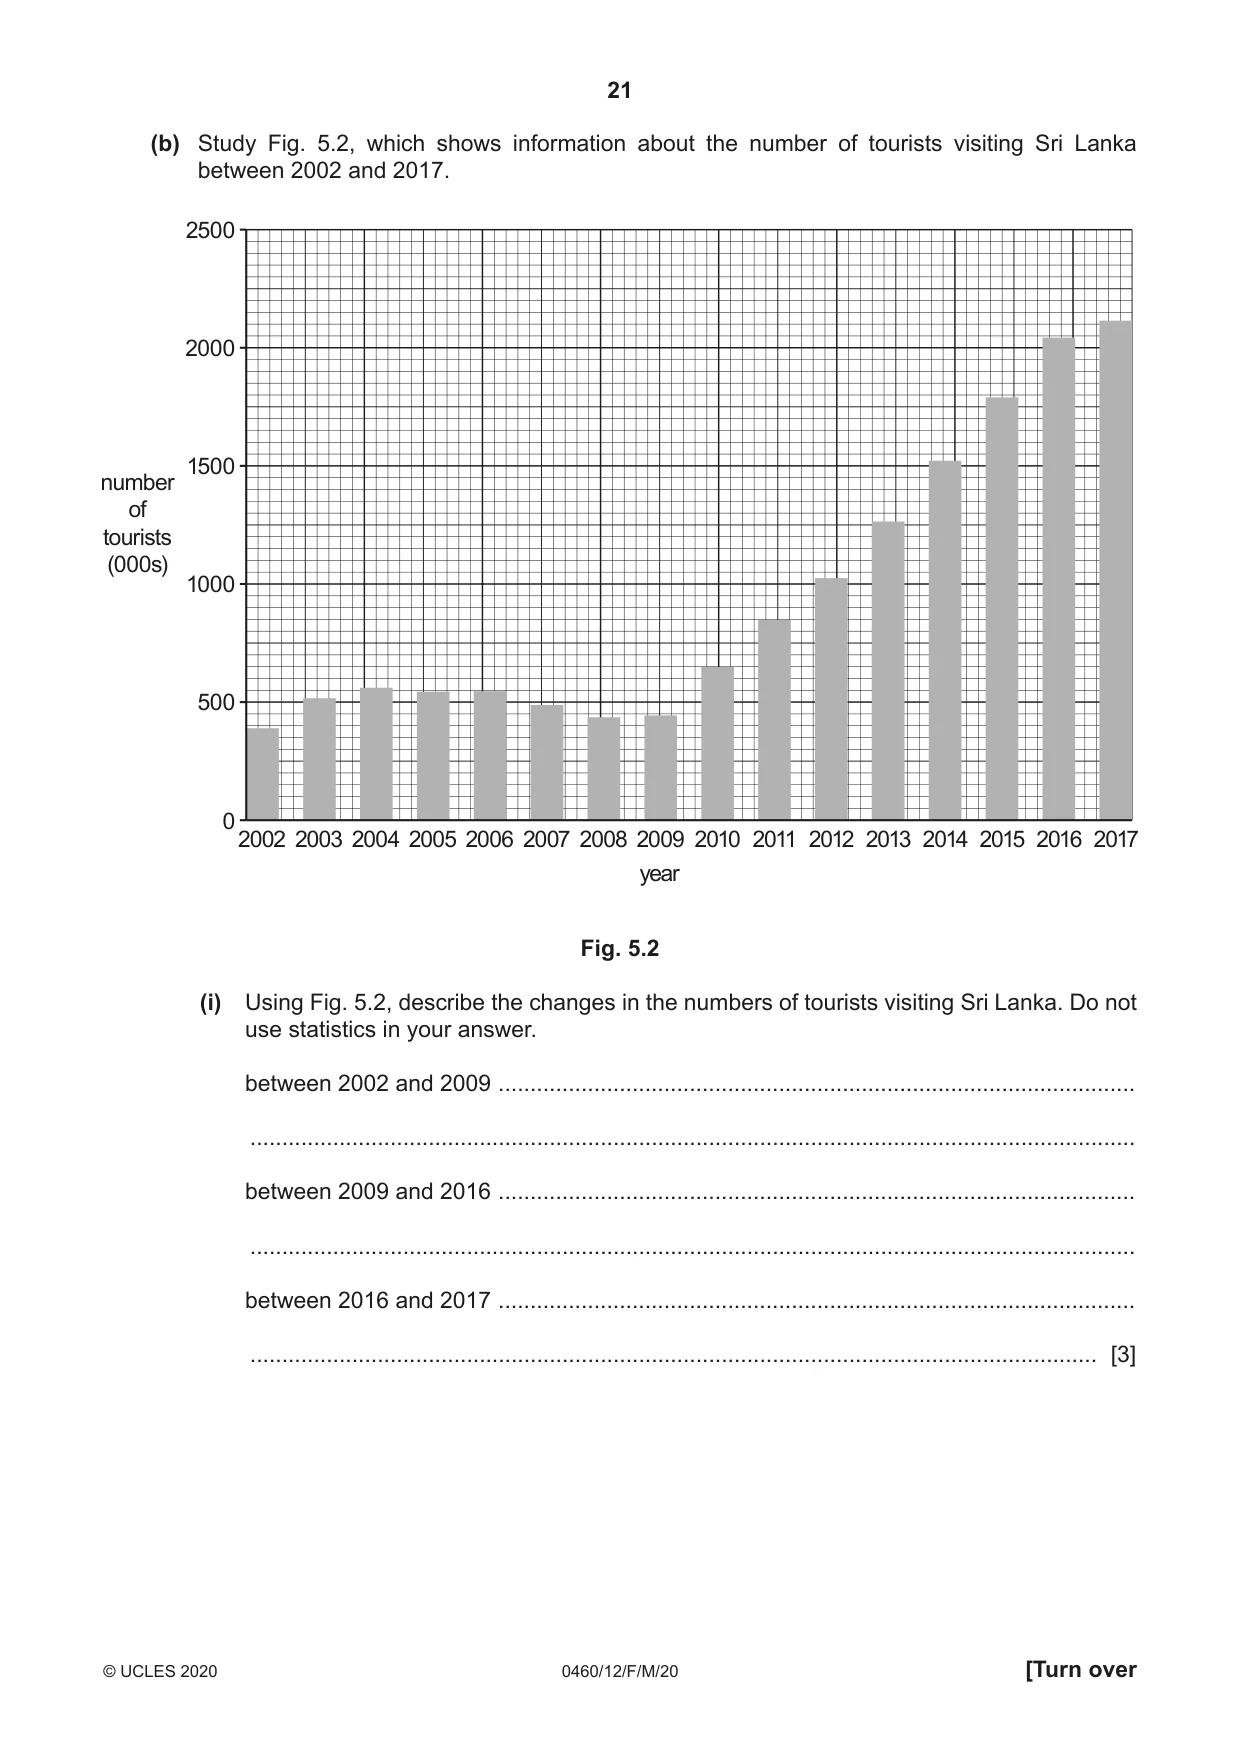
21 0460/12/F/M/20 © UCLES 2020 [Turn over (b) Study Fig. 5.2, which shows information about the number of tourists visiting Sri Lanka between 2002 and 2017. 2002 0 500 1000 number of tourists (000s) 1500 2000 2500 2003 2004 2005 2006 2007 2008 2009 2010 year 2011 2012 2013 2014 2015 2016 2017 Fig. 5.2 (i) Using Fig. 5.2, describe the changes in the numbers of tourists visiting Sri Lanka. Do not use statistics in your answer. between 2002 and 2009 … … between 2009 and 2016 … … between 2016 and 2017 … … [3]
Question paper, page 22
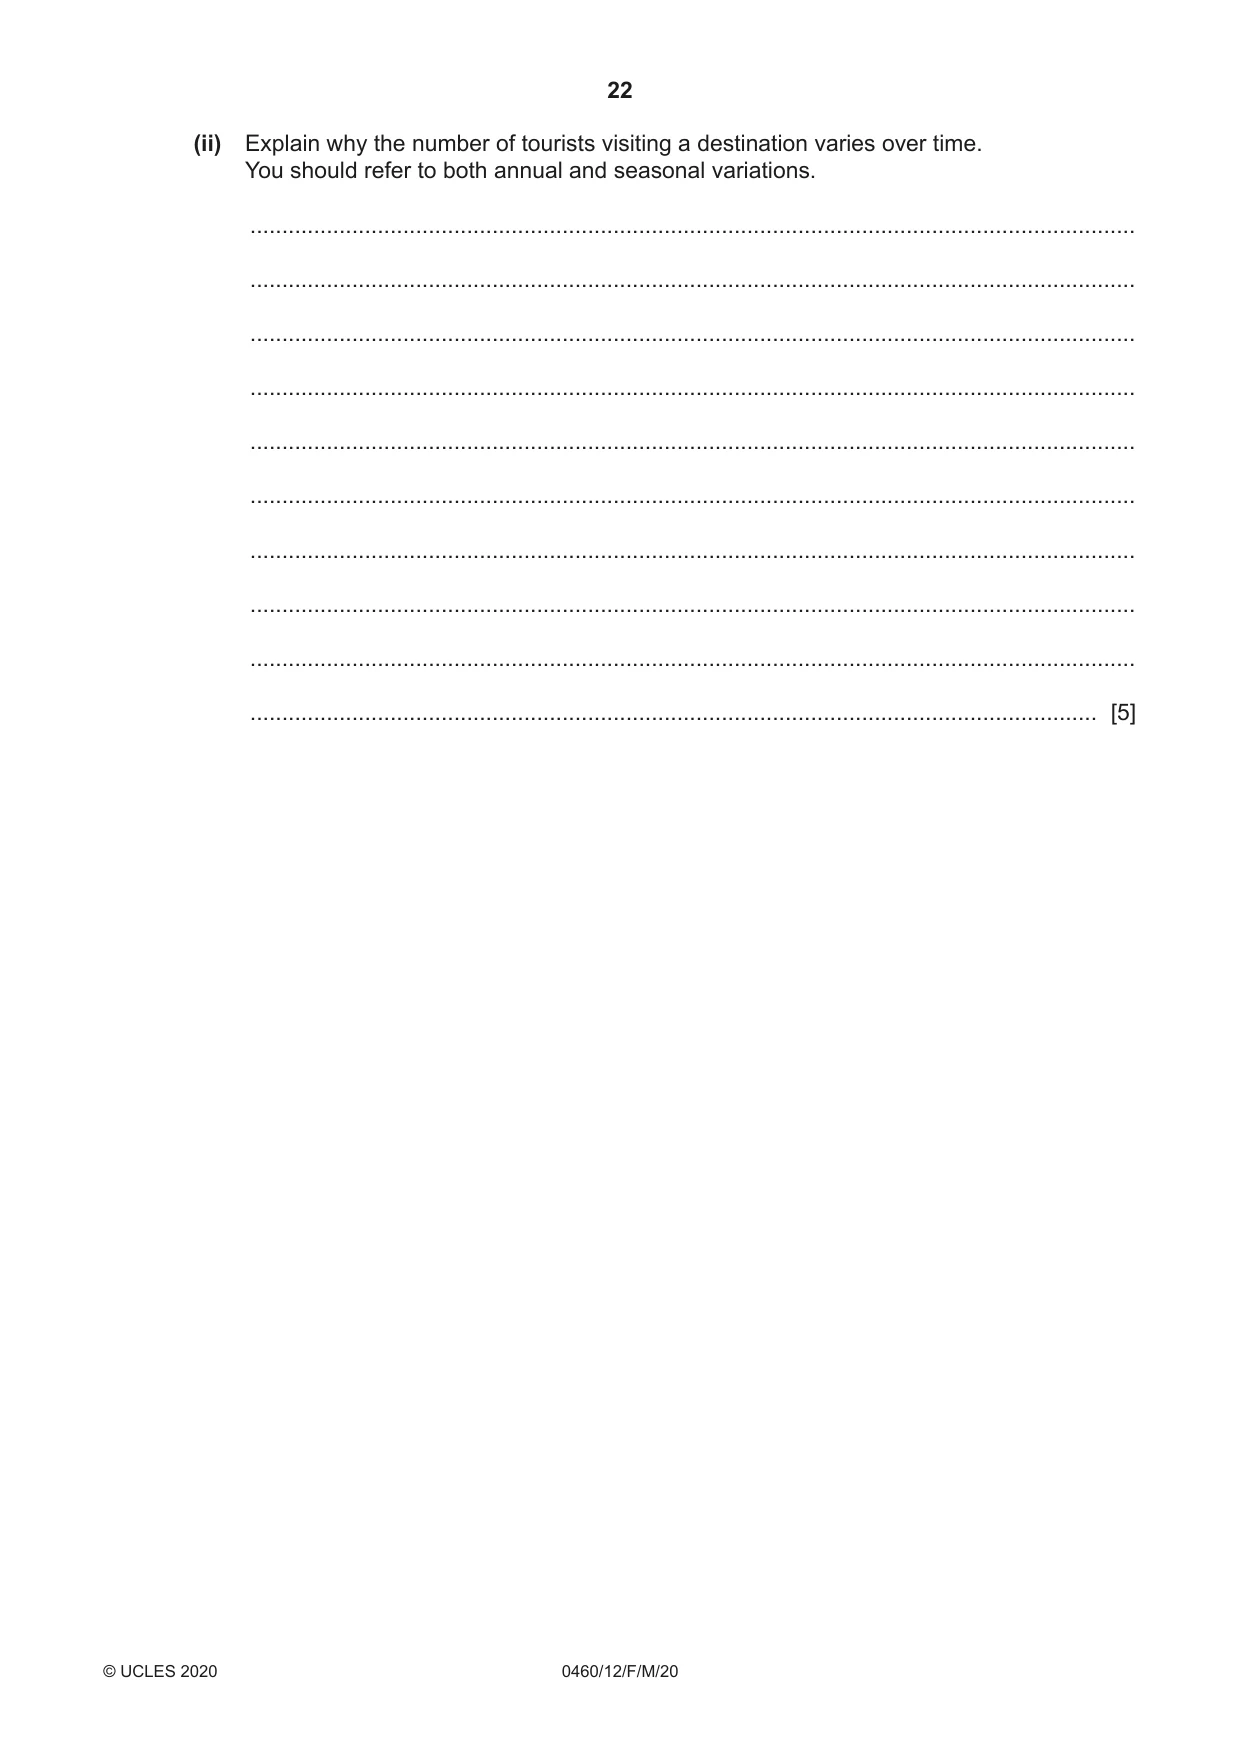
22 0460/12/F/M/20 © UCLES 2020 (ii) Explain why the number of tourists visiting a destination varies over time. You should refer to both annual and seasonal variations. … … … … … … … … … … [5]
Question paper, page 23
23 0460/12/F/M/20 © UCLES 2020 [Turn over (c) For a named area you have studied where tourism is important, describe the disadvantages of the tourist industry for local people. Named area … … … … … … … … … … … … … … … … … … … … … … … … … … [7] [Total: 25]
Question paper, page 24
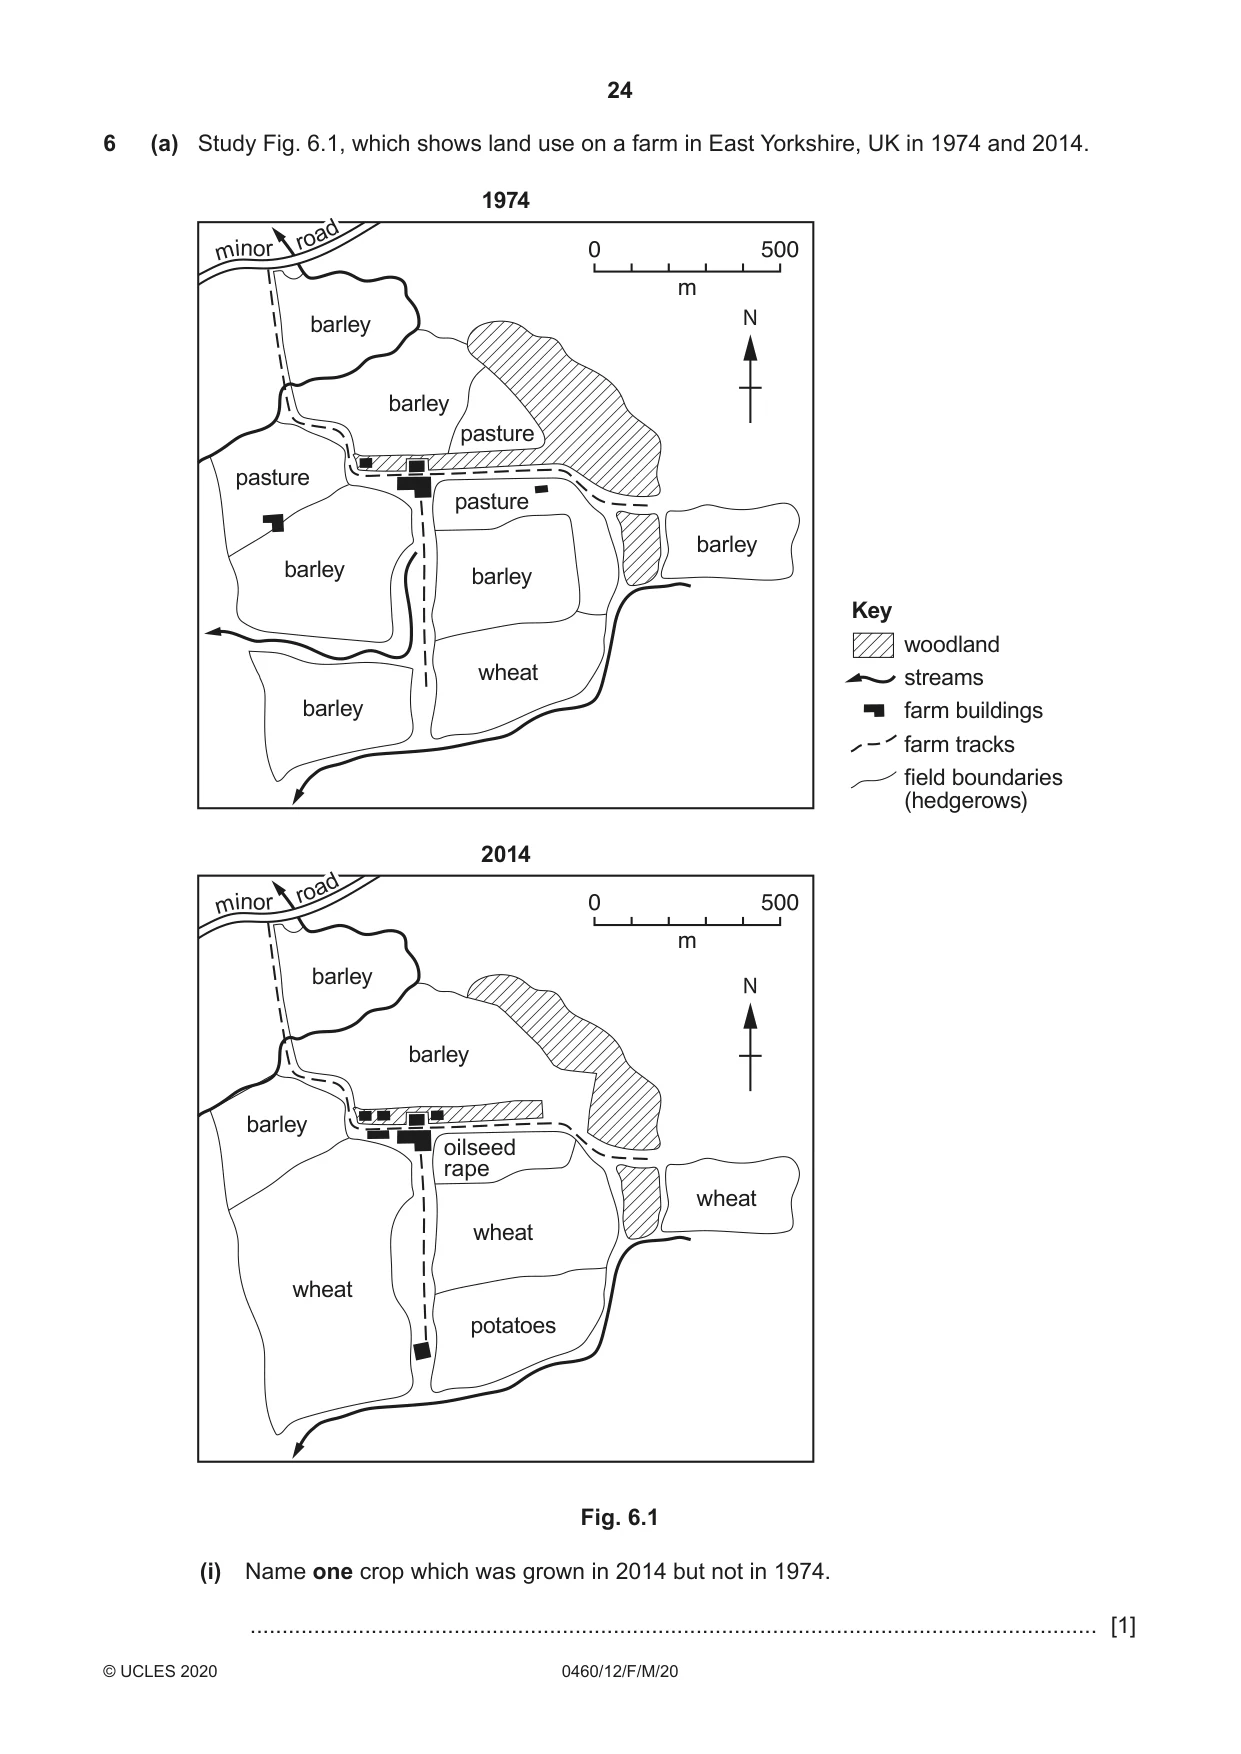
24 0460/12/F/M/20 © UCLES 2020 6 (a) Study Fig. 6.1, which shows land use on a farm in East Yorkshire, UK in 1974 and 2014. barley barley barley barley barley barley barley 1974 2014 barley wheat wheat wheat potatoes oilseed rape wheat barley pasture pasture pasture Key woodland streams farm buildings farm tracks field boundaries (hedgerows) N N 0 500 m 0 500 m m i no r r o ad m i no r r o ad Fig. 6.1 (i) Name one crop which was grown in 2014 but not in 1974. … [1]
Question paper, page 25
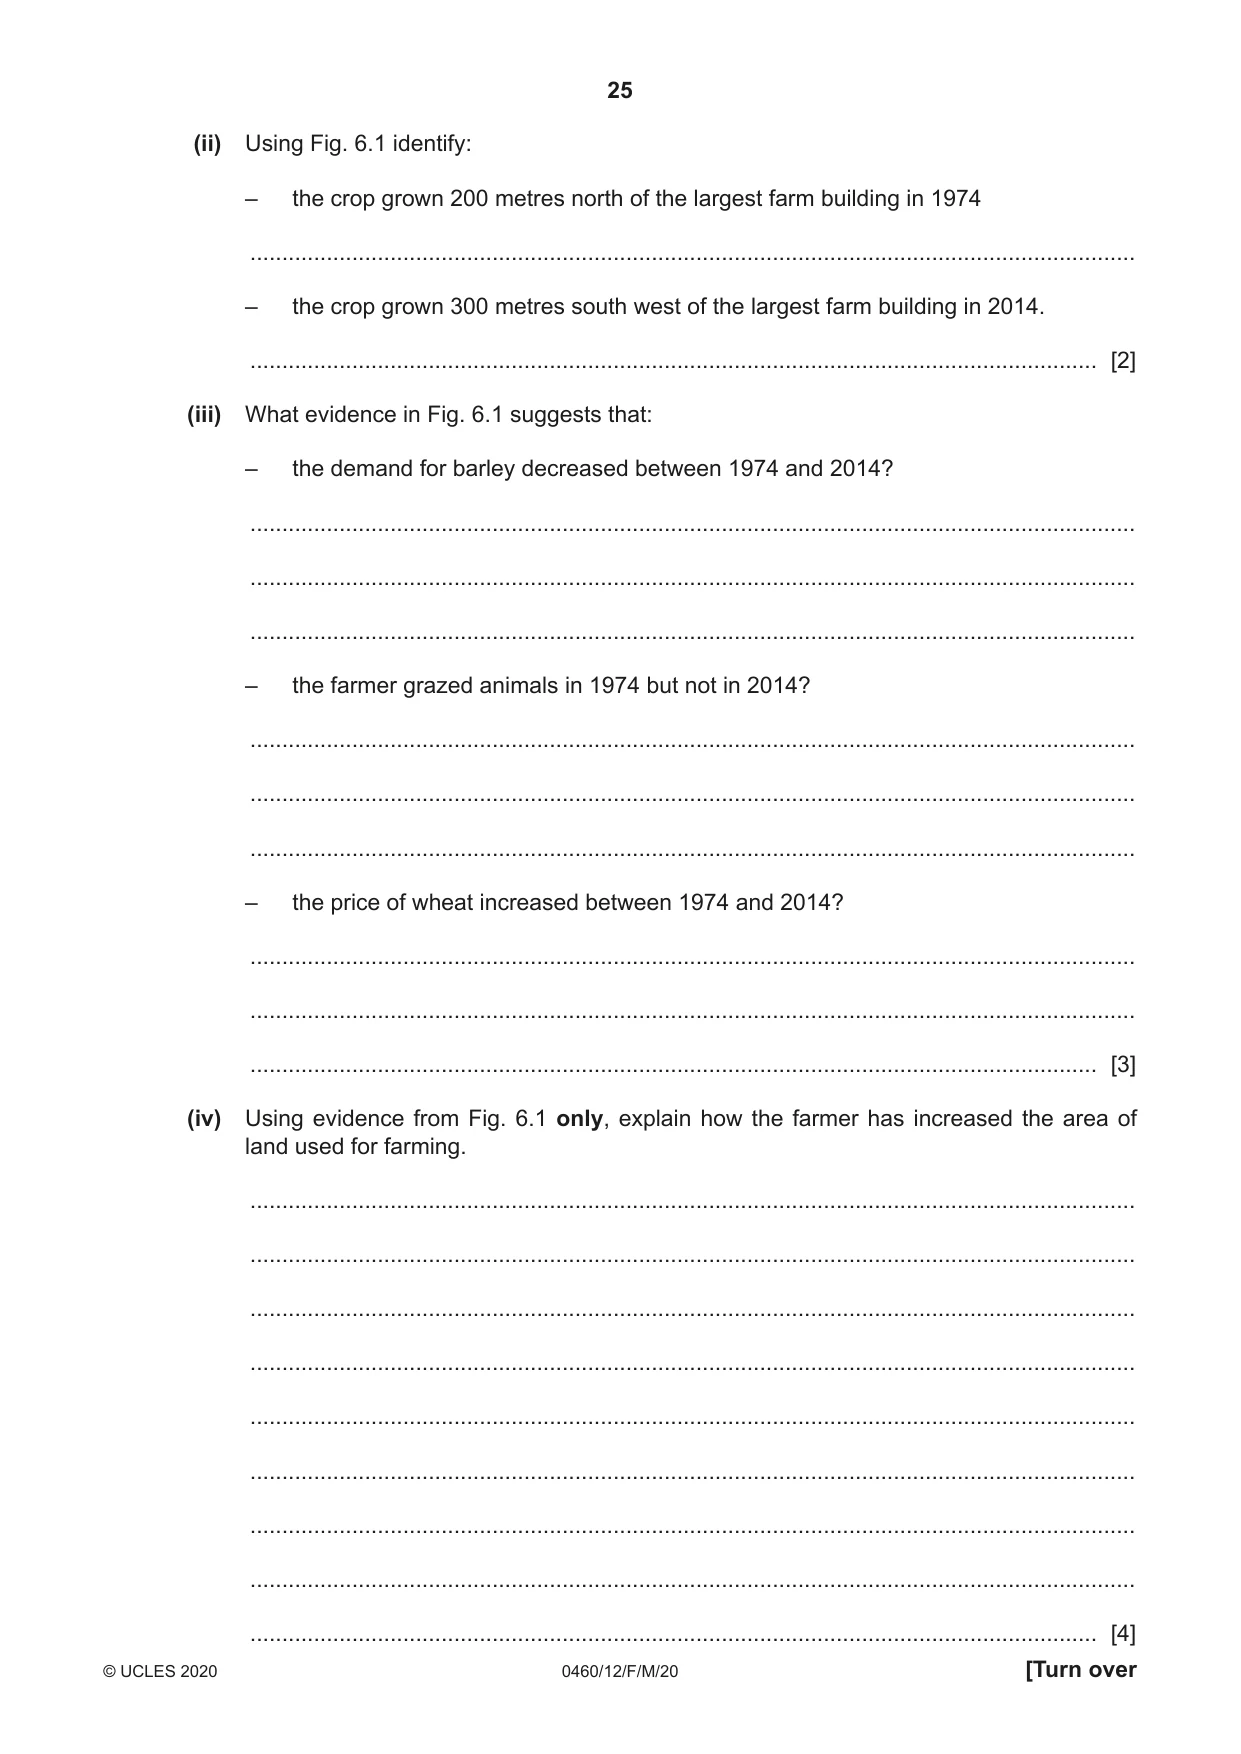
25 0460/12/F/M/20 © UCLES 2020 [Turn over (ii) Using Fig. 6.1 identify: – the crop grown 200 metres north of the largest farm building in 1974 … – the crop grown 300 metres south west of the largest farm building in 2014. … [2] (iii) What evidence in Fig. 6.1 suggests that: – the demand for barley decreased between 1974 and 2014? … … … – the farmer grazed animals in 1974 but not in 2014? … … … – the price of wheat increased between 1974 and 2014? … … … [3] (iv) Using evidence from Fig. 6.1 only, explain how the farmer has increased the area of land used for farming. … … … … … … … … … [4]
Question paper, page 26
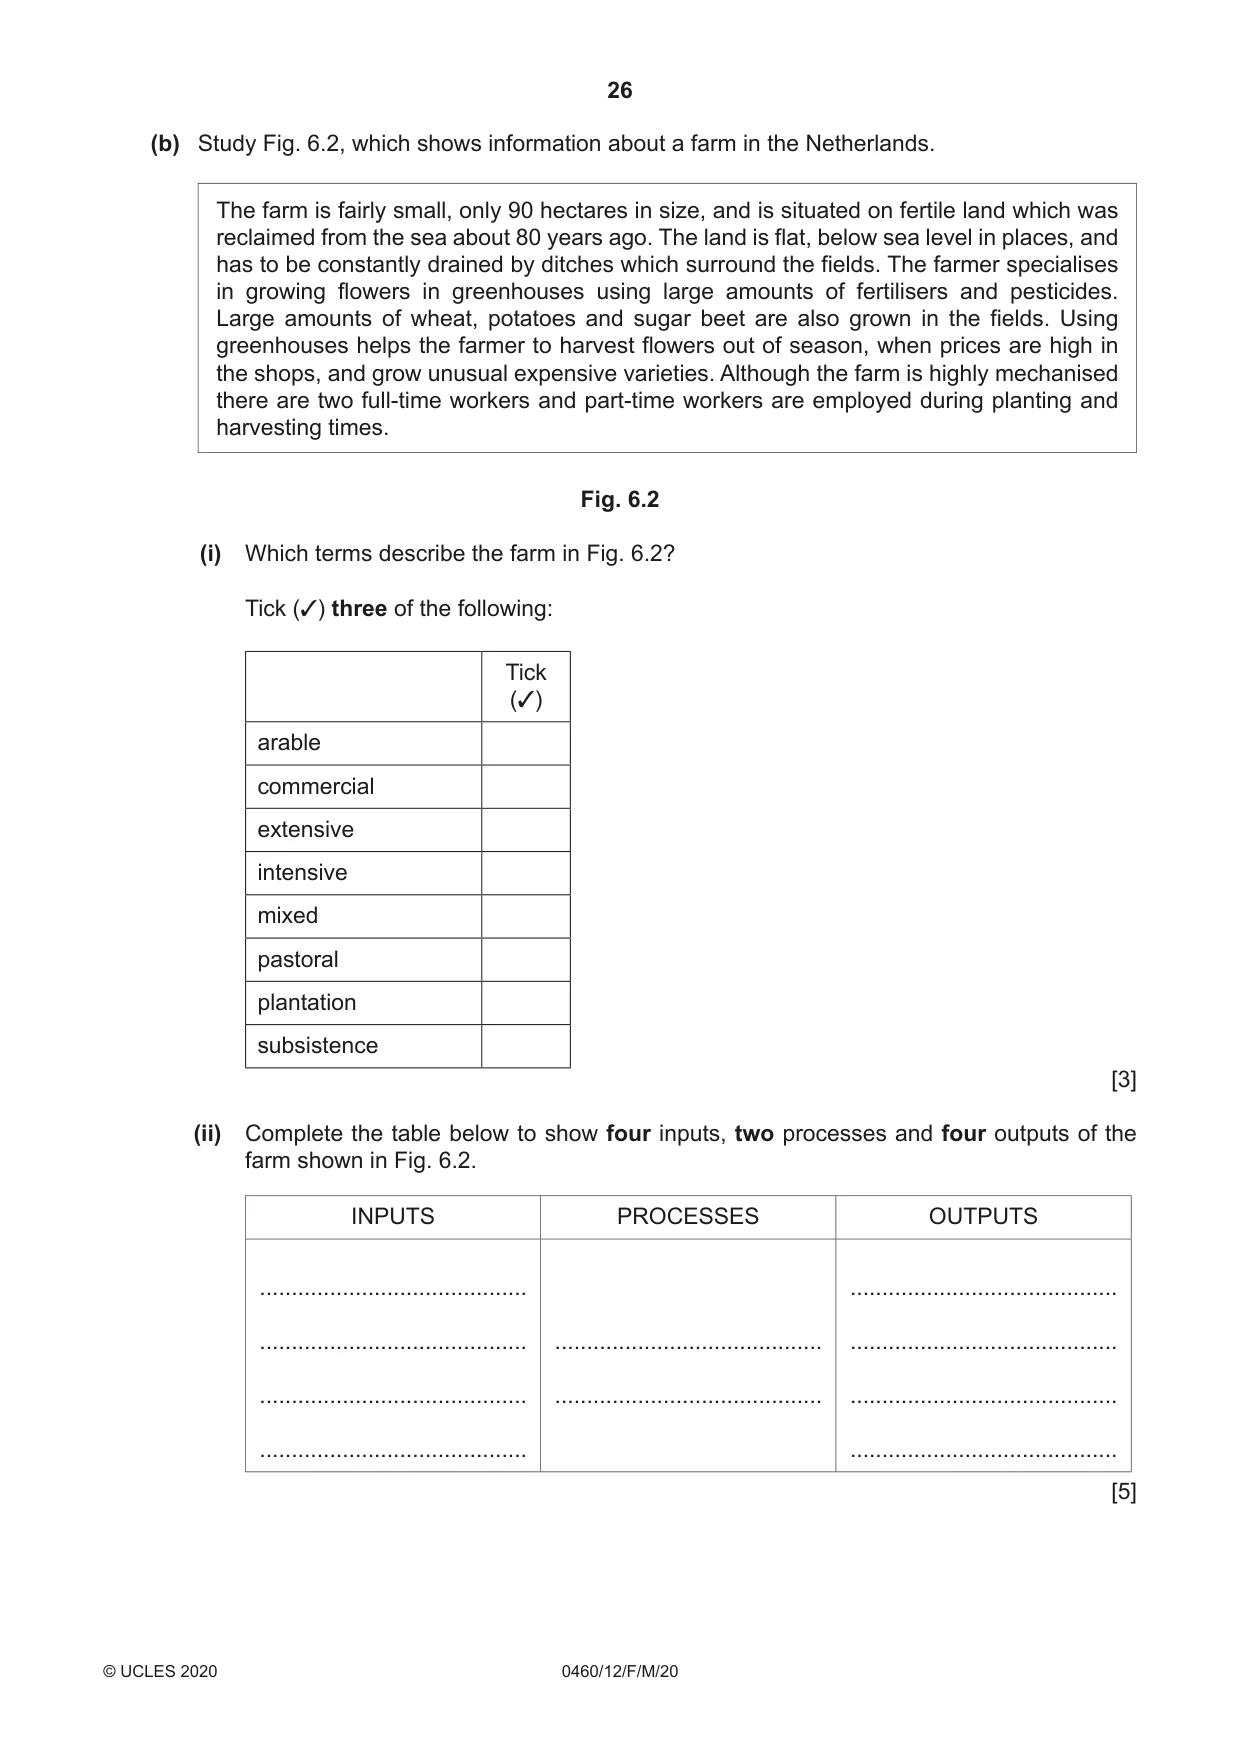
26 0460/12/F/M/20 © UCLES 2020 (b) Study Fig. 6.2, which shows information about a farm in the Netherlands. The farm is fairly small, only 90 hectares in size, and is situated on fertile land which was reclaimed from the sea about 80 years ago. The land is flat, below sea level in places, and has to be constantly drained by ditches which surround the fields. The farmer specialises in growing flowers in greenhouses using large amounts of fertilisers and pesticides. Large amounts of wheat, potatoes and sugar beet are also grown in the fields. Using greenhouses helps the farmer to harvest flowers out of season, when prices are high in the shops, and grow unusual expensive varieties. Although the farm is highly mechanised there are two full-time workers and part-time workers are employed during planting and harvesting times. Fig. 6.2 (i) Which terms describe the farm in Fig. 6.2? Tick (✓) three of the following: Tick (✓) arable commercial extensive intensive mixed pastoral plantation subsistence [3] (ii) Complete the table below to show four inputs, two processes and four outputs of the farm shown in Fig. 6.2. INPUTS PROCESSES OUTPUTS … … … … … … … … … … [5]
Question paper, page 27
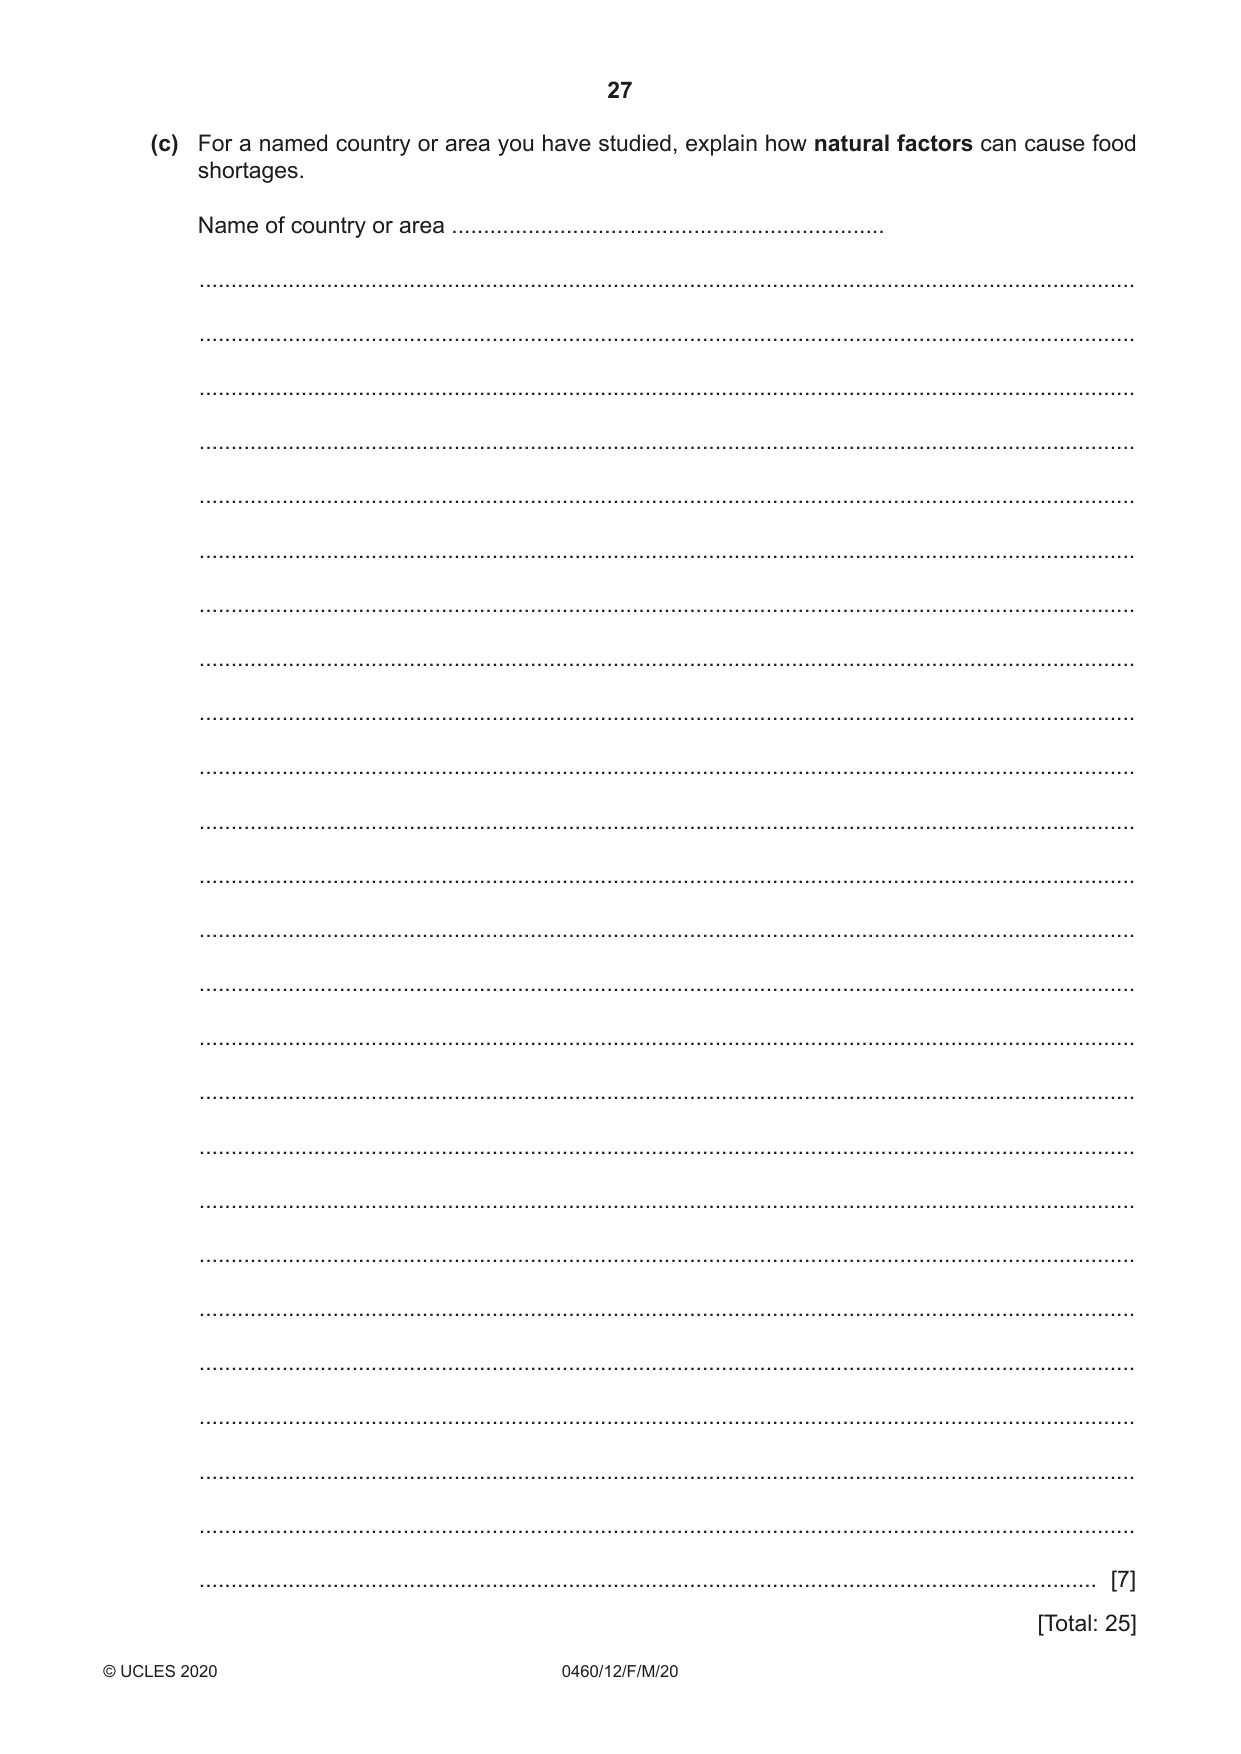
27 0460/12/F/M/20 © UCLES 2020 (c) For a named country or area you have studied, explain how natural factors can cause food shortages. Name of country or area … … … … … … … … … … … … … … … … … … … … … … … … … … [7] [Total: 25]
Question paper, page 28
28 0460/12/F/M/20 © UCLES 2020 Additional Pages If you use the following lined pages to complete the answer(s) to any question(s), the question number(s) must be clearly shown. … … … … … … … … … … … … … … … … … … … … … … … … … …
Question paper, page 29
29 0460/12/F/M/20 © UCLES 2020 … … … … … … … … … … … … … … … … … … … … … … … … … … … …
Question paper, page 30
30 0460/12/F/M/20 © UCLES 2020 BLANK PAGE
Question paper, page 31
31 0460/12/F/M/20 © UCLES 2020 BLANK PAGE
Question paper, page 32
32 0460/12/F/M/20 © UCLES 2020 Permission to reproduce items where third-party owned material protected by copyright is included has been sought and cleared where possible. Every reasonable effort has been made by the publisher (UCLES) to trace copyright holders, but if any items requiring clearance have unwittingly been included, the publisher will be pleased to make amends at the earliest possible opportunity. To avoid the issue of disclosure of answer-related information to candidates, all copyright acknowledgements are reproduced online in the Cambridge Assessment International Education Copyright Acknowledgements Booklet. This is produced for each series of examinations and is freely available to download at www.cambridgeinternational.org after the live examination series. Cambridge Assessment International Education is part of the Cambridge Assessment Group. Cambridge Assessment is the brand name of the University of Cambridge Local Examinations Syndicate (UCLES), which itself is a department of the University of Cambridge. BLANK PAGE
Mark scheme, page 1
This document consists of 14 printed pages. © UCLES 2020 [Turn over Cambridge IGCSE™ GEOGRAPHY 0460/12 Paper 1 March 2020 MARK SCHEME Maximum Mark: 75 Published This mark scheme is published as an aid to teachers and candidates, to indicate the requirements of the examination. It shows the basis on which Examiners were instructed to award marks. It does not indicate the details of the discussions that took place at an Examiners’ meeting before marking began, which would have considered the acceptability of alternative answers. Mark schemes should be read in conjunction with the question paper and the Principal Examiner Report for Teachers. Cambridge International will not enter into discussions about these mark schemes. Cambridge International is publishing the mark schemes for the March 2020 series for most Cambridge IGCSE™, Cambridge International A and AS Level components and some Cambridge O Level components.
Mark scheme, page 2
0460/12 Cambridge IGCSE – Mark Scheme PUBLISHED March 2020 © UCLES 2020 Page 2 of 14 Generic Marking Principles These general marking principles must be applied by all examiners when marking candidate answers. They should be applied alongside the specific content of the mark scheme or generic level descriptors for a question. Each question paper and mark scheme will also comply with these marking principles. GENERIC MARKING PRINCIPLE 1: Marks must be awarded in line with: • the specific content of the mark scheme or the generic level descriptors for the question • the specific skills defined in the mark scheme or in the generic level descriptors for the question • the standard of response required by a candidate as exemplified by the standardisation scripts. GENERIC MARKING PRINCIPLE 2: Marks awarded are always whole marks (not half marks, or other fractions). GENERIC MARKING PRINCIPLE 3: Marks must be awarded positively: • marks are awarded for correct/valid answers, as defined in the mark scheme. However, credit is given for valid answers which go beyond the scope of the syllabus and mark scheme, referring to your Team Leader as appropriate • marks are awarded when candidates clearly demonstrate what they know and can do • marks are not deducted for errors • marks are not deducted for omissions • answers should only be judged on the quality of spelling, punctuation and grammar when these features are specifically assessed by the question as indicated by the mark scheme. The meaning, however, should be unambiguous. GENERIC MARKING PRINCIPLE 4: Rules must be applied consistently e.g. in situations where candidates have not followed instructions or in the application of generic level descriptors. GENERIC MARKING PRINCIPLE 5: Marks should be awarded using the full range of marks defined in the mark scheme for the question (however; the use of the full mark range may be limited according to the quality of the candidate responses seen). GENERIC MARKING PRINCIPLE 6: Marks awarded are based solely on the requirements as defined in the mark scheme. Marks should not be awarded with grade thresholds or grade descriptors in mind.
Mark scheme, page 3
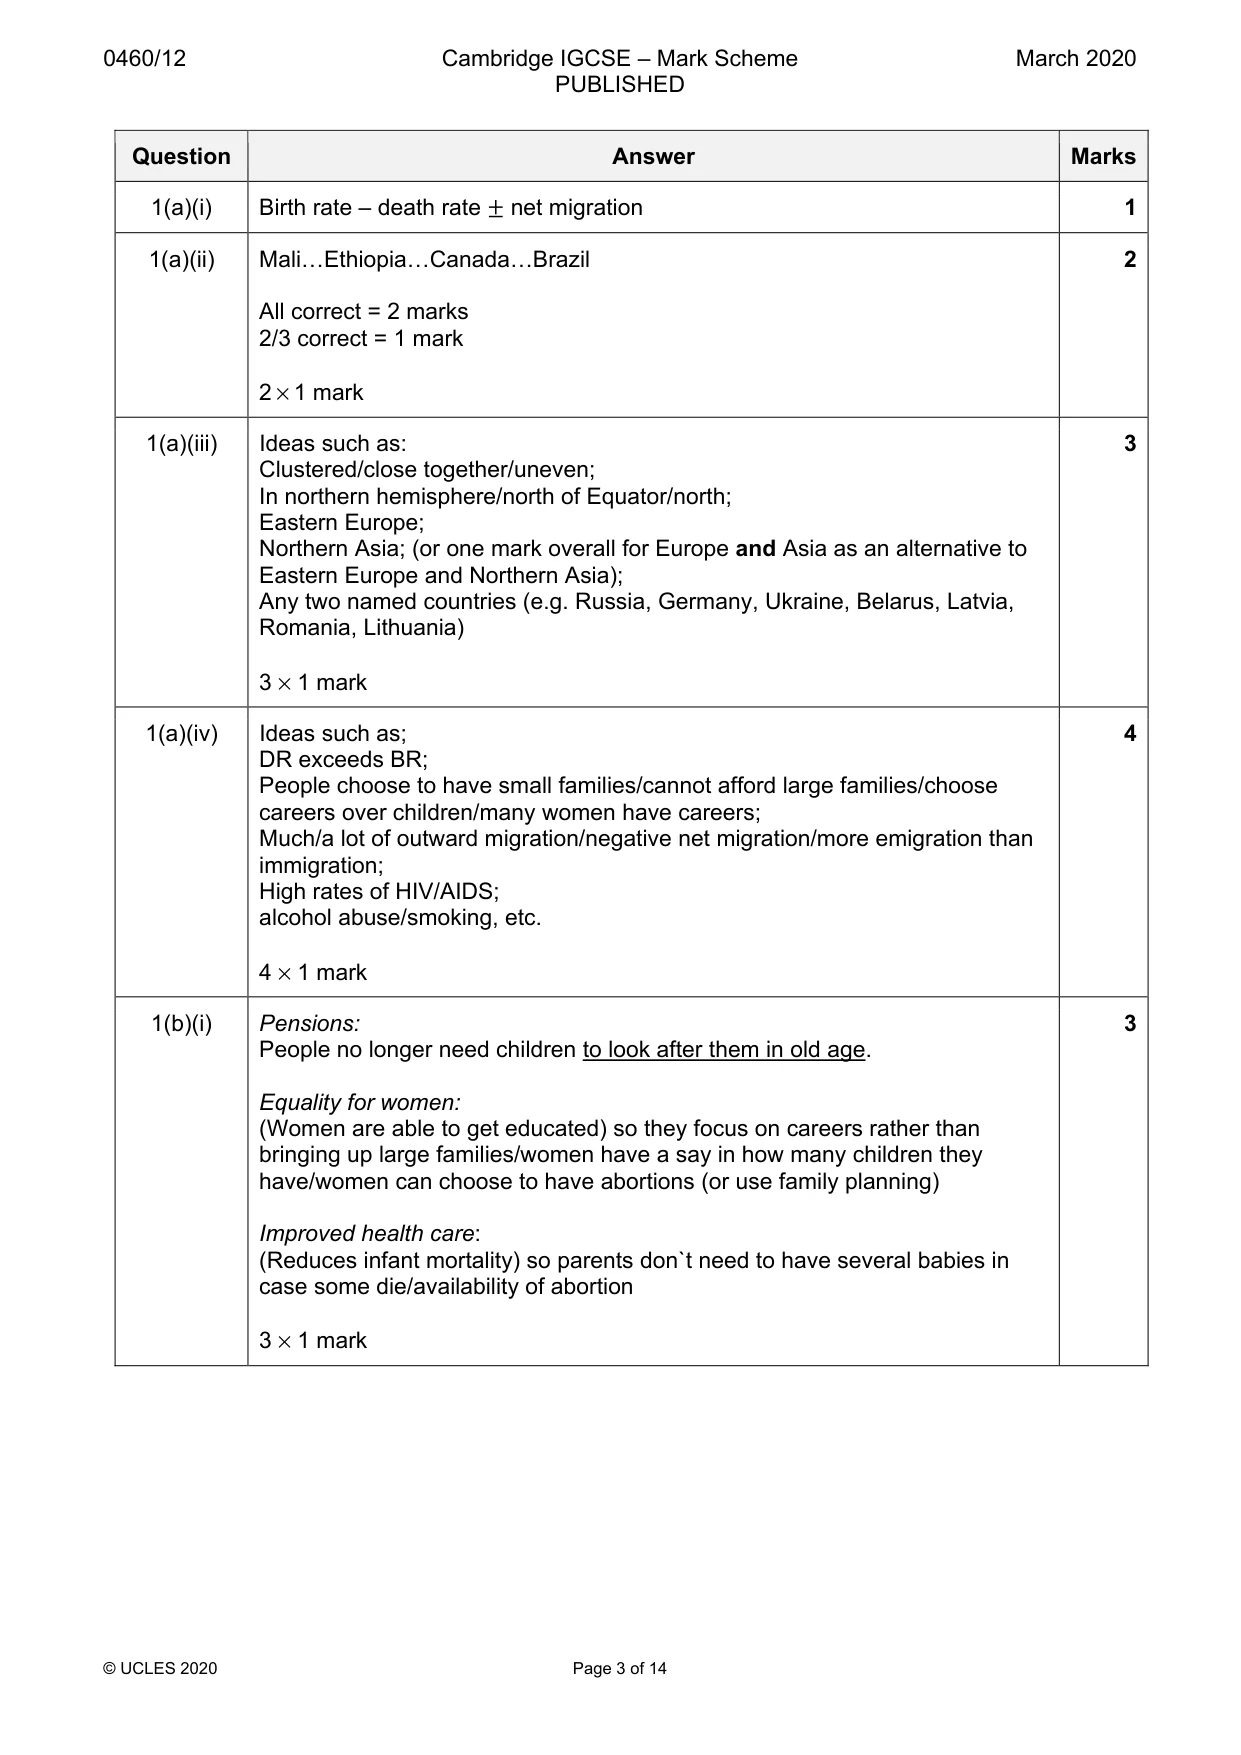
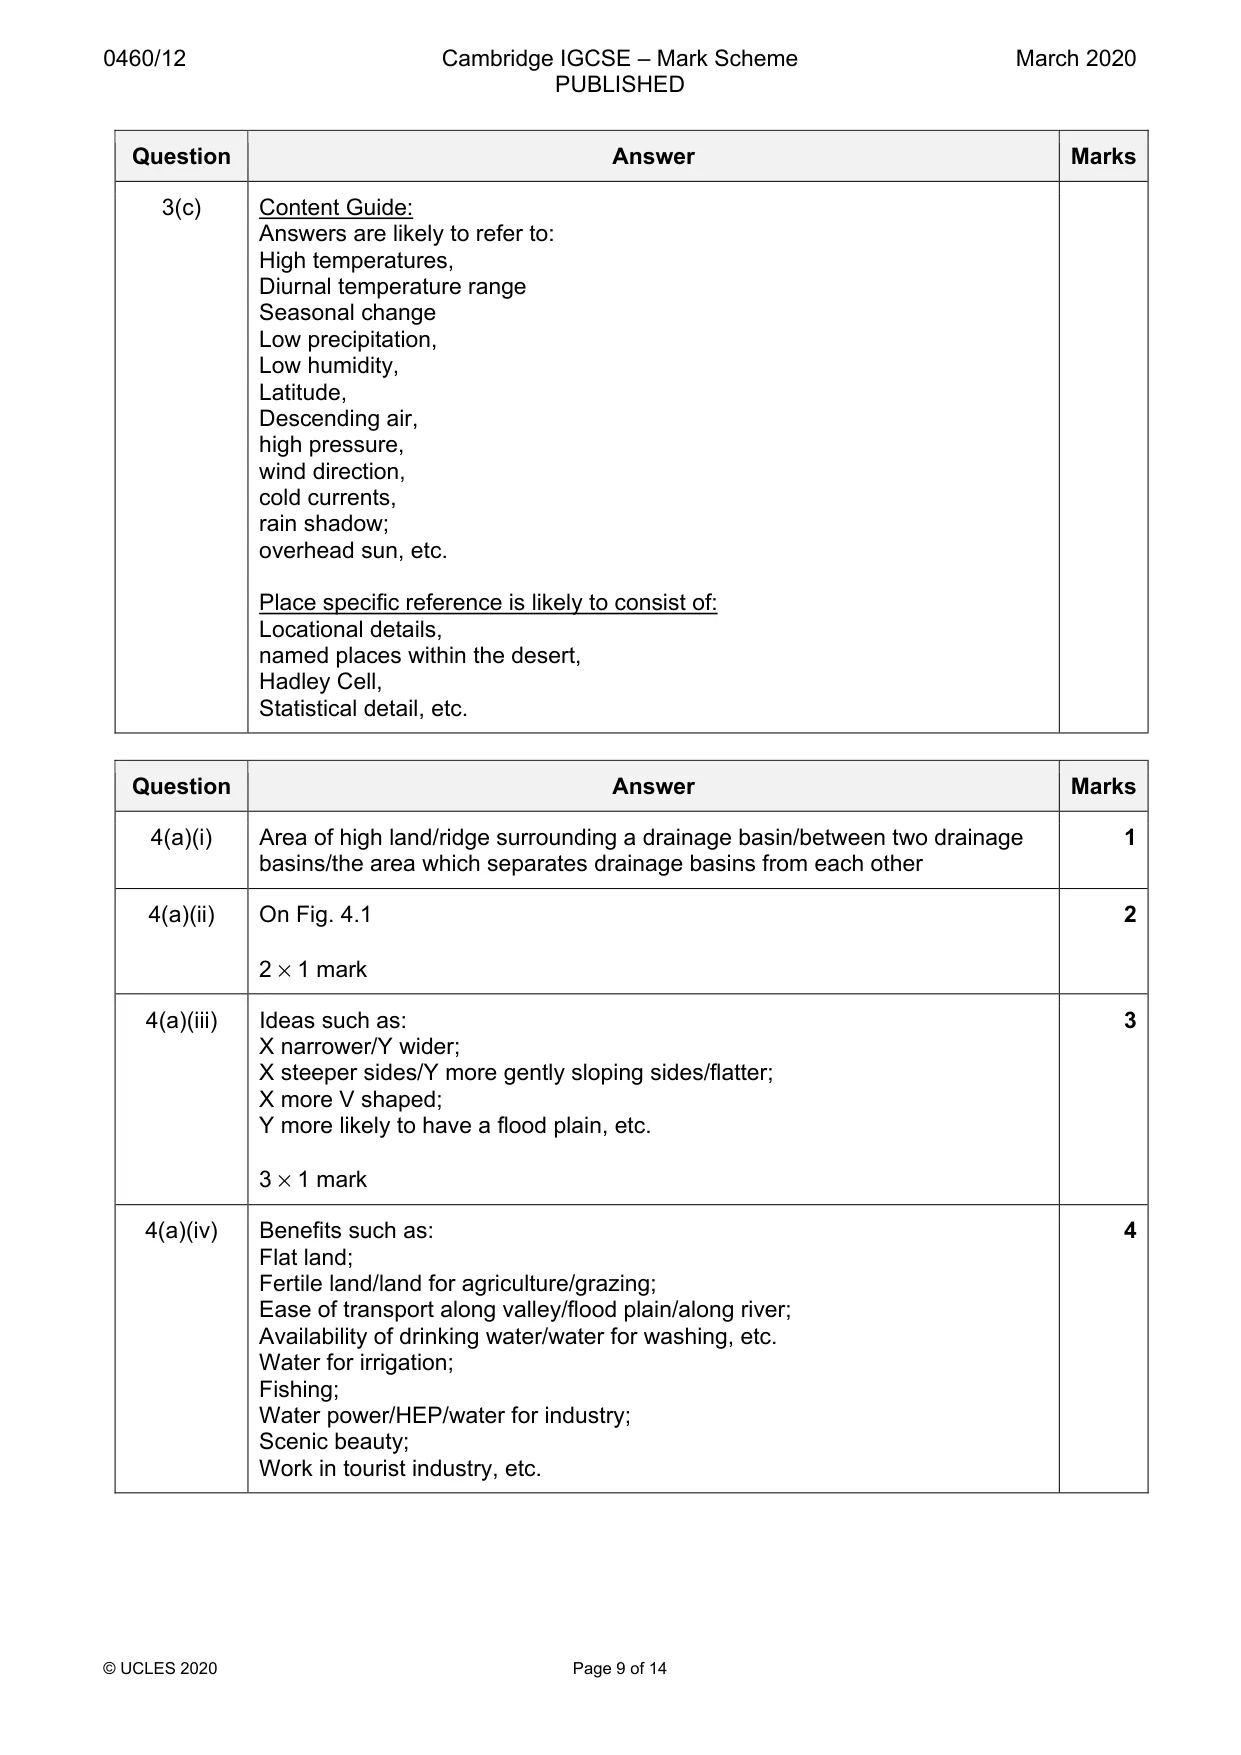
0460/12 Cambridge IGCSE – Mark Scheme PUBLISHED March 2020 © UCLES 2020 Page 3 of 14 Question Answer Marks 1(a)(i) Birth rate – death rate ± net migration 1 1(a)(ii) Mali…Ethiopia…Canada…Brazil All correct = 2 marks 2/3 correct = 1 mark 2 × 1 mark 2 1(a)(iii) Ideas such as: Clustered/close together/uneven; In northern hemisphere/north of Equator/north; Eastern Europe; Northern Asia; (or one mark overall for Europe and Asia as an alternative to Eastern Europe and Northern Asia); Any two named countries (e.g. Russia, Germany, Ukraine, Belarus, Latvia, Romania, Lithuania) 3 × 1 mark 3 1(a)(iv) Ideas such as; DR exceeds BR; People choose to have small families/cannot afford large families/choose careers over children/many women have careers; Much/a lot of outward migration/negative net migration/more emigration than immigration; High rates of HIV/AIDS; alcohol abuse/smoking, etc. 4 × 1 mark 4 1(b)(i) Pensions: People no longer need children to look after them in old age. Equality for women: (Women are able to get educated) so they focus on careers rather than bringing up large families/women have a say in how many children they have/women can choose to have abortions (or use family planning) Improved health care: (Reduces infant mortality) so parents don`t need to have several babies in case some die/availability of abortion 3 × 1 mark 3
Mark scheme, page 4
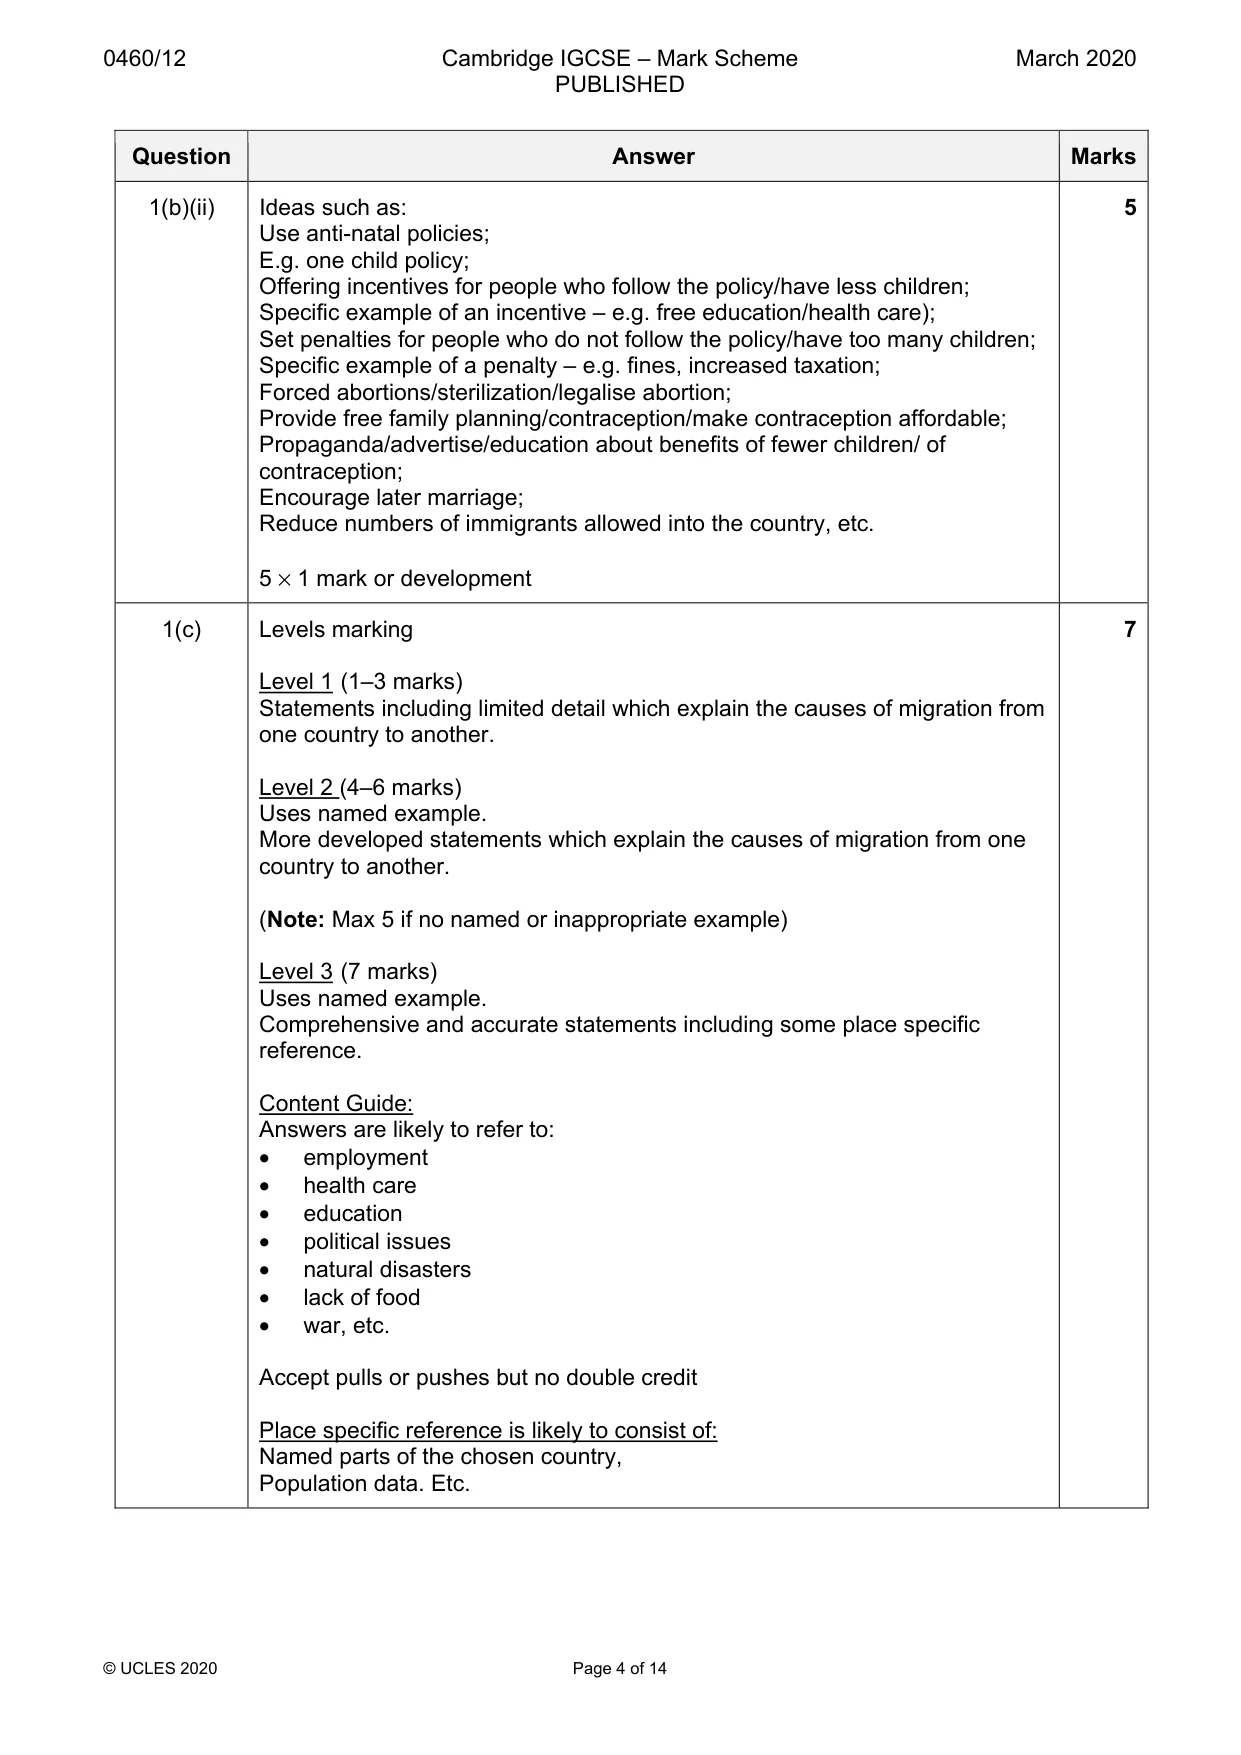
0460/12 Cambridge IGCSE – Mark Scheme PUBLISHED March 2020 © UCLES 2020 Page 4 of 14 Question Answer Marks 1(b)(ii) Ideas such as: Use anti-natal policies; E.g. one child policy; Offering incentives for people who follow the policy/have less children; Specific example of an incentive – e.g. free education/health care); Set penalties for people who do not follow the policy/have too many children; Specific example of a penalty – e.g. fines, increased taxation; Forced abortions/sterilization/legalise abortion; Provide free family planning/contraception/make contraception affordable; Propaganda/advertise/education about benefits of fewer children/ of contraception; Encourage later marriage; Reduce numbers of immigrants allowed into the country, etc. 5 × 1 mark or development 5 1(c) Levels marking Level 1 (1–3 marks) Statements including limited detail which explain the causes of migration from one country to another. Level 2 (4–6 marks) Uses named example. More developed statements which explain the causes of migration from one country to another. (Note: Max 5 if no named or inappropriate example) Level 3 (7 marks) Uses named example. Comprehensive and accurate statements including some place specific reference. Content Guide: Answers are likely to refer to: • employment • health care • education • political issues • natural disasters • lack of food • war, etc. Accept pulls or pushes but no double credit Place specific reference is likely to consist of: Named parts of the chosen country, Population data. Etc. 7
Mark scheme, page 5
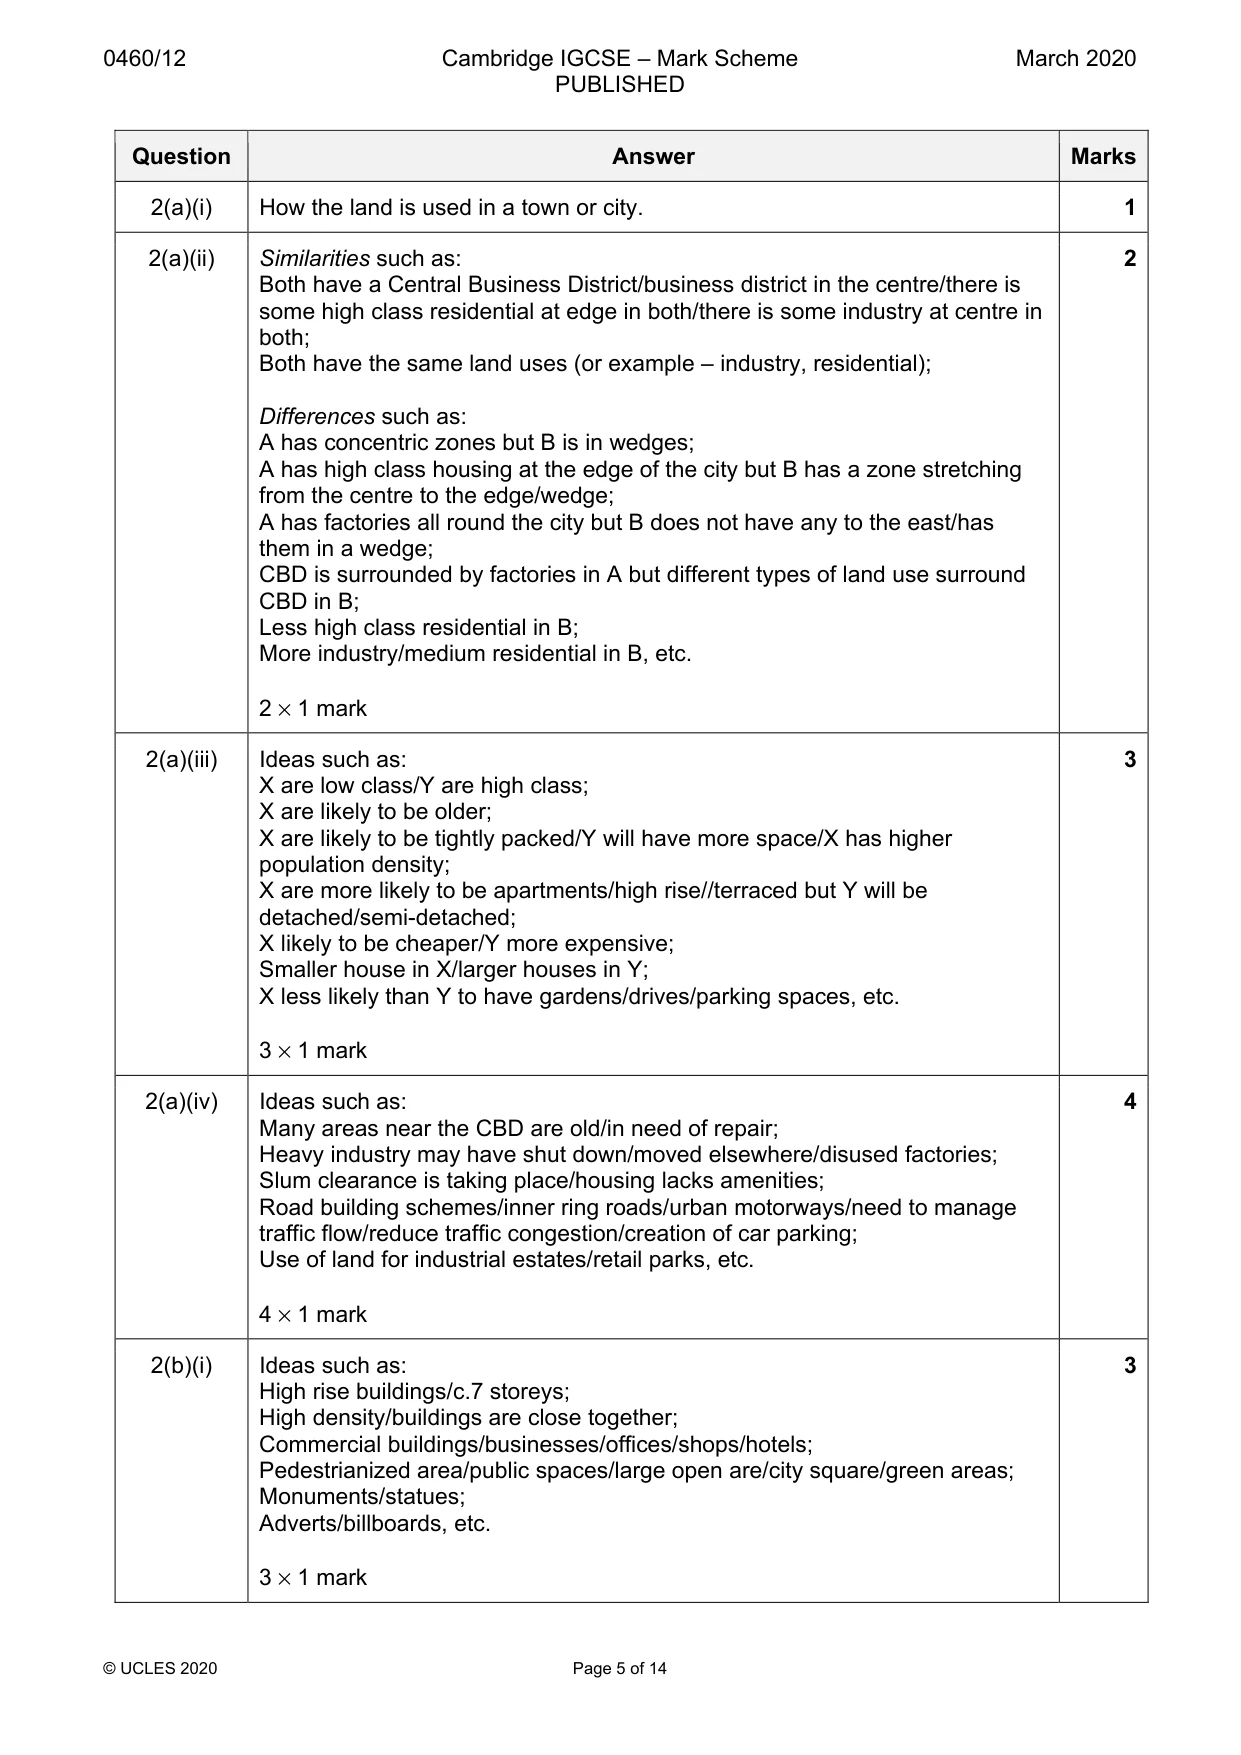
0460/12 Cambridge IGCSE – Mark Scheme PUBLISHED March 2020 © UCLES 2020 Page 5 of 14 Question Answer Marks 2(a)(i) How the land is used in a town or city. 1 2(a)(ii) Similarities such as: Both have a Central Business District/business district in the centre/there is some high class residential at edge in both/there is some industry at centre in both; Both have the same land uses (or example – industry, residential); Differences such as: A has concentric zones but B is in wedges; A has high class housing at the edge of the city but B has a zone stretching from the centre to the edge/wedge; A has factories all round the city but B does not have any to the east/has them in a wedge; CBD is surrounded by factories in A but different types of land use surround CBD in B; Less high class residential in B; More industry/medium residential in B, etc. 2 × 1 mark 2 2(a)(iii) Ideas such as: X are low class/Y are high class; X are likely to be older; X are likely to be tightly packed/Y will have more space/X has higher population density; X are more likely to be apartments/high rise//terraced but Y will be detached/semi-detached; X likely to be cheaper/Y more expensive; Smaller house in X/larger houses in Y; X less likely than Y to have gardens/drives/parking spaces, etc. 3 × 1 mark 3 2(a)(iv) Ideas such as: Many areas near the CBD are old/in need of repair; Heavy industry may have shut down/moved elsewhere/disused factories; Slum clearance is taking place/housing lacks amenities; Road building schemes/inner ring roads/urban motorways/need to manage traffic flow/reduce traffic congestion/creation of car parking; Use of land for industrial estates/retail parks, etc. 4 × 1 mark 4 2(b)(i) Ideas such as: High rise buildings/c.7 storeys; High density/buildings are close together; Commercial buildings/businesses/offices/shops/hotels; Pedestrianized area/public spaces/large open are/city square/green areas; Monuments/statues; Adverts/billboards, etc. 3 × 1 mark 3
Mark scheme, page 6
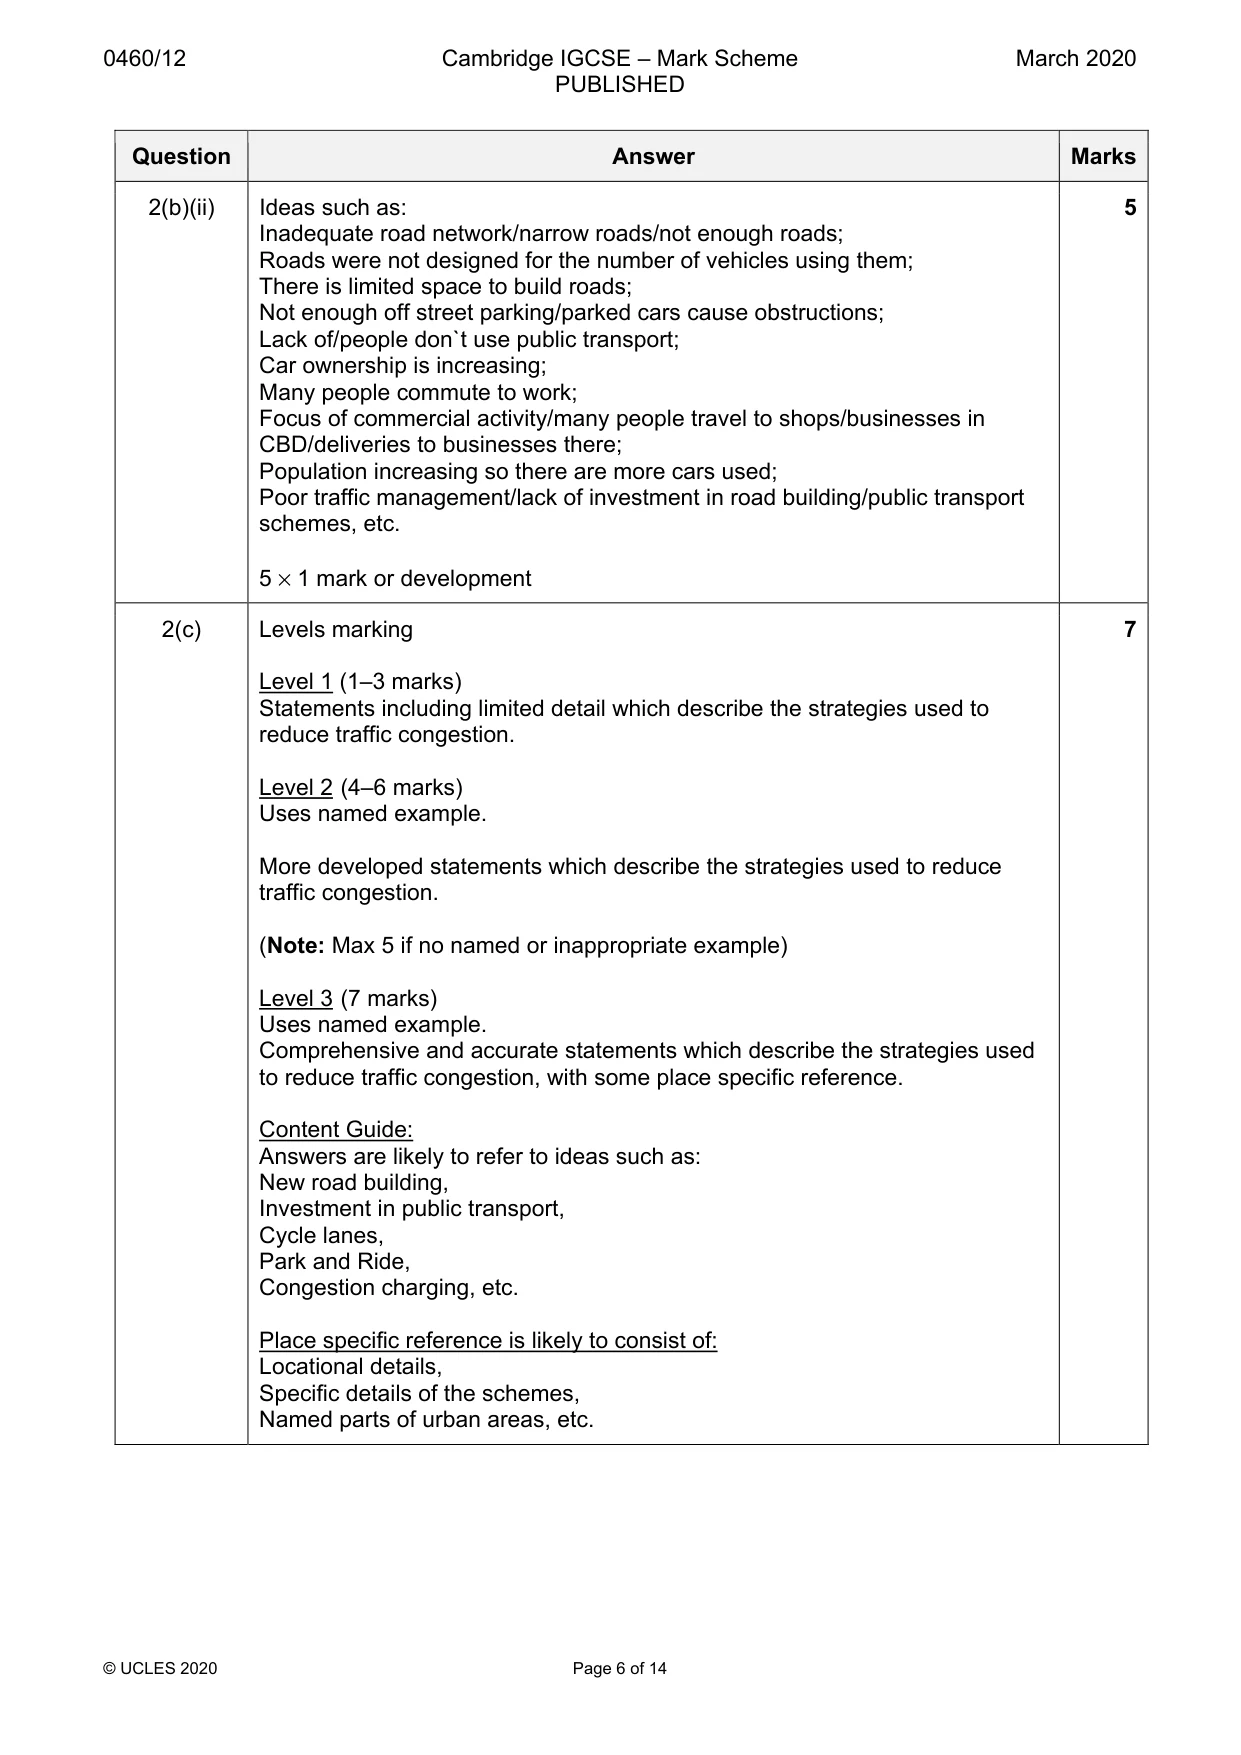
0460/12 Cambridge IGCSE – Mark Scheme PUBLISHED March 2020 © UCLES 2020 Page 6 of 14 Question Answer Marks 2(b)(ii) Ideas such as: Inadequate road network/narrow roads/not enough roads; Roads were not designed for the number of vehicles using them; There is limited space to build roads; Not enough off street parking/parked cars cause obstructions; Lack of/people don`t use public transport; Car ownership is increasing; Many people commute to work; Focus of commercial activity/many people travel to shops/businesses in CBD/deliveries to businesses there; Population increasing so there are more cars used; Poor traffic management/lack of investment in road building/public transport schemes, etc. 5 × 1 mark or development 5 2(c) Levels marking Level 1 (1–3 marks) Statements including limited detail which describe the strategies used to reduce traffic congestion. Level 2 (4–6 marks) Uses named example. More developed statements which describe the strategies used to reduce traffic congestion. (Note: Max 5 if no named or inappropriate example) Level 3 (7 marks) Uses named example. Comprehensive and accurate statements which describe the strategies used to reduce traffic congestion, with some place specific reference. Content Guide: Answers are likely to refer to ideas such as: New road building, Investment in public transport, Cycle lanes, Park and Ride, Congestion charging, etc. Place specific reference is likely to consist of: Locational details, Specific details of the schemes, Named parts of urban areas, etc. 7
Mark scheme, page 7
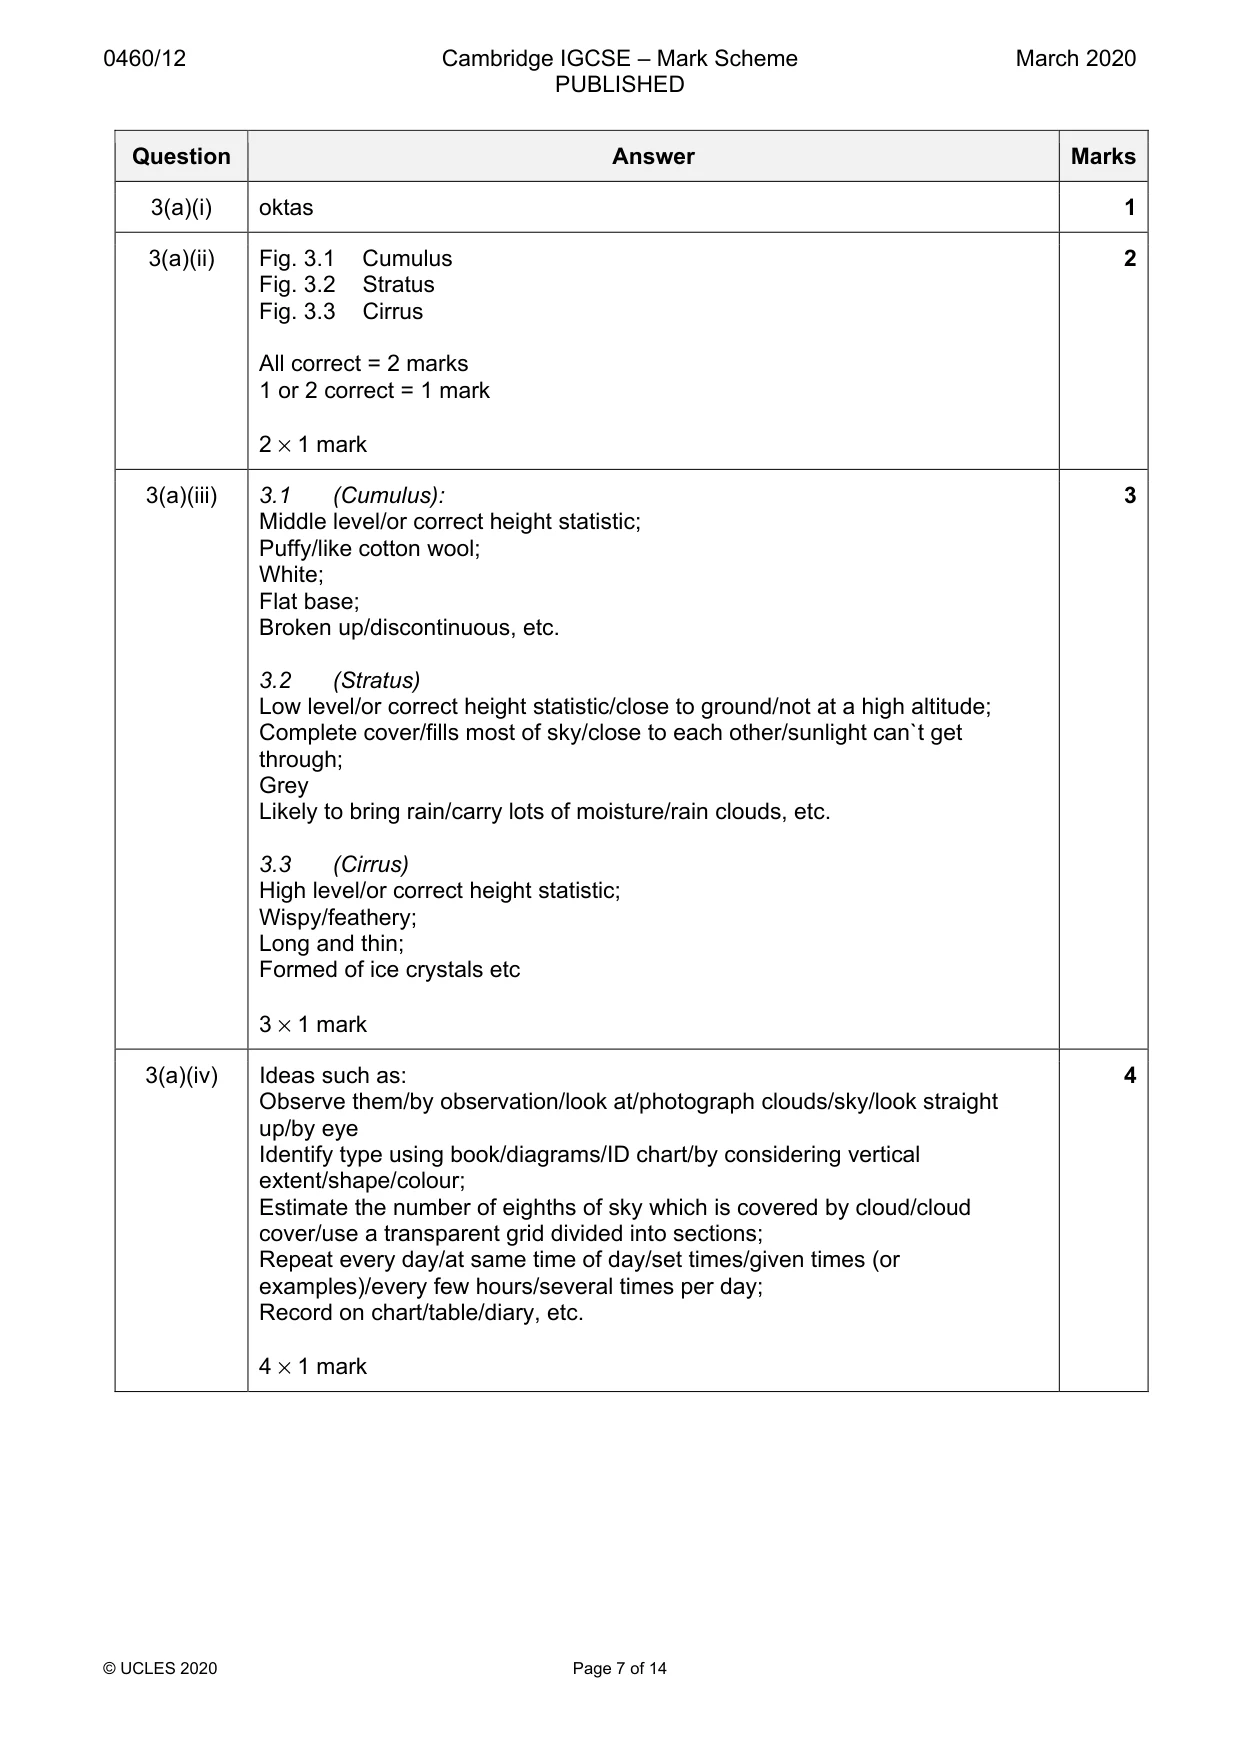
0460/12 Cambridge IGCSE – Mark Scheme PUBLISHED March 2020 © UCLES 2020 Page 7 of 14 Question Answer Marks 3(a)(i) oktas 1 3(a)(ii) Fig. 3.1 Cumulus Fig. 3.2 Stratus Fig. 3.3 Cirrus All correct = 2 marks 1 or 2 correct = 1 mark 2 × 1 mark 2 3(a)(iii) 3.1 (Cumulus): Middle level/or correct height statistic; Puffy/like cotton wool; White; Flat base; Broken up/discontinuous, etc. 3.2 (Stratus) Low level/or correct height statistic/close to ground/not at a high altitude; Complete cover/fills most of sky/close to each other/sunlight can`t get through; Grey Likely to bring rain/carry lots of moisture/rain clouds, etc. 3.3 (Cirrus) High level/or correct height statistic; Wispy/feathery; Long and thin; Formed of ice crystals etc 3 × 1 mark 3 3(a)(iv) Ideas such as: Observe them/by observation/look at/photograph clouds/sky/look straight up/by eye Identify type using book/diagrams/ID chart/by considering vertical extent/shape/colour; Estimate the number of eighths of sky which is covered by cloud/cloud cover/use a transparent grid divided into sections; Repeat every day/at same time of day/set times/given times (or examples)/every few hours/several times per day; Record on chart/table/diary, etc. 4 × 1 mark 4
Mark scheme, page 8
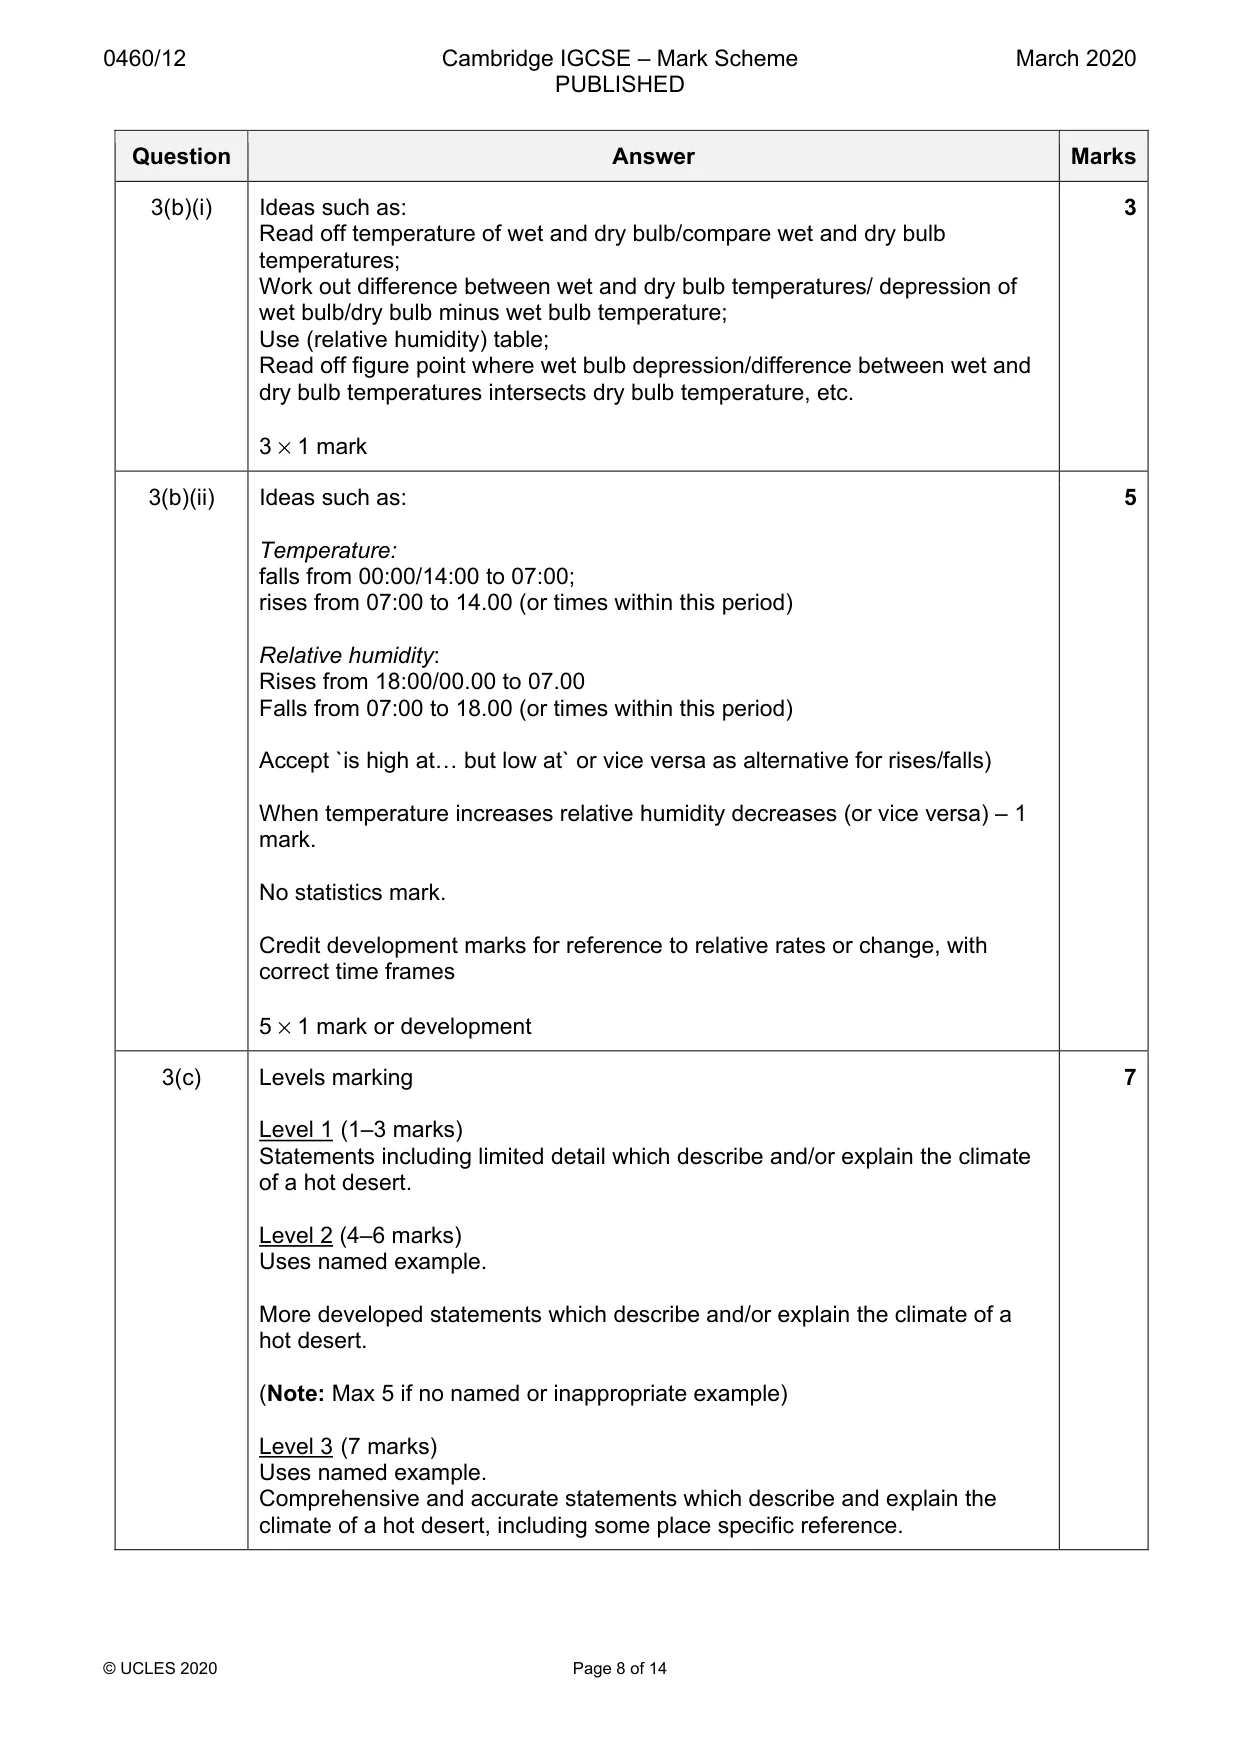
0460/12 Cambridge IGCSE – Mark Scheme PUBLISHED March 2020 © UCLES 2020 Page 8 of 14 Question Answer Marks 3(b)(i) Ideas such as: Read off temperature of wet and dry bulb/compare wet and dry bulb temperatures; Work out difference between wet and dry bulb temperatures/ depression of wet bulb/dry bulb minus wet bulb temperature; Use (relative humidity) table; Read off figure point where wet bulb depression/difference between wet and dry bulb temperatures intersects dry bulb temperature, etc. 3 × 1 mark 3 3(b)(ii) Ideas such as: Temperature: falls from 00:00/14:00 to 07:00; rises from 07:00 to 14.00 (or times within this period) Relative humidity: Rises from 18:00/00.00 to 07.00 Falls from 07:00 to 18.00 (or times within this period) Accept `is high at… but low at` or vice versa as alternative for rises/falls) When temperature increases relative humidity decreases (or vice versa) – 1 mark. No statistics mark. Credit development marks for reference to relative rates or change, with correct time frames 5 × 1 mark or development 5 3(c) Levels marking Level 1 (1–3 marks) Statements including limited detail which describe and/or explain the climate of a hot desert. Level 2 (4–6 marks) Uses named example. More developed statements which describe and/or explain the climate of a hot desert. (Note: Max 5 if no named or inappropriate example) Level 3 (7 marks) Uses named example. Comprehensive and accurate statements which describe and explain the climate of a hot desert, including some place specific reference. 7
Mark scheme, page 9
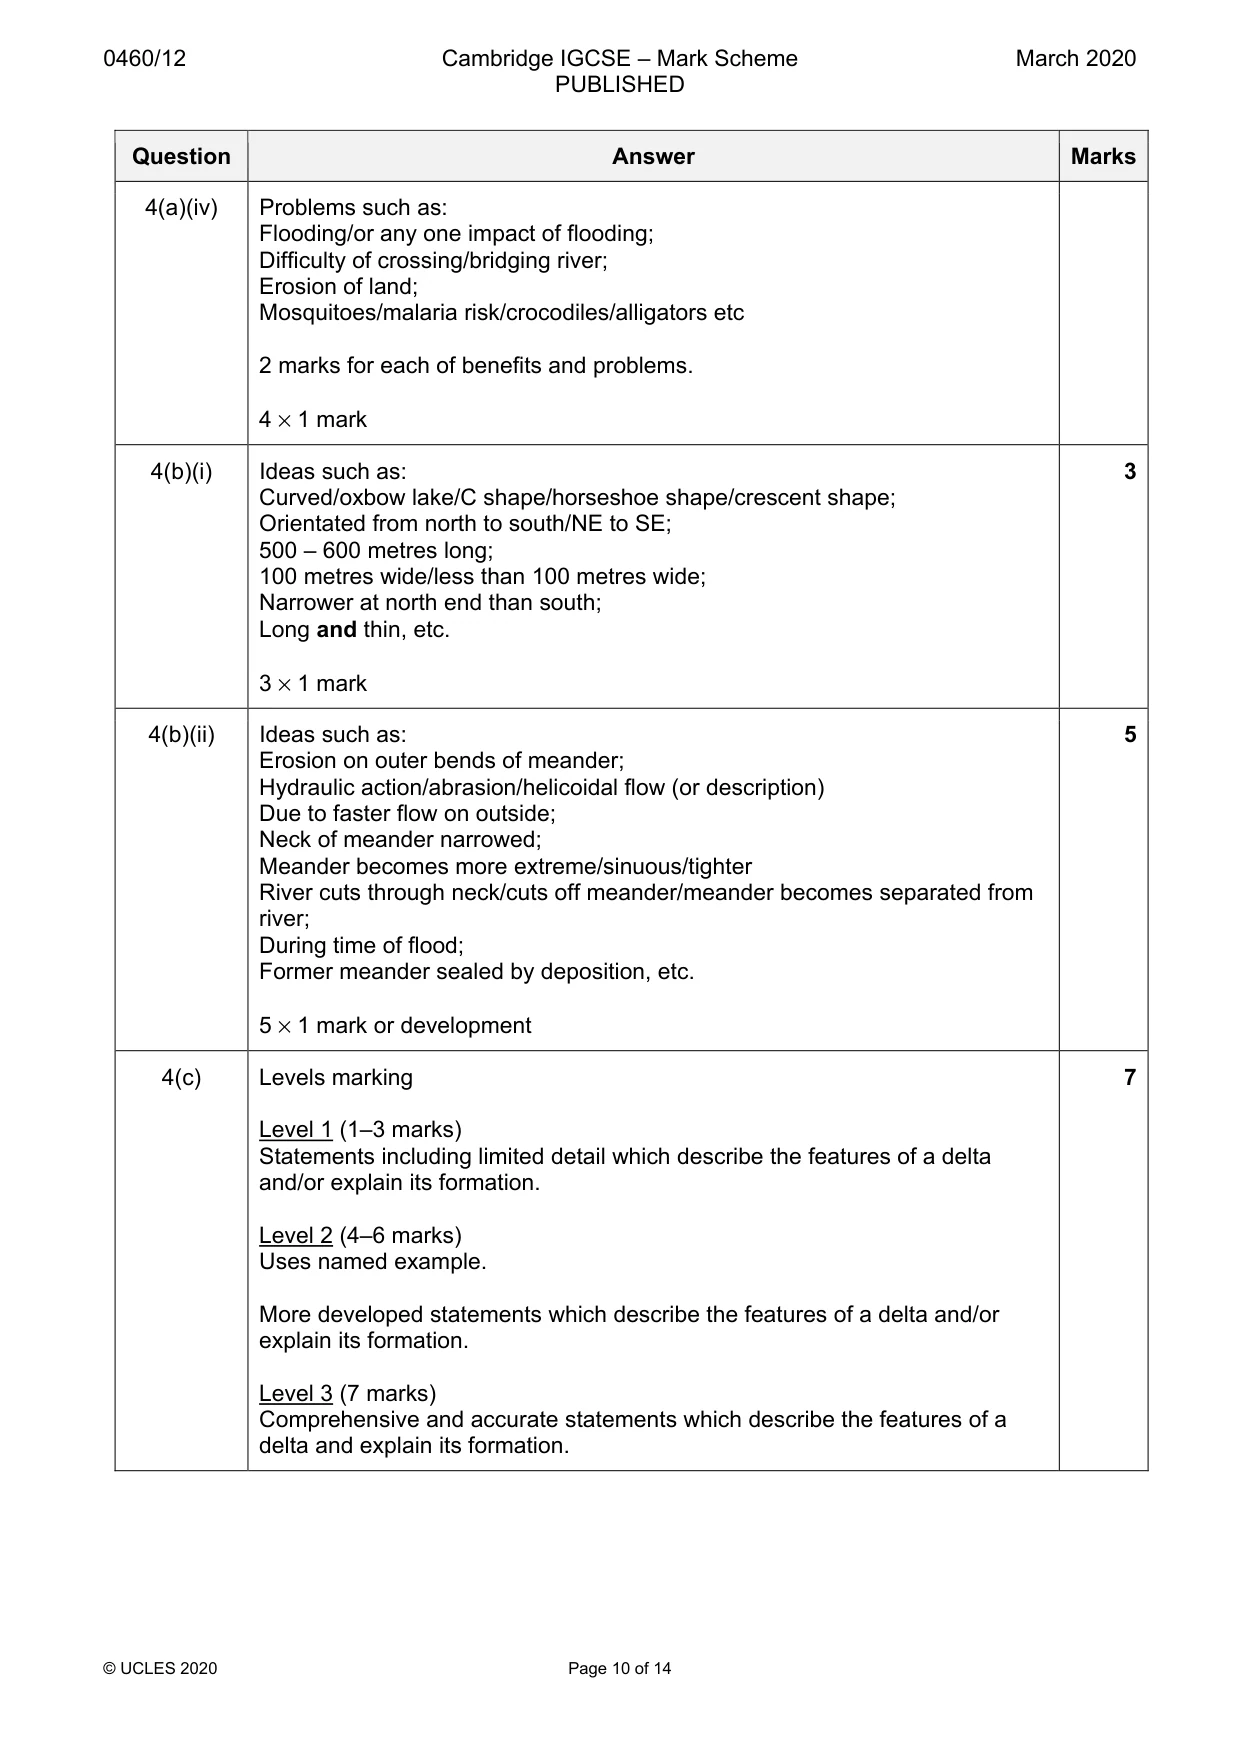
0460/12 Cambridge IGCSE – Mark Scheme PUBLISHED March 2020 © UCLES 2020 Page 9 of 14 Question Answer Marks 3(c) Content Guide: Answers are likely to refer to: High temperatures, Diurnal temperature range Seasonal change Low precipitation, Low humidity, Latitude, Descending air, high pressure, wind direction, cold currents, rain shadow; overhead sun, etc. Place specific reference is likely to consist of: Locational details, named places within the desert, Hadley Cell, Statistical detail, etc. Question Answer Marks 4(a)(i) Area of high land/ridge surrounding a drainage basin/between two drainage basins/the area which separates drainage basins from each other 1 4(a)(ii) On Fig. 4.1 2 × 1 mark 2 4(a)(iii) Ideas such as: X narrower/Y wider; X steeper sides/Y more gently sloping sides/flatter; X more V shaped; Y more likely to have a flood plain, etc. 3 × 1 mark 3 4(a)(iv) Benefits such as: Flat land; Fertile land/land for agriculture/grazing; Ease of transport along valley/flood plain/along river; Availability of drinking water/water for washing, etc. Water for irrigation; Fishing; Water power/HEP/water for industry; Scenic beauty; Work in tourist industry, etc. 4
Mark scheme, page 10
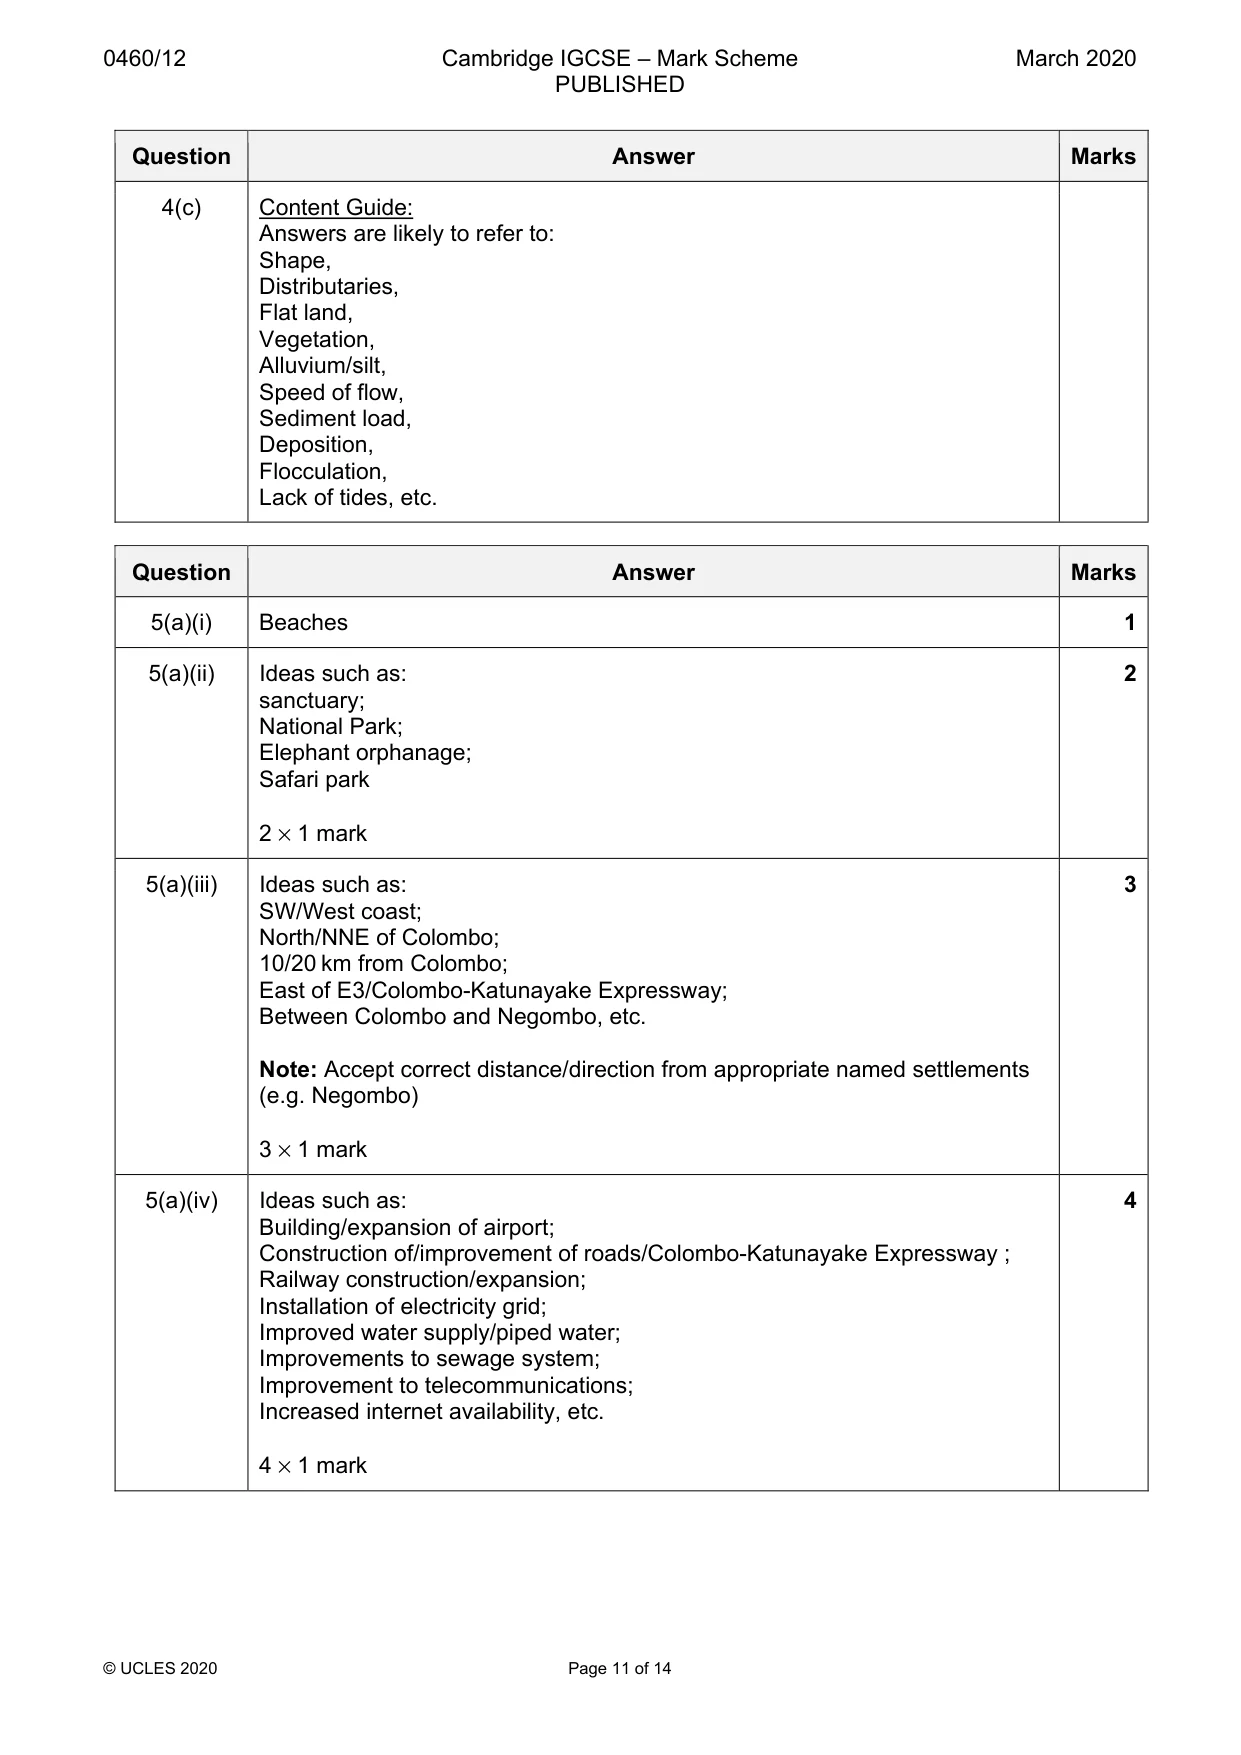
0460/12 Cambridge IGCSE – Mark Scheme PUBLISHED March 2020 © UCLES 2020 Page 10 of 14 Question Answer Marks 4(a)(iv) Problems such as: Flooding/or any one impact of flooding; Difficulty of crossing/bridging river; Erosion of land; Mosquitoes/malaria risk/crocodiles/alligators etc 2 marks for each of benefits and problems. 4 × 1 mark 4(b)(i) Ideas such as: Curved/oxbow lake/C shape/horseshoe shape/crescent shape; Orientated from north to south/NE to SE; 500 – 600 metres long; 100 metres wide/less than 100 metres wide; Narrower at north end than south; Long and thin, etc. 3 × 1 mark 3 4(b)(ii) Ideas such as: Erosion on outer bends of meander; Hydraulic action/abrasion/helicoidal flow (or description) Due to faster flow on outside; Neck of meander narrowed; Meander becomes more extreme/sinuous/tighter River cuts through neck/cuts off meander/meander becomes separated from river; During time of flood; Former meander sealed by deposition, etc. 5 × 1 mark or development 5 4(c) Levels marking Level 1 (1–3 marks) Statements including limited detail which describe the features of a delta and/or explain its formation. Level 2 (4–6 marks) Uses named example. More developed statements which describe the features of a delta and/or explain its formation. Level 3 (7 marks) Comprehensive and accurate statements which describe the features of a delta and explain its formation. 7
Mark scheme, page 11
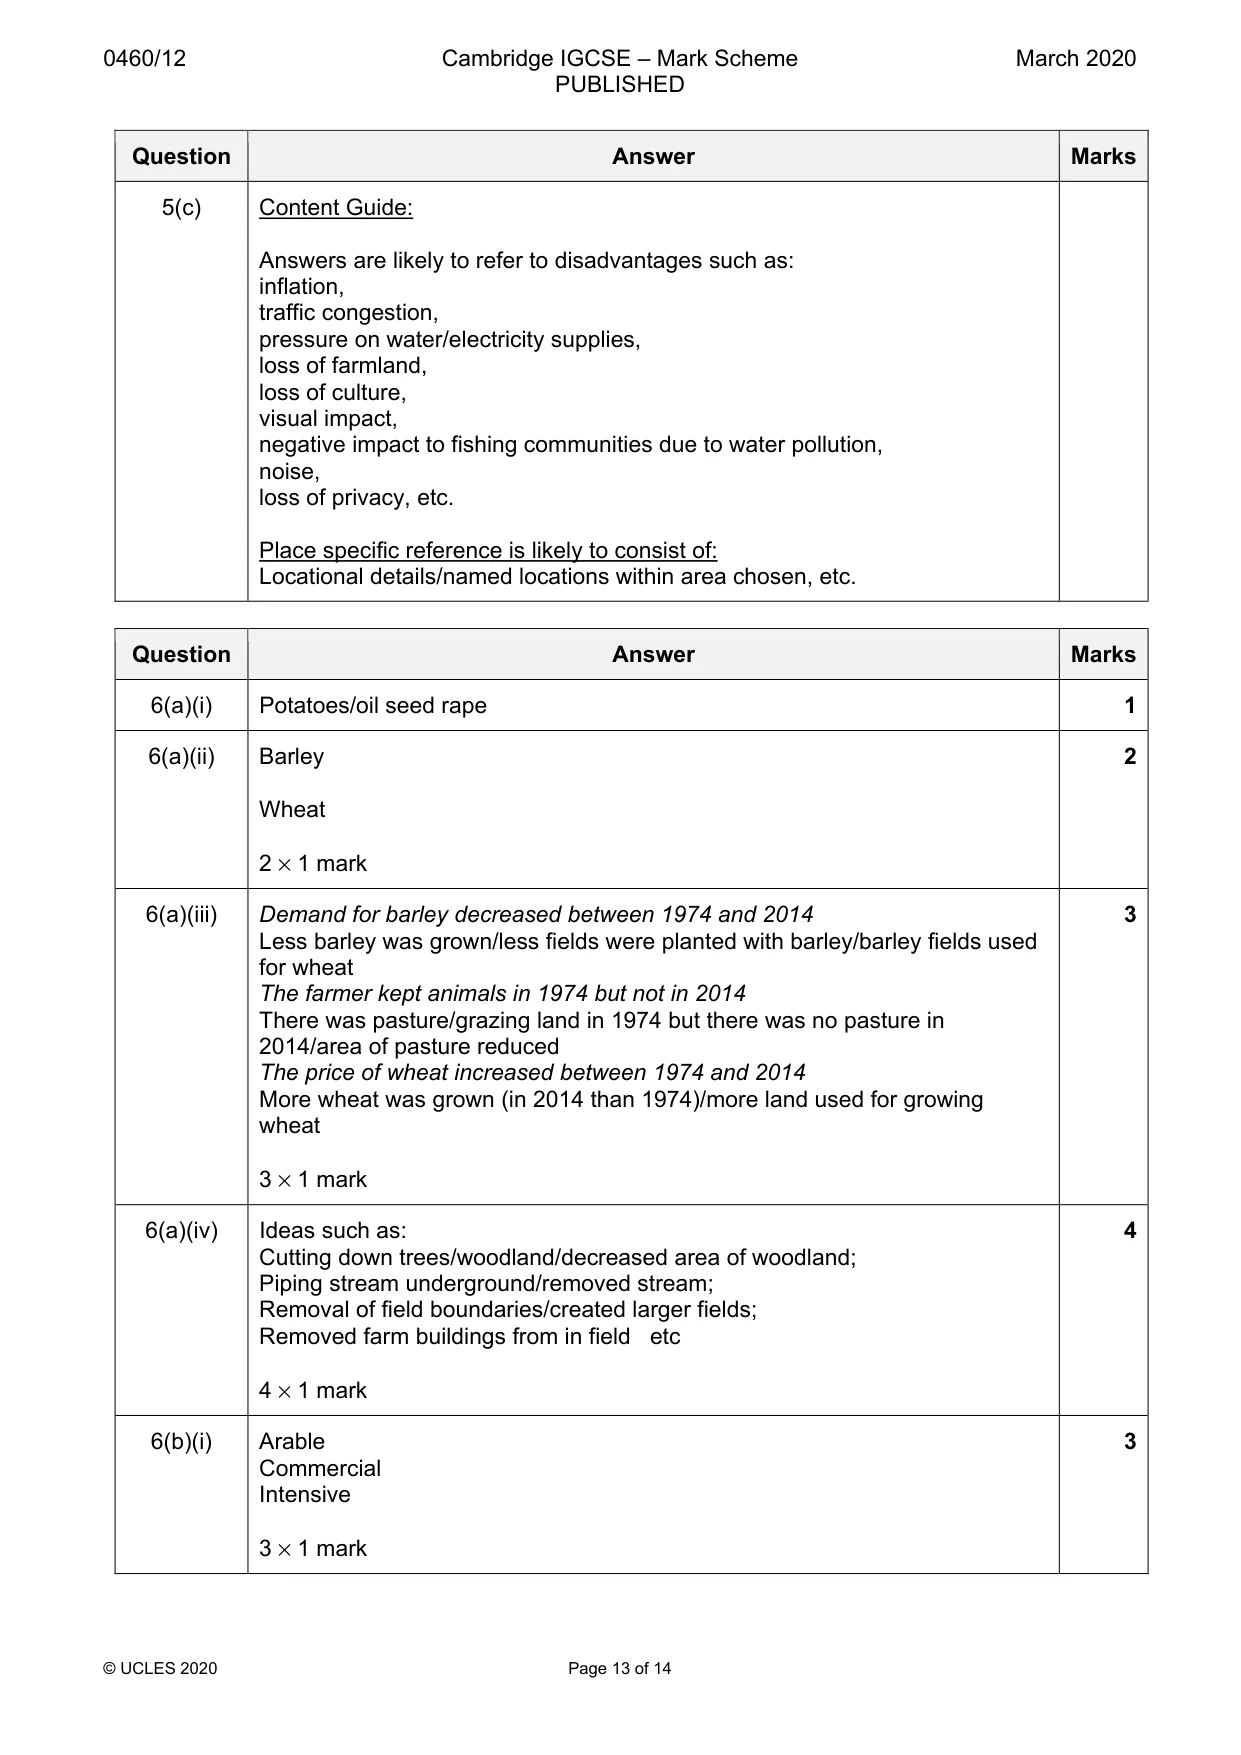
0460/12 Cambridge IGCSE – Mark Scheme PUBLISHED March 2020 © UCLES 2020 Page 11 of 14 Question Answer Marks 4(c) Content Guide: Answers are likely to refer to: Shape, Distributaries, Flat land, Vegetation, Alluvium/silt, Speed of flow, Sediment load, Deposition, Flocculation, Lack of tides, etc. Question Answer Marks 5(a)(i) Beaches 1 5(a)(ii) Ideas such as: sanctuary; National Park; Elephant orphanage; Safari park 2 × 1 mark 2 5(a)(iii) Ideas such as: SW/West coast; North/NNE of Colombo; 10/20 km from Colombo; East of E3/Colombo-Katunayake Expressway; Between Colombo and Negombo, etc. Note: Accept correct distance/direction from appropriate named settlements (e.g. Negombo) 3 × 1 mark 3 5(a)(iv) Ideas such as: Building/expansion of airport; Construction of/improvement of roads/Colombo-Katunayake Expressway ; Railway construction/expansion; Installation of electricity grid; Improved water supply/piped water; Improvements to sewage system; Improvement to telecommunications; Increased internet availability, etc. 4 × 1 mark 4
Mark scheme, page 12
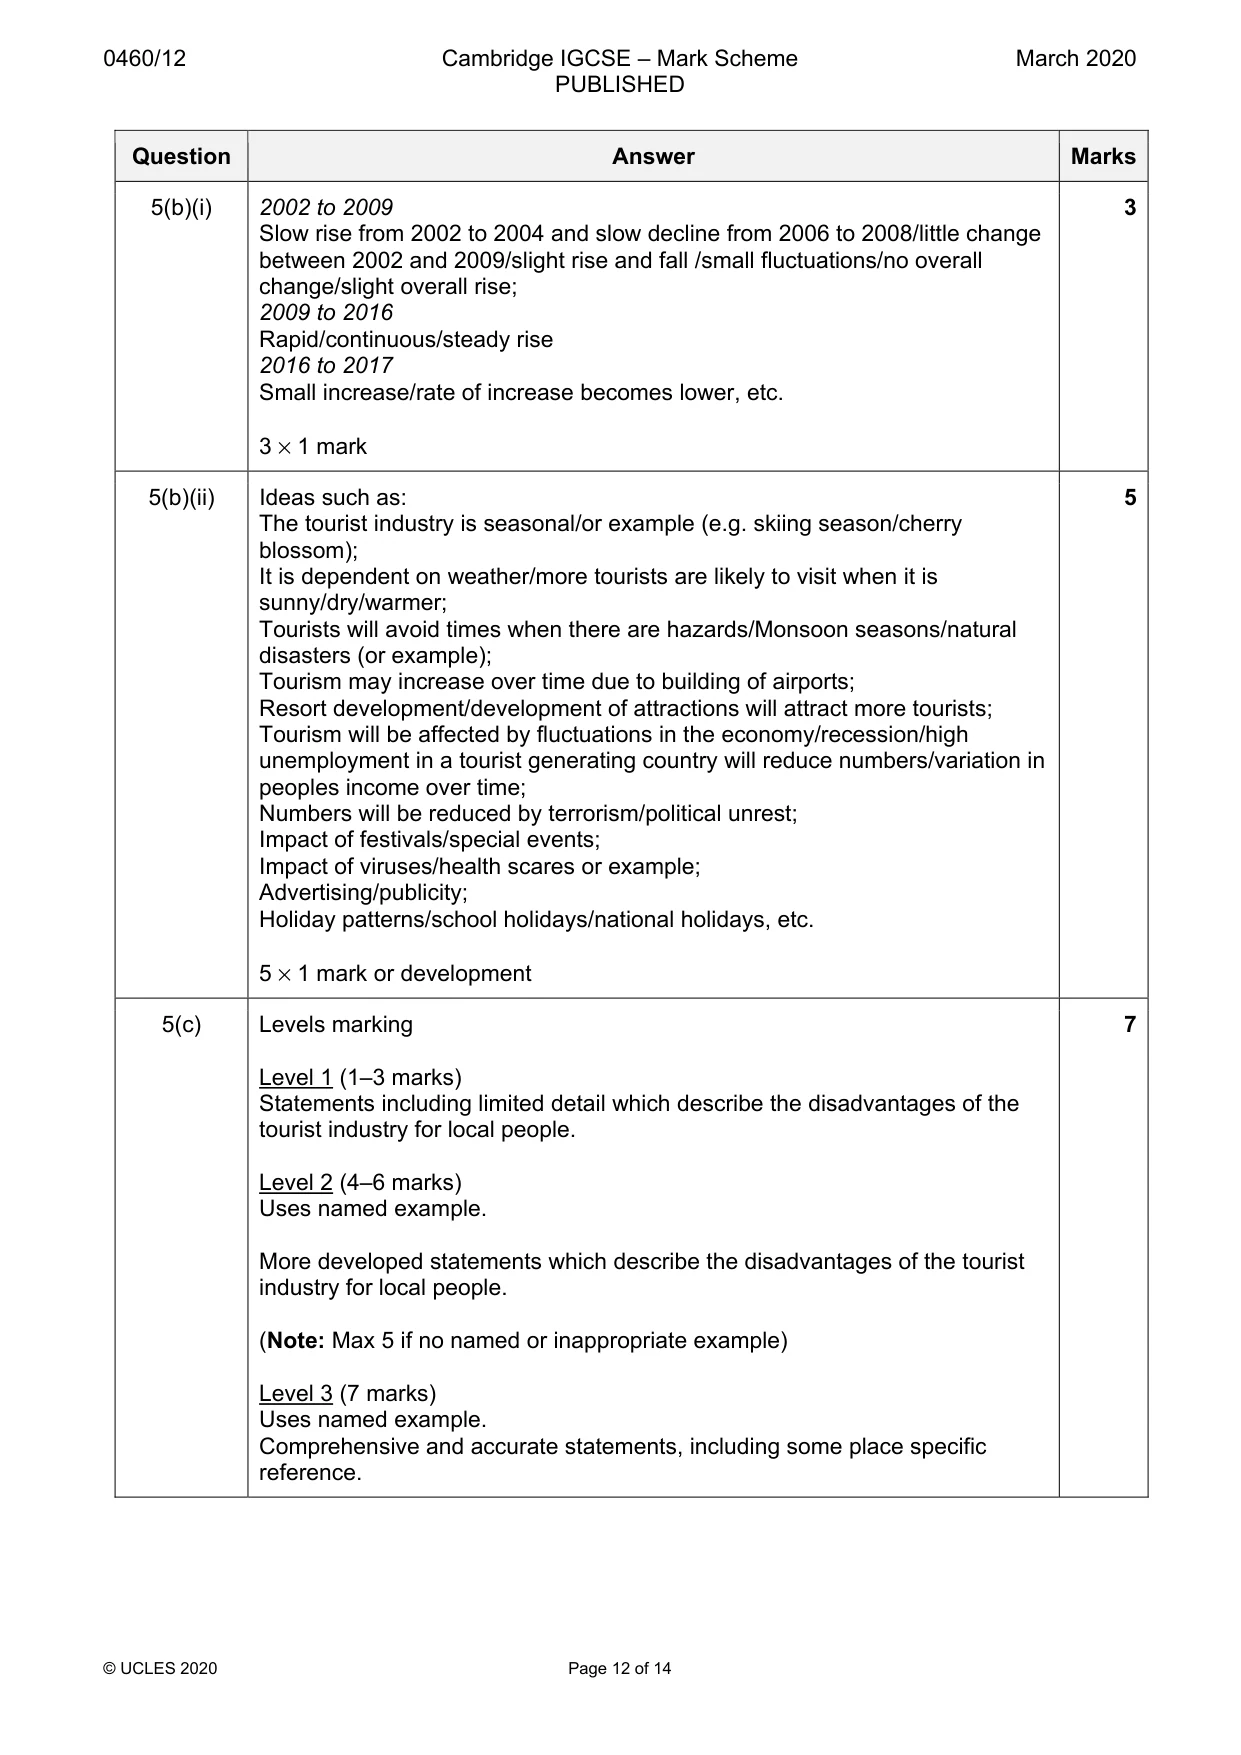
0460/12 Cambridge IGCSE – Mark Scheme PUBLISHED March 2020 © UCLES 2020 Page 12 of 14 Question Answer Marks 5(b)(i) 2002 to 2009 Slow rise from 2002 to 2004 and slow decline from 2006 to 2008/little change between 2002 and 2009/slight rise and fall /small fluctuations/no overall change/slight overall rise; 2009 to 2016 Rapid/continuous/steady rise 2016 to 2017 Small increase/rate of increase becomes lower, etc. 3 × 1 mark 3 5(b)(ii) Ideas such as: The tourist industry is seasonal/or example (e.g. skiing season/cherry blossom); It is dependent on weather/more tourists are likely to visit when it is sunny/dry/warmer; Tourists will avoid times when there are hazards/Monsoon seasons/natural disasters (or example); Tourism may increase over time due to building of airports; Resort development/development of attractions will attract more tourists; Tourism will be affected by fluctuations in the economy/recession/high unemployment in a tourist generating country will reduce numbers/variation in peoples income over time; Numbers will be reduced by terrorism/political unrest; Impact of festivals/special events; Impact of viruses/health scares or example; Advertising/publicity; Holiday patterns/school holidays/national holidays, etc. 5 × 1 mark or development 5 5(c) Levels marking Level 1 (1–3 marks) Statements including limited detail which describe the disadvantages of the tourist industry for local people. Level 2 (4–6 marks) Uses named example. More developed statements which describe the disadvantages of the tourist industry for local people. (Note: Max 5 if no named or inappropriate example) Level 3 (7 marks) Uses named example. Comprehensive and accurate statements, including some place specific reference. 7
Mark scheme, page 13
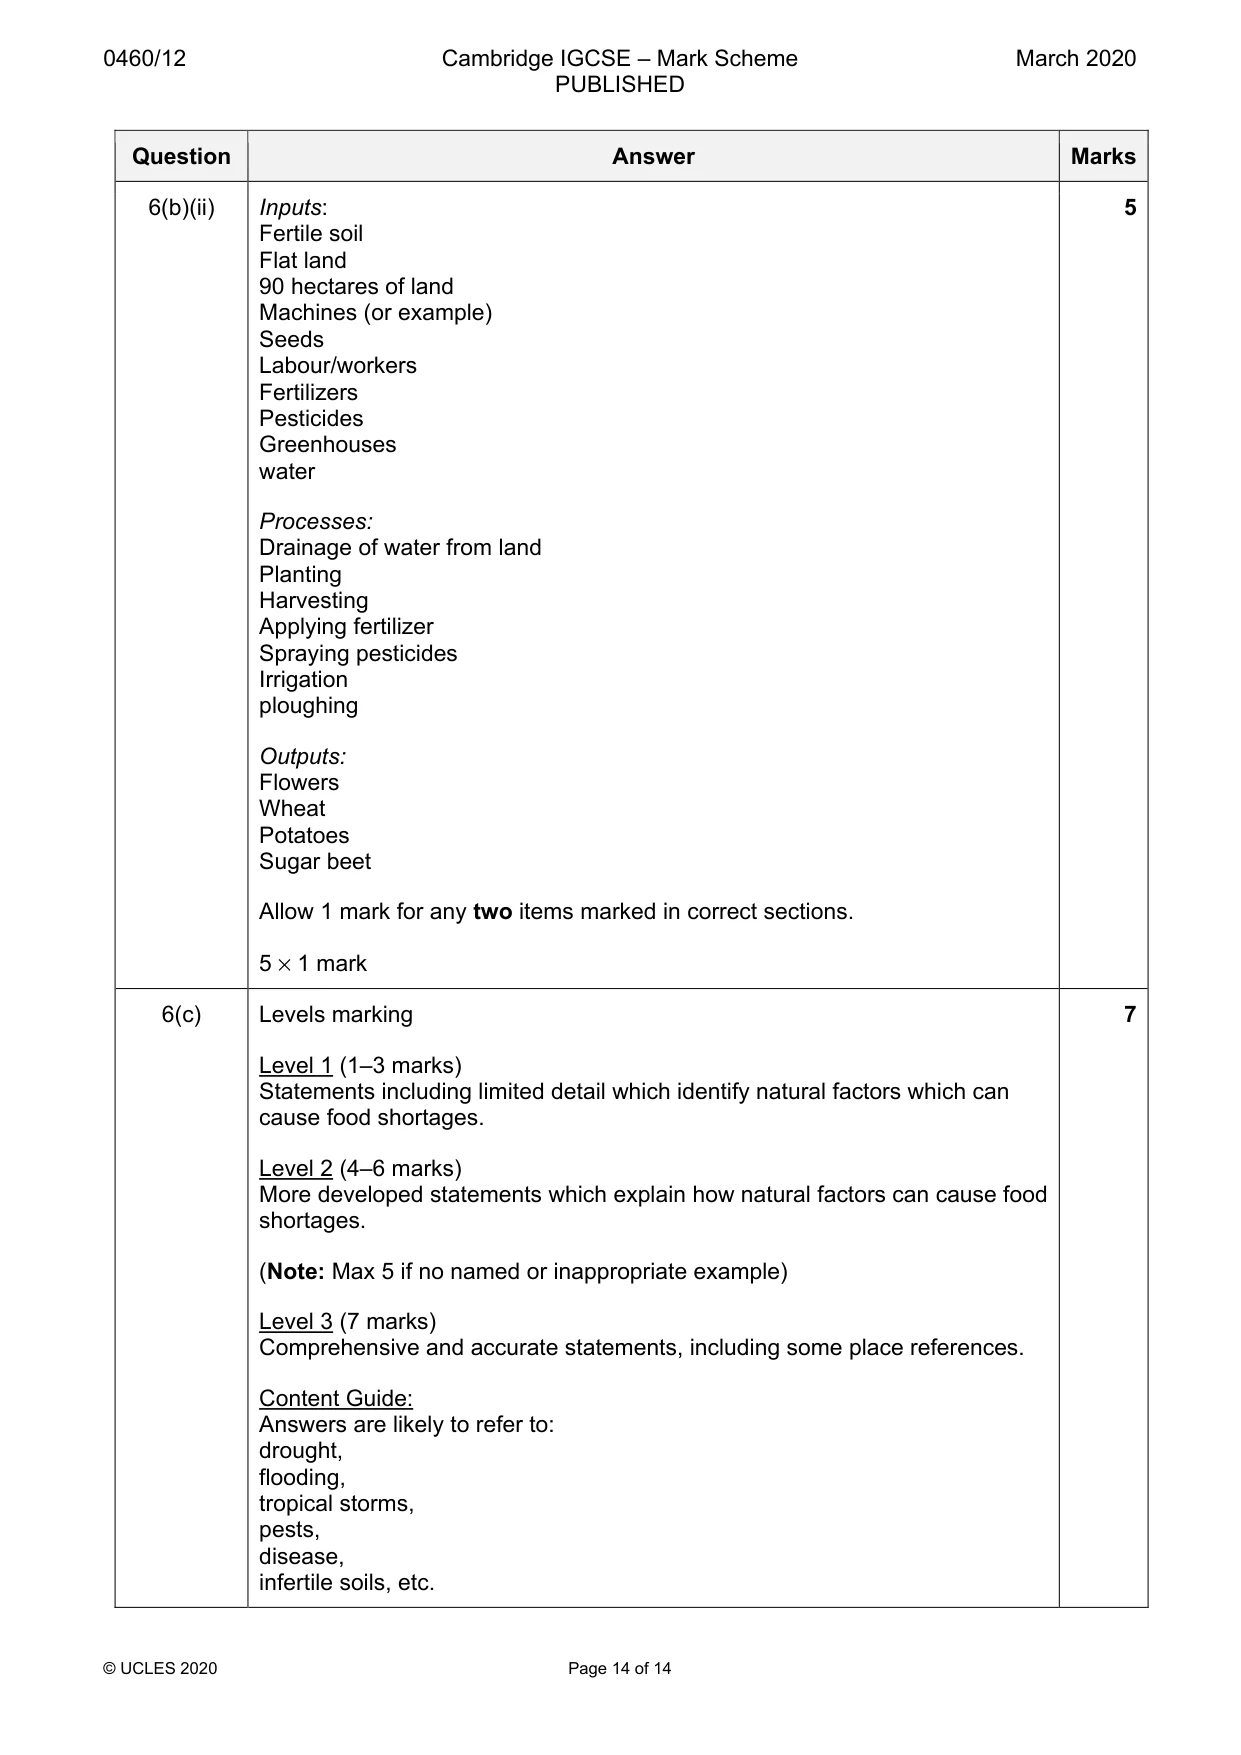
0460/12 Cambridge IGCSE – Mark Scheme PUBLISHED March 2020 © UCLES 2020 Page 13 of 14 Question Answer Marks 5(c) Content Guide: Answers are likely to refer to disadvantages such as: inflation, traffic congestion, pressure on water/electricity supplies, loss of farmland, loss of culture, visual impact, negative impact to fishing communities due to water pollution, noise, loss of privacy, etc. Place specific reference is likely to consist of: Locational details/named locations within area chosen, etc. Question Answer Marks 6(a)(i) Potatoes/oil seed rape 1 6(a)(ii) Barley Wheat 2 × 1 mark 2 6(a)(iii) Demand for barley decreased between 1974 and 2014 Less barley was grown/less fields were planted with barley/barley fields used for wheat The farmer kept animals in 1974 but not in 2014 There was pasture/grazing land in 1974 but there was no pasture in 2014/area of pasture reduced The price of wheat increased between 1974 and 2014 More wheat was grown (in 2014 than 1974)/more land used for growing wheat 3 × 1 mark 3 6(a)(iv) Ideas such as: Cutting down trees/woodland/decreased area of woodland; Piping stream underground/removed stream; Removal of field boundaries/created larger fields; Removed farm buildings from in field etc 4 × 1 mark 4 6(b)(i) Arable Commercial Intensive 3 × 1 mark 3
Mark scheme, page 14
0460/12 Cambridge IGCSE – Mark Scheme PUBLISHED March 2020 © UCLES 2020 Page 14 of 14 Question Answer Marks 6(b)(ii) Inputs: Fertile soil Flat land 90 hectares of land Machines (or example) Seeds Labour/workers Fertilizers Pesticides Greenhouses water Processes: Drainage of water from land Planting Harvesting Applying fertilizer Spraying pesticides Irrigation ploughing Outputs: Flowers Wheat Potatoes Sugar beet Allow 1 mark for any two items marked in correct sections. 5 × 1 mark 5 6(c) Levels marking Level 1 (1–3 marks) Statements including limited detail which identify natural factors which can cause food shortages. Level 2 (4–6 marks) More developed statements which explain how natural factors can cause food shortages. (Note: Max 5 if no named or inappropriate example) Level 3 (7 marks) Comprehensive and accurate statements, including some place references. Content Guide: Answers are likely to refer to: drought, flooding, tropical storms, pests, disease, infertile soils, etc. 7
What you needed in this session
Cambridge’s own grade thresholds for 2020 Feb/March, Paper 1 · Variant 2. A higher threshold means an easier paper — the bar moves with how the cohort did.