Cambridge IGCSE Geography 0460 — 2019 Feb/March Paper 1 · Variant 2
0460/12/F/M/19 · 75 marks · ≈84 min
The question paper and its mark scheme, free to read here and free to download. This is Cambridge’s own paper, exactly as it was sat.
Question paper32 pages














Mark scheme16 pages
Answers below. Sit the paper first if you are practising.
Paper as text
Question paper, page 1
This document consists of 30 printed pages, 2 blank pages and 1 Insert. DC (ST/SG) 167582/5 © UCLES 2019 [Turn over * 6 7 1 7 8 6 6 8 7 0 * GEOGRAPHY 0460/12 Paper 1 February/March 2019 1 hour 45 minutes Candidates answer on the Question Paper. Additional Materials: Ruler Calculator READ THESE INSTRUCTIONS FIRST Write your centre number, candidate number and name in the spaces provided. Write in dark blue or black pen. You may use an HB pencil for any diagrams or graphs. Do not use staples, paper clips, glue or correction fluid. DO NOT WRITE IN ANY BARCODES. Write your answer to each question in the space provided. If additional space is required, you should use the lined pages at the end of this booklet. The question number(s) must be clearly shown. Answer three questions, one from each section. The Insert contains Fig. 2.2 for Question 2, Figs. 3.1 and 3.2 for Question 3, Figs. 5.2, 5.3 and 5.4 for Question 5, and Fig. 6.1 for Question 6. The Insert is not required by the Examiner. Sketch maps and diagrams should be drawn whenever they serve to illustrate an answer. At the end of the examination, fasten all your work securely together. The number of marks is given in brackets [ ] at the end of each question or part question. Definitions MEDCs – More Economically Developed Countries LEDCs – Less Economically Developed Countries Cambridge Assessment International Education Cambridge International General Certificate of Secondary Education This syllabus is regulated for use in England, Wales and Northern Ireland as a Cambridge International Level 1/Level 2 Certificate.
Question paper, page 2
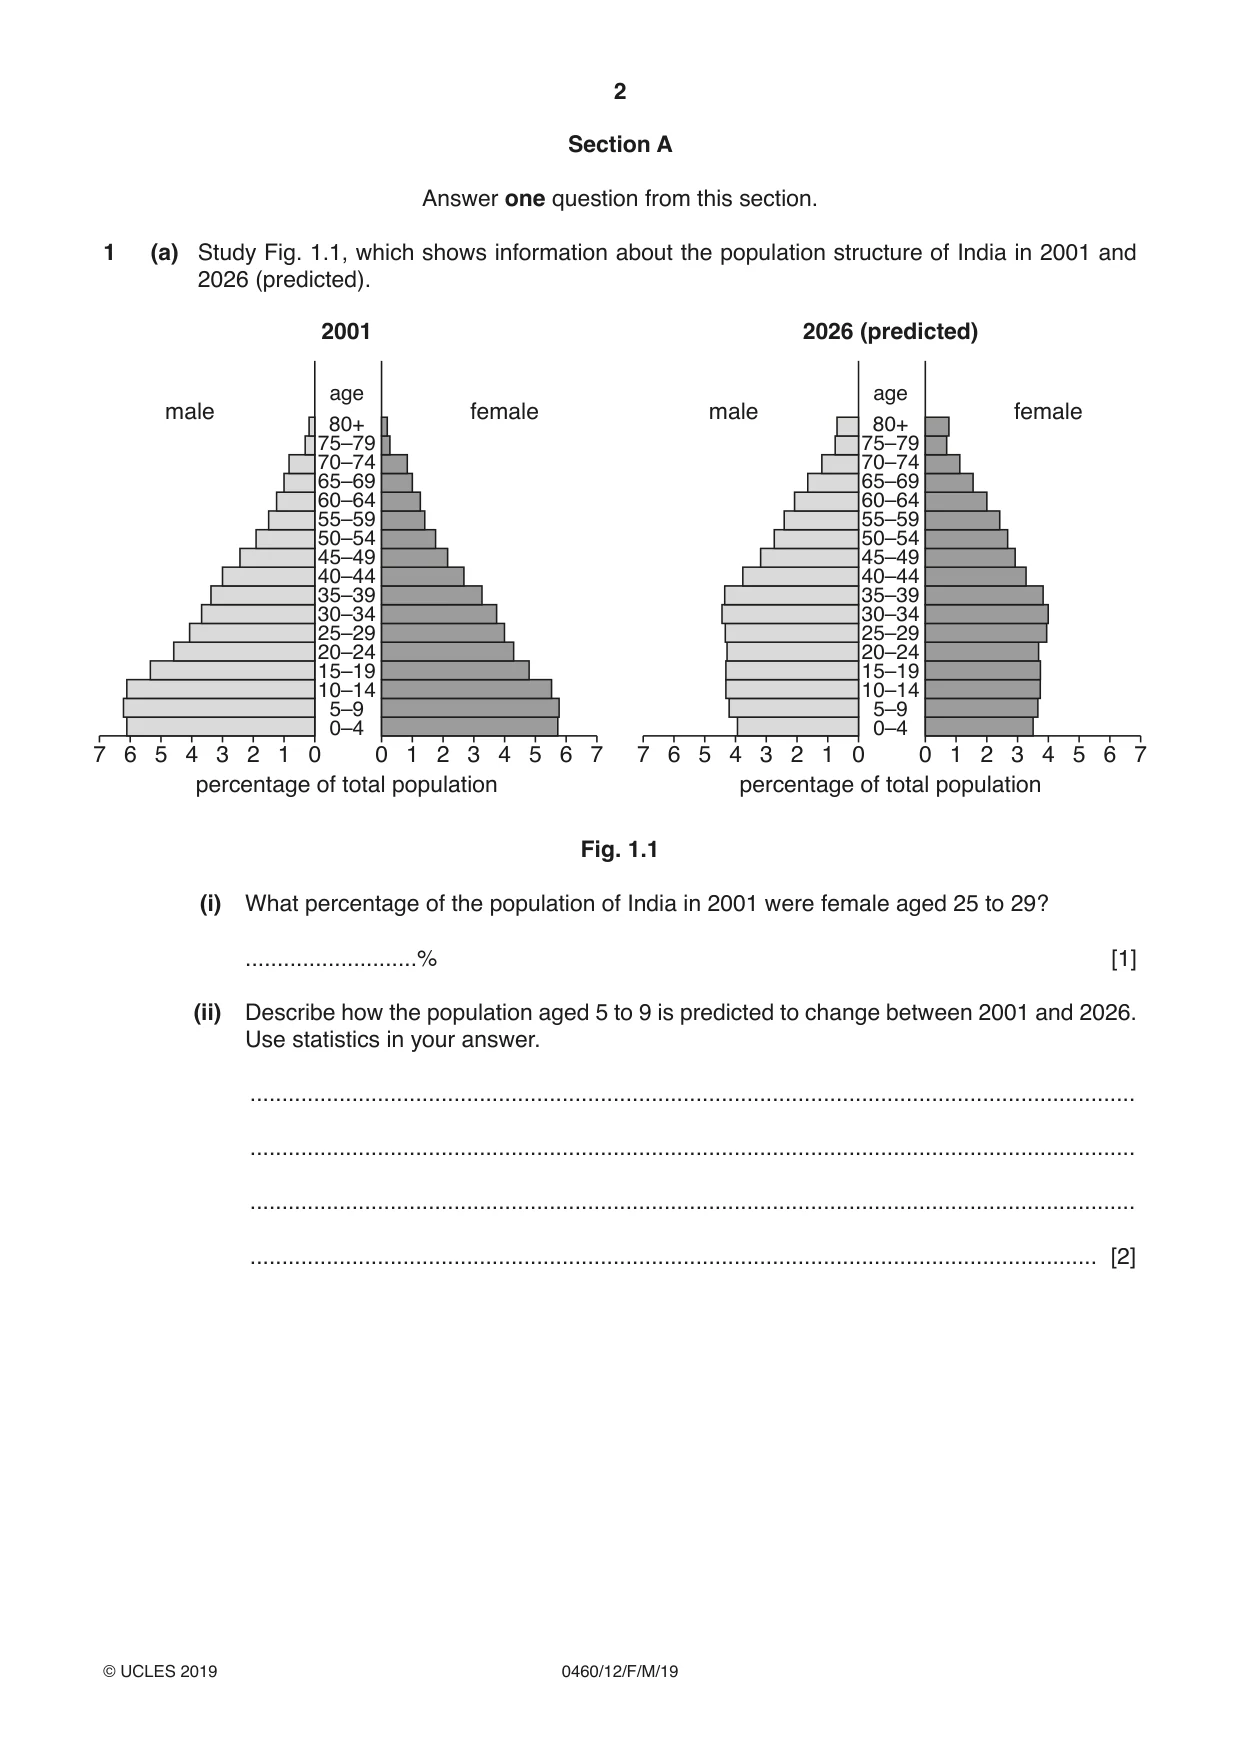
2 0460/12/F/M/19 © UCLES 2019 Section A Answer one question from this section. 1 (a) Study Fig. 1.1, which shows information about the population structure of India in 2001 and 2026 (predicted). 0 1 2 3 4 5 6 7 0–4 5–9 10–14 15–19 20–24 25–29 30–34 35–39 40–44 45–49 50–54 55–59 60–64 65–69 70–74 75–79 80+ male 7 6 5 4 3 2 1 0 female 0 1 2 3 4 5 6 7 0–4 5–9 10–14 15–19 20–24 25–29 30–34 35–39 40–44 45–49 50–54 55–59 60–64 65–69 70–74 75–79 80+ age age male 7 6 5 4 3 2 1 0 female 2001 percentage of total population 2026 (predicted) percentage of total population Fig. 1.1 (i) What percentage of the population of India in 2001 were female aged 25 to 29? …% [1] (ii) Describe how the population aged 5 to 9 is predicted to change between 2001 and 2026. Use statistics in your answer. … … … … [2]
Question paper, page 3
3 0460/12/F/M/19 © UCLES 2019 [Turn over (iii) Describe how the shape of India’s population pyramid is predicted to change between 2001 and 2026. … … … … … … [3] (iv) Suggest reasons for the changes in the percentage of young and old dependents in India which are predicted by 2026. Young dependents … … … … … … Old dependents … … … … … … [4]
Question paper, page 4
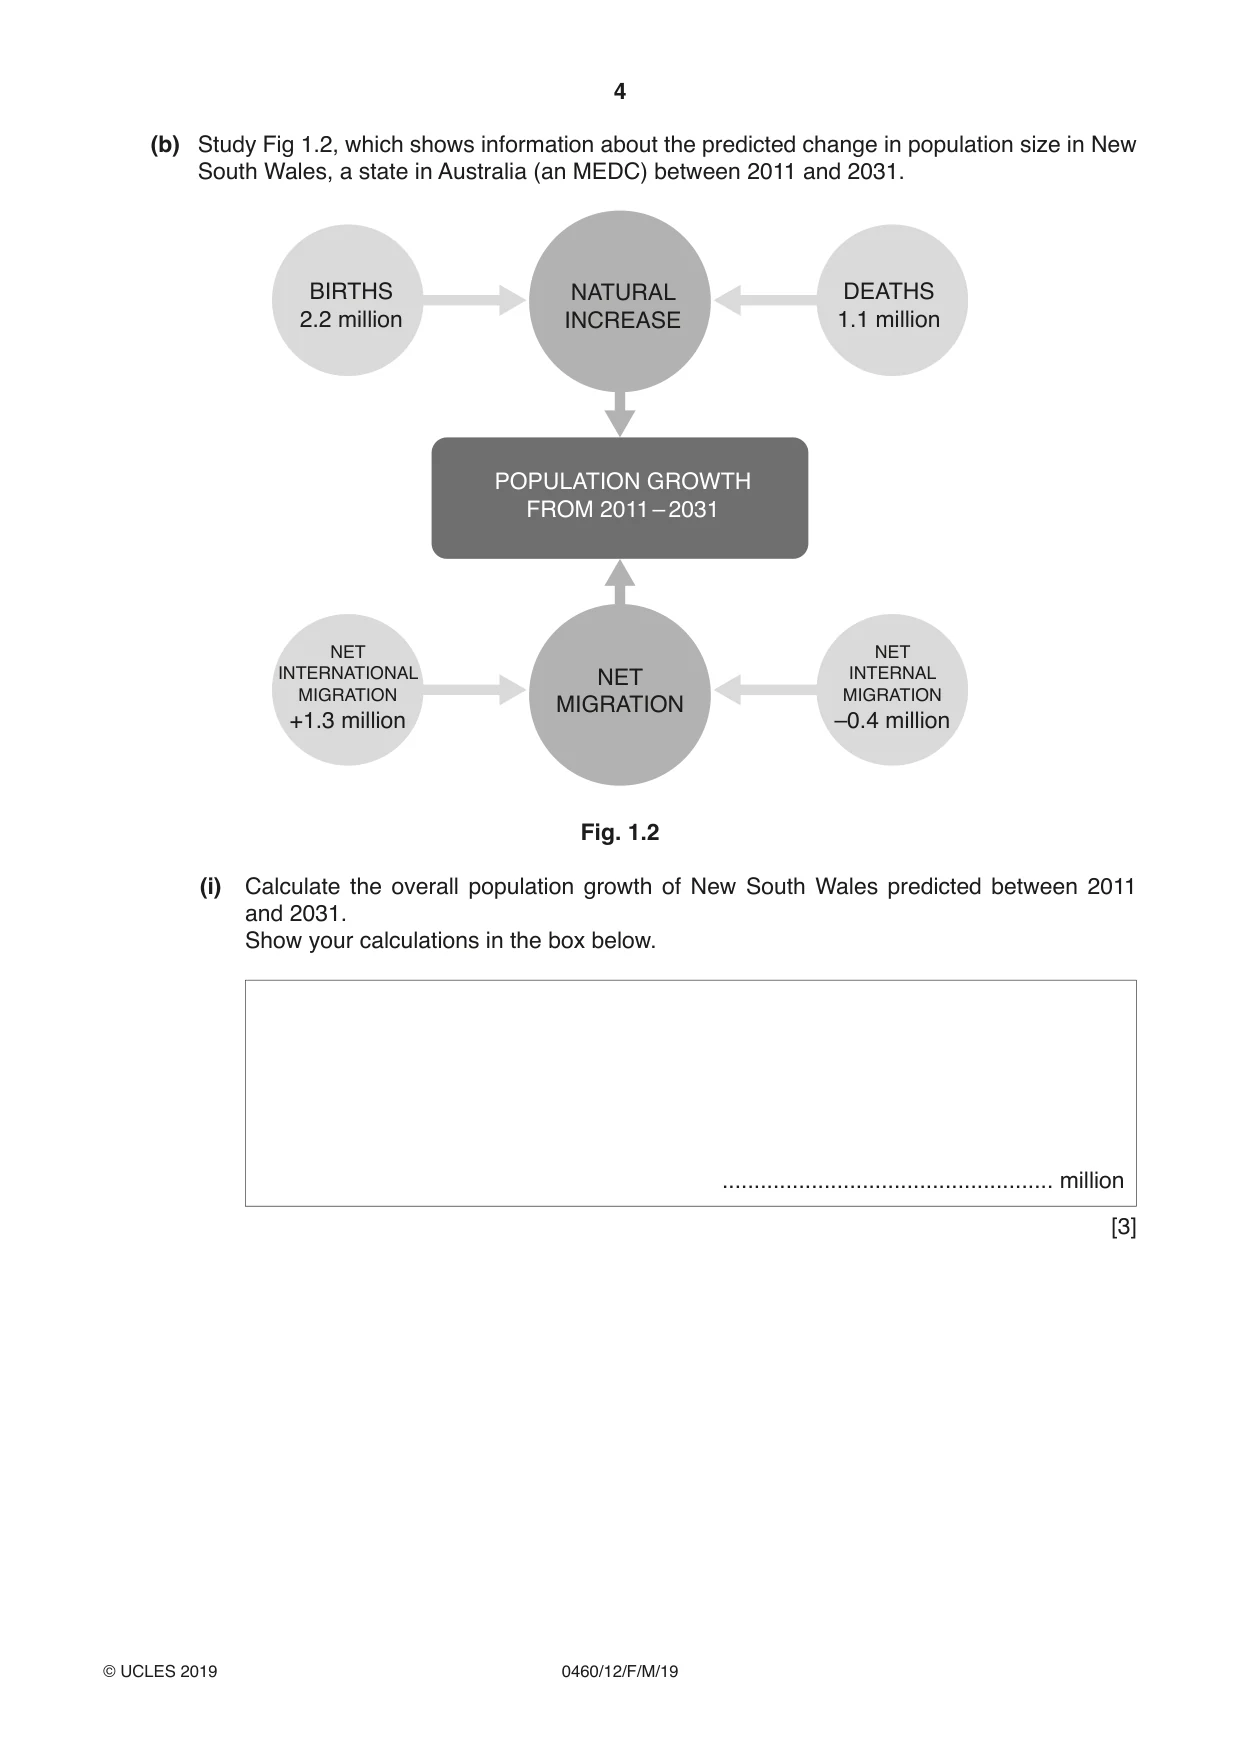
4 0460/12/F/M/19 © UCLES 2019 (b) Study Fig 1.2, which shows information about the predicted change in population size in New South Wales, a state in Australia (an MEDC) between 2011 and 2031. BIRTHS 2.2 million DEATHS 1.1 million NET INTERNATIONAL MIGRATION +1.3 million NET INTERNAL MIGRATION –0.4 million NATURAL INCREASE NET MIGRATION POPULATION GROWTH FROM 2011 – 2031 Fig. 1.2 (i) Calculate the overall population growth of New South Wales predicted between 2011 and 2031. Show your calculations in the box below. … million [3]
Question paper, page 5
5 0460/12/F/M/19 © UCLES 2019 [Turn over (ii) Explain what challenges are likely to be faced in New South Wales as a result of this predicted population growth. … … … … … … … … … … [5]
Question paper, page 6
6 0460/12/F/M/19 © UCLES 2019 (c) For a named country you have studied, describe a policy which has been used to influence its population growth rate. Name of country … … … … … … … … … … … … … … … … … … … … … … … … … … [7] [Total: 25]
Question paper, page 7
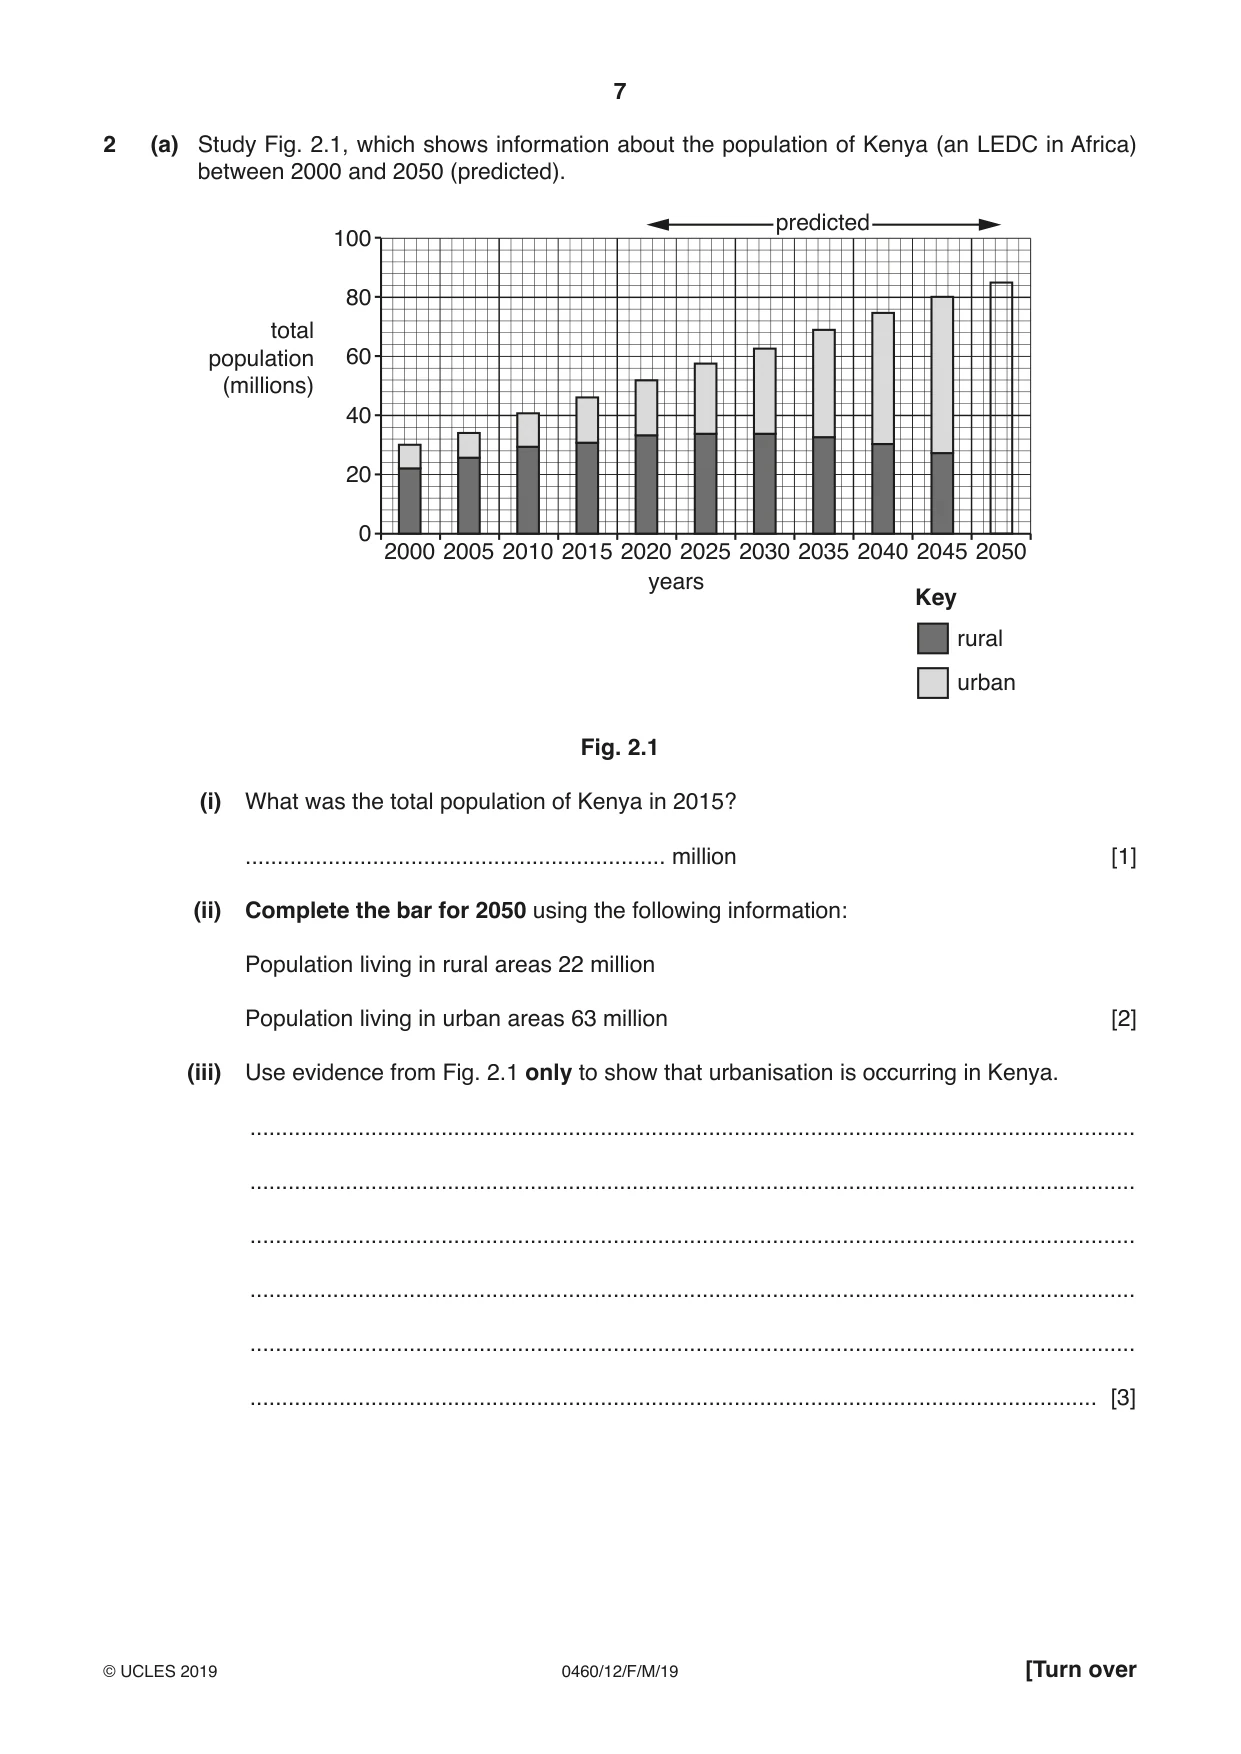
7 0460/12/F/M/19 © UCLES 2019 [Turn over 2 (a) Study Fig. 2.1, which shows information about the population of Kenya (an LEDC in Africa) between 2000 and 2050 (predicted). 2000 2005 2010 2015 2020 2025 years 2030 2035 2040 2045 2050 100 80 60 40 20 0 total population (millions) Key rural urban predicted Fig. 2.1 (i) What was the total population of Kenya in 2015? … million [1] (ii) Complete the bar for 2050 using the following information: Population living in rural areas 22 million Population living in urban areas 63 million [2] (iii) Use evidence from Fig. 2.1 only to show that urbanisation is occurring in Kenya. … … … … … … [3]
Question paper, page 8
8 0460/12/F/M/19 © UCLES 2019 (iv) Explain why urbanisation is occurring in LEDCs such as Kenya. … … … … … … … … [4] (b) Study Fig. 2.2 (Insert), which are maps showing the percentage of people in African countries living in squatter settlements in 1995 and 2015. (i) Identify a country which is labelled on Fig. 2.2 where the percentage of people living in squatter settlements: – increased between 1995 and 2015 … – decreased between 1995 and 2015 … – was the same in 1995 and 2015. … [3] (ii) Explain why a large percentage of the population in many cities in LEDCs are living in squatter settlements. … … … … … … … … … … [5]
Question paper, page 9
9 0460/12/F/M/19 © UCLES 2019 [Turn over (c) For a named urban area you have studied, describe the strategies used to improve the housing conditions of the people who live there. Name of urban area … … … … … … … … … … … … … … … … … … … … … … … … … … [7] [Total: 25]
Question paper, page 10
10 0460/12/F/M/19 © UCLES 2019 Section B Answer one question from this section. 3 (a) Study Fig. 3.1 (Insert), which is a block diagram of a volcano. (i) Name the type of volcano shown in Fig. 3.1. Circle one of the following: extinct volcano shield volcano strato-volcano [1] (ii) Identify the features labelled X and Y on Fig. 3.1. X … Y … [2] (iii) Describe three hazards for people which may occur when a volcano erupts. 1 … … 2 … … 3 … … [3] (iv) Explain why volcanic eruptions usually do not cause large numbers of deaths, even though many people live nearby. … … … … … … … … [4]
Question paper, page 11
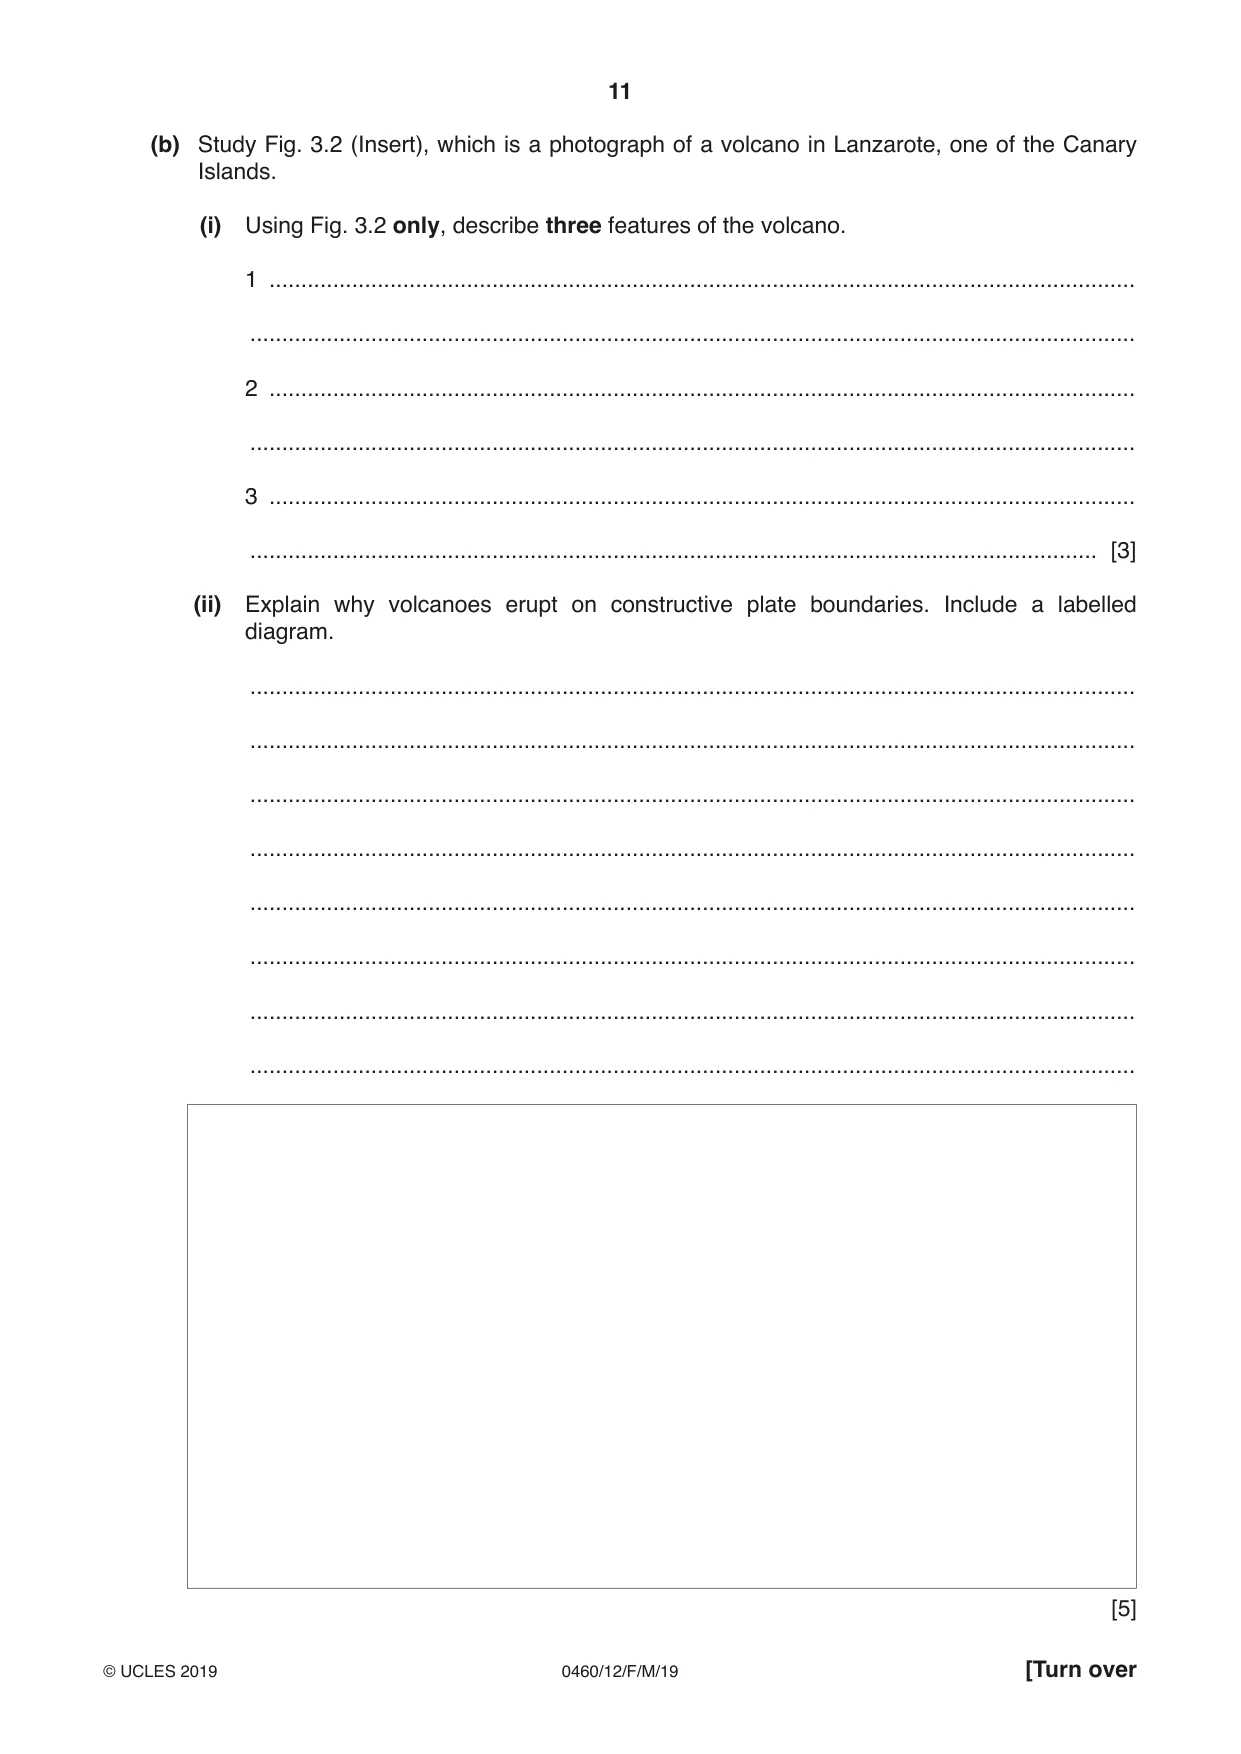
11 0460/12/F/M/19 © UCLES 2019 [Turn over (b) Study Fig. 3.2 (Insert), which is a photograph of a volcano in Lanzarote, one of the Canary Islands. (i) Using Fig. 3.2 only, describe three features of the volcano. 1 … … 2 … … 3 … … [3] (ii) Explain why volcanoes erupt on constructive plate boundaries. Include a labelled diagram. … … … … … … … … [5]
Question paper, page 12
12 0460/12/F/M/19 © UCLES 2019 (c) Describe the impacts of an earthquake on a named area you have studied. Name of area … … … … … … … … … … … … … … … … … … … … … … … … … … [7] [Total: 25]
Question paper, page 13
13 0460/12/F/M/19 © UCLES 2019 [Turn over TURN PAGE FOR QUESTION 4
Question paper, page 14
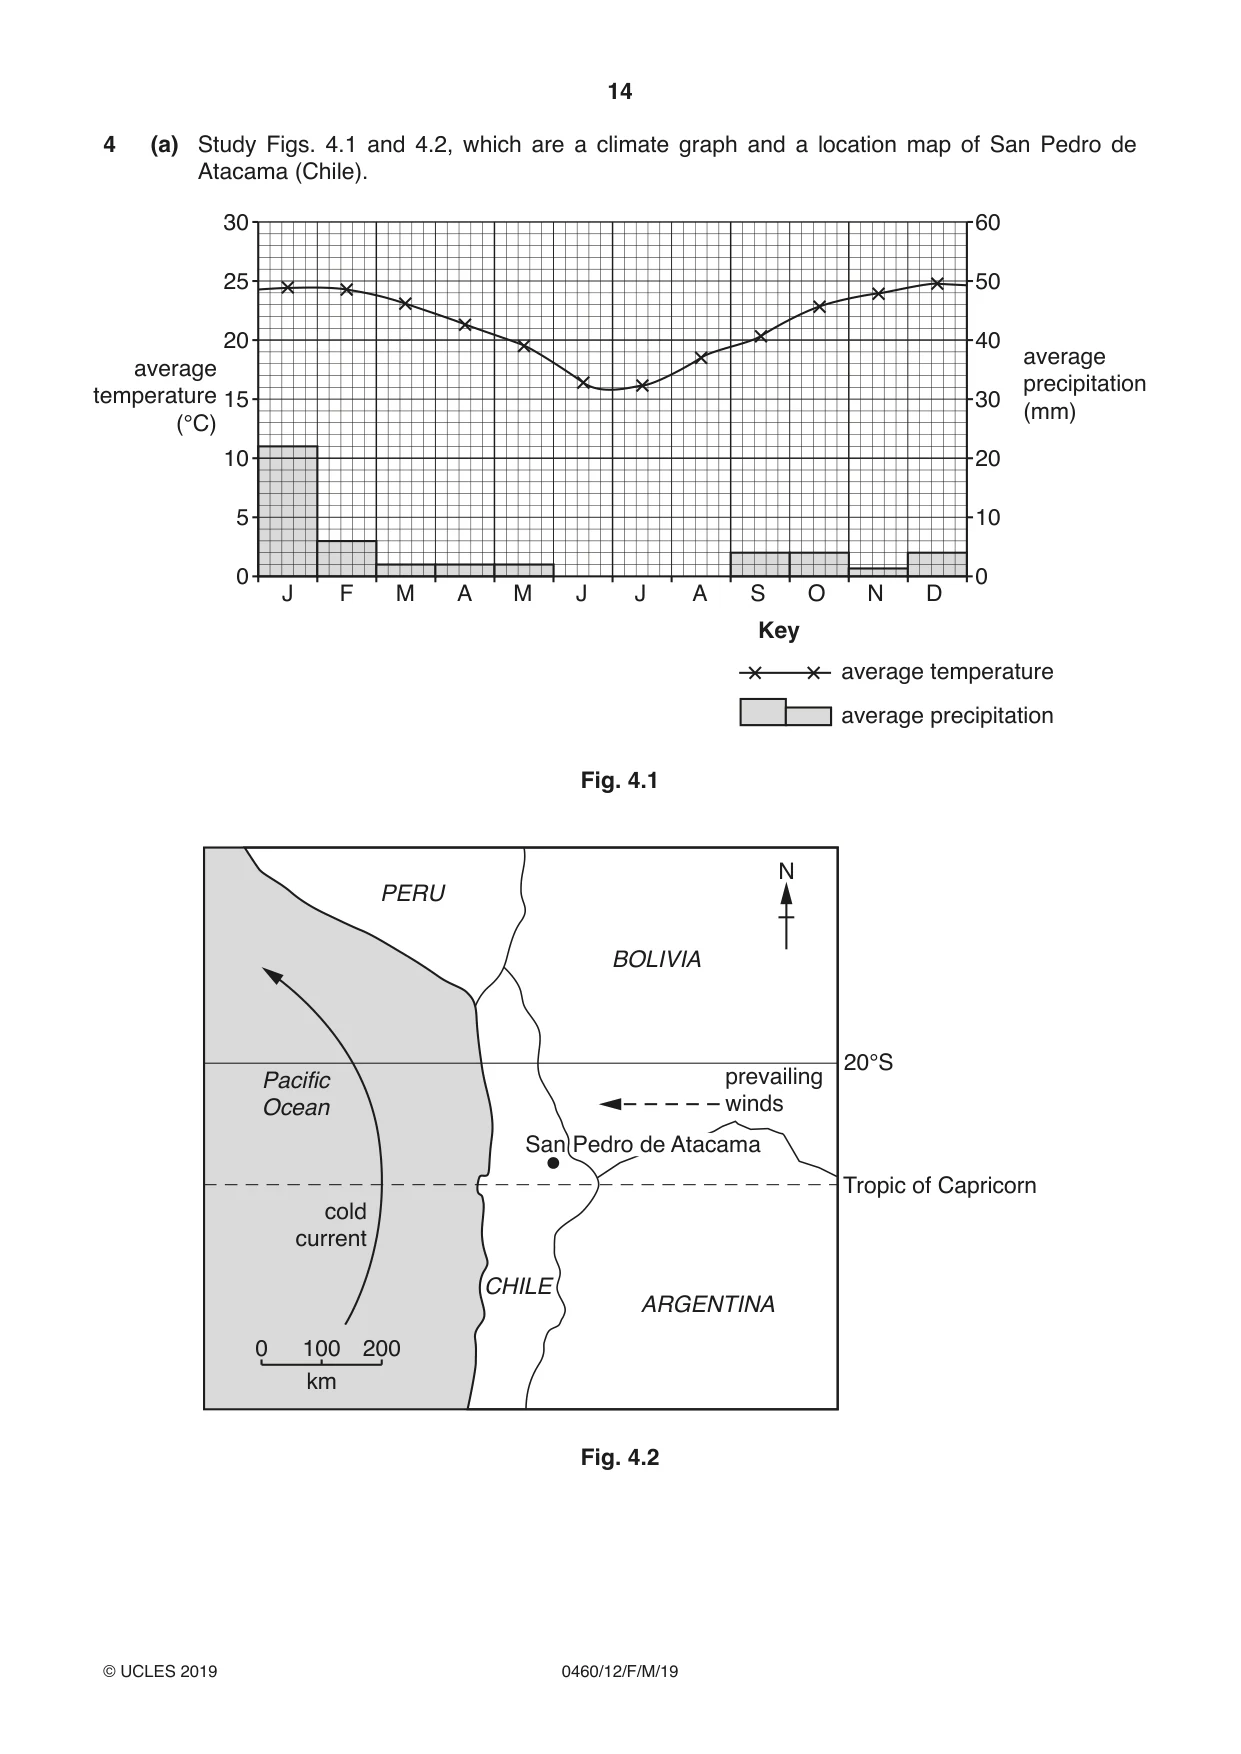
14 0460/12/F/M/19 © UCLES 2019 4 (a) Study Figs. 4.1 and 4.2, which are a climate graph and a location map of San Pedro de Atacama (Chile). 30 20 25 10 15 0 5 average temperature (°C) average precipitation (mm) J F M A M J J A S O N D 0 10 20 30 40 50 60 Key average temperature average precipitation Fig. 4.1 PERU BOLIVIA ARGENTINA CHILE Pacific Ocean cold current 0 100 km 200 prevailing winds 20°S Tropic of Capricorn N San Pedro de Atacama Fig. 4.2
Question paper, page 15
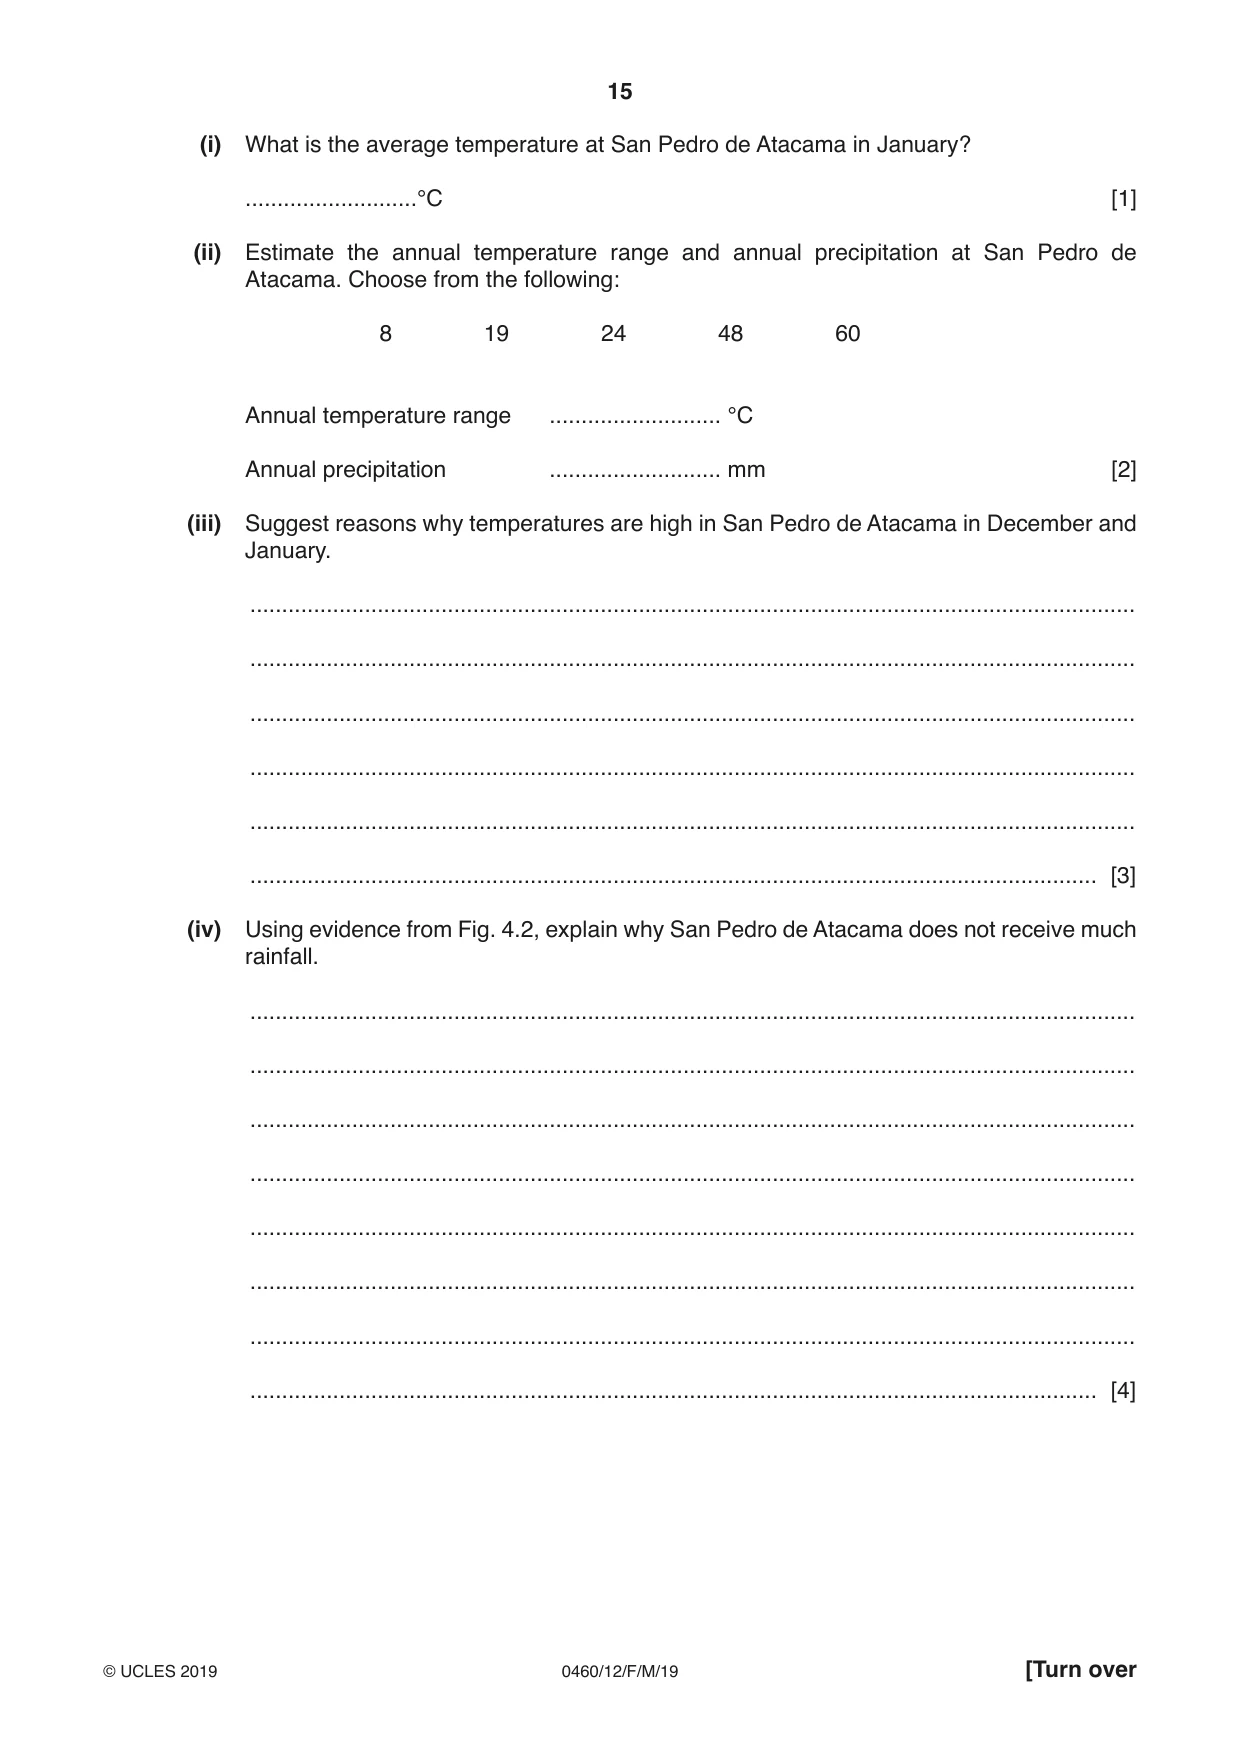
15 0460/12/F/M/19 © UCLES 2019 [Turn over (i) What is the average temperature at San Pedro de Atacama in January? …°C [1] (ii) Estimate the annual temperature range and annual precipitation at San Pedro de Atacama. Choose from the following: 8 19 24 48 60 Annual temperature range … °C Annual precipitation … mm [2] (iii) Suggest reasons why temperatures are high in San Pedro de Atacama in December and January. … … … … … … [3] (iv) Using evidence from Fig. 4.2, explain why San Pedro de Atacama does not receive much rainfall. … … … … … … … … [4]
Question paper, page 16
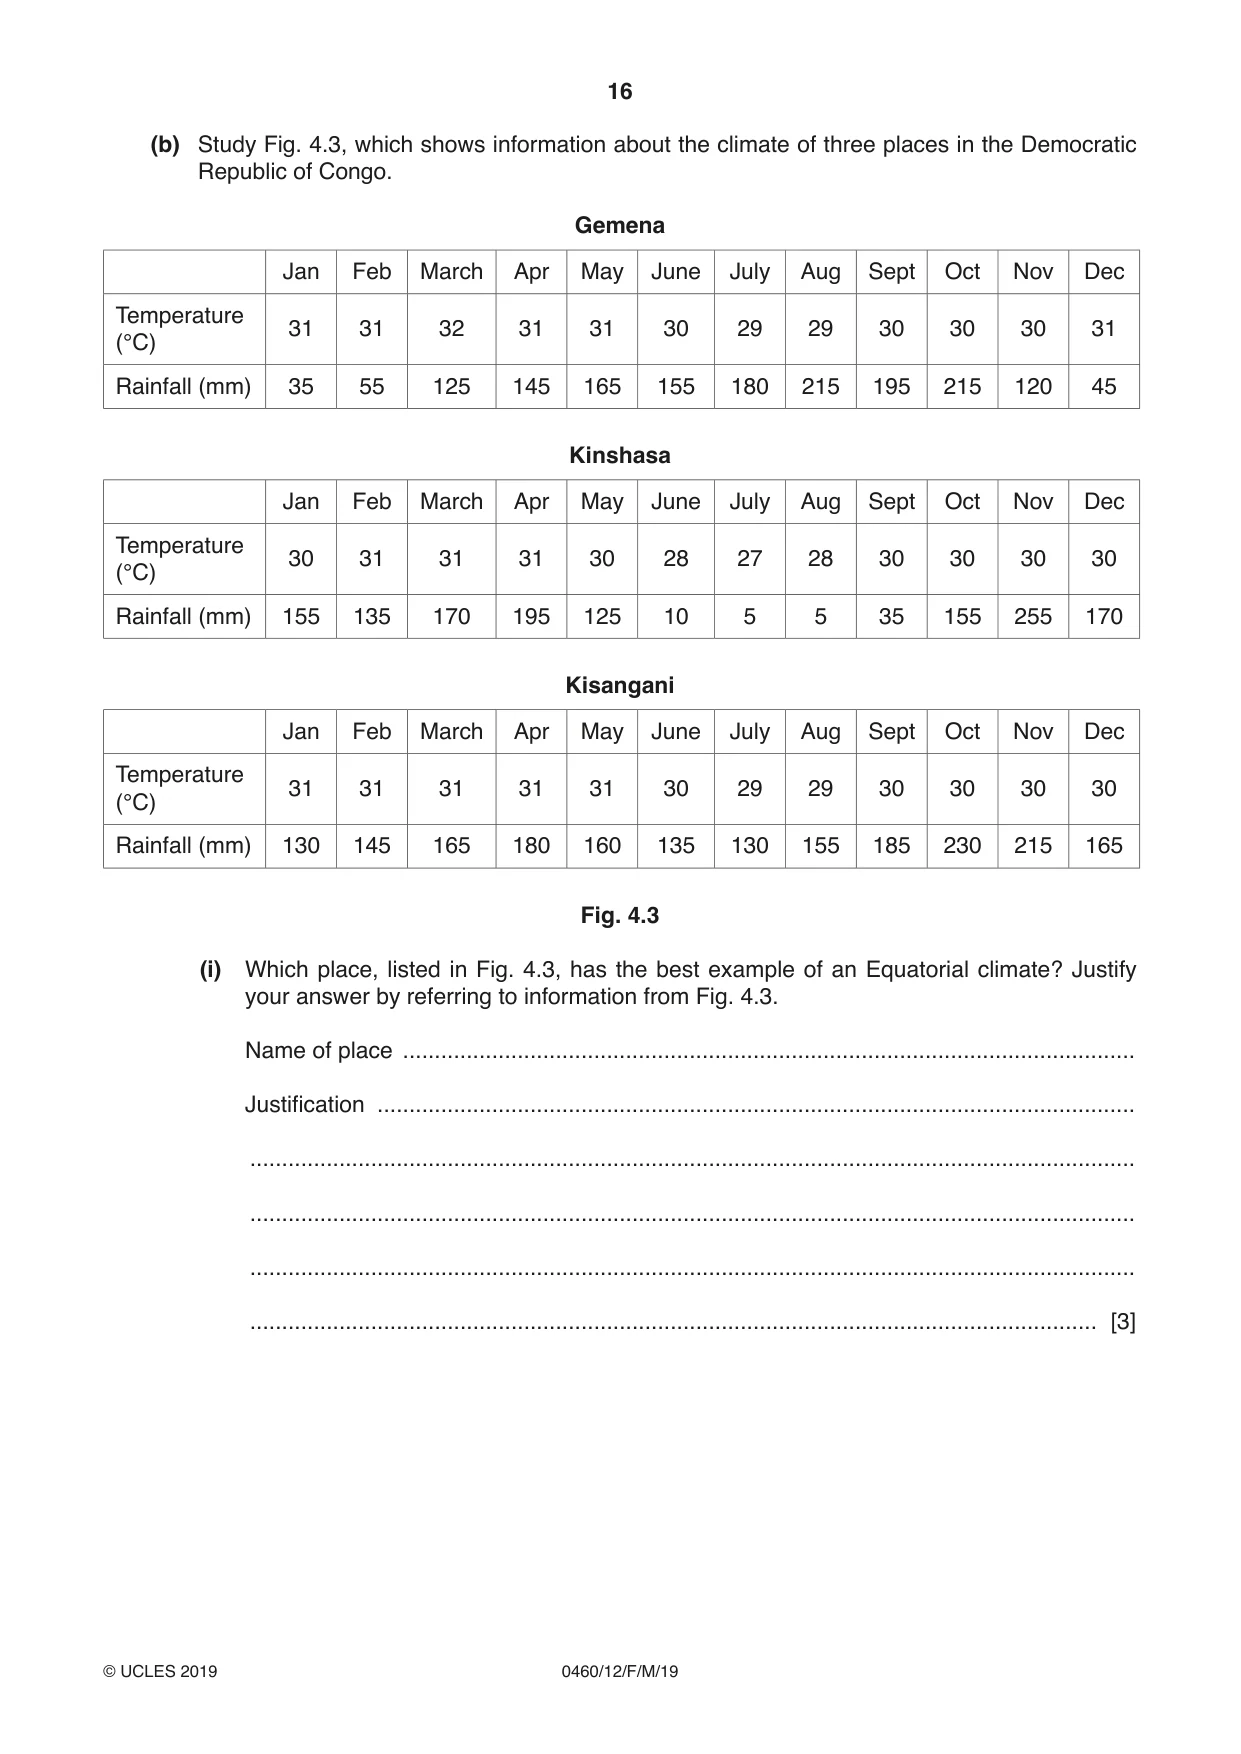
16 0460/12/F/M/19 © UCLES 2019 (b) Study Fig. 4.3, which shows information about the climate of three places in the Democratic Republic of Congo. Gemena Jan Feb March Apr May June July Aug Sept Oct Nov Dec Temperature (°C) 31 31 32 31 31 30 29 29 30 30 30 31 Rainfall (mm) 35 55 125 145 165 155 180 215 195 215 120 45 Kinshasa Jan Feb March Apr May June July Aug Sept Oct Nov Dec Temperature (°C) 30 31 31 31 30 28 27 28 30 30 30 30 Rainfall (mm) 155 135 170 195 125 10 5 5 35 155 255 170 Kisangani Jan Feb March Apr May June July Aug Sept Oct Nov Dec Temperature (°C) 31 31 31 31 31 30 29 29 30 30 30 30 Rainfall (mm) 130 145 165 180 160 135 130 155 185 230 215 165 Fig. 4.3 (i) Which place, listed in Fig. 4.3, has the best example of an Equatorial climate? Justify your answer by referring to information from Fig. 4.3. Name of place … Justification … … … … … [3]
Question paper, page 17
17 0460/12/F/M/19 © UCLES 2019 [Turn over (ii) Explain how the vegetation which grows in a tropical rainforest is influenced by the climatic conditions. … … … … … … … … … … [5]
Question paper, page 18
18 0460/12/F/M/19 © UCLES 2019 (c) For a named area of tropical rainforest, explain why deforestation has taken place. Name of area of rainforest … … … … … … … … … … … … … … … … … … … … … … … … … … [7] [Total: 25]
Question paper, page 19
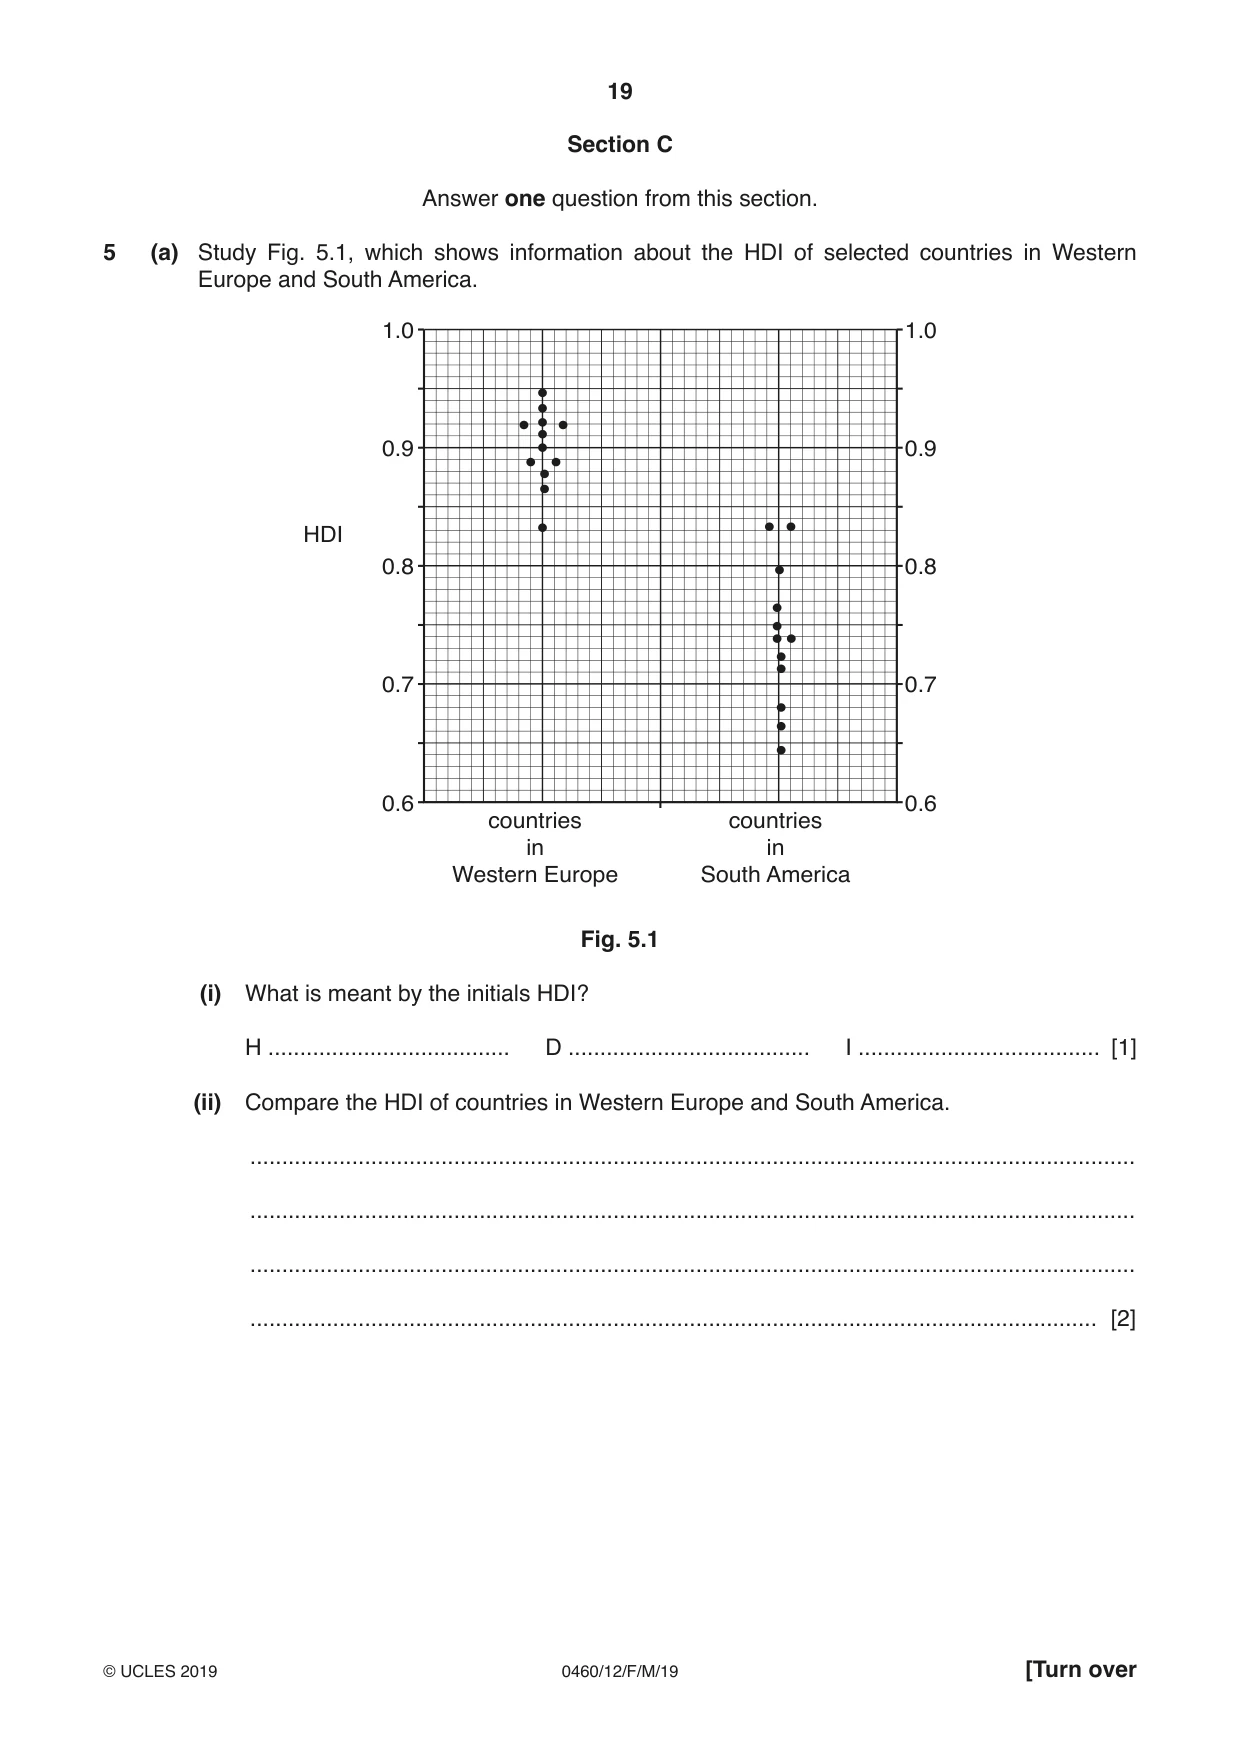
19 0460/12/F/M/19 © UCLES 2019 [Turn over Section C Answer one question from this section. 5 (a) Study Fig. 5.1, which shows information about the HDI of selected countries in Western Europe and South America. 1.0 0.9 0.8 0.7 0.6 1.0 0.9 0.8 0.7 0.6 countries in Western Europe countries in South America HDI Fig. 5.1 (i) What is meant by the initials HDI? H … D … I … [1] (ii) Compare the HDI of countries in Western Europe and South America. … … … … [2]
Question paper, page 20
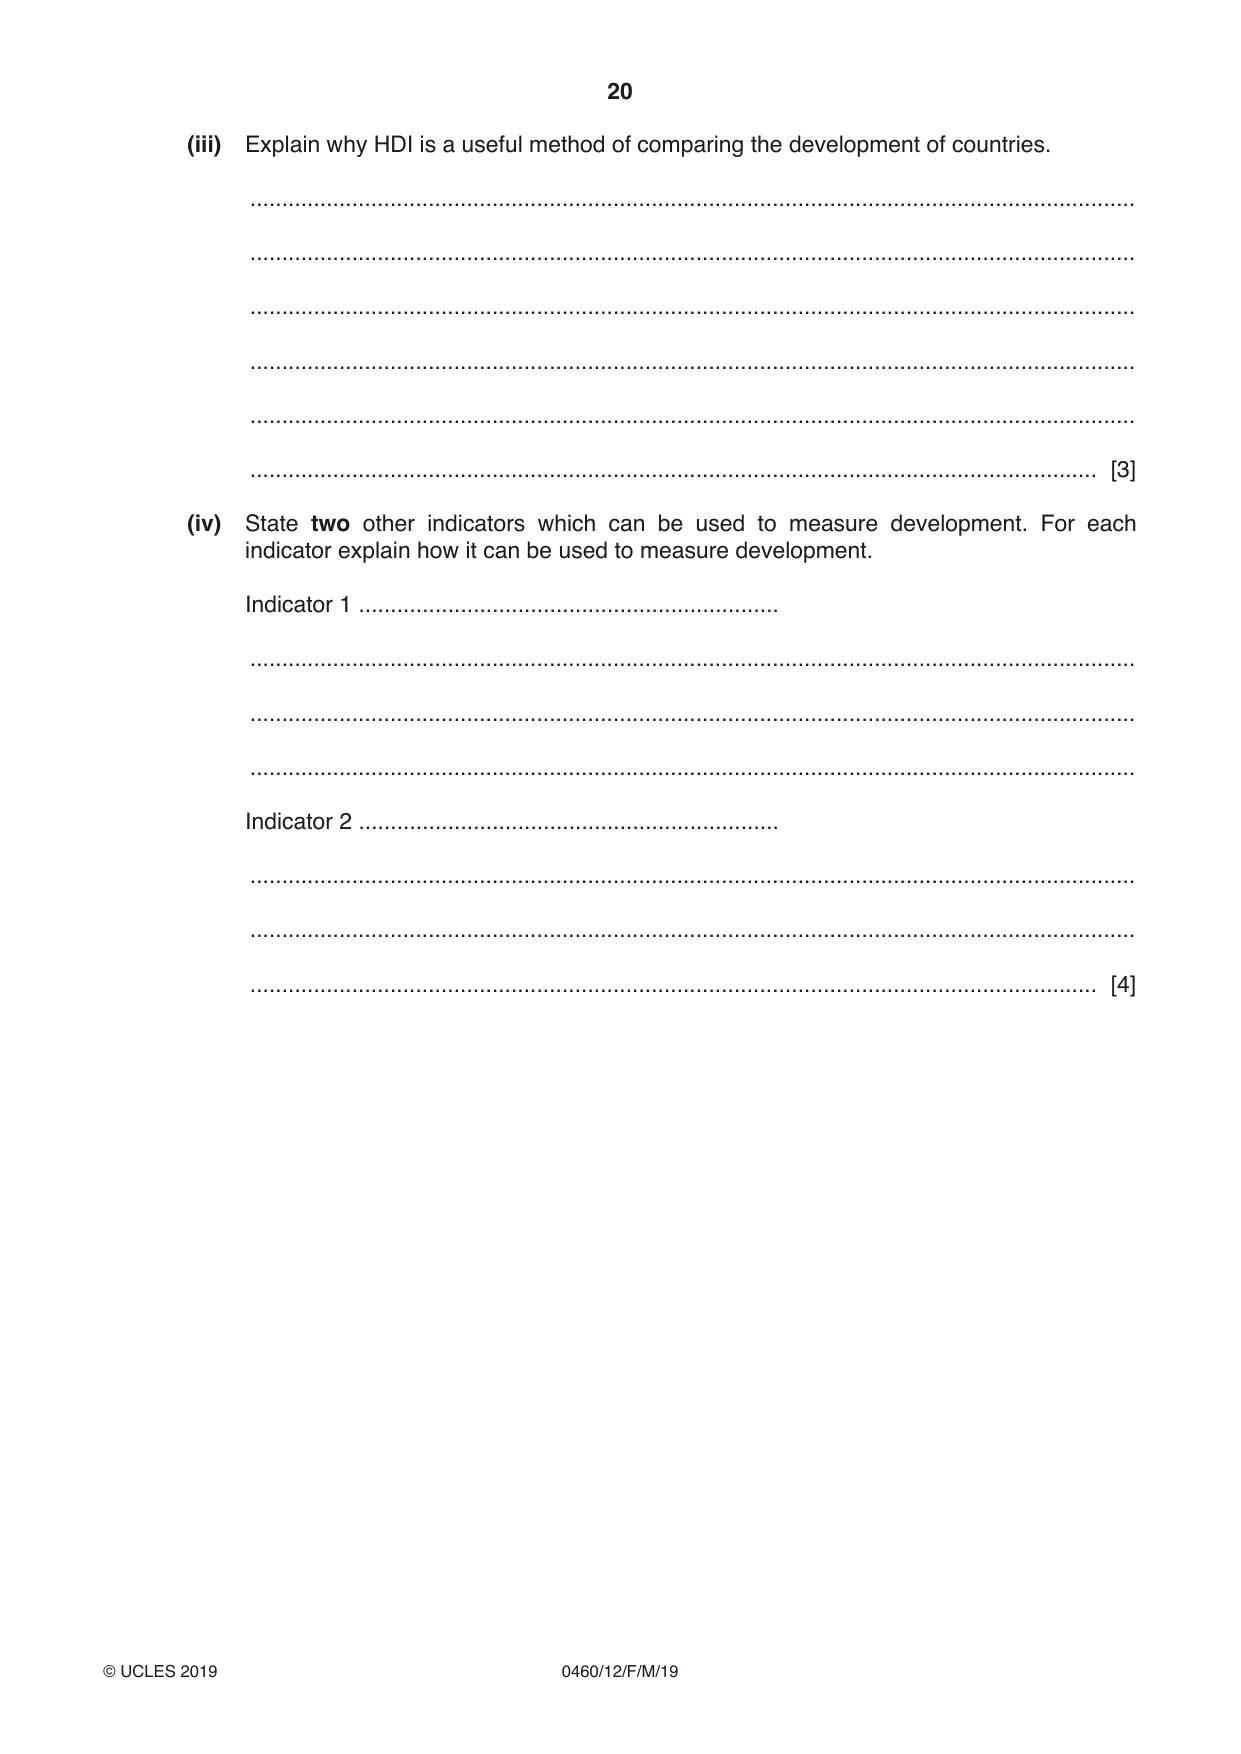
20 0460/12/F/M/19 © UCLES 2019 (iii) Explain why HDI is a useful method of comparing the development of countries. … … … … … … [3] (iv) State two other indicators which can be used to measure development. For each indicator explain how it can be used to measure development. Indicator 1 … … … … Indicator 2 … … … … [4]
Question paper, page 21
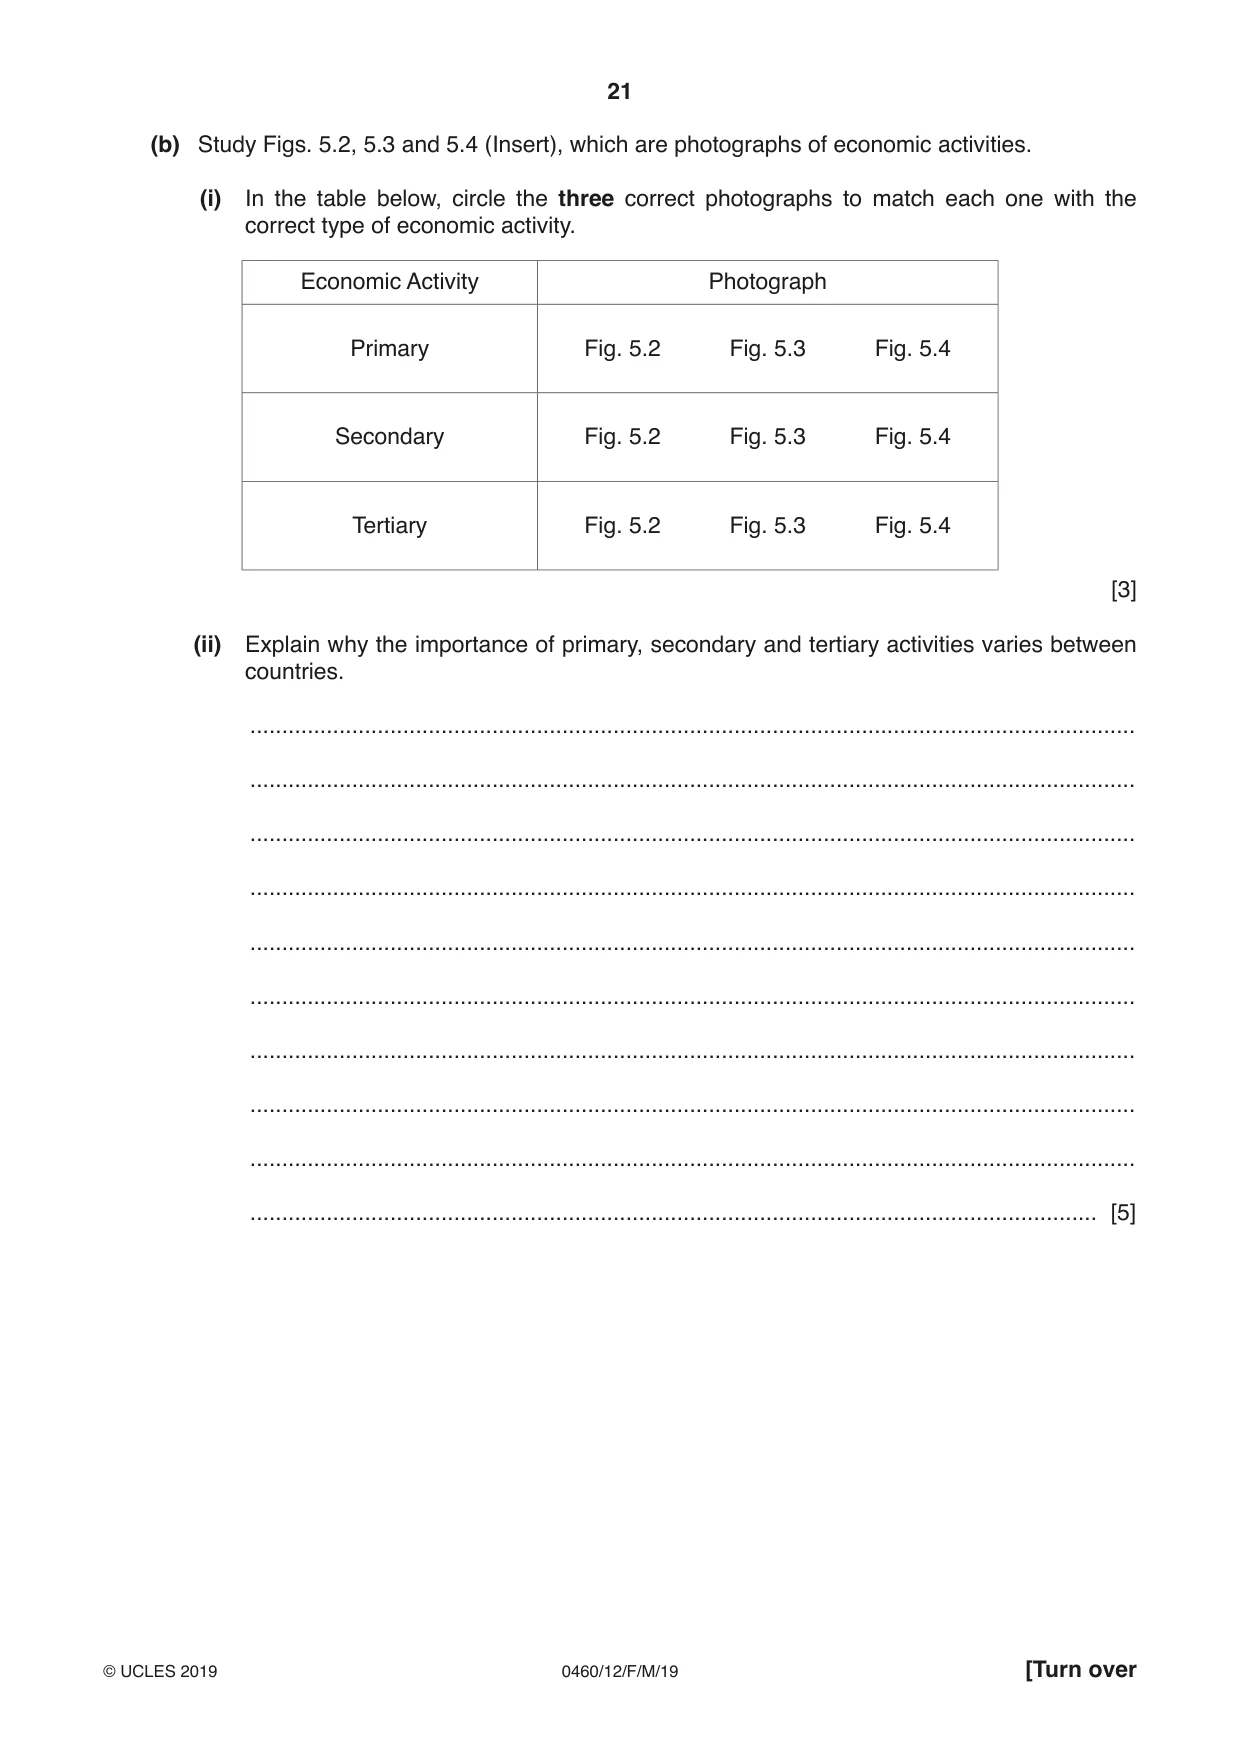
21 0460/12/F/M/19 © UCLES 2019 [Turn over (b) Study Figs. 5.2, 5.3 and 5.4 (Insert), which are photographs of economic activities. (i) In the table below, circle the three correct photographs to match each one with the correct type of economic activity. Economic Activity Photograph Primary Fig. 5.2 Fig. 5.3 Fig. 5.4 Secondary Fig. 5.2 Fig. 5.3 Fig. 5.4 Tertiary Fig. 5.2 Fig. 5.3 Fig. 5.4 [3] (ii) Explain why the importance of primary, secondary and tertiary activities varies between countries. … … … … … … … … … … [5]
Question paper, page 22
22 0460/12/F/M/19 © UCLES 2019 (c) For a named country or area you have studied, describe the impacts of an economic activity on the natural environment. Name of country or area … Economic Activity … … … … … … … … … … … … … … … … … … … … … … … … … [7] [Total: 25]
Question paper, page 23
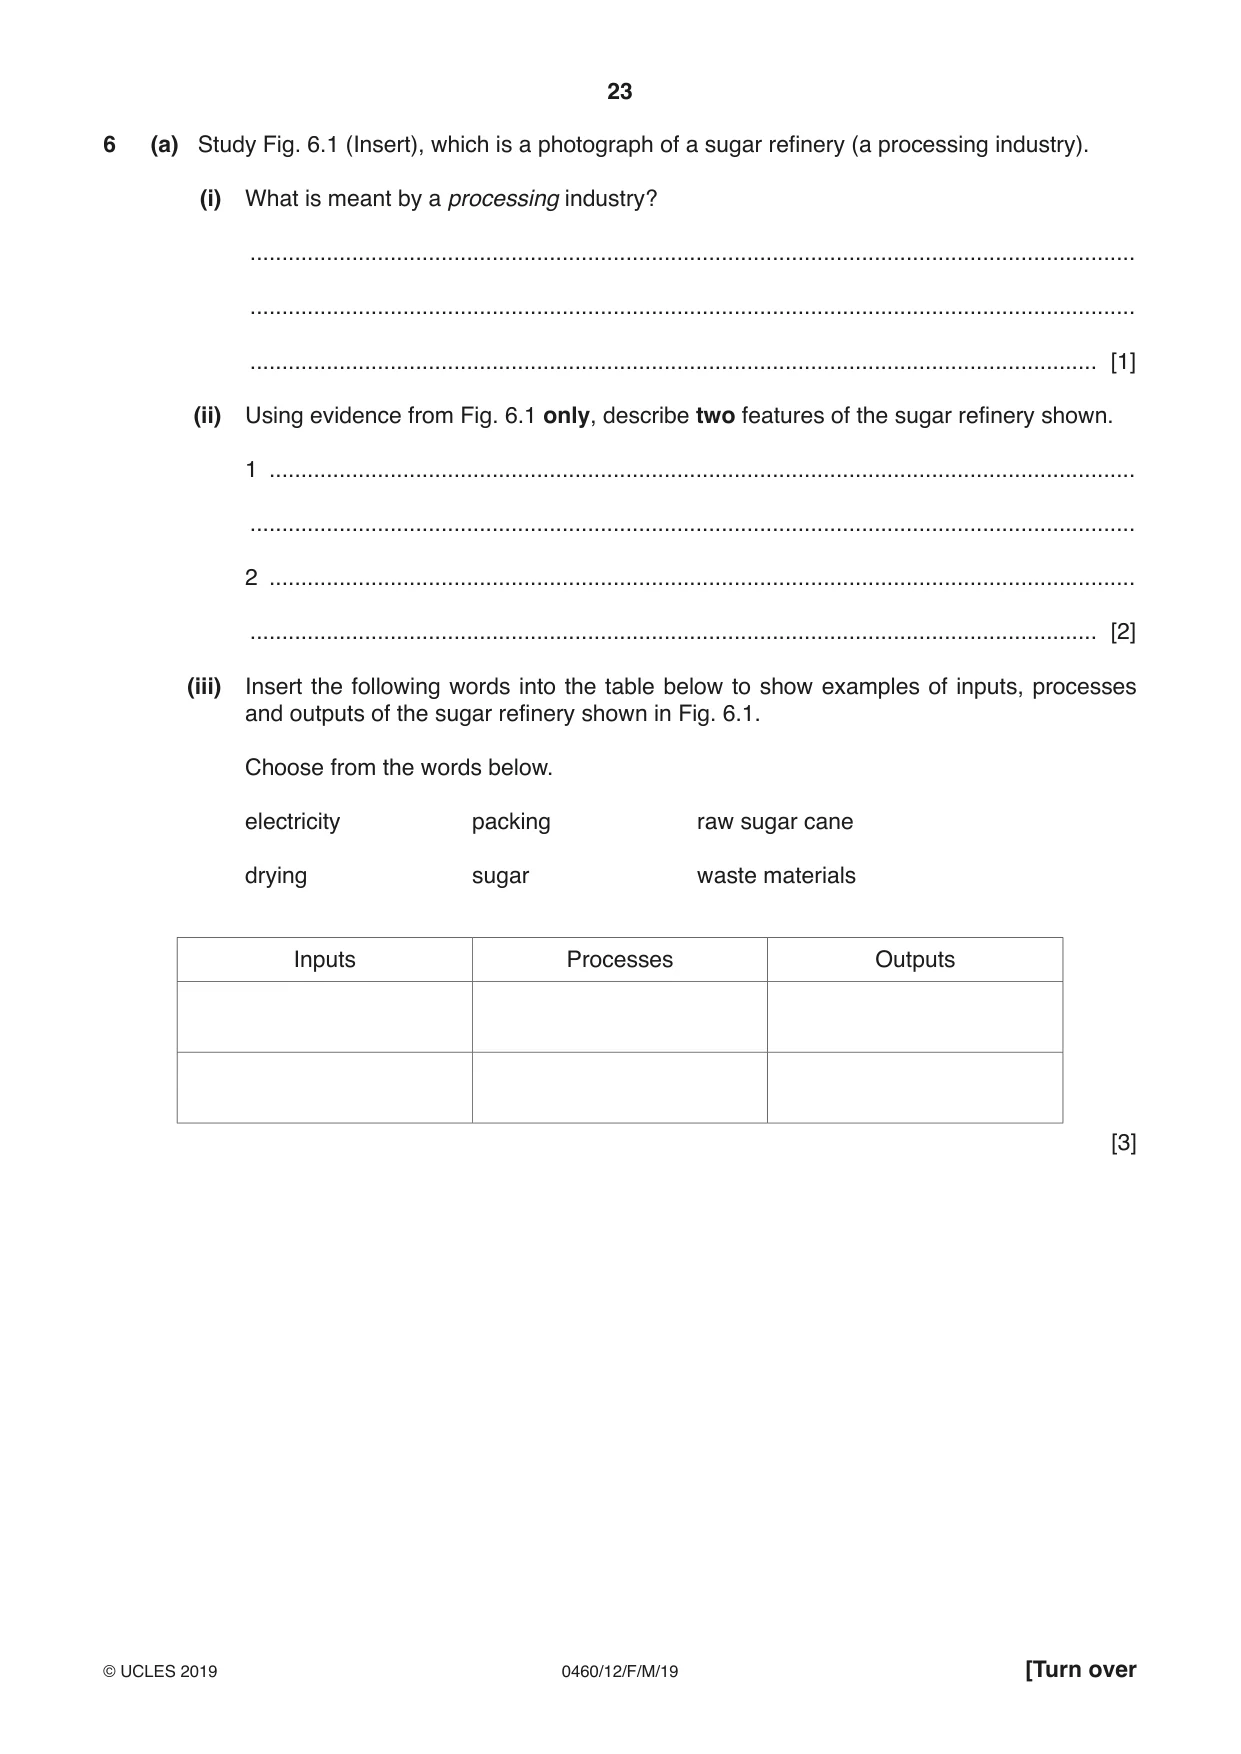
23 0460/12/F/M/19 © UCLES 2019 [Turn over 6 (a) Study Fig. 6.1 (Insert), which is a photograph of a sugar refinery (a processing industry). (i) What is meant by a processing industry? … … … [1] (ii) Using evidence from Fig. 6.1 only, describe two features of the sugar refinery shown. 1 … … 2 … … [2] (iii) Insert the following words into the table below to show examples of inputs, processes and outputs of the sugar refinery shown in Fig. 6.1. Choose from the words below. electricity packing raw sugar cane drying sugar waste materials Inputs Processes Outputs [3]
Question paper, page 24
24 0460/12/F/M/19 © UCLES 2019 (iv) Suggest ways in which factories, such as that shown in Fig. 6.1, may threaten the local natural environment. … … … … … … … … … [4]
Question paper, page 25
25 0460/12/F/M/19 © UCLES 2019 [Turn over TURN PAGE FOR QUESTION 6(b)
Question paper, page 26
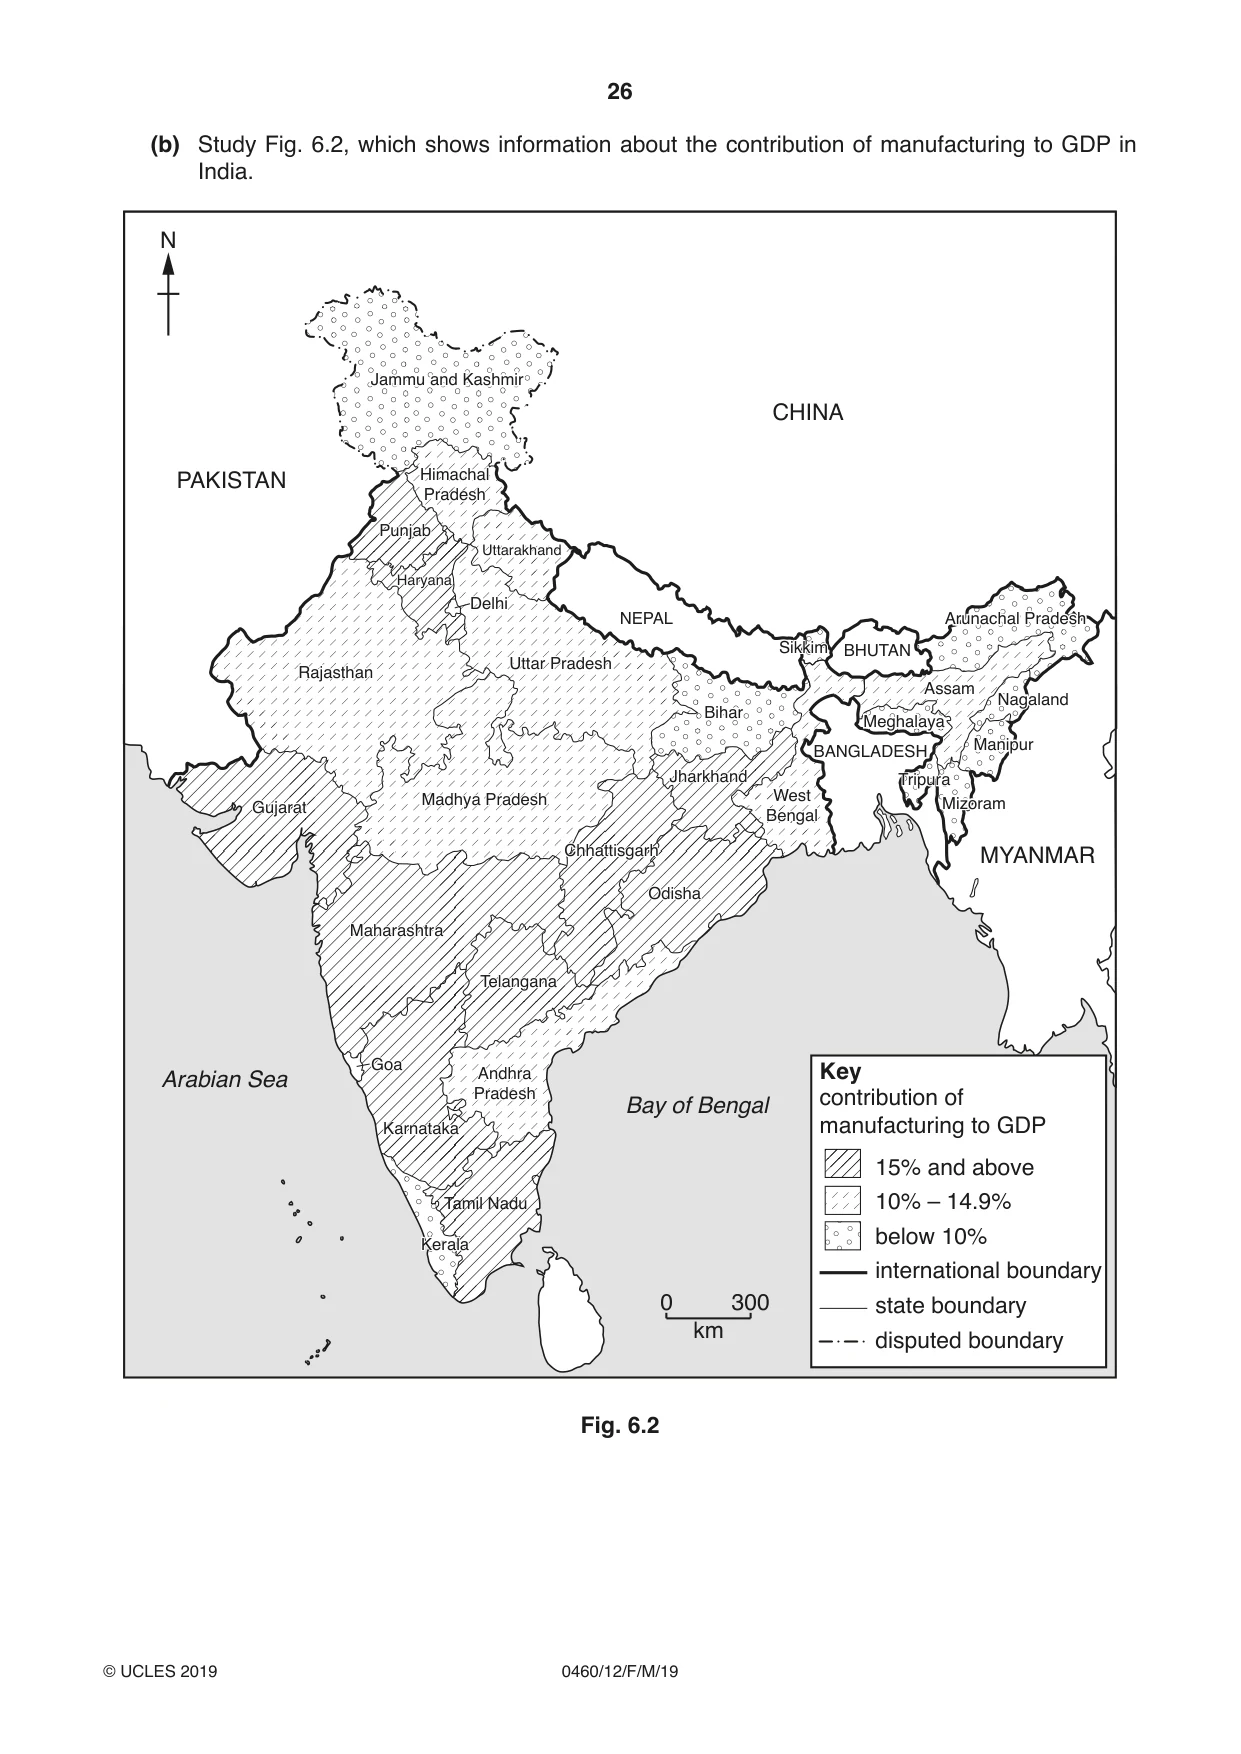
26 0460/12/F/M/19 © UCLES 2019 (b) Study Fig. 6.2, which shows information about the contribution of manufacturing to GDP in India. Jammu and Kashmir Jammu and Kashmir Himachal Pradesh Himachal Pradesh Punjab Punjab Haryana Haryana Uttarakhand Uttarakhand NEPAL BHUTAN Uttar Pradesh Uttar Pradesh Rajasthan Rajasthan Gujarat Gujarat Madhya Pradesh Madhya Pradesh Maharashtra Maharashtra Goa Goa Karnataka Karnataka Kerala Kerala Tamil Nadu Andhra Pradesh Andhra Pradesh Telangana Telangana Odisha Odisha Chhattisgarh Chhattisgarh Jharkhand Jharkhand Bihar Bihar West Bengal West Bengal BANGLADESH Sikkim Sikkim Assam Assam Arunachal Pradesh Arunachal Pradesh Meghalaya Meghalaya Nagaland Nagaland Manipur Manipur Tripura Tripura Mizoram Mizoram Delhi Delhi Bay of Bengal Arabian Sea CHINA MYANMAR PAKISTAN 0 300 km N Key 15% and above 10% – 14.9% below 10% international boundary state boundary disputed boundary contribution of manufacturing to GDP Fig. 6.2
Question paper, page 27
27 0460/12/F/M/19 © UCLES 2019 [Turn over (i) Describe the distribution of the states in India where the contribution of manufacturing to GDP is 15% and above. … … … … … … [3] (ii) Some industries in LEDCs are owned by transnational corporations (TNCs). Explain how TNCs can bring both advantages and disadvantages to LEDCs. … … … … … … … … … … [5]
Question paper, page 28
28 0460/12/F/M/19 © UCLES 2019 (c) For a named example you have studied, describe and explain the location of a factory or industrial zone. Name of factory or industrial zone … … … … … … … … … … … … … … … … … … … … … … … … … … [7] [Total: 25]
Question paper, page 29
29 0460/12/F/M/19 © UCLES 2019 Additional Pages If you use the following lined pages to complete the answer(s) to any question(s), the question number(s) must be clearly shown. … … … … … … … … … … … … … … … … … … … … … … … … …
Question paper, page 30
30 0460/12/F/M/19 © UCLES 2019 … … … … … … … … … … … … … … … … … … … … … … … … … … … …
Question paper, page 31
31 0460/12/F/M/19 © UCLES 2019 BLANK PAGE
Question paper, page 32
32 0460/12/F/M/19 © UCLES 2019 Permission to reproduce items where third-party owned material protected by copyright is included has been sought and cleared where possible. Every reasonable effort has been made by the publisher (UCLES) to trace copyright holders, but if any items requiring clearance have unwittingly been included, the publisher will be pleased to make amends at the earliest possible opportunity. To avoid the issue of disclosure of answer-related information to candidates, all copyright acknowledgements are reproduced online in the Cambridge Assessment International Education Copyright Acknowledgements Booklet. This is produced for each series of examinations and is freely available to download at www.cambridgeinternational.org after the live examination series. Cambridge Assessment International Education is part of the Cambridge Assessment Group. Cambridge Assessment is the brand name of the University of Cambridge Local Examinations Syndicate (UCLES), which itself is a department of the University of Cambridge. BLANK PAGE
Mark scheme, page 1
This syllabus is regulated for use in England, Wales and Northern Ireland as a Cambridge International Level 1/Level 2 Certificate. This document consists of 16 printed pages. © UCLES 2019 [Turn over Cambridge Assessment International Education Cambridge International General Certificate of Secondary Education GEOGRAPHY 0460/12 Paper 1 March 2019 MARK SCHEME Maximum Mark: 75 Published This mark scheme is published as an aid to teachers and candidates, to indicate the requirements of the examination. It shows the basis on which Examiners were instructed to award marks. It does not indicate the details of the discussions that took place at an Examiners’ meeting before marking began, which would have considered the acceptability of alternative answers. Mark schemes should be read in conjunction with the question paper and the Principal Examiner Report for Teachers. Cambridge International will not enter into discussions about these mark schemes. Cambridge International is publishing the mark schemes for the March 2019 series for most Cambridge IGCSE™, Cambridge International A and AS Level components and some Cambridge O Level components.
Mark scheme, page 2
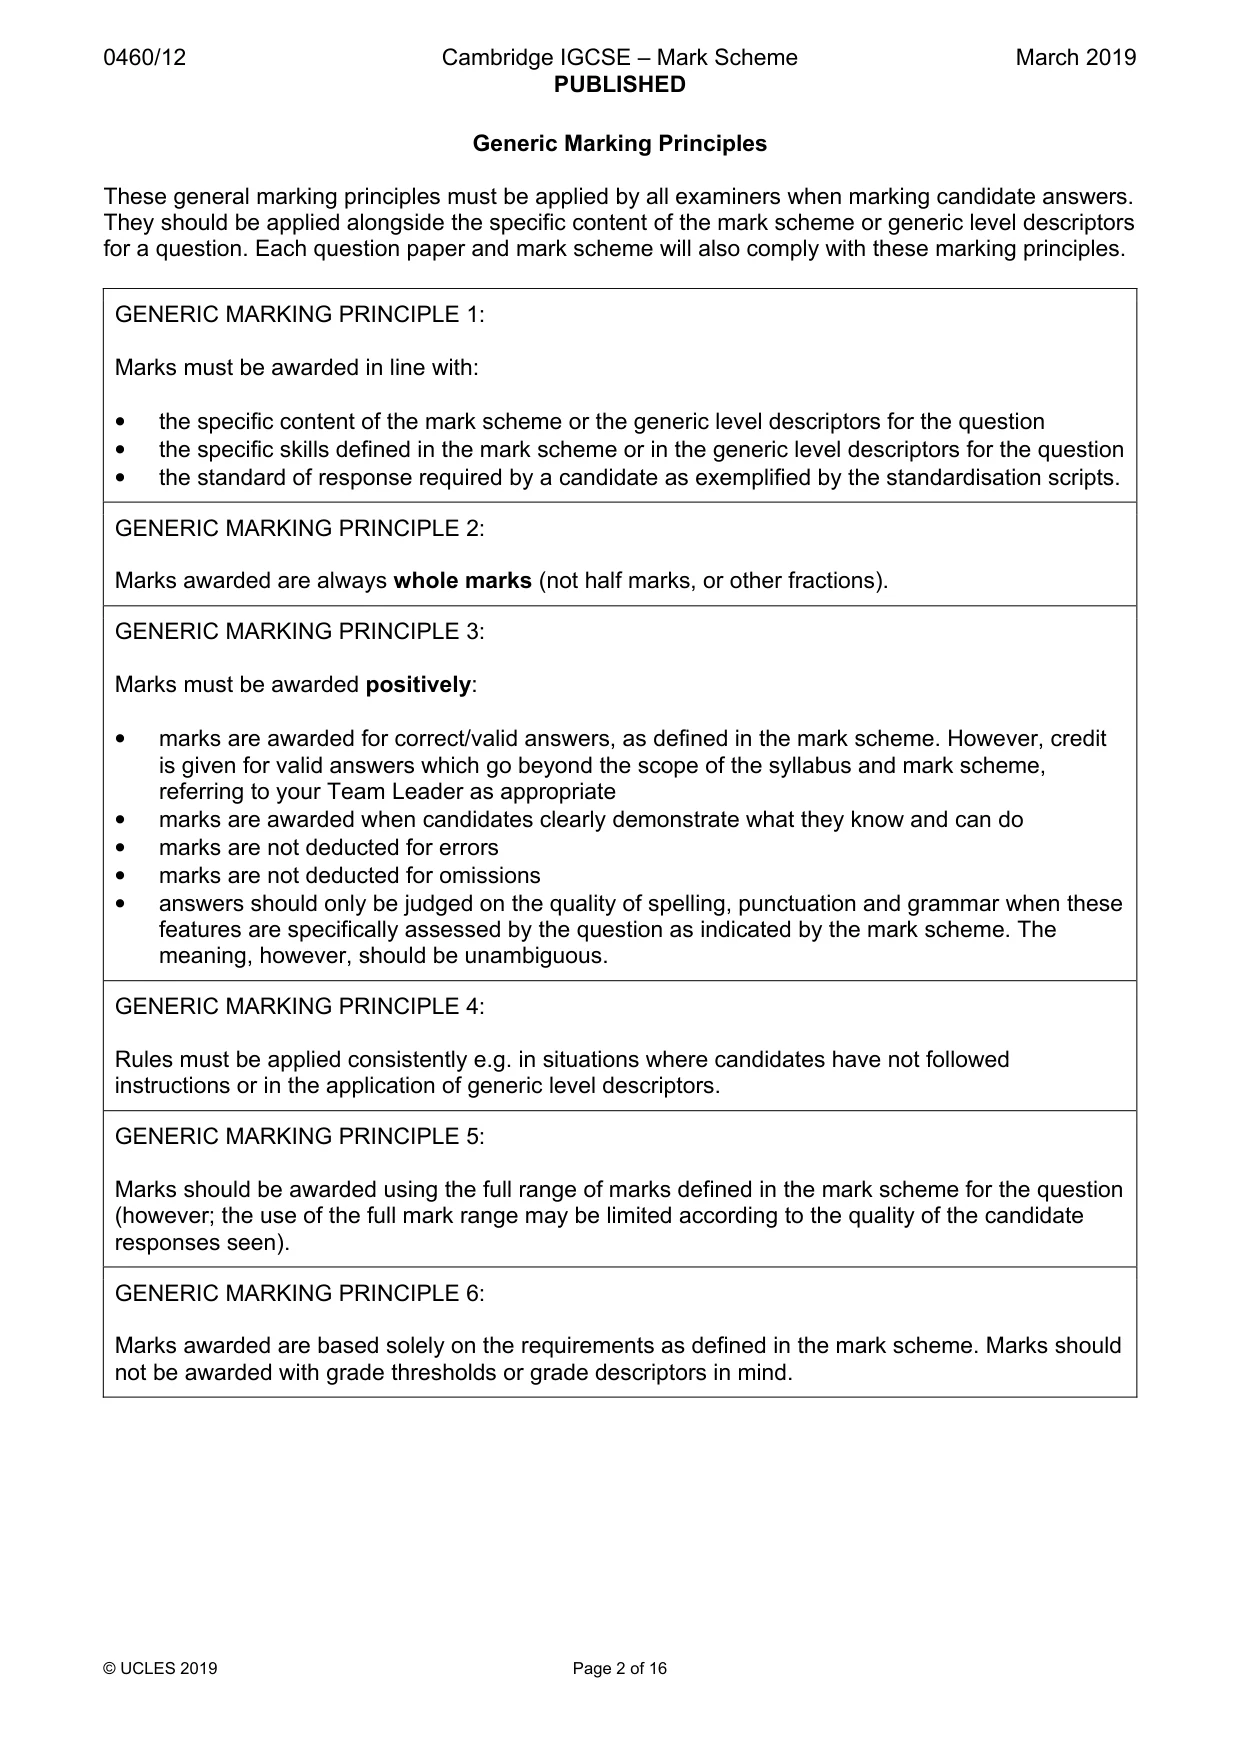
0460/12 Cambridge IGCSE – Mark Scheme PUBLISHED March 2019 © UCLES 2019 Page 2 of 16 Generic Marking Principles These general marking principles must be applied by all examiners when marking candidate answers. They should be applied alongside the specific content of the mark scheme or generic level descriptors for a question. Each question paper and mark scheme will also comply with these marking principles. GENERIC MARKING PRINCIPLE 1: Marks must be awarded in line with: • the specific content of the mark scheme or the generic level descriptors for the question • the specific skills defined in the mark scheme or in the generic level descriptors for the question • the standard of response required by a candidate as exemplified by the standardisation scripts. GENERIC MARKING PRINCIPLE 2: Marks awarded are always whole marks (not half marks, or other fractions). GENERIC MARKING PRINCIPLE 3: Marks must be awarded positively: • marks are awarded for correct/valid answers, as defined in the mark scheme. However, credit is given for valid answers which go beyond the scope of the syllabus and mark scheme, referring to your Team Leader as appropriate • marks are awarded when candidates clearly demonstrate what they know and can do • marks are not deducted for errors • marks are not deducted for omissions • answers should only be judged on the quality of spelling, punctuation and grammar when these features are specifically assessed by the question as indicated by the mark scheme. The meaning, however, should be unambiguous. GENERIC MARKING PRINCIPLE 4: Rules must be applied consistently e.g. in situations where candidates have not followed instructions or in the application of generic level descriptors. GENERIC MARKING PRINCIPLE 5: Marks should be awarded using the full range of marks defined in the mark scheme for the question (however; the use of the full mark range may be limited according to the quality of the candidate responses seen). GENERIC MARKING PRINCIPLE 6: Marks awarded are based solely on the requirements as defined in the mark scheme. Marks should not be awarded with grade thresholds or grade descriptors in mind.
Mark scheme, page 3
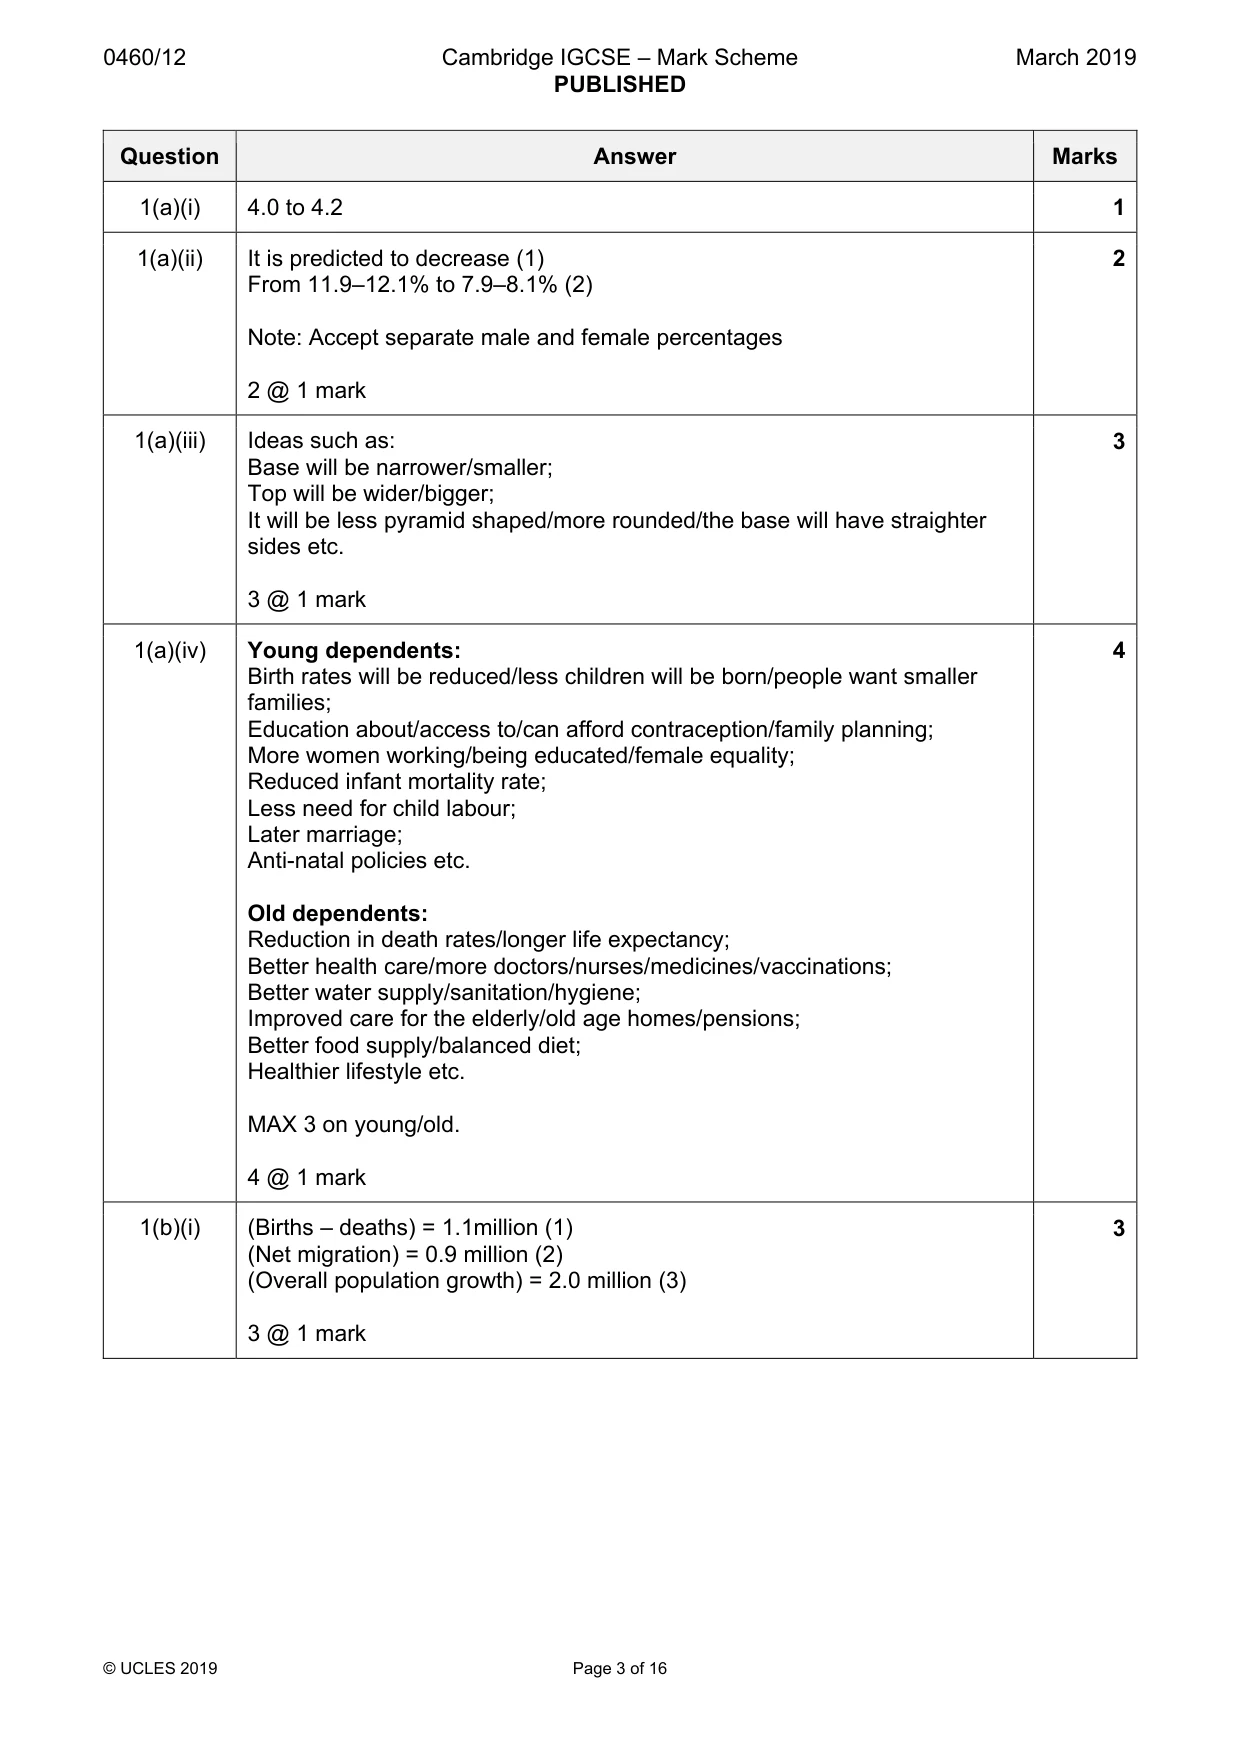
0460/12 Cambridge IGCSE – Mark Scheme PUBLISHED March 2019 © UCLES 2019 Page 3 of 16 Question Answer Marks 1(a)(i) 4.0 to 4.2 1 1(a)(ii) It is predicted to decrease (1) From 11.9–12.1% to 7.9–8.1% (2) Note: Accept separate male and female percentages 2 @ 1 mark 2 1(a)(iii) Ideas such as: Base will be narrower/smaller; Top will be wider/bigger; It will be less pyramid shaped/more rounded/the base will have straighter sides etc. 3 @ 1 mark 3 1(a)(iv) Young dependents: Birth rates will be reduced/less children will be born/people want smaller families; Education about/access to/can afford contraception/family planning; More women working/being educated/female equality; Reduced infant mortality rate; Less need for child labour; Later marriage; Anti-natal policies etc. Old dependents: Reduction in death rates/longer life expectancy; Better health care/more doctors/nurses/medicines/vaccinations; Better water supply/sanitation/hygiene; Improved care for the elderly/old age homes/pensions; Better food supply/balanced diet; Healthier lifestyle etc. MAX 3 on young/old. 4 @ 1 mark 4 1(b)(i) (Births – deaths) = 1.1million (1) (Net migration) = 0.9 million (2) (Overall population growth) = 2.0 million (3) 3 @ 1 mark 3
Mark scheme, page 4
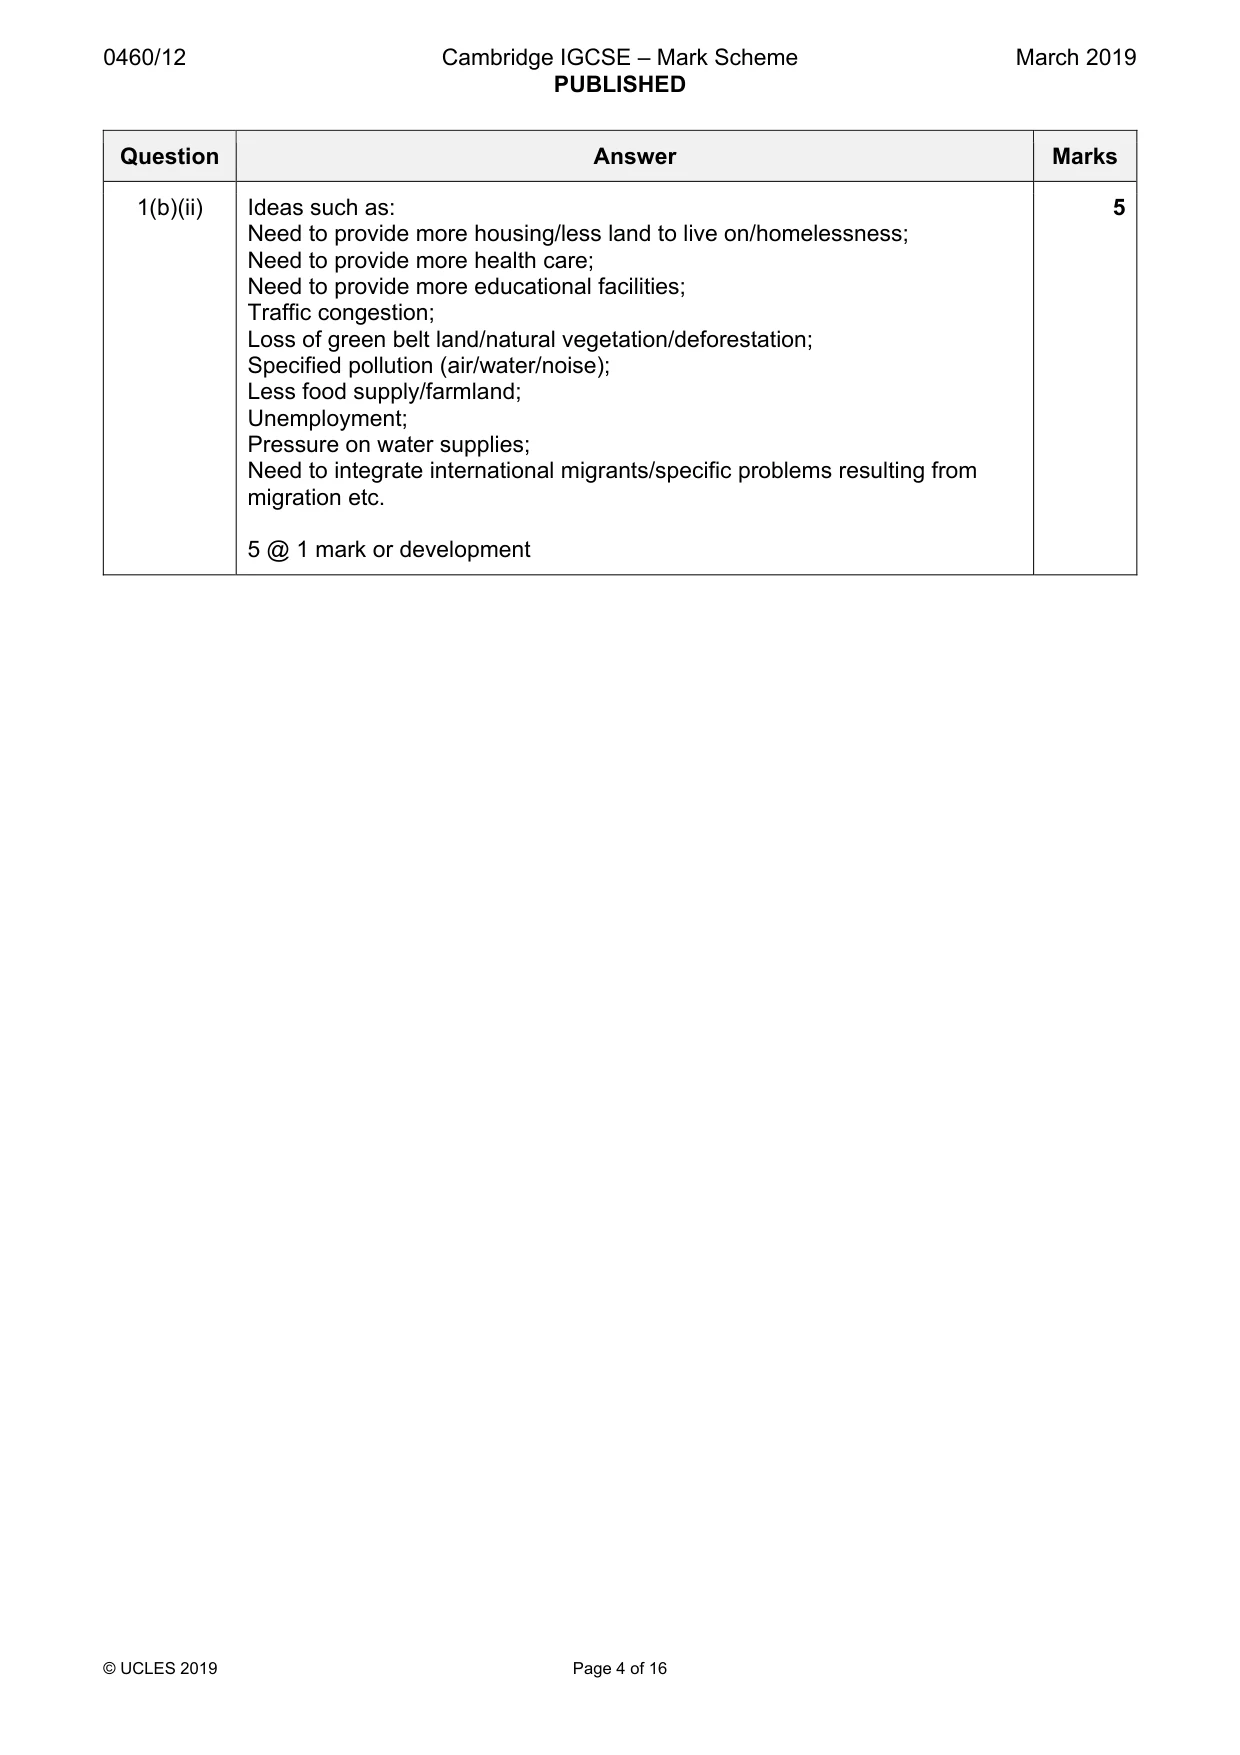
0460/12 Cambridge IGCSE – Mark Scheme PUBLISHED March 2019 © UCLES 2019 Page 4 of 16 Question Answer Marks 1(b)(ii) Ideas such as: Need to provide more housing/less land to live on/homelessness; Need to provide more health care; Need to provide more educational facilities; Traffic congestion; Loss of green belt land/natural vegetation/deforestation; Specified pollution (air/water/noise); Less food supply/farmland; Unemployment; Pressure on water supplies; Need to integrate international migrants/specific problems resulting from migration etc. 5 @ 1 mark or development 5
Mark scheme, page 5
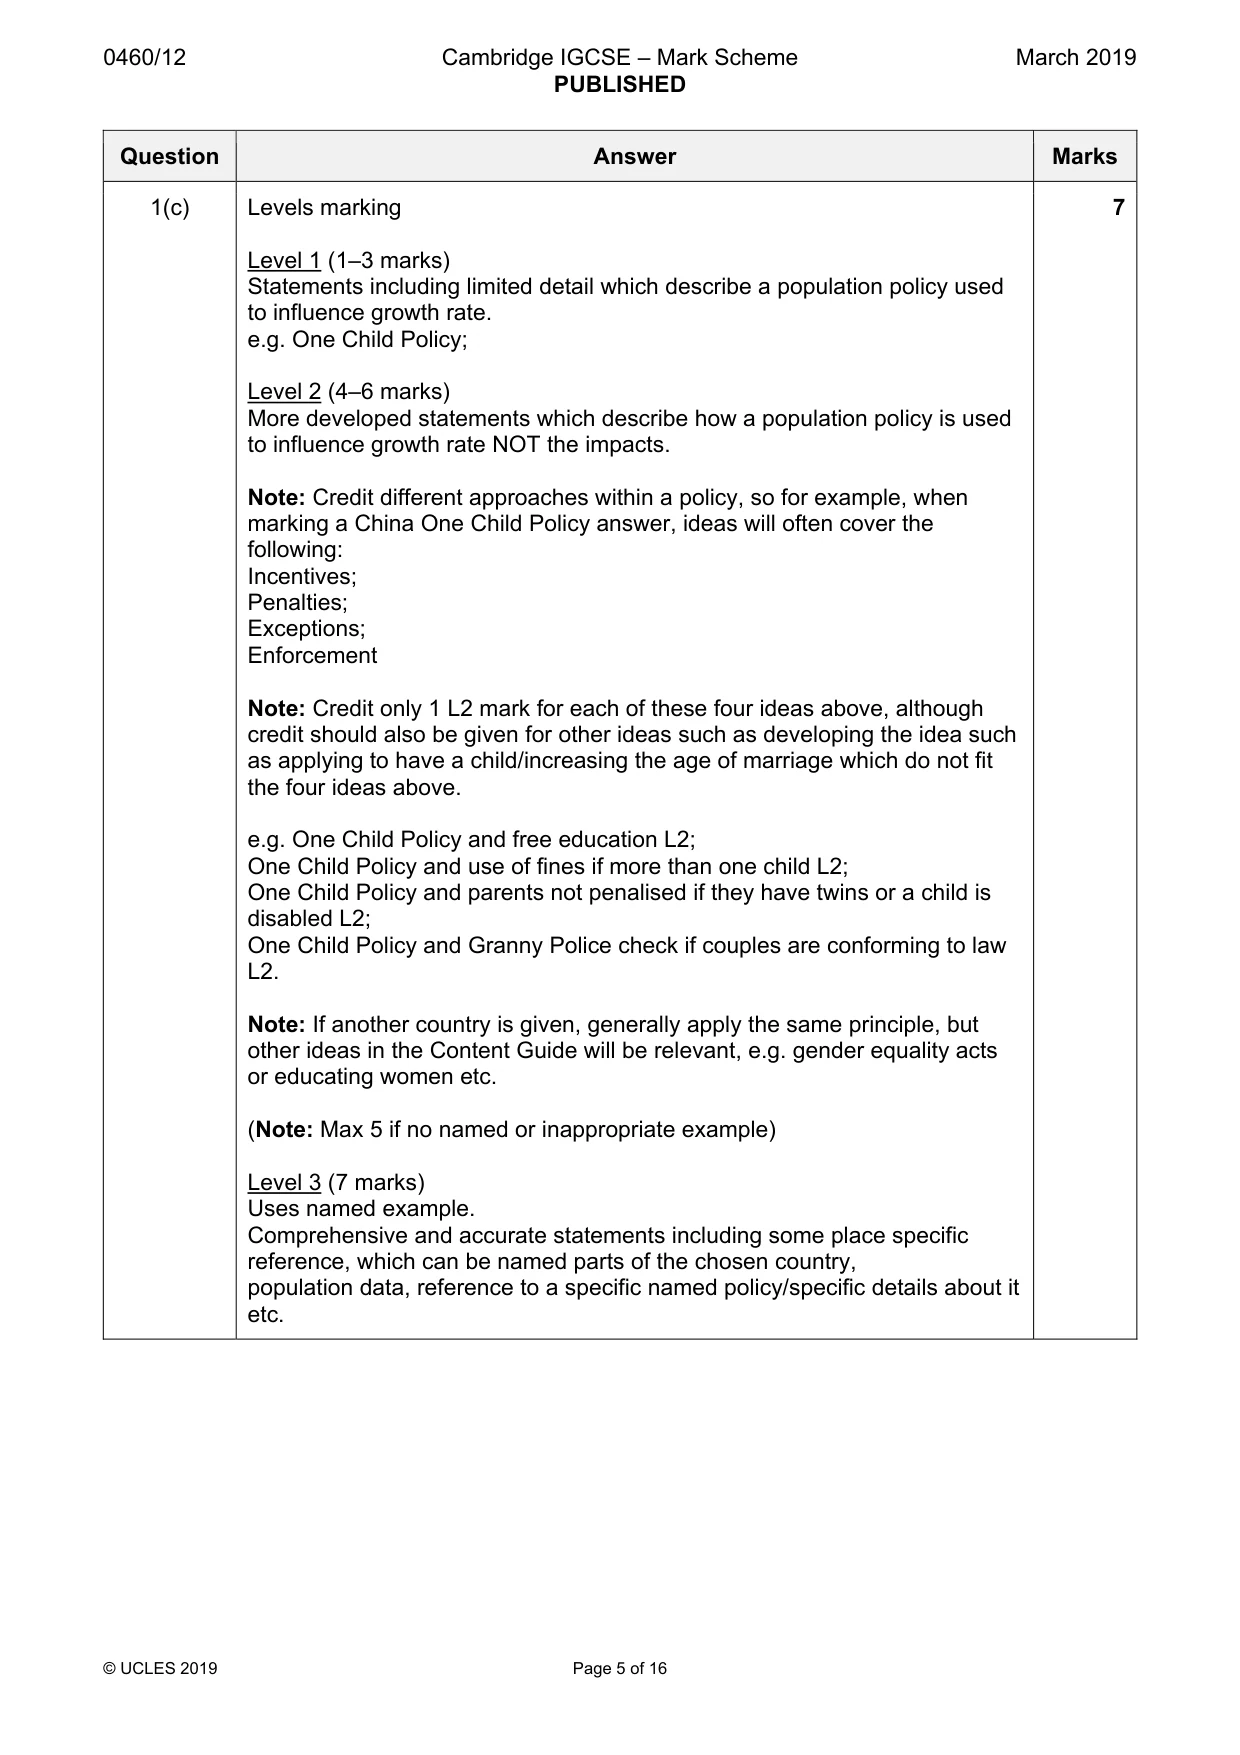
0460/12 Cambridge IGCSE – Mark Scheme PUBLISHED March 2019 © UCLES 2019 Page 5 of 16 Question Answer Marks 1(c) Levels marking Level 1 (1–3 marks) Statements including limited detail which describe a population policy used to influence growth rate. e.g. One Child Policy; Level 2 (4–6 marks) More developed statements which describe how a population policy is used to influence growth rate NOT the impacts. Note: Credit different approaches within a policy, so for example, when marking a China One Child Policy answer, ideas will often cover the following: Incentives; Penalties; Exceptions; Enforcement Note: Credit only 1 L2 mark for each of these four ideas above, although credit should also be given for other ideas such as developing the idea such as applying to have a child/increasing the age of marriage which do not fit the four ideas above. e.g. One Child Policy and free education L2; One Child Policy and use of fines if more than one child L2; One Child Policy and parents not penalised if they have twins or a child is disabled L2; One Child Policy and Granny Police check if couples are conforming to law L2. Note: If another country is given, generally apply the same principle, but other ideas in the Content Guide will be relevant, e.g. gender equality acts or educating women etc. (Note: Max 5 if no named or inappropriate example) Level 3 (7 marks) Uses named example. Comprehensive and accurate statements including some place specific reference, which can be named parts of the chosen country, population data, reference to a specific named policy/specific details about it etc. 7
Mark scheme, page 6
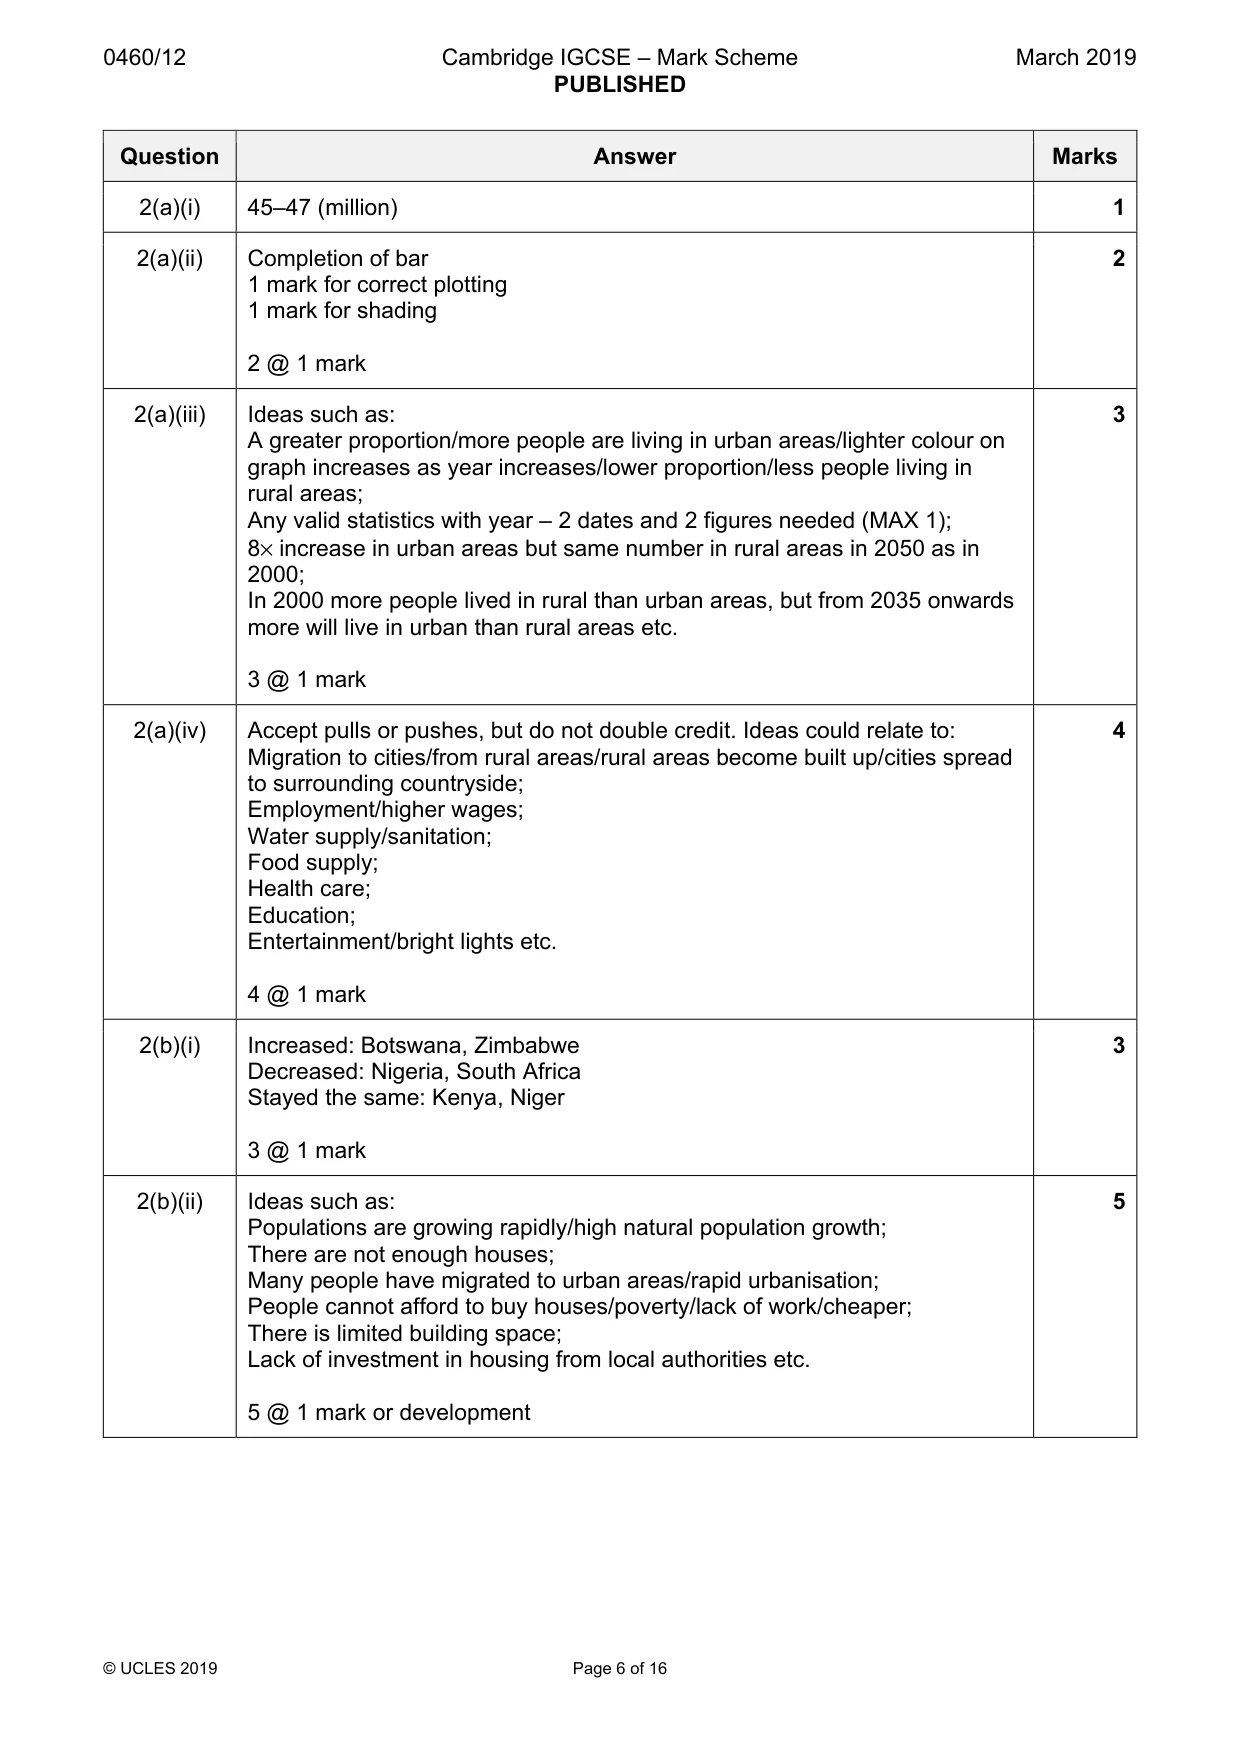
0460/12 Cambridge IGCSE – Mark Scheme PUBLISHED March 2019 © UCLES 2019 Page 6 of 16 Question Answer Marks 2(a)(i) 45–47 (million) 1 2(a)(ii) Completion of bar 1 mark for correct plotting 1 mark for shading 2 @ 1 mark 2 2(a)(iii) Ideas such as: A greater proportion/more people are living in urban areas/lighter colour on graph increases as year increases/lower proportion/less people living in rural areas; Any valid statistics with year – 2 dates and 2 figures needed (MAX 1); 8× increase in urban areas but same number in rural areas in 2050 as in 2000; In 2000 more people lived in rural than urban areas, but from 2035 onwards more will live in urban than rural areas etc. 3 @ 1 mark 3 2(a)(iv) Accept pulls or pushes, but do not double credit. Ideas could relate to: Migration to cities/from rural areas/rural areas become built up/cities spread to surrounding countryside; Employment/higher wages; Water supply/sanitation; Food supply; Health care; Education; Entertainment/bright lights etc. 4 @ 1 mark 4 2(b)(i) Increased: Botswana, Zimbabwe Decreased: Nigeria, South Africa Stayed the same: Kenya, Niger 3 @ 1 mark 3 2(b)(ii) Ideas such as: Populations are growing rapidly/high natural population growth; There are not enough houses; Many people have migrated to urban areas/rapid urbanisation; People cannot afford to buy houses/poverty/lack of work/cheaper; There is limited building space; Lack of investment in housing from local authorities etc. 5 @ 1 mark or development 5
Mark scheme, page 7
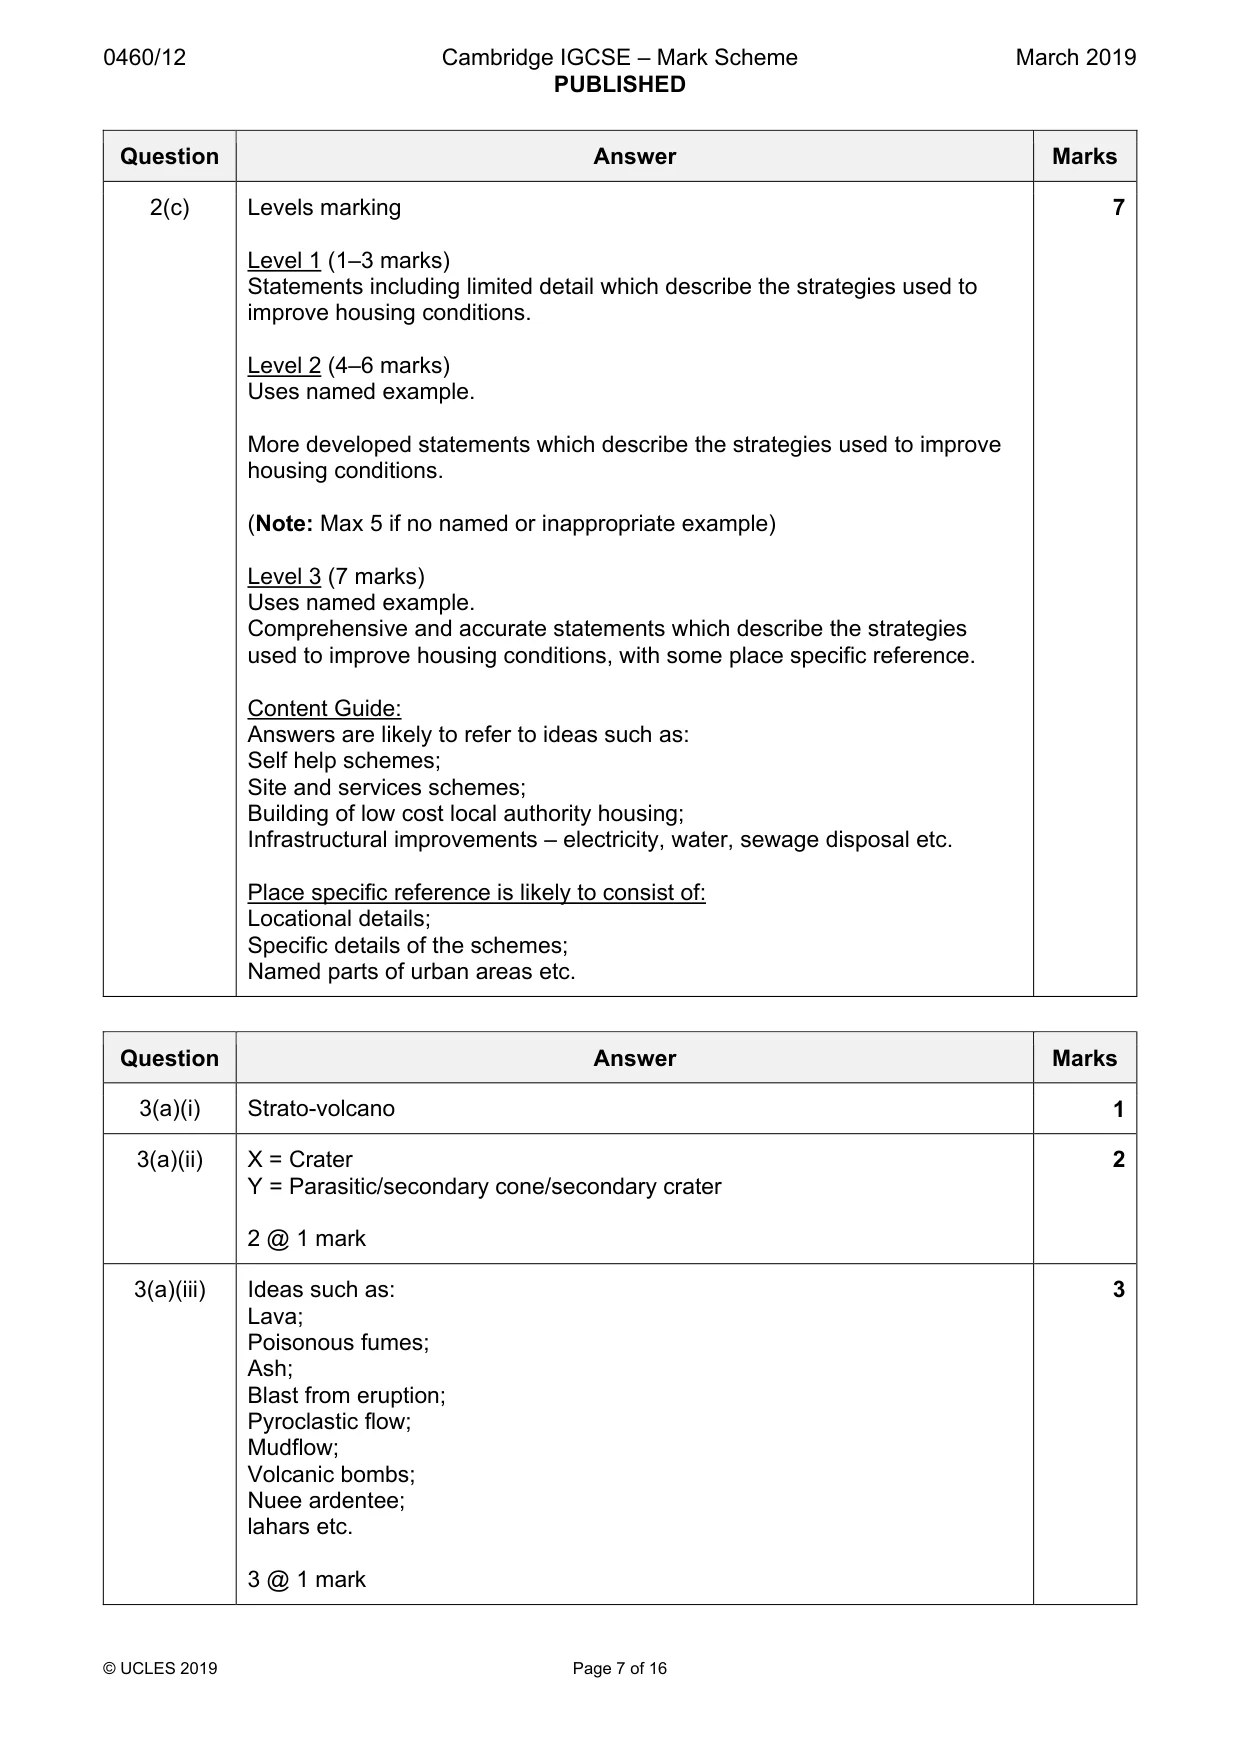
0460/12 Cambridge IGCSE – Mark Scheme PUBLISHED March 2019 © UCLES 2019 Page 7 of 16 Question Answer Marks 2(c) Levels marking Level 1 (1–3 marks) Statements including limited detail which describe the strategies used to improve housing conditions. Level 2 (4–6 marks) Uses named example. More developed statements which describe the strategies used to improve housing conditions. (Note: Max 5 if no named or inappropriate example) Level 3 (7 marks) Uses named example. Comprehensive and accurate statements which describe the strategies used to improve housing conditions, with some place specific reference. Content Guide: Answers are likely to refer to ideas such as: Self help schemes; Site and services schemes; Building of low cost local authority housing; Infrastructural improvements – electricity, water, sewage disposal etc. Place specific reference is likely to consist of: Locational details; Specific details of the schemes; Named parts of urban areas etc. 7 Question Answer Marks 3(a)(i) Strato-volcano 1 3(a)(ii) X = Crater Y = Parasitic/secondary cone/secondary crater 2 @ 1 mark 2 3(a)(iii) Ideas such as: Lava; Poisonous fumes; Ash; Blast from eruption; Pyroclastic flow; Mudflow; Volcanic bombs; Nuee ardentee; lahars etc. 3 @ 1 mark 3
Mark scheme, page 8
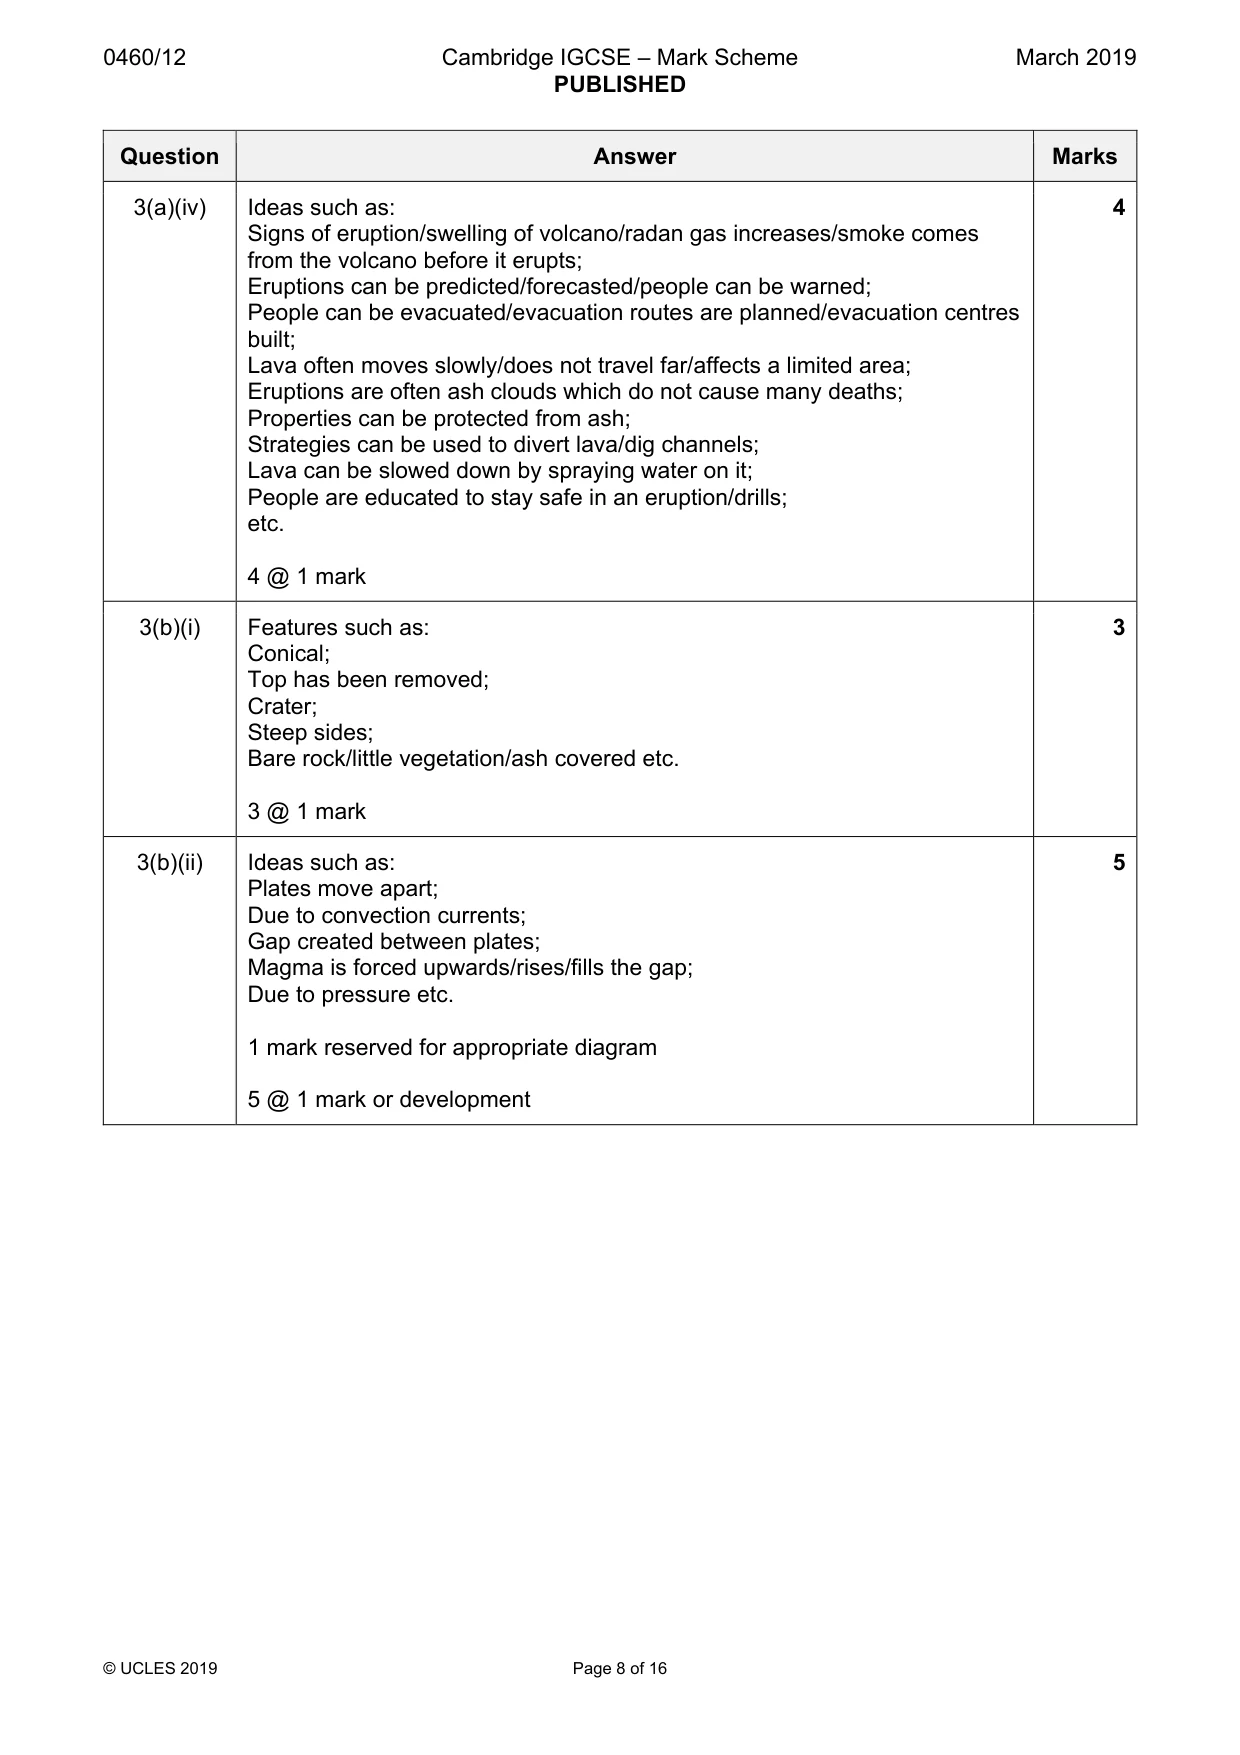
0460/12 Cambridge IGCSE – Mark Scheme PUBLISHED March 2019 © UCLES 2019 Page 8 of 16 Question Answer Marks 3(a)(iv) Ideas such as: Signs of eruption/swelling of volcano/radan gas increases/smoke comes from the volcano before it erupts; Eruptions can be predicted/forecasted/people can be warned; People can be evacuated/evacuation routes are planned/evacuation centres built; Lava often moves slowly/does not travel far/affects a limited area; Eruptions are often ash clouds which do not cause many deaths; Properties can be protected from ash; Strategies can be used to divert lava/dig channels; Lava can be slowed down by spraying water on it; People are educated to stay safe in an eruption/drills; etc. 4 @ 1 mark 4 3(b)(i) Features such as: Conical; Top has been removed; Crater; Steep sides; Bare rock/little vegetation/ash covered etc. 3 @ 1 mark 3 3(b)(ii) Ideas such as: Plates move apart; Due to convection currents; Gap created between plates; Magma is forced upwards/rises/fills the gap; Due to pressure etc. 1 mark reserved for appropriate diagram 5 @ 1 mark or development 5
Mark scheme, page 9
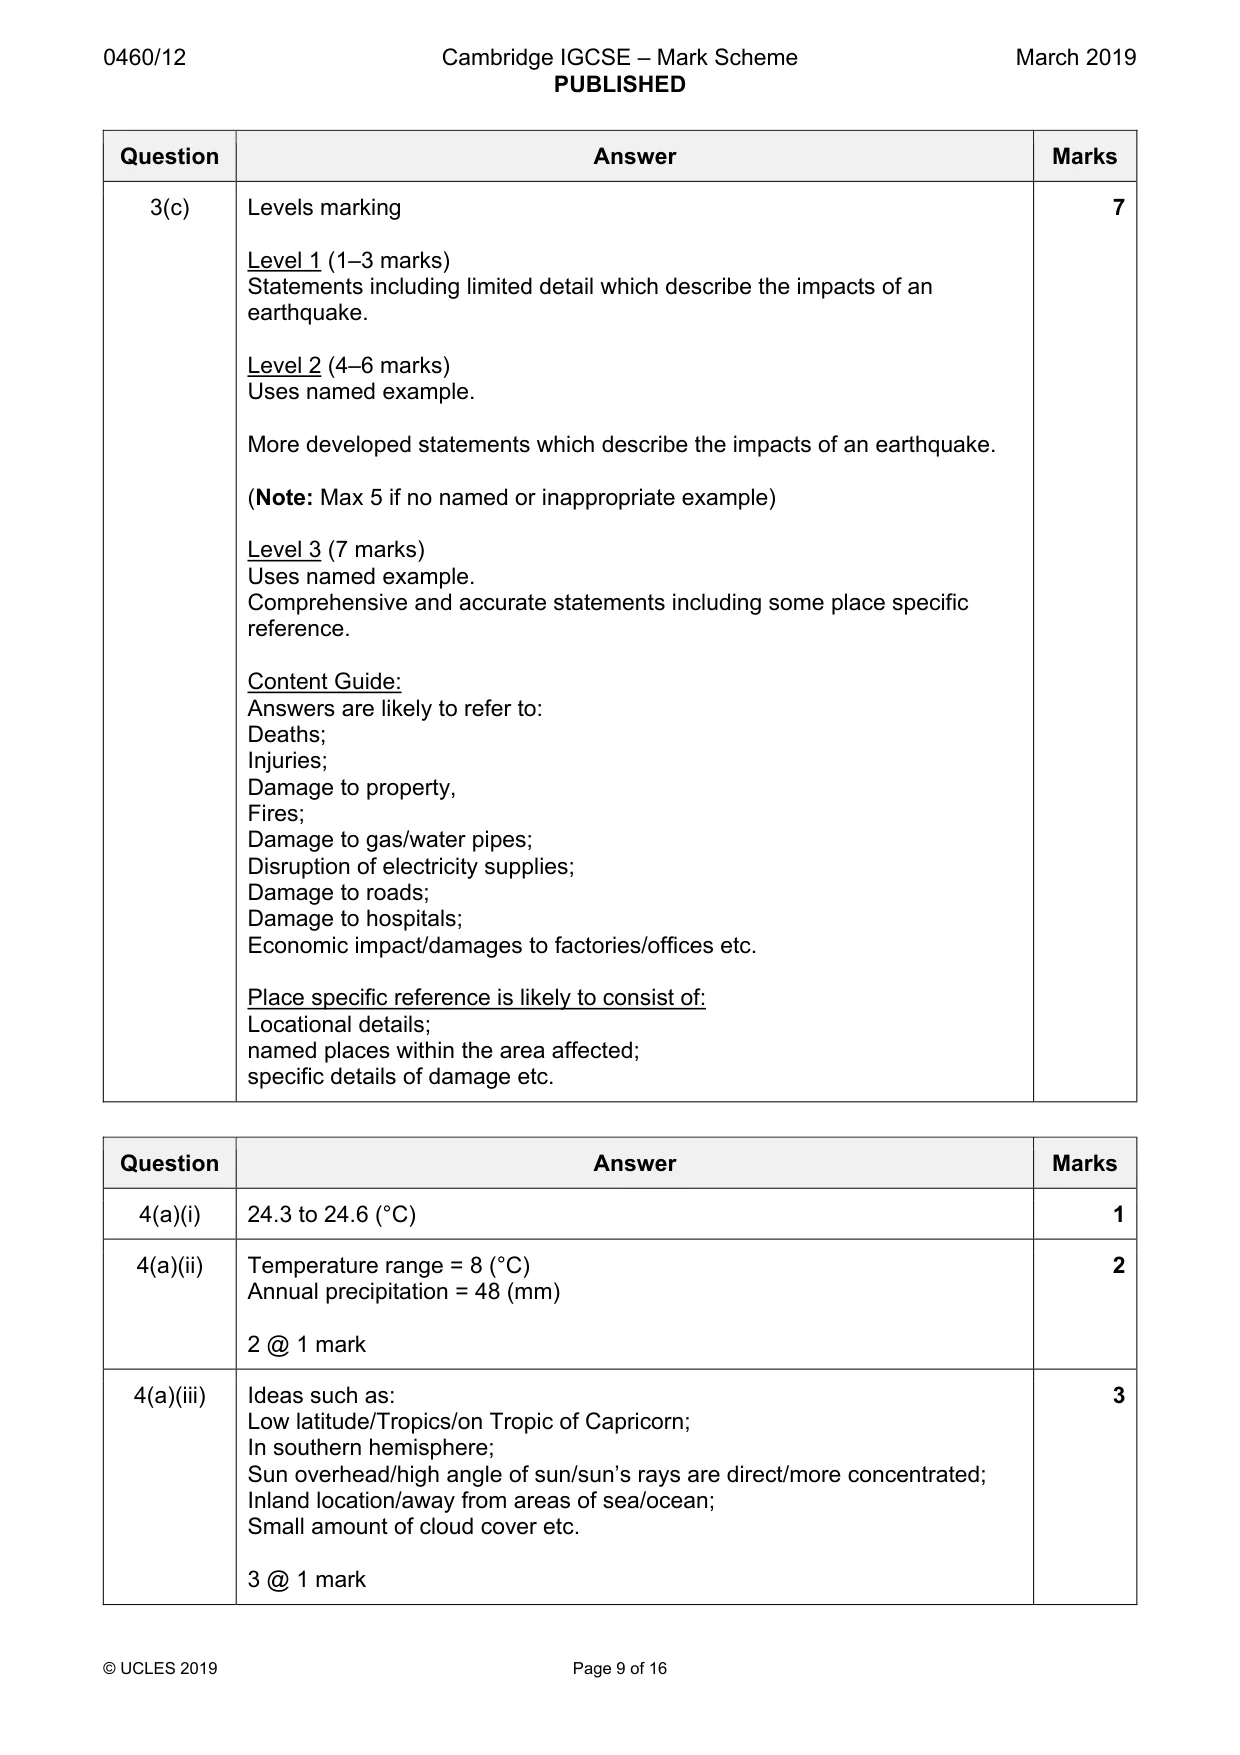
0460/12 Cambridge IGCSE – Mark Scheme PUBLISHED March 2019 © UCLES 2019 Page 9 of 16 Question Answer Marks 3(c) Levels marking Level 1 (1–3 marks) Statements including limited detail which describe the impacts of an earthquake. Level 2 (4–6 marks) Uses named example. More developed statements which describe the impacts of an earthquake. (Note: Max 5 if no named or inappropriate example) Level 3 (7 marks) Uses named example. Comprehensive and accurate statements including some place specific reference. Content Guide: Answers are likely to refer to: Deaths; Injuries; Damage to property, Fires; Damage to gas/water pipes; Disruption of electricity supplies; Damage to roads; Damage to hospitals; Economic impact/damages to factories/offices etc. Place specific reference is likely to consist of: Locational details; named places within the area affected; specific details of damage etc. 7 Question Answer Marks 4(a)(i) 24.3 to 24.6 (°C) 1 4(a)(ii) Temperature range = 8 (°C) Annual precipitation = 48 (mm) 2 @ 1 mark 2 4(a)(iii) Ideas such as: Low latitude/Tropics/on Tropic of Capricorn; In southern hemisphere; Sun overhead/high angle of sun/sun’s rays are direct/more concentrated; Inland location/away from areas of sea/ocean; Small amount of cloud cover etc. 3 @ 1 mark 3
Mark scheme, page 10
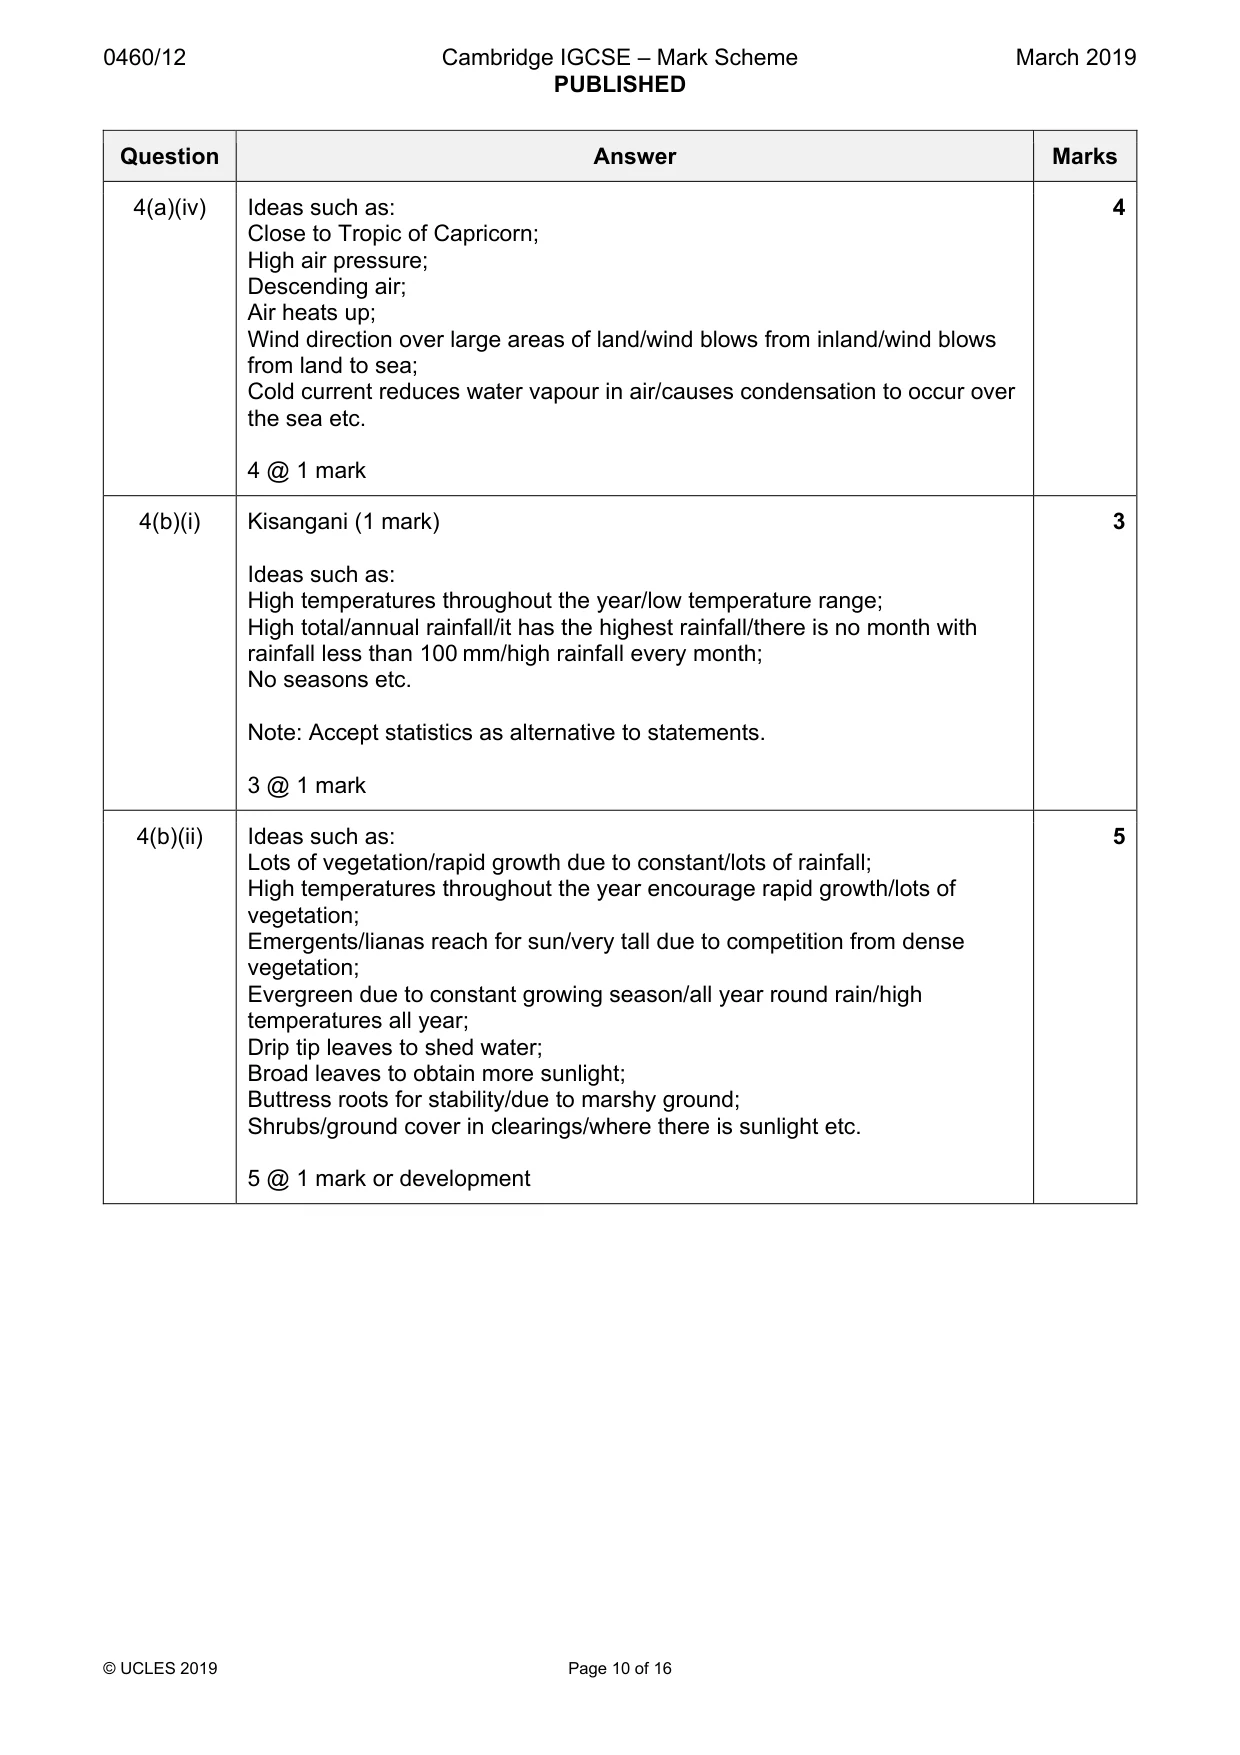
0460/12 Cambridge IGCSE – Mark Scheme PUBLISHED March 2019 © UCLES 2019 Page 10 of 16 Question Answer Marks 4(a)(iv) Ideas such as: Close to Tropic of Capricorn; High air pressure; Descending air; Air heats up; Wind direction over large areas of land/wind blows from inland/wind blows from land to sea; Cold current reduces water vapour in air/causes condensation to occur over the sea etc. 4 @ 1 mark 4 4(b)(i) Kisangani (1 mark) Ideas such as: High temperatures throughout the year/low temperature range; High total/annual rainfall/it has the highest rainfall/there is no month with rainfall less than 100 mm/high rainfall every month; No seasons etc. Note: Accept statistics as alternative to statements. 3 @ 1 mark 3 4(b)(ii) Ideas such as: Lots of vegetation/rapid growth due to constant/lots of rainfall; High temperatures throughout the year encourage rapid growth/lots of vegetation; Emergents/lianas reach for sun/very tall due to competition from dense vegetation; Evergreen due to constant growing season/all year round rain/high temperatures all year; Drip tip leaves to shed water; Broad leaves to obtain more sunlight; Buttress roots for stability/due to marshy ground; Shrubs/ground cover in clearings/where there is sunlight etc. 5 @ 1 mark or development 5
Mark scheme, page 11
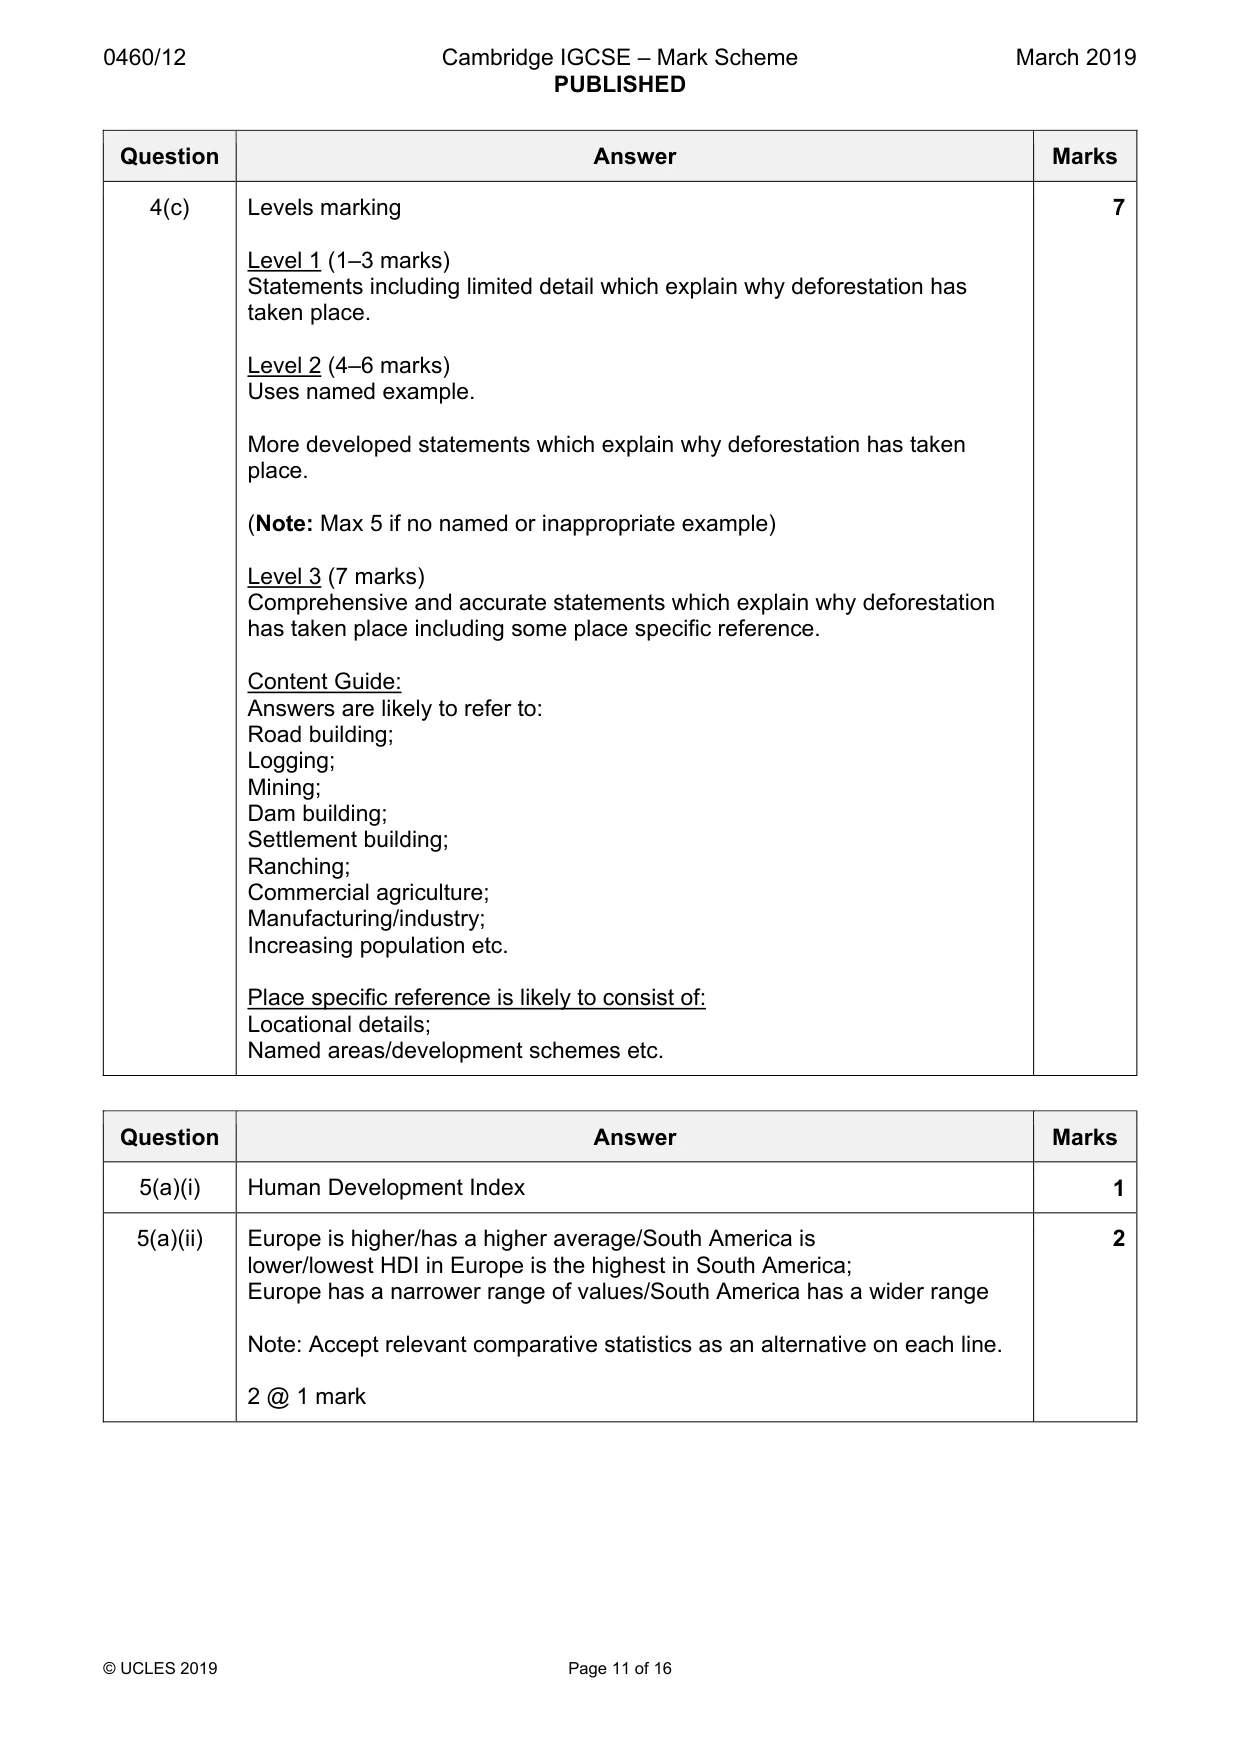
0460/12 Cambridge IGCSE – Mark Scheme PUBLISHED March 2019 © UCLES 2019 Page 11 of 16 Question Answer Marks 4(c) Levels marking Level 1 (1–3 marks) Statements including limited detail which explain why deforestation has taken place. Level 2 (4–6 marks) Uses named example. More developed statements which explain why deforestation has taken place. (Note: Max 5 if no named or inappropriate example) Level 3 (7 marks) Comprehensive and accurate statements which explain why deforestation has taken place including some place specific reference. Content Guide: Answers are likely to refer to: Road building; Logging; Mining; Dam building; Settlement building; Ranching; Commercial agriculture; Manufacturing/industry; Increasing population etc. Place specific reference is likely to consist of: Locational details; Named areas/development schemes etc. 7 Question Answer Marks 5(a)(i) Human Development Index 1 5(a)(ii) Europe is higher/has a higher average/South America is lower/lowest HDI in Europe is the highest in South America; Europe has a narrower range of values/South America has a wider range Note: Accept relevant comparative statistics as an alternative on each line. 2 @ 1 mark 2
Mark scheme, page 12
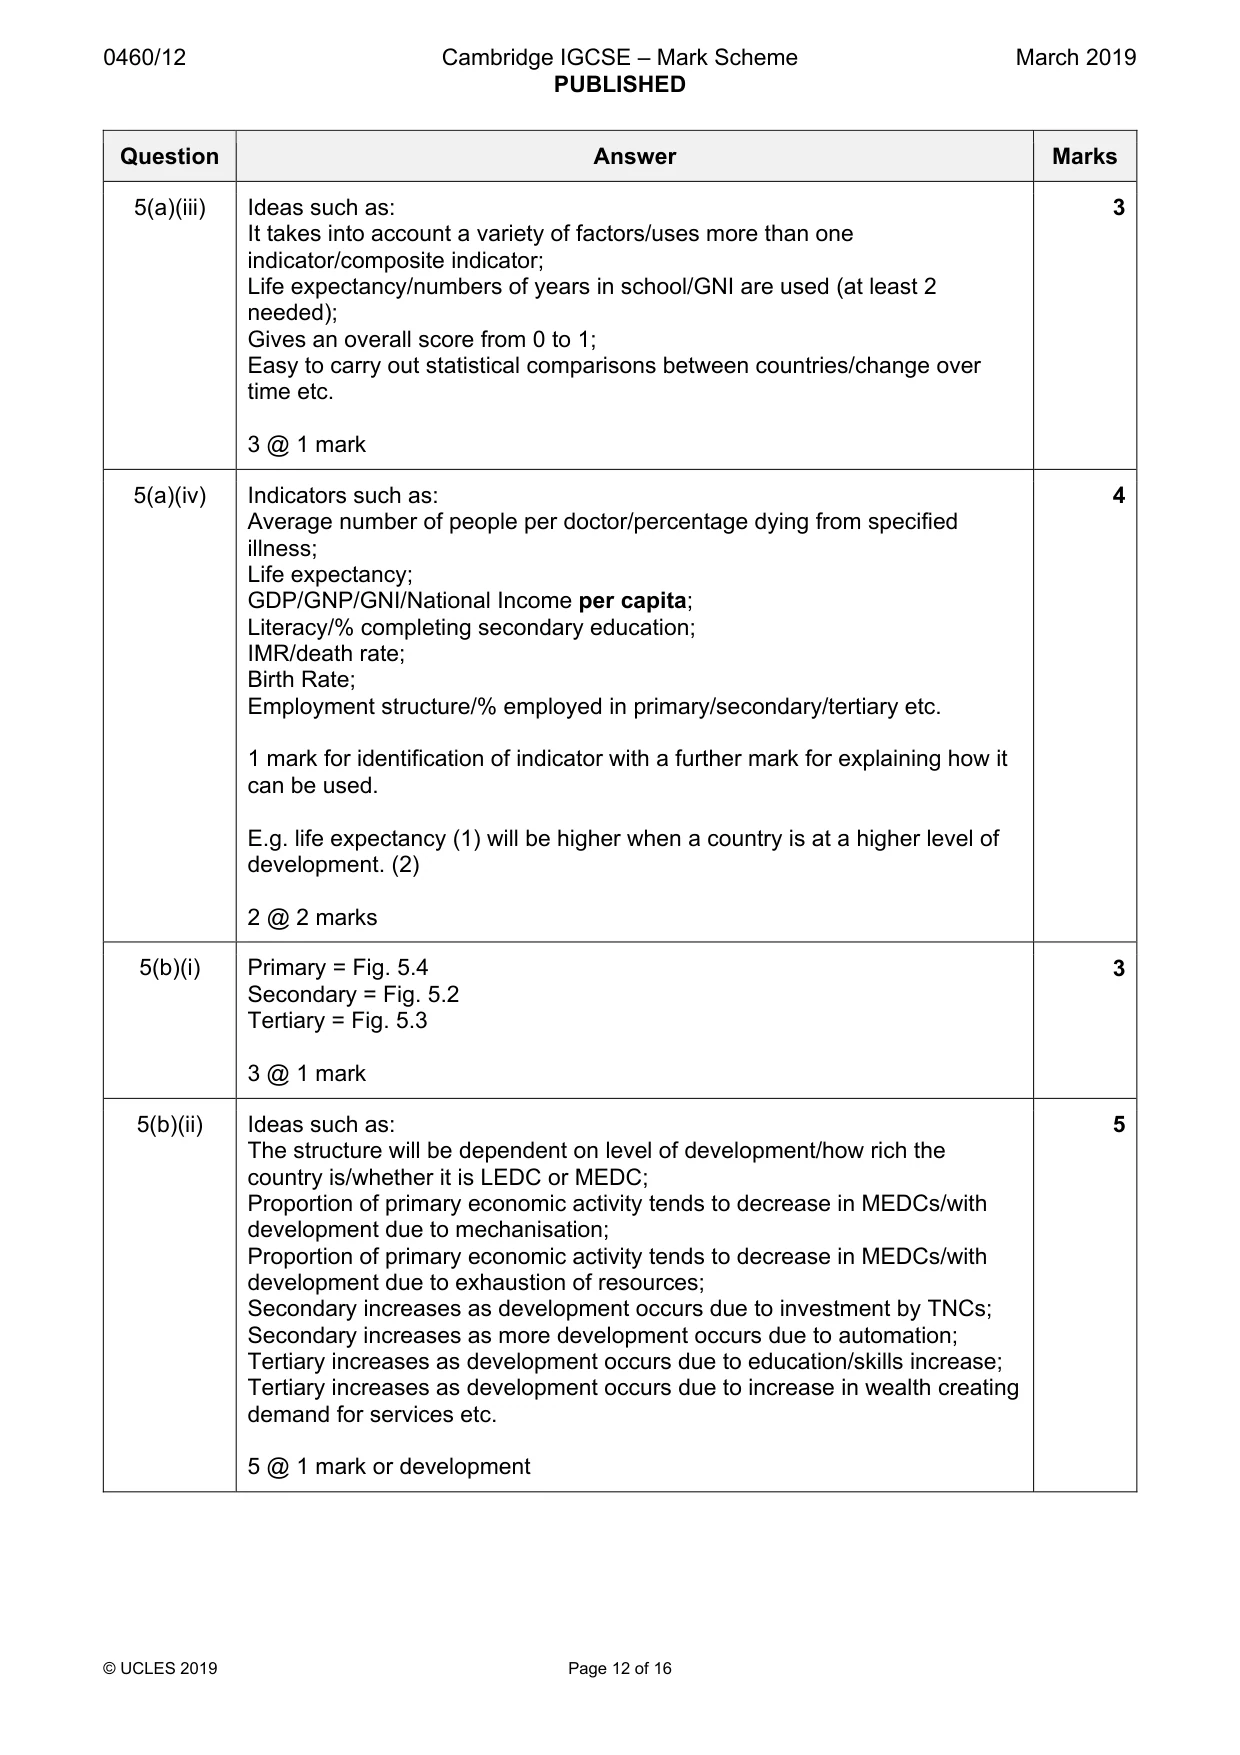
0460/12 Cambridge IGCSE – Mark Scheme PUBLISHED March 2019 © UCLES 2019 Page 12 of 16 Question Answer Marks 5(a)(iii) Ideas such as: It takes into account a variety of factors/uses more than one indicator/composite indicator; Life expectancy/numbers of years in school/GNI are used (at least 2 needed); Gives an overall score from 0 to 1; Easy to carry out statistical comparisons between countries/change over time etc. 3 @ 1 mark 3 5(a)(iv) Indicators such as: Average number of people per doctor/percentage dying from specified illness; Life expectancy; GDP/GNP/GNI/National Income per capita; Literacy/% completing secondary education; IMR/death rate; Birth Rate; Employment structure/% employed in primary/secondary/tertiary etc. 1 mark for identification of indicator with a further mark for explaining how it can be used. E.g. life expectancy (1) will be higher when a country is at a higher level of development. (2) 2 @ 2 marks 4 5(b)(i) Primary = Fig. 5.4 Secondary = Fig. 5.2 Tertiary = Fig. 5.3 3 @ 1 mark 3 5(b)(ii) Ideas such as: The structure will be dependent on level of development/how rich the country is/whether it is LEDC or MEDC; Proportion of primary economic activity tends to decrease in MEDCs/with development due to mechanisation; Proportion of primary economic activity tends to decrease in MEDCs/with development due to exhaustion of resources; Secondary increases as development occurs due to investment by TNCs; Secondary increases as more development occurs due to automation; Tertiary increases as development occurs due to education/skills increase; Tertiary increases as development occurs due to increase in wealth creating demand for services etc. 5 @ 1 mark or development 5
Mark scheme, page 13
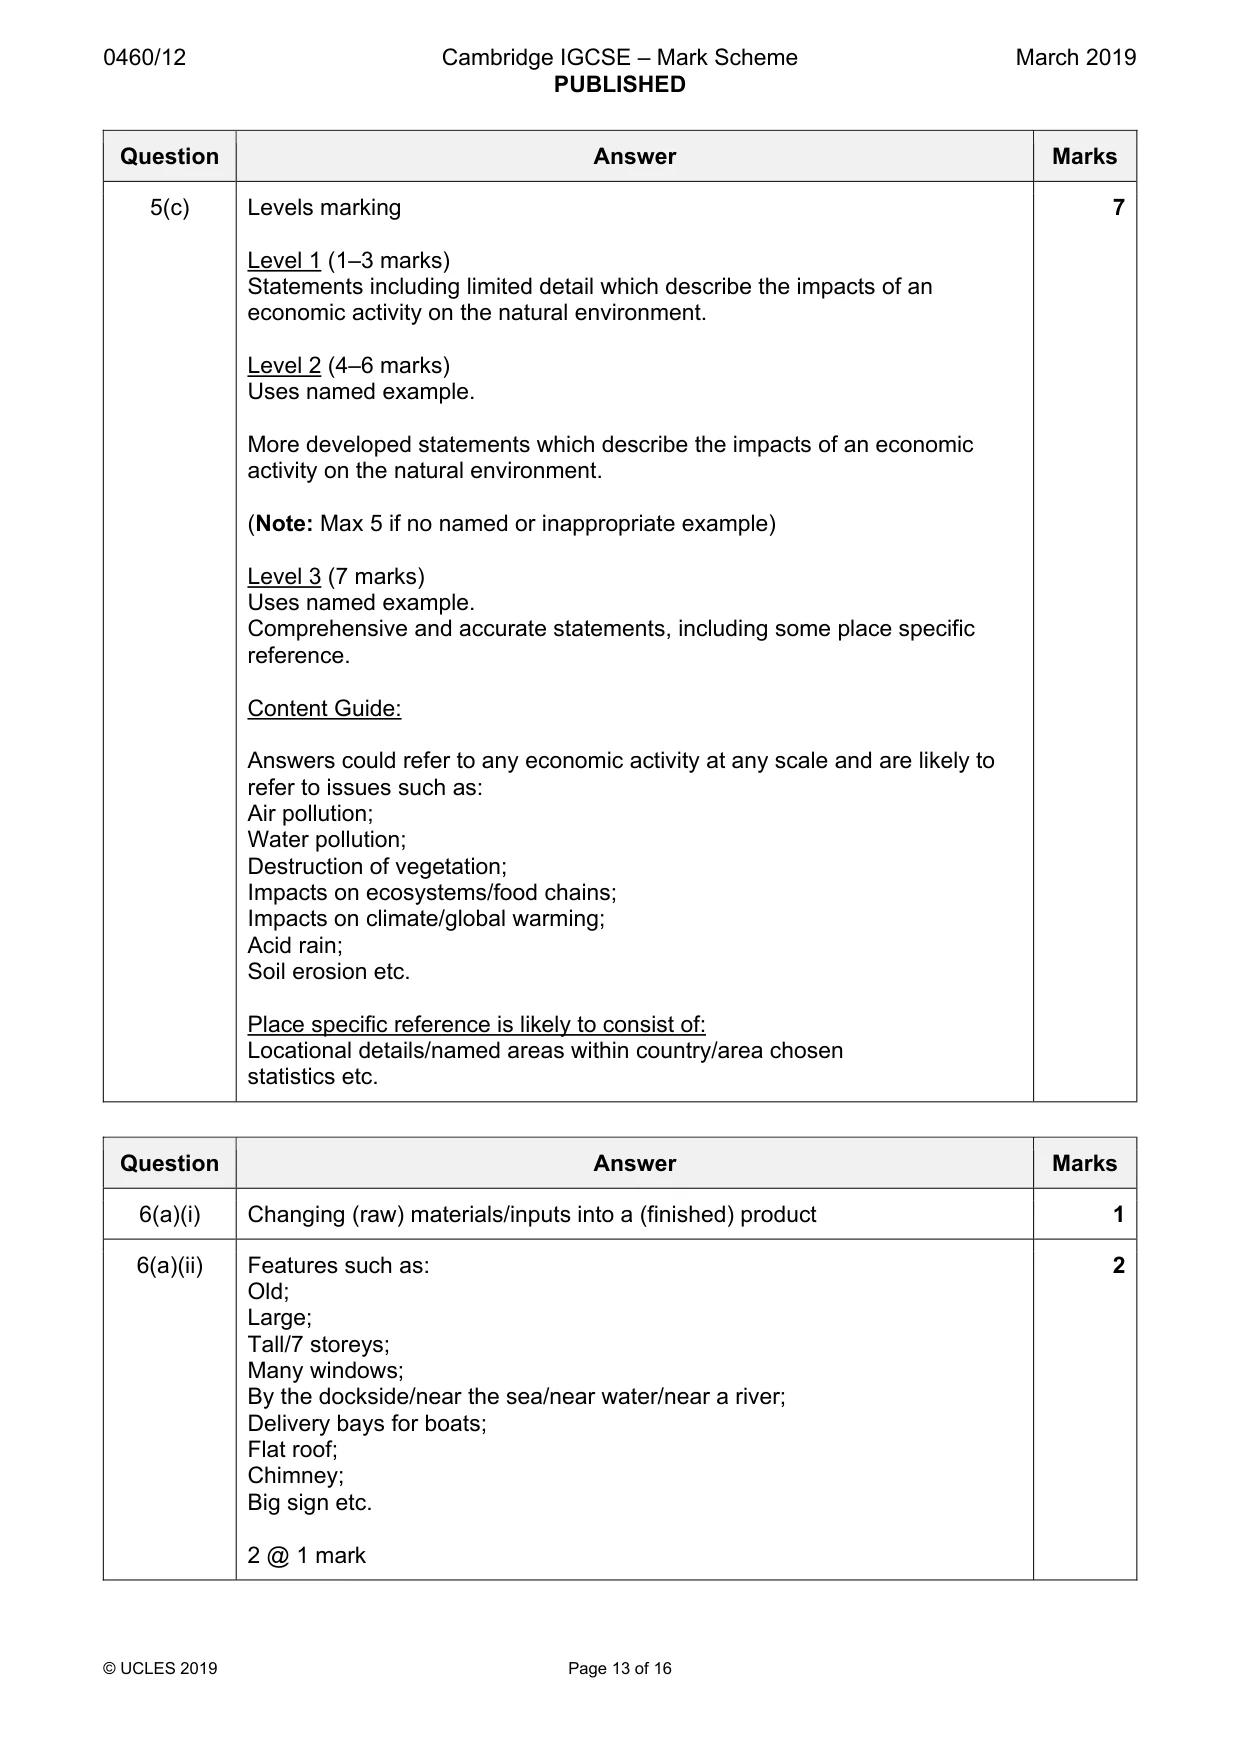
0460/12 Cambridge IGCSE – Mark Scheme PUBLISHED March 2019 © UCLES 2019 Page 13 of 16 Question Answer Marks 5(c) Levels marking Level 1 (1–3 marks) Statements including limited detail which describe the impacts of an economic activity on the natural environment. Level 2 (4–6 marks) Uses named example. More developed statements which describe the impacts of an economic activity on the natural environment. (Note: Max 5 if no named or inappropriate example) Level 3 (7 marks) Uses named example. Comprehensive and accurate statements, including some place specific reference. Content Guide: Answers could refer to any economic activity at any scale and are likely to refer to issues such as: Air pollution; Water pollution; Destruction of vegetation; Impacts on ecosystems/food chains; Impacts on climate/global warming; Acid rain; Soil erosion etc. Place specific reference is likely to consist of: Locational details/named areas within country/area chosen statistics etc. 7 Question Answer Marks 6(a)(i) Changing (raw) materials/inputs into a (finished) product 1 6(a)(ii) Features such as: Old; Large; Tall/7 storeys; Many windows; By the dockside/near the sea/near water/near a river; Delivery bays for boats; Flat roof; Chimney; Big sign etc. 2 @ 1 mark 2
Mark scheme, page 14
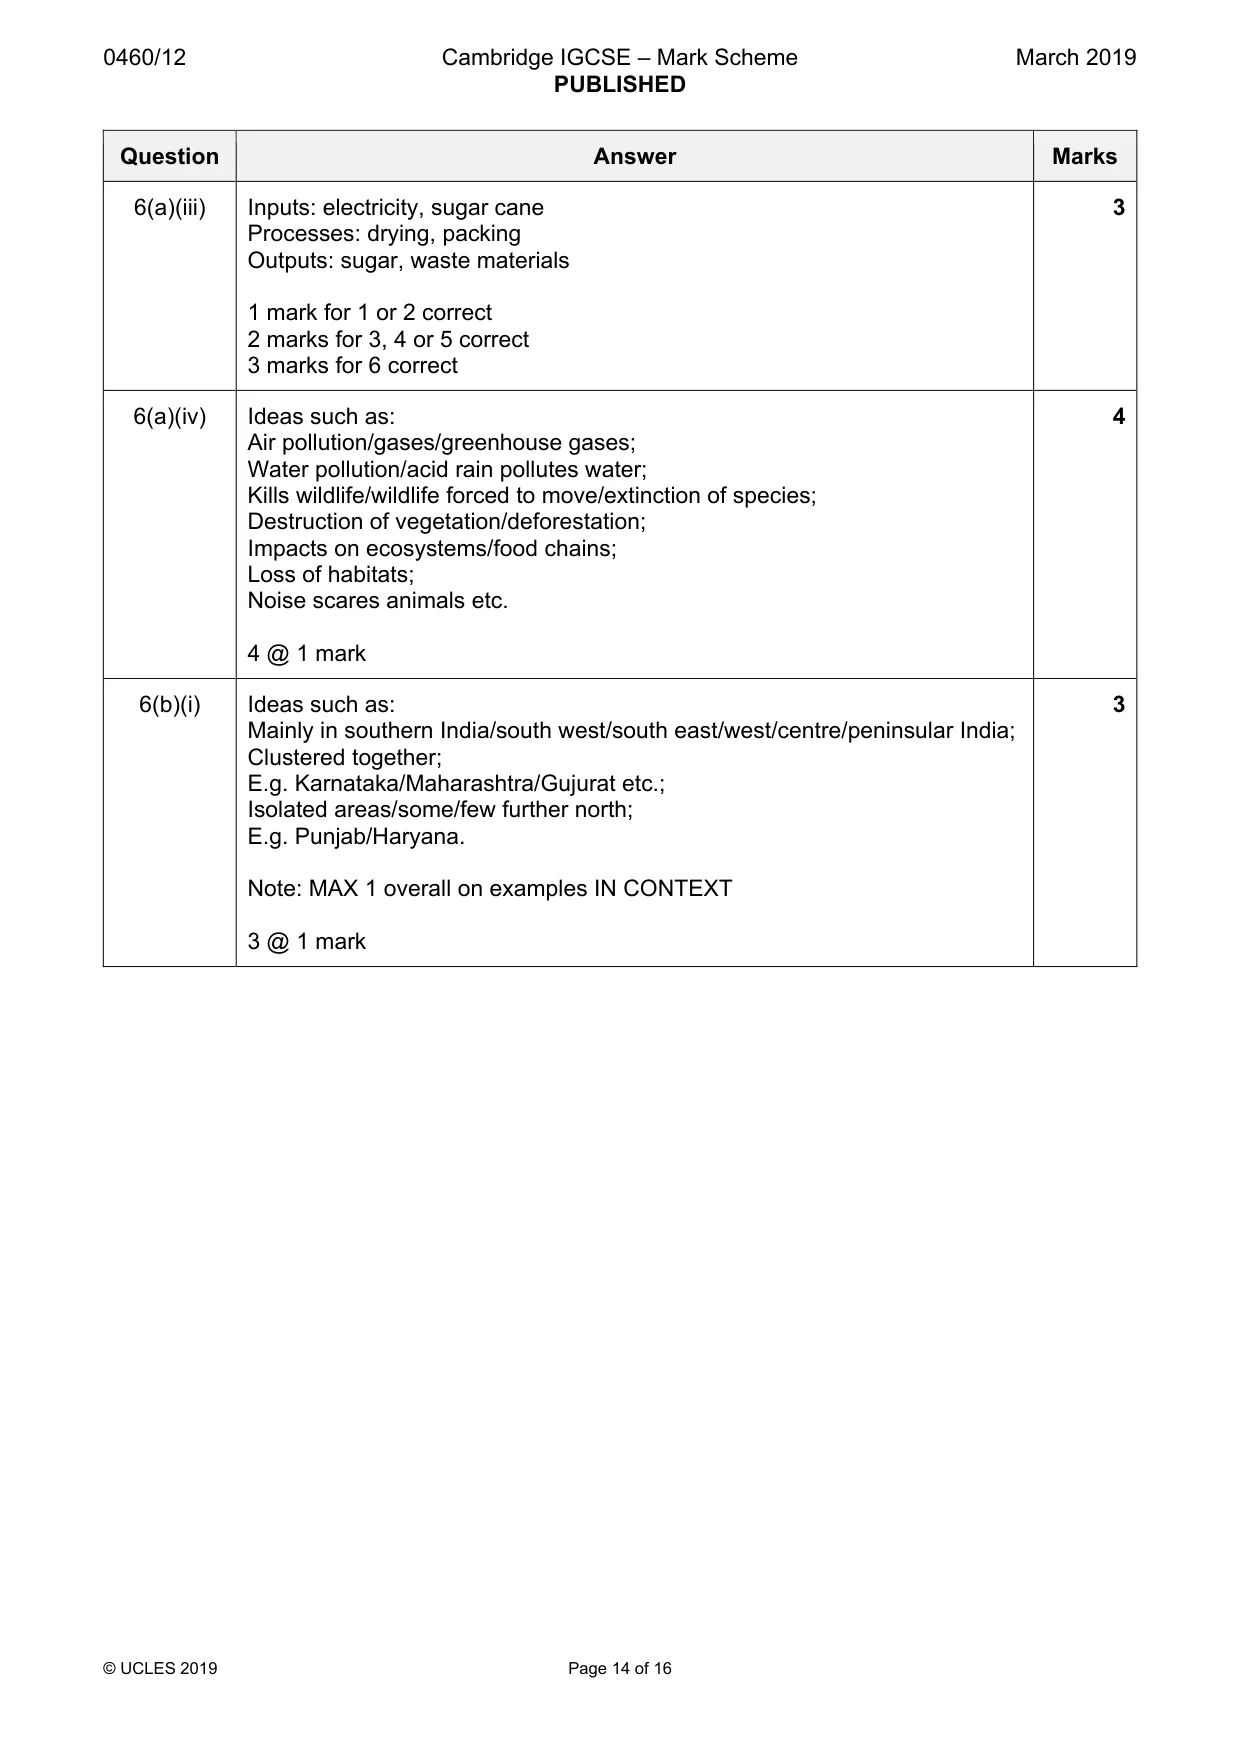
0460/12 Cambridge IGCSE – Mark Scheme PUBLISHED March 2019 © UCLES 2019 Page 14 of 16 Question Answer Marks 6(a)(iii) Inputs: electricity, sugar cane Processes: drying, packing Outputs: sugar, waste materials 1 mark for 1 or 2 correct 2 marks for 3, 4 or 5 correct 3 marks for 6 correct 3 6(a)(iv) Ideas such as: Air pollution/gases/greenhouse gases; Water pollution/acid rain pollutes water; Kills wildlife/wildlife forced to move/extinction of species; Destruction of vegetation/deforestation; Impacts on ecosystems/food chains; Loss of habitats; Noise scares animals etc. 4 @ 1 mark 4 6(b)(i) Ideas such as: Mainly in southern India/south west/south east/west/centre/peninsular India; Clustered together; E.g. Karnataka/Maharashtra/Gujurat etc.; Isolated areas/some/few further north; E.g. Punjab/Haryana. Note: MAX 1 overall on examples IN CONTEXT 3 @ 1 mark 3
Mark scheme, page 15
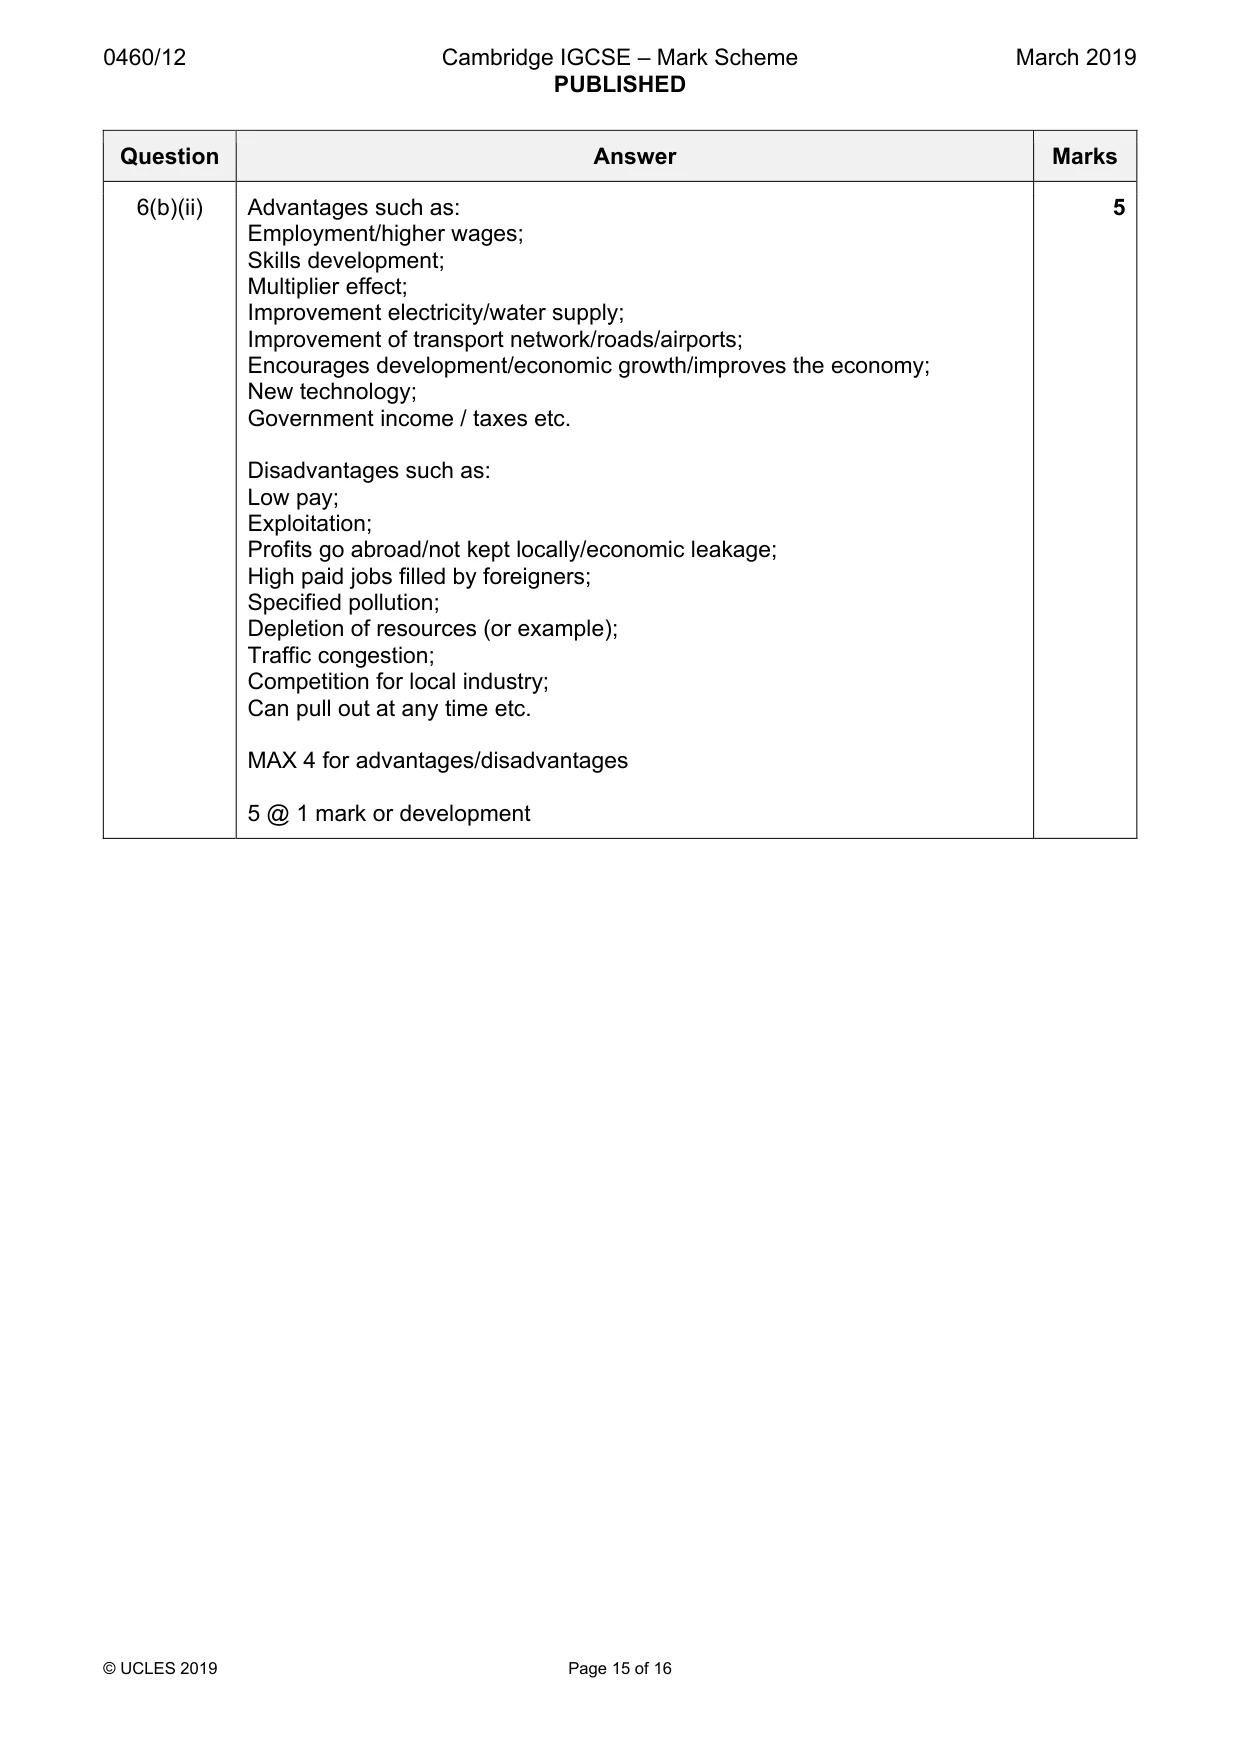
0460/12 Cambridge IGCSE – Mark Scheme PUBLISHED March 2019 © UCLES 2019 Page 15 of 16 Question Answer Marks 6(b)(ii) Advantages such as: Employment/higher wages; Skills development; Multiplier effect; Improvement electricity/water supply; Improvement of transport network/roads/airports; Encourages development/economic growth/improves the economy; New technology; Government income / taxes etc. Disadvantages such as: Low pay; Exploitation; Profits go abroad/not kept locally/economic leakage; High paid jobs filled by foreigners; Specified pollution; Depletion of resources (or example); Traffic congestion; Competition for local industry; Can pull out at any time etc. MAX 4 for advantages/disadvantages 5 @ 1 mark or development 5
Mark scheme, page 16
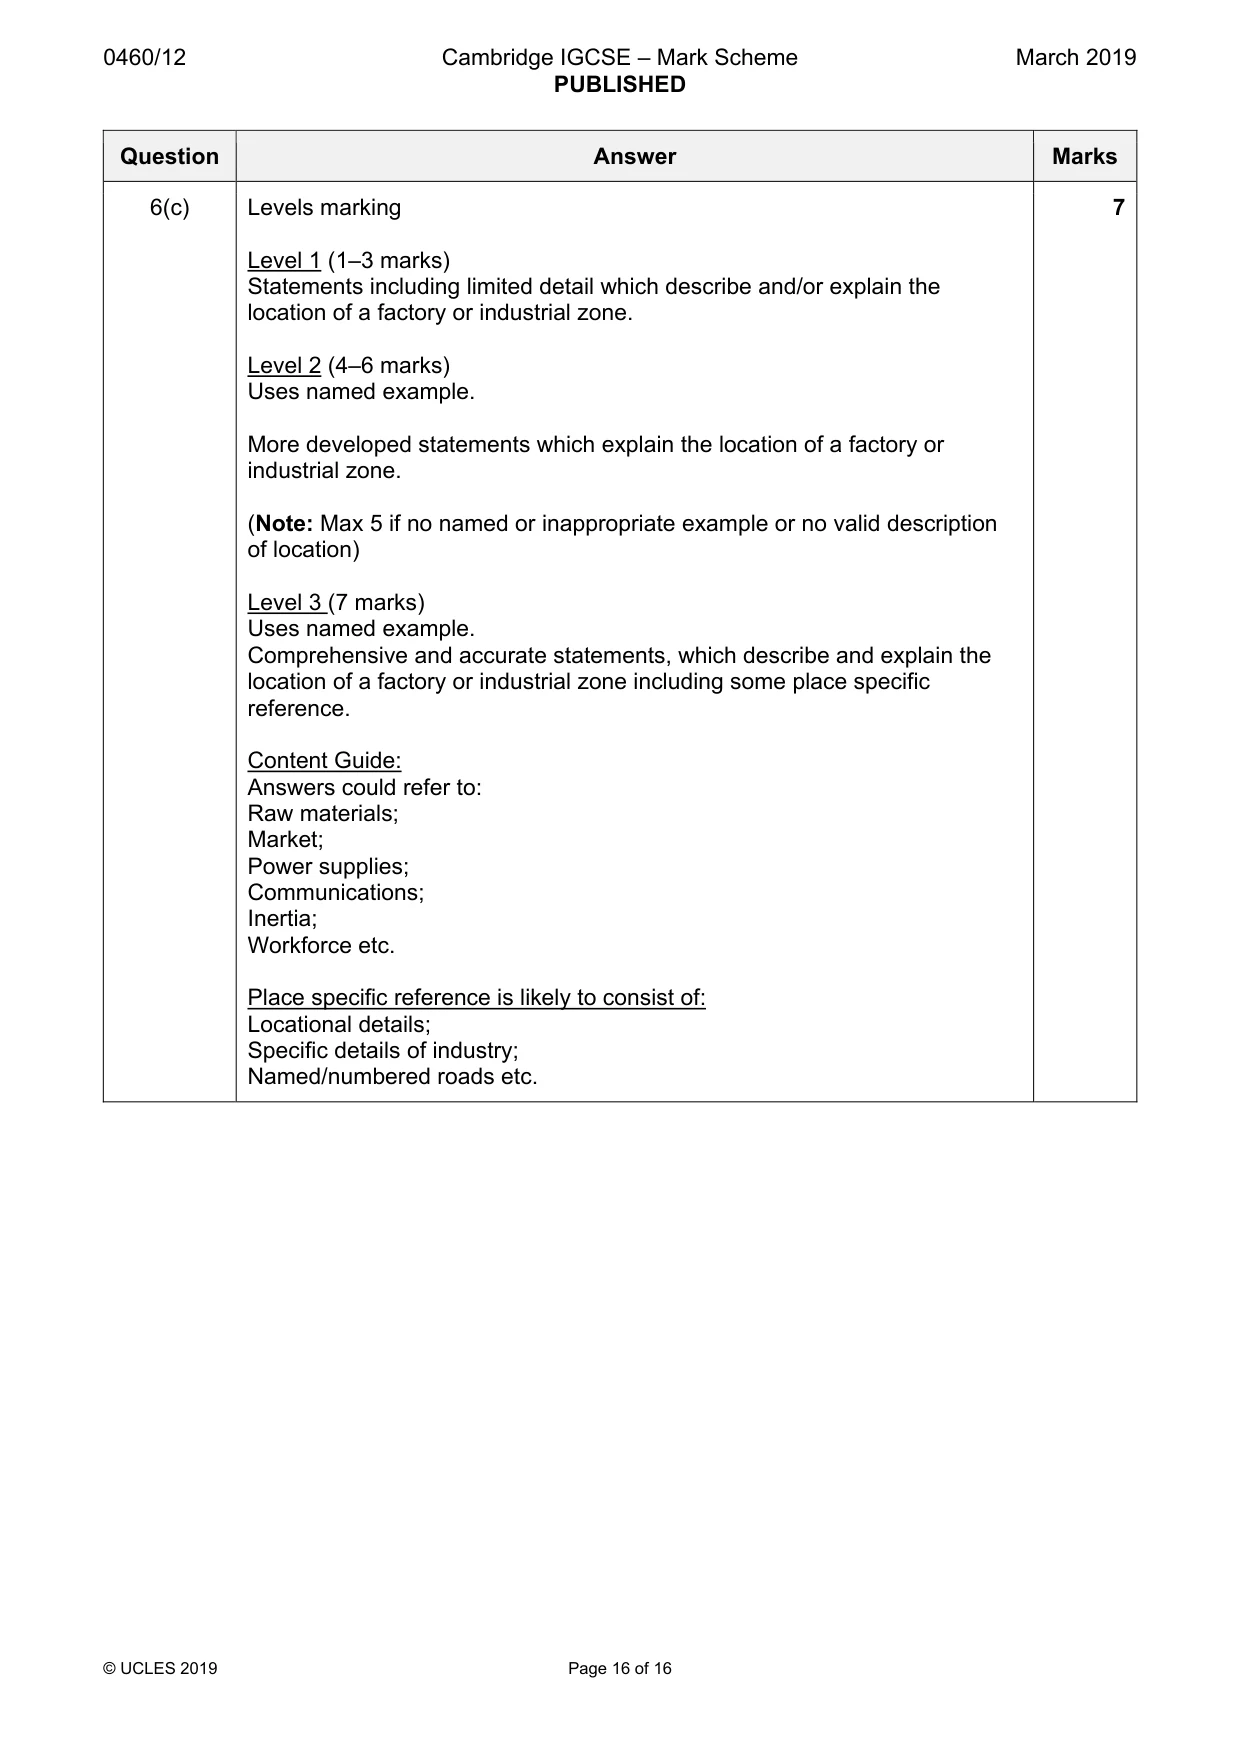
0460/12 Cambridge IGCSE – Mark Scheme PUBLISHED March 2019 © UCLES 2019 Page 16 of 16 Question Answer Marks 6(c) Levels marking Level 1 (1–3 marks) Statements including limited detail which describe and/or explain the location of a factory or industrial zone. Level 2 (4–6 marks) Uses named example. More developed statements which explain the location of a factory or industrial zone. (Note: Max 5 if no named or inappropriate example or no valid description of location) Level 3 (7 marks) Uses named example. Comprehensive and accurate statements, which describe and explain the location of a factory or industrial zone including some place specific reference. Content Guide: Answers could refer to: Raw materials; Market; Power supplies; Communications; Inertia; Workforce etc. Place specific reference is likely to consist of: Locational details; Specific details of industry; Named/numbered roads etc. 7
What you needed in this session
Cambridge’s own grade thresholds for 2019 Feb/March, Paper 1 · Variant 2. A higher threshold means an easier paper — the bar moves with how the cohort did.