Cambridge IGCSE Environmental Management 0680 — 2020 Oct/Nov Paper 1 · Variant 3
0680/13/O/N/20 · 80 marks · ≈90 min
The question paper and its mark scheme, free to read here and free to download. This is Cambridge’s own paper, exactly as it was sat.
Question paper16 pages


Mark scheme14 pages
Answers below. Sit the paper first if you are practising.
Paper as text
Question paper, page 1
Cambridge IGCSE™ This document has 16 pages. Blank pages are indicated. DC (DH/SW) 192727/4 © UCLES 2020 [Turn over * 5 3 1 5 8 0 1 5 5 5 * ENVIRONMENTAL MANAGEMENT 0680/13 Paper 1 Theory October/November 2020 1 hour 45 minutes You must answer on the question paper. No additional materials are needed. INSTRUCTIONS ● Answer all questions. ● Use a black or dark blue pen. You may use an HB pencil for any diagrams or graphs. ● Write your name, centre number and candidate number in the boxes at the top of the page. ● Write your answer to each question in the space provided. ● Do not use an erasable pen or correction fluid. ● Do not write on any bar codes. ● You may use a calculator. ● You should show all your working and use appropriate units. INFORMATION ● The total mark for this paper is 80. ● The number of marks for each question or part question is shown in brackets [ ].
Question paper, page 2
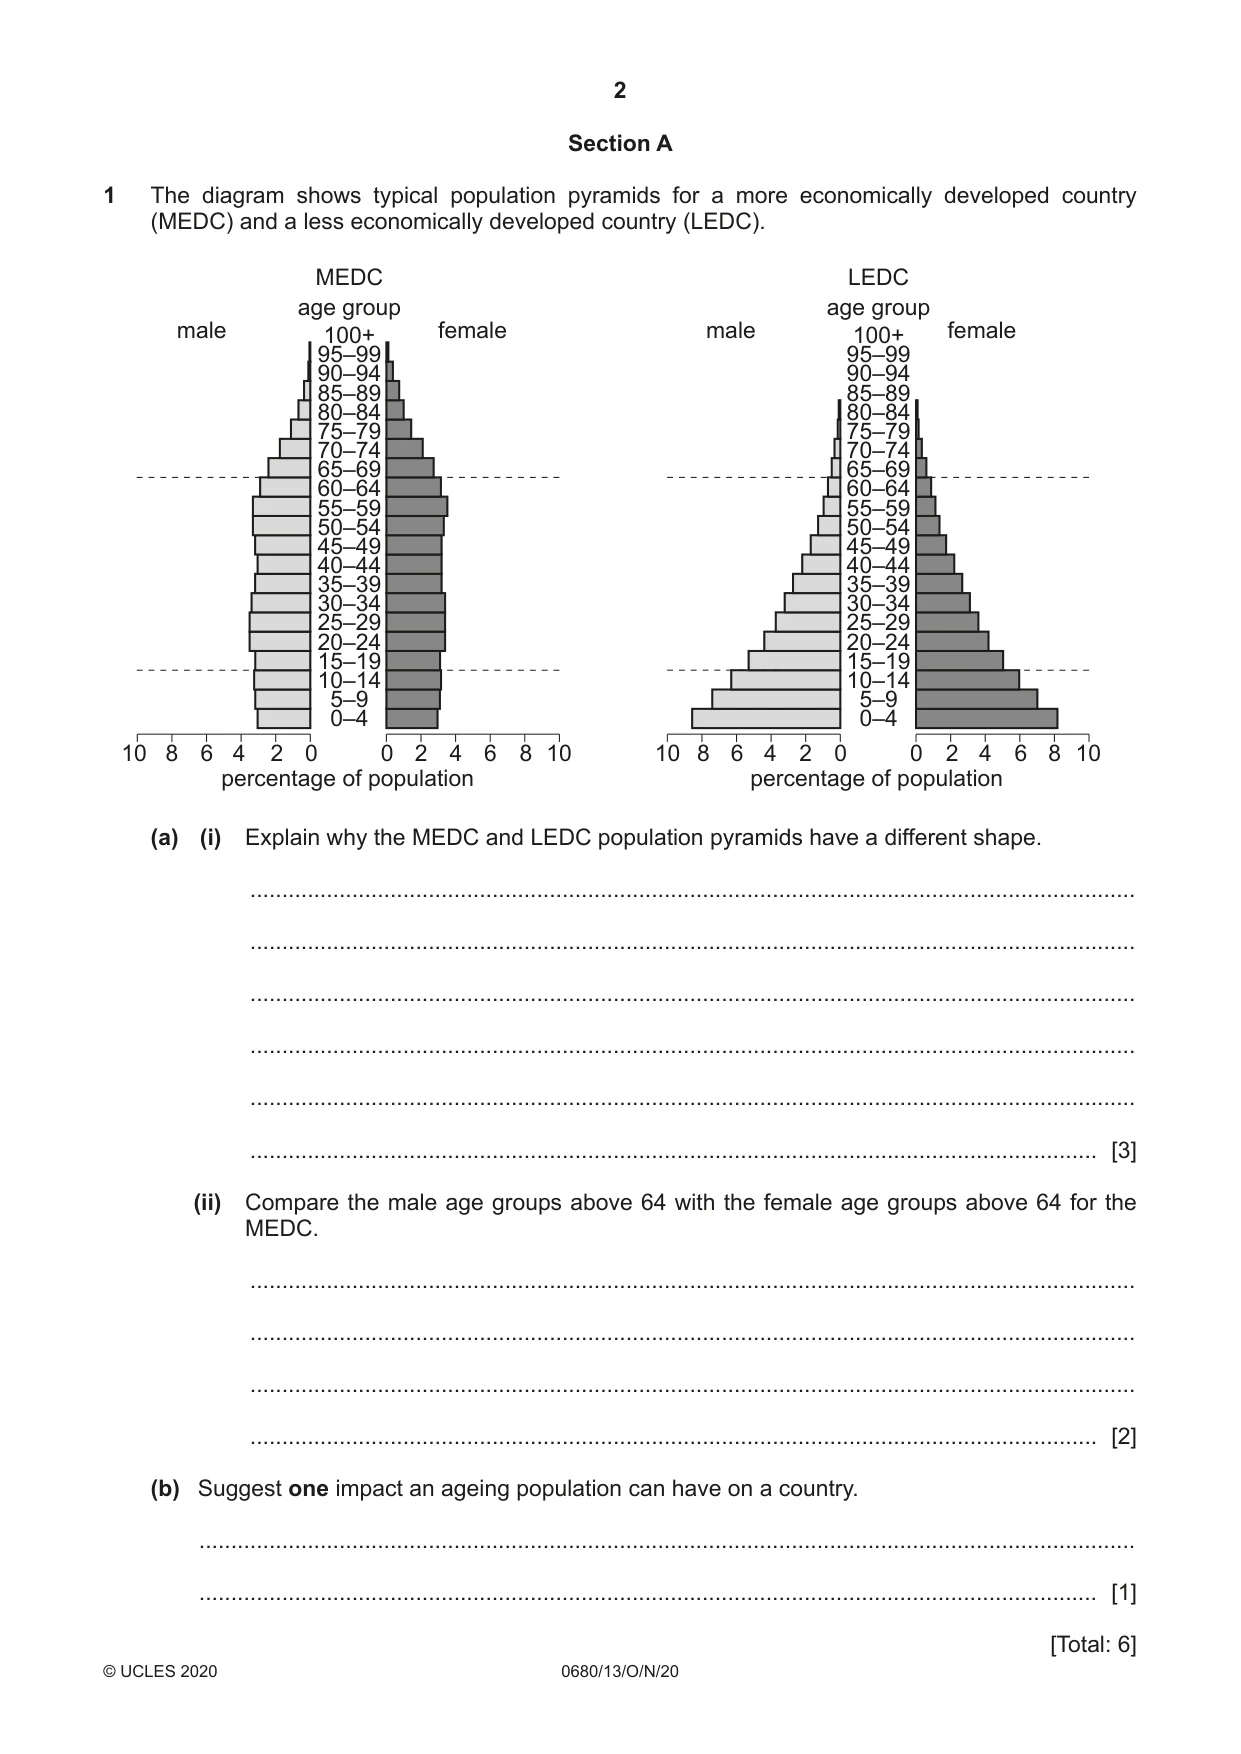
2 0680/13/O/N/20 © UCLES 2020 Section A 1 The diagram shows typical population pyramids for a more economically developed country (MEDC) and a less economically developed country (LEDC). 100+ 95–99 90–94 85–89 80–84 75–79 70–74 65–69 60–64 55–59 50–54 45–49 40–44 35–39 30–34 25–29 20–24 15–19 10–14 5–9 0–4 MEDC 0 0 percentage of population male female 2 4 2 4 6 8 10 6 8 10 100+ 95–99 90–94 85–89 80–84 75–79 70–74 65–69 60–64 55–59 50–54 45–49 40–44 35–39 30–34 25–29 20–24 15–19 10–14 5–9 0–4 LEDC age group age group 0 0 percentage of population male female 2 4 2 4 6 8 10 6 8 10 (a) (i) Explain why the MEDC and LEDC population pyramids have a different shape. … … … … … … [3] (ii) Compare the male age groups above 64 with the female age groups above 64 for the MEDC. … … … … [2] (b) Suggest one impact an ageing population can have on a country. … … [1] [Total: 6]
Question paper, page 3
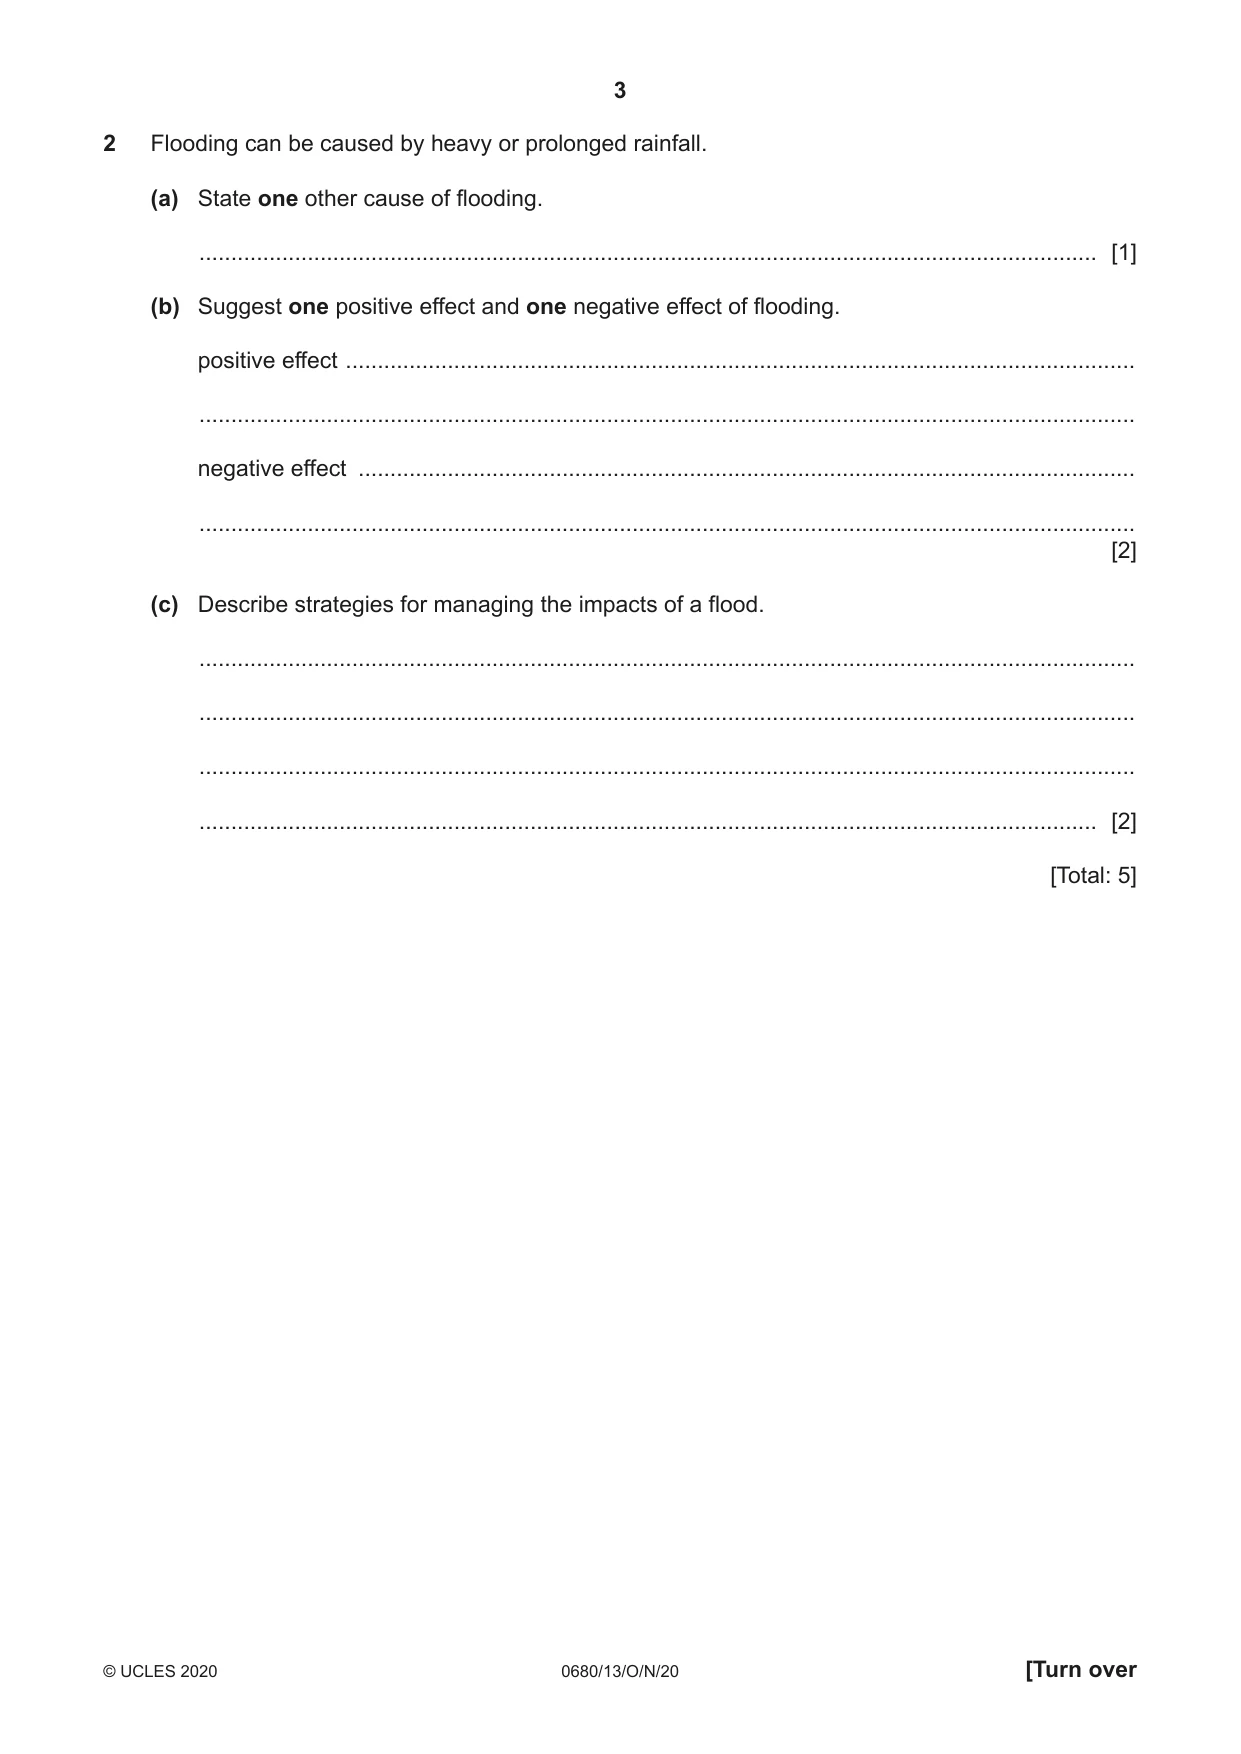
3 0680/13/O/N/20 © UCLES 2020 [Turn over 2 Flooding can be caused by heavy or prolonged rainfall. (a) State one other cause of flooding. … [1] (b) Suggest one positive effect and one negative effect of flooding. positive effect … … negative effect … … [2] (c) Describe strategies for managing the impacts of a flood. … … … … [2] [Total: 5]
Question paper, page 4
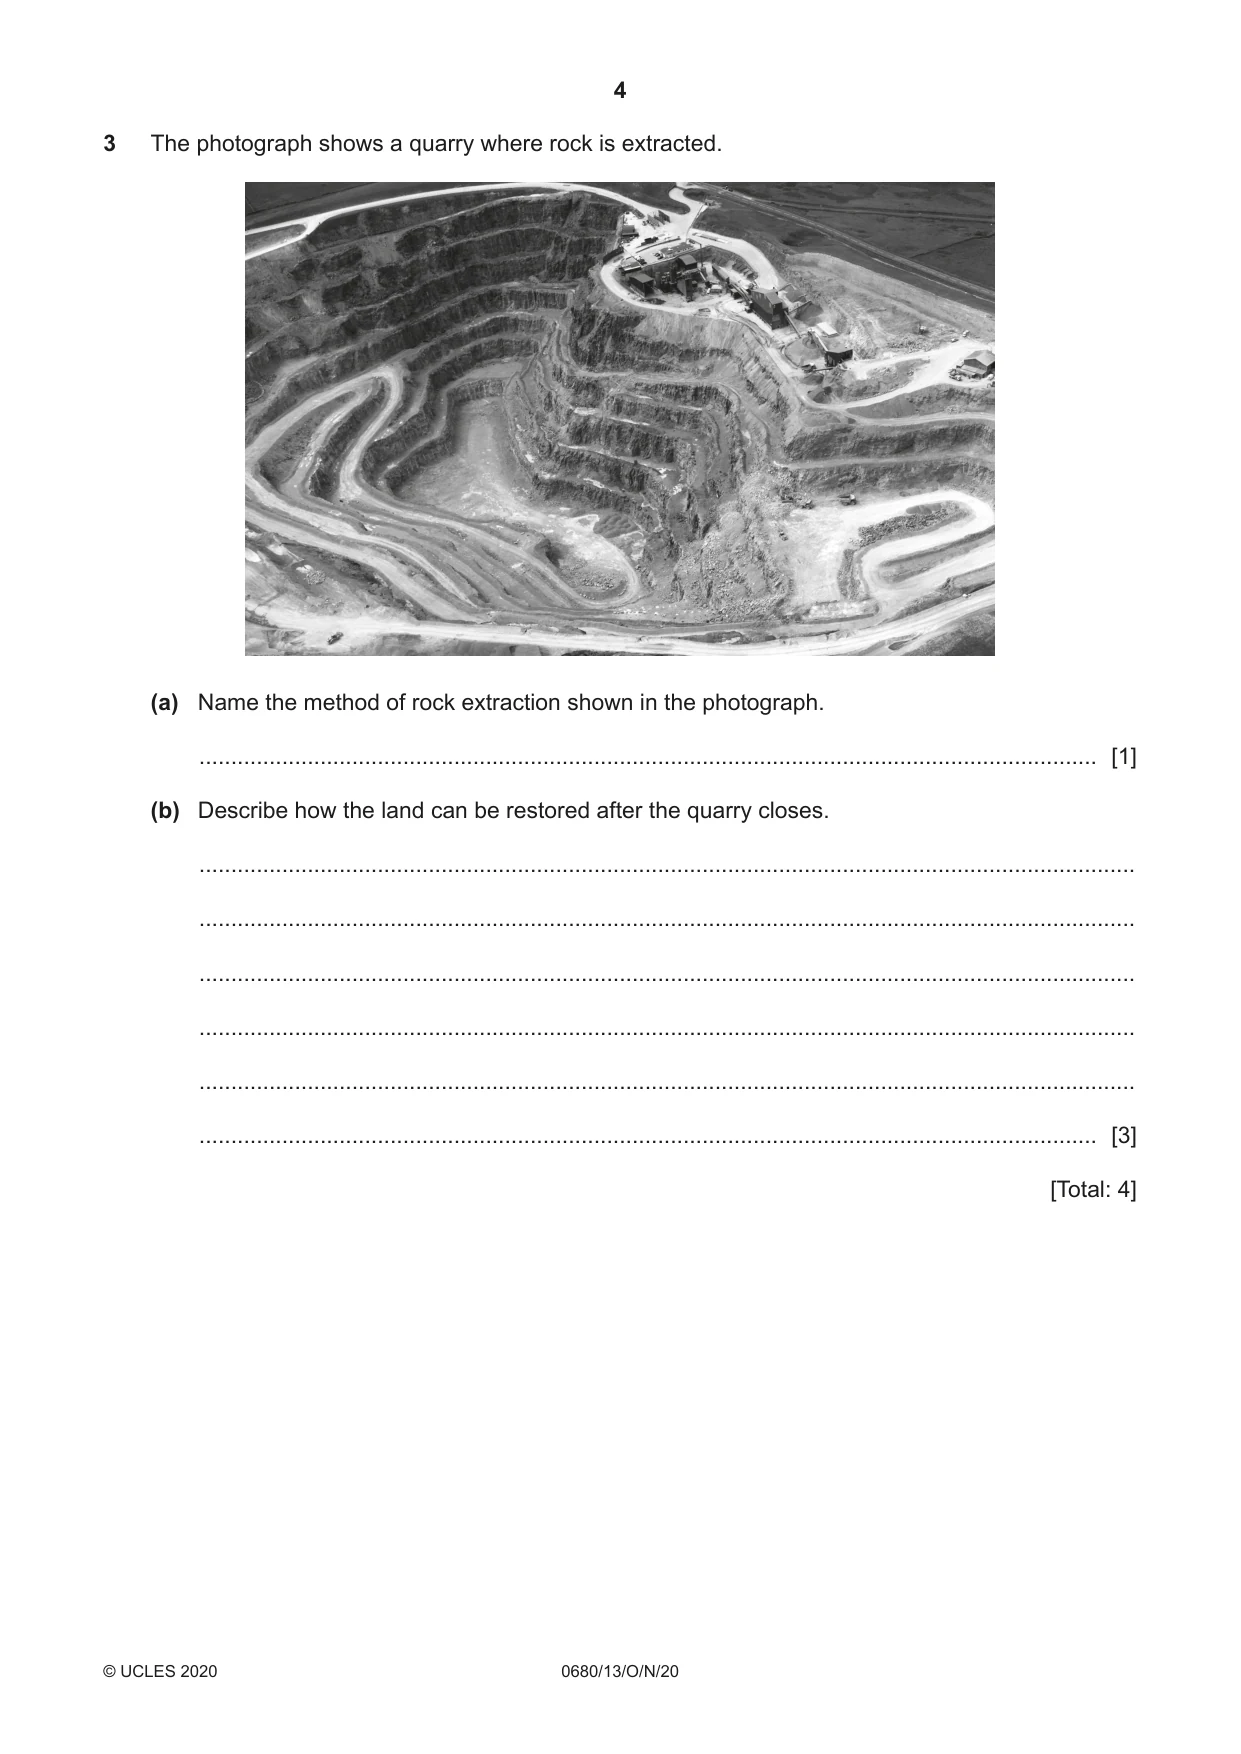
4 0680/13/O/N/20 © UCLES 2020 3 The photograph shows a quarry where rock is extracted. (a) Name the method of rock extraction shown in the photograph. … [1] (b) Describe how the land can be restored after the quarry closes. … … … … … … [3] [Total: 4]
Question paper, page 5
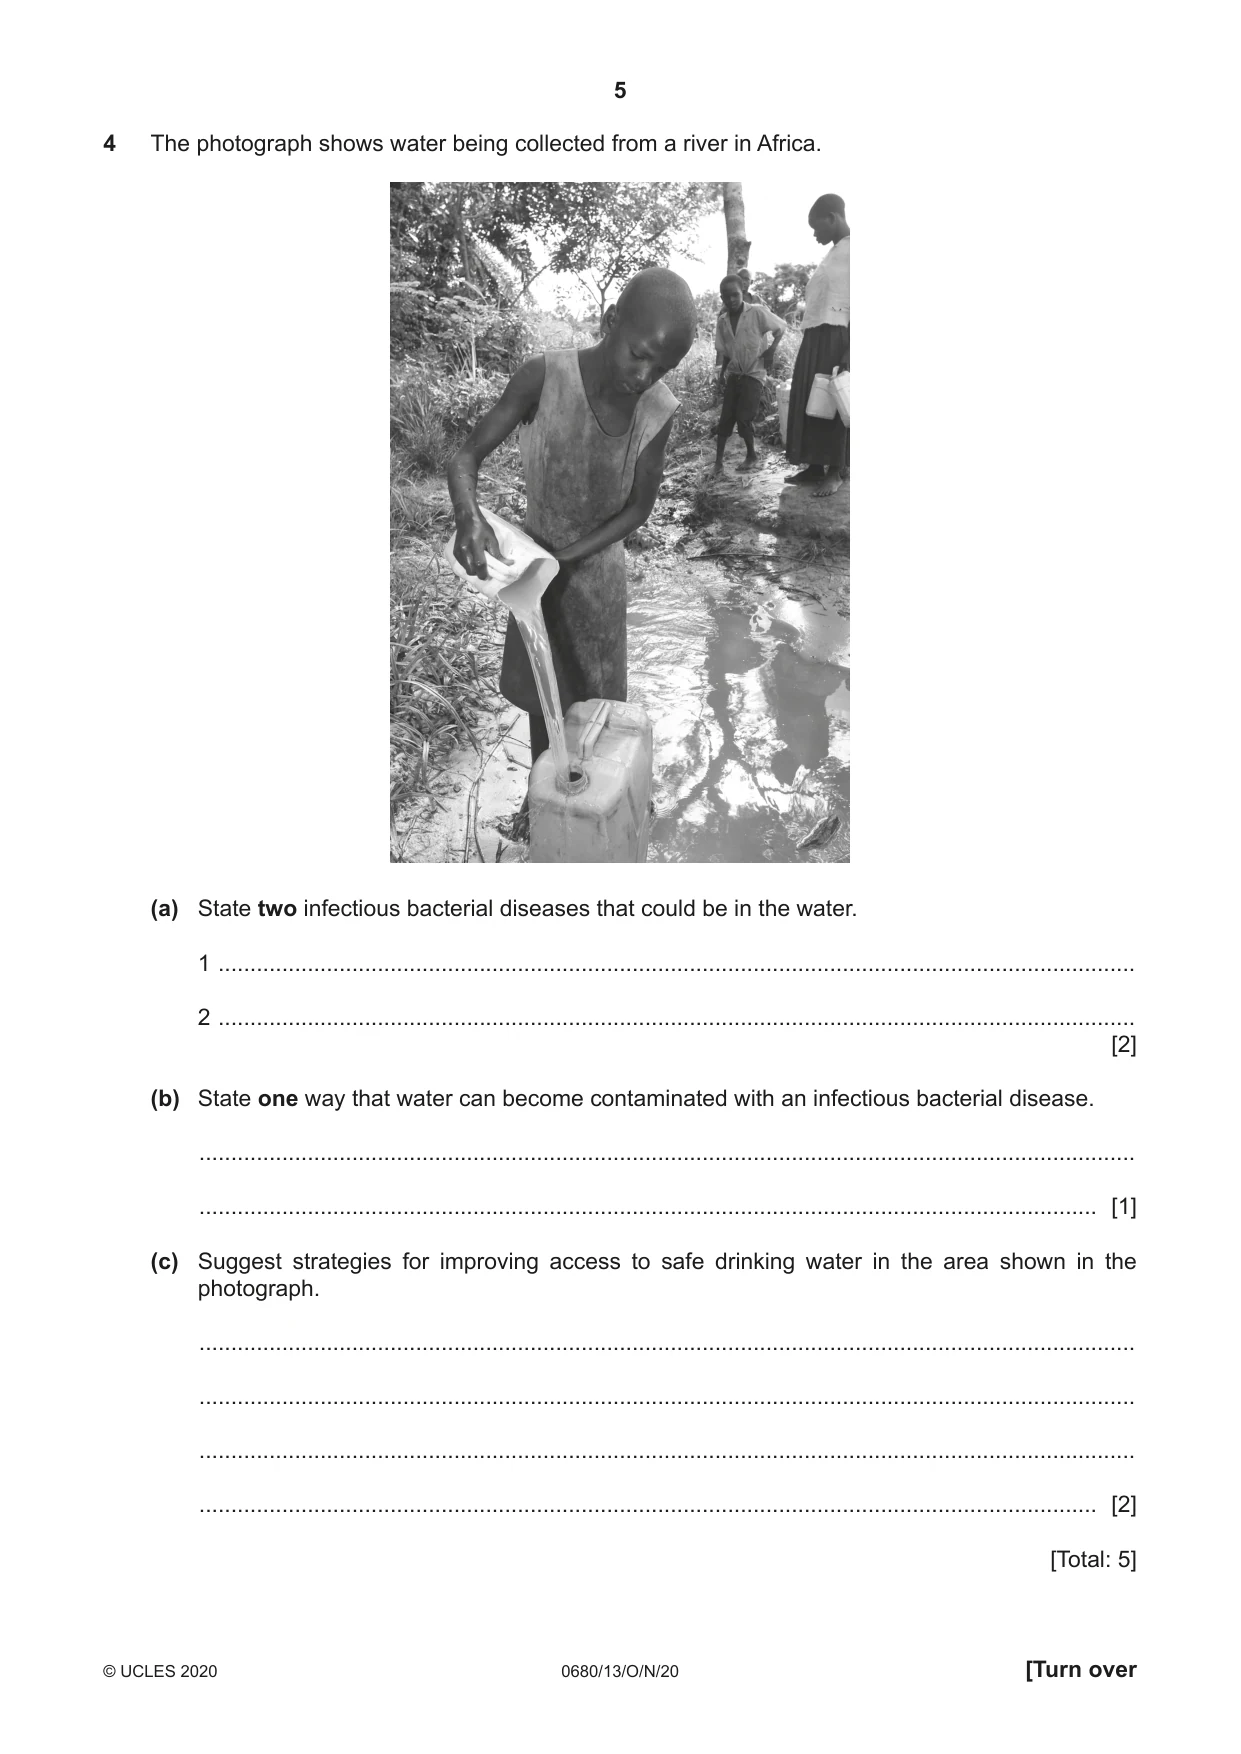
5 0680/13/O/N/20 © UCLES 2020 [Turn over 4 The photograph shows water being collected from a river in Africa. (a) State two infectious bacterial diseases that could be in the water. 1 … 2 … [2] (b) State one way that water can become contaminated with an infectious bacterial disease. … … [1] (c) Suggest strategies for improving access to safe drinking water in the area shown in the photograph. … … … … [2] [Total: 5]
Question paper, page 6
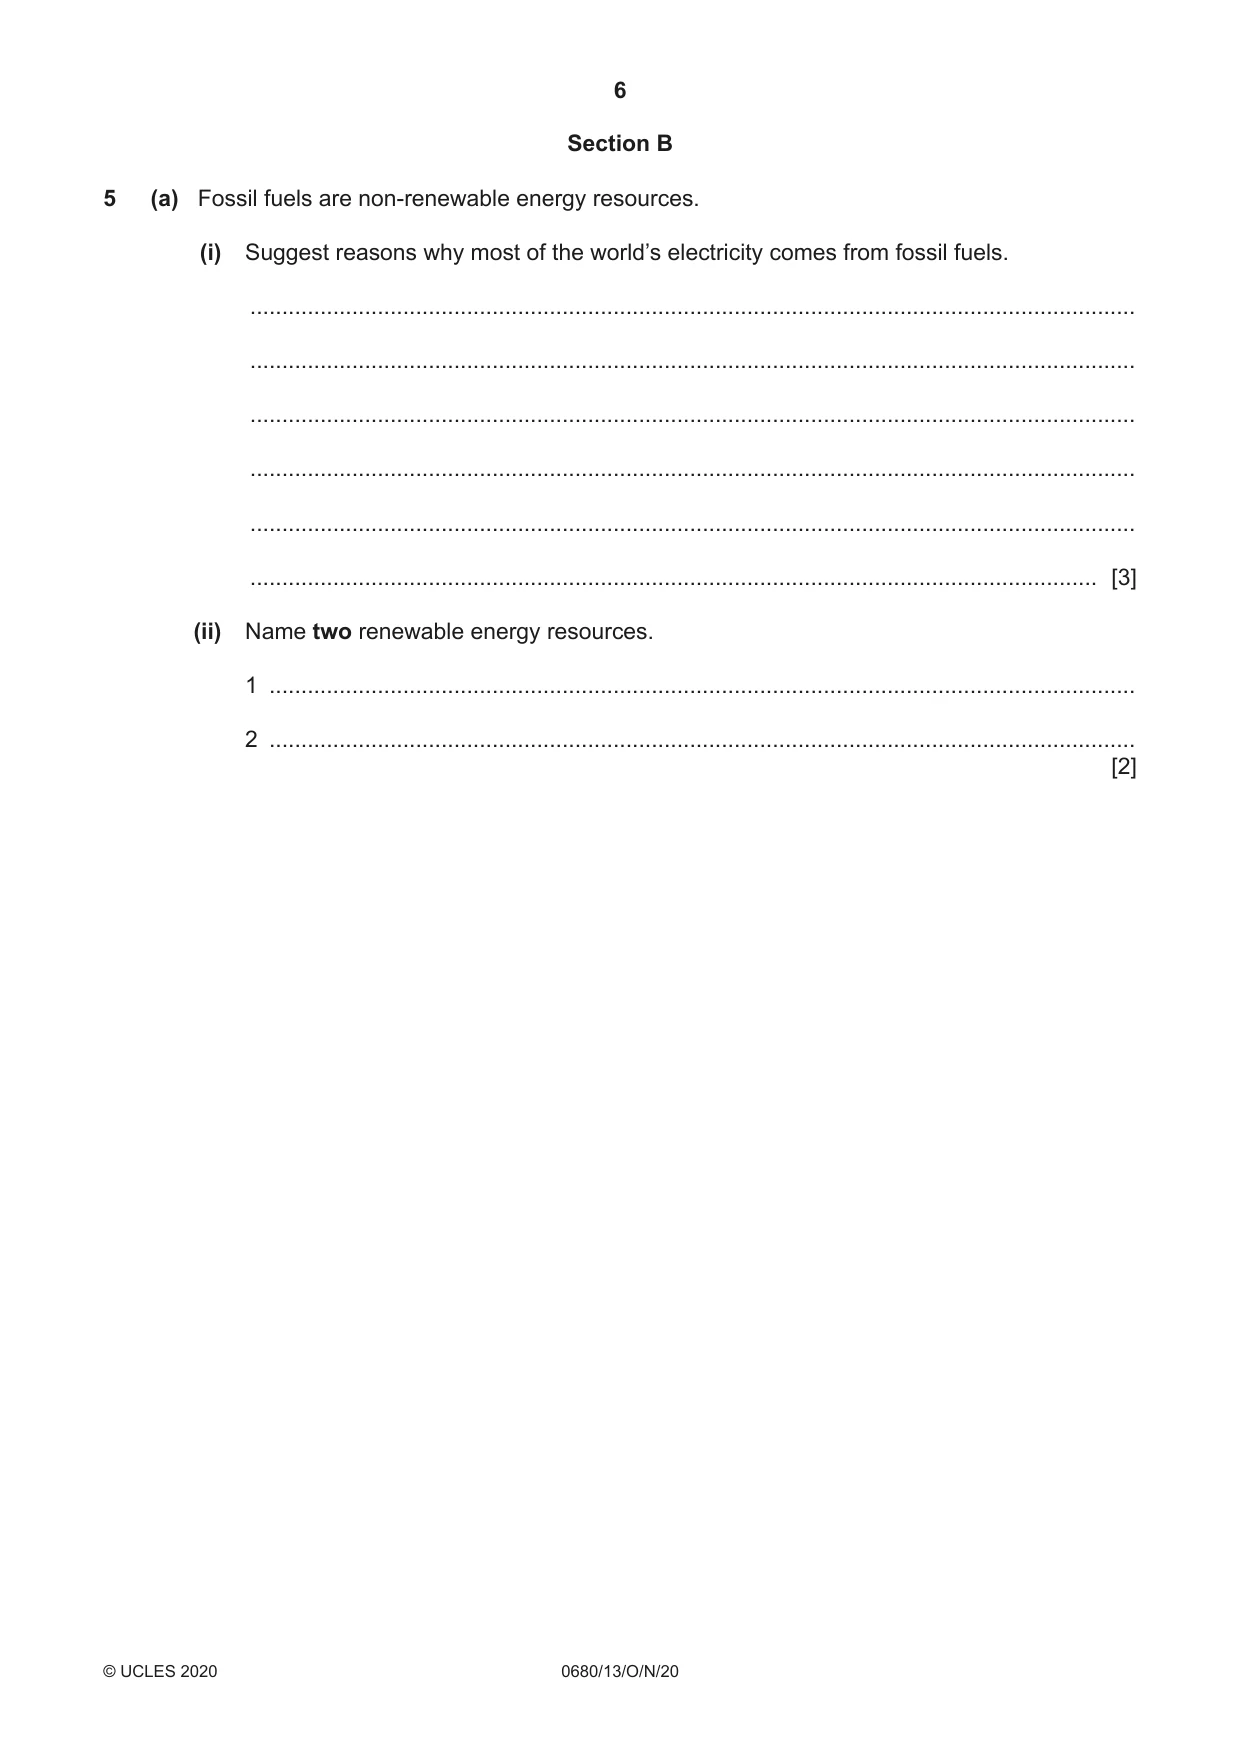
6 0680/13/O/N/20 © UCLES 2020 Section B 5 (a) Fossil fuels are non-renewable energy resources. (i) Suggest reasons why most of the world’s electricity comes from fossil fuels. … … … … … … [3] (ii) Name two renewable energy resources. 1 … 2 … [2]
Question paper, page 7
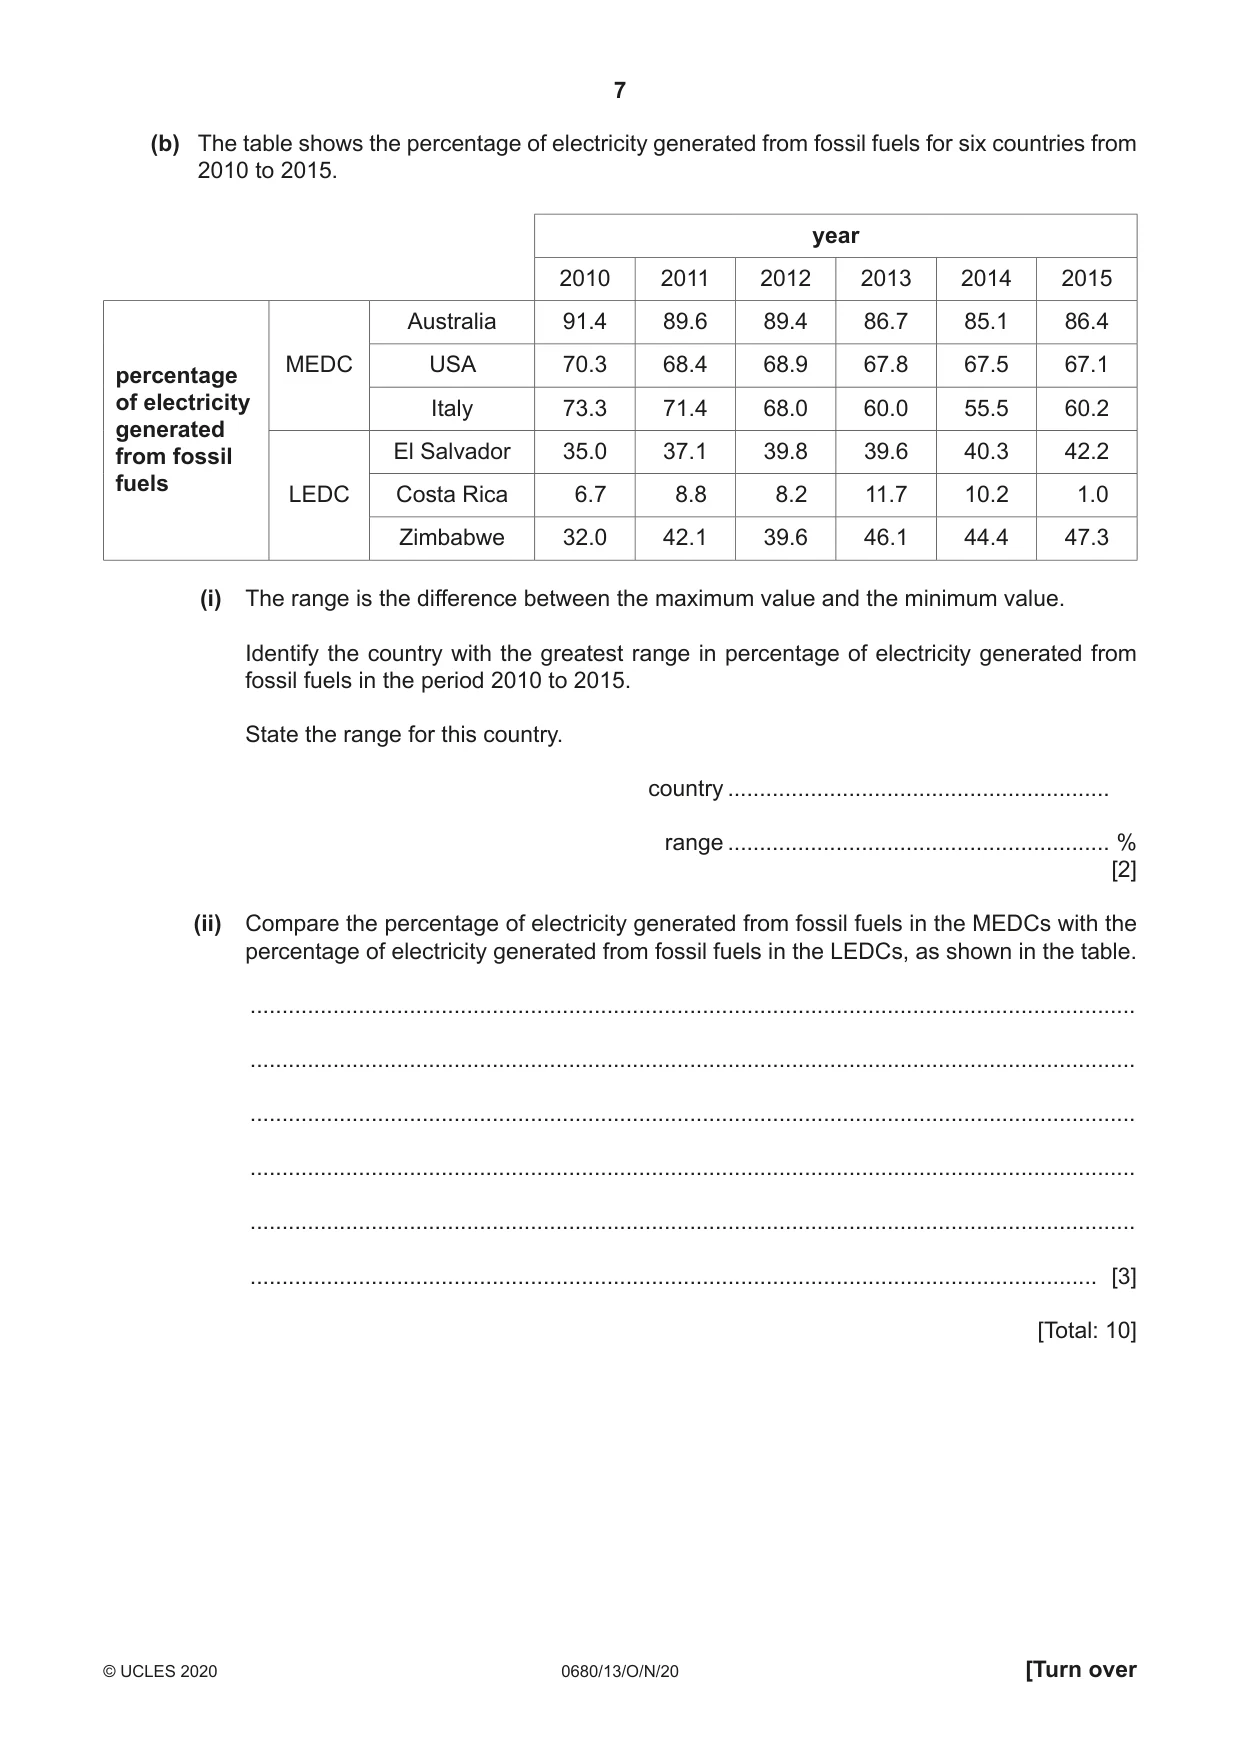
7 0680/13/O/N/20 © UCLES 2020 [Turn over (b) The table shows the percentage of electricity generated from fossil fuels for six countries from 2010 to 2015. year 2010 2011 2012 2013 2014 2015 percentage of electricity generated from fossil fuels MEDC Australia 91.4 89.6 89.4 86.7 85.1 86.4 USA 70.3 68.4 68.9 67.8 67.5 67.1 Italy 73.3 71.4 68.0 60.0 55.5 60.2 LEDC El Salvador 35.0 37.1 39.8 39.6 40.3 42.2 Costa Rica 6.7 8.8 8.2 11.7 10.2 1.0 Zimbabwe 32.0 42.1 39.6 46.1 44.4 47.3 (i) The range is the difference between the maximum value and the minimum value. Identify the country with the greatest range in percentage of electricity generated from fossil fuels in the period 2010 to 2015. State the range for this country. country … range … % [2] (ii) Compare the percentage of electricity generated from fossil fuels in the MEDCs with the percentage of electricity generated from fossil fuels in the LEDCs, as shown in the table. … … … … … … [3] [Total: 10]
Question paper, page 8
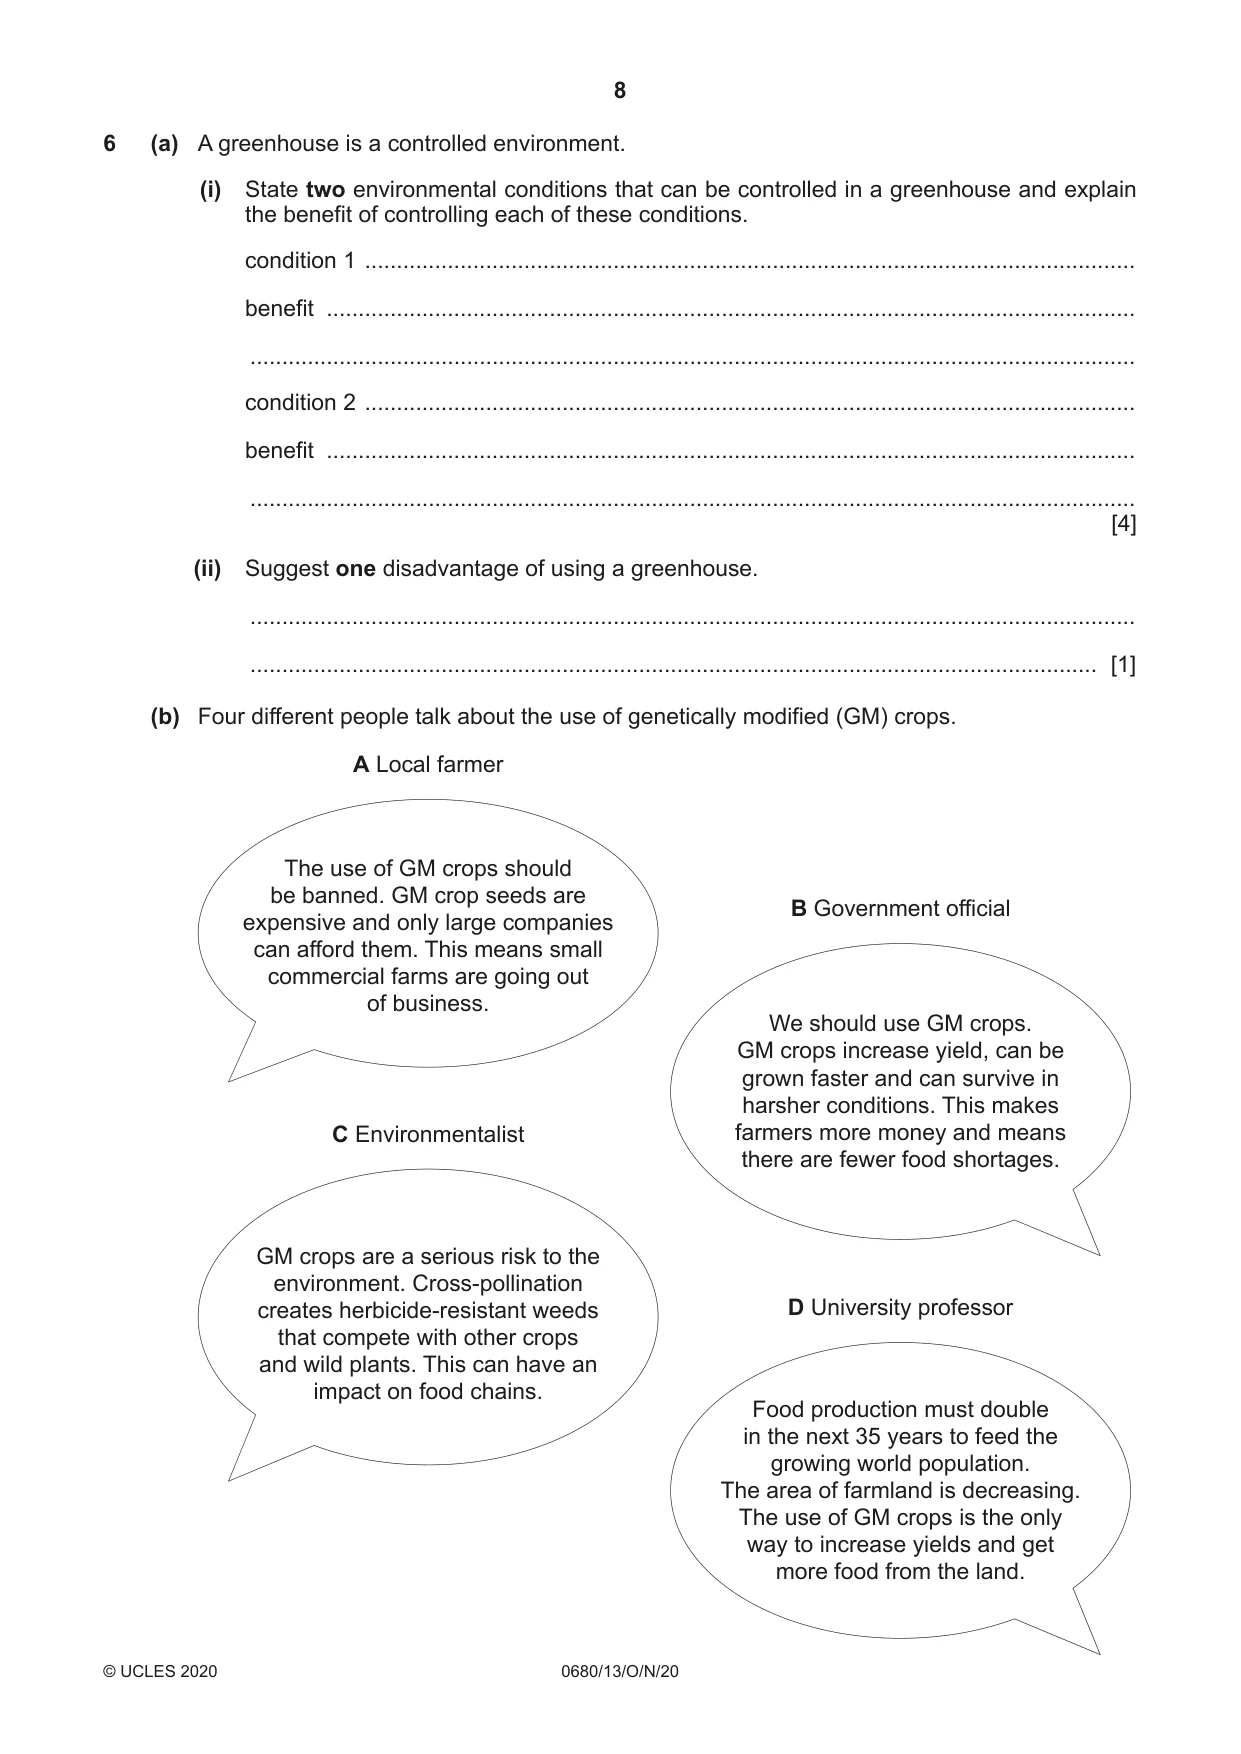
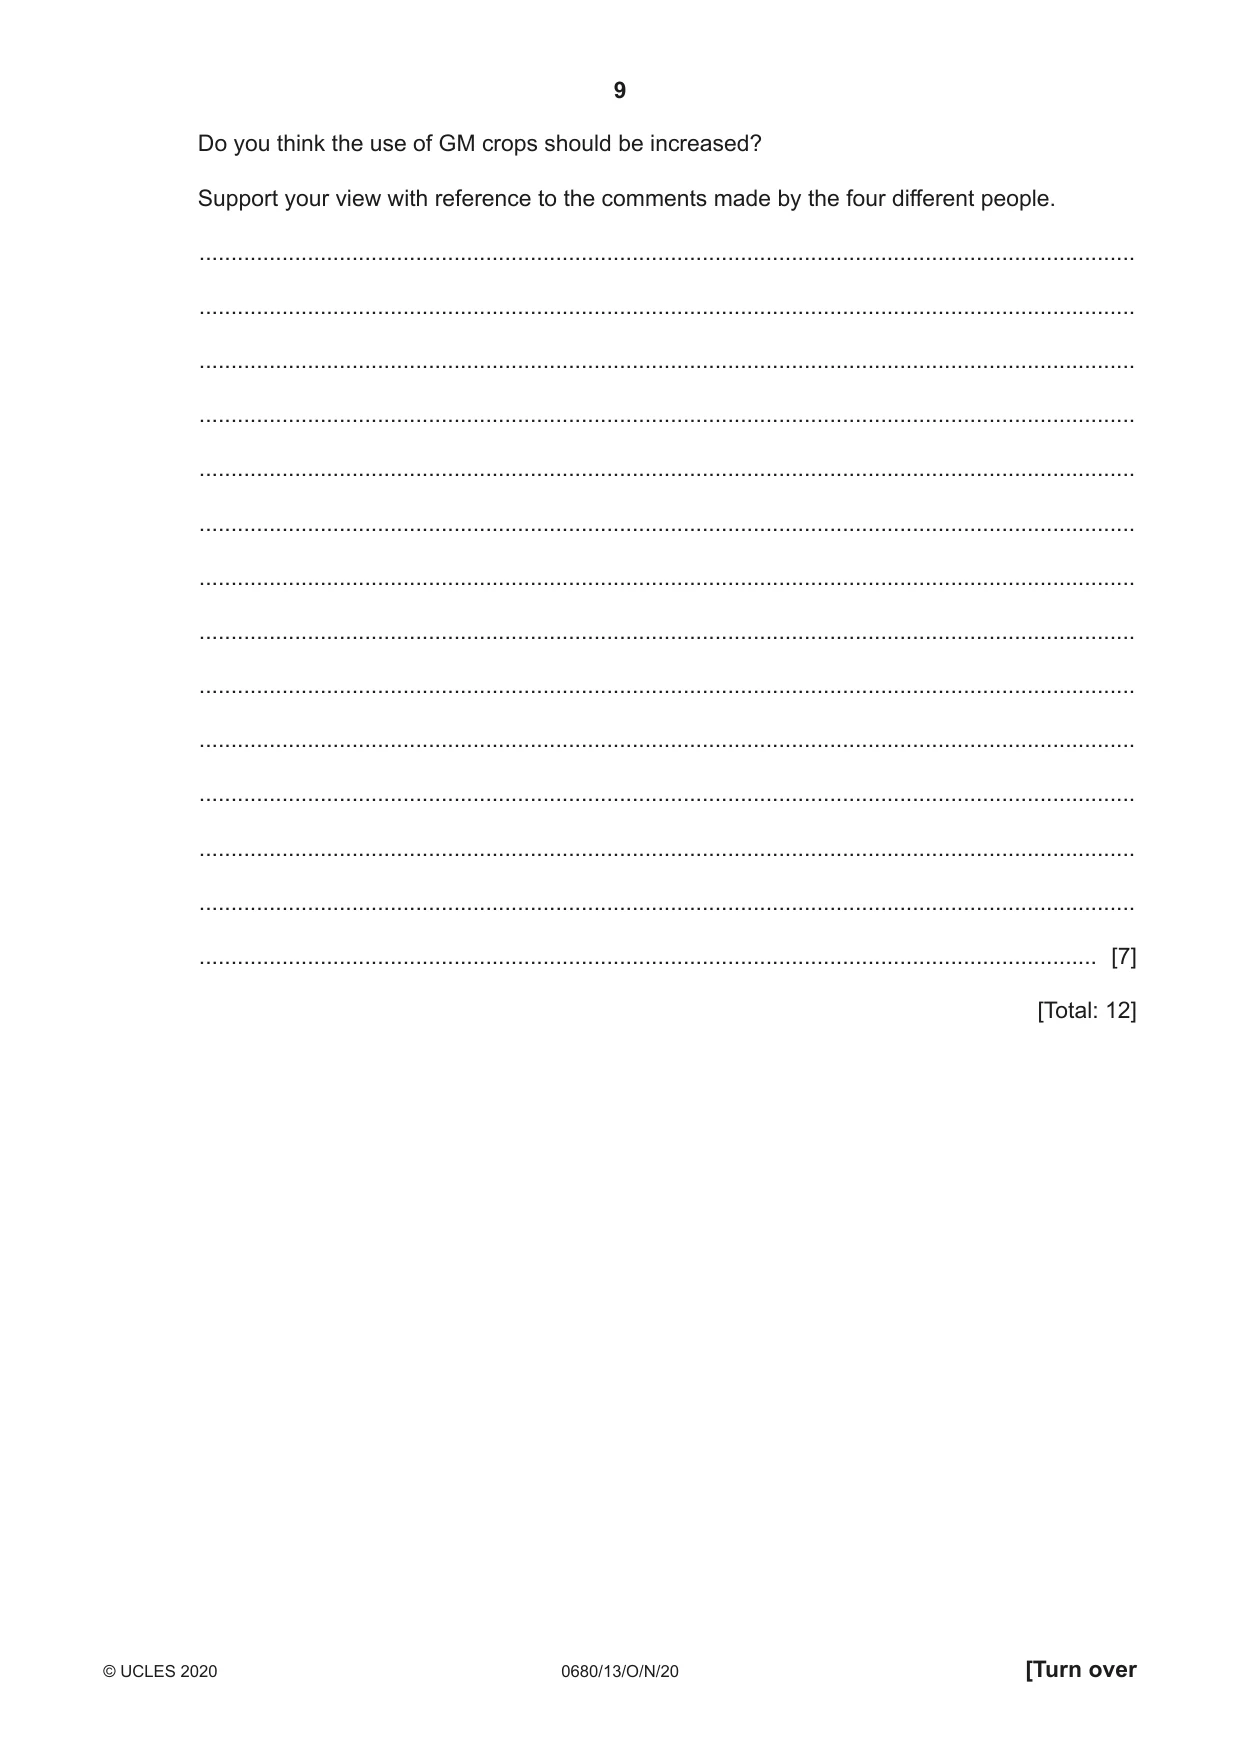
8 0680/13/O/N/20 © UCLES 2020 6 (a) A greenhouse is a controlled environment. (i) State two environmental conditions that can be controlled in a greenhouse and explain the benefit of controlling each of these conditions. condition 1 … benefit … … condition 2 … benefit … … [4] (ii) Suggest one disadvantage of using a greenhouse. … … [1] (b) Four different people talk about the use of genetically modified (GM) crops. The use of GM crops should be banned. GM crop seeds are expensive and only large companies can afford them. This means small commercial farms are going out of business. A Local farmer We should use GM crops. GM crops increase yield, can be grown faster and can survive in harsher conditions. This makes farmers more money and means there are fewer food shortages. B Government official GM crops are a serious risk to the environment. Cross-pollination creates herbicide-resistant weeds that compete with other crops and wild plants. This can have an impact on food chains. C Environmentalist Food production must double in the next 35 years to feed the growing world population. The area of farmland is decreasing. The use of GM crops is the only way to increase yields and get more food from the land. D University professor
Question paper, page 9
9 0680/13/O/N/20 © UCLES 2020 [Turn over Do you think the use of GM crops should be increased? Support your view with reference to the comments made by the four different people. … … … … … … … … … … … … … … [7] [Total: 12]
Question paper, page 10
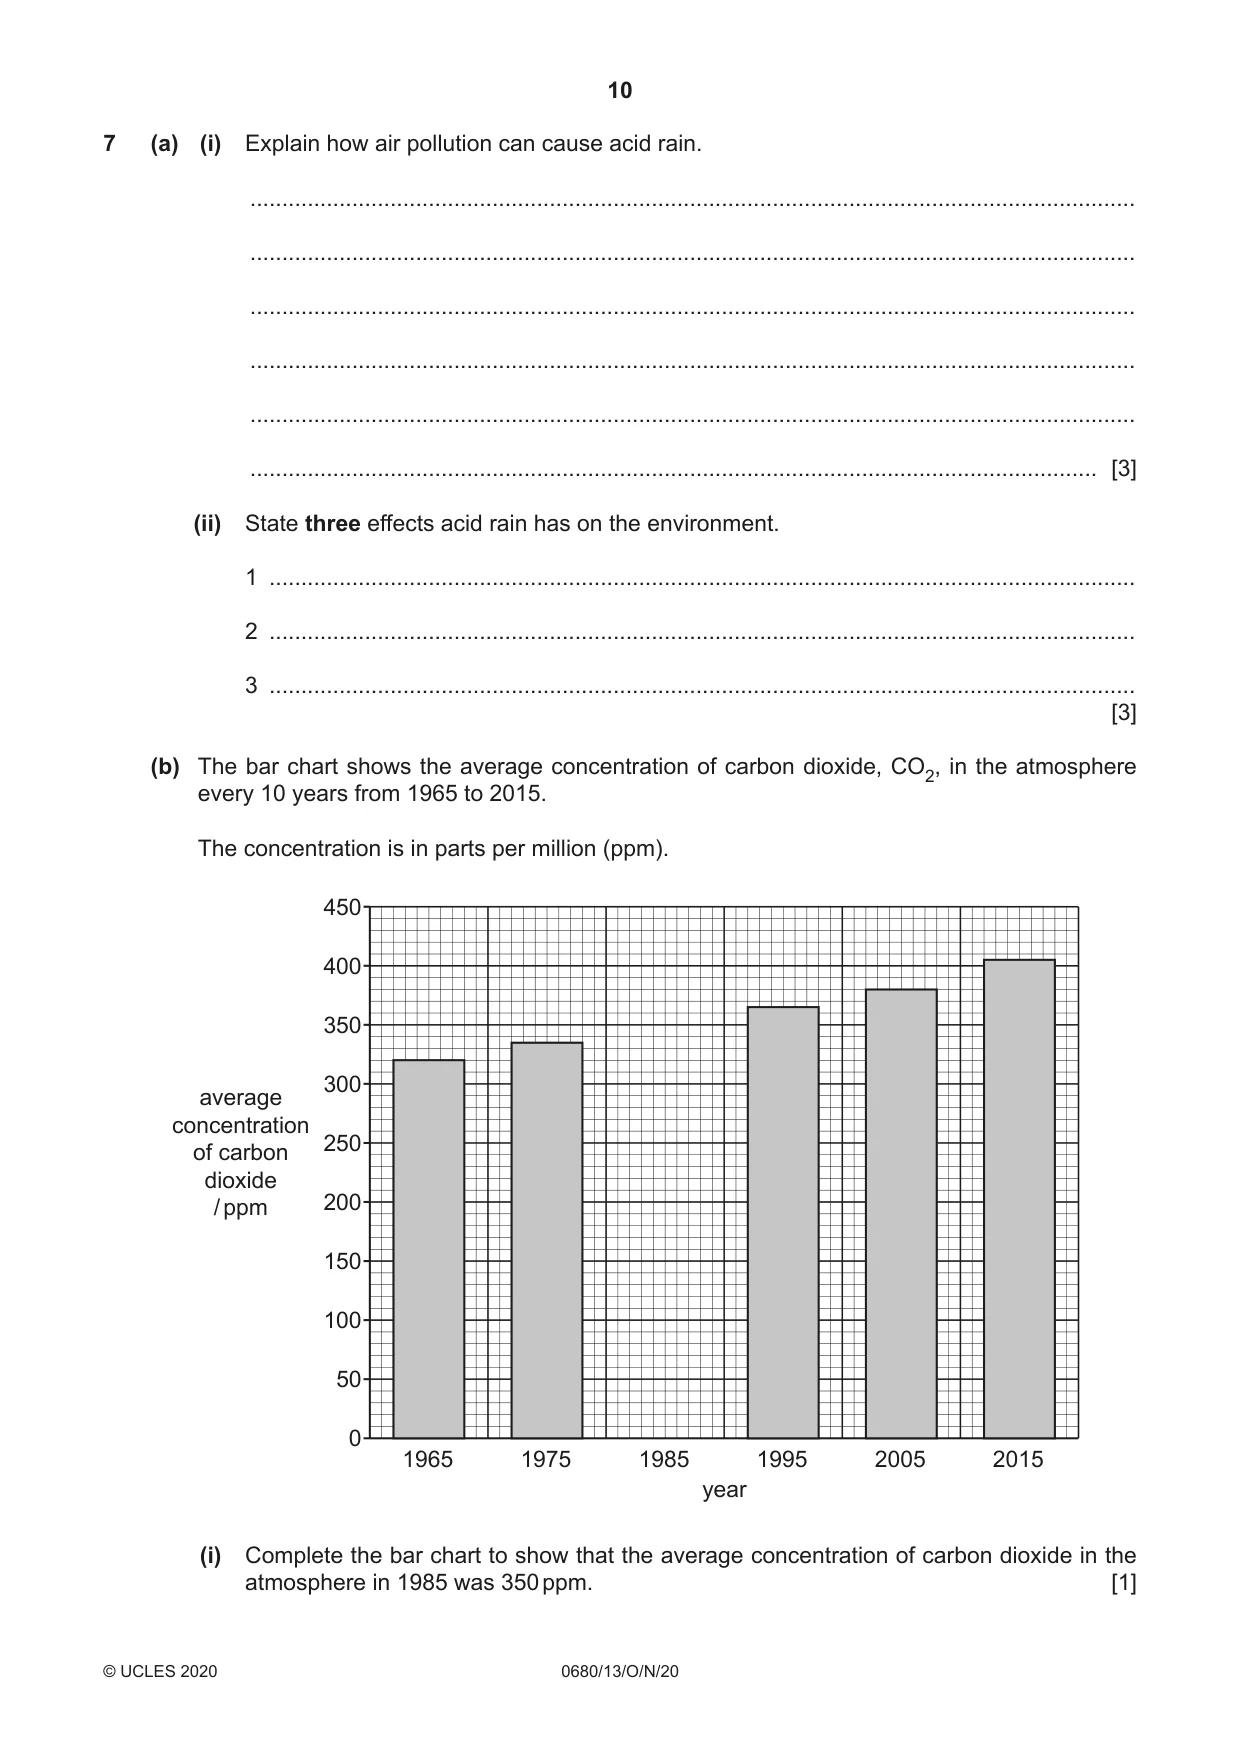
10 0680/13/O/N/20 © UCLES 2020 7 (a) (i) Explain how air pollution can cause acid rain. … … … … … … [3] (ii) State three effects acid rain has on the environment. 1 … 2 … 3 … [3] (b) The bar chart shows the average concentration of carbon dioxide, CO2, in the atmosphere every 10 years from 1965 to 2015. The concentration is in parts per million (ppm). 0 50 1965 1975 1985 1995 year 2005 2015 100 150 200 250 average concentration of carbon dioxide / ppm 300 350 400 450 (i) Complete the bar chart to show that the average concentration of carbon dioxide in the atmosphere in 1985 was 350 ppm. [1]
Question paper, page 11
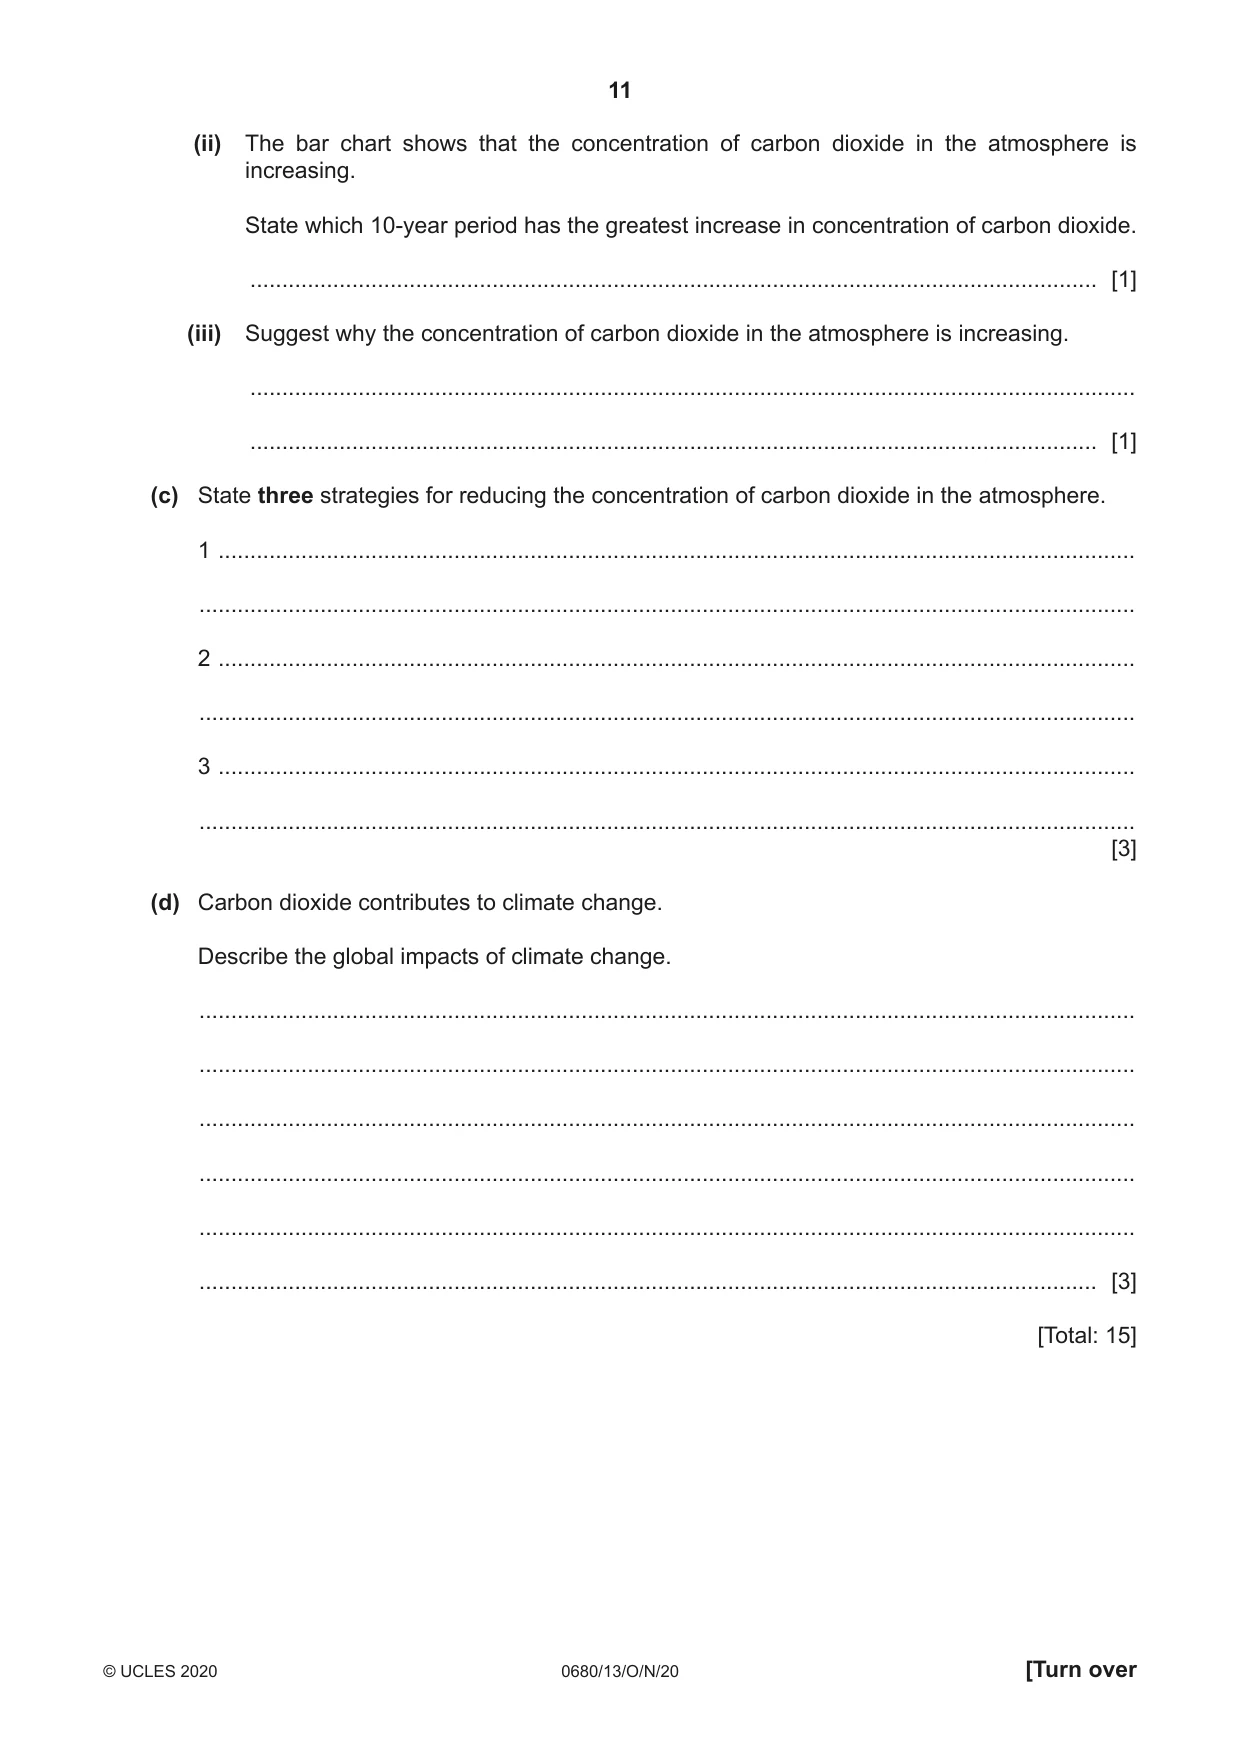
11 0680/13/O/N/20 © UCLES 2020 [Turn over (ii) The bar chart shows that the concentration of carbon dioxide in the atmosphere is increasing. State which 10-year period has the greatest increase in concentration of carbon dioxide. … [1] (iii) Suggest why the concentration of carbon dioxide in the atmosphere is increasing. … … [1] (c) State three strategies for reducing the concentration of carbon dioxide in the atmosphere. 1 … … 2 … … 3 … … [3] (d) Carbon dioxide contributes to climate change. Describe the global impacts of climate change. … … … … … … [3] [Total: 15]
Question paper, page 12
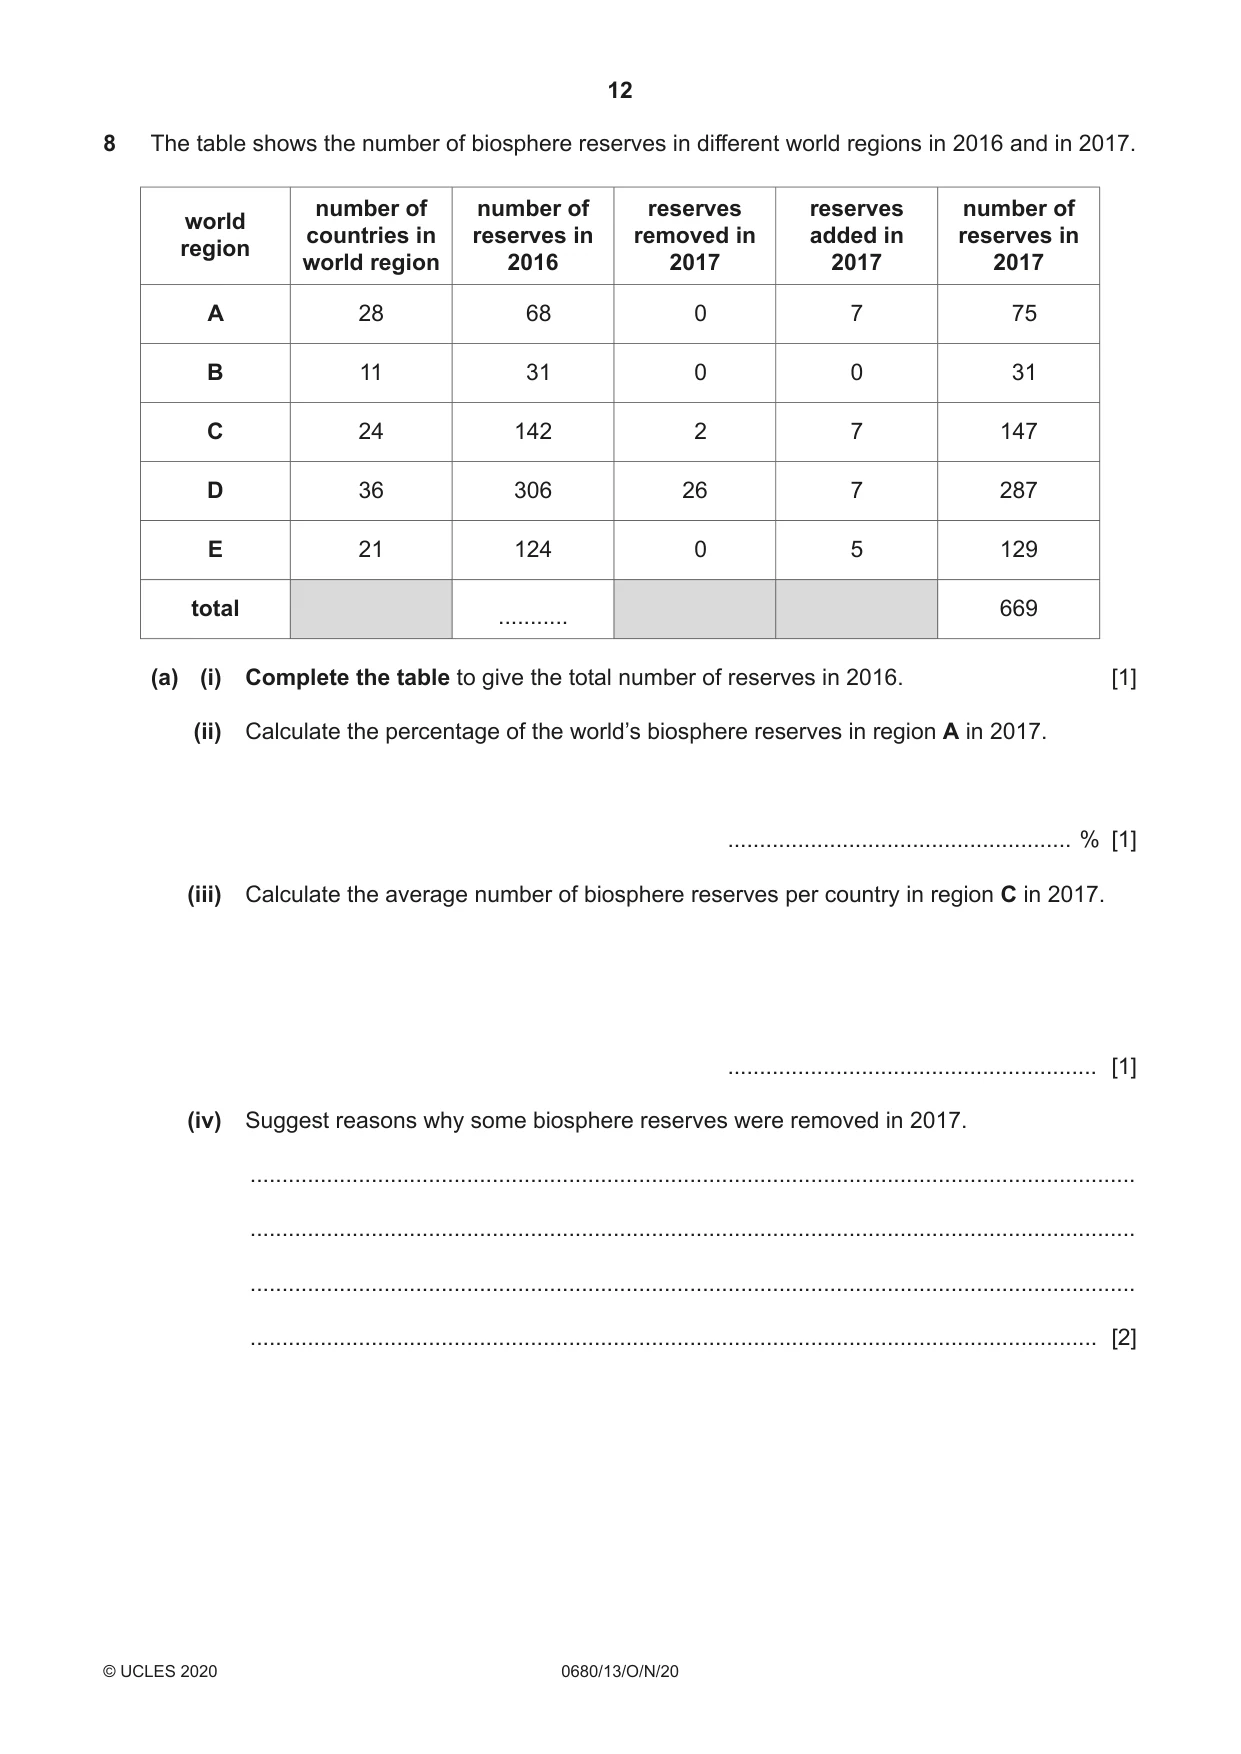
12 0680/13/O/N/20 © UCLES 2020 8 The table shows the number of biosphere reserves in different world regions in 2016 and in 2017. world region number of countries in world region number of reserves in 2016 reserves removed in 2017 reserves added in 2017 number of reserves in 2017 A 28 68 0 7 75 B 11 31 0 0 31 C 24 142 2 7 147 D 36 306 26 7 287 E 21 124 0 5 129 total … 669 (a) (i) Complete the table to give the total number of reserves in 2016. [1] (ii) Calculate the percentage of the world’s biosphere reserves in region A in 2017. … % [1] (iii) Calculate the average number of biosphere reserves per country in region C in 2017. … [1] (iv) Suggest reasons why some biosphere reserves were removed in 2017. … … … … [2]
Question paper, page 13
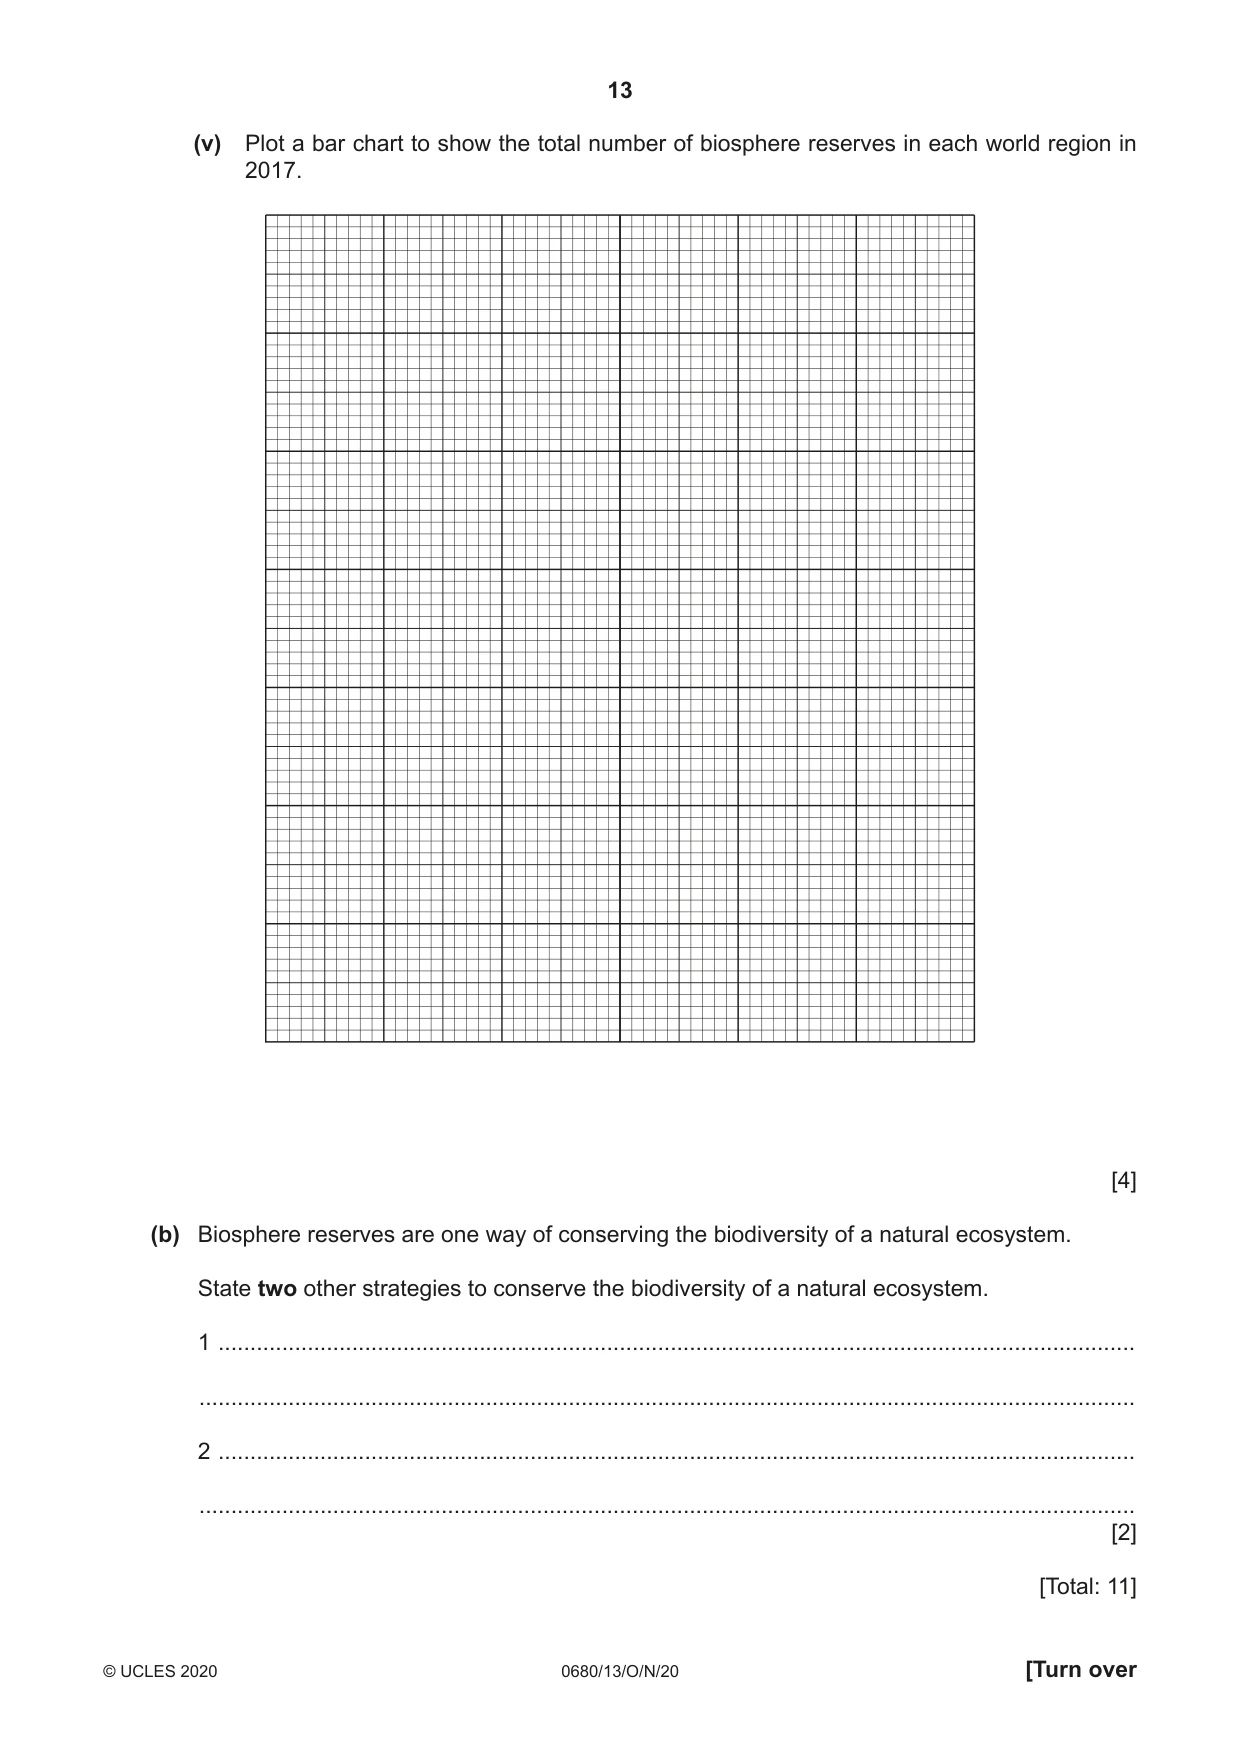
13 0680/13/O/N/20 © UCLES 2020 [Turn over (v) Plot a bar chart to show the total number of biosphere reserves in each world region in 2017. [4] (b) Biosphere reserves are one way of conserving the biodiversity of a natural ecosystem. State two other strategies to conserve the biodiversity of a natural ecosystem. 1 … … 2 … … [2] [Total: 11]
Question paper, page 14
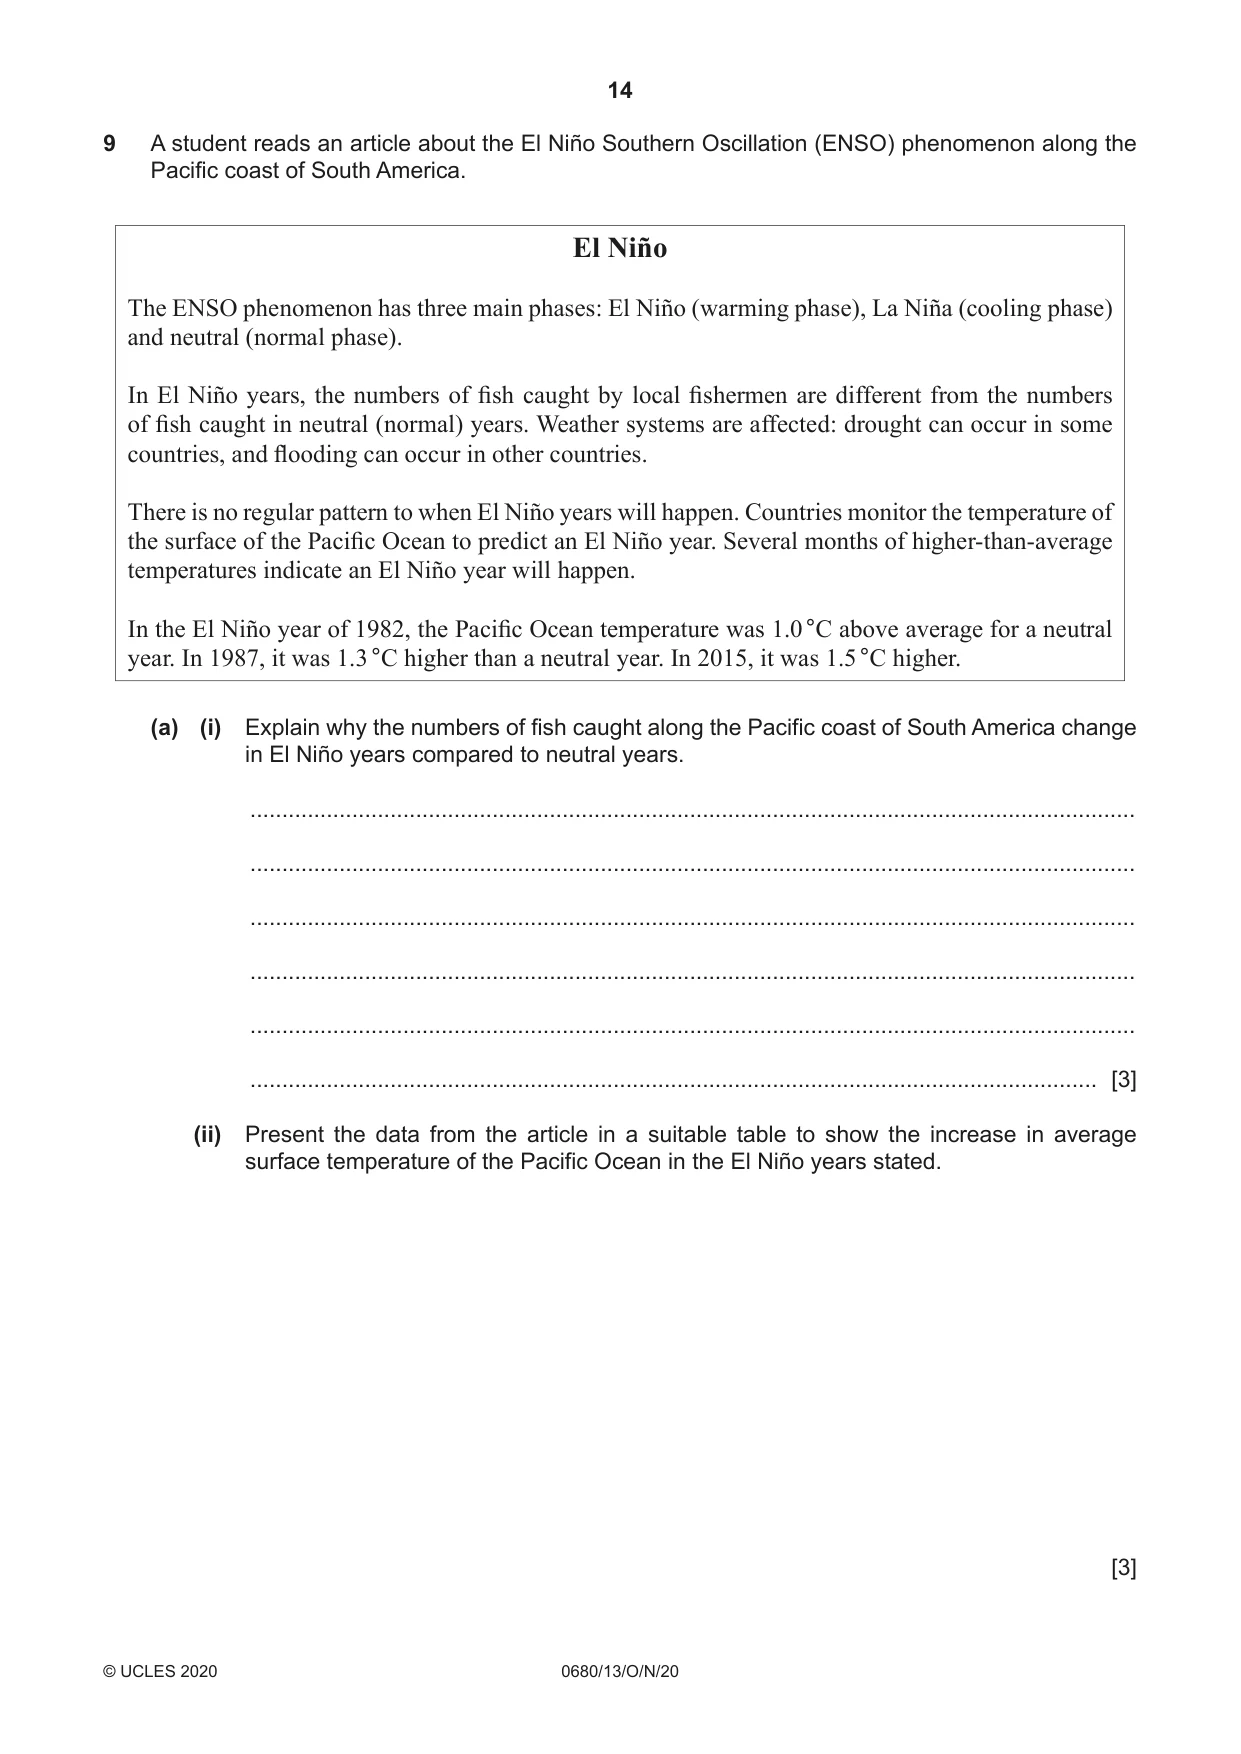
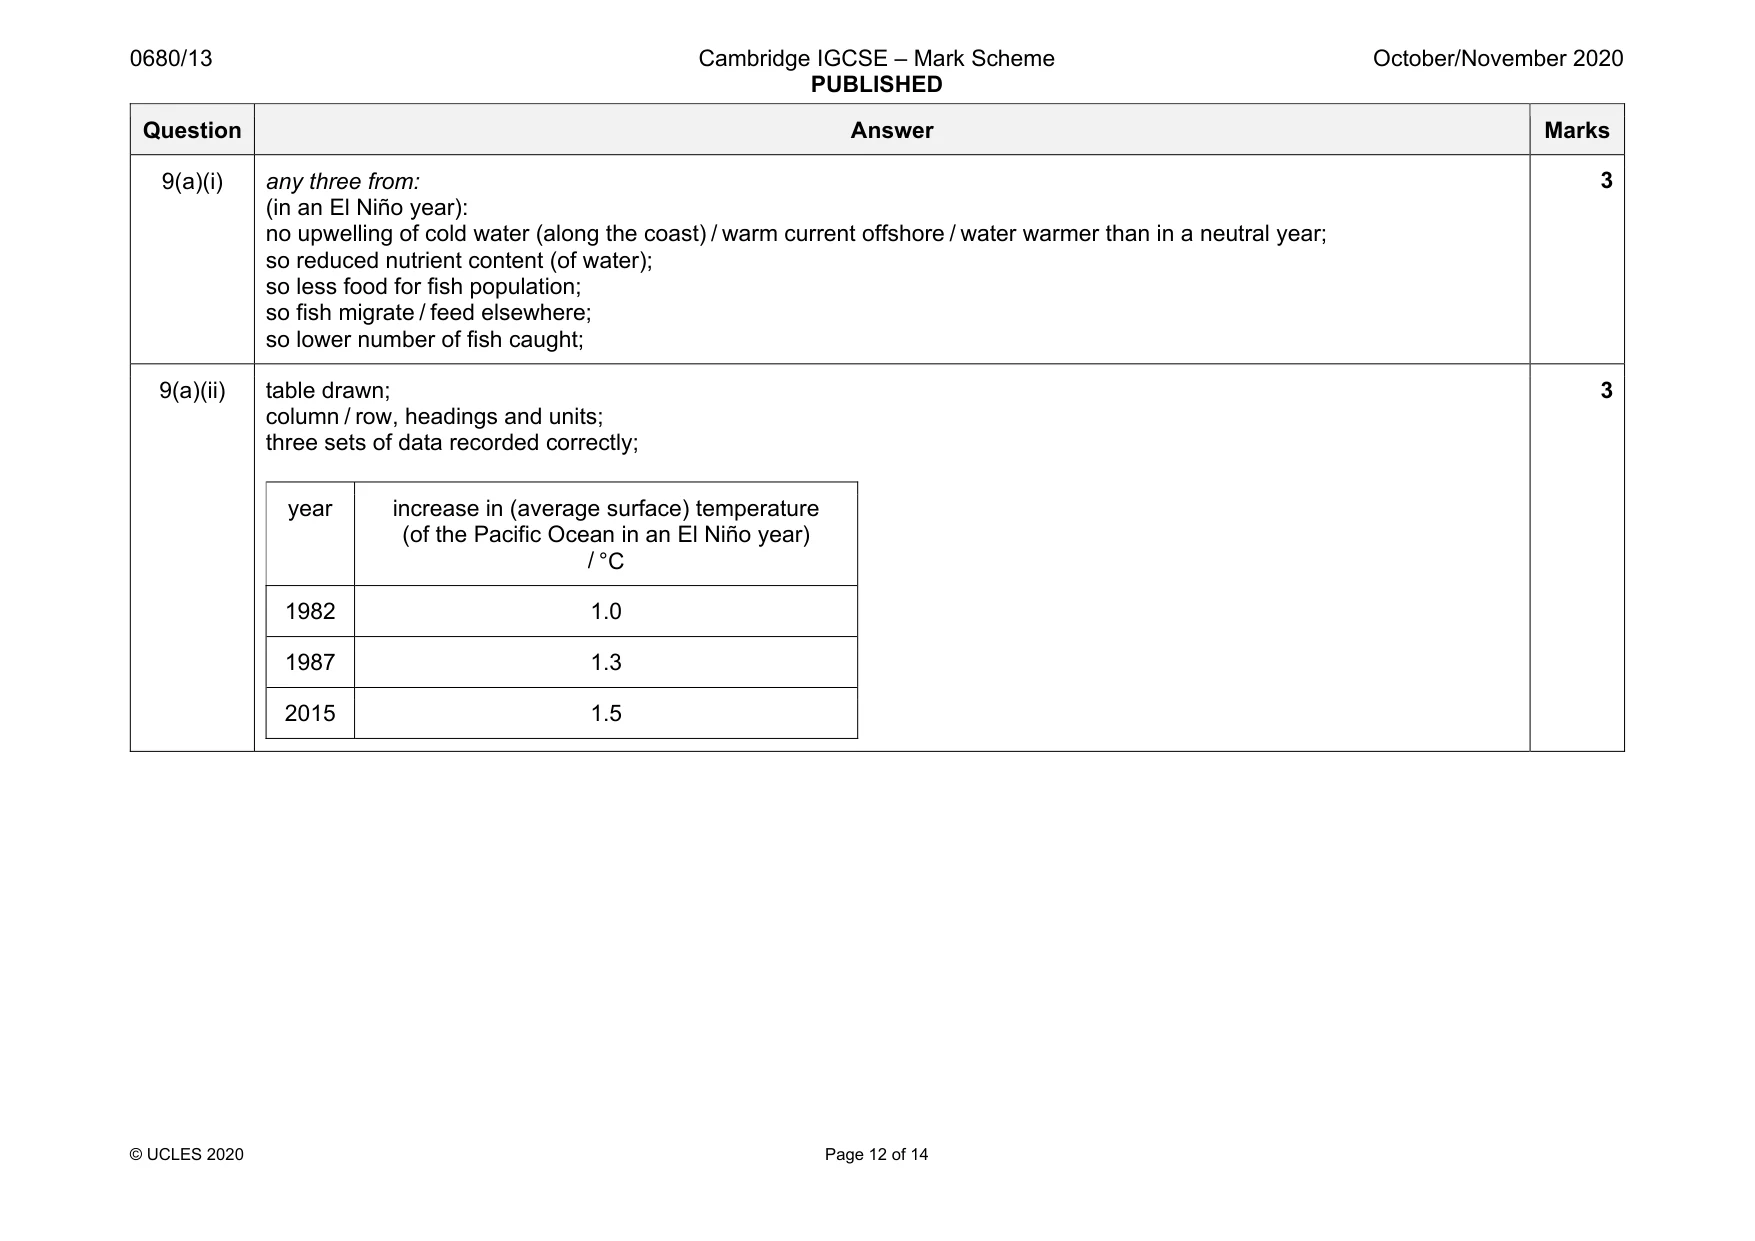
14 0680/13/O/N/20 © UCLES 2020 9 A student reads an article about the El Niño Southern Oscillation (ENSO) phenomenon along the Pacific coast of South America. El Niño The ENSO phenomenon has three main phases: El Niño (warming phase), La Niña (cooling phase) and neutral (normal phase). In El Niño years, the numbers of fish caught by local fishermen are different from the numbers of fish caught in neutral (normal) years. Weather systems are affected: drought can occur in some countries, and flooding can occur in other countries. There is no regular pattern to when El Niño years will happen. Countries monitor the temperature of the surface of the Pacific Ocean to predict an El Niño year. Several months of higher-than-average temperatures indicate an El Niño year will happen. In the El Niño year of 1982, the Pacific Ocean temperature was 1.0 °C above average for a neutral year. In 1987, it was 1.3 °C higher than a neutral year. In 2015, it was 1.5 °C higher. (a) (i) Explain why the numbers of fish caught along the Pacific coast of South America change in El Niño years compared to neutral years. … … … … … … [3] (ii) Present the data from the article in a suitable table to show the increase in average surface temperature of the Pacific Ocean in the El Niño years stated. [3]
Question paper, page 15
15 0680/13/O/N/20 © UCLES 2020 (b) The student says, There is no need for countries to monitor the ENSO phenomenon because nothing can stop it from happening. To what extent do you agree with this statement? Give reasons for your answer. … … … … … … … … … … … … … … … [6] [Total: 12]
Question paper, page 16
16 0680/13/O/N/20 © UCLES 2020 BLANK PAGE The boundaries and names shown, the designations used and the presentation of material on the maps contained in this question paper/insert do not imply official endorsement or acceptance by Cambridge Assessment International Education concerning the legal status of any country, territory, or area or any of its authorities, or of the delimitation of its frontiers or boundaries. Permission to reproduce items where third-party owned material protected by copyright is included has been sought and cleared where possible. Every reasonable effort has been made by the publisher (UCLES) to trace copyright holders, but if any items requiring clearance have unwittingly been included, the publisher will be pleased to make amends at the earliest possible opportunity. To avoid the issue of disclosure of answer-related information to candidates, all copyright acknowledgements are reproduced online in the Cambridge Assessment International Education Copyright Acknowledgements Booklet. This is produced for each series of examinations and is freely available to download at www.cambridgeinternational.org after the live examination series. Cambridge Assessment International Education is part of the Cambridge Assessment Group. Cambridge Assessment is the brand name of the University of Cambridge Local Examinations Syndicate (UCLES), which itself is a department of the University of Cambridge.
Mark scheme, page 1
This document consists of 14 printed pages. © UCLES 2020 [Turn over Cambridge IGCSE™ ENVIRONMENTAL MANAGEMENT 0680/13 Paper 1 Theory October/November 2020 MARK SCHEME Maximum Mark: 80 Published This mark scheme is published as an aid to teachers and candidates, to indicate the requirements of the examination. It shows the basis on which Examiners were instructed to award marks. It does not indicate the details of the discussions that took place at an Examiners’ meeting before marking began, which would have considered the acceptability of alternative answers. Mark schemes should be read in conjunction with the question paper and the Principal Examiner Report for Teachers. Cambridge International will not enter into discussions about these mark schemes. Cambridge International is publishing the mark schemes for the October/November 2020 series for most Cambridge IGCSE, Cambridge International A and AS Level and Cambridge Pre-U components, and some Cambridge O Level components.
Mark scheme, page 2
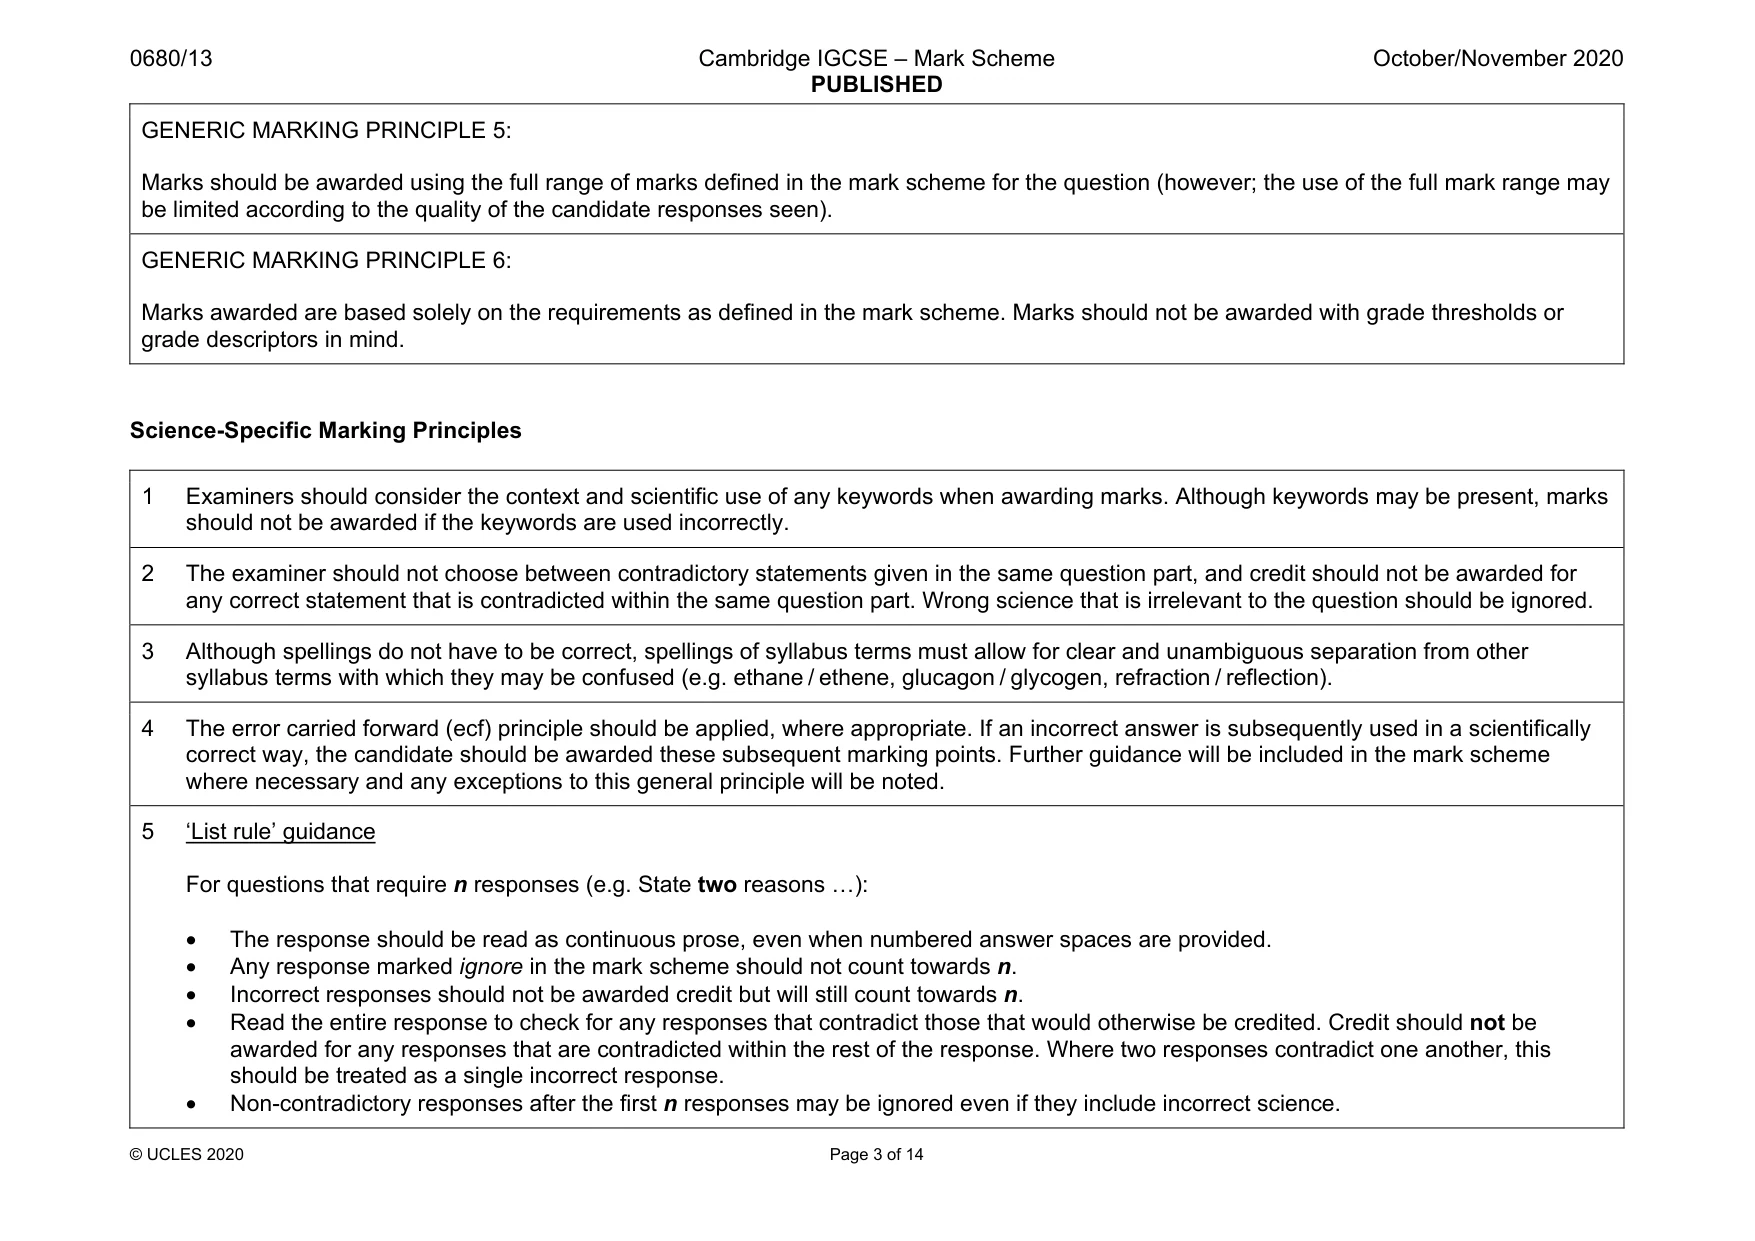
0680/13 Cambridge IGCSE – Mark Scheme PUBLISHED October/November 2020 © UCLES 2020 Page 2 of 14 Generic Marking Principles These general marking principles must be applied by all examiners when marking candidate answers. They should be applied alongside the specific content of the mark scheme or generic level descriptors for a question. Each question paper and mark scheme will also comply with these marking principles. GENERIC MARKING PRINCIPLE 1: Marks must be awarded in line with: • the specific content of the mark scheme or the generic level descriptors for the question • the specific skills defined in the mark scheme or in the generic level descriptors for the question • the standard of response required by a candidate as exemplified by the standardisation scripts. GENERIC MARKING PRINCIPLE 2: Marks awarded are always whole marks (not half marks, or other fractions). GENERIC MARKING PRINCIPLE 3: Marks must be awarded positively: • marks are awarded for correct/valid answers, as defined in the mark scheme. However, credit is given for valid answers which go beyond the scope of the syllabus and mark scheme, referring to your Team Leader as appropriate • marks are awarded when candidates clearly demonstrate what they know and can do • marks are not deducted for errors • marks are not deducted for omissions • answers should only be judged on the quality of spelling, punctuation and grammar when these features are specifically assessed by the question as indicated by the mark scheme. The meaning, however, should be unambiguous. GENERIC MARKING PRINCIPLE 4: Rules must be applied consistently, e.g. in situations where candidates have not followed instructions or in the application of generic level descriptors.
Mark scheme, page 3
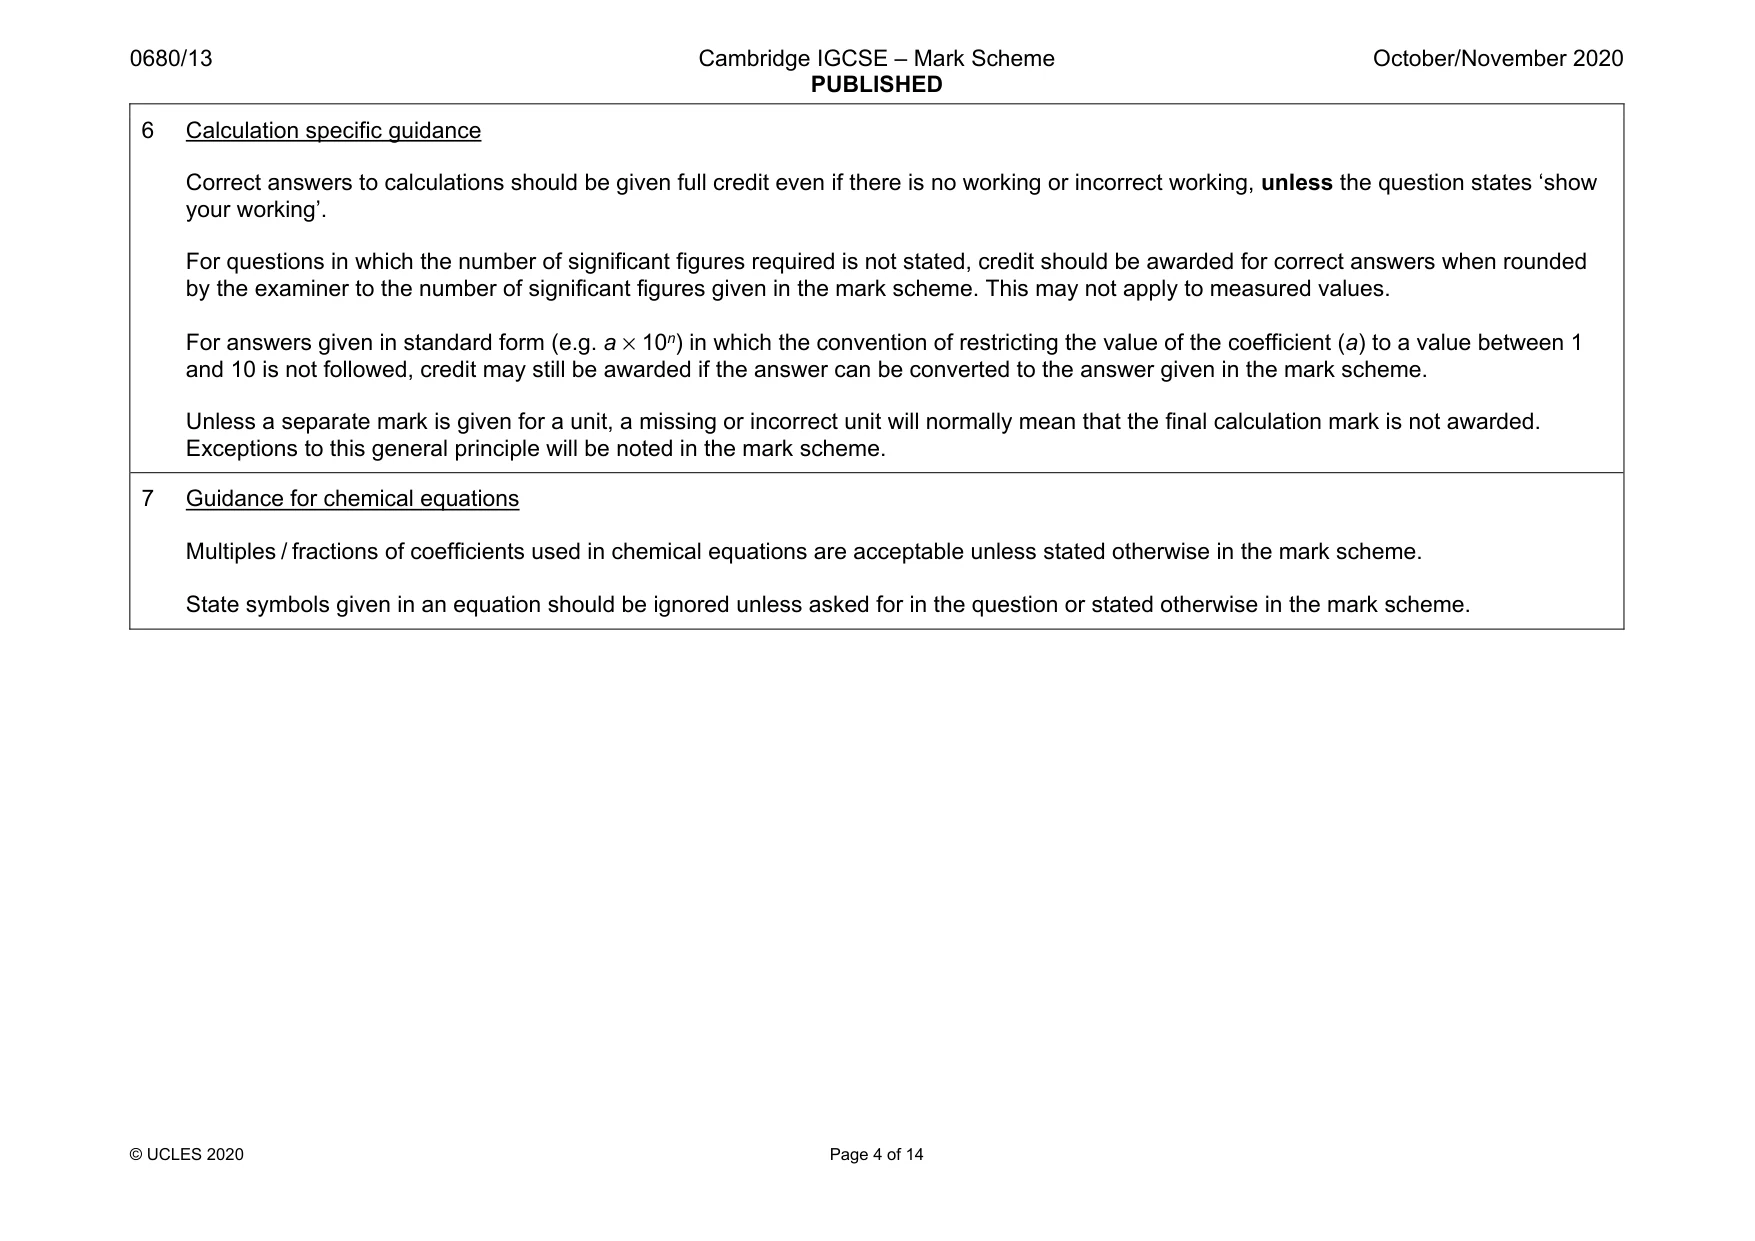
0680/13 Cambridge IGCSE – Mark Scheme PUBLISHED October/November 2020 © UCLES 2020 Page 3 of 14 GENERIC MARKING PRINCIPLE 5: Marks should be awarded using the full range of marks defined in the mark scheme for the question (however; the use of the full mark range may be limited according to the quality of the candidate responses seen). GENERIC MARKING PRINCIPLE 6: Marks awarded are based solely on the requirements as defined in the mark scheme. Marks should not be awarded with grade thresholds or grade descriptors in mind. Science-Specific Marking Principles 1 Examiners should consider the context and scientific use of any keywords when awarding marks. Although keywords may be present, marks should not be awarded if the keywords are used incorrectly. 2 The examiner should not choose between contradictory statements given in the same question part, and credit should not be awarded for any correct statement that is contradicted within the same question part. Wrong science that is irrelevant to the question should be ignored. 3 Although spellings do not have to be correct, spellings of syllabus terms must allow for clear and unambiguous separation from other syllabus terms with which they may be confused (e.g. ethane / ethene, glucagon / glycogen, refraction / reflection). 4 The error carried forward (ecf) principle should be applied, where appropriate. If an incorrect answer is subsequently used in a scientifically correct way, the candidate should be awarded these subsequent marking points. Further guidance will be included in the mark scheme where necessary and any exceptions to this general principle will be noted. 5 ‘List rule’ guidance For questions that require n responses (e.g. State two reasons …): • The response should be read as continuous prose, even when numbered answer spaces are provided. • Any response marked ignore in the mark scheme should not count towards n. • Incorrect responses should not be awarded credit but will still count towards n. • Read the entire response to check for any responses that contradict those that would otherwise be credited. Credit should not be awarded for any responses that are contradicted within the rest of the response. Where two responses contradict one another, this should be treated as a single incorrect response. • Non-contradictory responses after the first n responses may be ignored even if they include incorrect science.
Mark scheme, page 4
0680/13 Cambridge IGCSE – Mark Scheme PUBLISHED October/November 2020 © UCLES 2020 Page 4 of 14 6 Calculation specific guidance Correct answers to calculations should be given full credit even if there is no working or incorrect working, unless the question states ‘show your working’. For questions in which the number of significant figures required is not stated, credit should be awarded for correct answers when rounded by the examiner to the number of significant figures given in the mark scheme. This may not apply to measured values. For answers given in standard form (e.g. a × 10n) in which the convention of restricting the value of the coefficient (a) to a value between 1 and 10 is not followed, credit may still be awarded if the answer can be converted to the answer given in the mark scheme. Unless a separate mark is given for a unit, a missing or incorrect unit will normally mean that the final calculation mark is not awarded. Exceptions to this general principle will be noted in the mark scheme. 7 Guidance for chemical equations Multiples / fractions of coefficients used in chemical equations are acceptable unless stated otherwise in the mark scheme. State symbols given in an equation should be ignored unless asked for in the question or stated otherwise in the mark scheme.
Mark scheme, page 5
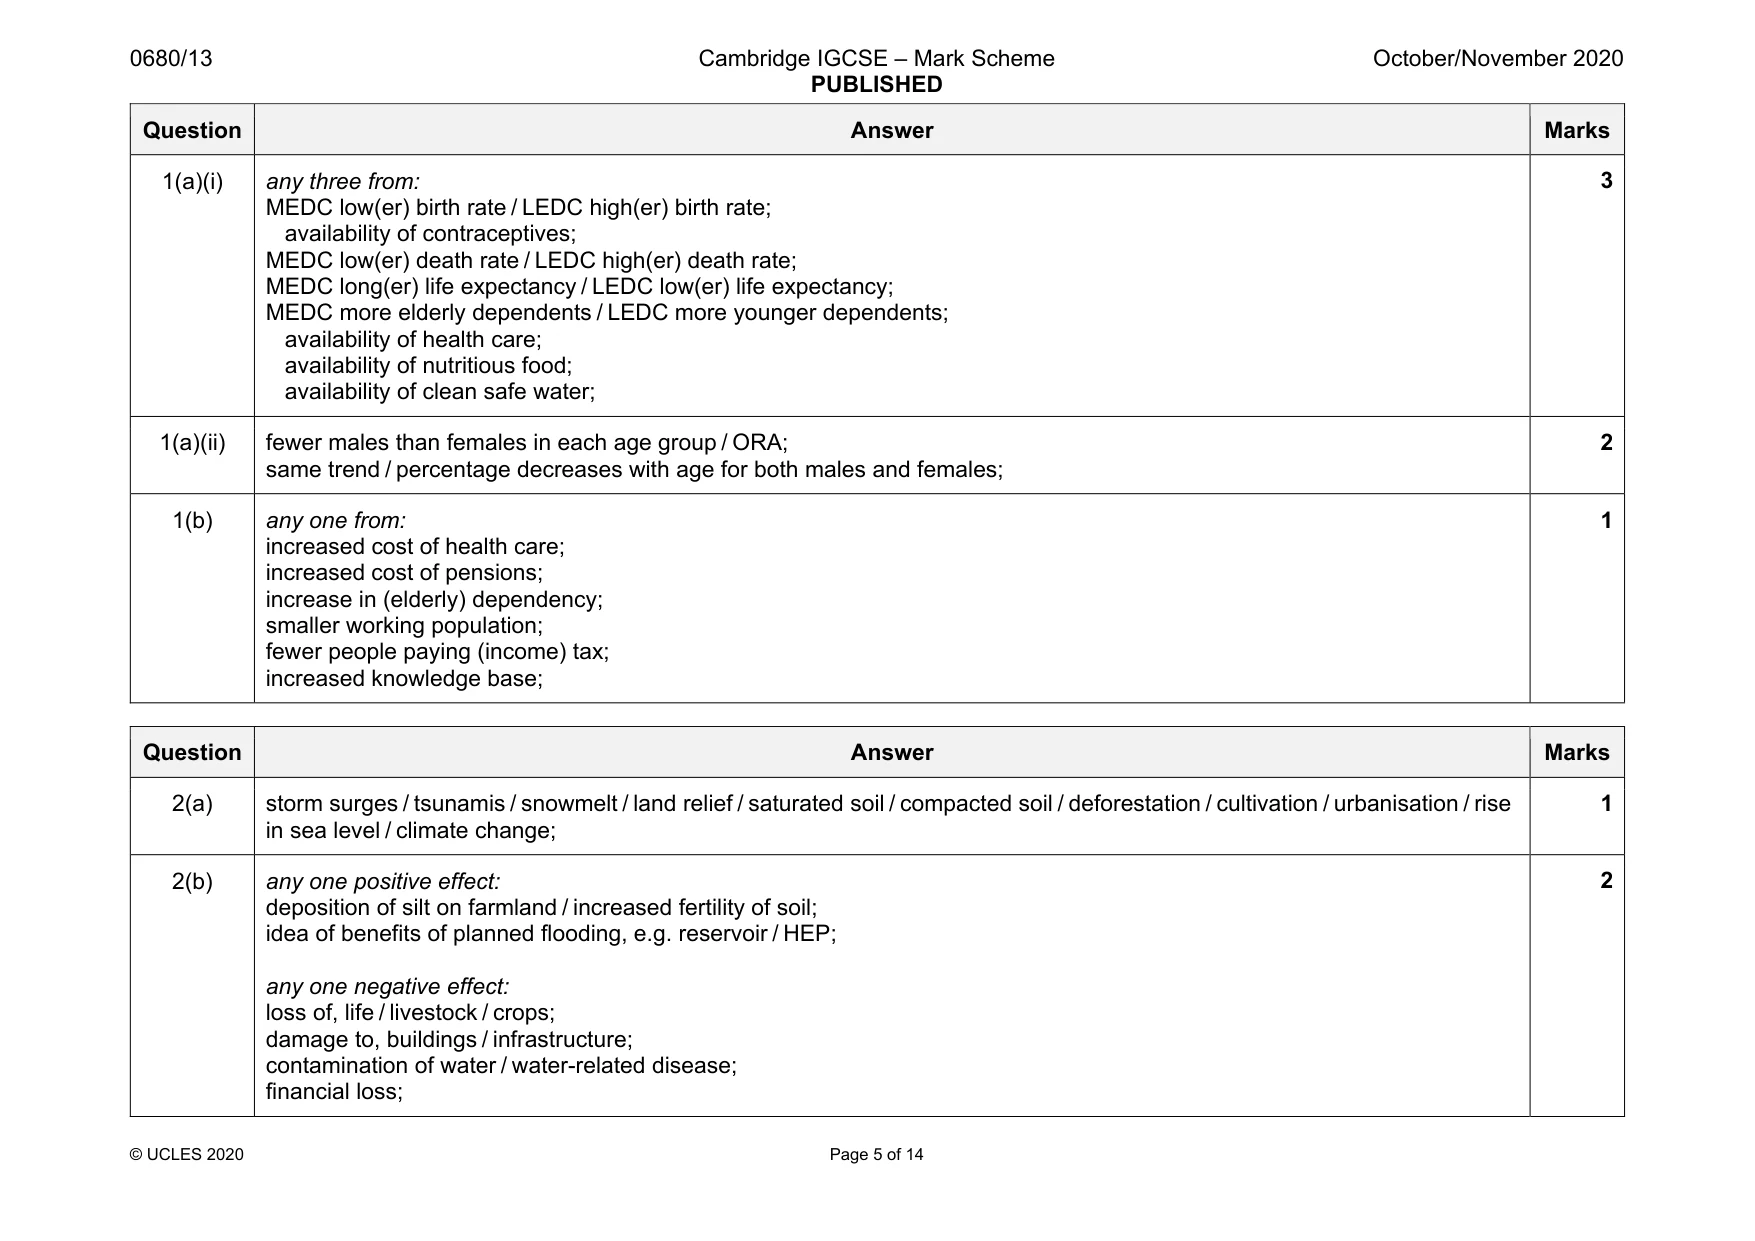
0680/13 Cambridge IGCSE – Mark Scheme PUBLISHED October/November 2020 © UCLES 2020 Page 5 of 14 Question Answer Marks 1(a)(i) any three from: MEDC low(er) birth rate / LEDC high(er) birth rate; availability of contraceptives; MEDC low(er) death rate / LEDC high(er) death rate; MEDC long(er) life expectancy / LEDC low(er) life expectancy; MEDC more elderly dependents / LEDC more younger dependents; availability of health care; availability of nutritious food; availability of clean safe water; 3 1(a)(ii) fewer males than females in each age group / ORA; same trend / percentage decreases with age for both males and females; 2 1(b) any one from: increased cost of health care; increased cost of pensions; increase in (elderly) dependency; smaller working population; fewer people paying (income) tax; increased knowledge base; 1 Question Answer Marks 2(a) storm surges / tsunamis / snowmelt / land relief / saturated soil / compacted soil / deforestation / cultivation / urbanisation / rise in sea level / climate change; 1 2(b) any one positive effect: deposition of silt on farmland / increased fertility of soil; idea of benefits of planned flooding, e.g. reservoir / HEP; any one negative effect: loss of, life / livestock / crops; damage to, buildings / infrastructure; contamination of water / water-related disease; financial loss; 2
Mark scheme, page 6
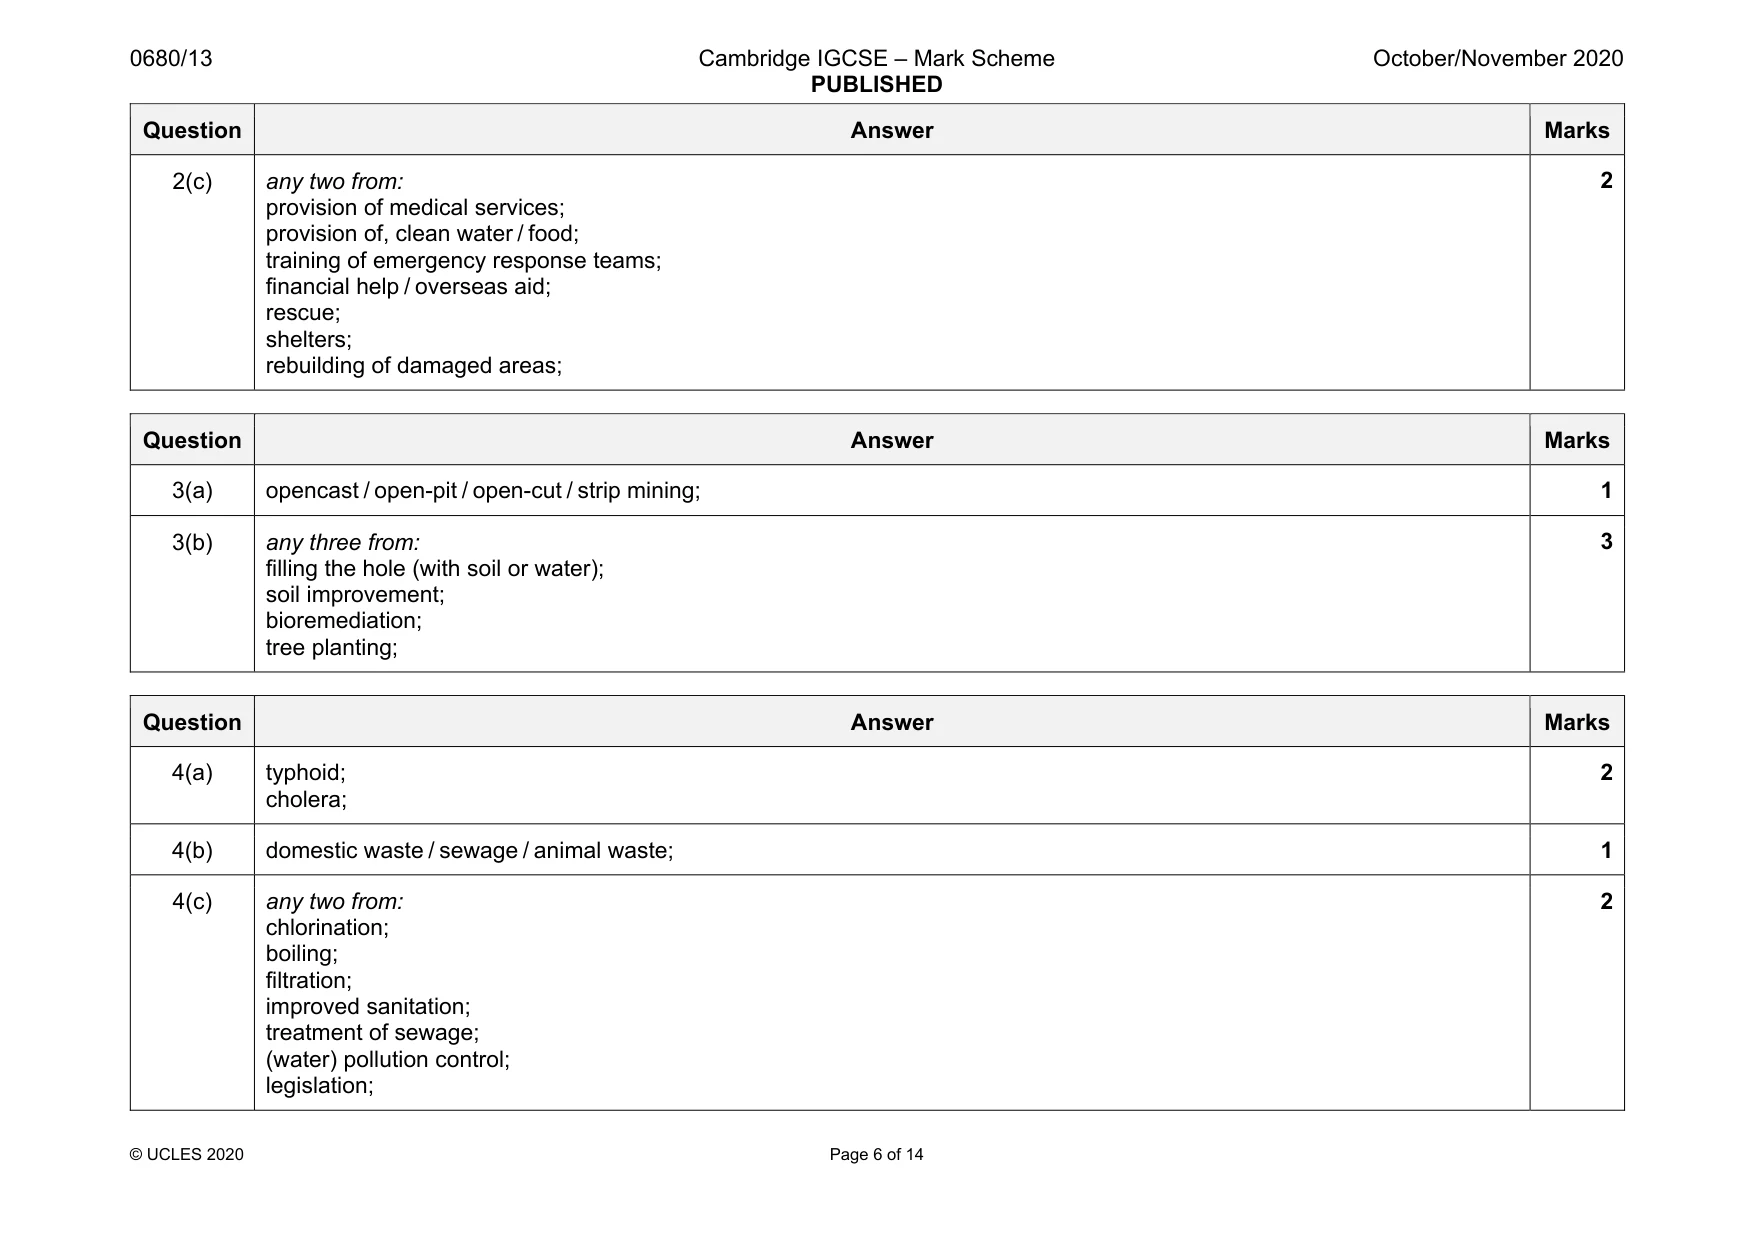
0680/13 Cambridge IGCSE – Mark Scheme PUBLISHED October/November 2020 © UCLES 2020 Page 6 of 14 Question Answer Marks 2(c) any two from: provision of medical services; provision of, clean water / food; training of emergency response teams; financial help / overseas aid; rescue; shelters; rebuilding of damaged areas; 2 Question Answer Marks 3(a) opencast / open-pit / open-cut / strip mining; 1 3(b) any three from: filling the hole (with soil or water); soil improvement; bioremediation; tree planting; 3 Question Answer Marks 4(a) typhoid; cholera; 2 4(b) domestic waste / sewage / animal waste; 1 4(c) any two from: chlorination; boiling; filtration; improved sanitation; treatment of sewage; (water) pollution control; legislation; 2
Mark scheme, page 7
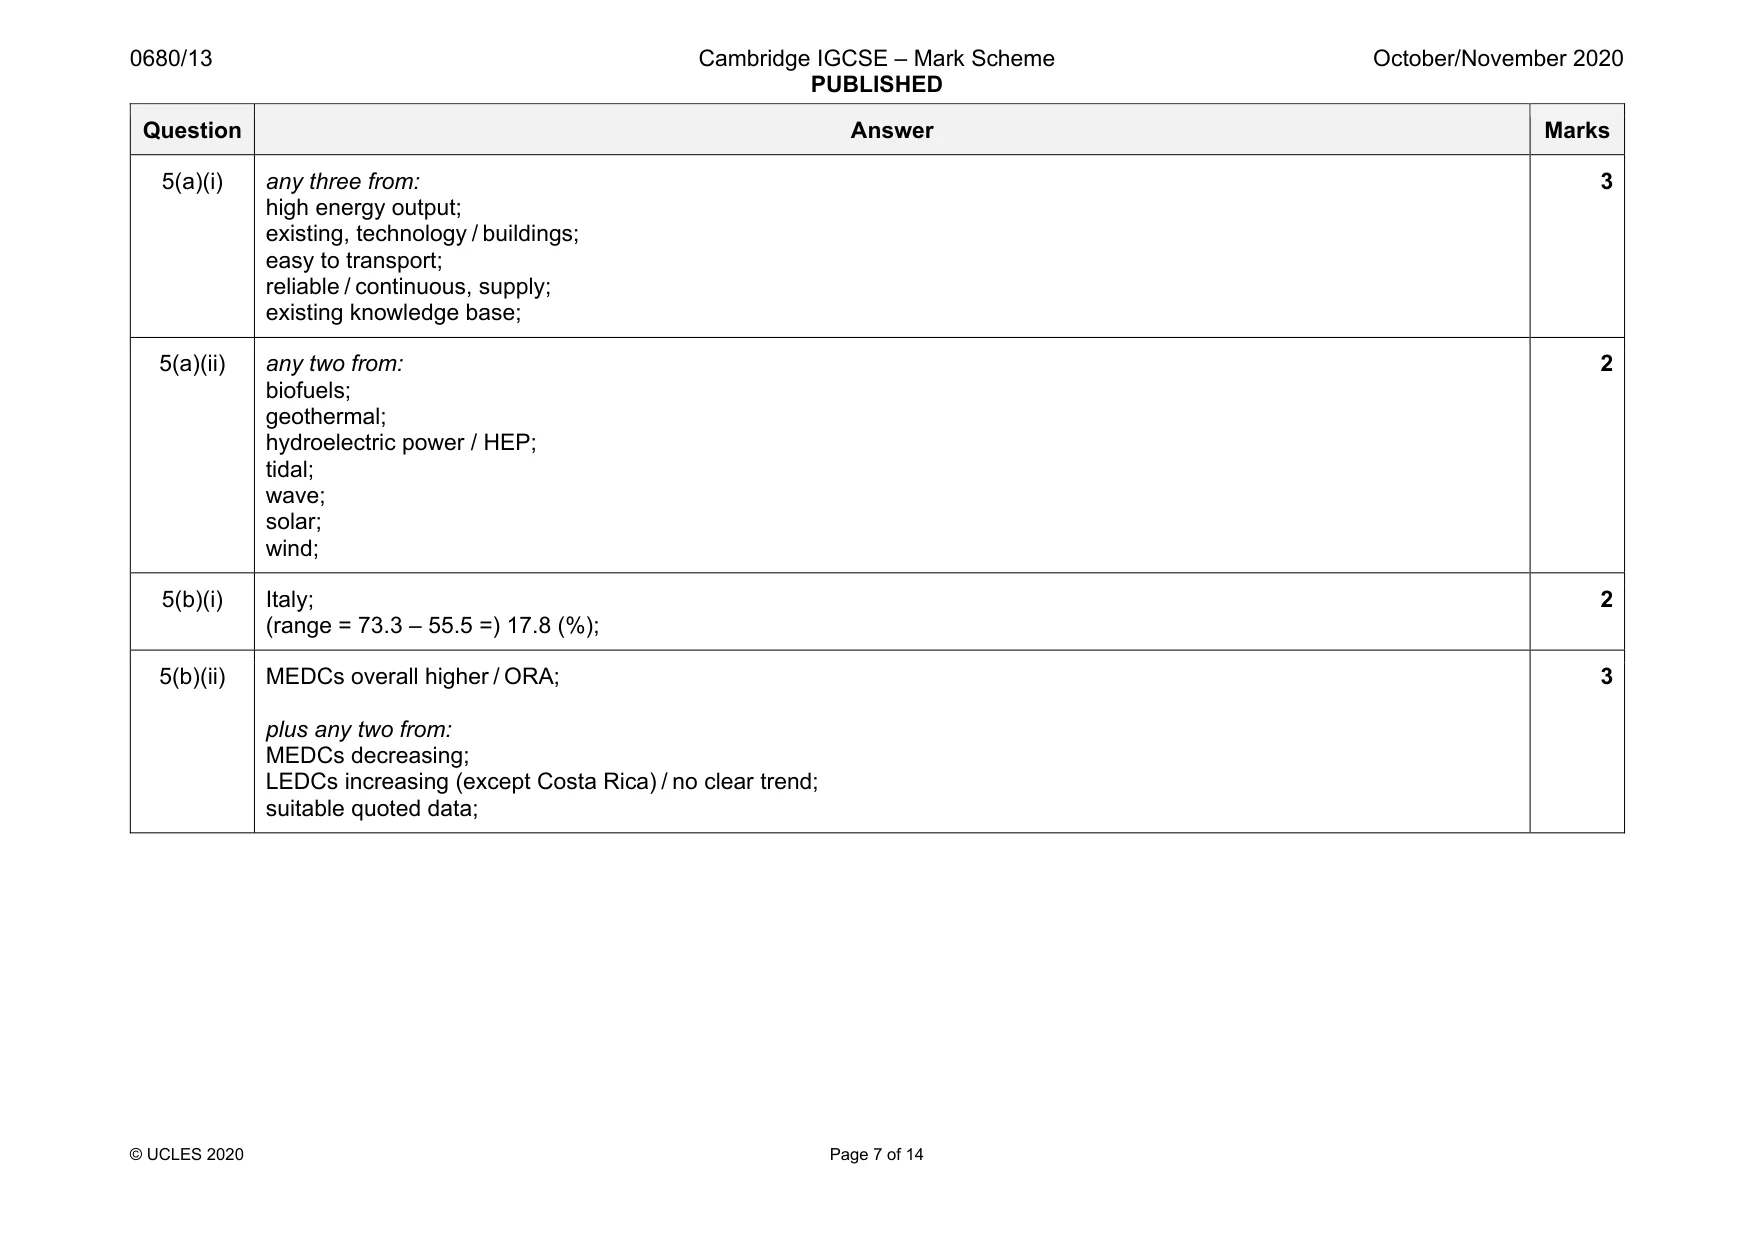
0680/13 Cambridge IGCSE – Mark Scheme PUBLISHED October/November 2020 © UCLES 2020 Page 7 of 14 Question Answer Marks 5(a)(i) any three from: high energy output; existing, technology / buildings; easy to transport; reliable / continuous, supply; existing knowledge base; 3 5(a)(ii) any two from: biofuels; geothermal; hydroelectric power / HEP; tidal; wave; solar; wind; 2 5(b)(i) Italy; (range = 73.3 – 55.5 =) 17.8 (%); 2 5(b)(ii) MEDCs overall higher / ORA; plus any two from: MEDCs decreasing; LEDCs increasing (except Costa Rica) / no clear trend; suitable quoted data; 3
Mark scheme, page 8
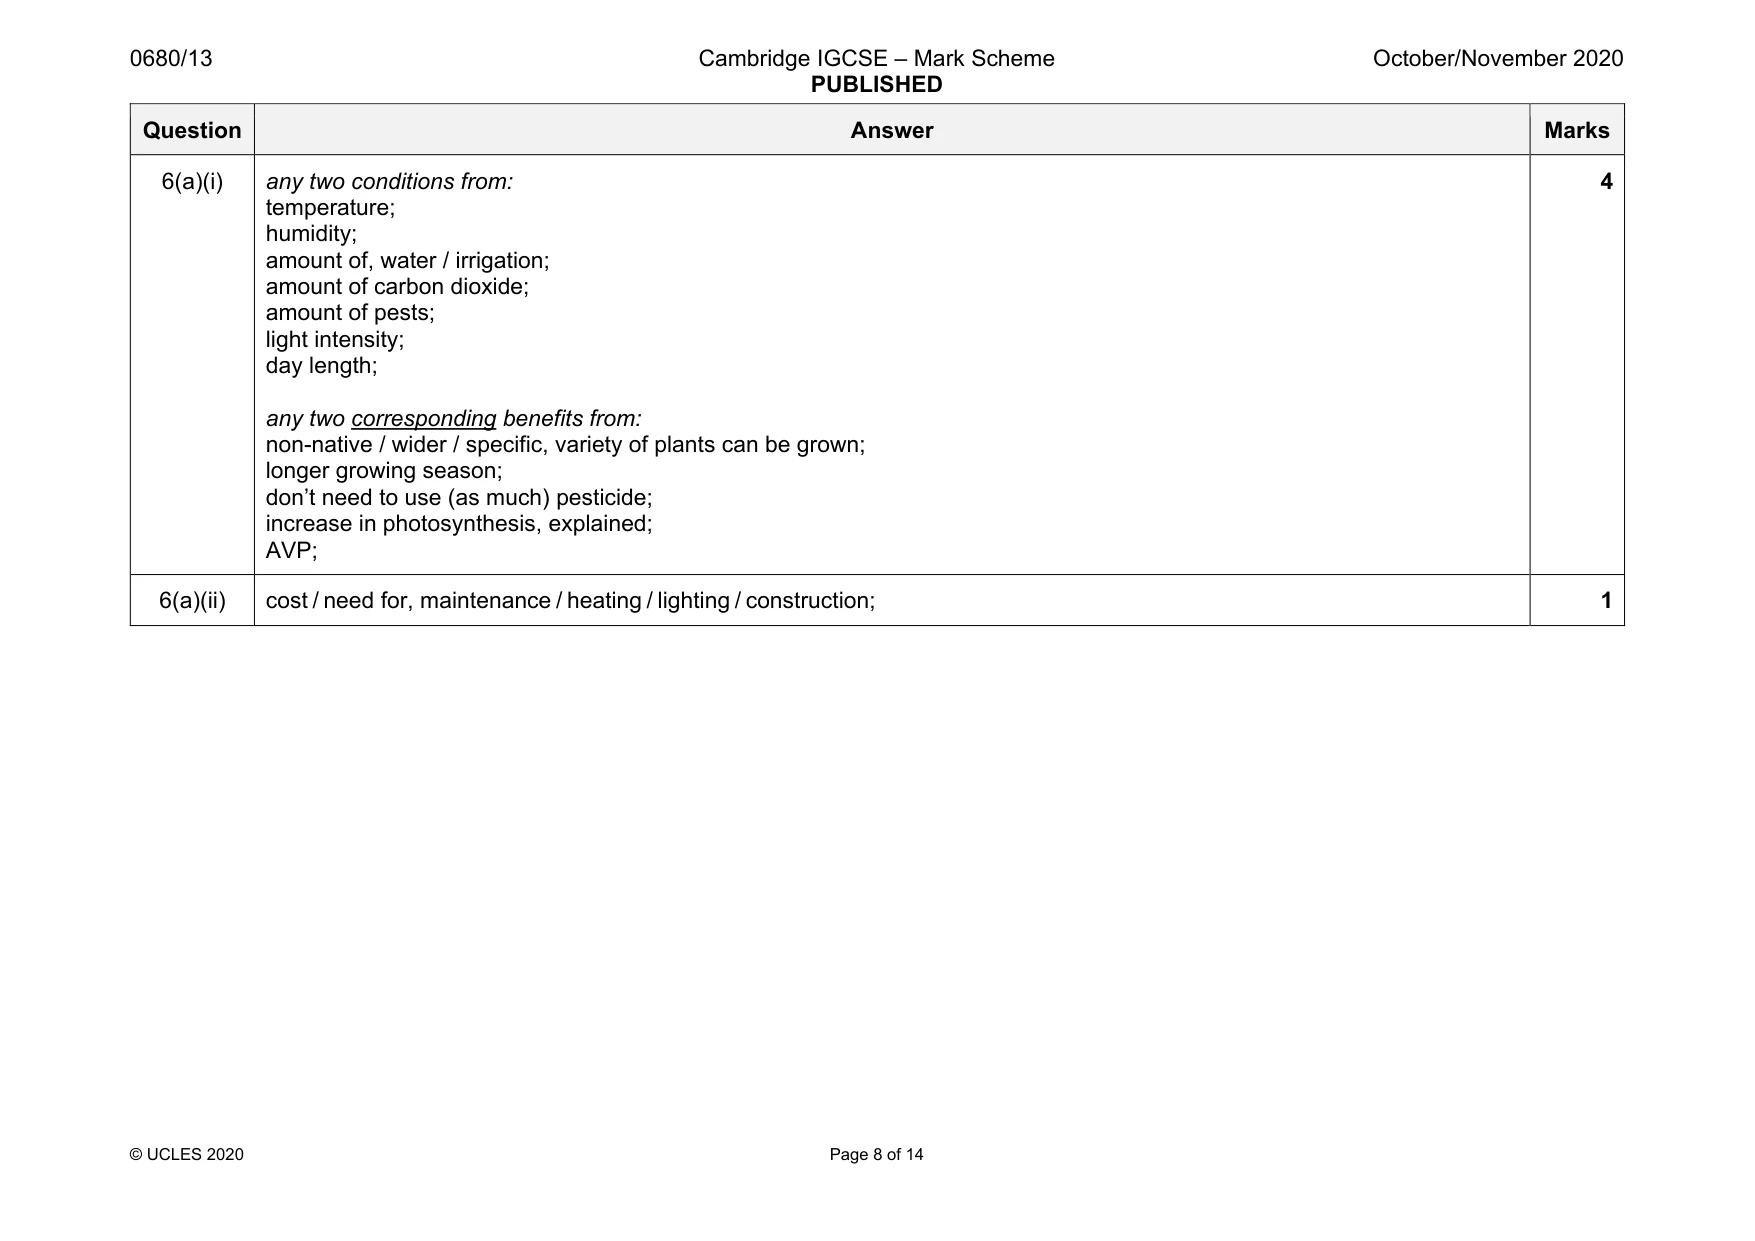
0680/13 Cambridge IGCSE – Mark Scheme PUBLISHED October/November 2020 © UCLES 2020 Page 8 of 14 Question Answer Marks 6(a)(i) any two conditions from: temperature; humidity; amount of, water / irrigation; amount of carbon dioxide; amount of pests; light intensity; day length; any two corresponding benefits from: non-native / wider / specific, variety of plants can be grown; longer growing season; don’t need to use (as much) pesticide; increase in photosynthesis, explained; AVP; 4 6(a)(ii) cost / need for, maintenance / heating / lighting / construction; 1
Mark scheme, page 9
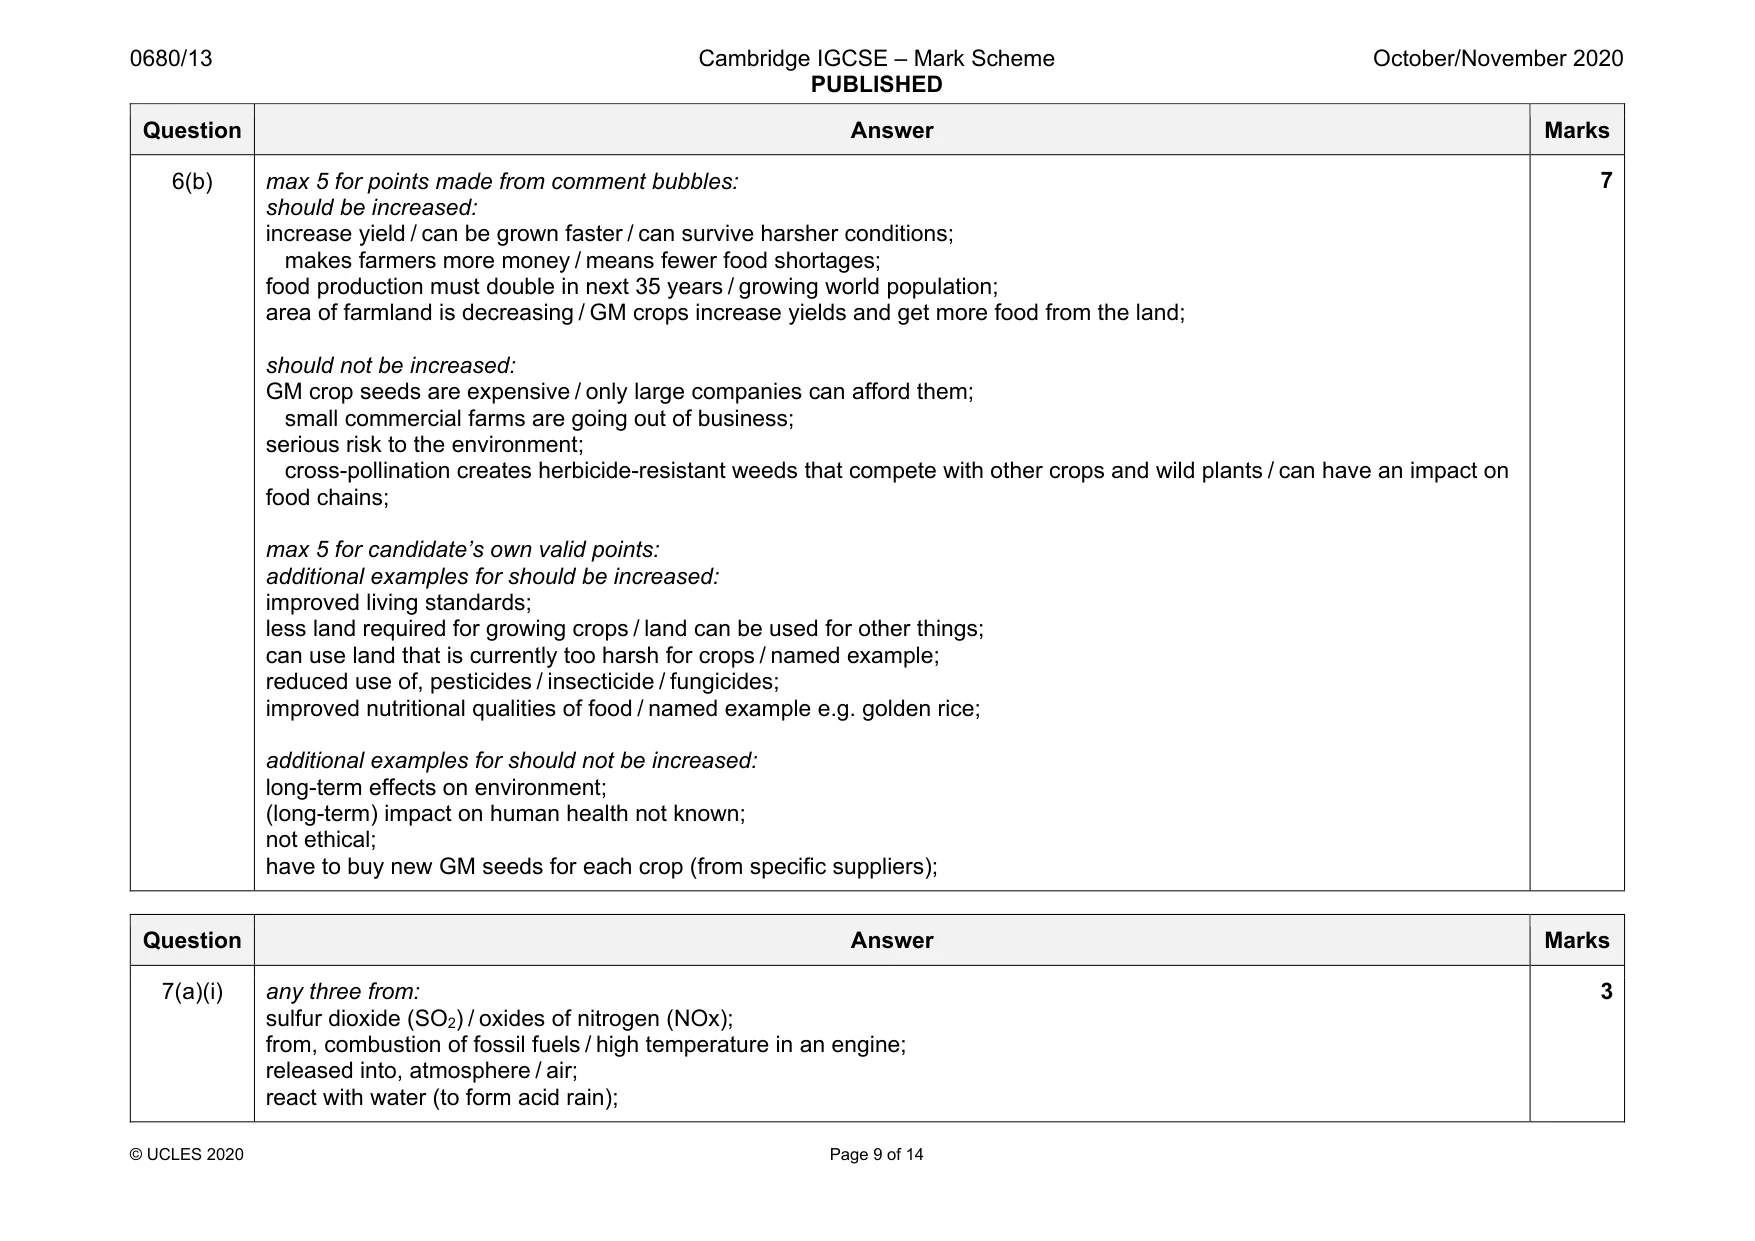
0680/13 Cambridge IGCSE – Mark Scheme PUBLISHED October/November 2020 © UCLES 2020 Page 9 of 14 Question Answer Marks 6(b) max 5 for points made from comment bubbles: should be increased: increase yield / can be grown faster / can survive harsher conditions; makes farmers more money / means fewer food shortages; food production must double in next 35 years / growing world population; area of farmland is decreasing / GM crops increase yields and get more food from the land; should not be increased: GM crop seeds are expensive / only large companies can afford them; small commercial farms are going out of business; serious risk to the environment; cross-pollination creates herbicide-resistant weeds that compete with other crops and wild plants / can have an impact on food chains; max 5 for candidate’s own valid points: additional examples for should be increased: improved living standards; less land required for growing crops / land can be used for other things; can use land that is currently too harsh for crops / named example; reduced use of, pesticides / insecticide / fungicides; improved nutritional qualities of food / named example e.g. golden rice; additional examples for should not be increased: long-term effects on environment; (long-term) impact on human health not known; not ethical; have to buy new GM seeds for each crop (from specific suppliers); 7 Question Answer Marks 7(a)(i) any three from: sulfur dioxide (SO2) / oxides of nitrogen (NOx); from, combustion of fossil fuels / high temperature in an engine; released into, atmosphere / air; react with water (to form acid rain); 3
Mark scheme, page 10
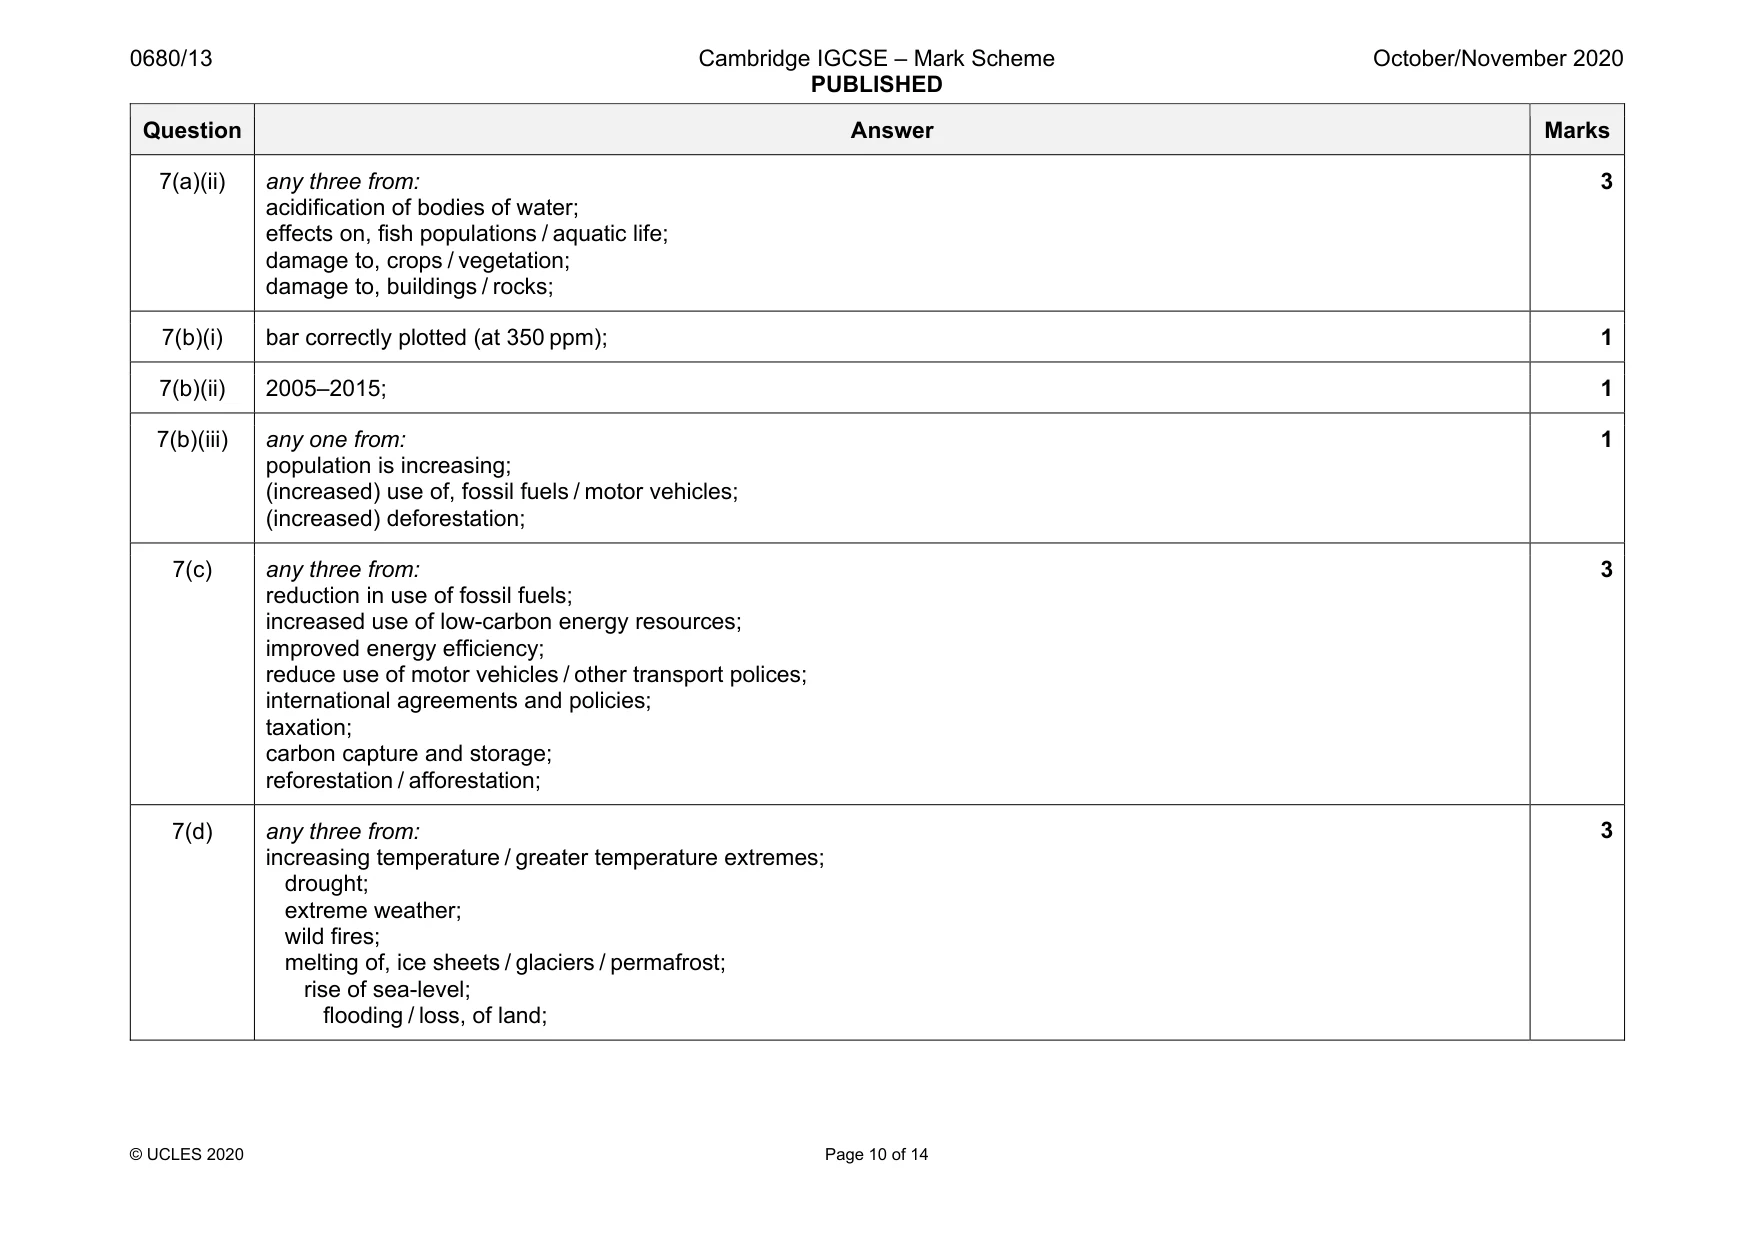
0680/13 Cambridge IGCSE – Mark Scheme PUBLISHED October/November 2020 © UCLES 2020 Page 10 of 14 Question Answer Marks 7(a)(ii) any three from: acidification of bodies of water; effects on, fish populations / aquatic life; damage to, crops / vegetation; damage to, buildings / rocks; 3 7(b)(i) bar correctly plotted (at 350 ppm); 1 7(b)(ii) 2005–2015; 1 7(b)(iii) any one from: population is increasing; (increased) use of, fossil fuels / motor vehicles; (increased) deforestation; 1 7(c) any three from: reduction in use of fossil fuels; increased use of low-carbon energy resources; improved energy efficiency; reduce use of motor vehicles / other transport polices; international agreements and policies; taxation; carbon capture and storage; reforestation / afforestation; 3 7(d) any three from: increasing temperature / greater temperature extremes; drought; extreme weather; wild fires; melting of, ice sheets / glaciers / permafrost; rise of sea-level; flooding / loss, of land; 3
Mark scheme, page 11
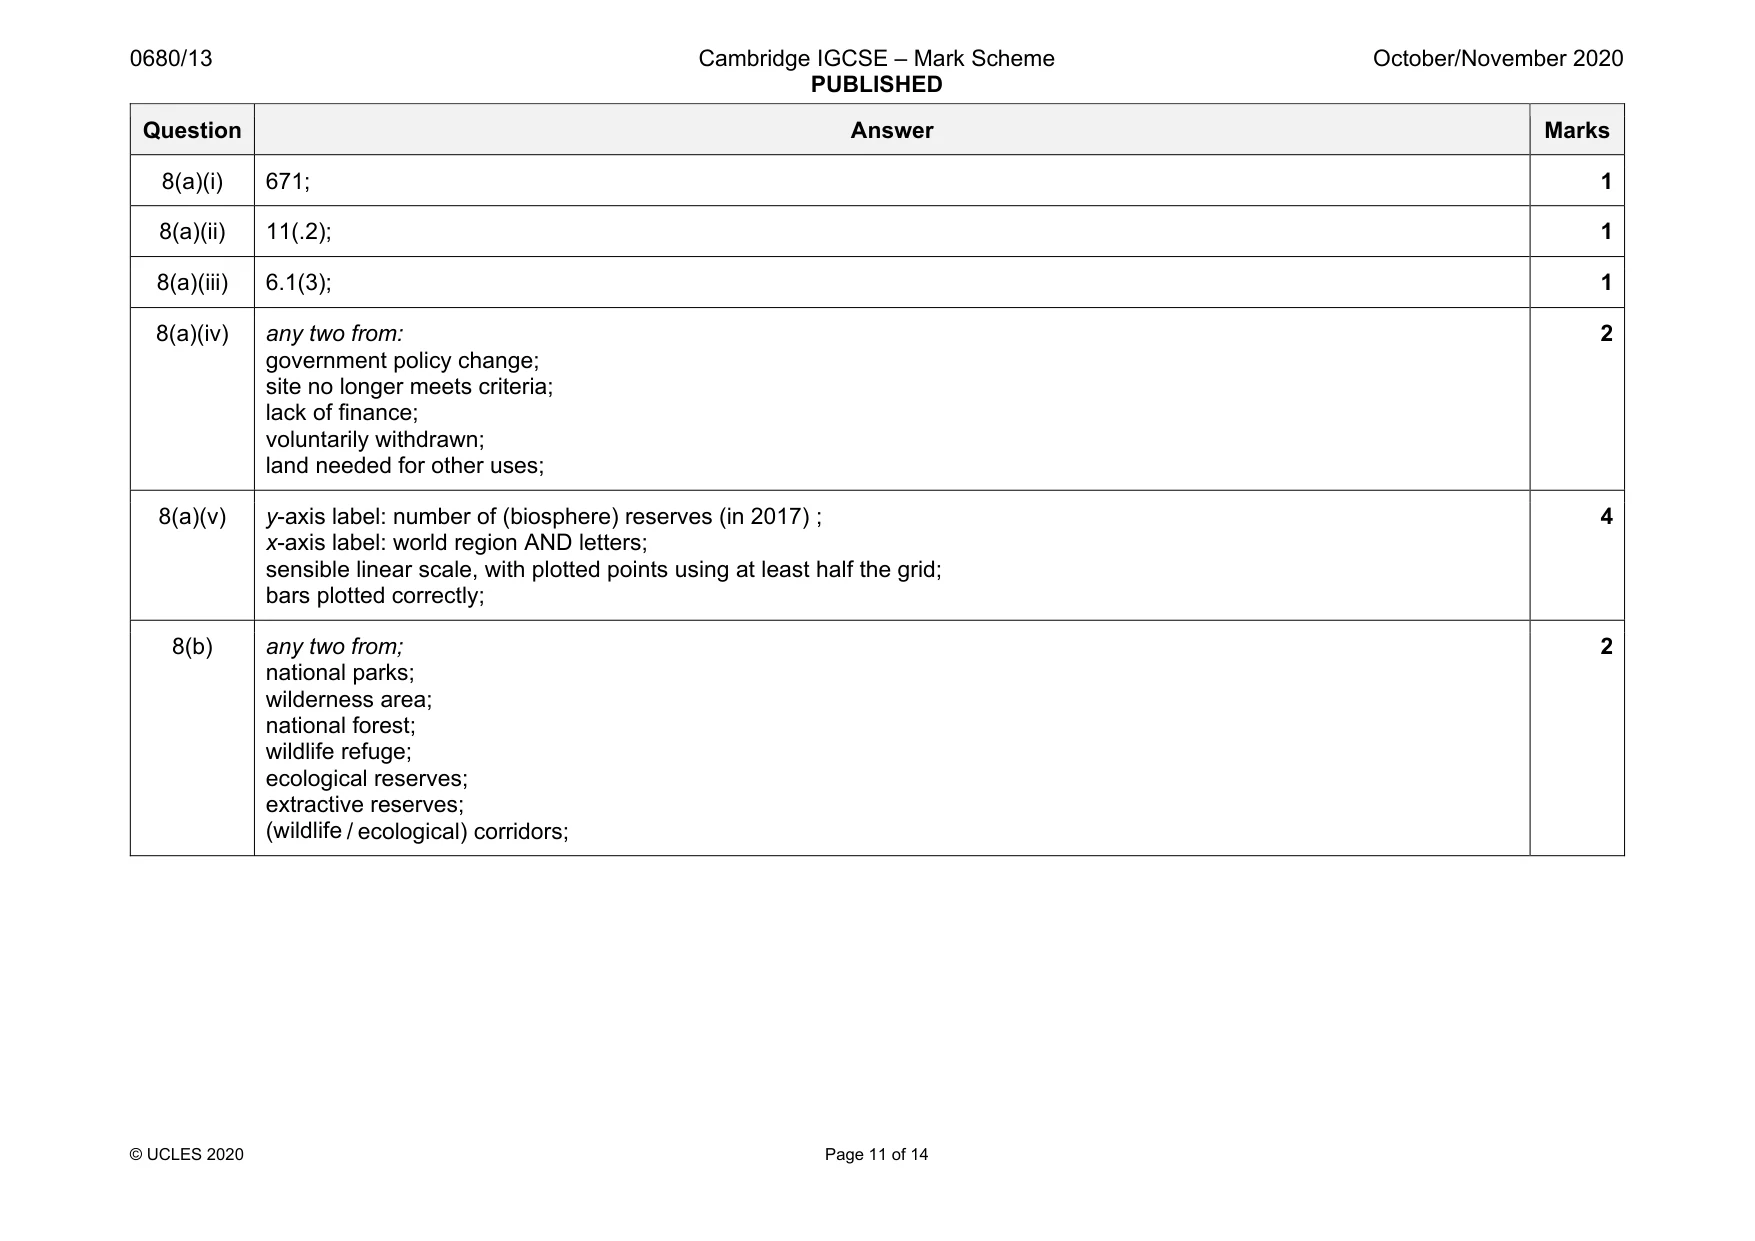
0680/13 Cambridge IGCSE – Mark Scheme PUBLISHED October/November 2020 © UCLES 2020 Page 11 of 14 Question Answer Marks 8(a)(i) 671; 1 8(a)(ii) 11(.2); 1 8(a)(iii) 6.1(3); 1 8(a)(iv) any two from: government policy change; site no longer meets criteria; lack of finance; voluntarily withdrawn; land needed for other uses; 2 8(a)(v) y-axis label: number of (biosphere) reserves (in 2017) ; x-axis label: world region AND letters; sensible linear scale, with plotted points using at least half the grid; bars plotted correctly; 4 8(b) any two from; national parks; wilderness area; national forest; wildlife refuge; ecological reserves; extractive reserves; (wildlife / ecological) corridors; 2
Mark scheme, page 12
0680/13 Cambridge IGCSE – Mark Scheme PUBLISHED October/November 2020 © UCLES 2020 Page 12 of 14 Question Answer Marks 9(a)(i) any three from: (in an El Niño year): no upwelling of cold water (along the coast) / warm current offshore / water warmer than in a neutral year; so reduced nutrient content (of water); so less food for fish population; so fish migrate / feed elsewhere; so lower number of fish caught; 3 9(a)(ii) table drawn; column / row, headings and units; three sets of data recorded correctly; year increase in (average surface) temperature (of the Pacific Ocean in an El Niño year) / °C 1982 1.0 1987 1.3 2015 1.5 3
Mark scheme, page 13
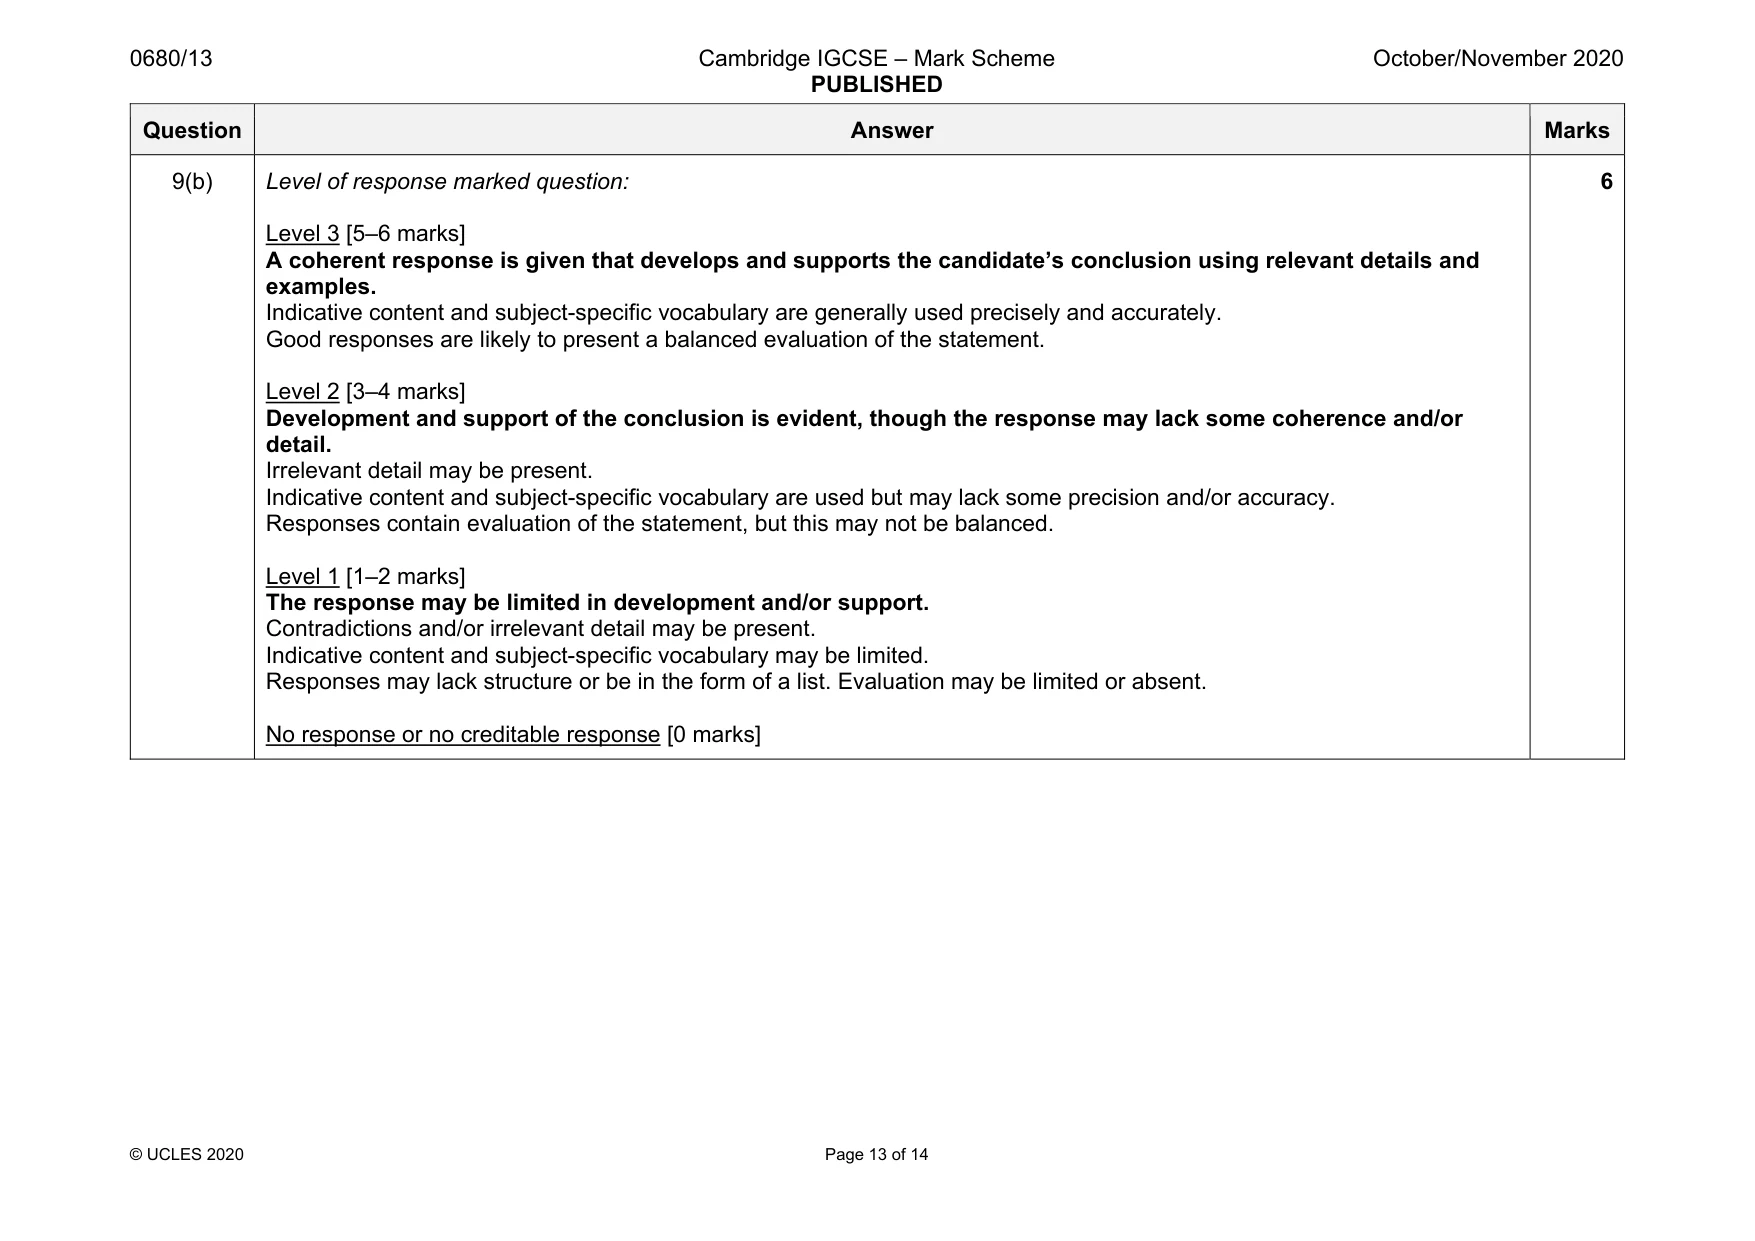
0680/13 Cambridge IGCSE – Mark Scheme PUBLISHED October/November 2020 © UCLES 2020 Page 13 of 14 Question Answer Marks 9(b) Level of response marked question: Level 3 [5–6 marks] A coherent response is given that develops and supports the candidate’s conclusion using relevant details and examples. Indicative content and subject-specific vocabulary are generally used precisely and accurately. Good responses are likely to present a balanced evaluation of the statement. Level 2 [3–4 marks] Development and support of the conclusion is evident, though the response may lack some coherence and/or detail. Irrelevant detail may be present. Indicative content and subject-specific vocabulary are used but may lack some precision and/or accuracy. Responses contain evaluation of the statement, but this may not be balanced. Level 1 [1–2 marks] The response may be limited in development and/or support. Contradictions and/or irrelevant detail may be present. Indicative content and subject-specific vocabulary may be limited. Responses may lack structure or be in the form of a list. Evaluation may be limited or absent. No response or no creditable response [0 marks] 6
Mark scheme, page 14
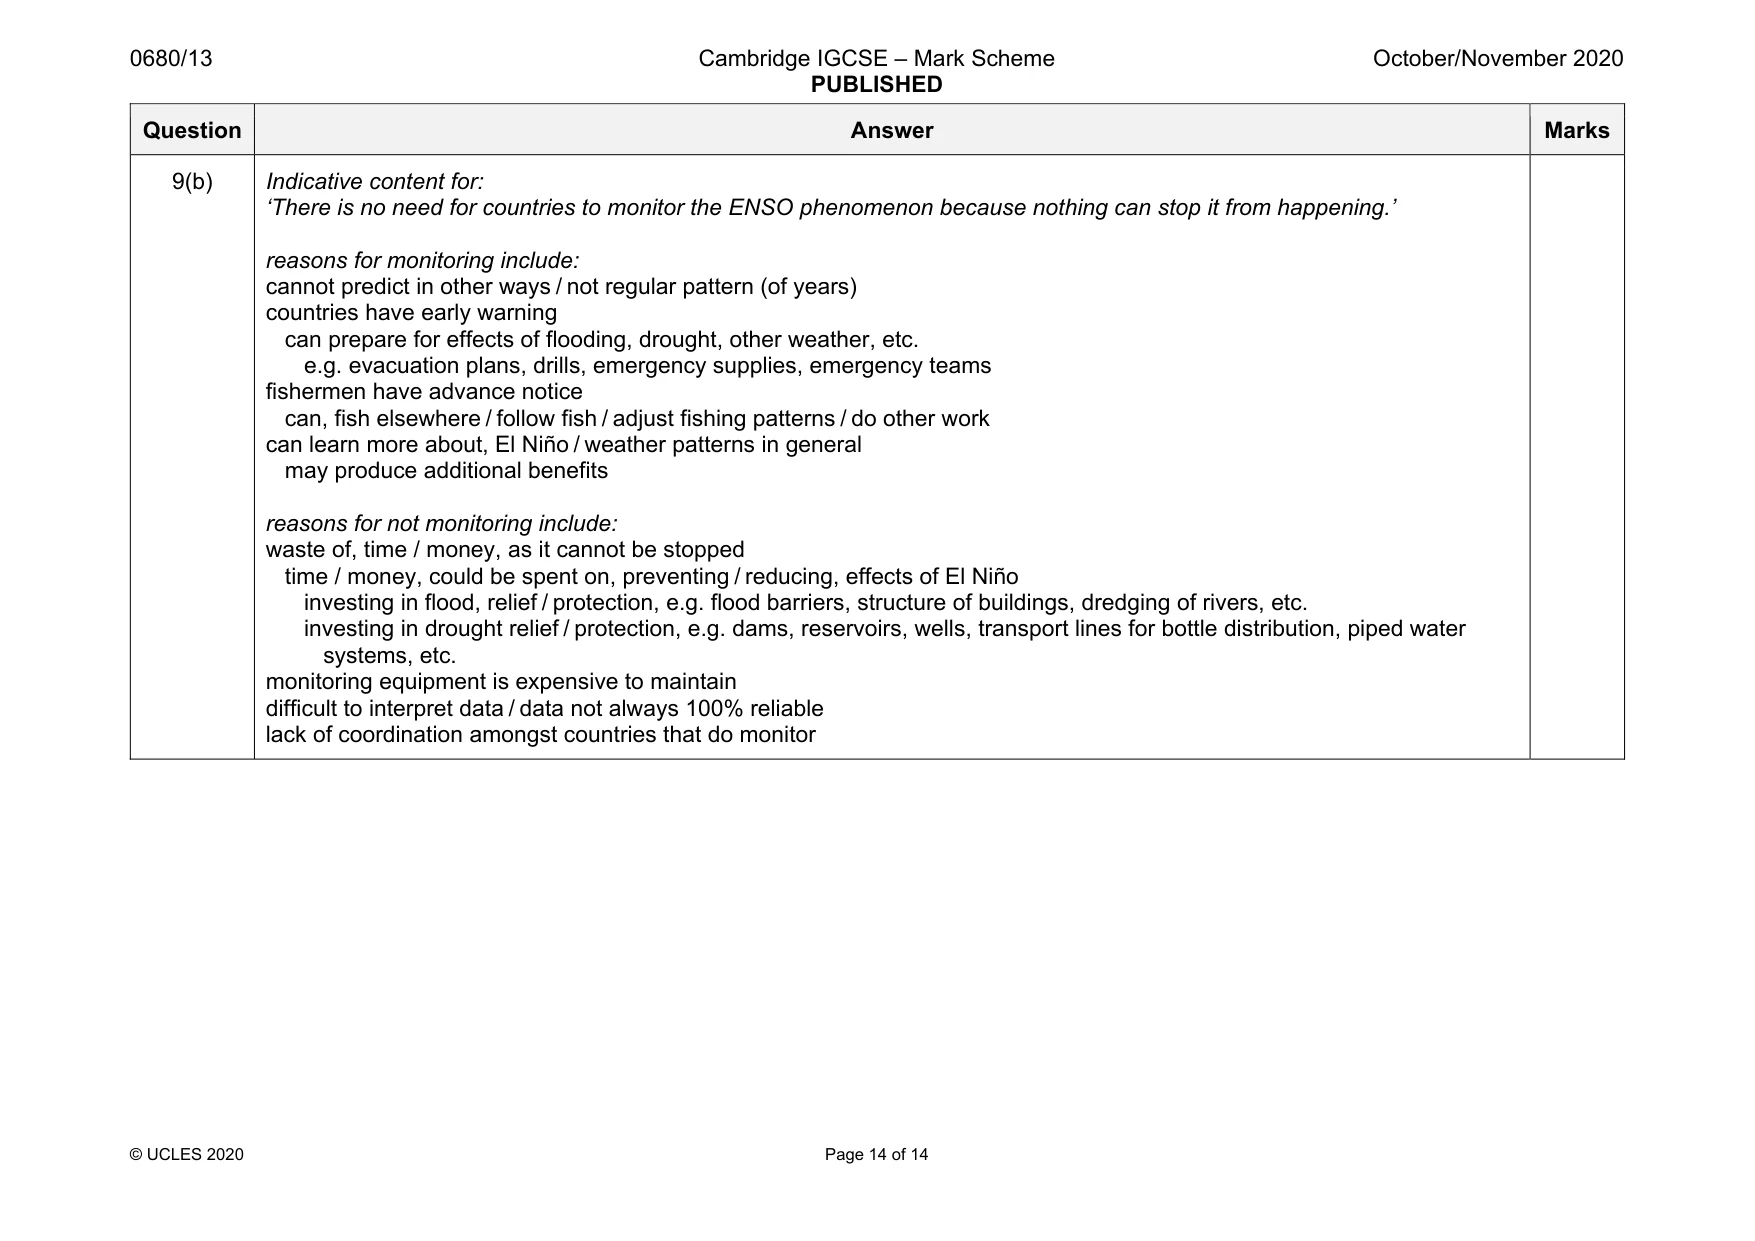
0680/13 Cambridge IGCSE – Mark Scheme PUBLISHED October/November 2020 © UCLES 2020 Page 14 of 14 Question Answer Marks 9(b) Indicative content for: ‘There is no need for countries to monitor the ENSO phenomenon because nothing can stop it from happening.’ reasons for monitoring include: cannot predict in other ways / not regular pattern (of years) countries have early warning can prepare for effects of flooding, drought, other weather, etc. e.g. evacuation plans, drills, emergency supplies, emergency teams fishermen have advance notice can, fish elsewhere / follow fish / adjust fishing patterns / do other work can learn more about, El Niño / weather patterns in general may produce additional benefits reasons for not monitoring include: waste of, time / money, as it cannot be stopped time / money, could be spent on, preventing / reducing, effects of El Niño investing in flood, relief / protection, e.g. flood barriers, structure of buildings, dredging of rivers, etc. investing in drought relief / protection, e.g. dams, reservoirs, wells, transport lines for bottle distribution, piped water systems, etc. monitoring equipment is expensive to maintain difficult to interpret data / data not always 100% reliable lack of coordination amongst countries that do monitor
What you needed in this session
Cambridge’s own grade thresholds for 2020 Oct/Nov, Paper 1 · Variant 3. A higher threshold means an easier paper — the bar moves with how the cohort did.