Cambridge A Level Physics 9702 — 2018 May/June Paper 5 · Variant 1
9702/51/M/J/18 · 2 questions · 30 marks · ≈34 min
The question paper and its mark scheme, free to read here and free to download. This is Cambridge’s own paper, exactly as it was sat.
Question paper8 pages

Mark scheme7 pages
Answers below. Sit the paper first if you are practising.
Questions as text
Q1 · A student is investigating the force between two charged metal spheres S and T, as shown…
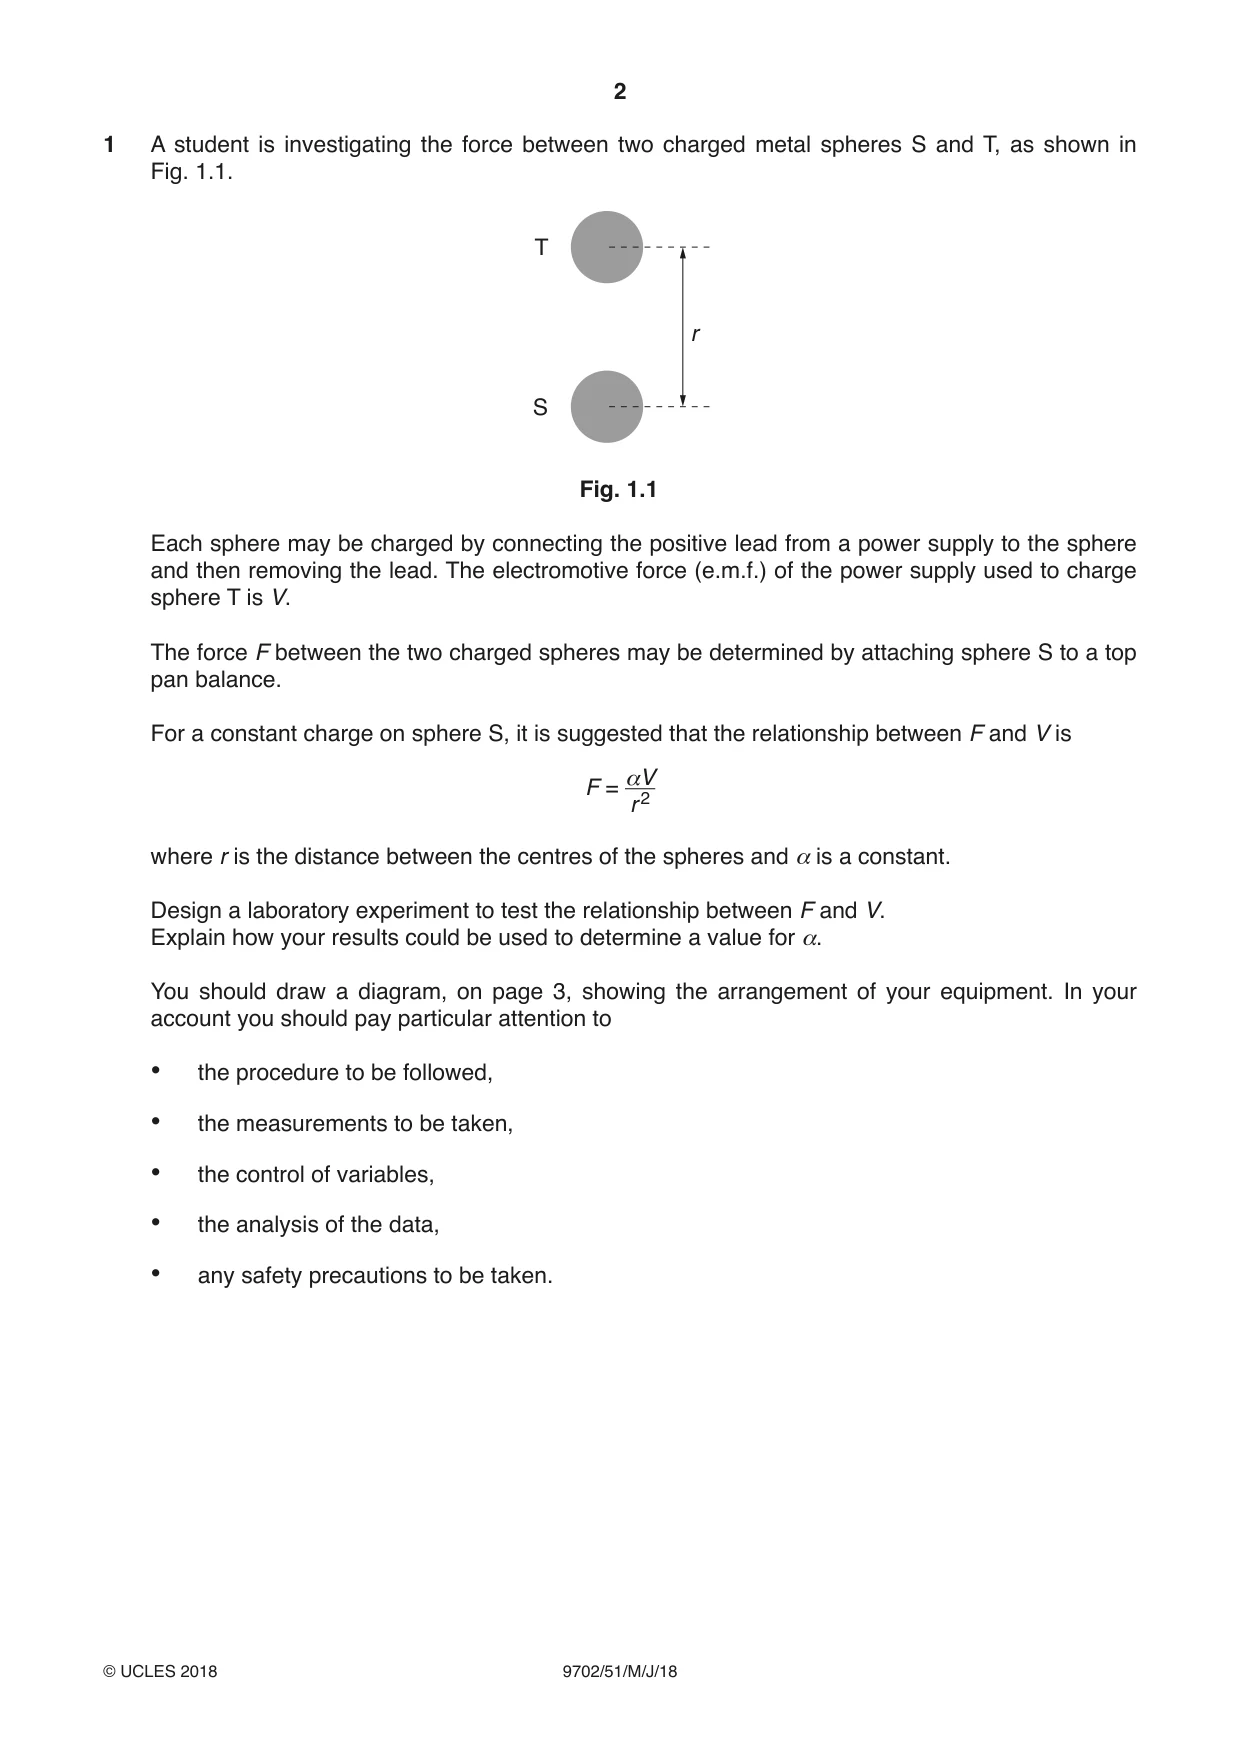
1 A student is investigating the force between two charged metal spheres S and T, as shown in Fig. 1.1. T r S Fig. 1.1 Each sphere may be charged by connecting the positive lead from a power supply to the sphere and then removing the lead. The electromotive force (e.m.f.) of the power supply used to charge sphere T is V. The force F between the two charged spheres may be determined by attaching sphere S to a top pan balance. For a constant charge on sphere S, it is suggested that the relationship between F and V is αV F = r 2 where r is the distance between the centres of the spheres and α is a constant. Design a laboratory experiment to test the relationship between F and V. Explain how your results could be used to determine a value for α. You should draw a diagram, on page 3, showing the arrangement of your equipment. In your account you should pay particular attention to • the procedure to be followed, • the measurements to be taken, • the control of variables, • the analysis of the data, • any safety precautions to be taken. Diagram .................................................................................................................................................................. .................................................................................................................................................................. .................................................................................................................................................................. .................................................................................................................................................................. .................................................................................................................................................................. .................................................................................................................................................................. .................................................................................................................................................................. .................................................................................................................................................................. .................................................................................................................................................................. .................................................................................................................................................................. .................................................................................................................................................................. .................................................................................................................................................................. .................................................................................................................................................................. .................................................................................................................................................................. .................................................................................................................................................................. .................................................................................................................................................................. .................................................................................................................................................................. .................................................................................................................................................................. .................................................................................................................................................................. .................................................................................................................................................................. .................................................................................................................................................................. .................................................................................................................................................................. .................................................................................................................................................................. .................................................................................................................................................................. .................................................................................................................................................................. .................................................................................................................................................................. .................................................................................................................................................................. .................................................................................................................................................................. .................................................................................................................................................................. .................................................................................................................................................................. .................................................................................................................................................................. .................................................................................................................................................................. .................................................................................................................................................................. .................................................................................................................................................................. .................................................................................................................................................................. .................................................................................................................................................................. .................................................................................................................................................................. .................................................................................................................................................................. .................................................................................................................................................................. .................................................................................................................................................................. .................................................................................................................................................................. .................................................................................................................................................................. ............................................................................................................................................................[15]
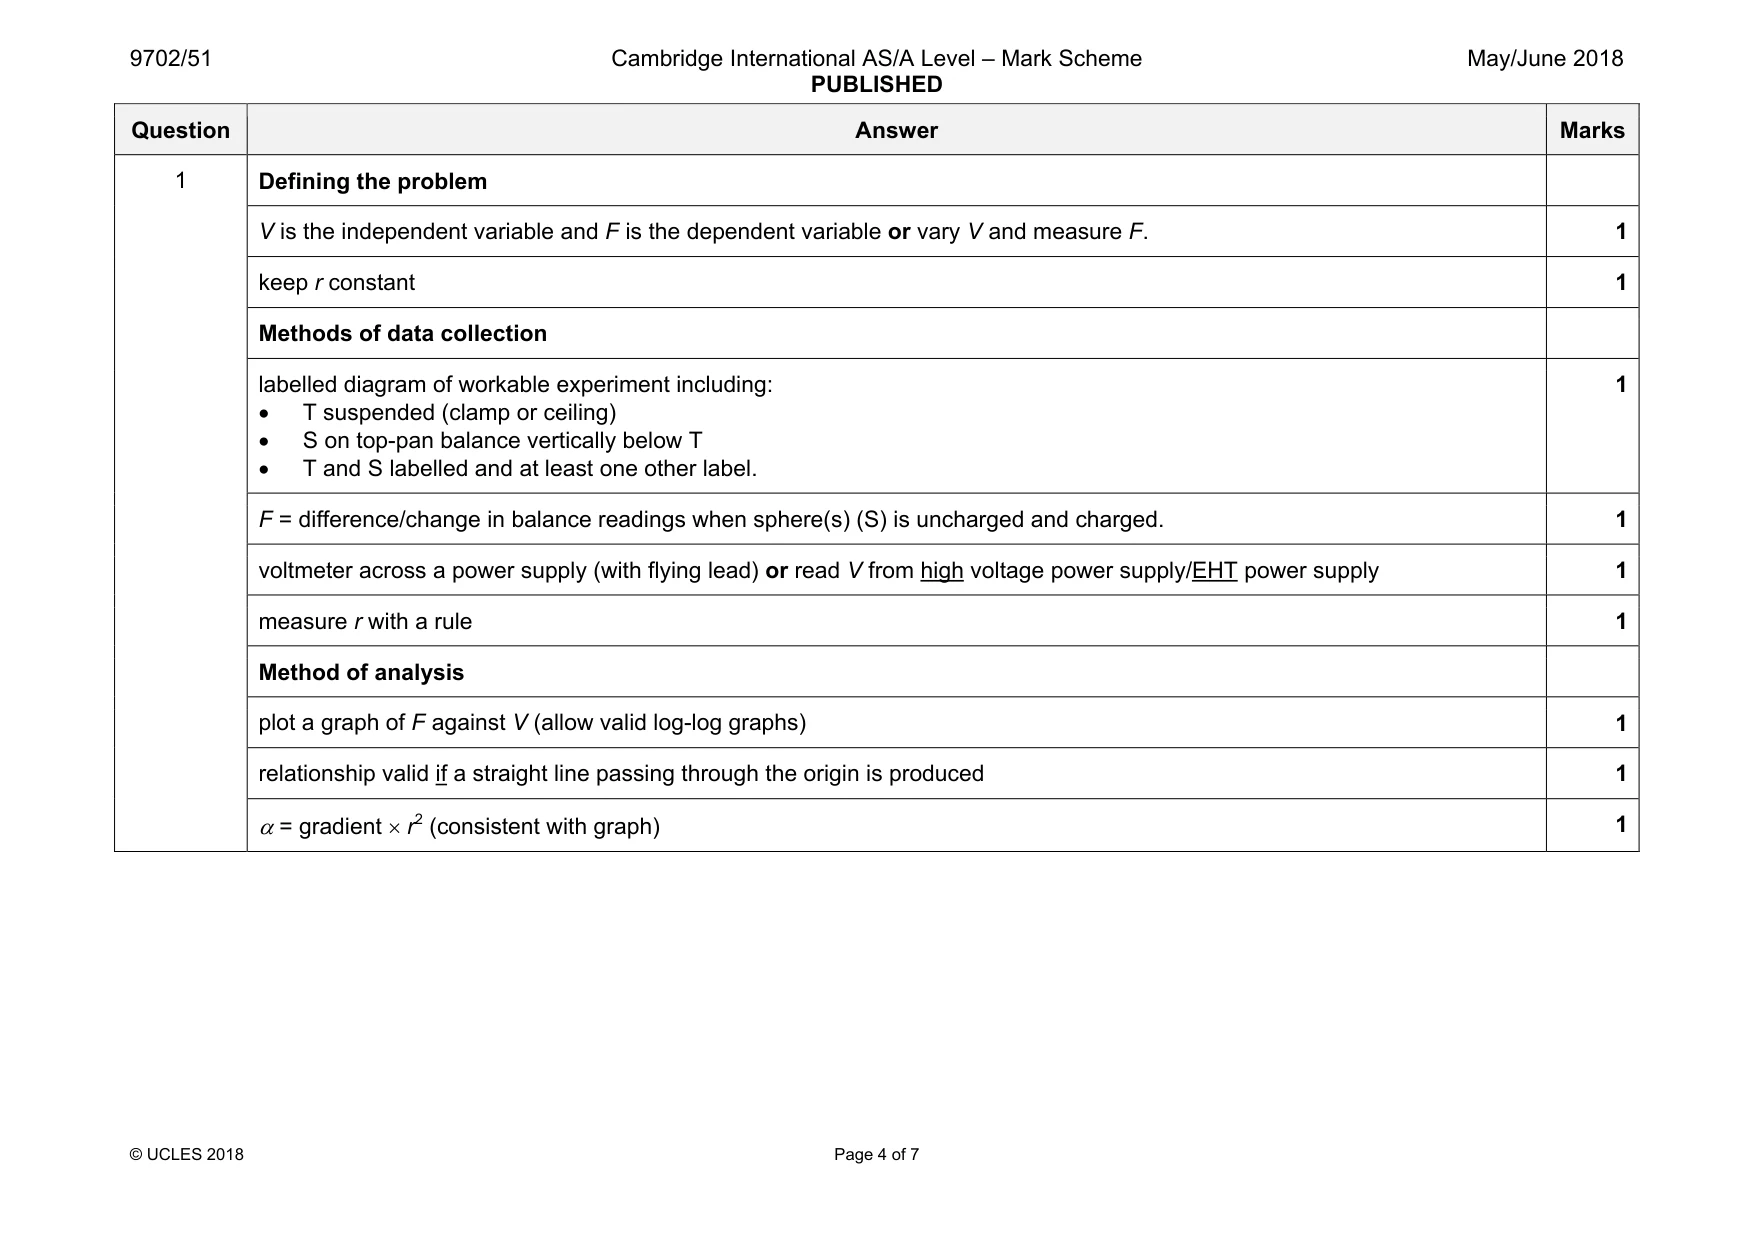
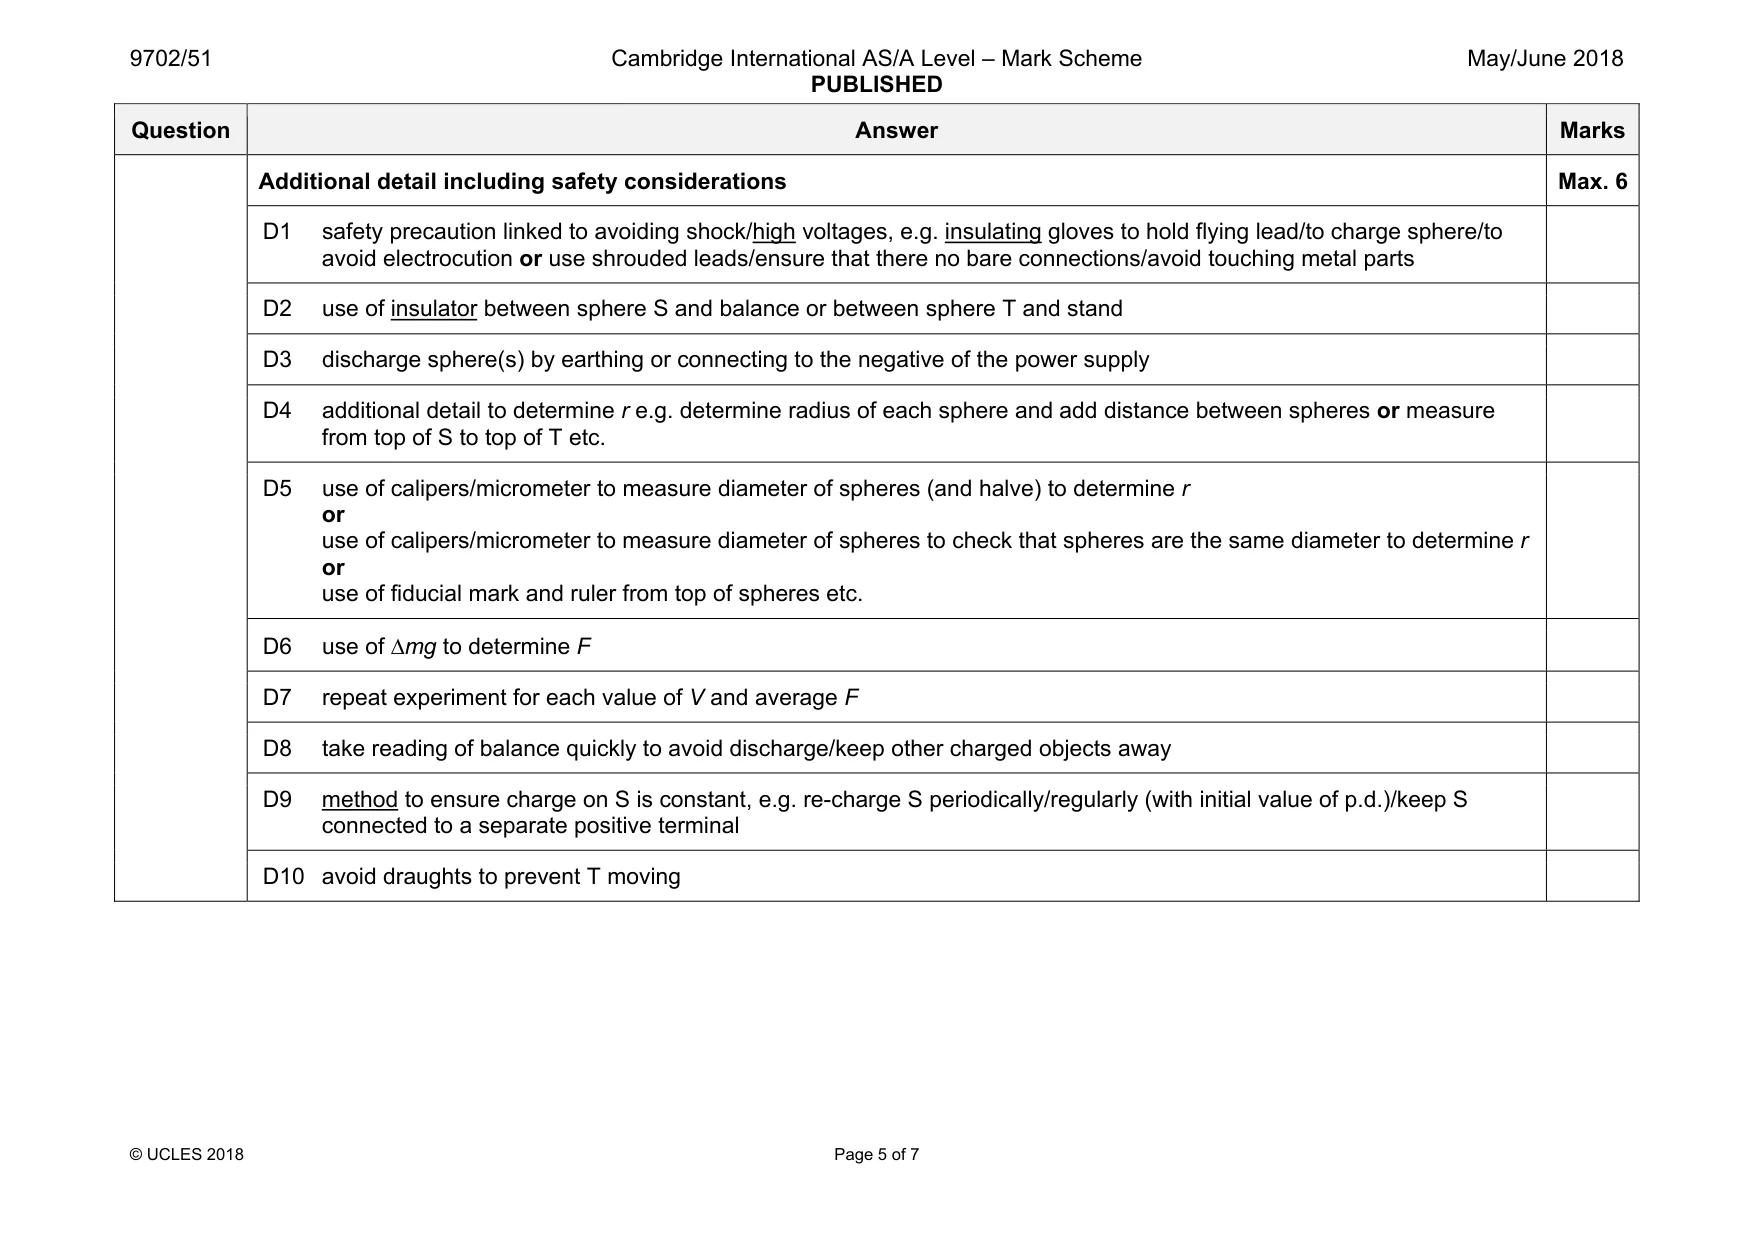
Mark scheme: 1 Defining the problem V is the independent variable and F is the dependent variable or vary V and measure F. 1 keep r constant 1 Methods of data collection labelled diagram of workable experiment including: • T suspended (clamp or ceiling) • S on top-pan balance vertically below T • T and S labelled and at least one other label. 1 F = difference/change in balance readings when sphere(s) (S) is uncharged and charged. 1 voltmeter across a power supply (with flying lead) or read V from high voltage power supply/EHT power supply 1 measure r with a rule 1 Method of analysis plot a graph of F against V (allow valid log-log graphs) 1 relationship valid if a straight line passing through the origin is produced 1 α = gradient × r2 (consistent with graph) 1 Question Answer Marks Additional detail including safety considerations Max. 6 D1 safety precaution linked to avoiding shock/high voltages, e.g. insulating gloves to hold flying lead/to charge sphere/to avoid electrocution or use shrouded leads/ensure that there no bare connections/avoid touching metal parts D2 use of insulator between sphere S and balance or between sphere T and stand D3 discharge sphere(s) by earthing or connecting to the negative of the power supply D4 additional detail to determine r e.g. determine radius of each sphere and add distance between spheres or measure from top of S to top of T etc. D5 use of calipers/micrometer to measure diameter of spheres (and halve) to determine r or use of calipers/micrometer to measure diameter of spheres to check that spheres are the same diameter to determine r or use of fiducial mark and ruler from top of spheres etc. D6 use of ∆mg to determine F D7 repeat experiment for each value of V and average F D8 take reading of balance quickly to avoid discharge/keep other charged objects away D9 method to ensure charge on S is constant, e.g. re-charge S periodically/regularly (with initial value of p.d.)/keep S connected to a separate positive terminal D10 avoid draughts to prevent T moving
Q2 · A student is investigating monochromatic light passing through a diffraction grating
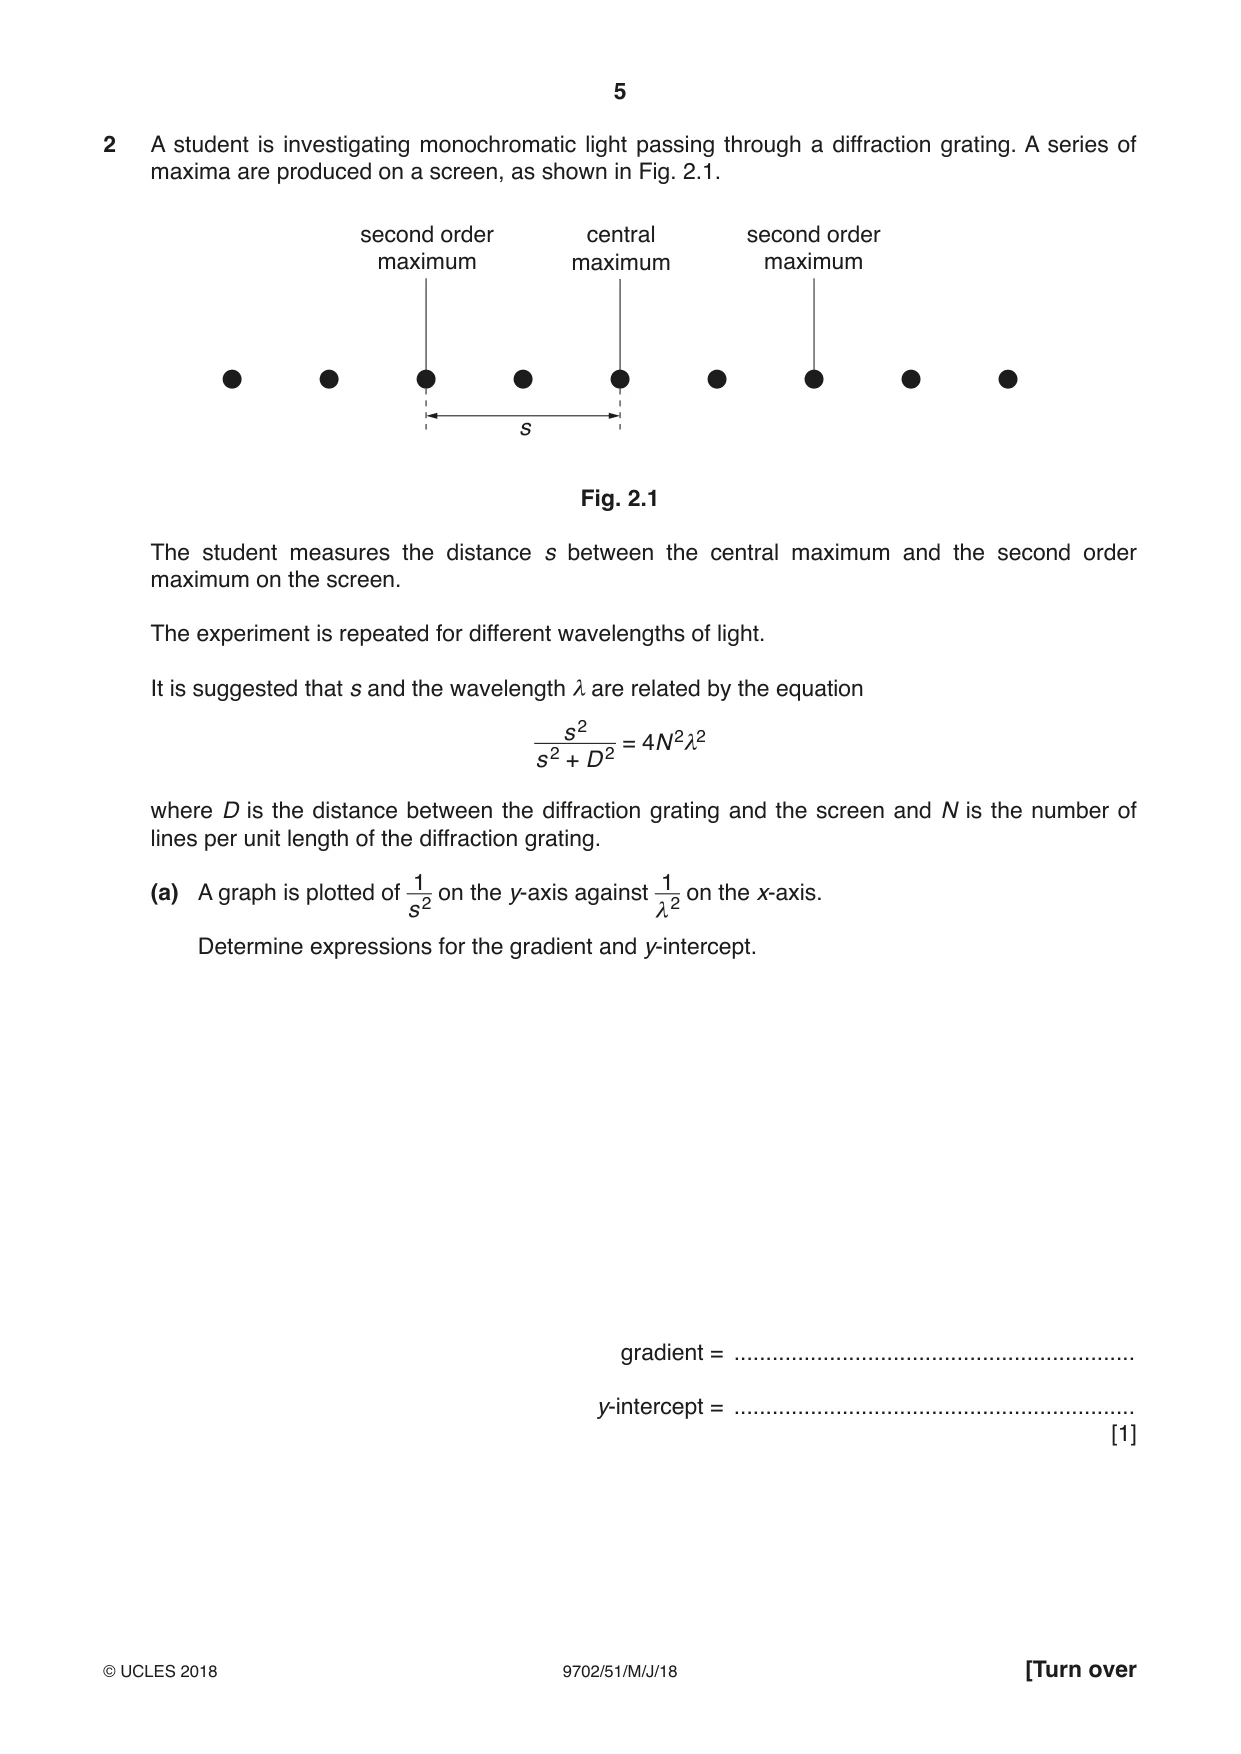
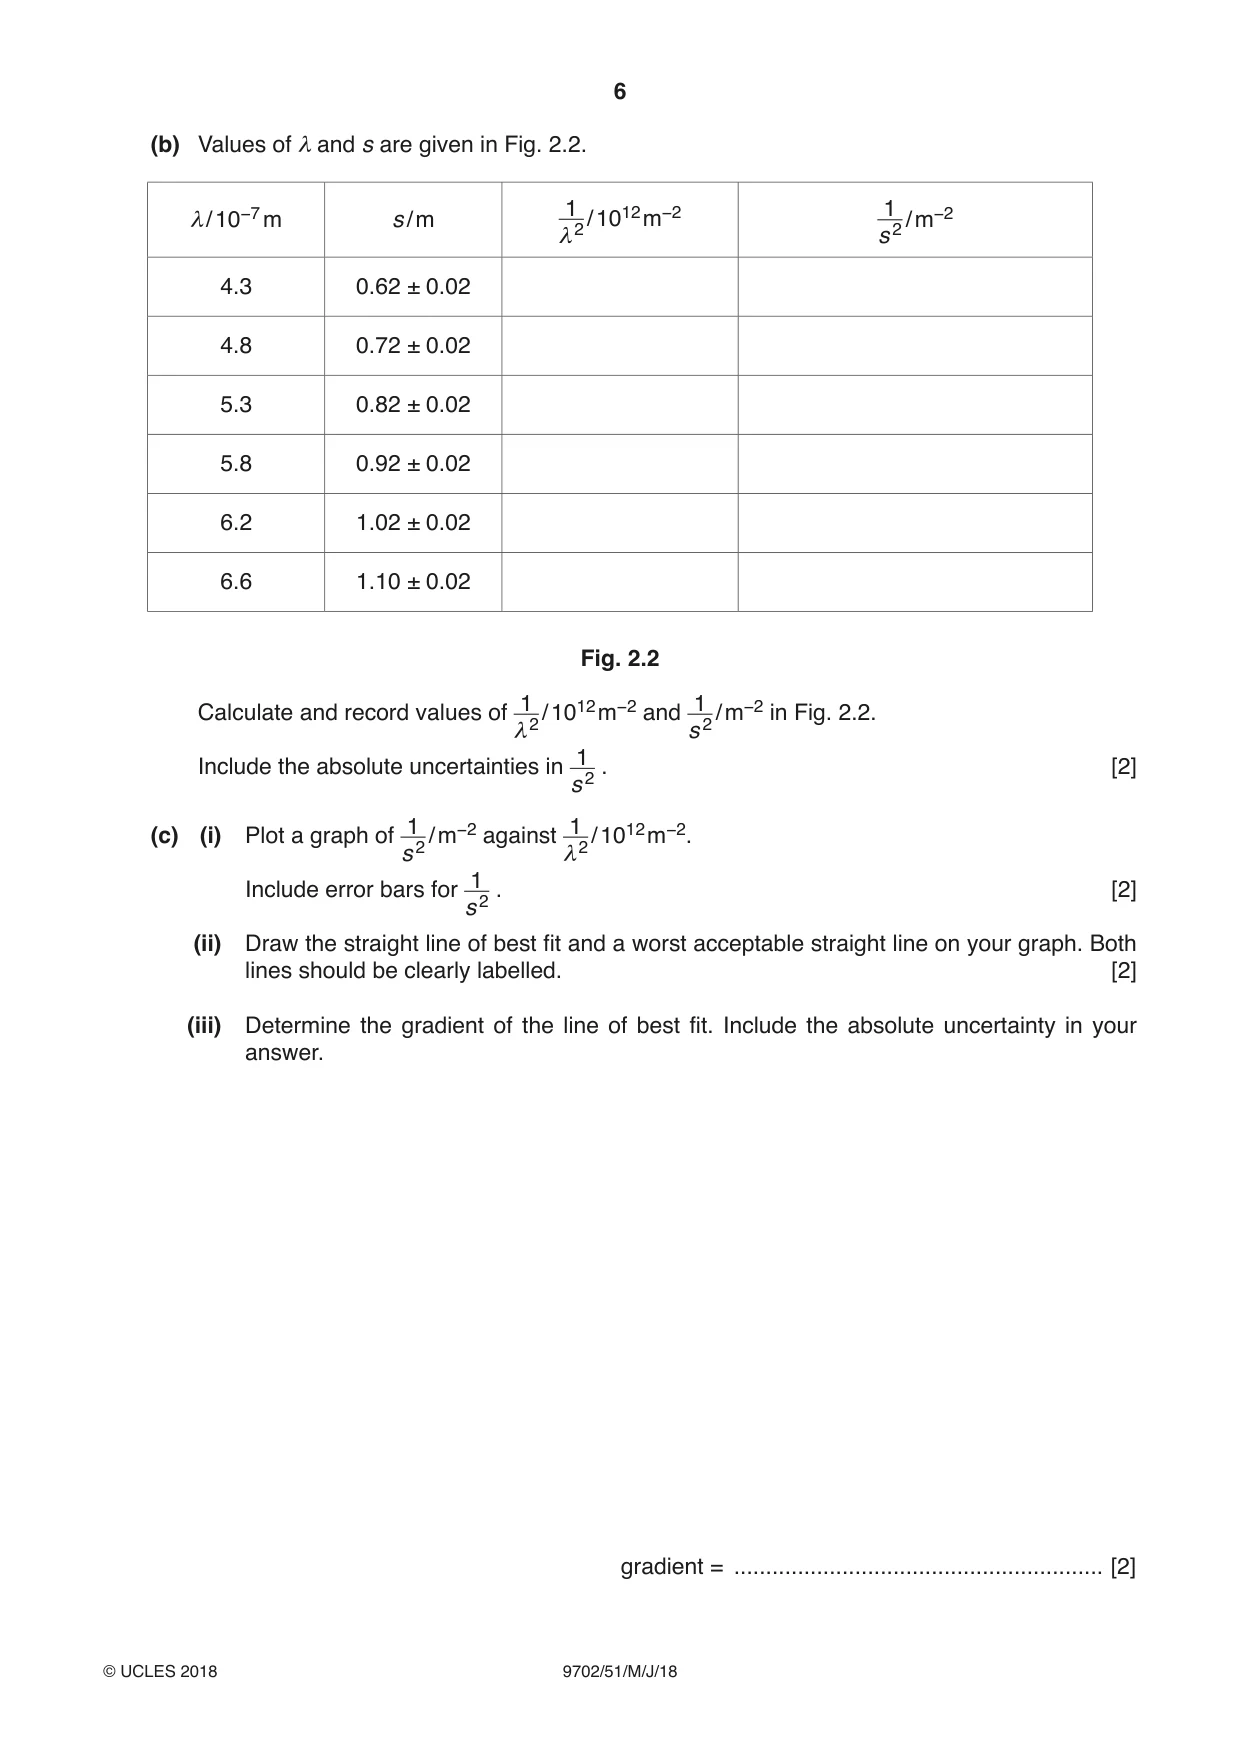
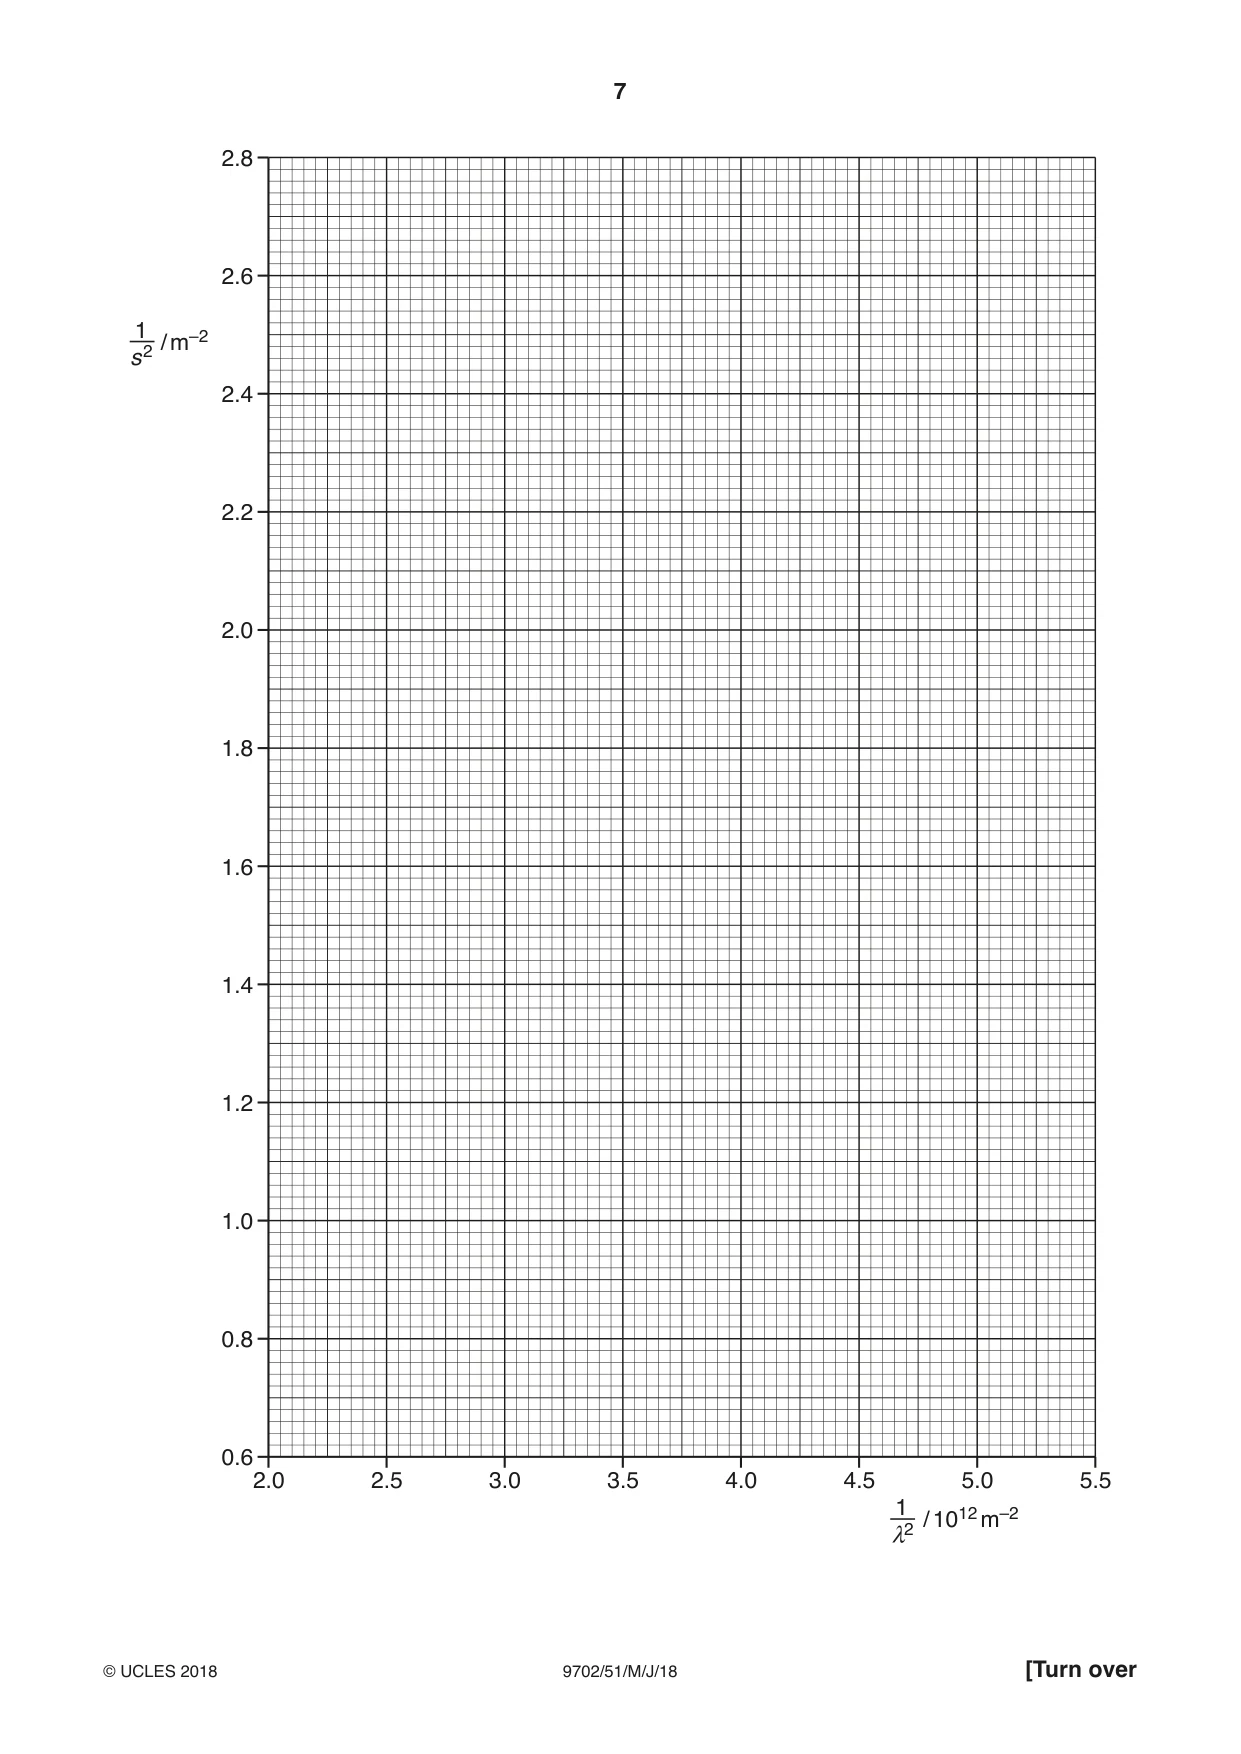
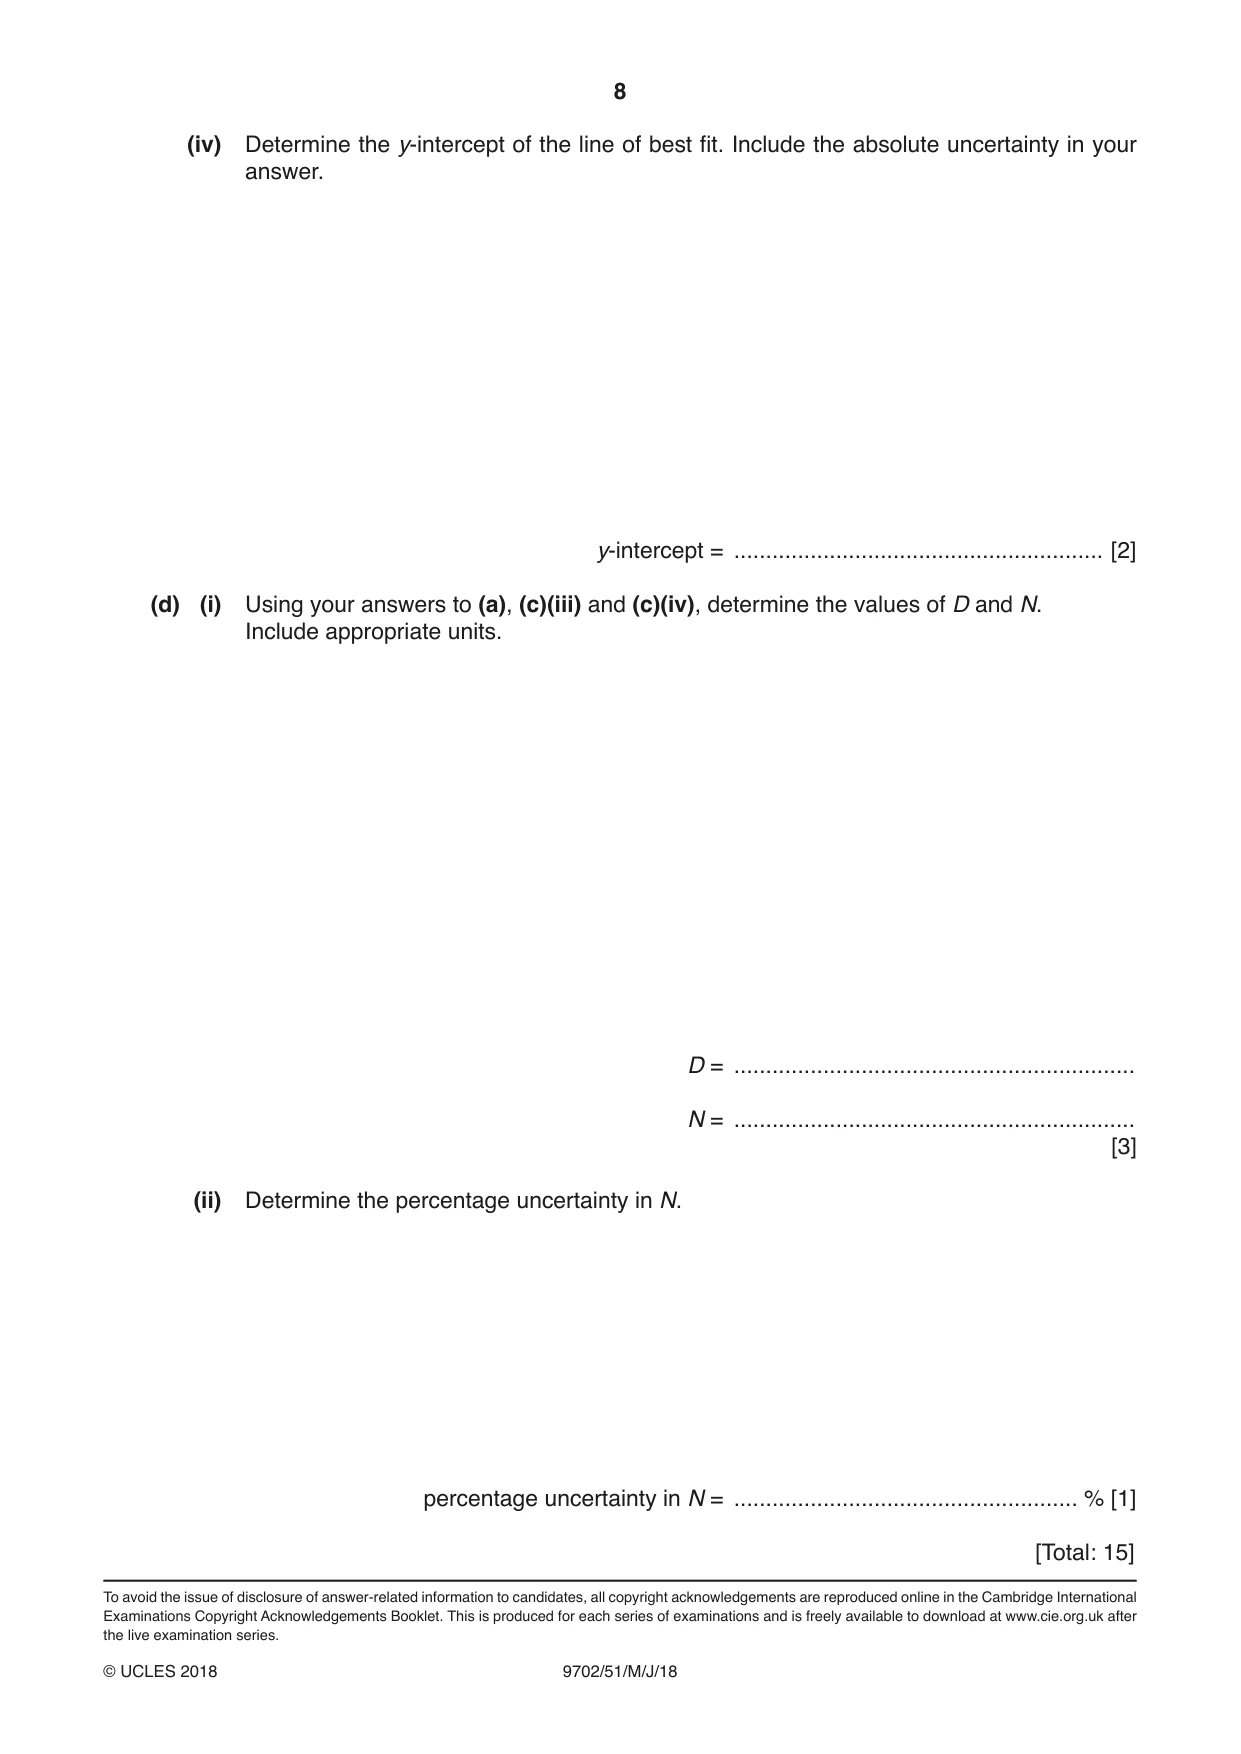
2 A student is investigating monochromatic light passing through a diffraction grating. A series of maxima are produced on a screen, as shown in Fig. 2.1. second order central second order maximum maximum maximum s Fig. 2.1 The student measures the distance s between the central maximum and the second order maximum on the screen. The experiment is repeated for different wavelengths of light. It is suggested that s and the wavelength λ are related by the equation s 2 = 4N 2λ2 s 2 + D 2 where D is the distance between the diffraction grating and the screen and N is the number of lines per unit length of the diffraction grating. 1 1 (a) A graph is plotted of on the y-axis against on the x-axis. s 2 λ2 Determine expressions for the gradient and y-intercept. gradient = ............................................................... y-intercept = ............................................................... [1] (b) Values of λ and s are given in Fig. 2.2. 1 1 λ/ 10−7 m s / m 2 / 1012 m−2 2 / m−2 λ s 4.3 0.62 ± 0.02 4.8 0.72 ± 0.02 5.3 0.82 ± 0.02 5.8 0.92 ± 0.02 6.2 1.02 ± 0.02 6.6 1.10 ± 0.02 Fig. 2.2 1 1 Calculate and record values of / 1012 m−2 and / m−2 in Fig. 2.2. 2 2 λ s 1 Include the absolute uncertainties in . [2] s 2 1 1(c) (i) Plot a graph of / m−2 against / 1012 m−2. s 2 λ2 1 Include error bars for . [2] s 2 (ii) Draw the straight line of best fit and a worst acceptable straight line on your graph. Both lines should be clearly labelled. [2] (iii) Determine the gradient of the line of best fit. Include the absolute uncertainty in your answer. gradient = .......................................................... [2]
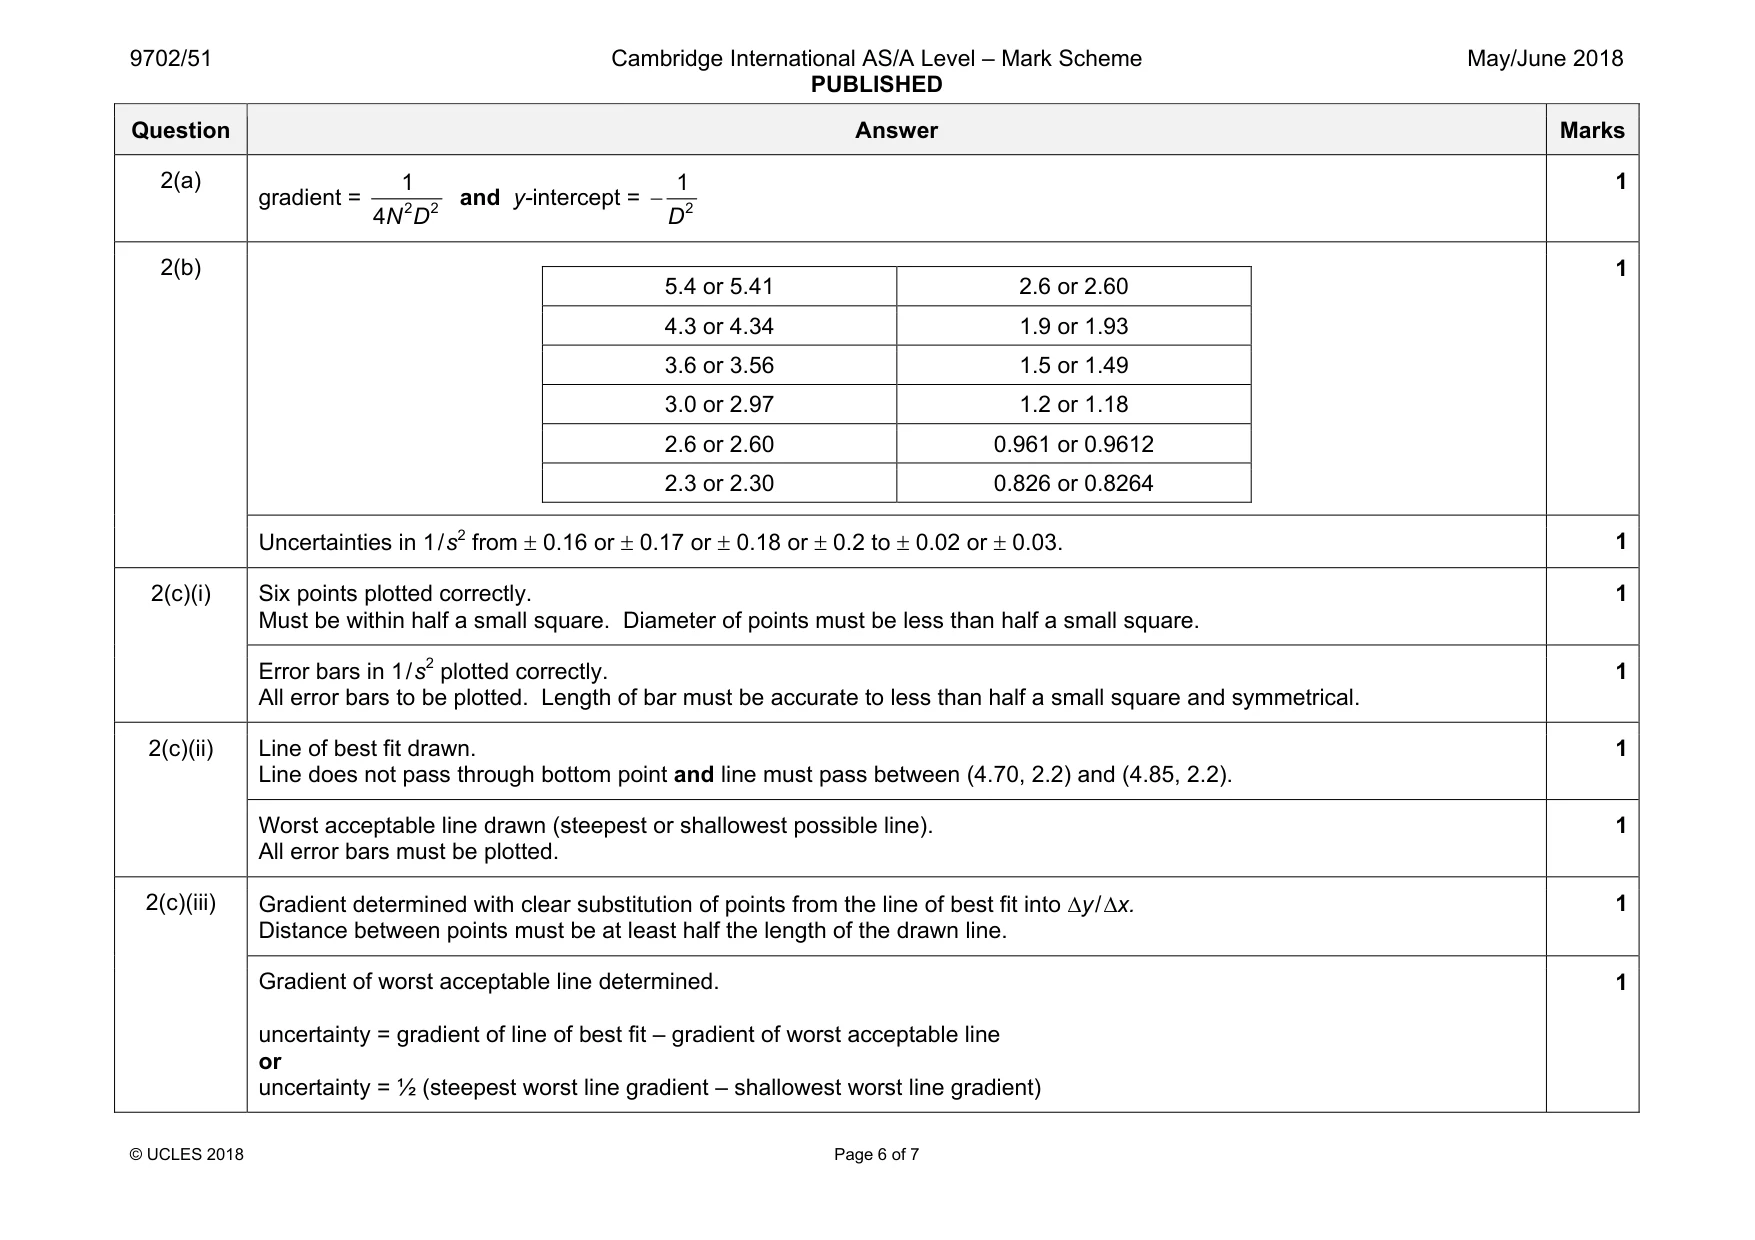
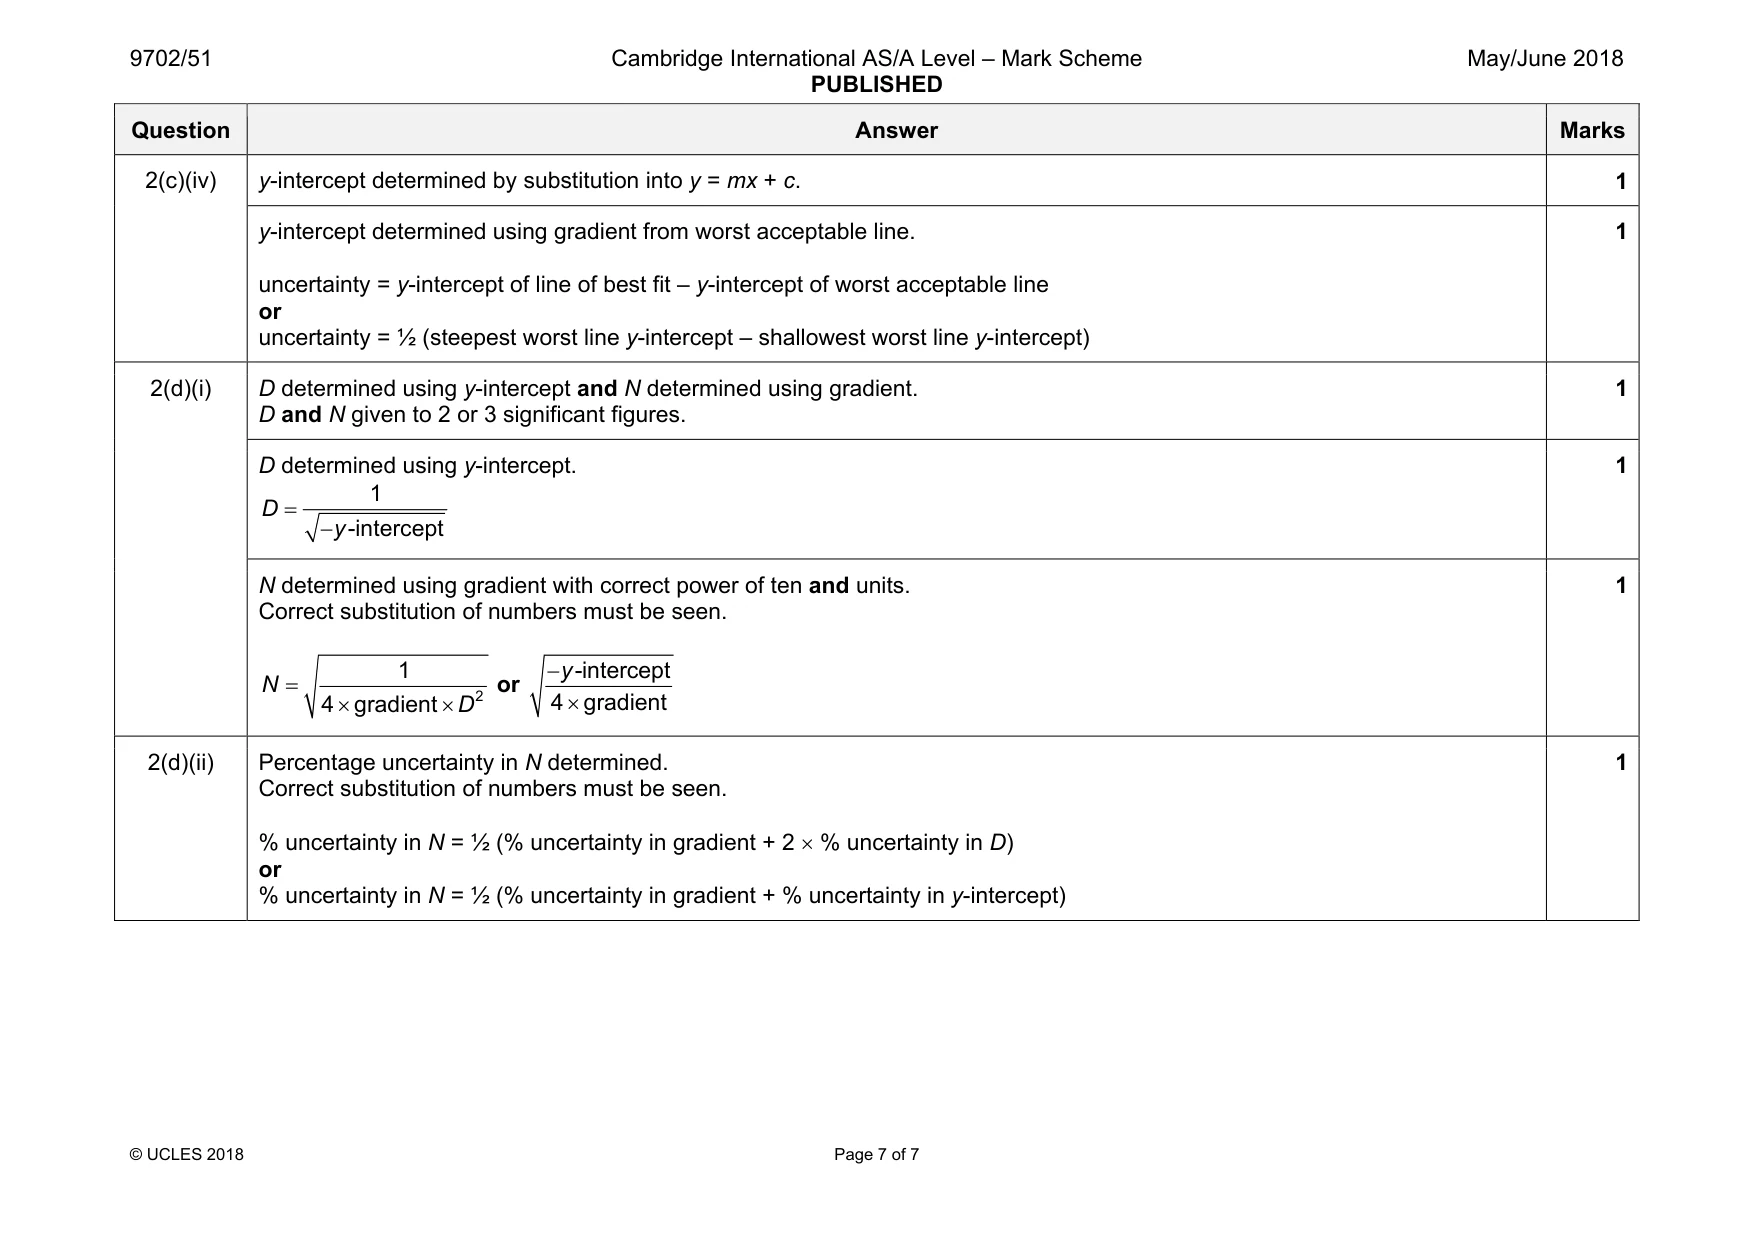
Mark scheme: 2(a) gradient = 2 2 1 4N D and y-intercept = 2 1 D − 1 2(b) 5.4 or 5.41 2.6 or 2.60 4.3 or 4.34 1.9 or 1.93 3.6 or 3.56 1.5 or 1.49 3.0 or 2.97 1.2 or 1.18 2.6 or 2.60 0.961 or 0.9612 2.3 or 2.30 0.826 or 0.8264 1 Uncertainties in 1 / s2 from ± 0.16 or ± 0.17 or ± 0.18 or ± 0.2 to ± 0.02 or ± 0.03. 1 2(c)(i) Six points plotted correctly. Must be within half a small square. Diameter of points must be less than half a small square. 1 Error bars in 1 / s2 plotted correctly. All error bars to be plotted. Length of bar must be accurate to less than half a small square and symmetrical. 1 2(c)(ii) Line of best fit drawn. Line does not pass through bottom point and line must pass between (4.70, 2.2) and (4.85, 2.2). 1 Worst acceptable line drawn (steepest or shallowest possible line). All error bars must be plotted. 1 2(c)(iii) Gradient determined with clear substitution of points from the line of best fit into ∆y / ∆x. Distance between points must be at least half the length of the drawn line. 1 Gradient of worst acceptable line determined. uncertainty = gradient of line of best fit – gradient of worst acceptable line or uncertainty = ½ (steepest worst line gradient – shallowest worst line gradient) 1 Question Answer Marks 2(c)(iv) y-intercept determined by substitution into y = mx + c. 1 y-intercept determined using gradient from worst acceptable line. uncertainty = y-intercept of line of best fit – y-intercept of worst acceptable line or uncertainty = ½ (steepest worst line y-intercept – shallowest worst line y-intercept) 1 2(d)(i) D determined using y-intercept and N determined using gradient. D and N given to 2 or 3 significant figures. 1 D determined using y-intercept. 1 -intercept D y = − 1 N determined using gradient with correct power of ten and units. Correct substitution of numbers must be seen. 2 1 -intercept 4 gradient 4 gradient y N D − = × × × or 1 2(d)(ii) Percentage uncertainty in N determined. Correct substitution of numbers must be seen. % uncertainty in N = ½ (% uncertainty in gradient + 2 × % uncertainty in D) or % uncertainty in N = ½ (% uncertainty in gradient + % uncertainty in y-intercept) 1
What was in this paper
The subtopics covered by these 2 questions, and how many questions each got. Open one in a new tab to see every Cambridge question on it.
What you needed in this session
Cambridge’s own grade thresholds for 2018 May/June, Paper 5 · Variant 1. A higher threshold means an easier paper — the bar moves with how the cohort did.