Cambridge A Level Physics 9702 — 2017 Feb/March Paper 5 · Variant 2
9702/52/F/M/17 · 2 questions · 30 marks · ≈34 min
The question paper and its mark scheme, free to read here and free to download. This is Cambridge’s own paper, exactly as it was sat.
Question paper8 pages

Mark scheme5 pages
Answers below. Sit the paper first if you are practising.
Questions as text
Q1 · A student is investigating the speed of a vehicle on a track when a small ball is…
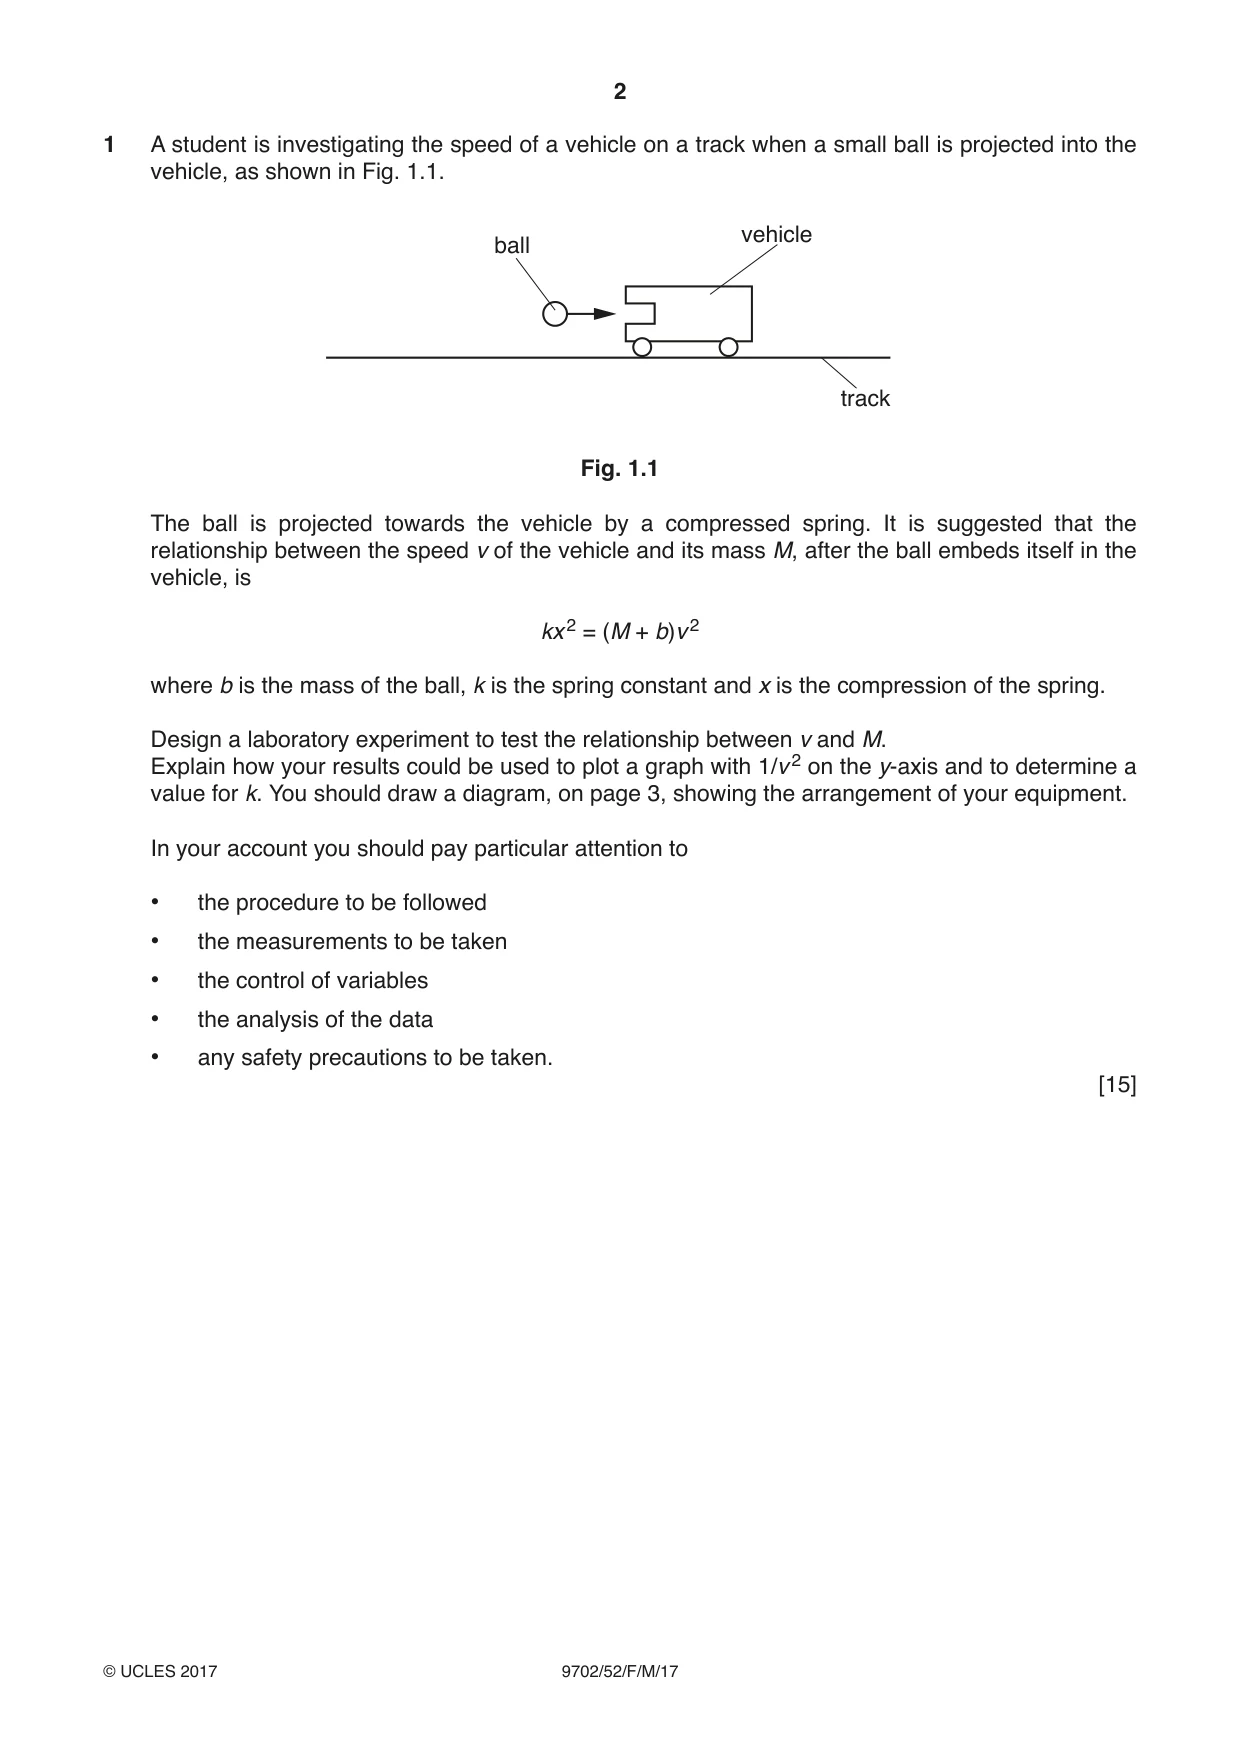
1 A student is investigating the speed of a vehicle on a track when a small ball is projected into the vehicle, as shown in Fig. 1.1. vehicle ball track Fig. 1.1 The ball is projected towards the vehicle by a compressed spring. It is suggested that the relationship between the speed v of the vehicle and its mass M, after the ball embeds itself in the vehicle, is kx 2 = (M + b)v 2 where b is the mass of the ball, k is the spring constant and x is the compression of the spring. Design a laboratory experiment to test the relationship between v and M. Explain how your results could be used to plot a graph with 1/v 2 on the y-axis and to determine a value for k. You should draw a diagram, on page 3, showing the arrangement of your equipment. In your account you should pay particular attention to • the procedure to be followed • the measurements to be taken • the control of variables • the analysis of the data • any safety precautions to be taken. [15] Diagram .................................................................................................................................................................. .................................................................................................................................................................. .................................................................................................................................................................. .................................................................................................................................................................. .................................................................................................................................................................. .................................................................................................................................................................. .................................................................................................................................................................. .................................................................................................................................................................. .................................................................................................................................................................. .................................................................................................................................................................. .................................................................................................................................................................. .................................................................................................................................................................. .................................................................................................................................................................. .................................................................................................................................................................. .................................................................................................................................................................. .................................................................................................................................................................. .................................................................................................................................................................. .................................................................................................................................................................. .................................................................................................................................................................. .................................................................................................................................................................. .................................................................................................................................................................. .................................................................................................................................................................. .................................................................................................................................................................. .................................................................................................................................................................. .................................................................................................................................................................. .................................................................................................................................................................. .................................................................................................................................................................. .................................................................................................................................................................. .................................................................................................................................................................. .................................................................................................................................................................. .................................................................................................................................................................. .................................................................................................................................................................. .................................................................................................................................................................. .................................................................................................................................................................. .................................................................................................................................................................. .................................................................................................................................................................. .................................................................................................................................................................. .................................................................................................................................................................. .................................................................................................................................................................. .................................................................................................................................................................. .................................................................................................................................................................. .................................................................................................................................................................. [Total: 15]
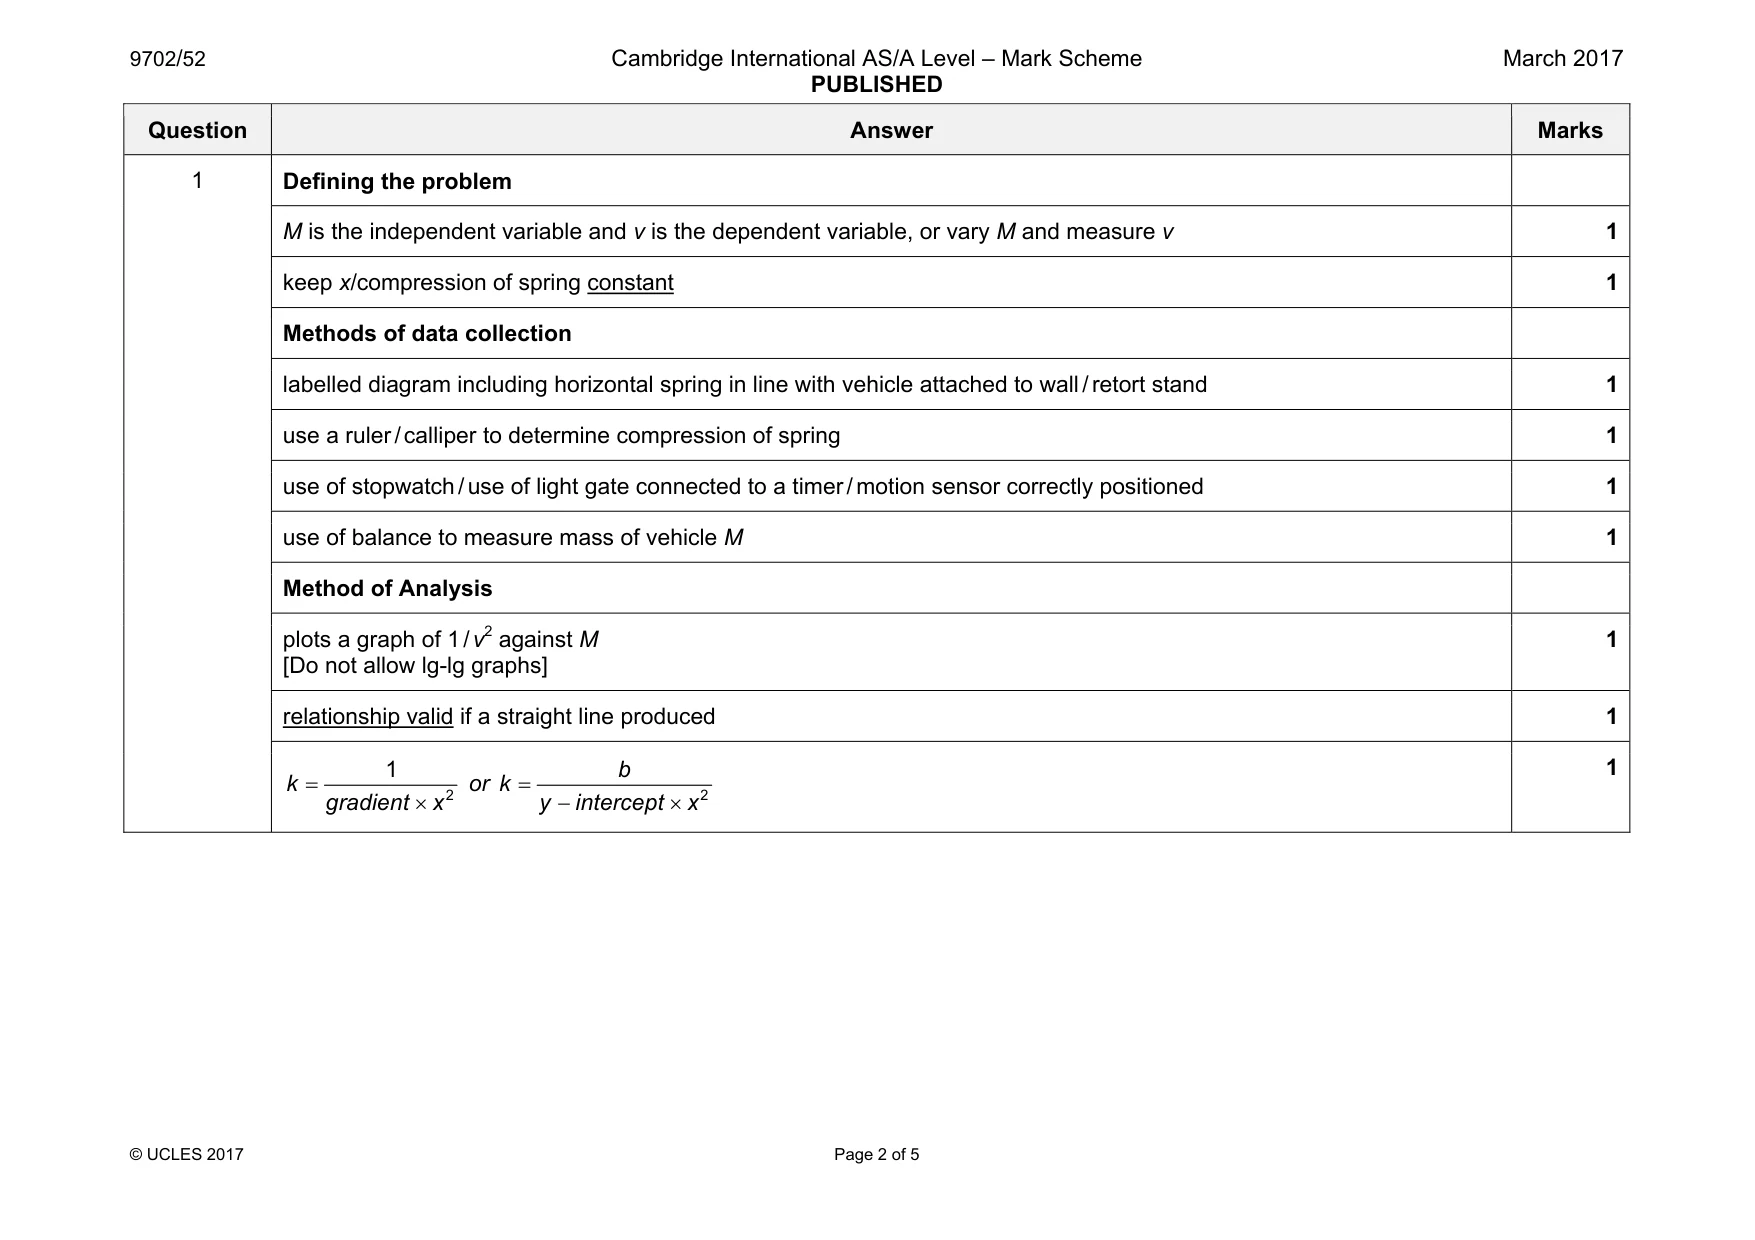
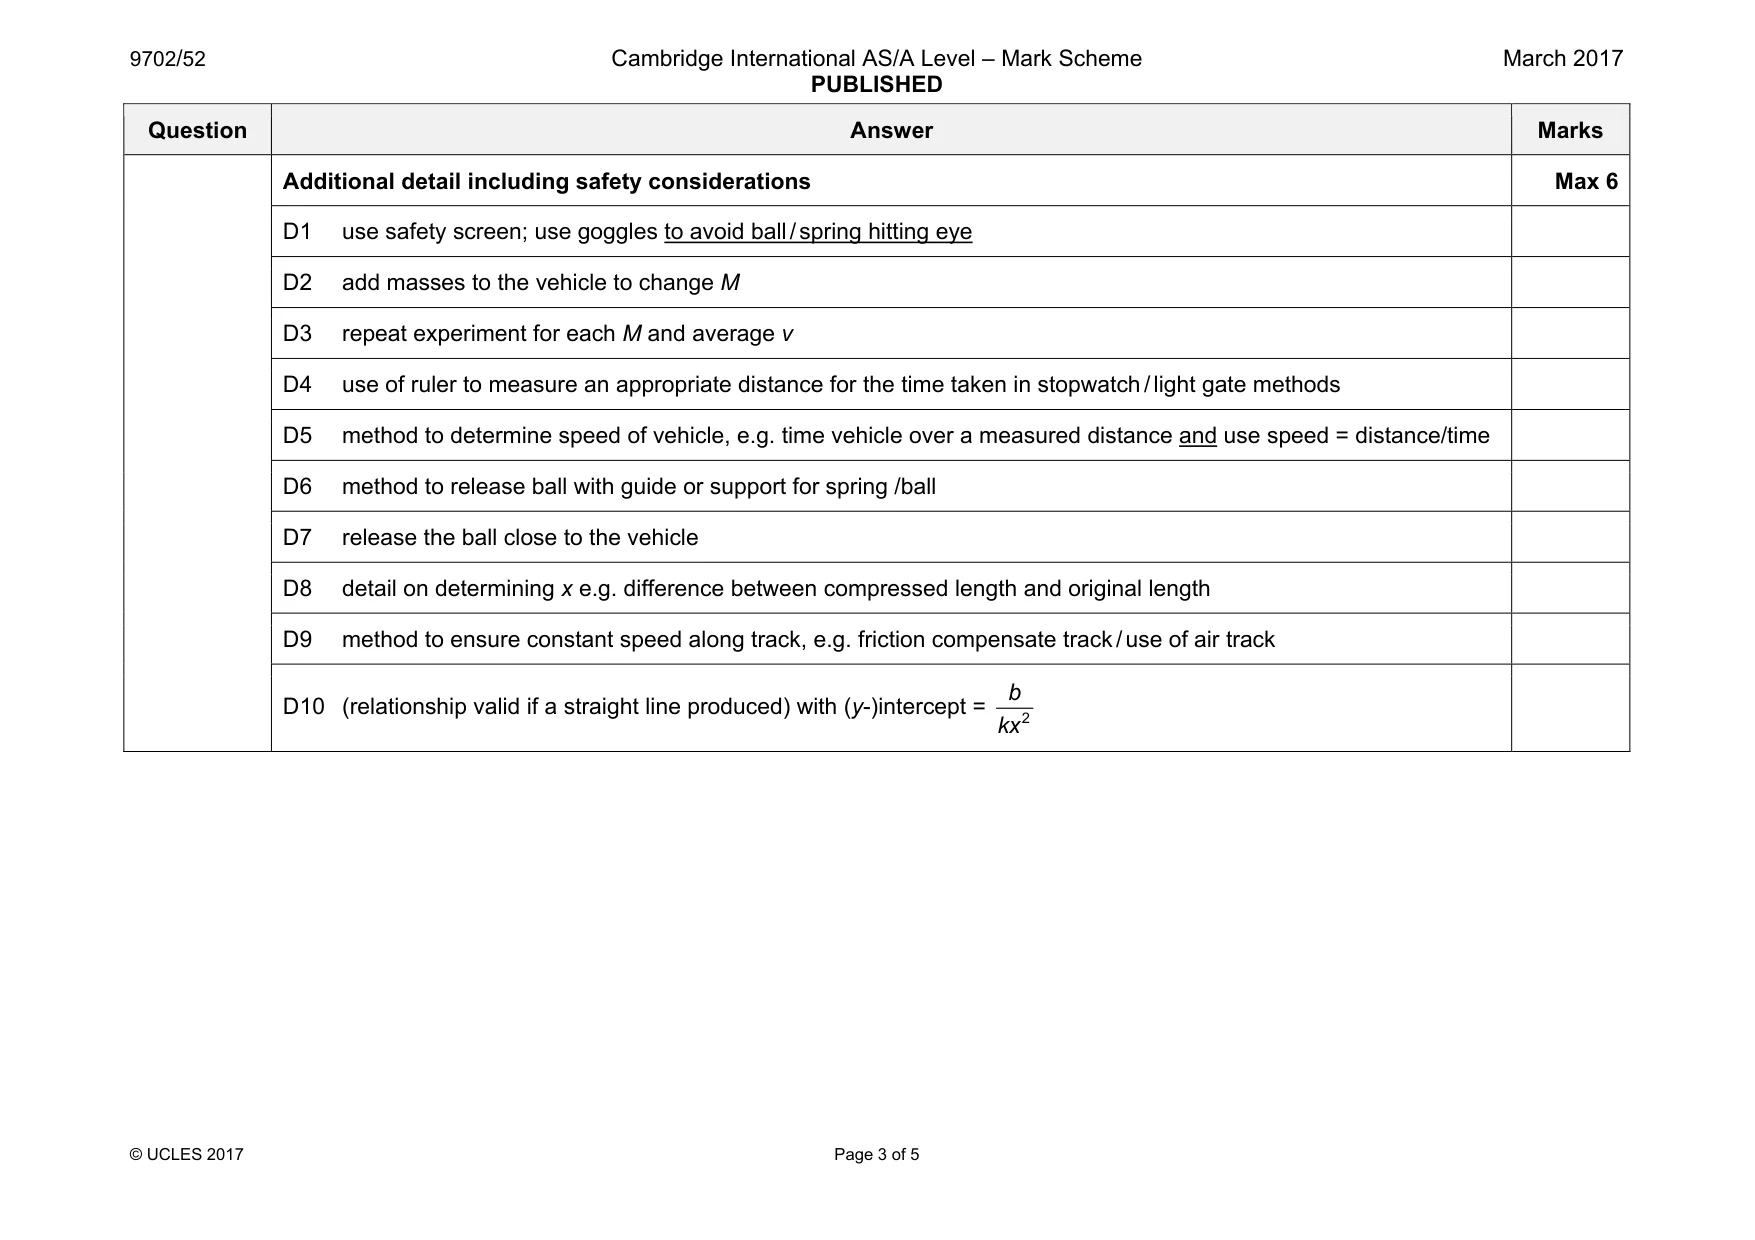
Mark scheme: 1 Defining the problem M is the independent variable and v is the dependent variable, or vary M and measure v 1 keep x/compression of spring constant 1 Methods of data collection labelled diagram including horizontal spring in line with vehicle attached to wall / retort stand 1 use a ruler / calliper to determine compression of spring 1 use of stopwatch / use of light gate connected to a timer / motion sensor correctly positioned 1 use of balance to measure mass of vehicle M 1 Method of Analysis plots a graph of 1 / v2 against M [Do not allow lg-lg graphs] 1 relationship valid if a straight line produced 1 2 1 k gradient x = × or 2 b k y intercept x = − × 1 Question Answer Marks Additional detail including safety considerations Max 6 D1 use safety screen; use goggles to avoid ball / spring hitting eye D2 add masses to the vehicle to change M D3 repeat experiment for each M and average v D4 use of ruler to measure an appropriate distance for the time taken in stopwatch / light gate methods D5 method to determine speed of vehicle, e.g. time vehicle over a measured distance and use speed = distance/time D6 method to release ball with guide or support for spring /ball D7 release the ball close to the vehicle D8 detail on determining x e.g. difference between compressed length and original length D9 method to ensure constant speed along track, e.g. friction compensate track / use of air track D10 (relationship valid if a straight line produced) with (y-)intercept = 2 b kx
Q2 · A student is investigating the potential difference in a circuit
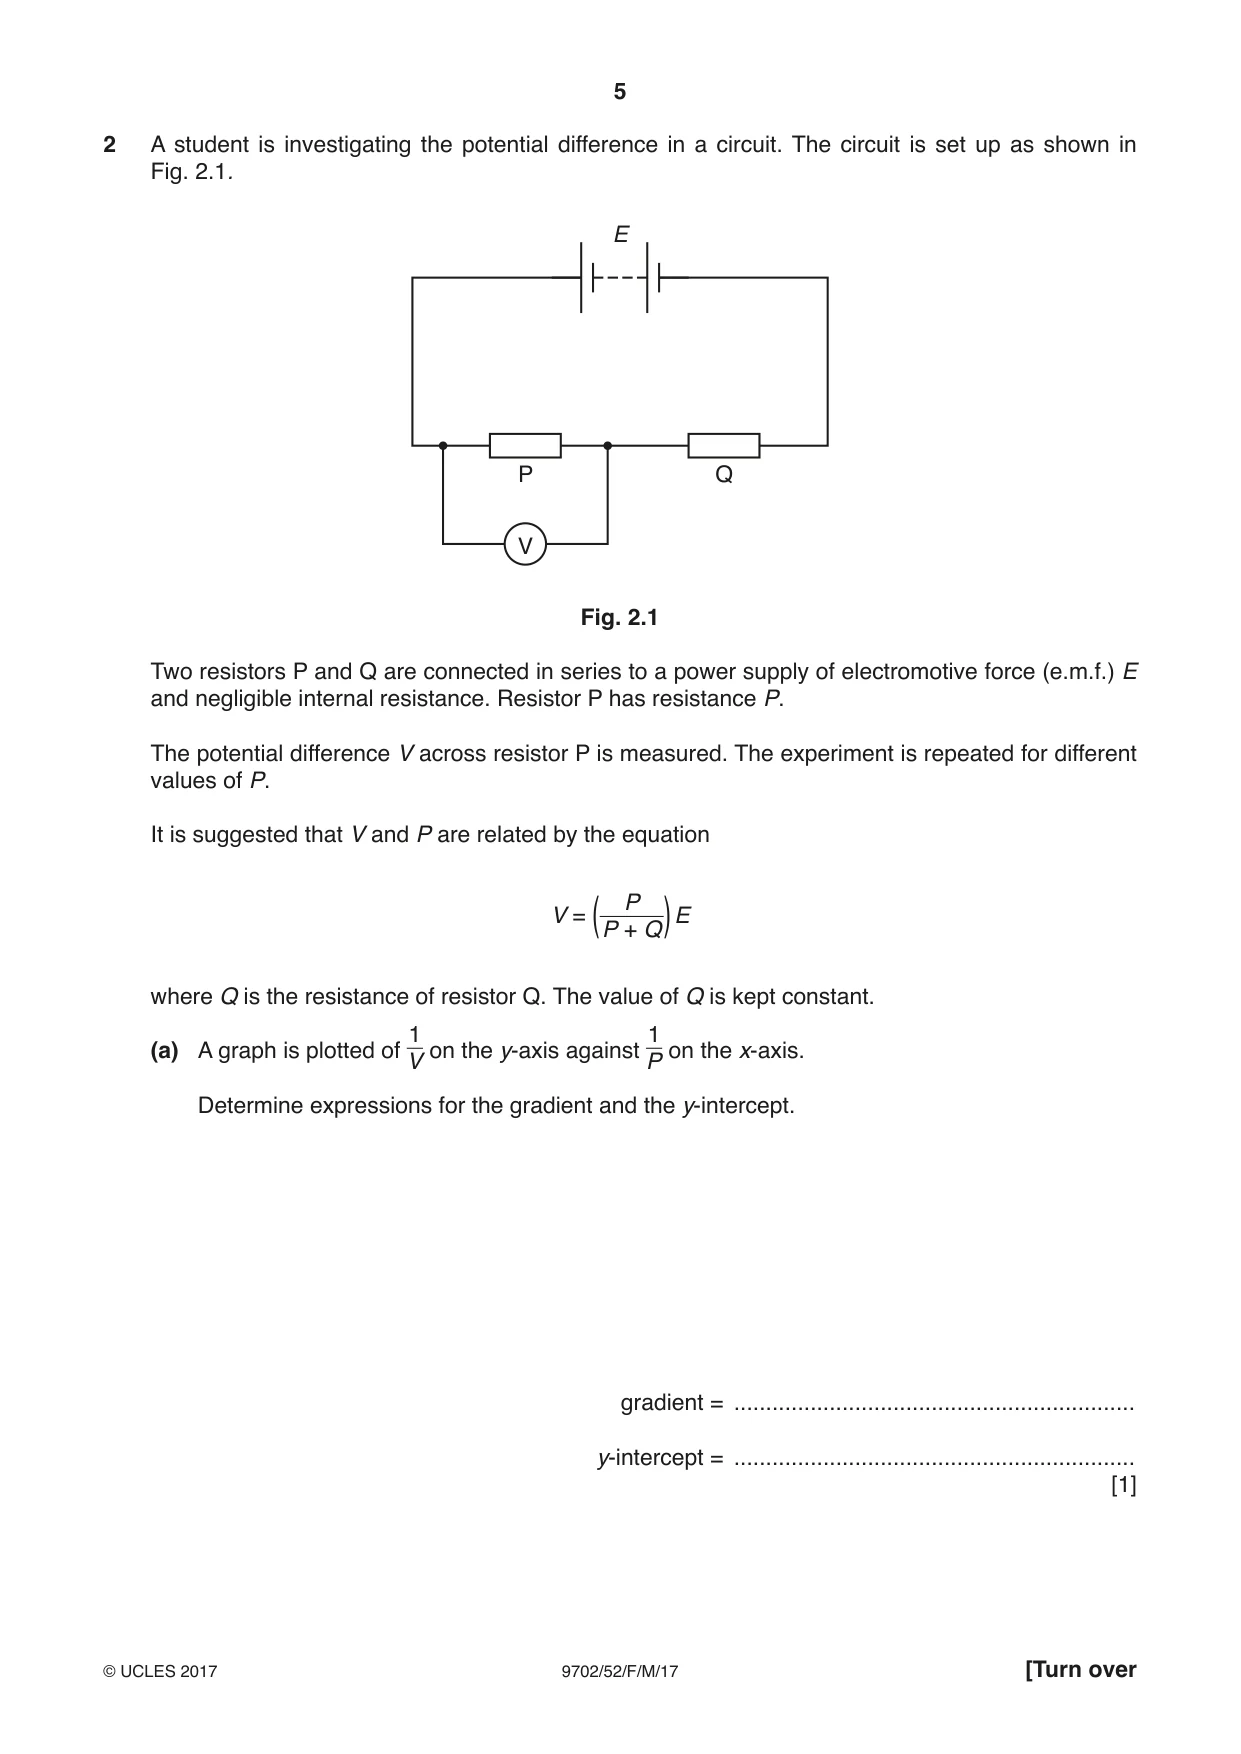
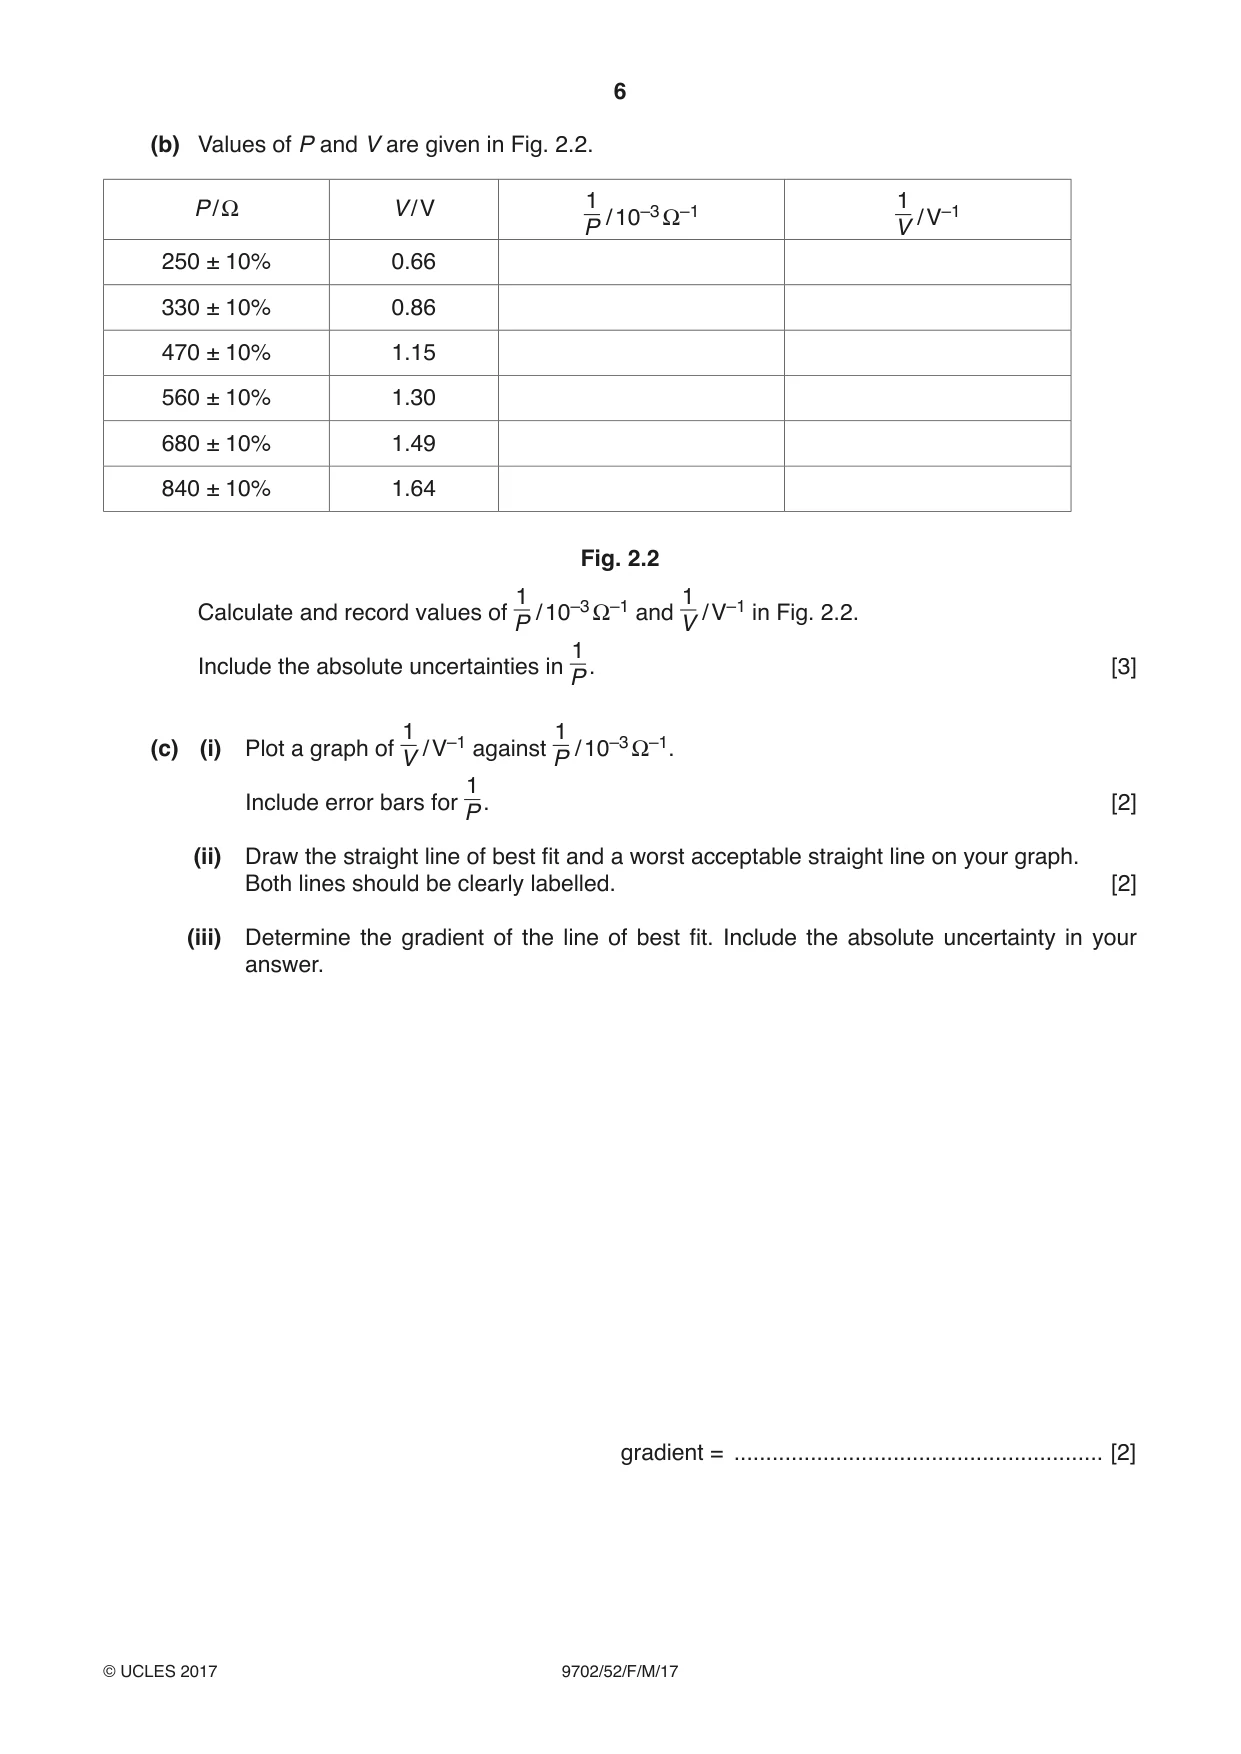
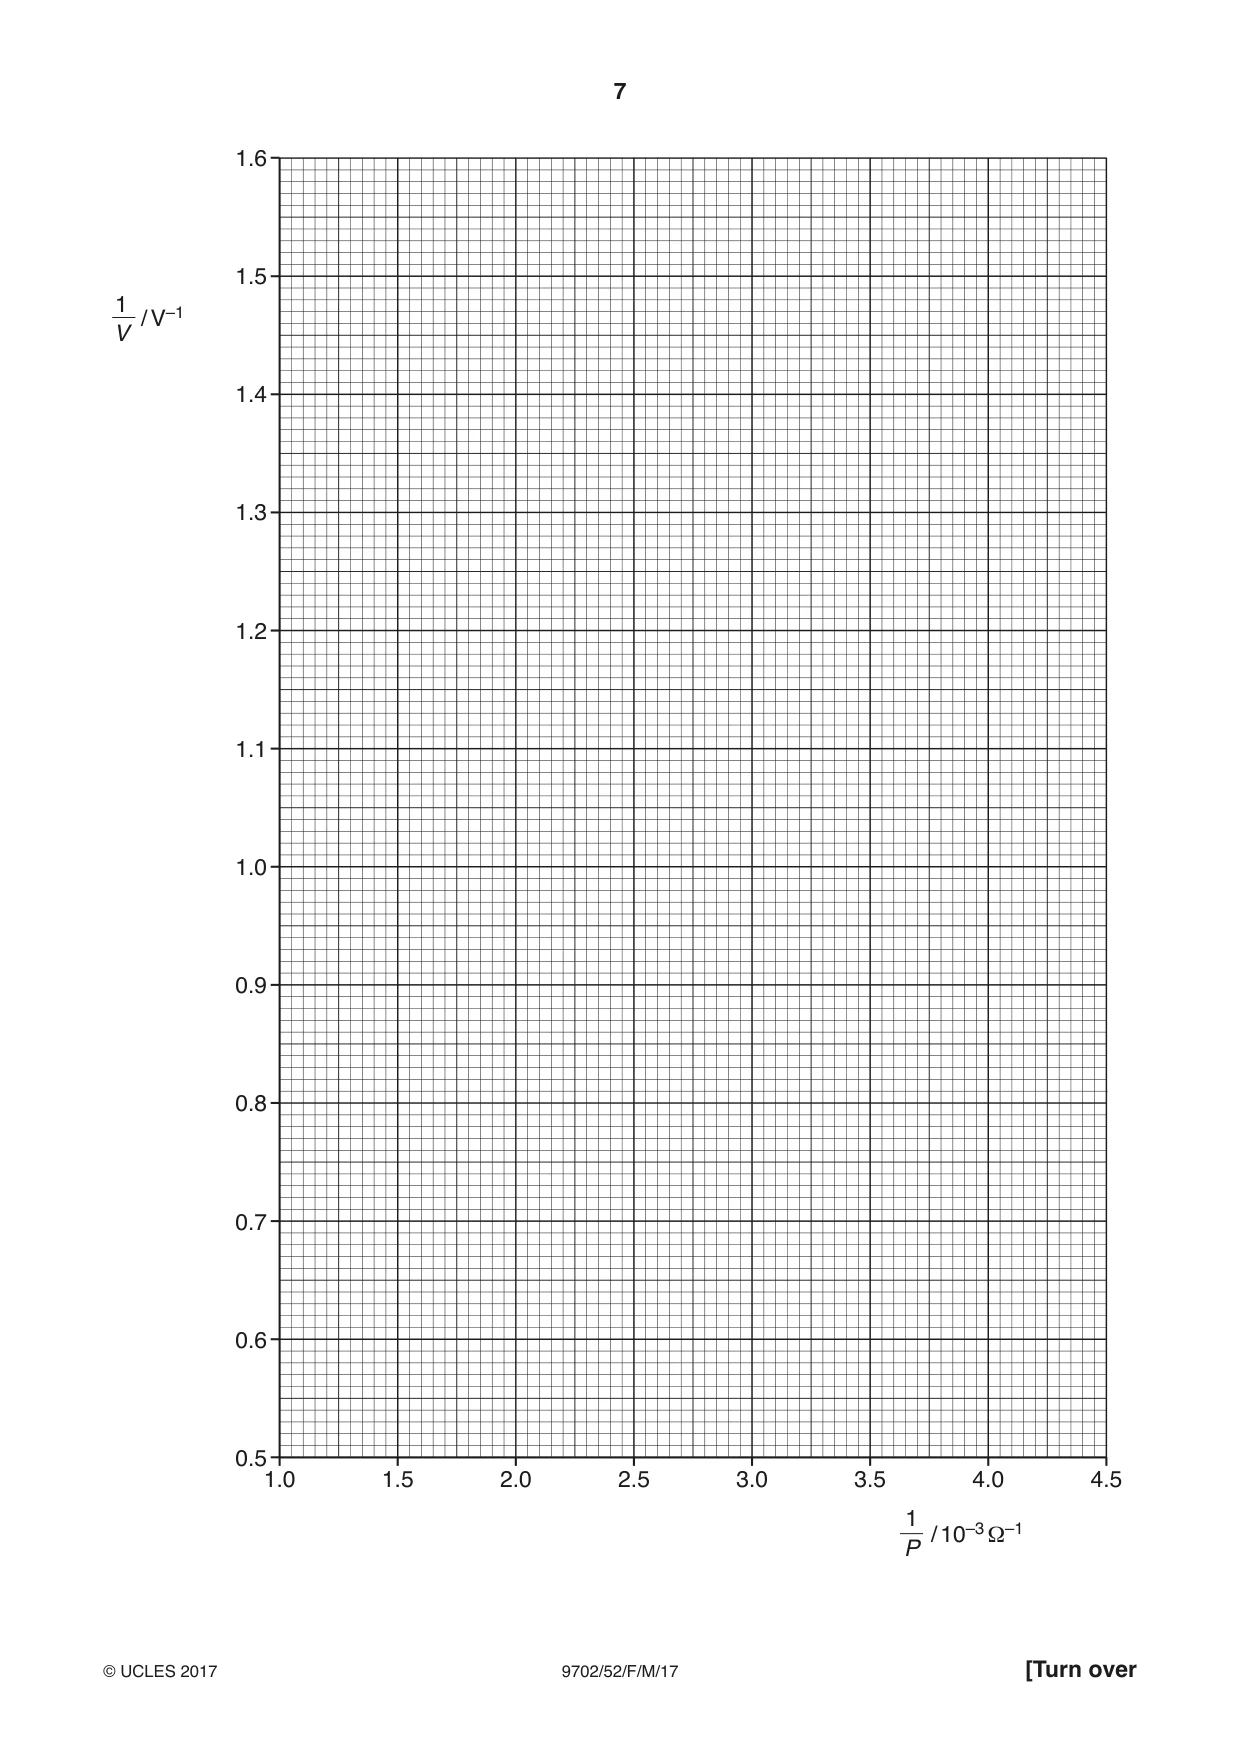
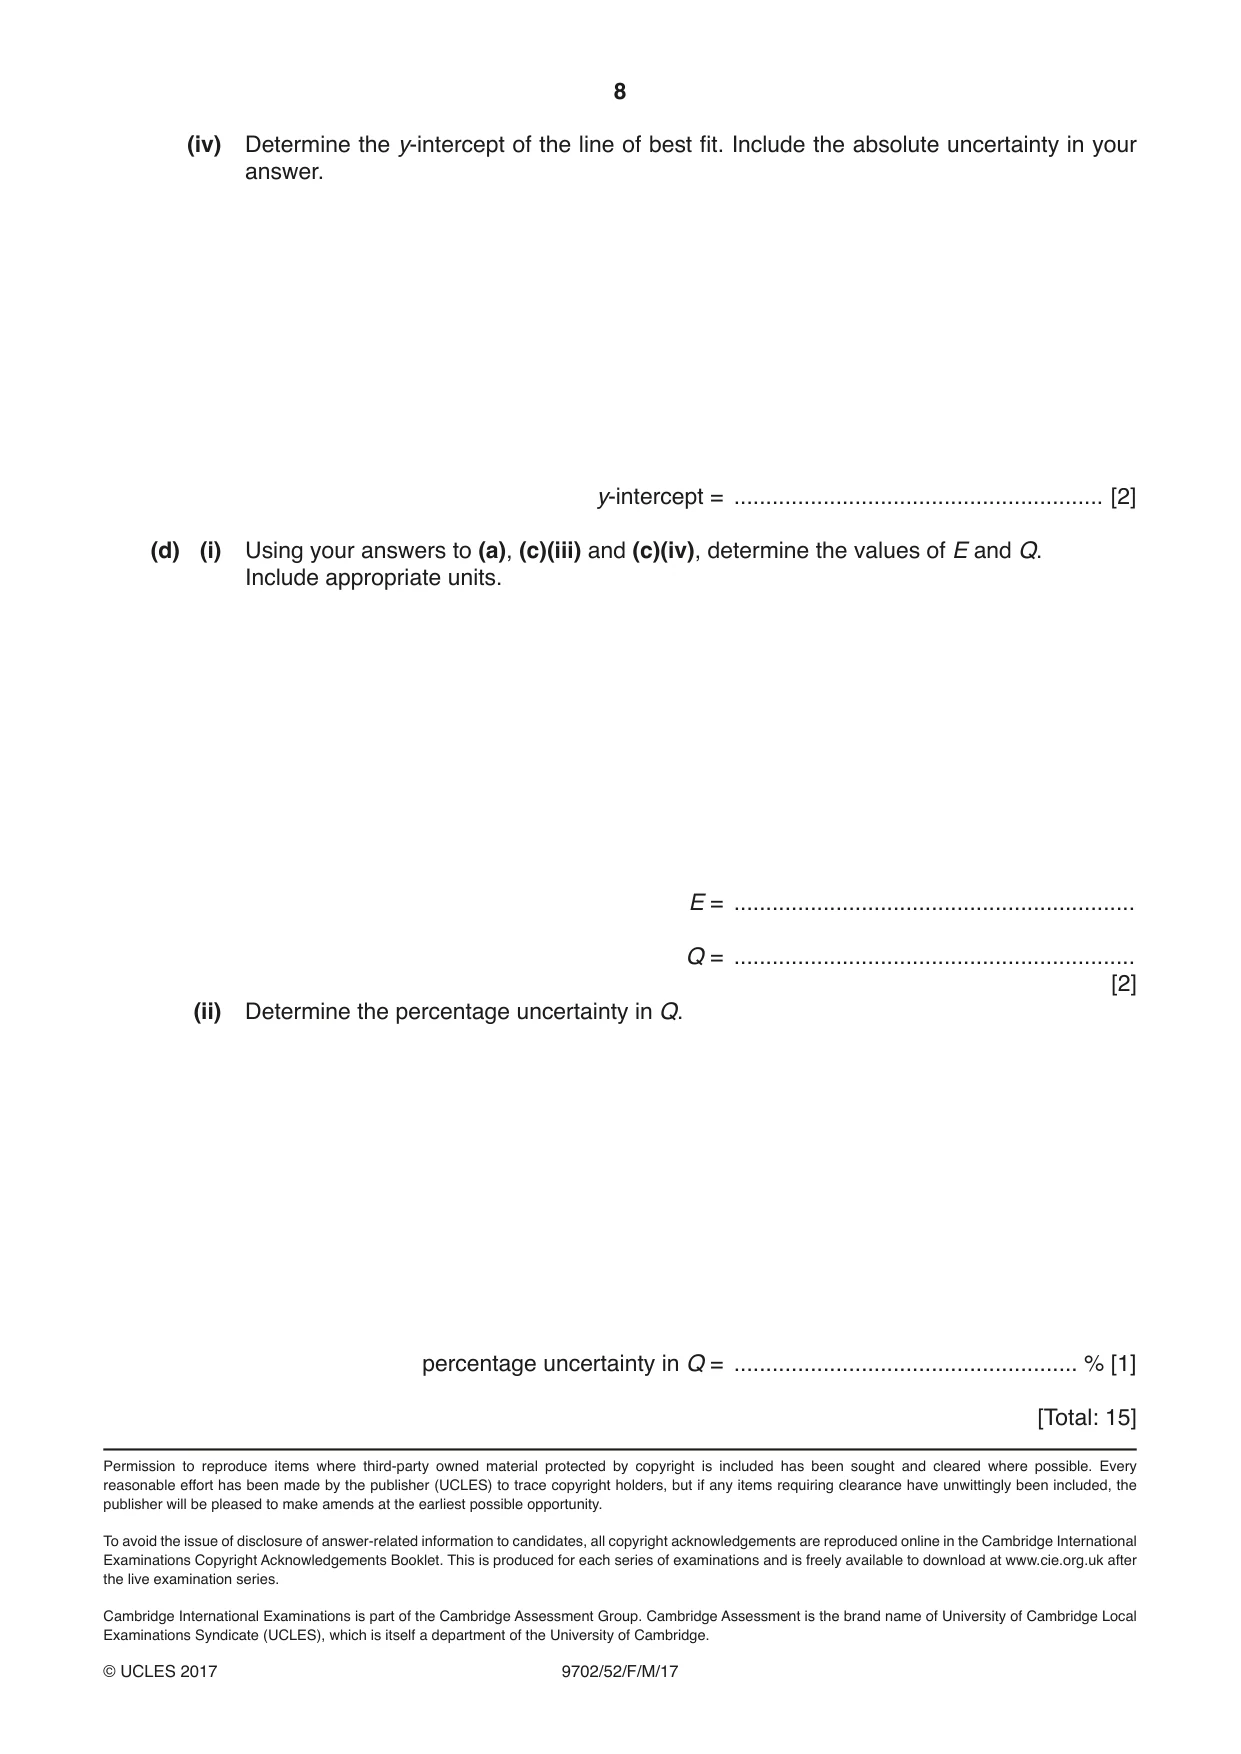
2 A student is investigating the potential difference in a circuit. The circuit is set up as shown in Fig. 2.1. E P Q V Fig. 2.1 Two resistors P and Q are connected in series to a power supply of electromotive force (e.m.f.) E and negligible internal resistance. Resistor P has resistance P. The potential difference V across resistor P is measured. The experiment is repeated for different values of P. It is suggested that V and P are related by the equation P V = E ( P + Q) where Q is the resistance of resistor Q. The value of Q is kept constant. 1 1 (a) A graph is plotted of on the y-axis against on the x-axis. V P Determine expressions for the gradient and the y-intercept. gradient = ............................................................... y-intercept = ............................................................... [1] (b) Values of P and V are given in Fig. 2.2. 1 1 P / Ω V / V / 10–3 Ω–1 / V–1 P V 250 ± 10% 0.66 330 ± 10% 0.86 470 ± 10% 1.15 560 ± 10% 1.30 680 ± 10% 1.49 840 ± 10% 1.64 Fig. 2.2 1 1 Calculate and record values of / 10–3 Ω–1 and / V–1 in Fig. 2.2. P V 1 Include the absolute uncertainties in . [3] P 1 1(c) (i) Plot a graph of / V–1 against / 10–3 Ω–1. V P 1 Include error bars for . [2] P (ii) Draw the straight line of best fit and a worst acceptable straight line on your graph. Both lines should be clearly labelled. [2] (iii) Determine the gradient of the line of best fit. Include the absolute uncertainty in your answer. gradient = .......................................................... [2]
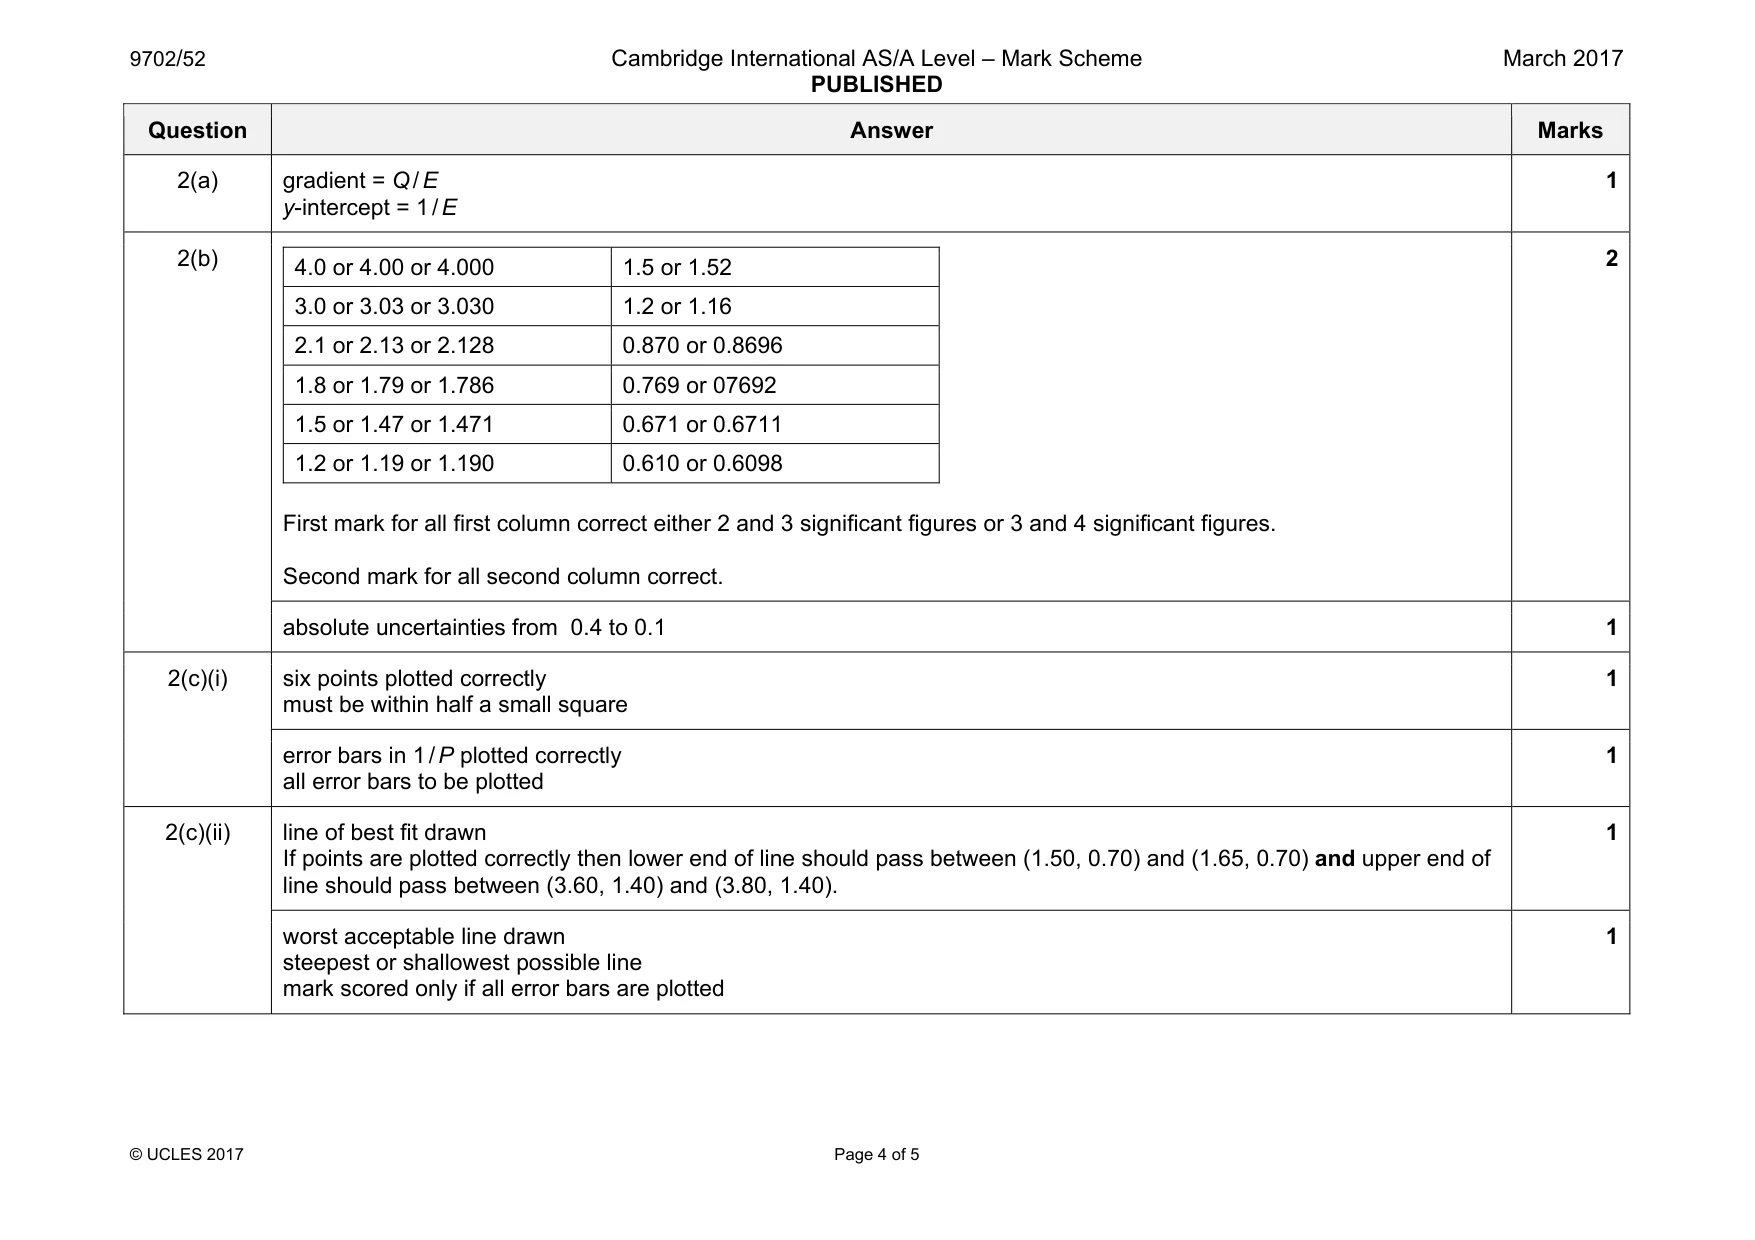
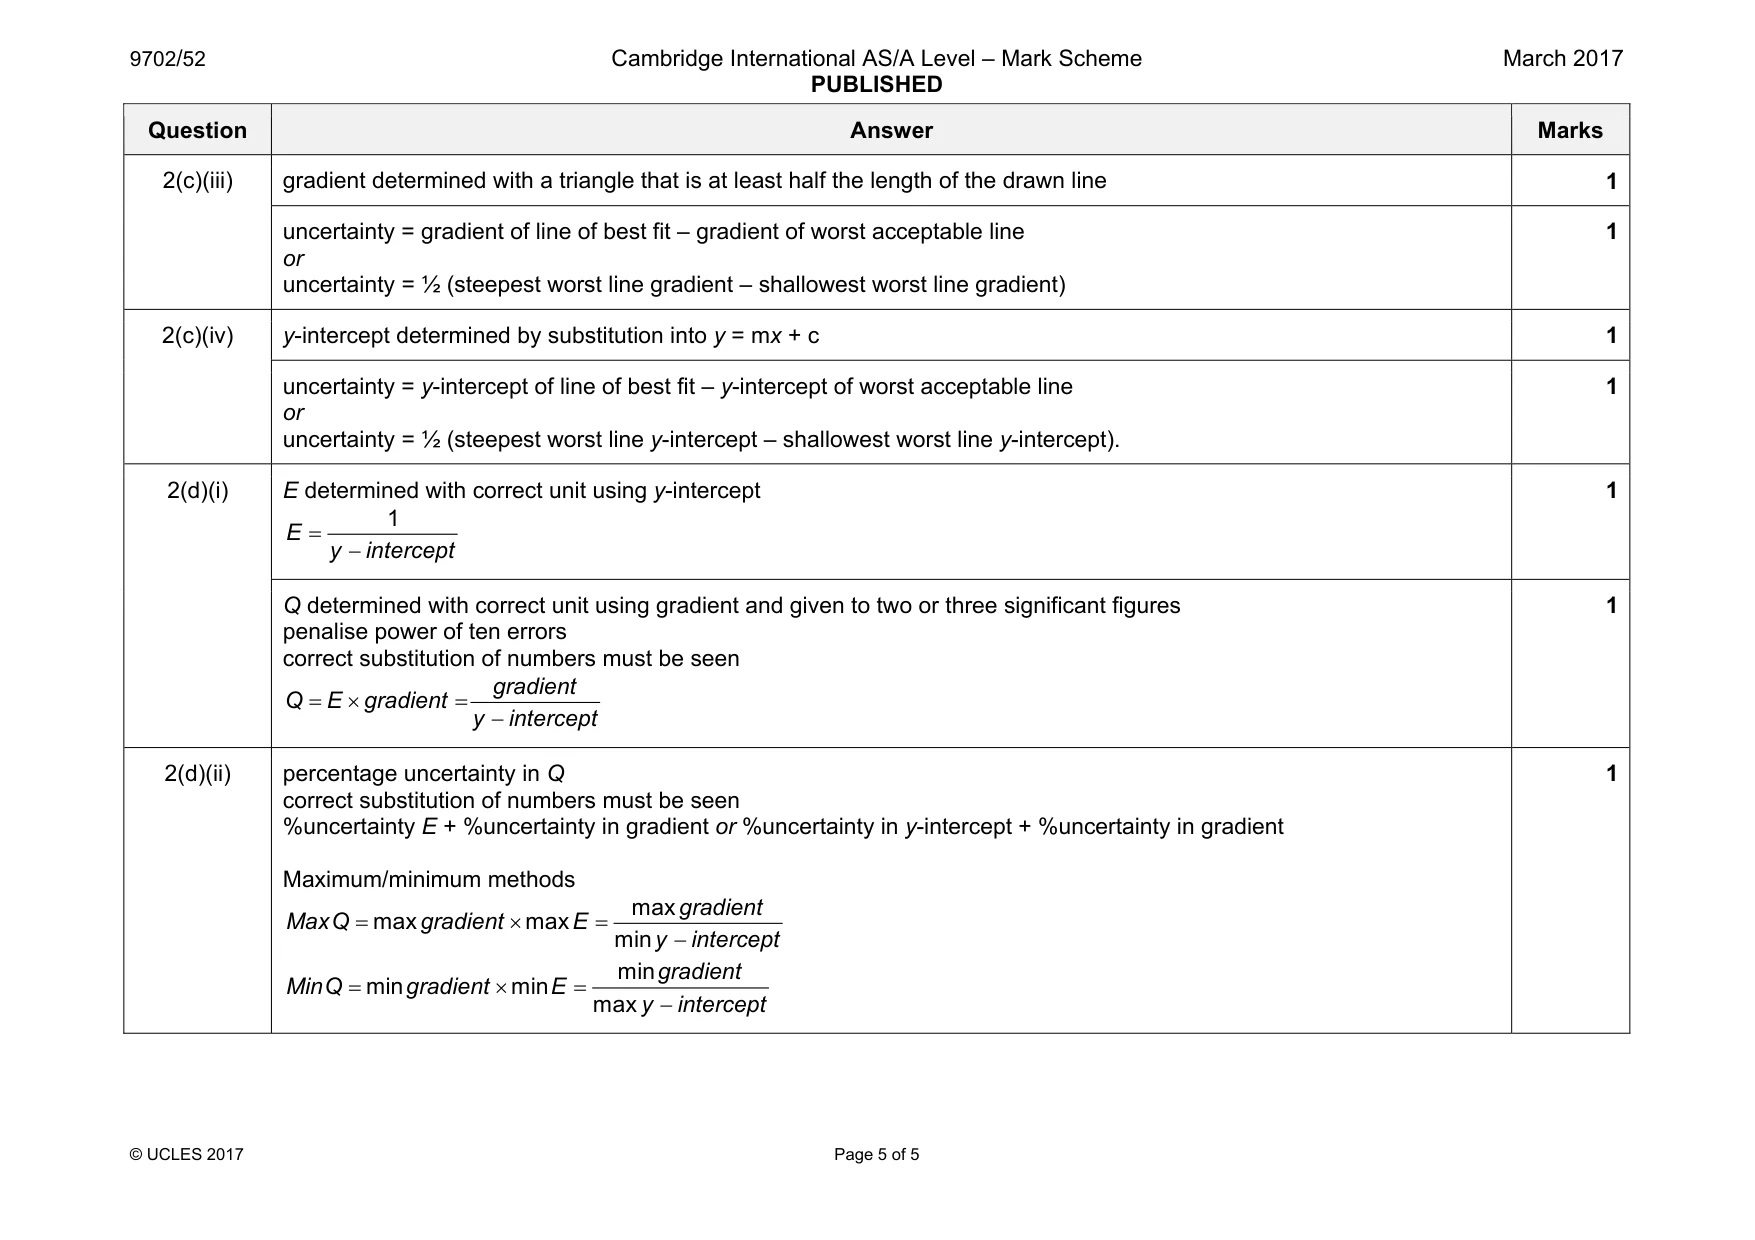
Mark scheme: 2(a) gradient = Q / E y-intercept = 1 / E 1 2(b) 4.0 or 4.00 or 4.000 1.5 or 1.52 3.0 or 3.03 or 3.030 1.2 or 1.16 2.1 or 2.13 or 2.128 0.870 or 0.8696 1.8 or 1.79 or 1.786 0.769 or 07692 1.5 or 1.47 or 1.471 0.671 or 0.6711 1.2 or 1.19 or 1.190 0.610 or 0.6098 First mark for all first column correct either 2 and 3 significant figures or 3 and 4 significant figures. Second mark for all second column correct. 2 absolute uncertainties from 0.4 to 0.1 1 2(c)(i) six points plotted correctly must be within half a small square 1 error bars in 1 / P plotted correctly all error bars to be plotted 1 2(c)(ii) line of best fit drawn If points are plotted correctly then lower end of line should pass between (1.50, 0.70) and (1.65, 0.70) and upper end of line should pass between (3.60, 1.40) and (3.80, 1.40). 1 worst acceptable line drawn steepest or shallowest possible line mark scored only if all error bars are plotted 1 Question Answer Marks 2(c)(iii) gradient determined with a triangle that is at least half the length of the drawn line 1 uncertainty = gradient of line of best fit – gradient of worst acceptable line or uncertainty = ½ (steepest worst line gradient – shallowest worst line gradient) 1 2(c)(iv) y-intercept determined by substitution into y = mx + c 1 uncertainty = y-intercept of line of best fit – y-intercept of worst acceptable line or uncertainty = ½ (steepest worst line y-intercept – shallowest worst line y-intercept). 1 2(d)(i) E determined with correct unit using y-intercept 1 E y intercept = − 1 Q determined with correct unit using gradient and given to two or three significant figures penalise power of ten errors correct substitution of numbers must be seen gradient Q E gradient y intercept = × = − 1 2(d)(ii) percentage uncertainty in Q correct substitution of numbers must be seen %uncertainty E + %uncertainty in gradient or %uncertainty in y-intercept + %uncertainty in gradient Maximum/minimum methods max max max min gradient MaxQ gradient E y intercept = × = − min min min max gradient MinQ gradient E y intercept = × = − 1
What was in this paper
The subtopics covered by these 2 questions, and how many questions each got. Open one in a new tab to see every Cambridge question on it.
What you needed in this session
Cambridge’s own grade thresholds for 2017 Feb/March, Paper 5 · Variant 2. A higher threshold means an easier paper — the bar moves with how the cohort did.