Cambridge A Level Physics 9702 — 2016 May/June Paper 3 · Variant 3
9702/33/M/J/16 · 2 questions · 40 marks · ≈45 min
The question paper and its mark scheme, free to read here and free to download. This is Cambridge’s own paper, exactly as it was sat.
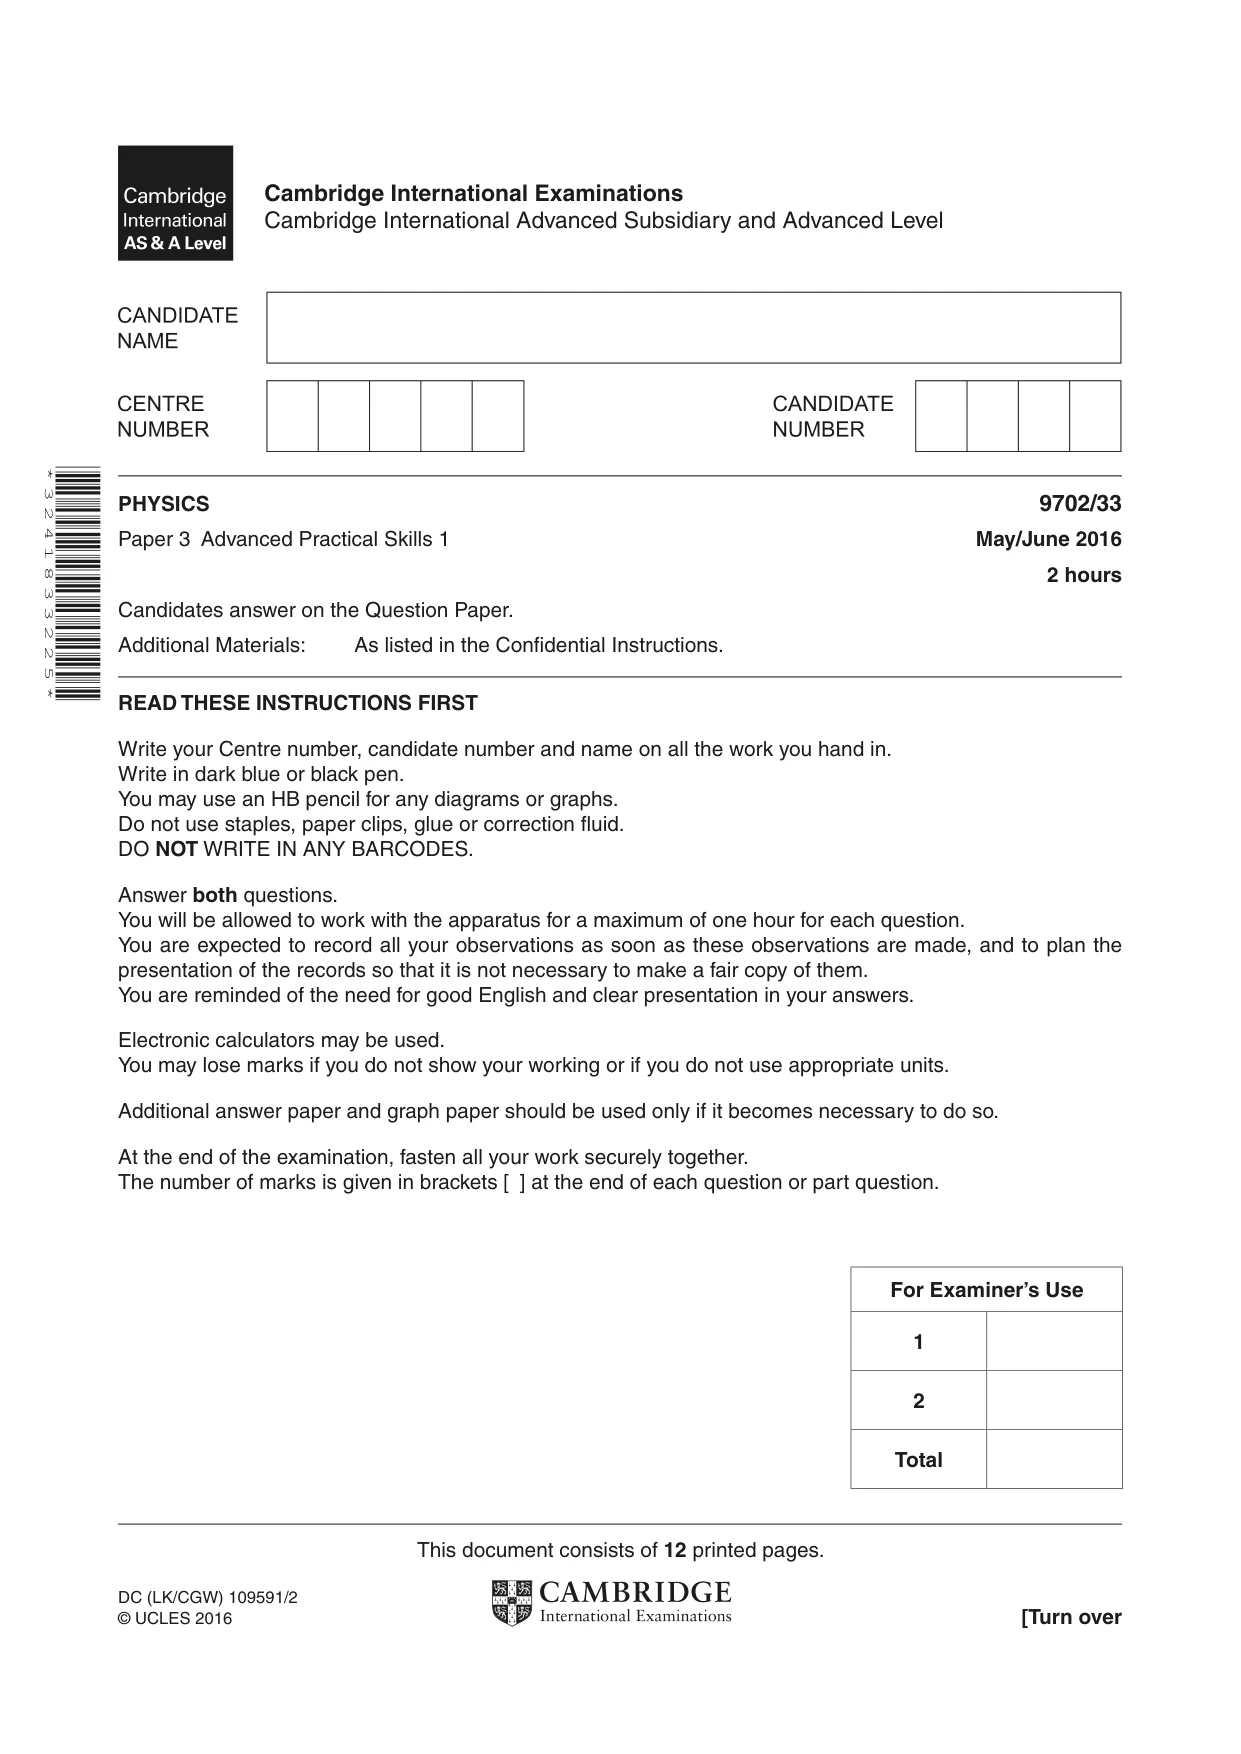
Question paper12 pages
Mark scheme4 pages
Answers below. Sit the paper first if you are practising.
Questions as text
Q1 · In this experiment, you will investigate a wooden strip acted on by several forces
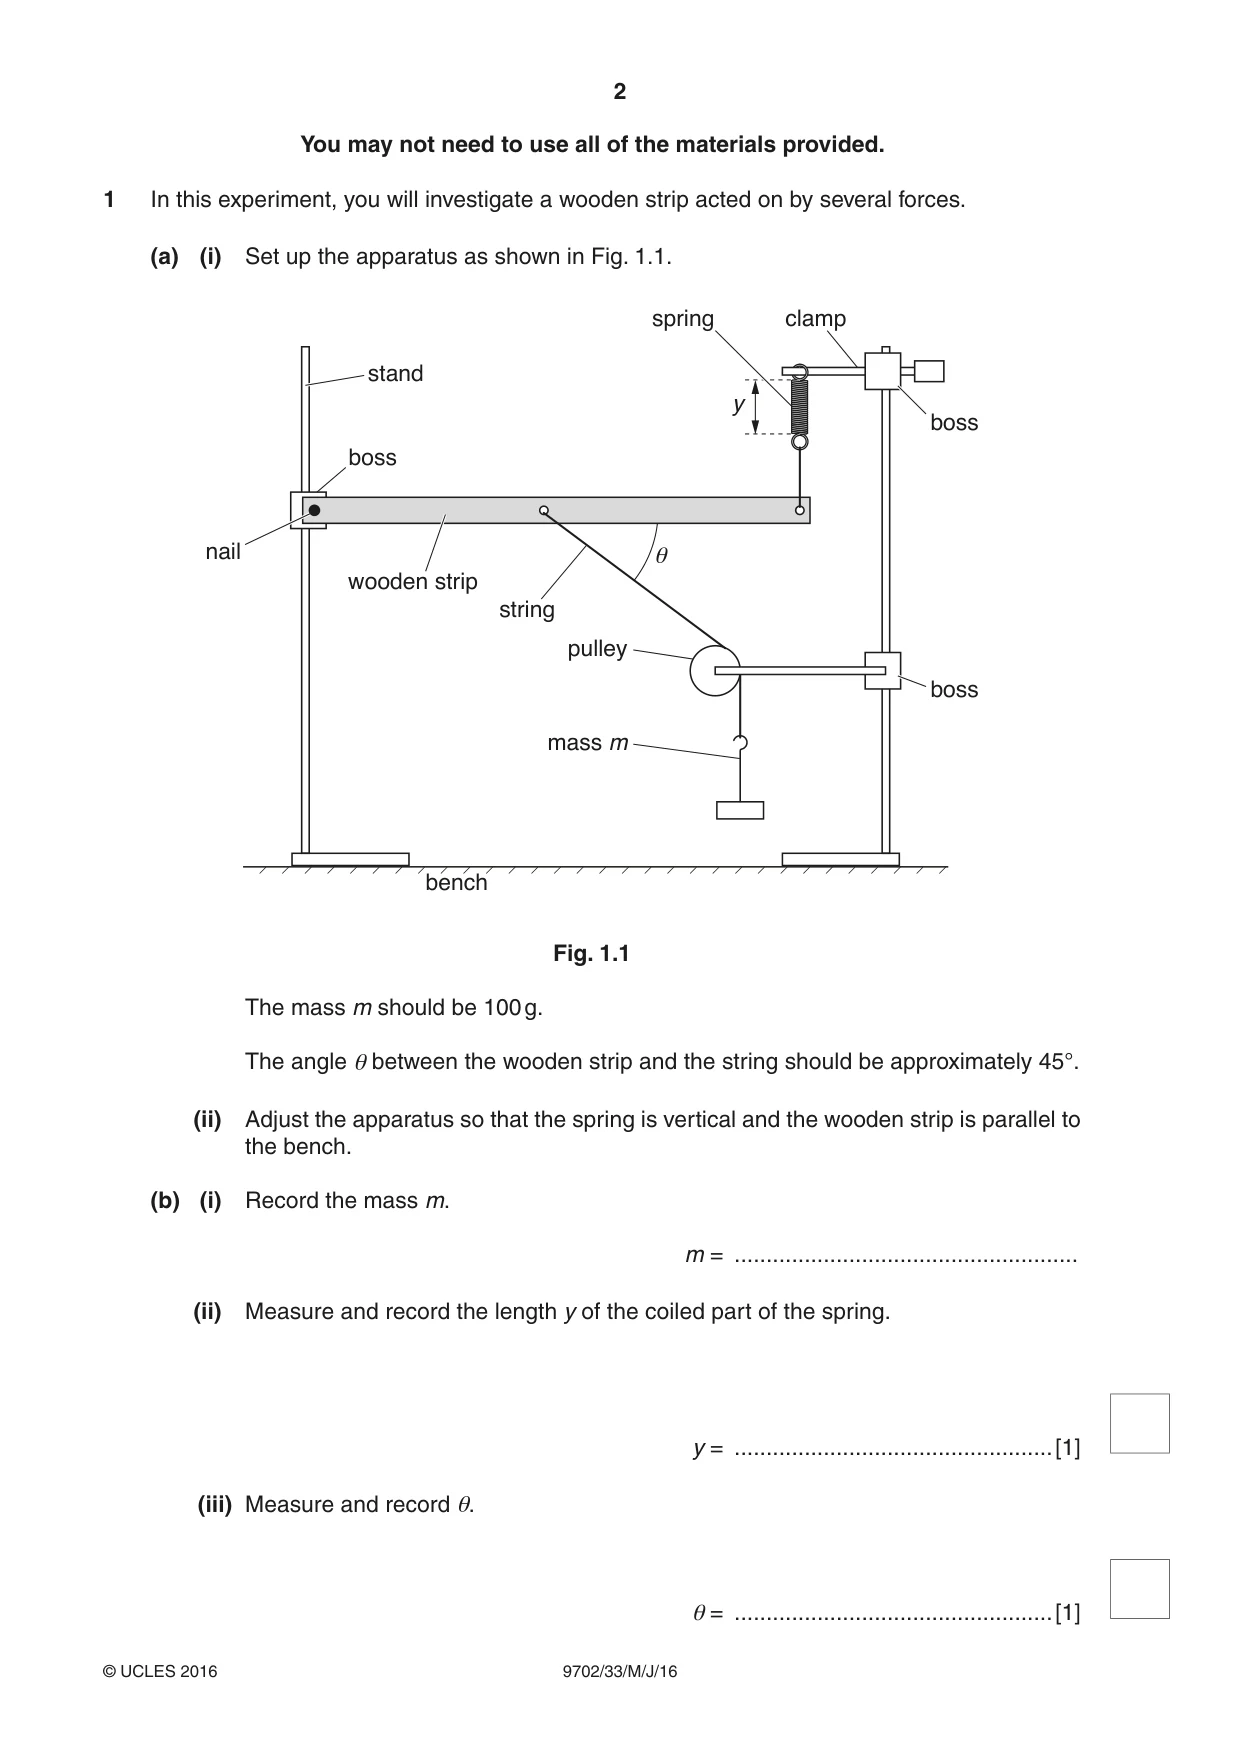
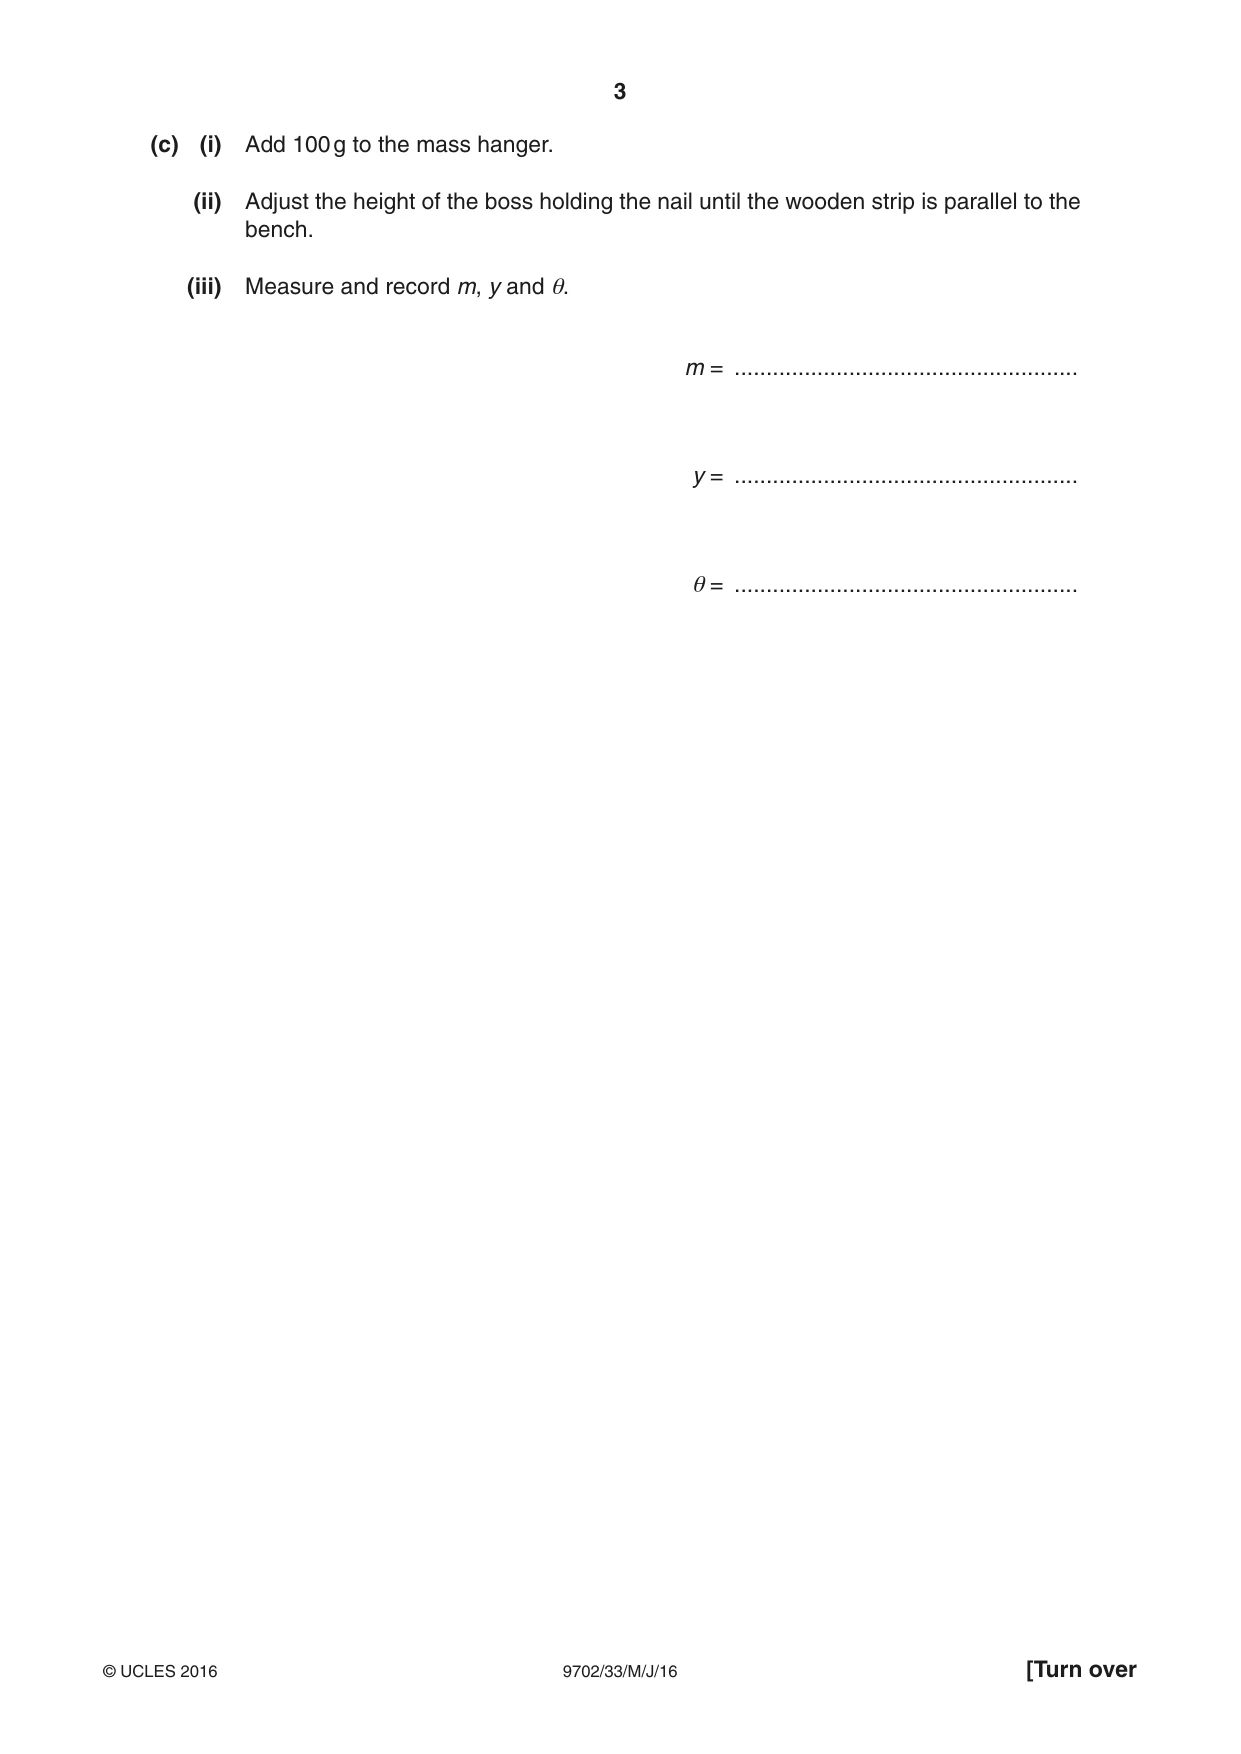
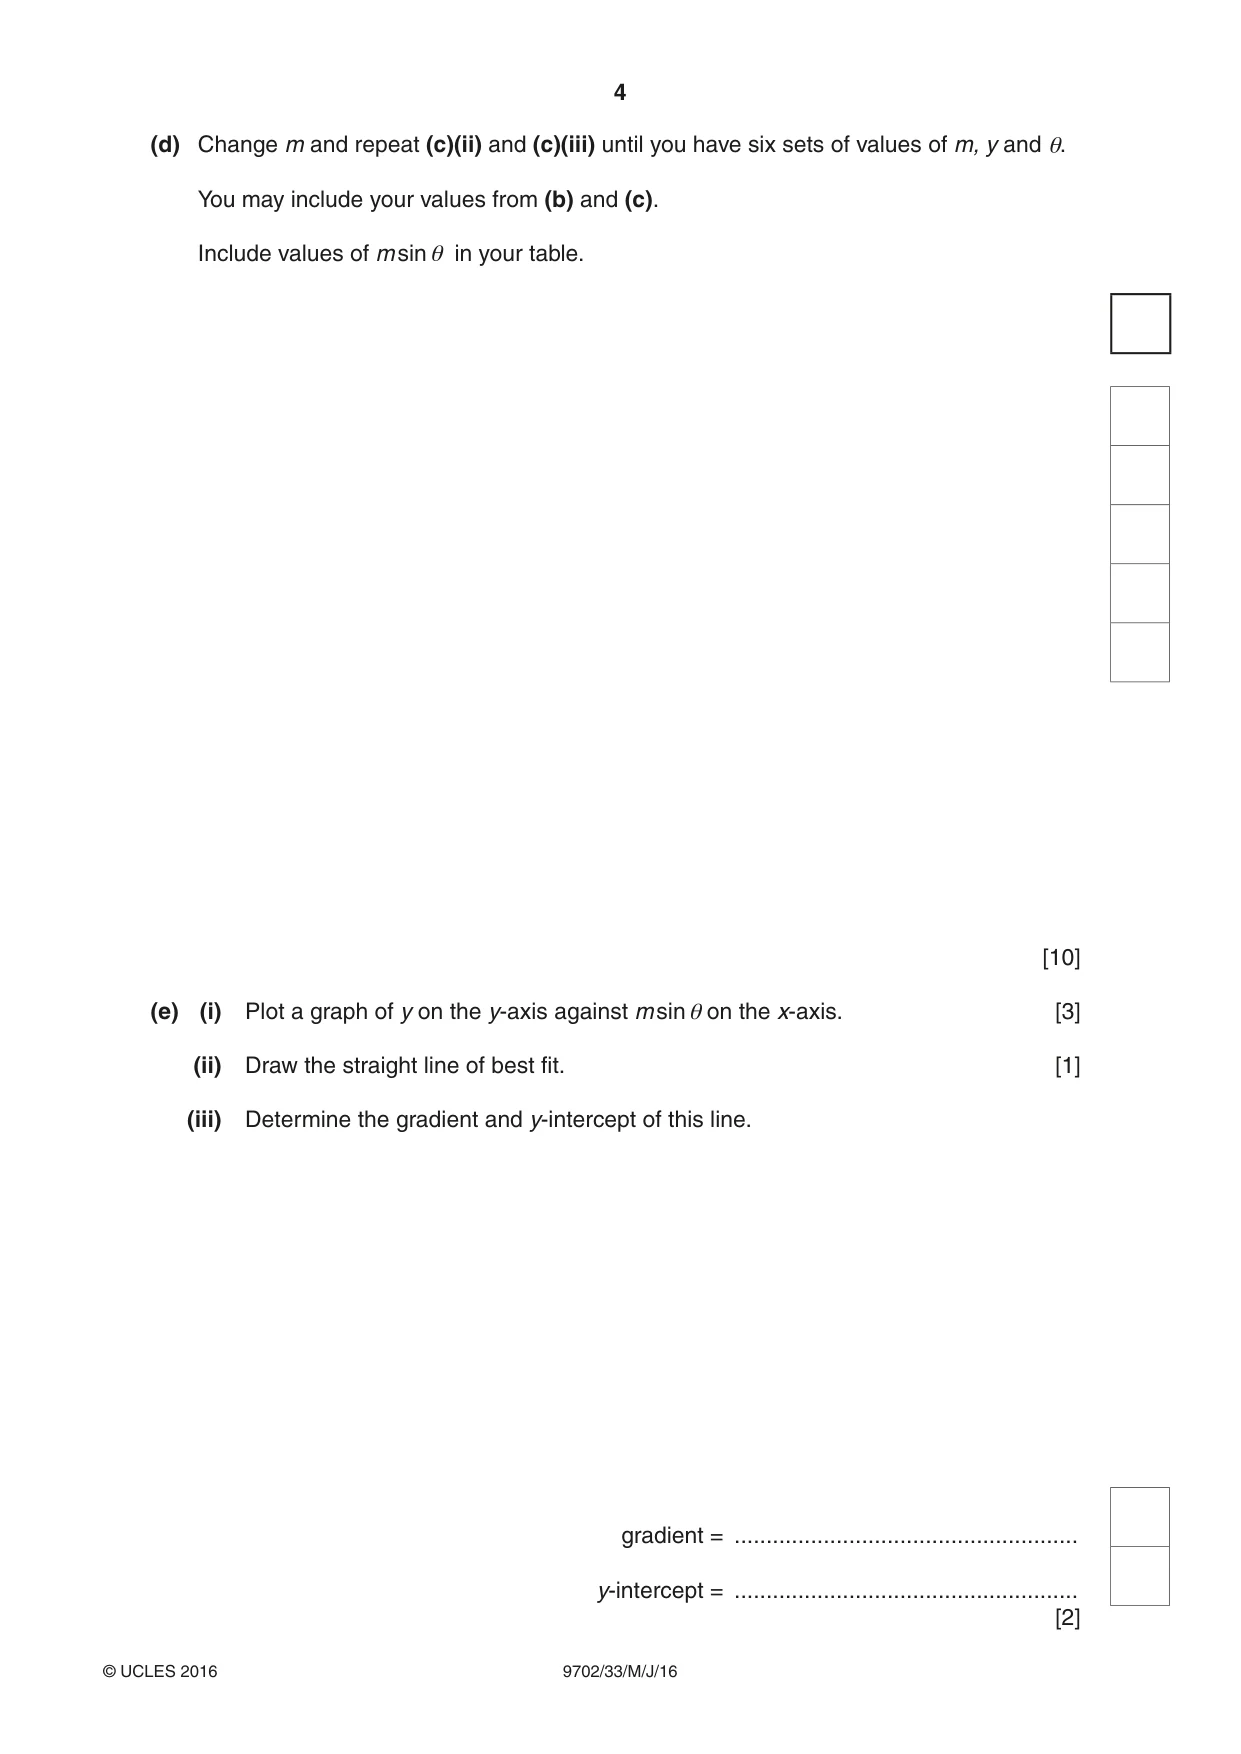
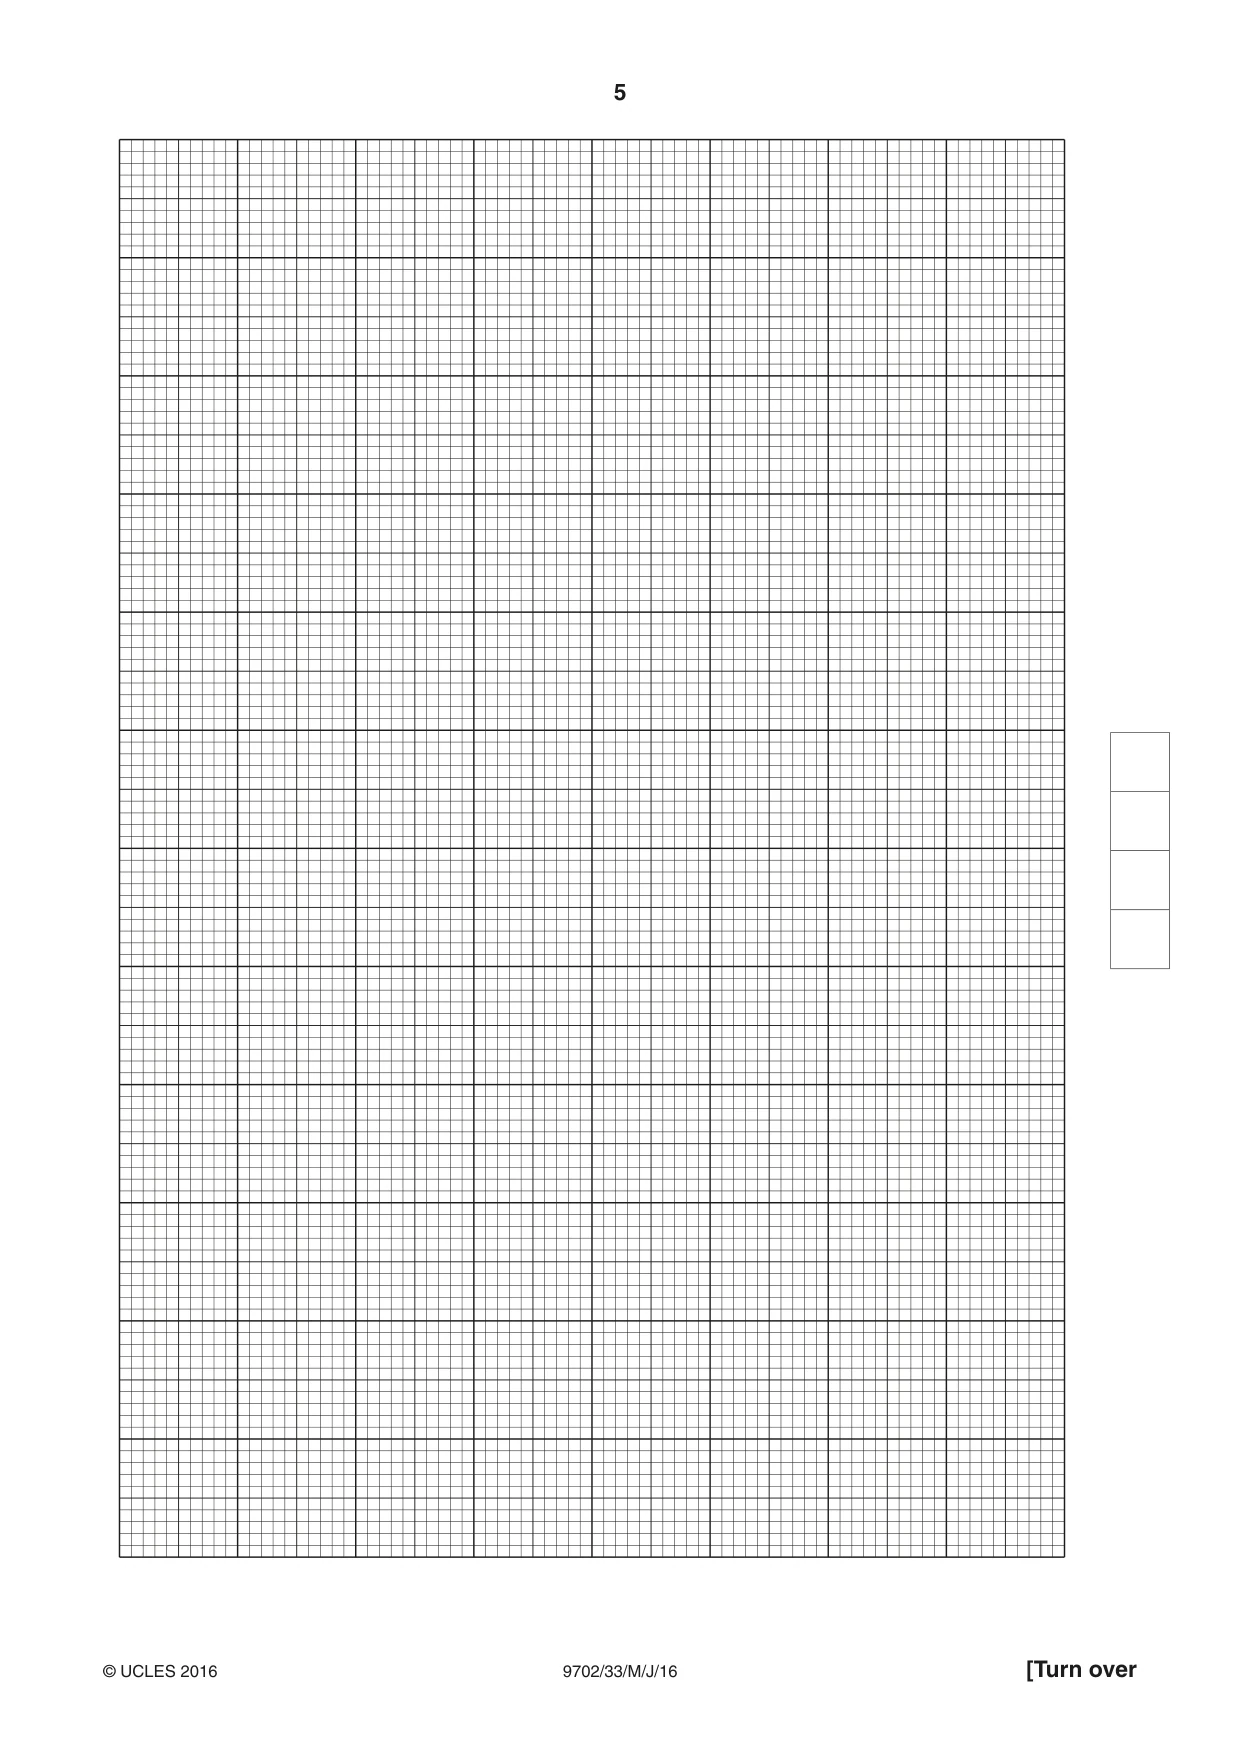
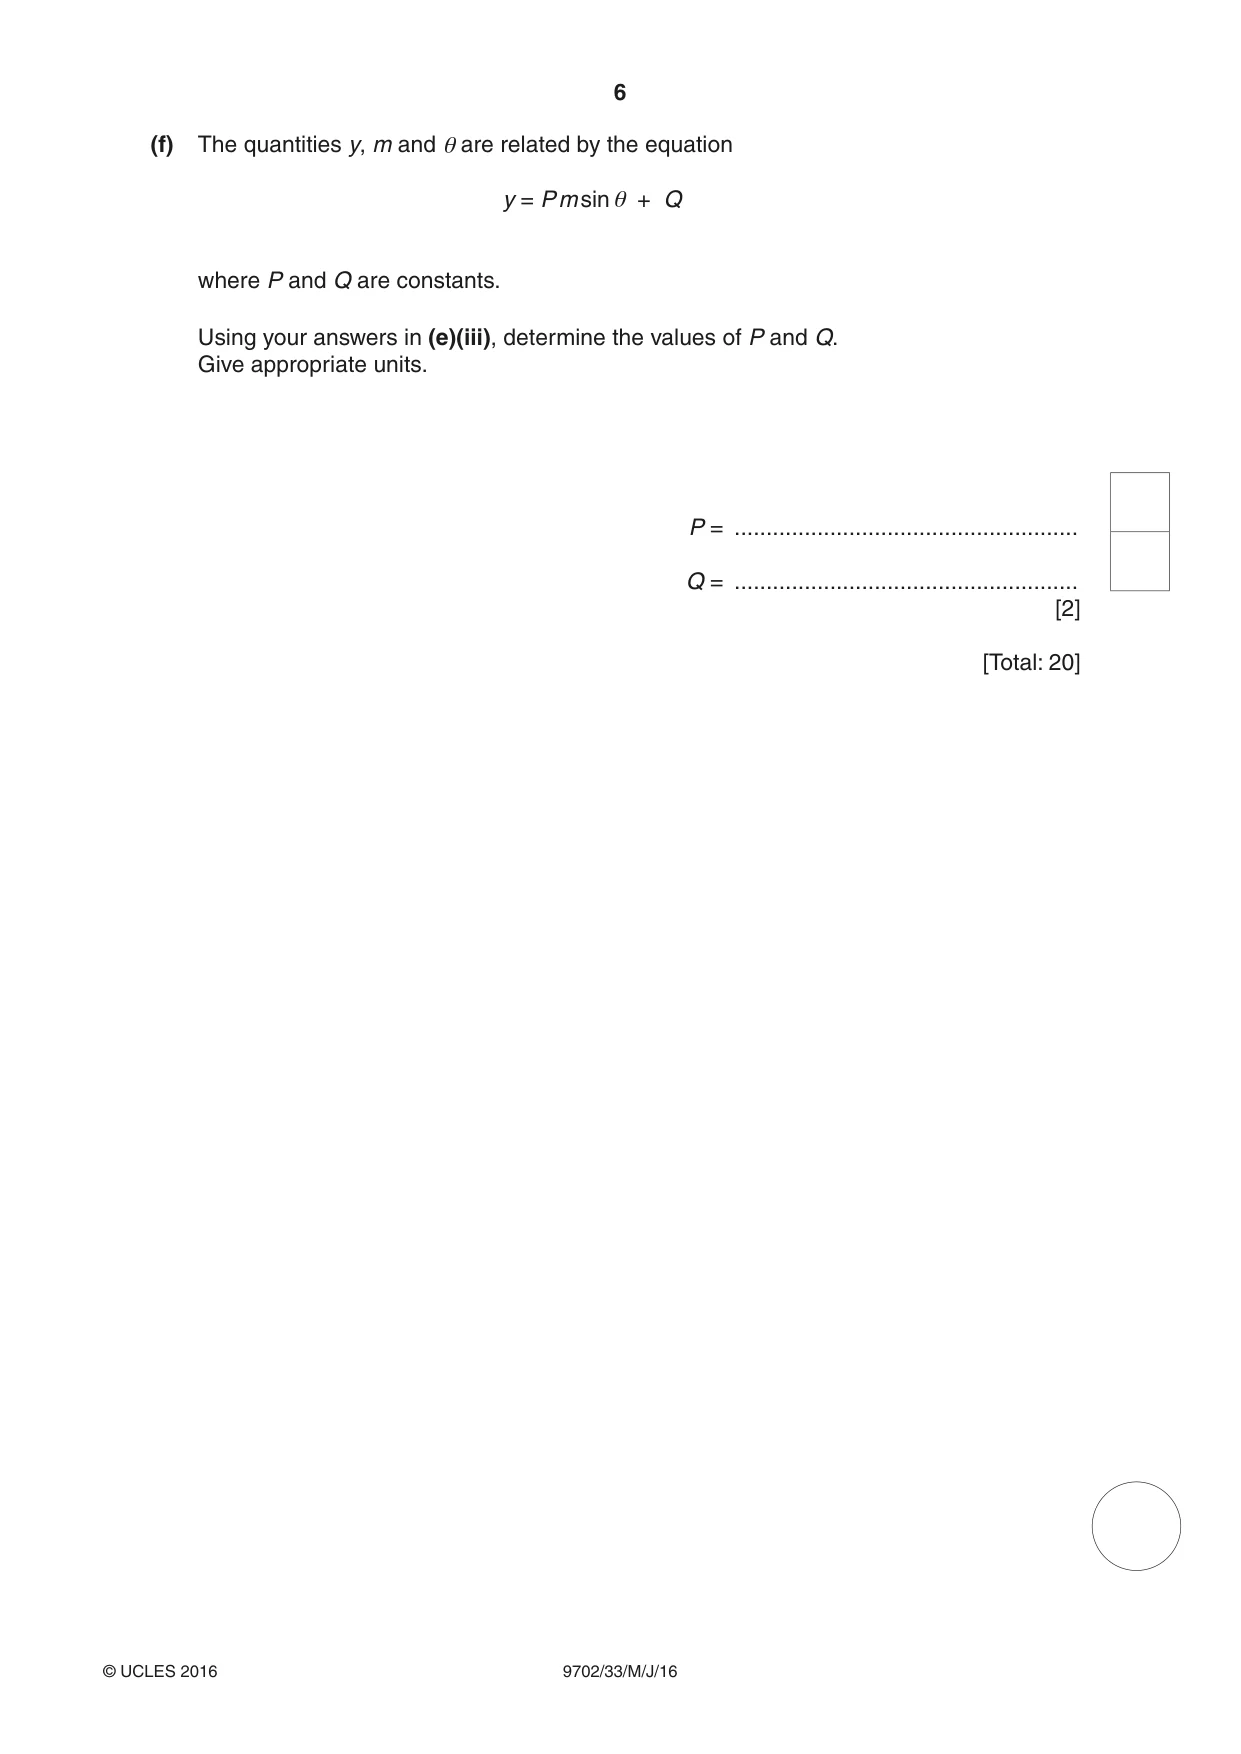
1 In this experiment, you will investigate a wooden strip acted on by several forces. (a) (i) Set up the apparatus as shown in Fig. 1.1. spring clamp stand y boss boss nail θ wooden strip string pulley boss mass m bench Fig. 1.1 The mass m should be 100 g. The angle θ between the wooden strip and the string should be approximately 45°. (ii) Adjust the apparatus so that the spring is vertical and the wooden strip is parallel to the bench. (b) (i) Record the mass m. m = ...................................................... (ii) Measure and record the length y of the coiled part of the spring. y = ..................................................[1] (iii) Measure and record θ. θ = ..................................................[1] (c) (i) Add 100 g to the mass hanger. (ii) Adjust the height of the boss holding the nail until the wooden strip is parallel to the bench. (iii) Measure and record m, y and θ. m = ...................................................... y = ...................................................... θ = ...................................................... (d) Change m and repeat (c)(ii) and (c)(iii) until you have six sets of values of m, y and θ. You may include your values from (b) and (c). Include values of m sin θ in your table. [10] (e) (i) Plot a graph of y on the y-axis against m sin θ on the x-axis. [3] (ii) Draw the straight line of best fit. [1] (iii) Determine the gradient and y-intercept of this line. gradient = ...................................................... y-intercept = ...................................................... [2] (f) The quantities y, m and θ are related by the equation y = P m sin θ + Q where P and Q are constants. Using your answers in (e)(iii), determine the values of P and Q. Give appropriate units. P = ...................................................... Q = ...................................................... [2] [Total: 20] You may not need to use all of the materials provided.
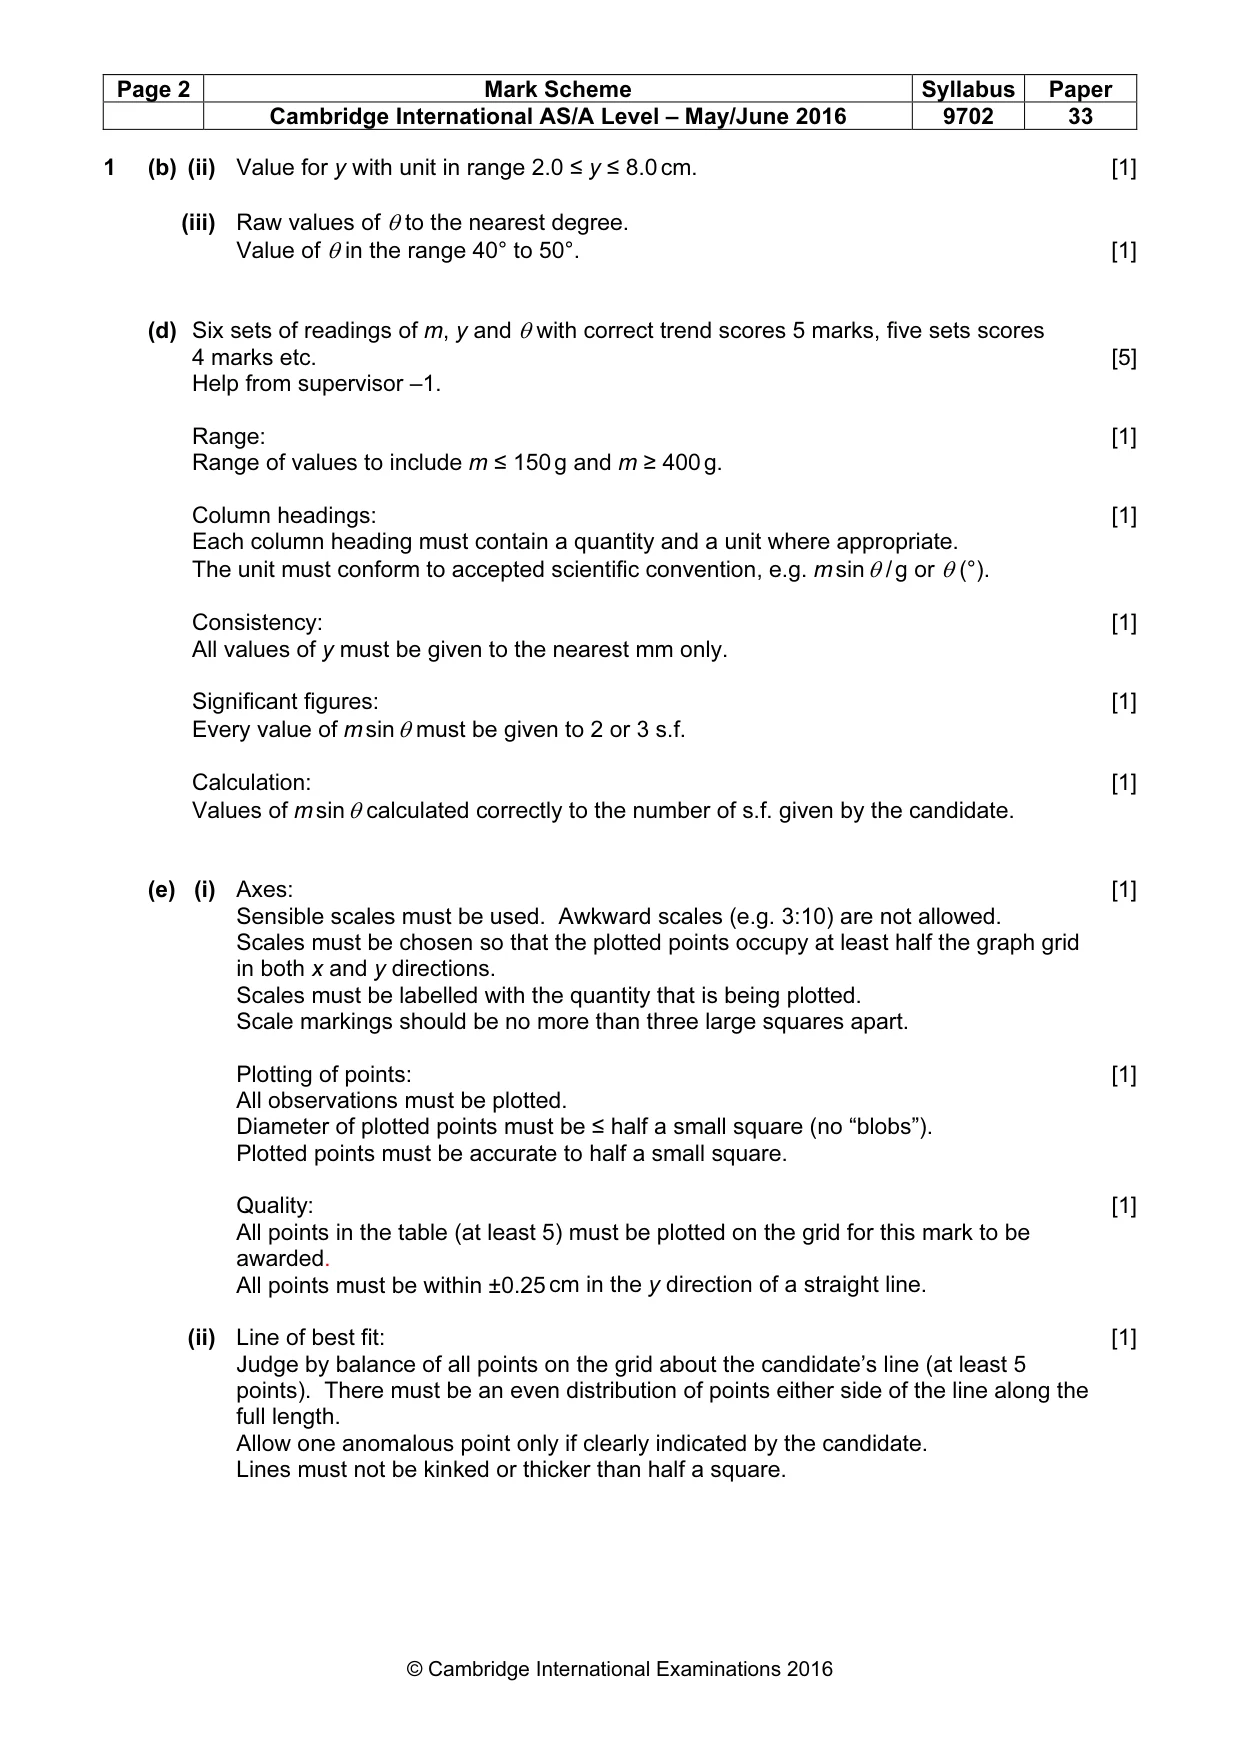
Mark scheme: 1 (b) (ii) Value for y with unit in range 2.0 ≤ y ≤ 8.0 cm. [1] (iii) Raw values of θ to the nearest degree. Value of θ in the range 40° to 50°. [1] (d) Six sets of readings of m, y and θ with correct trend scores 5 marks, five sets scores 4 marks etc. [5] Help from supervisor –1. Range: [1] Range of values to include m ≤ 150 g and m ≥ 400 g. Column headings: [1] Each column heading must contain a quantity and a unit where appropriate. The unit must conform to accepted scientific convention, e.g. m sin θ / g or θ (°). Consistency: [1] All values of y must be given to the nearest mm only. Significant figures: [1] Every value of m sin θ must be given to 2 or 3 s.f. Calculation: [1] Values of m sin θ calculated correctly to the number of s.f. given by the candidate. (e) (i) Axes: [1] Sensible scales must be used. Awkward scales (e.g. 3:10) are not allowed. Scales must be chosen so that the plotted points occupy at least half the graph grid in both x and y directions. Scales must be labelled with the quantity that is being plotted. Scale markings should be no more than three large squares apart. Plotting of points: [1] All observations must be plotted. Diameter of plotted points must be ≤ half a small square (no “blobs”). Plotted points must be accurate to half a small square. Quality: [1] All points in the table (at least 5) must be plotted on the grid for this mark to be awarded. All points must be within ±0.25 cm in the y direction of a straight line. (ii) Line of best fit: [1] Judge by balance of all points on the grid about the candidate’s line (at least 5 points). There must be an even distribution of points either side of the line along the full length. Allow one anomalous point only if clearly indicated by the candidate. Lines must not be kinked or thicker than half a square. (iii) Gradient: [1] The hypotenuse of the triangle must be greater than half of the length of the drawn line. The method of calculation must be correct. Both read-offs must be accurate to half a small square in both the x and y directions. y-intercept: [1] Either: Correct read-off from a point on the line and substituted into y = mx + c. Read-offs must be accurate to half a small square in both x and y directions. Or: Intercept read off directly from the graph (accurate to half a small square). (f) Value of P = candidate’s gradient and value of Q = candidate’s intercept. [1] Do not allow fractions. Unit for P correct (m kg–1 or cm kg–1 or mm kg–1 or m g–1 or cm g–1 or mm g–1) and consistent with value. Unit for Q correct (m or cm or mm) and consistent with value. [1]
Q2 · In this experiment, you will investigate the movement of a loaded wire
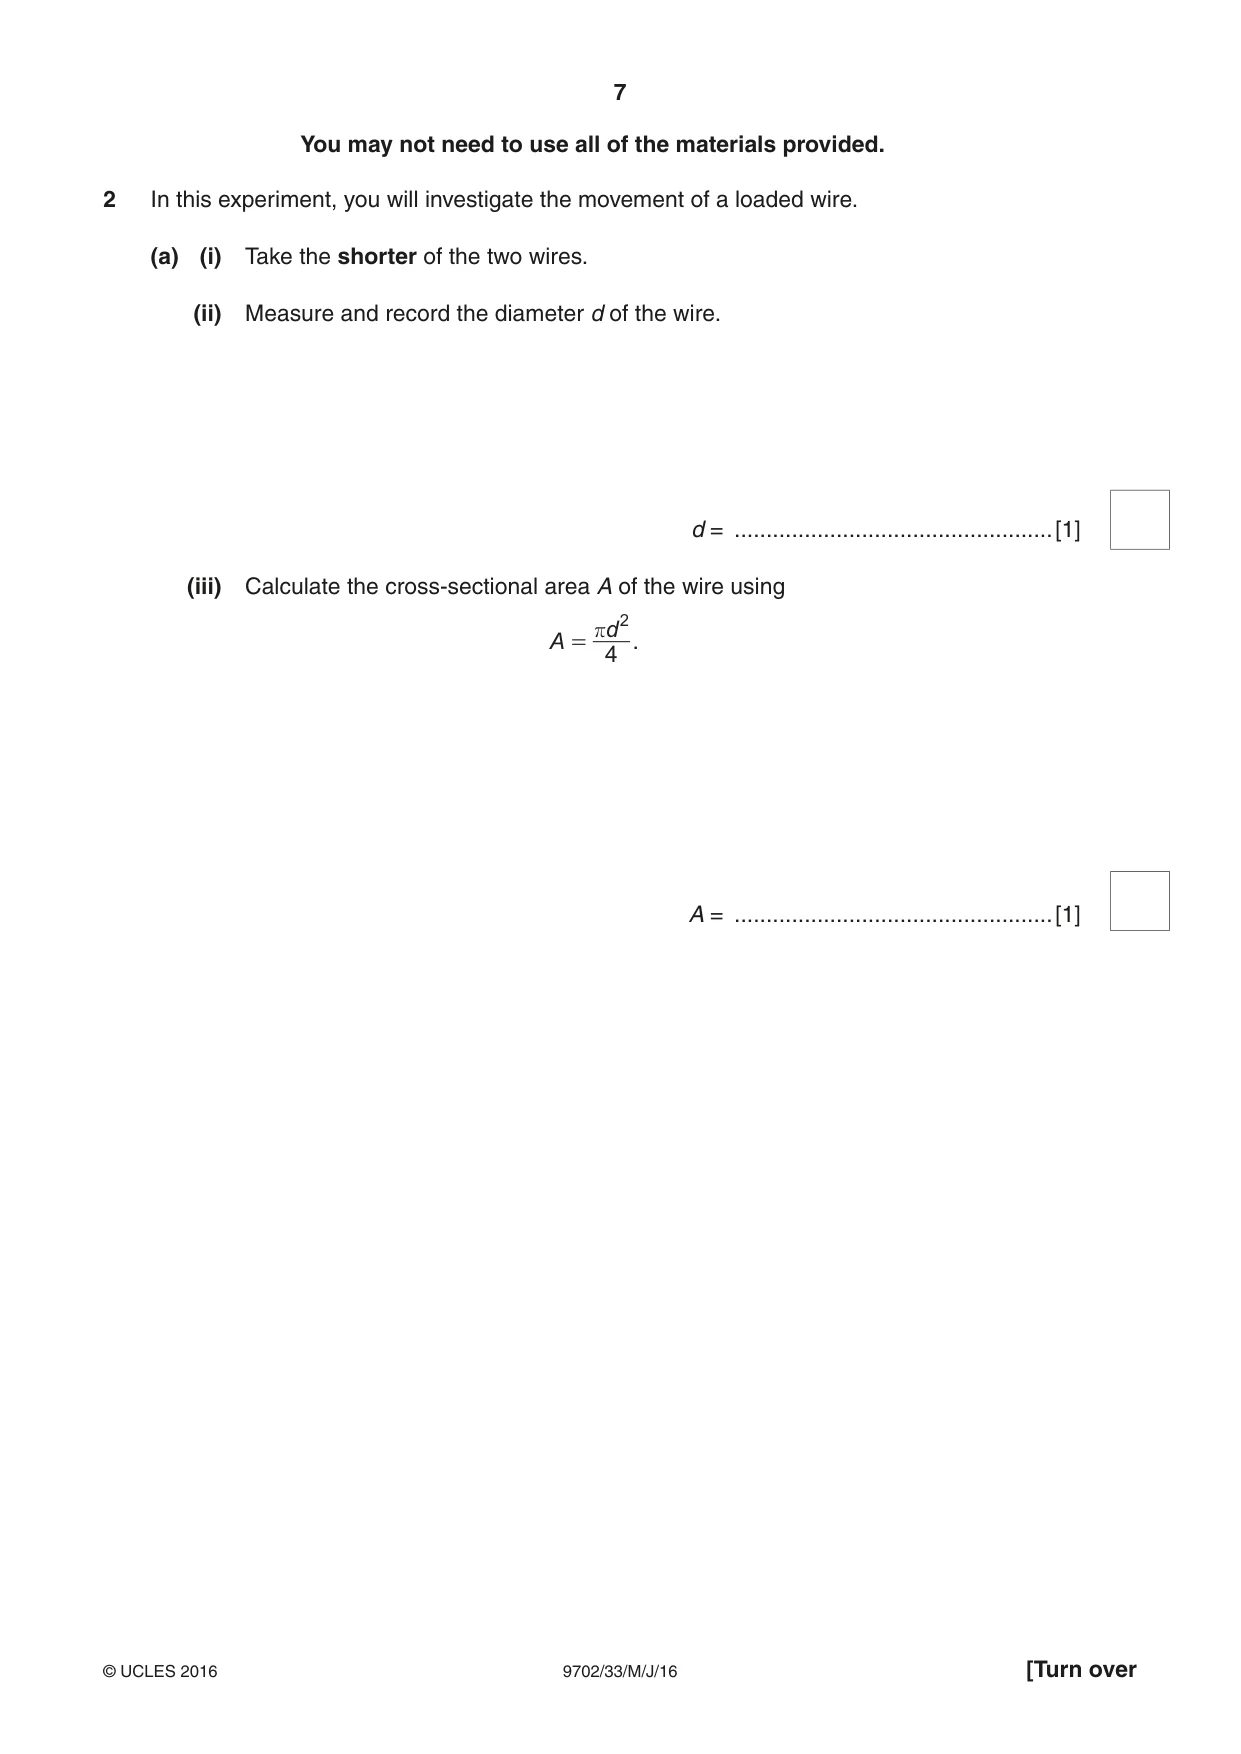
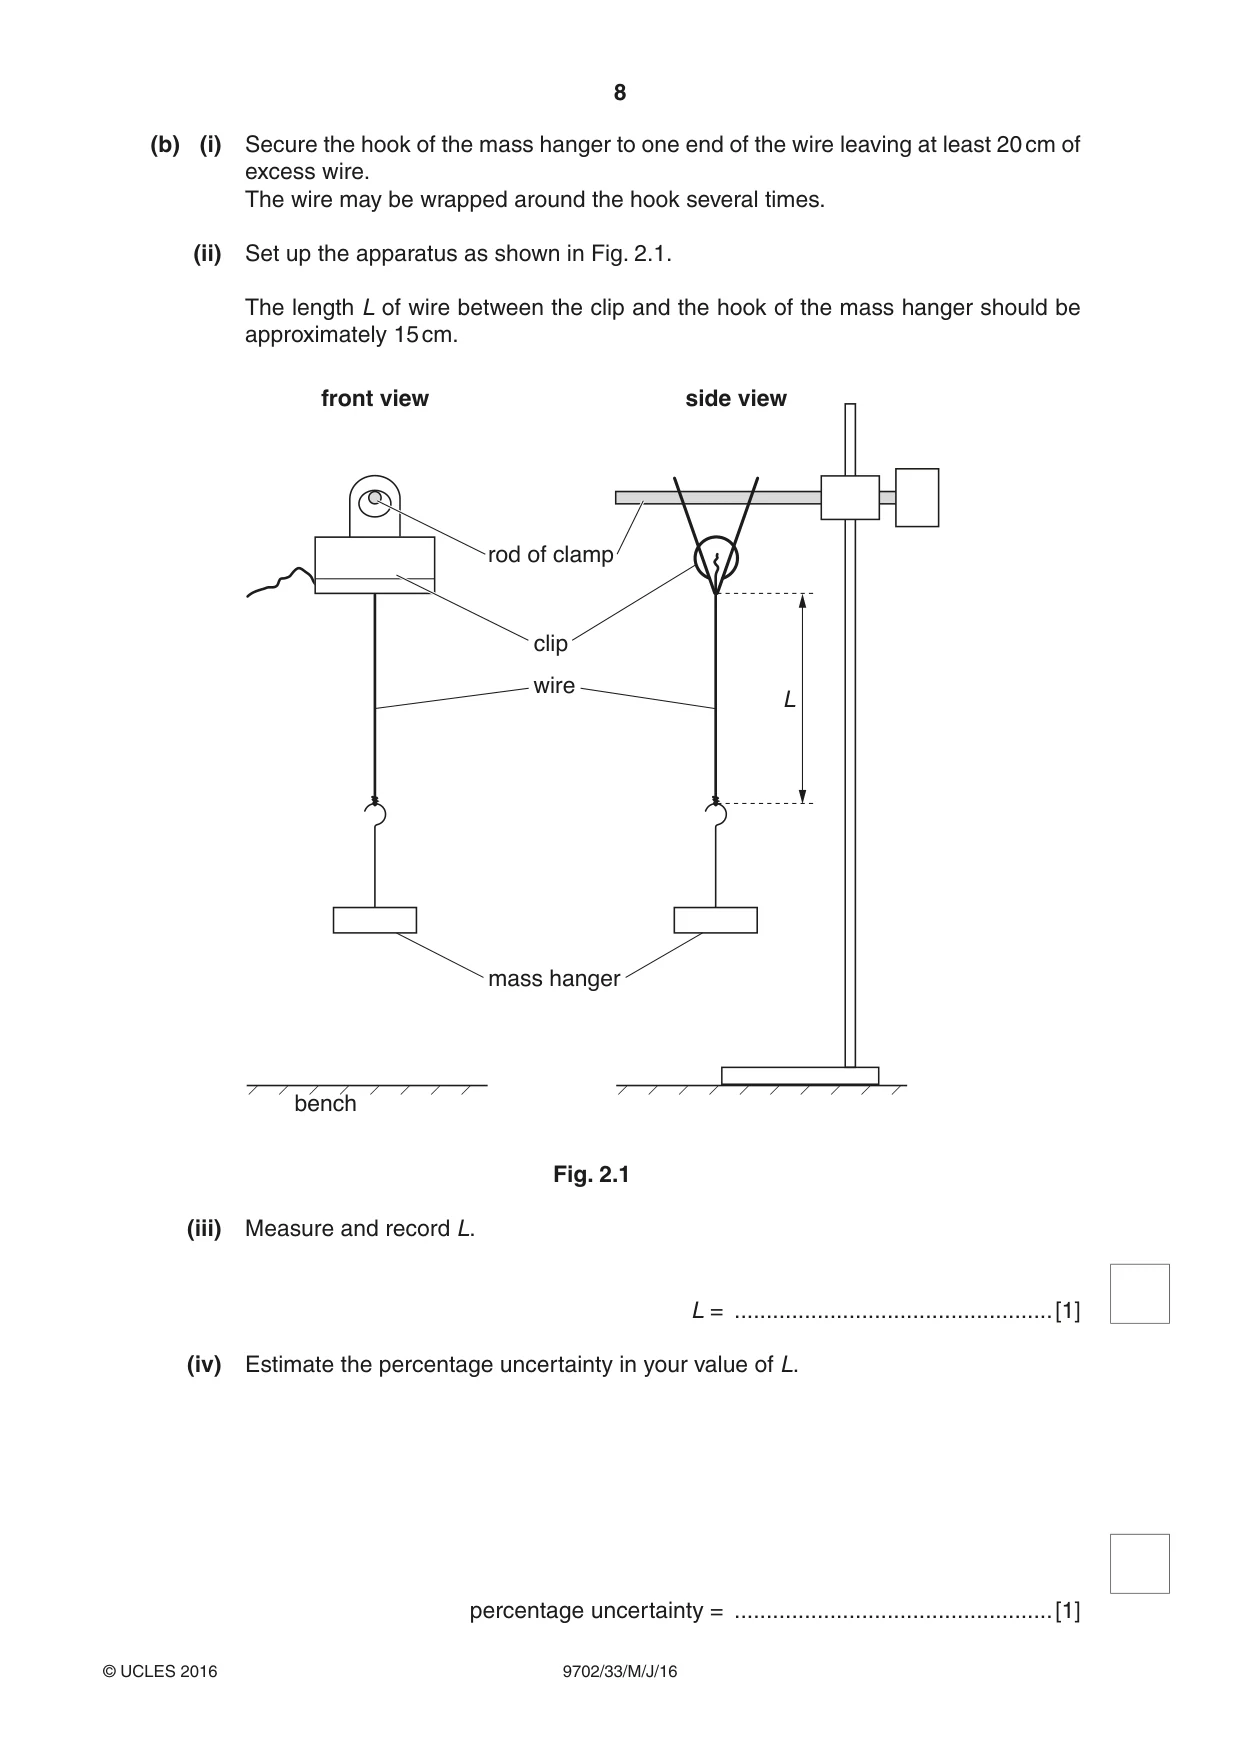
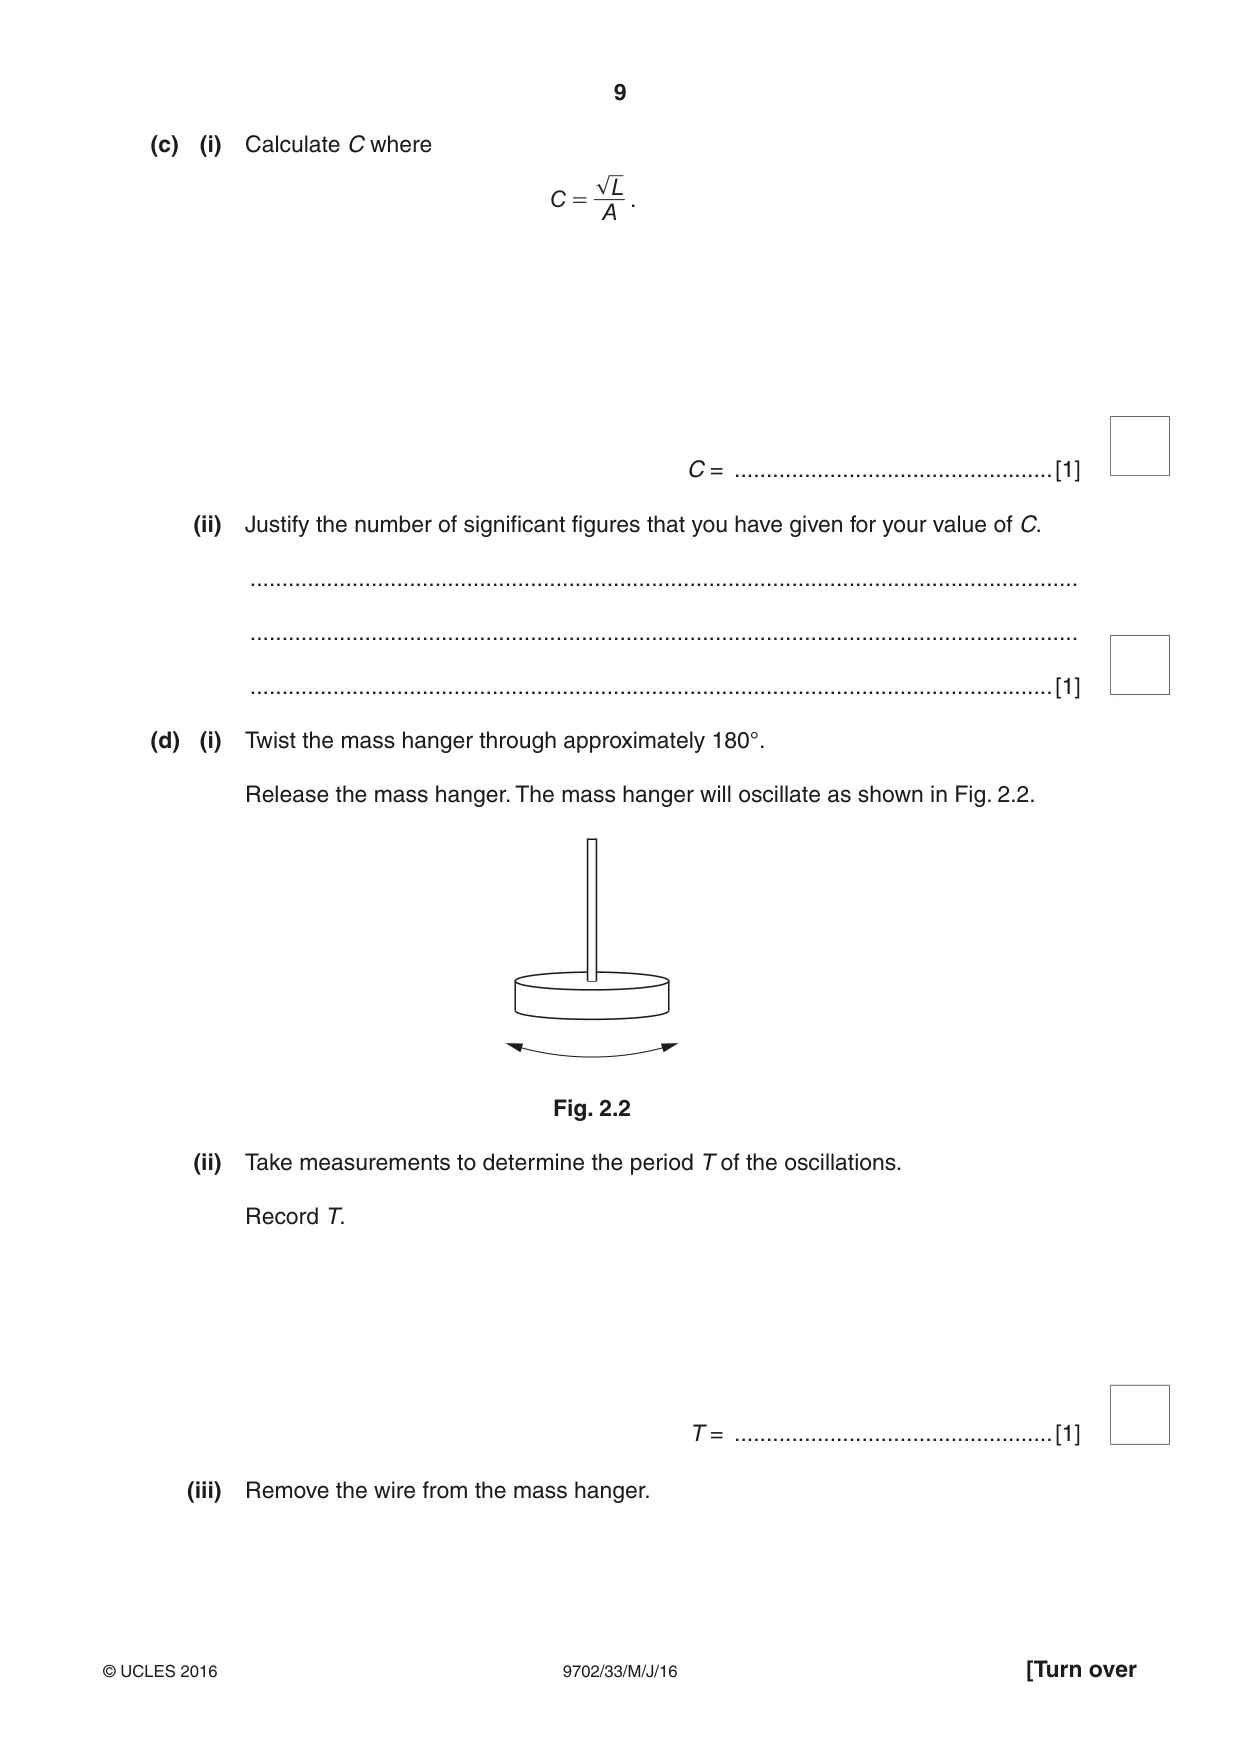
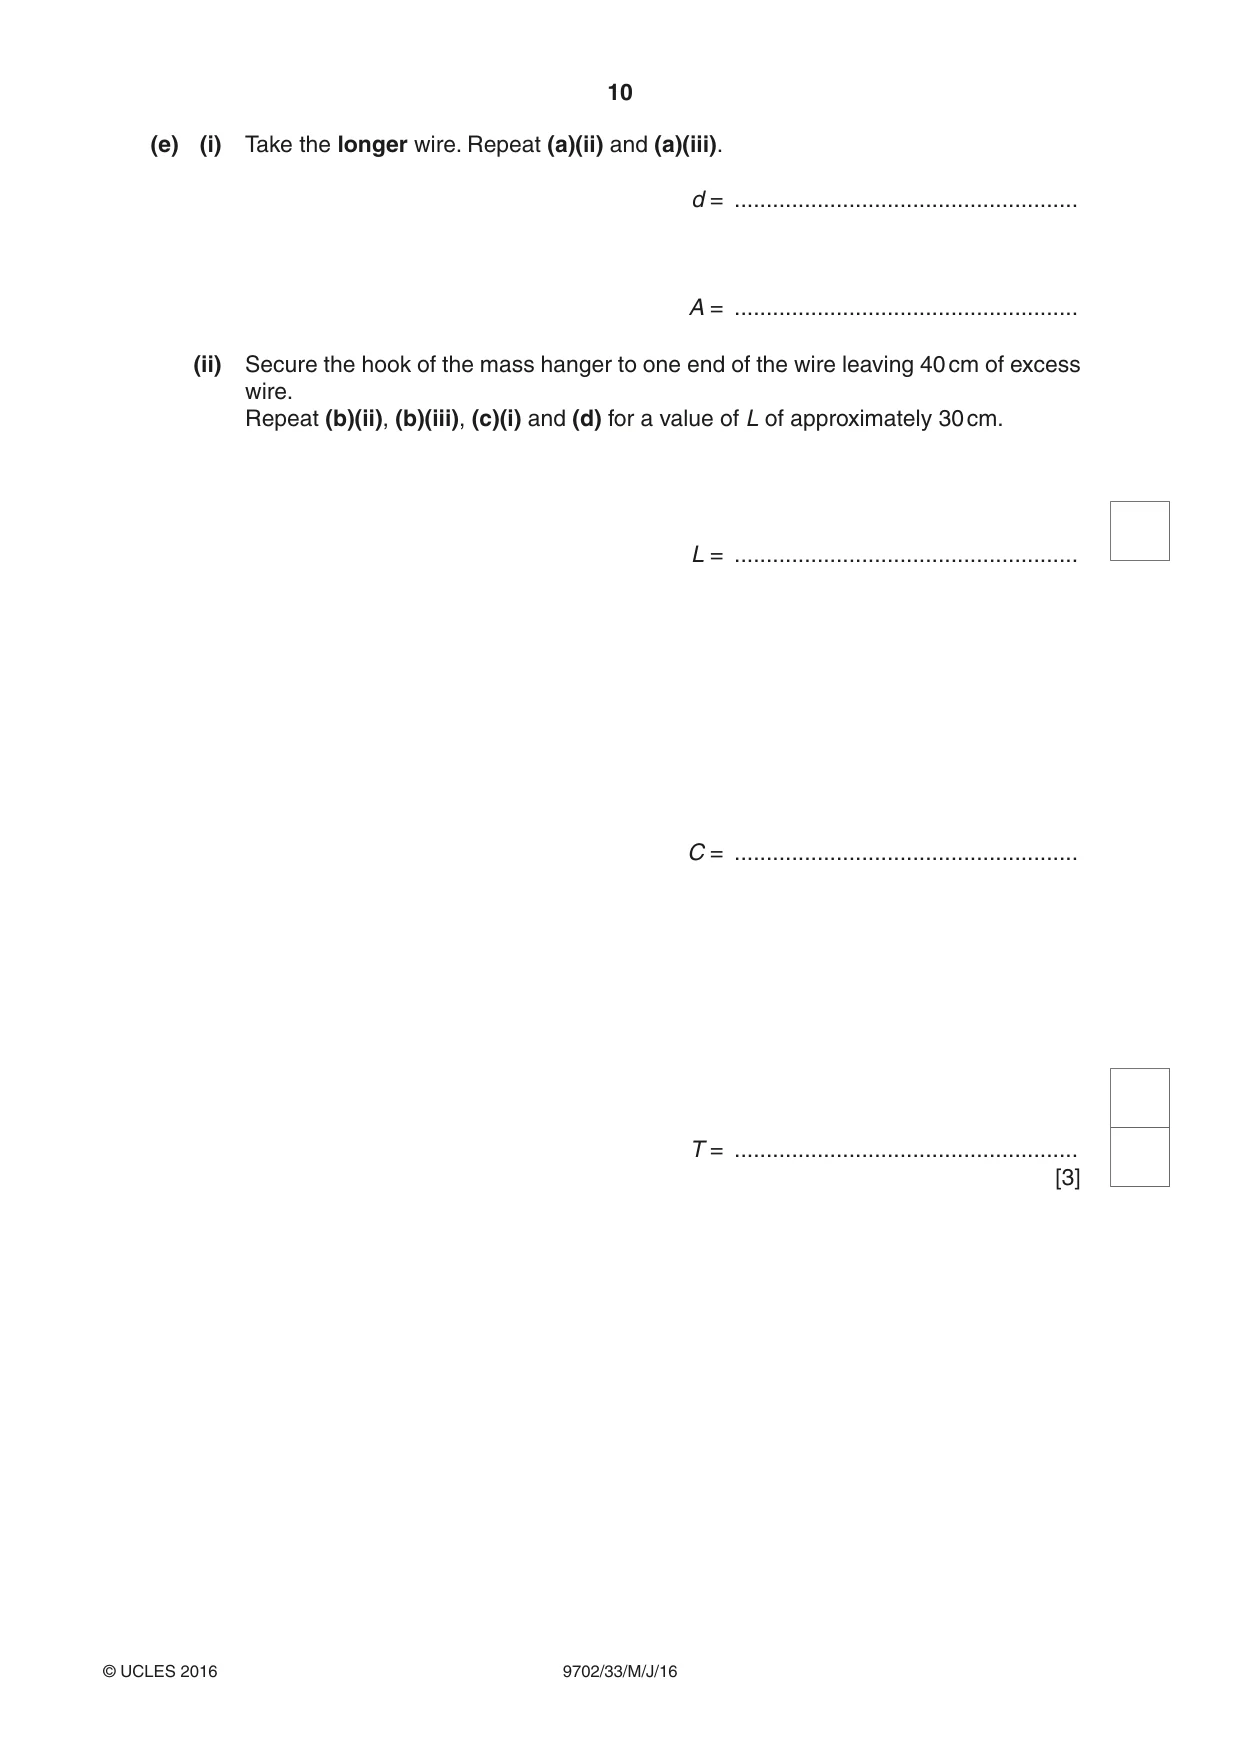
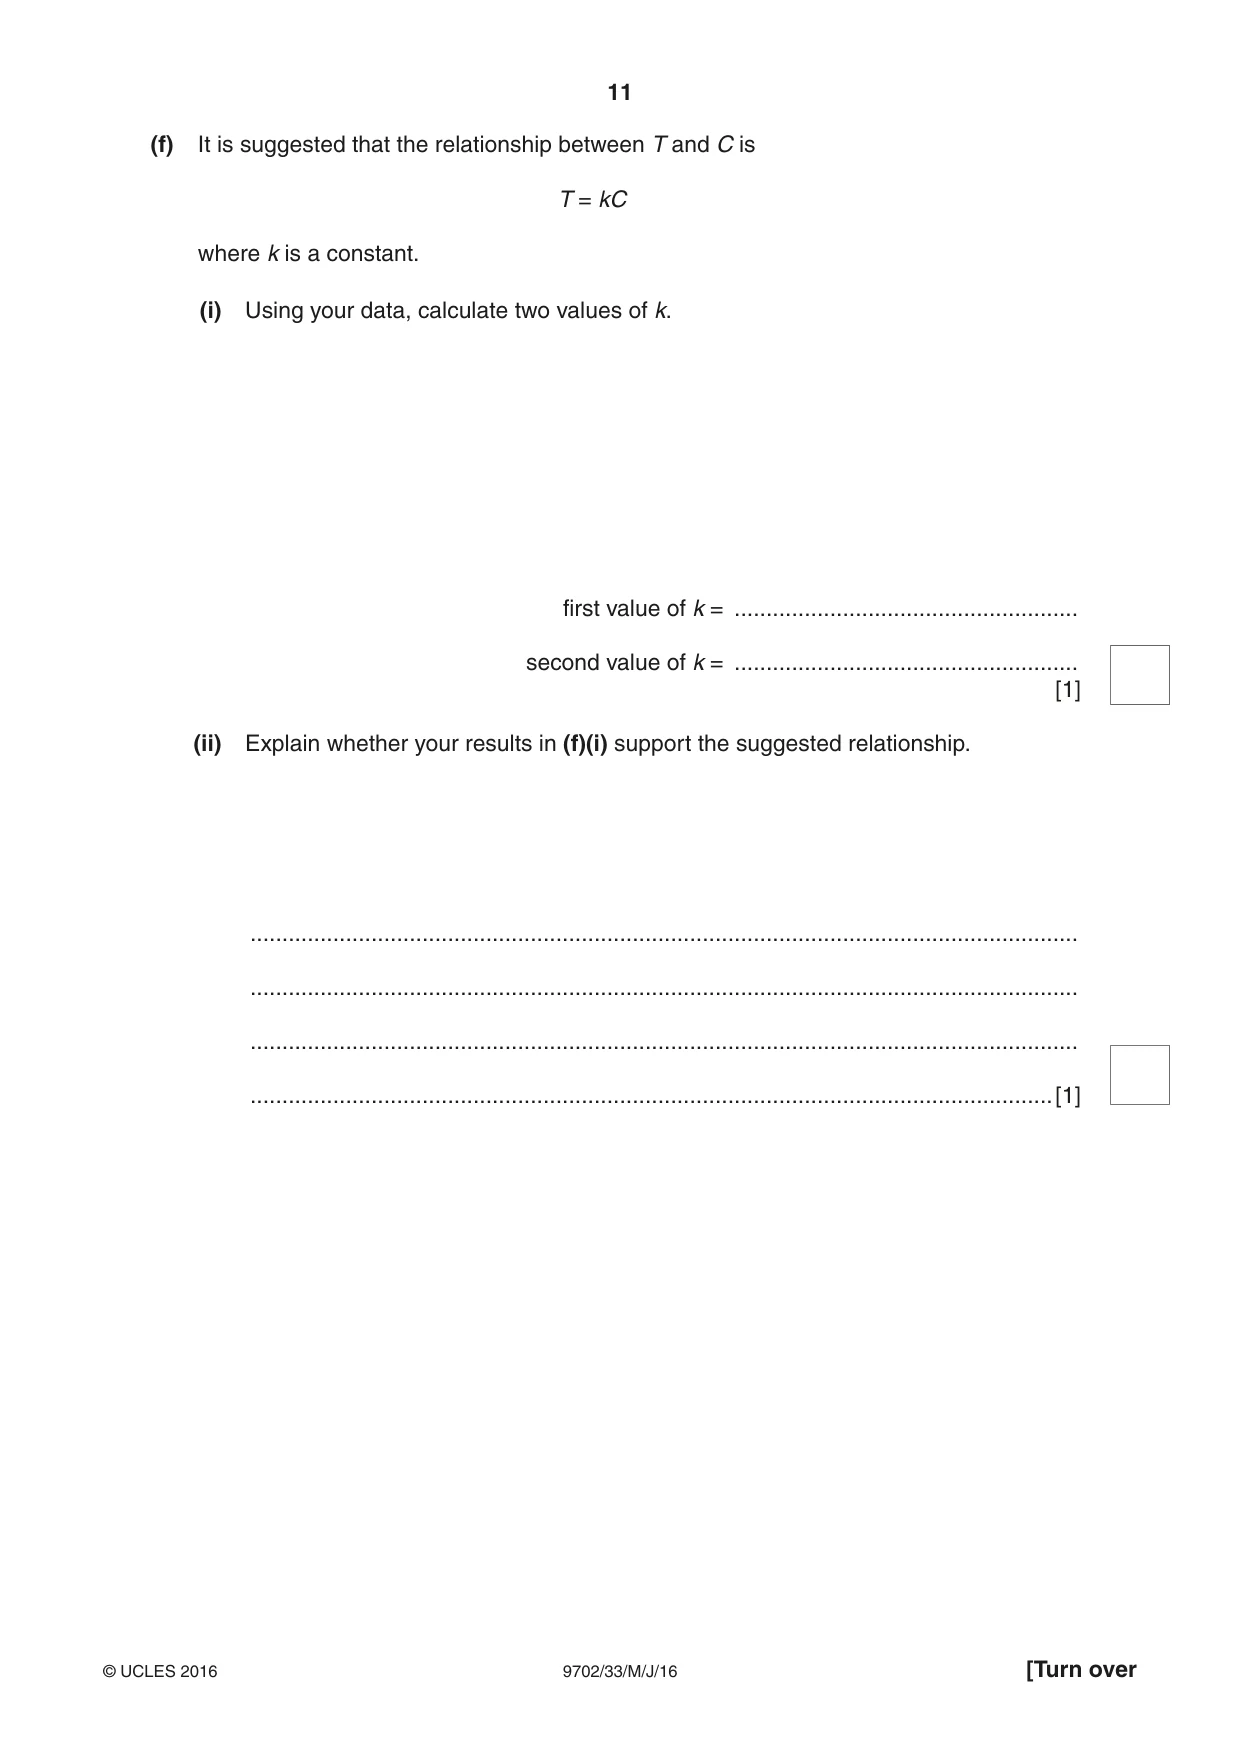
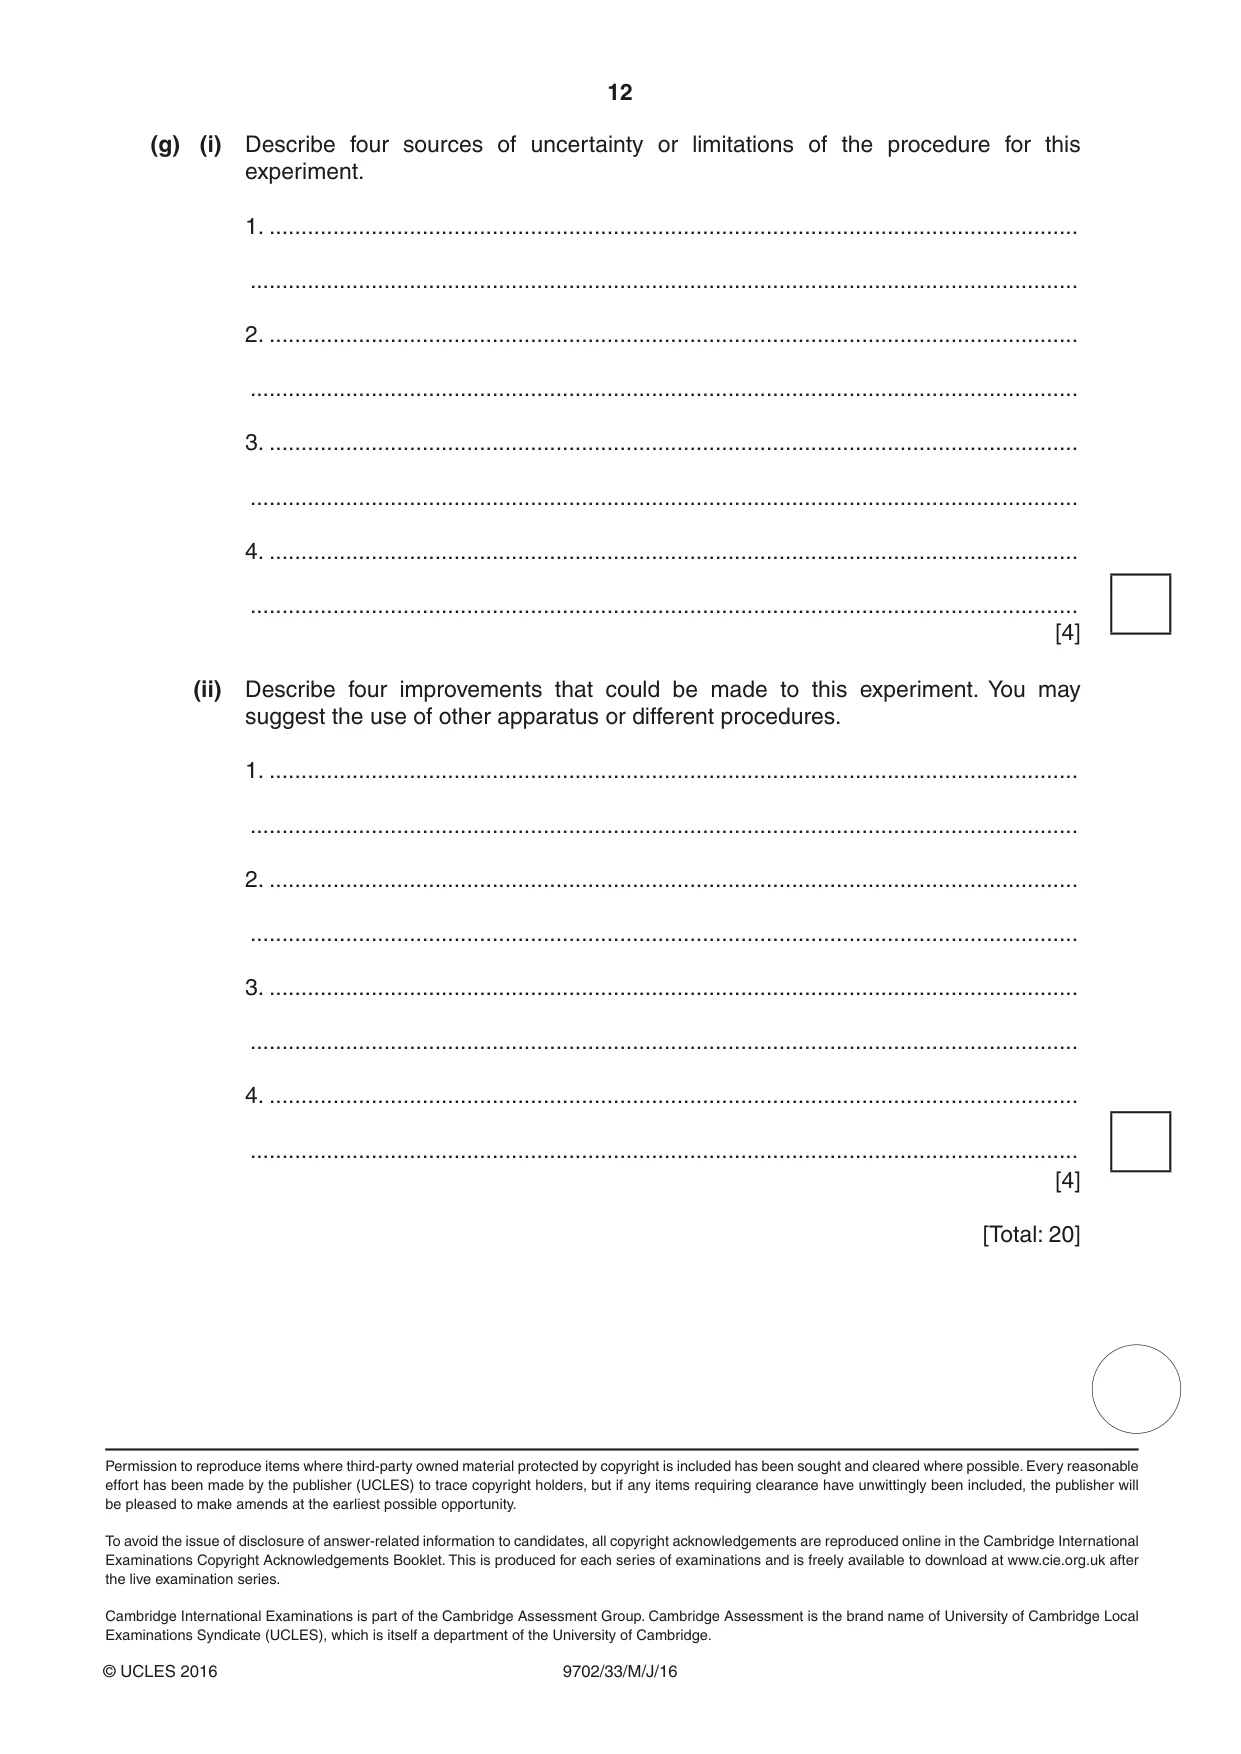
2 In this experiment, you will investigate the movement of a loaded wire. (a) (i) Take the shorter of the two wires. (ii) Measure and record the diameter d of the wire. d = ..................................................[1] (iii) Calculate the cross-sectional area A of the wire using 2 r d A = . 4 A = ..................................................[1] (b) (i) Secure the hook of the mass hanger to one end of the wire leaving at least 20 cm of excess wire. The wire may be wrapped around the hook several times. (ii) Set up the apparatus as shown in Fig. 2.1. The length L of wire between the clip and the hook of the mass hanger should be approximately 15 cm. front view side view rod of clamp clip wire L mass hanger bench Fig. 2.1 (iii) Measure and record L. L = ..................................................[1] (iv) Estimate the percentage uncertainty in your value of L. percentage uncertainty = ..................................................[1] (c) (i) Calculate C where L C = . A C = ..................................................[1] (ii) Justify the number of significant figures that you have given for your value of C. .................................................................................................................................. .................................................................................................................................. ..............................................................................................................................[1] (d) (i) Twist the mass hanger through approximately 180°. Release the mass hanger. The mass hanger will oscillate as shown in Fig. 2.2. Fig. 2.2 (ii) Take measurements to determine the period T of the oscillations. Record T. T = ..................................................[1] (iii) Remove the wire from the mass hanger.
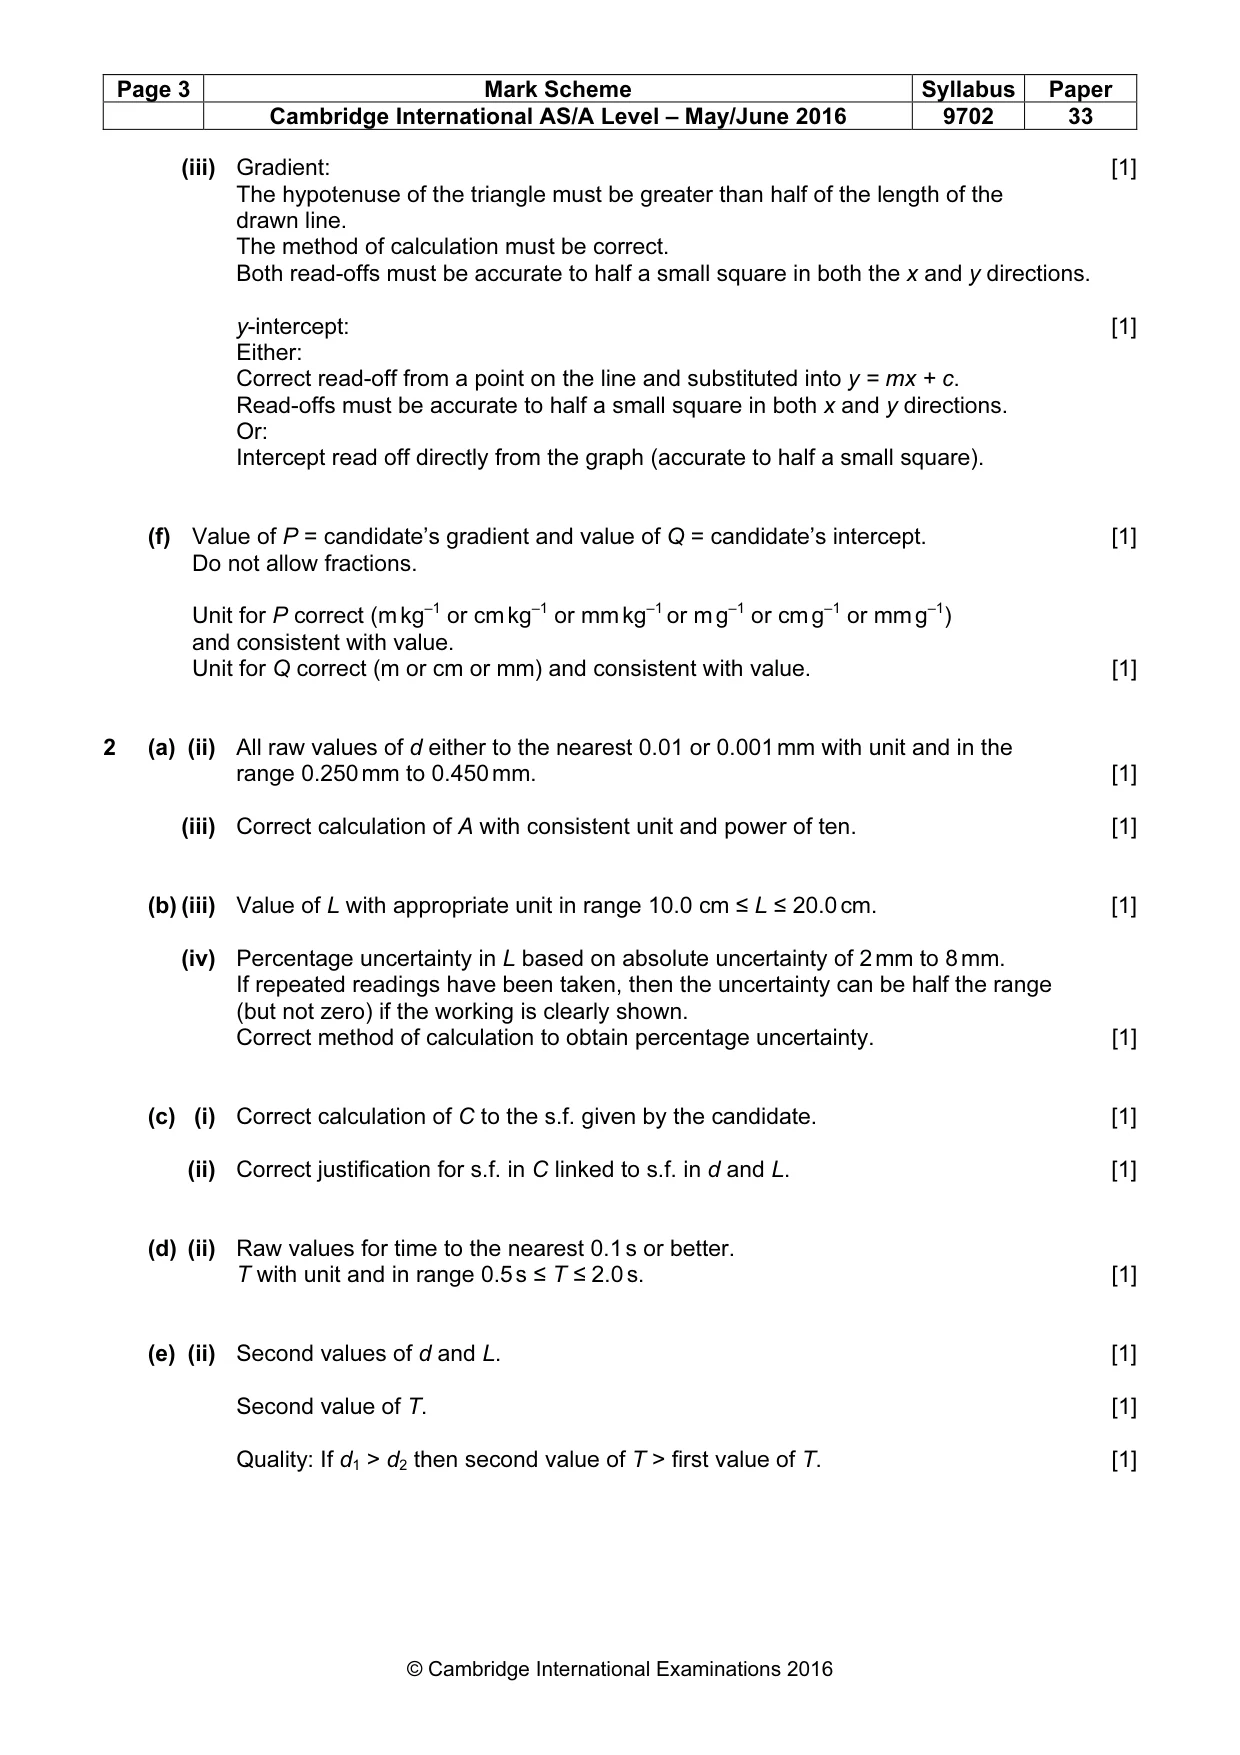
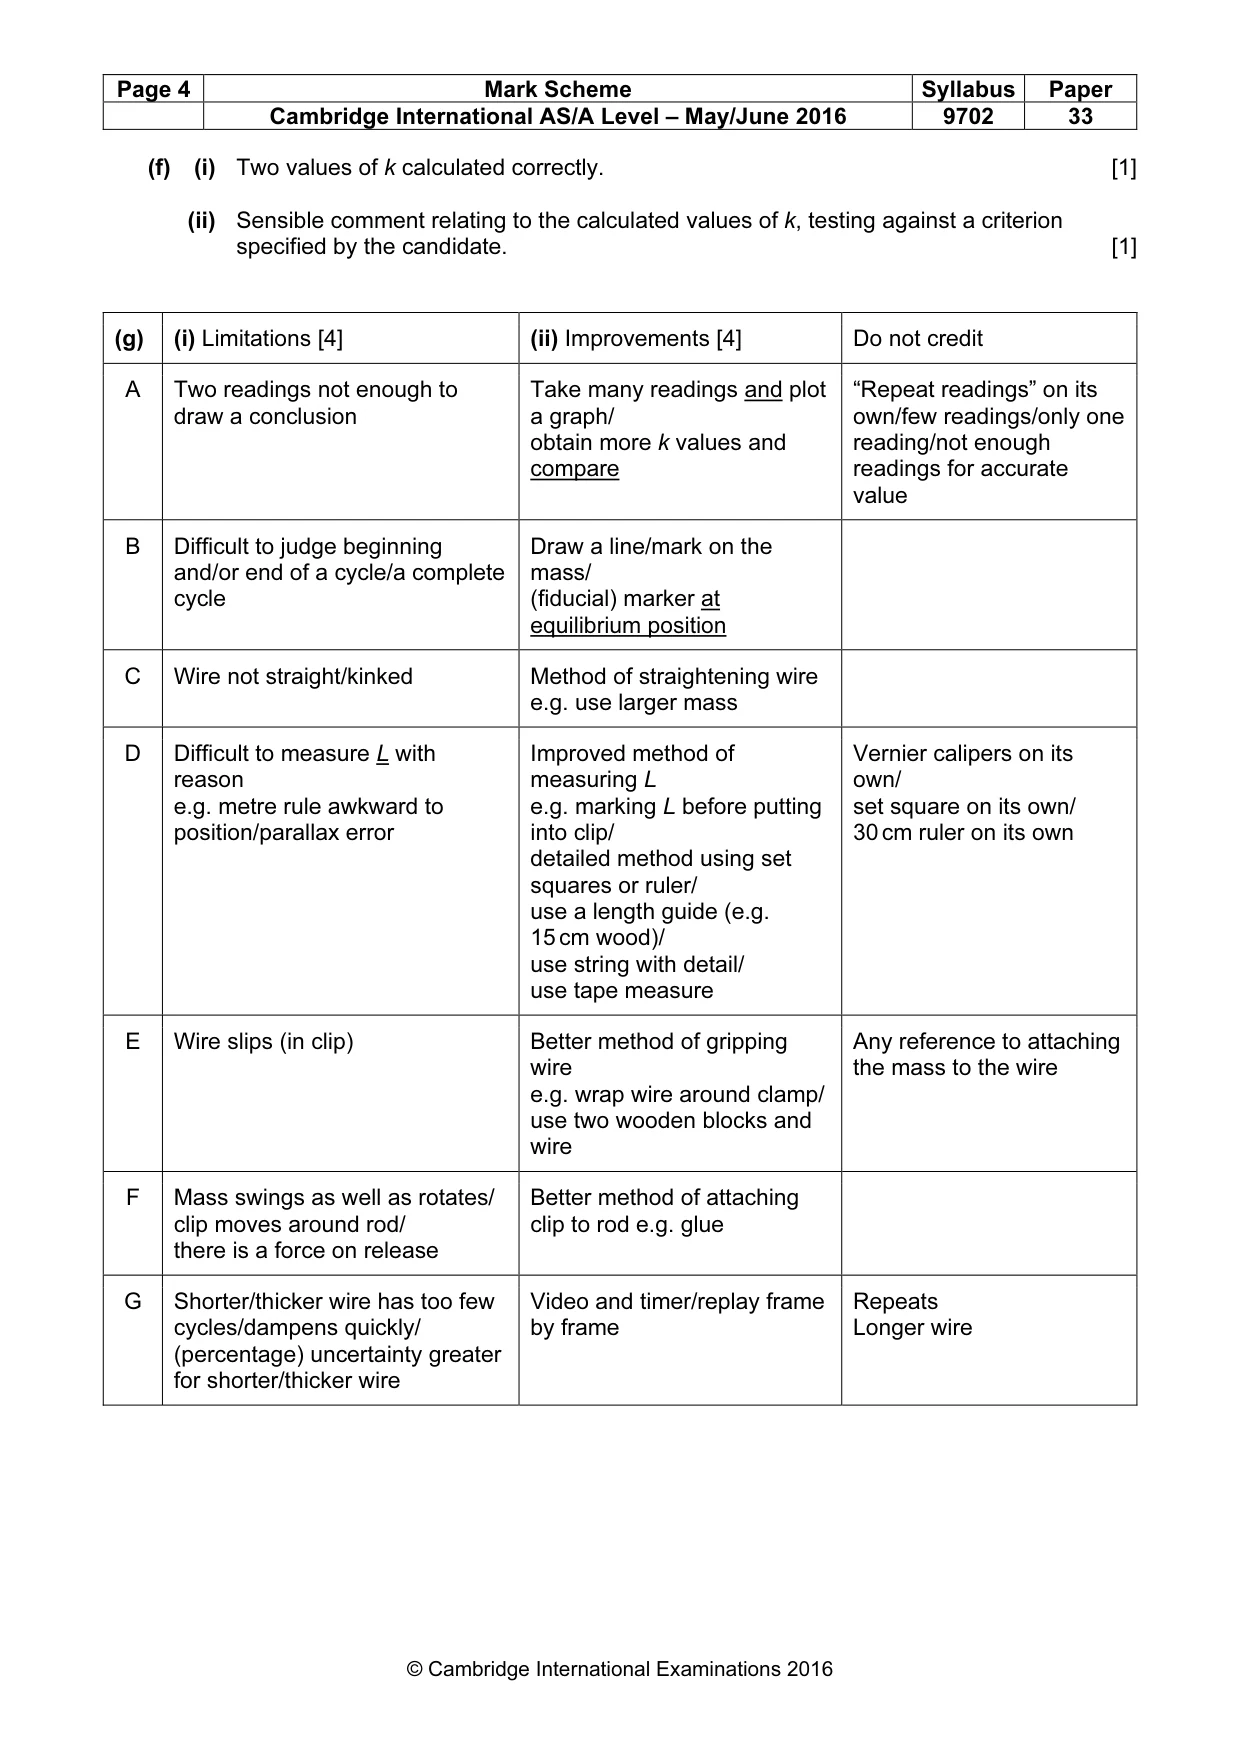
Mark scheme: 2 (a) (ii) All raw values of d either to the nearest 0.01 or 0.001 mm with unit and in the range 0.250 mm to 0.450 mm. [1] (iii) Correct calculation of A with consistent unit and power of ten. [1] (b) (iii) Value of L with appropriate unit in range 10.0 cm ≤ L ≤ 20.0 cm. [1] (iv) Percentage uncertainty in L based on absolute uncertainty of 2 mm to 8 mm. If repeated readings have been taken, then the uncertainty can be half the range (but not zero) if the working is clearly shown. Correct method of calculation to obtain percentage uncertainty. [1] (c) (i) Correct calculation of C to the s.f. given by the candidate. [1] (ii) Correct justification for s.f. in C linked to s.f. in d and L. [1] (d) (ii) Raw values for time to the nearest 0.1 s or better. T with unit and in range 0.5 s ≤ T ≤ 2.0 s. [1] (e) (ii) Second values of d and L. [1] Second value of T. [1] Quality: If d1 > d2 then second value of T > first value of T. [1] (f) (i) Two values of k calculated correctly. [1] (ii) Sensible comment relating to the calculated values of k, testing against a criterion specified by the candidate. [1] (g) (i) Limitations [4] (ii) Improvements [4] Do not credit A Two readings not enough to Take many readings and plot “Repeat readings” on its draw a conclusion a graph/ own/few readings/only one obtain more k values and reading/not enough compare readings for accurate value B Difficult to judge beginning Draw a line/mark on the and/or end of a cycle/a complete mass/ cycle (fiducial) marker at equilibrium position C Wire not straight/kinked Method of straightening wire e.g. use larger mass D Difficult to measure L with Improved method of Vernier calipers on its reason measuring L own/ e.g. metre rule awkward to e.g. marking L before putting set square on its own/ position/parallax error into clip/ 30 cm ruler on its own detailed method using set squares or ruler/ use a length guide (e.g. 15 cm wood)/ use string with detail/ use tape measure E Wire slips (in clip) Better method of gripping Any reference to attaching wire the mass to the wire e.g. wrap wire around clamp/ use two wooden blocks and wire F Mass swings as well as rotates/ Better method of attaching clip moves around rod/ clip to rod e.g. glue there is a force on release G Shorter/thicker wire has too few Video and timer/replay frame Repeats cycles/dampens quickly/ by frame Longer wire (percentage) uncertainty greater for shorter/thicker wire
What was in this paper
The subtopics covered by these 2 questions, and how many questions each got. Open one in a new tab to see every Cambridge question on it.
What you needed in this session
Cambridge’s own grade thresholds for 2016 May/June, Paper 3 · Variant 3. A higher threshold means an easier paper — the bar moves with how the cohort did.