Cambridge A Level Physics 9702 — 2010 May/June Paper 3 · Variant 3
9702/33/M/J/10 · 40 marks · ≈45 min
The question paper and its mark scheme, free to read here and free to download. This is Cambridge’s own paper, exactly as it was sat.
Question paper12 pages
Mark scheme4 pages
Answers below. Sit the paper first if you are practising.
Paper as text
Question paper, page 1
This document consists of 9 printed pages and 3 blank pages. DC (CW/SW) 24452/2 © UCLES 2010 [Turn over UNIVERSITY OF CAMBRIDGE INTERNATIONAL EXAMINATIONS General Certificate of Education Advanced Subsidiary Level and Advanced Level READ THESE INSTRUCTIONS FIRST Write your Centre number, candidate number and name on all the work you hand in. Write in dark blue or black pen. You may use a soft pencil for any diagrams, graphs or rough working. Do not use staples, paper clips, highlighters, glue or correction fluid. DO NOT WRITE IN ANY BARCODES. Answer both questions. You will be allowed to work with the apparatus for a maximum of one hour for each question. You are expected to record all your observations as soon as these observations are made, and to plan the presentation of the records so that it is not necessary to make a fair copy of them. You may lose marks if you do not show your working or if you do not use appropriate units. Additional answer paper and graph paper should be used only if it becomes necessary to do so. You are reminded of the need for good English and clear presentation in your answers. At the end of the examination, fasten all your work securely together. All questions in this paper carry equal marks. * 3 1 6 5 9 6 5 4 9 7 * PHYSICS 9702/33 Paper 31 Advanced Practical Skills 1 May/June 2010 2 hours Candidates answer on the Question Paper. Additional Materials: As listed in the Confidential Instructions. For Examiner’s Use 1 2 Total
Question paper, page 2
2 9702/33/M/J/10 © UCLES 2010 BLANK PAGE
Question paper, page 3
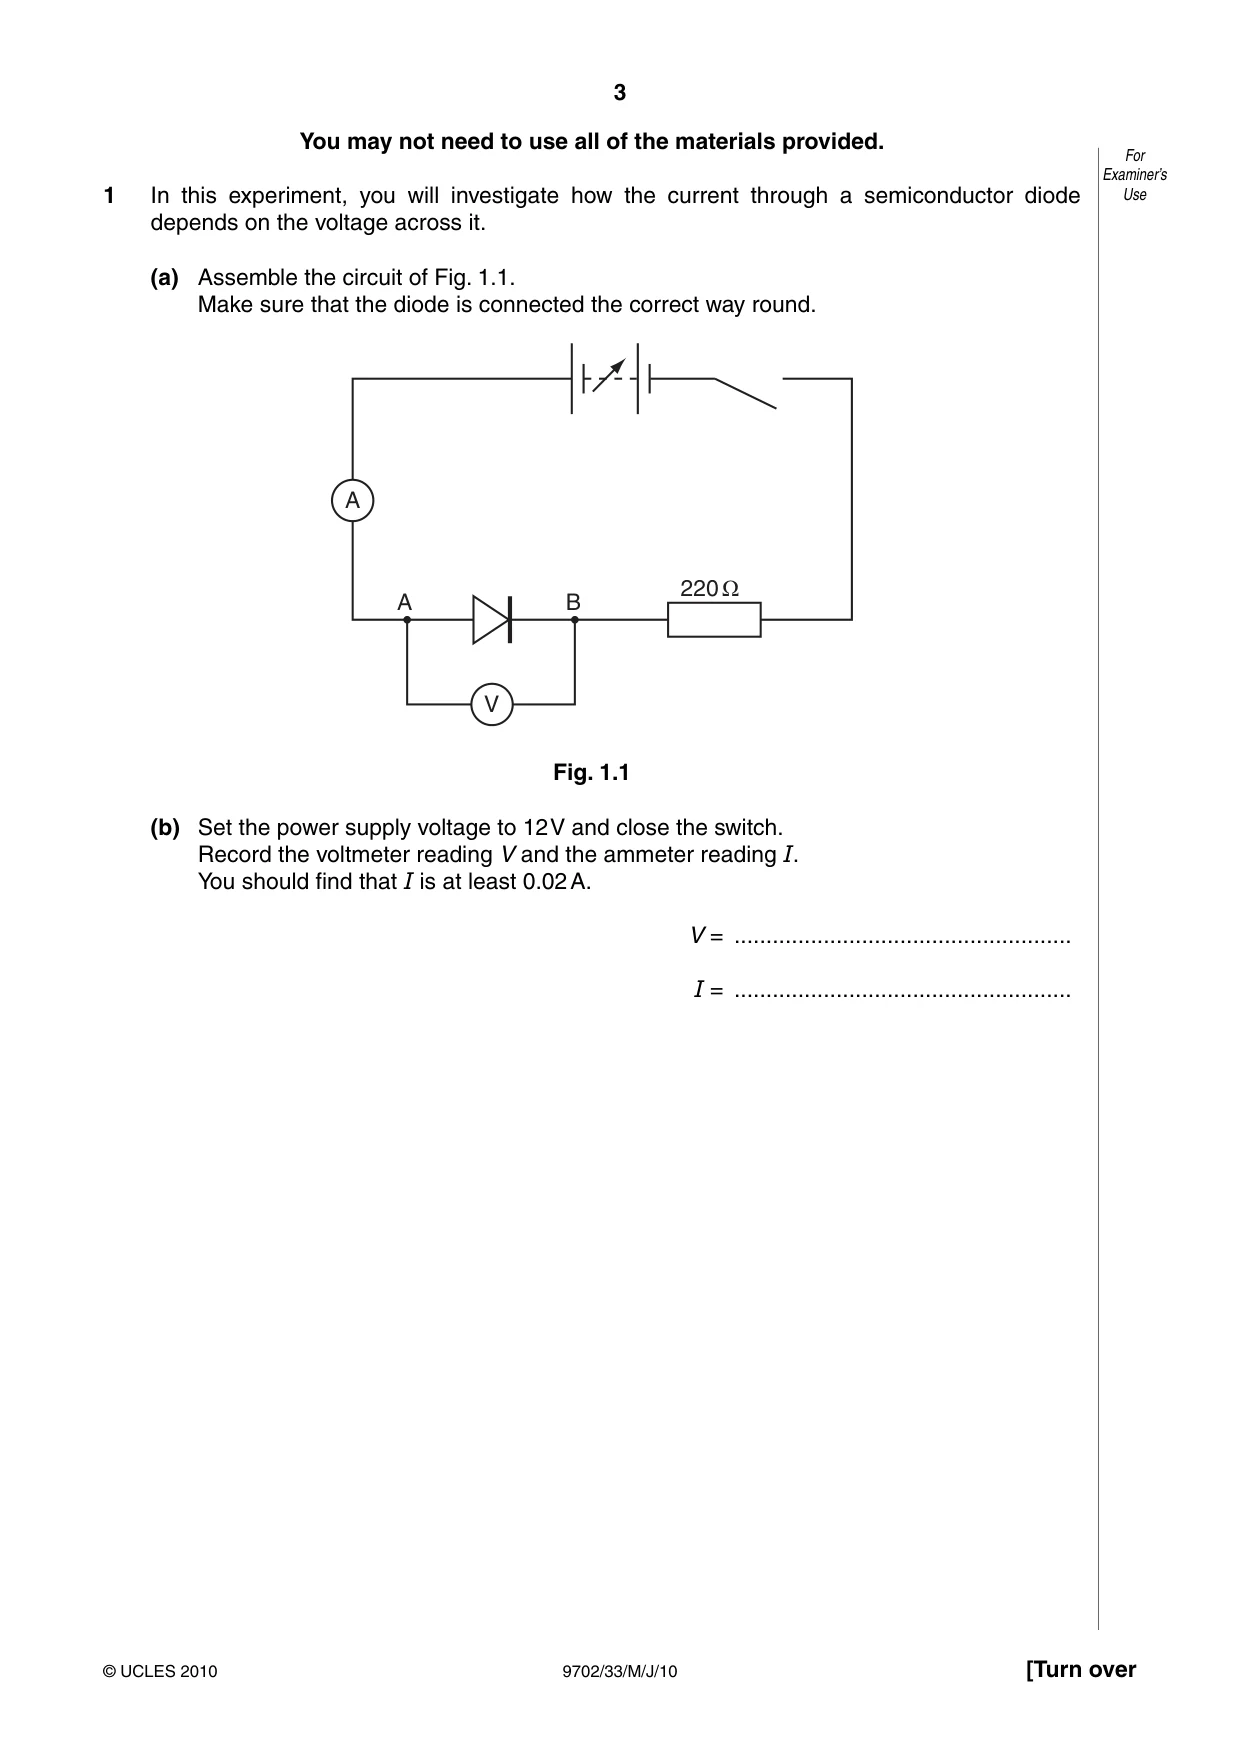
3 9702/33/M/J/10 [Turn over © UCLES 2010 For Examiner’s Use You may not need to use all of the materials provided. 1 In this experiment, you will investigate how the current through a semiconductor diode depends on the voltage across it. (a) Assemble the circuit of Fig. 1.1. Make sure that the diode is connected the correct way round. A V 220 Ω A B Fig. 1.1 (b) Set the power supply voltage to 12 V and close the switch. Record the voltmeter reading V and the ammeter reading I. You should find that I is at least 0.02 A. V = … I = …
Question paper, page 4
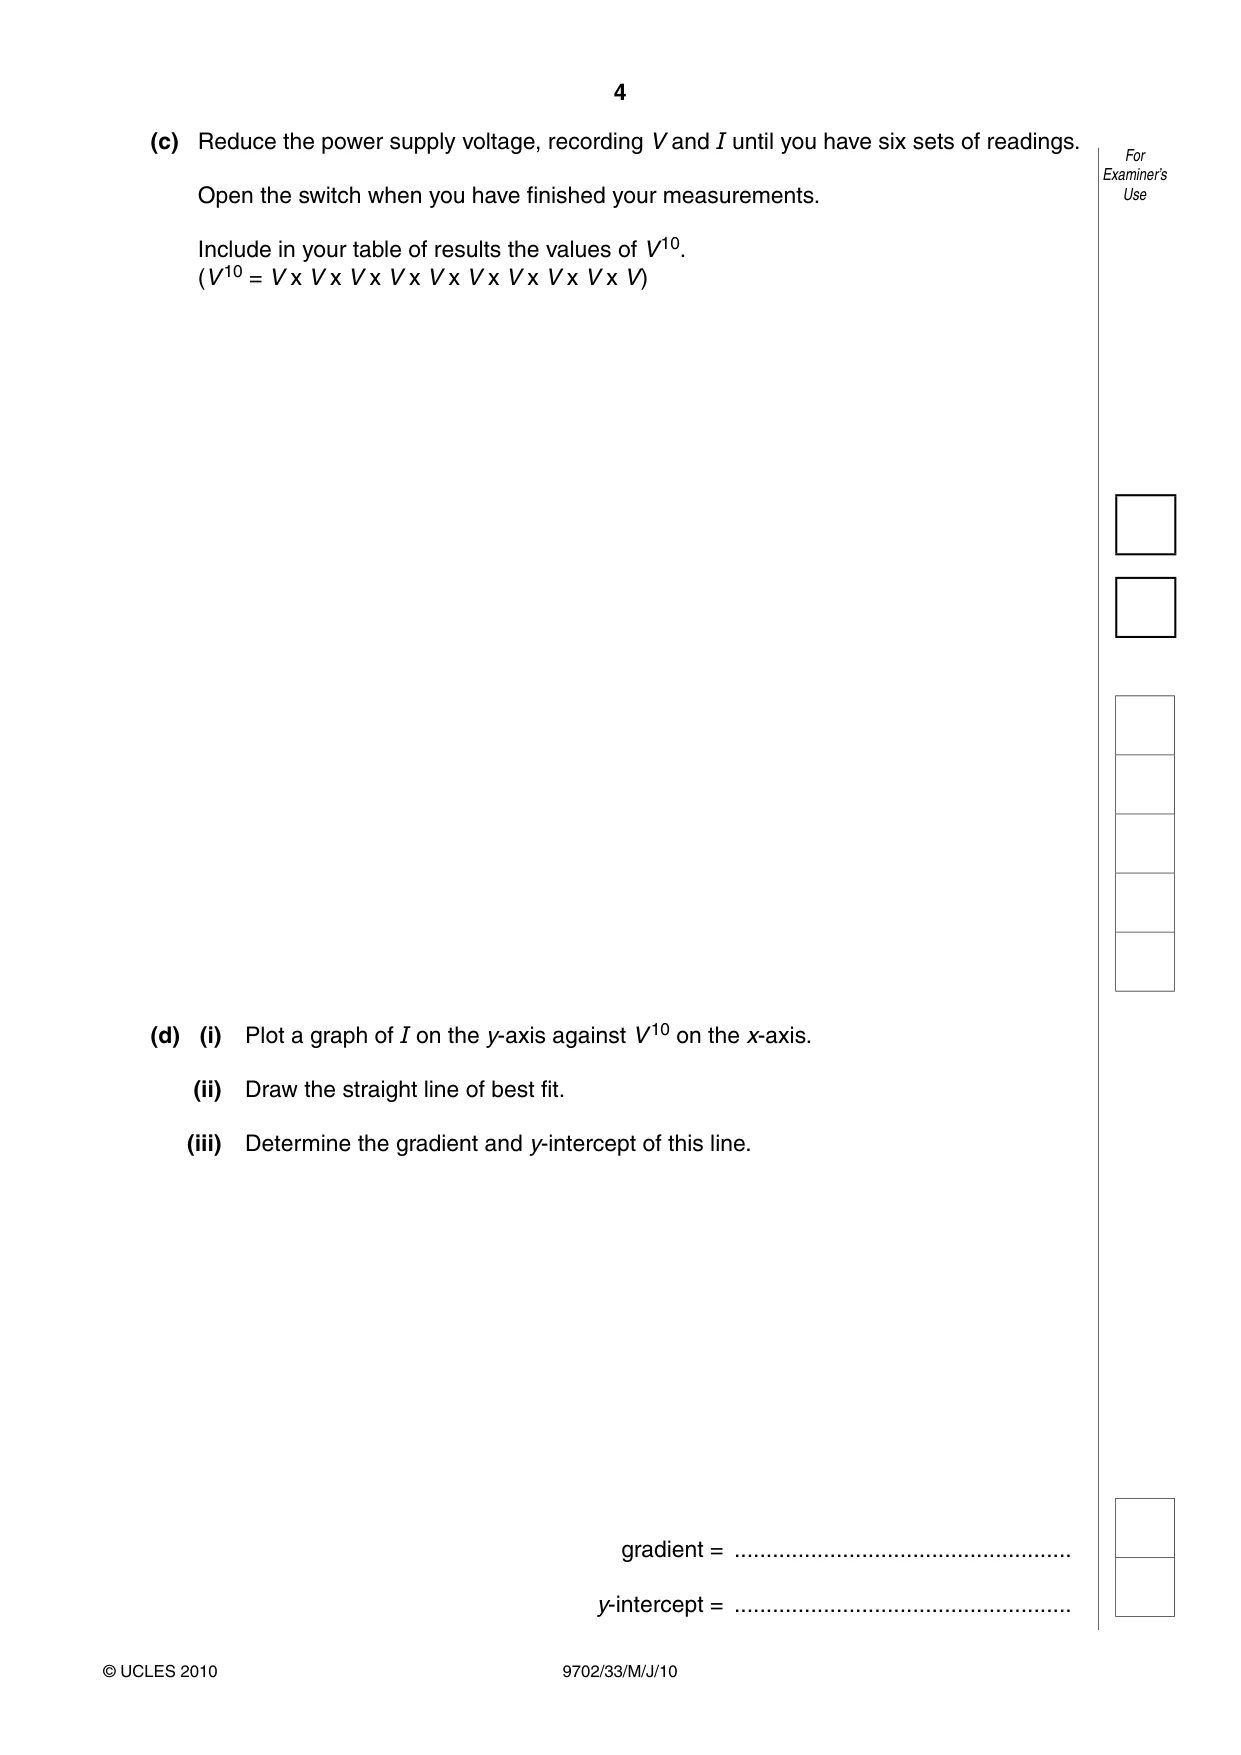
4 9702/33/M/J/10 © UCLES 2010 For Examiner’s Use (c) Reduce the power supply voltage, recording V and I until you have six sets of readings. Open the switch when you have finished your measurements. Include in your table of results the values of V 10. (V 10 = V x V x V x V x V x V x V x V x V x V ) (d) (i) Plot a graph of I on the y-axis against V 10 on the x-axis. (ii) Draw the straight line of best fit. (iii) Determine the gradient and y-intercept of this line. gradient = … y-intercept = …
Question paper, page 5
5 9702/33/M/J/10 [Turn over © UCLES 2010 For Examiner’s Use
Question paper, page 6
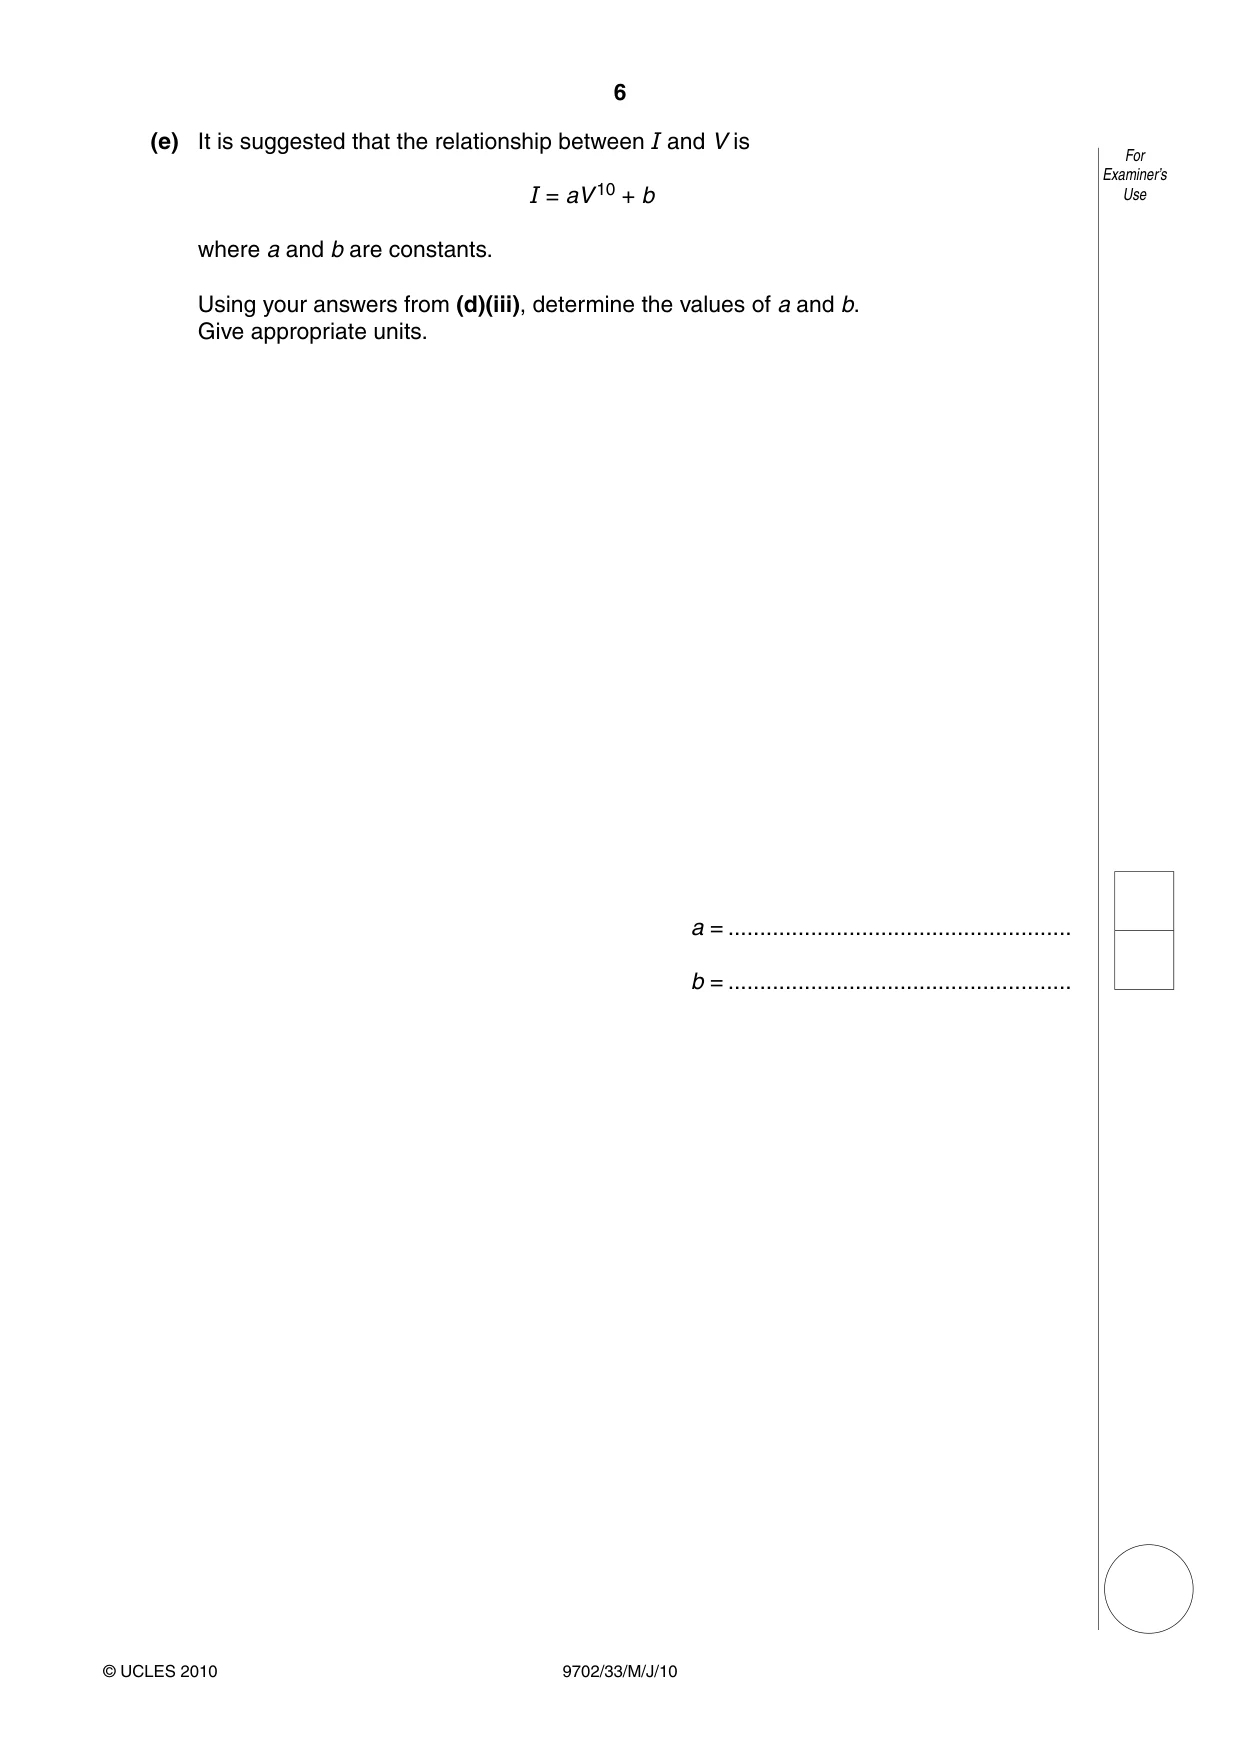
6 9702/33/M/J/10 © UCLES 2010 For Examiner’s Use (e) It is suggested that the relationship between I and V is I = aV 10 + b where a and b are constants. Using your answers from (d)(iii), determine the values of a and b. Give appropriate units. a = … b = …
Question paper, page 7
7 9702/33/M/J/10 © UCLES 2010 [Turn over BLANK PAGE Please turn over for Question 2.
Question paper, page 8
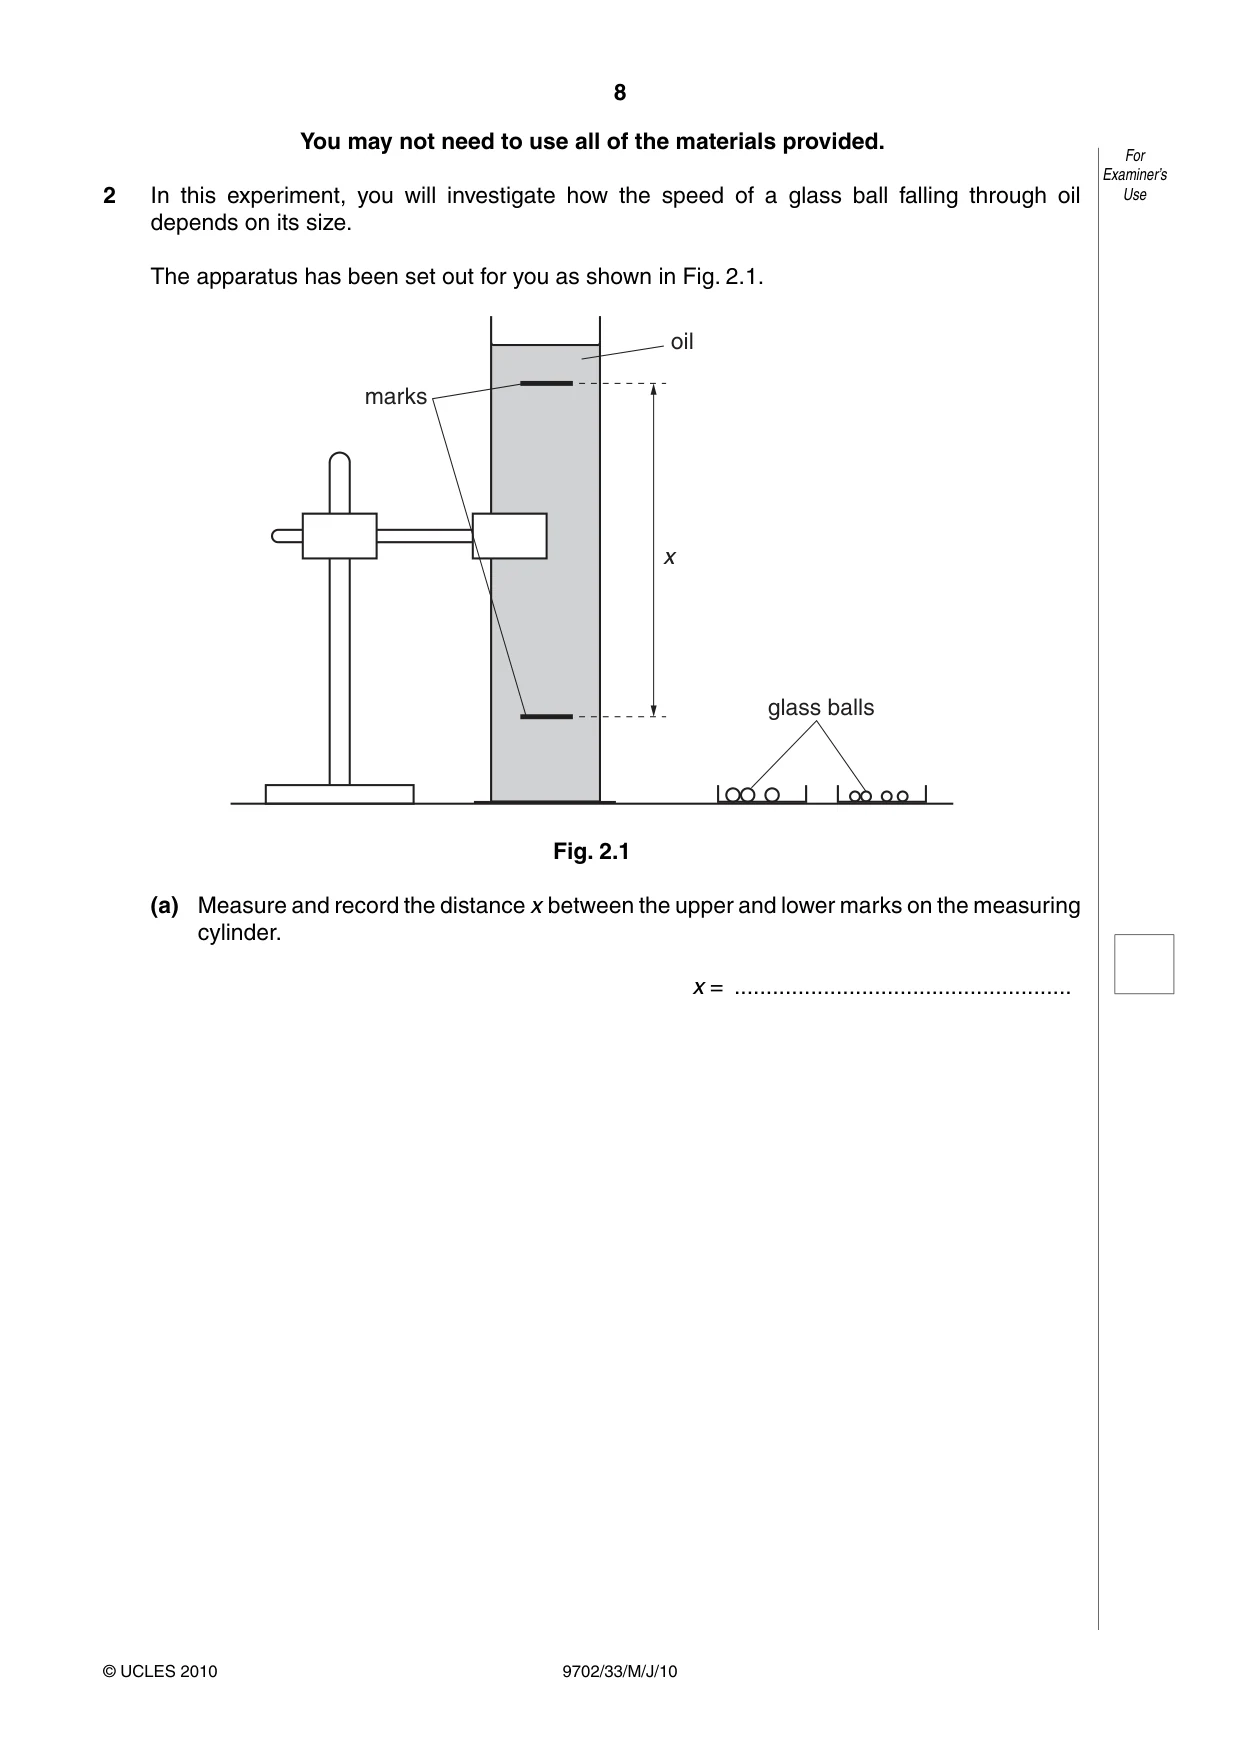
8 9702/33/M/J/10 © UCLES 2010 For Examiner’s Use You may not need to use all of the materials provided. 2 In this experiment, you will investigate how the speed of a glass ball falling through oil depends on its size. The apparatus has been set out for you as shown in Fig. 2.1. marks oil glass balls x Fig. 2.1 (a) Measure and record the distance x between the upper and lower marks on the measuring cylinder. x = …
Question paper, page 9
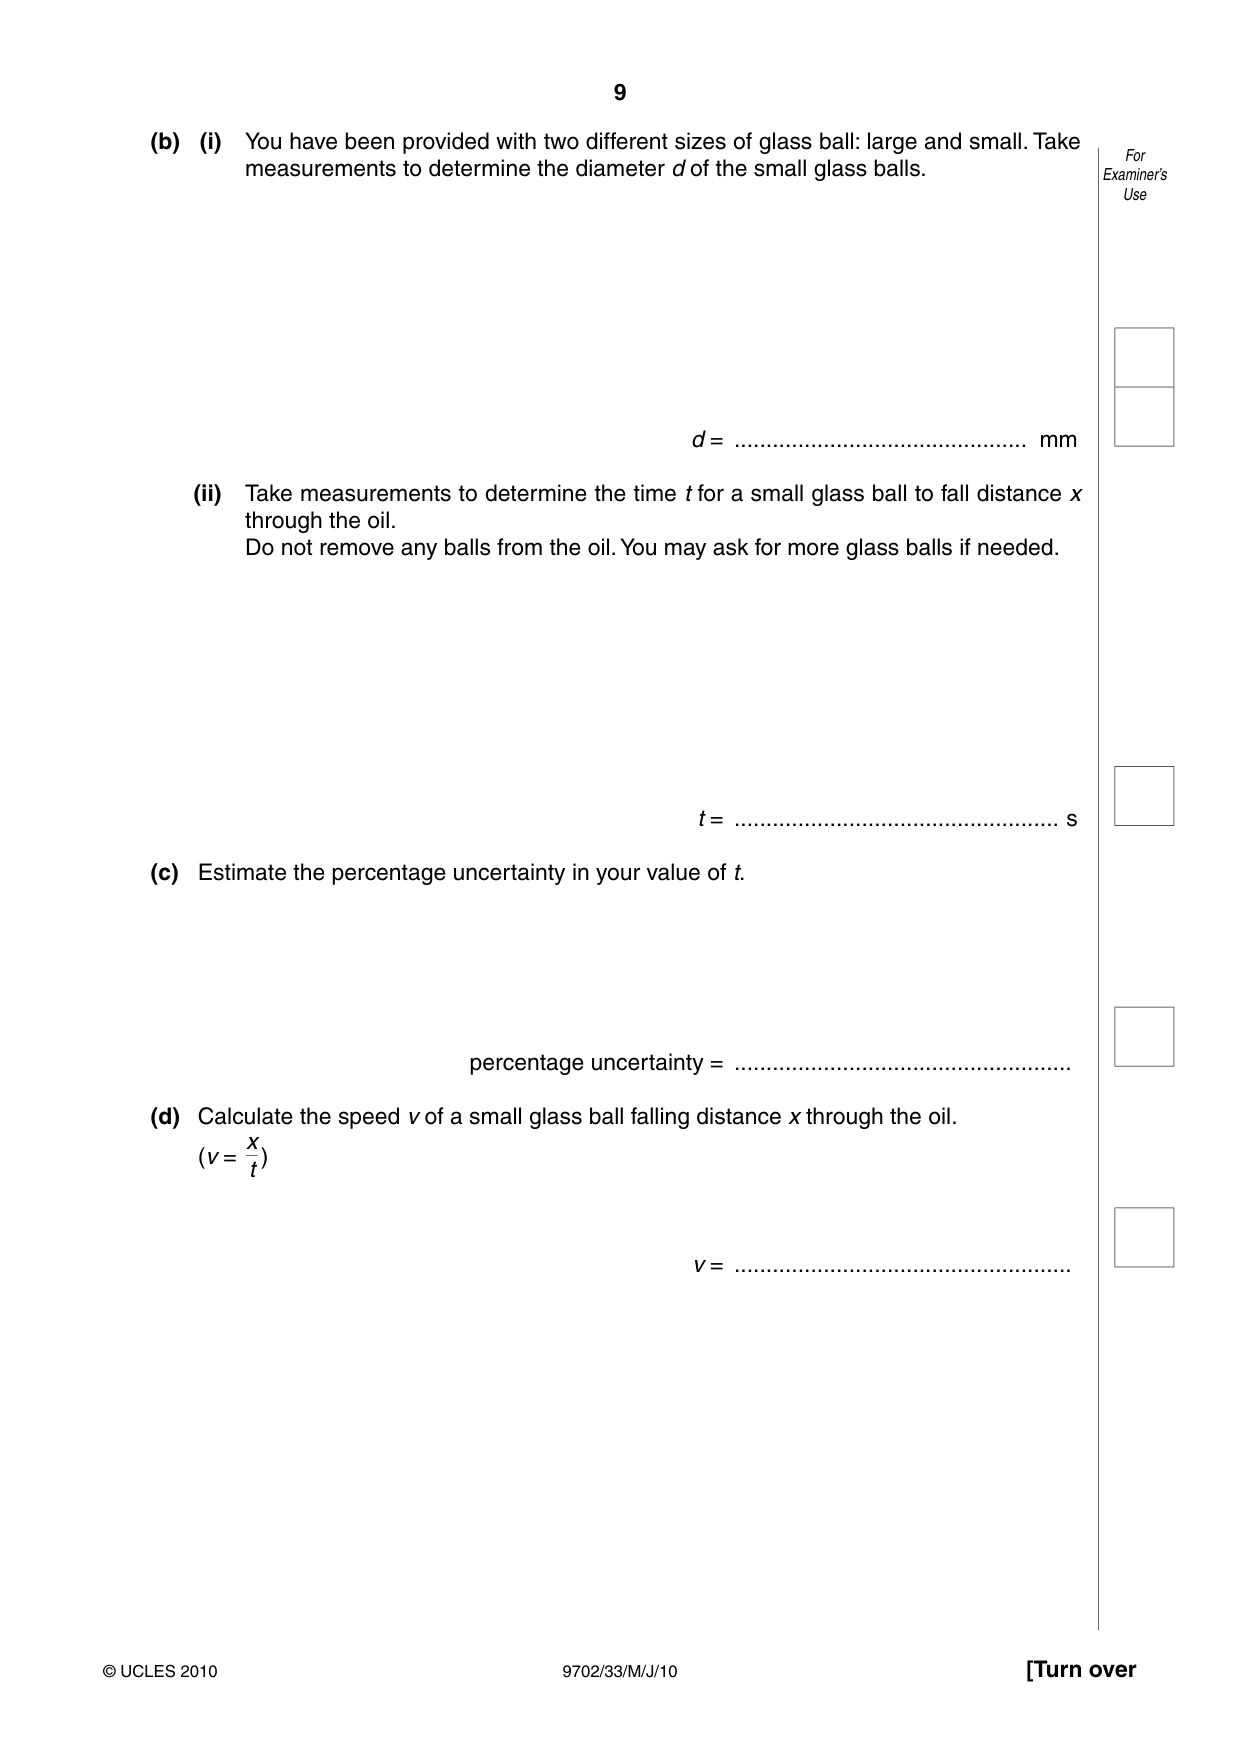
9 9702/33/M/J/10 [Turn over © UCLES 2010 For Examiner’s Use (b) (i) You have been provided with two different sizes of glass ball: large and small. Take measurements to determine the diameter d of the small glass balls. d = … mm (ii) Take measurements to determine the time t for a small glass ball to fall distance x through the oil. Do not remove any balls from the oil. You may ask for more glass balls if needed. t = … s (c) Estimate the percentage uncertainty in your value of t. percentage uncertainty = … (d) Calculate the speed v of a small glass ball falling distance x through the oil. (v = x t ) v = …
Question paper, page 10
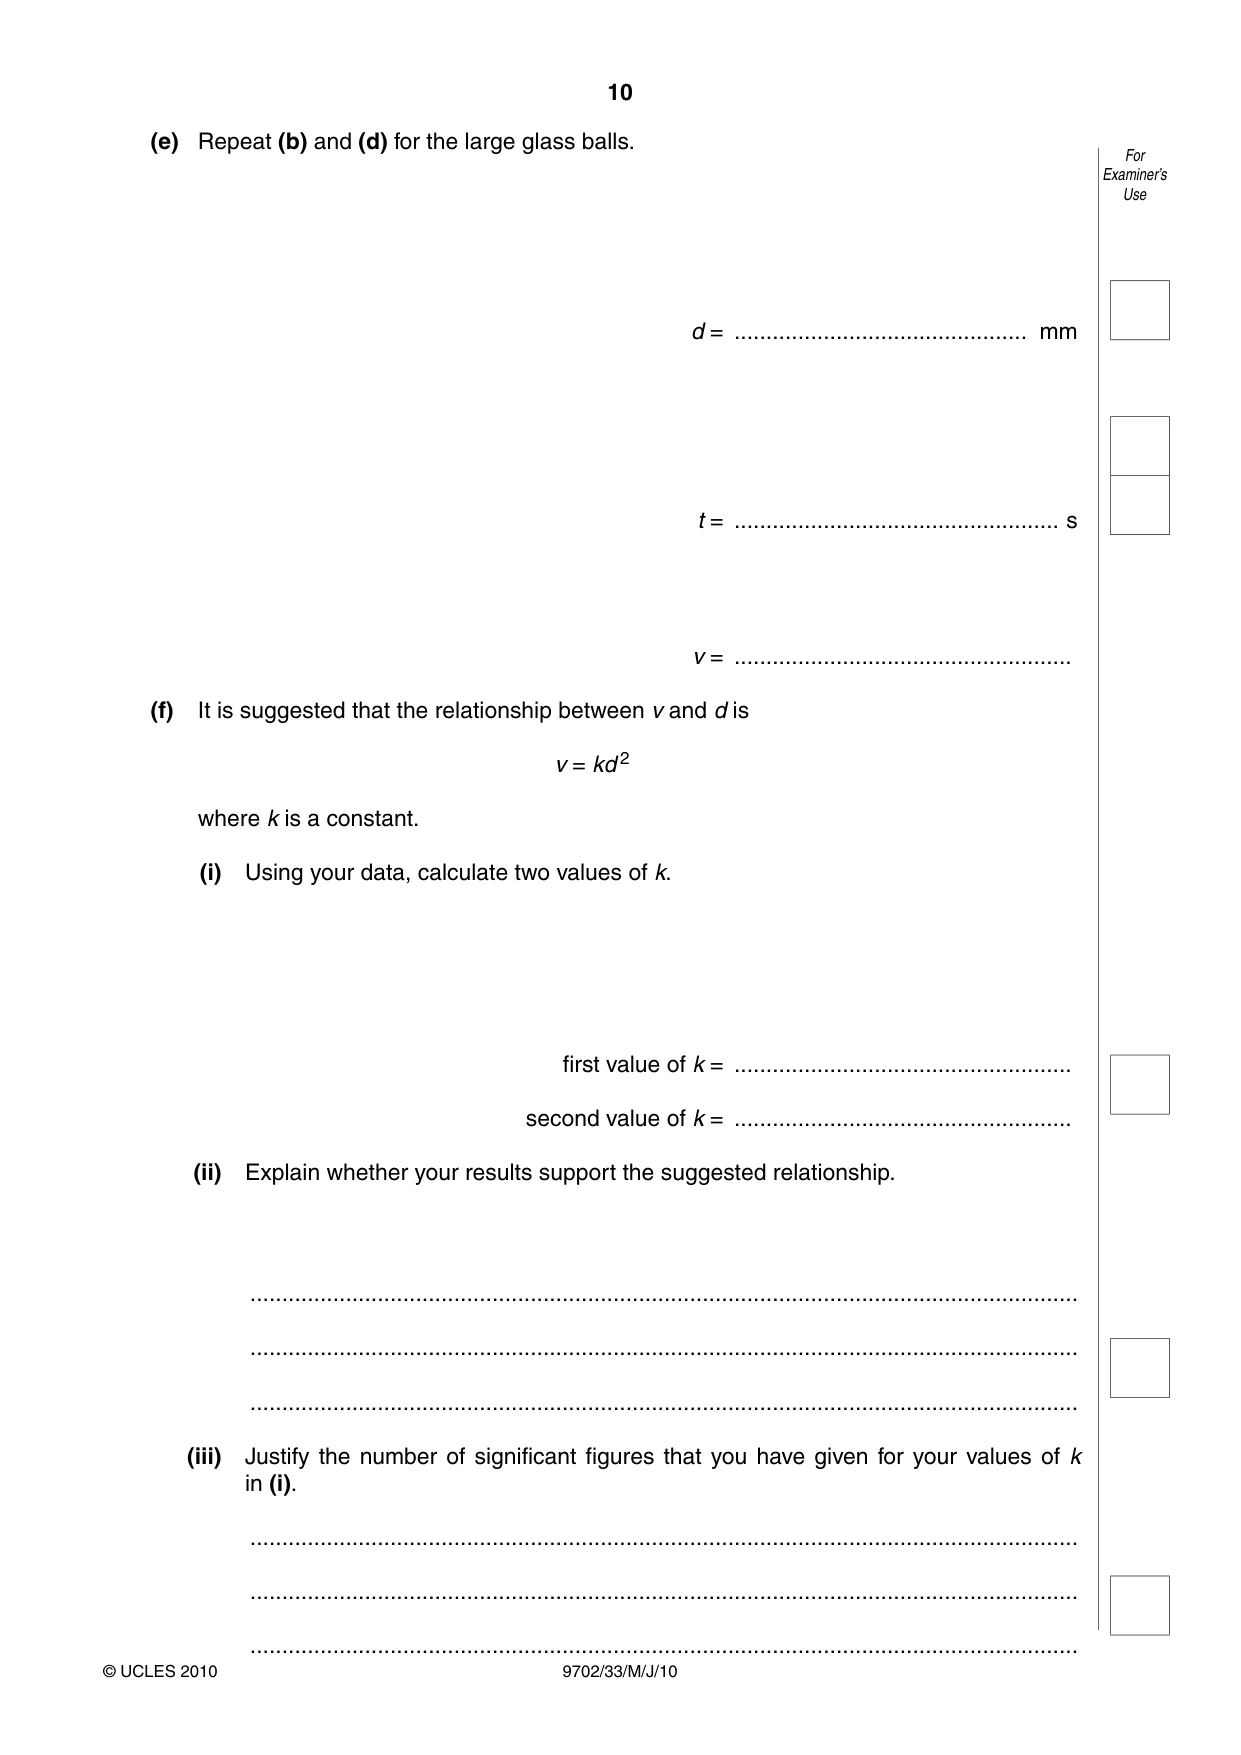
10 9702/33/M/J/10 © UCLES 2010 For Examiner’s Use (e) Repeat (b) and (d) for the large glass balls. d = … mm t = … s v = … (f) It is suggested that the relationship between v and d is v = kd 2 where k is a constant. (i) Using your data, calculate two values of k. first value of k = … second value of k = … (ii) Explain whether your results support the suggested relationship. … … … (iii) Justify the number of significant figures that you have given for your values of k in (i). … … …
Question paper, page 11
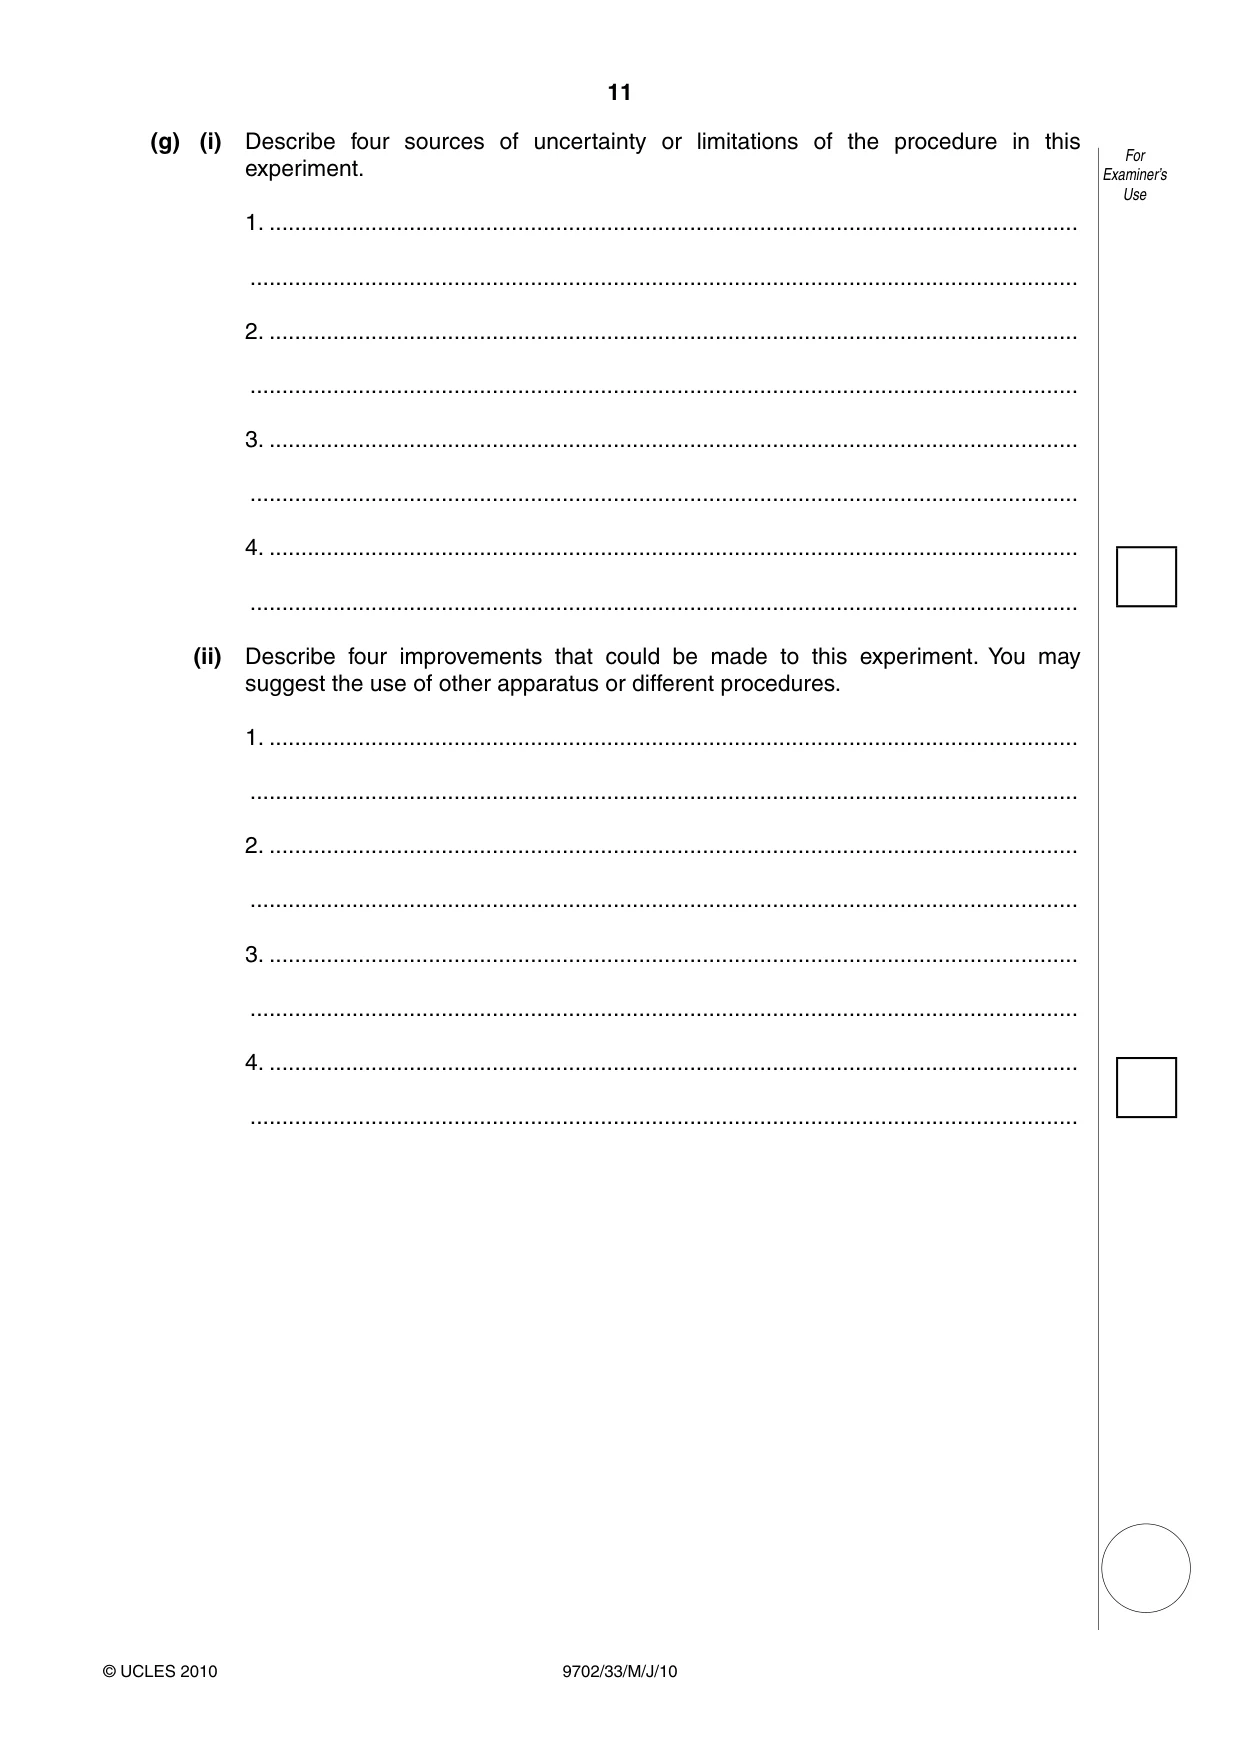
11 9702/33/M/J/10 © UCLES 2010 For Examiner’s Use (g) (i) Describe four sources of uncertainty or limitations of the procedure in this experiment. 1. … … 2. … … 3. … … 4. … … (ii) Describe four improvements that could be made to this experiment. You may suggest the use of other apparatus or different procedures. 1. … … 2. … … 3. … … 4. … …
Question paper, page 12
12 9702/33/M/J/10 © UCLES 2010 BLANK PAGE Permission to reproduce items where third-party owned material protected by copyright is included has been sought and cleared where possible. Every reasonable effort has been made by the publisher (UCLES) to trace copyright holders, but if any items requiring clearance have unwittingly been included, the publisher will be pleased to make amends at the earliest possible opportunity. University of Cambridge International Examinations is part of the Cambridge Assessment Group. Cambridge Assessment is the brand name of University of Cambridge Local Examinations Syndicate (UCLES), which is itself a department of the University of Cambridge.
Mark scheme, page 1
UNIVERSITY OF CAMBRIDGE INTERNATIONAL EXAMINATIONS GCE Advanced Subsidiary Level and GCE Advanced Level MARK SCHEME for the May/June 2010 question paper for the guidance of teachers 9702 PHYSICS 9702/33 Paper 31 (Advanced Practical Skills), maximum raw mark 40 This mark scheme is published as an aid to teachers and candidates, to indicate the requirements of the examination. It shows the basis on which Examiners were instructed to award marks. It does not indicate the details of the discussions that took place at an Examiners’ meeting before marking began, which would have considered the acceptability of alternative answers. Mark schemes must be read in conjunction with the question papers and the report on the examination. • CIE will not enter into discussions or correspondence in connection with these mark schemes. CIE is publishing the mark schemes for the May/June 2010 question papers for most IGCSE, GCE Advanced Level and Advanced Subsidiary Level syllabuses and some Ordinary Level syllabuses.
Mark scheme, page 2
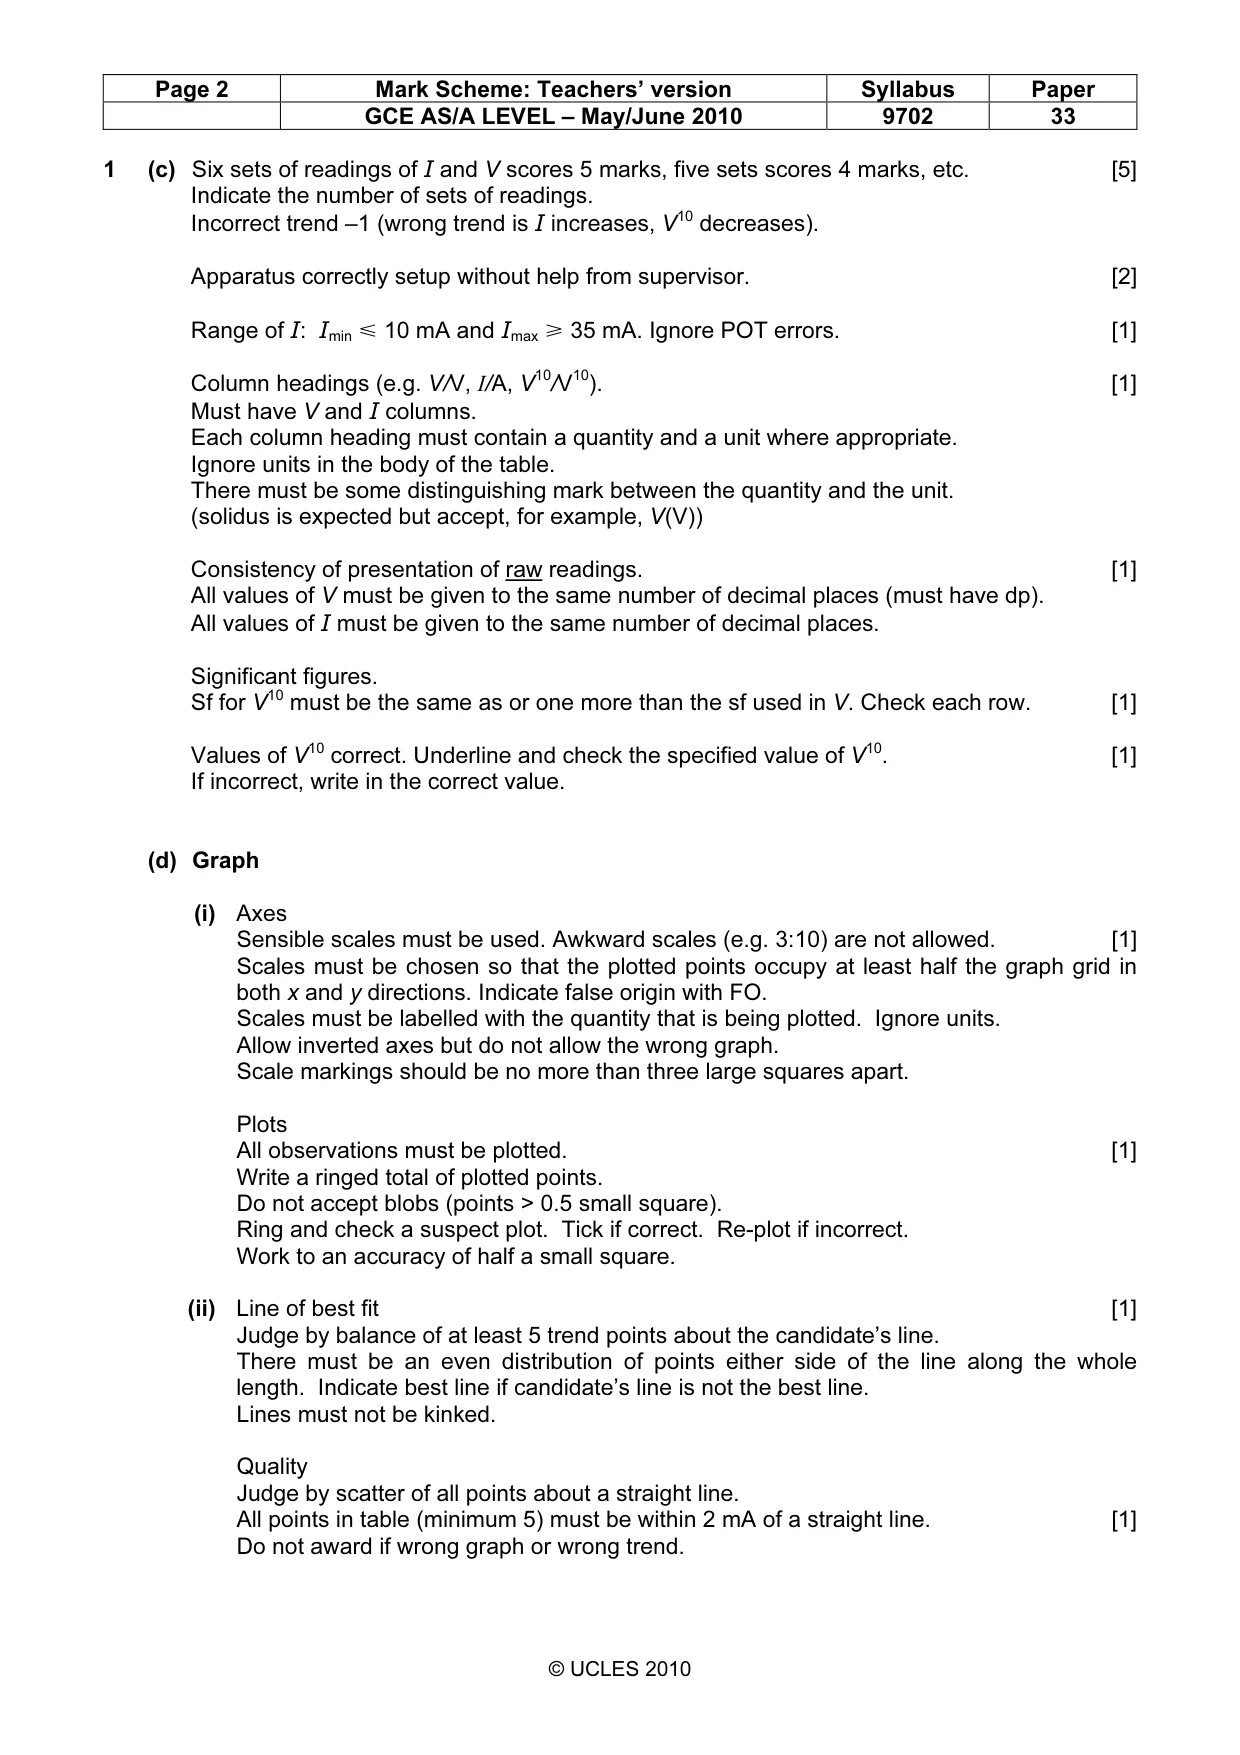
Page 2 Mark Scheme: Teachers’ version Syllabus Paper GCE AS/A LEVEL – May/June 2010 9702 33 © UCLES 2010 1 (c) Six sets of readings of I and V scores 5 marks, five sets scores 4 marks, etc. [5] Indicate the number of sets of readings. Incorrect trend –1 (wrong trend is I increases, V10 decreases). Apparatus correctly setup without help from supervisor. [2] Range of I: Imin Y 10 mA and Imax [ 35 mA. Ignore POT errors. [1] Column headings (e.g. V/V, I/A, V10/V10). [1] Must have V and I columns. Each column heading must contain a quantity and a unit where appropriate. Ignore units in the body of the table. There must be some distinguishing mark between the quantity and the unit. (solidus is expected but accept, for example, V(V)) Consistency of presentation of raw readings. [1] All values of V must be given to the same number of decimal places (must have dp). All values of I must be given to the same number of decimal places. Significant figures. Sf for V10 must be the same as or one more than the sf used in V. Check each row. [1] Values of V10 correct. Underline and check the specified value of V10. [1] If incorrect, write in the correct value. (d) Graph (i) Axes Sensible scales must be used. Awkward scales (e.g. 3:10) are not allowed. [1] Scales must be chosen so that the plotted points occupy at least half the graph grid in both x and y directions. Indicate false origin with FO. Scales must be labelled with the quantity that is being plotted. Ignore units. Allow inverted axes but do not allow the wrong graph. Scale markings should be no more than three large squares apart. Plots All observations must be plotted. [1] Write a ringed total of plotted points. Do not accept blobs (points > 0.5 small square). Ring and check a suspect plot. Tick if correct. Re-plot if incorrect. Work to an accuracy of half a small square. (ii) Line of best fit [1] Judge by balance of at least 5 trend points about the candidate’s line. There must be an even distribution of points either side of the line along the whole length. Indicate best line if candidate’s line is not the best line. Lines must not be kinked. Quality Judge by scatter of all points about a straight line. All points in table (minimum 5) must be within 2 mA of a straight line. [1] Do not award if wrong graph or wrong trend.
Mark scheme, page 3
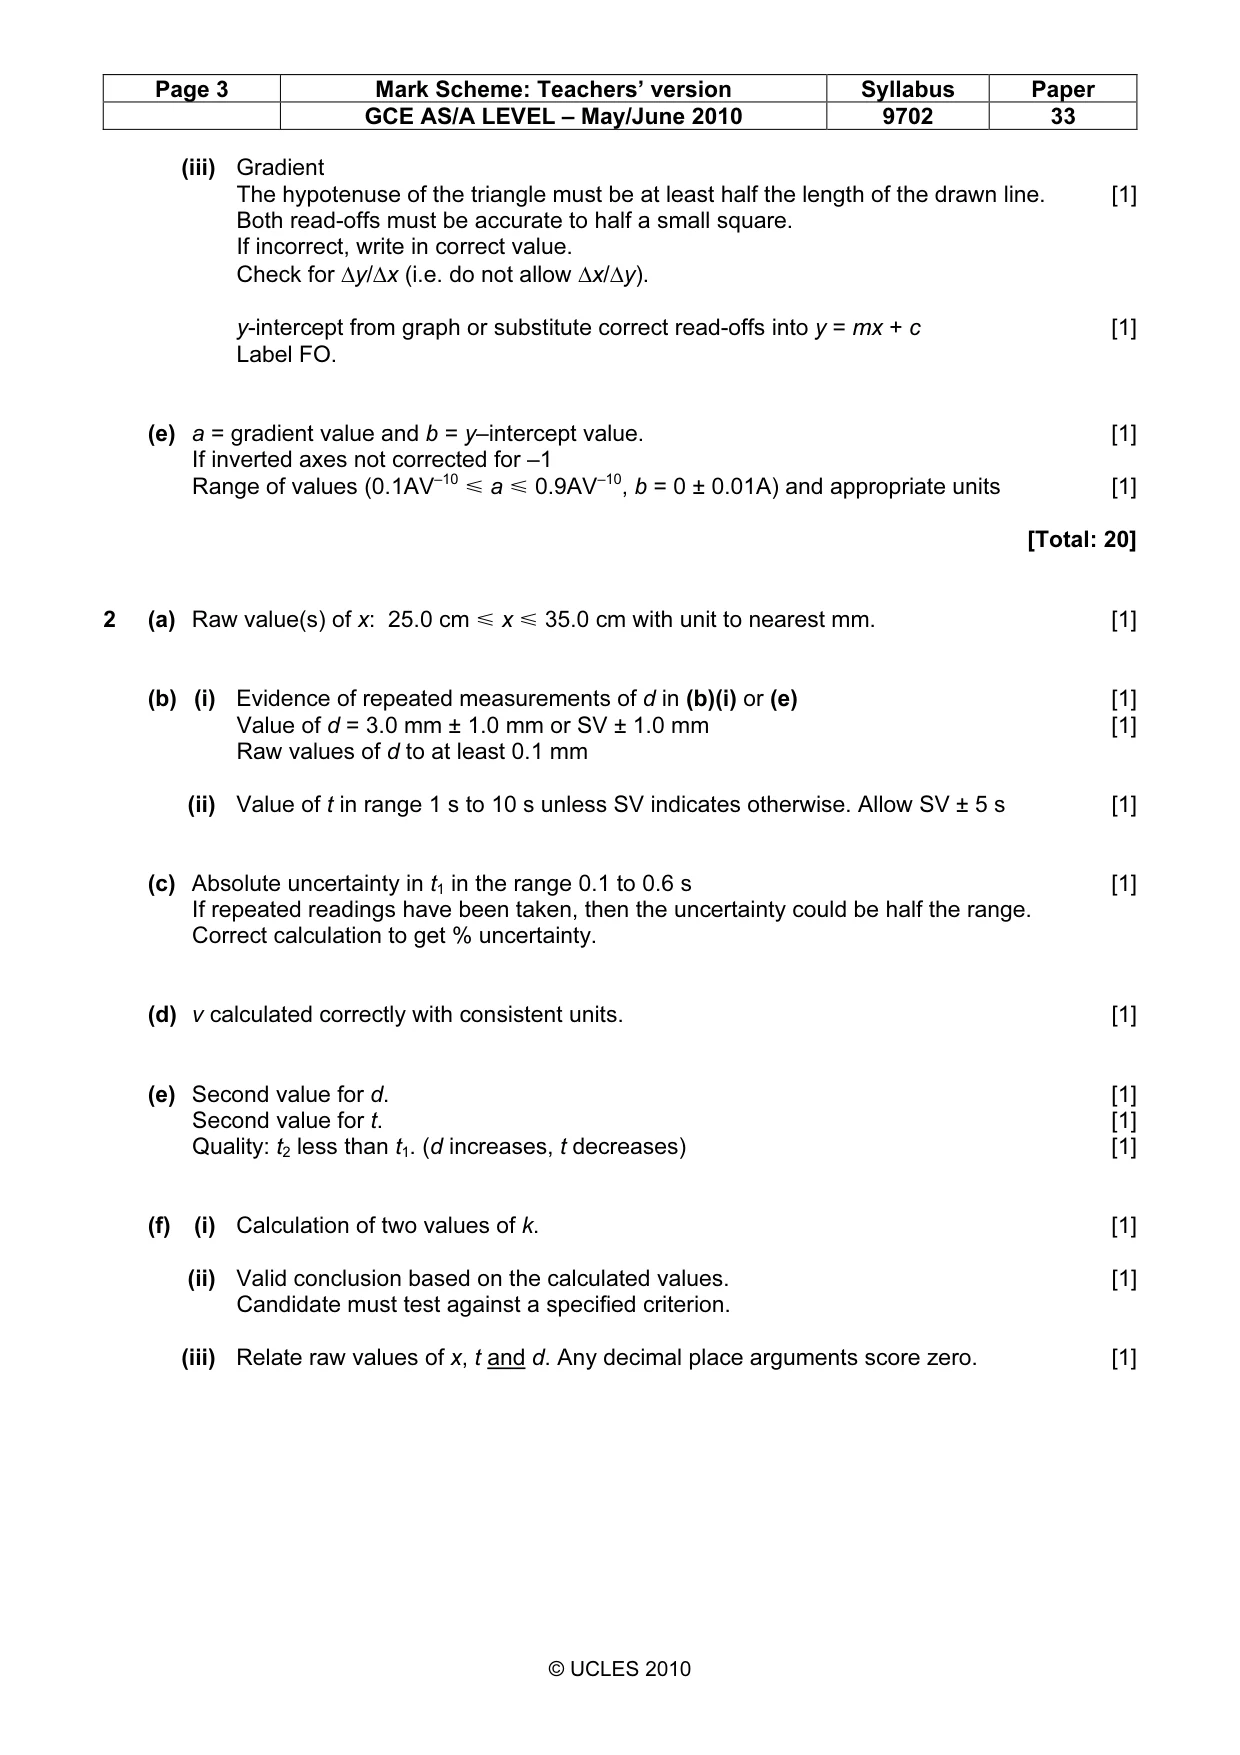
Page 3 Mark Scheme: Teachers’ version Syllabus Paper GCE AS/A LEVEL – May/June 2010 9702 33 © UCLES 2010 (iii) Gradient The hypotenuse of the triangle must be at least half the length of the drawn line. [1] Both read-offs must be accurate to half a small square. If incorrect, write in correct value. Check for ∆y/∆x (i.e. do not allow ∆x/∆y). y-intercept from graph or substitute correct read-offs into y = mx + c [1] Label FO. (e) a = gradient value and b = y–intercept value. [1] If inverted axes not corrected for –1 Range of values (0.1AV–10 Y a Y 0.9AV–10, b = 0 ± 0.01A) and appropriate units [1] [Total: 20] 2 (a) Raw value(s) of x: 25.0 cm Y x Y 35.0 cm with unit to nearest mm. [1] (b) (i) Evidence of repeated measurements of d in (b)(i) or (e) [1] Value of d = 3.0 mm ± 1.0 mm or SV ± 1.0 mm [1] Raw values of d to at least 0.1 mm (ii) Value of t in range 1 s to 10 s unless SV indicates otherwise. Allow SV ± 5 s [1] (c) Absolute uncertainty in t1 in the range 0.1 to 0.6 s [1] If repeated readings have been taken, then the uncertainty could be half the range. Correct calculation to get % uncertainty. (d) v calculated correctly with consistent units. [1] (e) Second value for d. [1] Second value for t. [1] Quality: t2 less than t1. (d increases, t decreases) [1] (f) (i) Calculation of two values of k. [1] (ii) Valid conclusion based on the calculated values. [1] Candidate must test against a specified criterion. (iii) Relate raw values of x, t and d. Any decimal place arguments score zero. [1]
Mark scheme, page 4
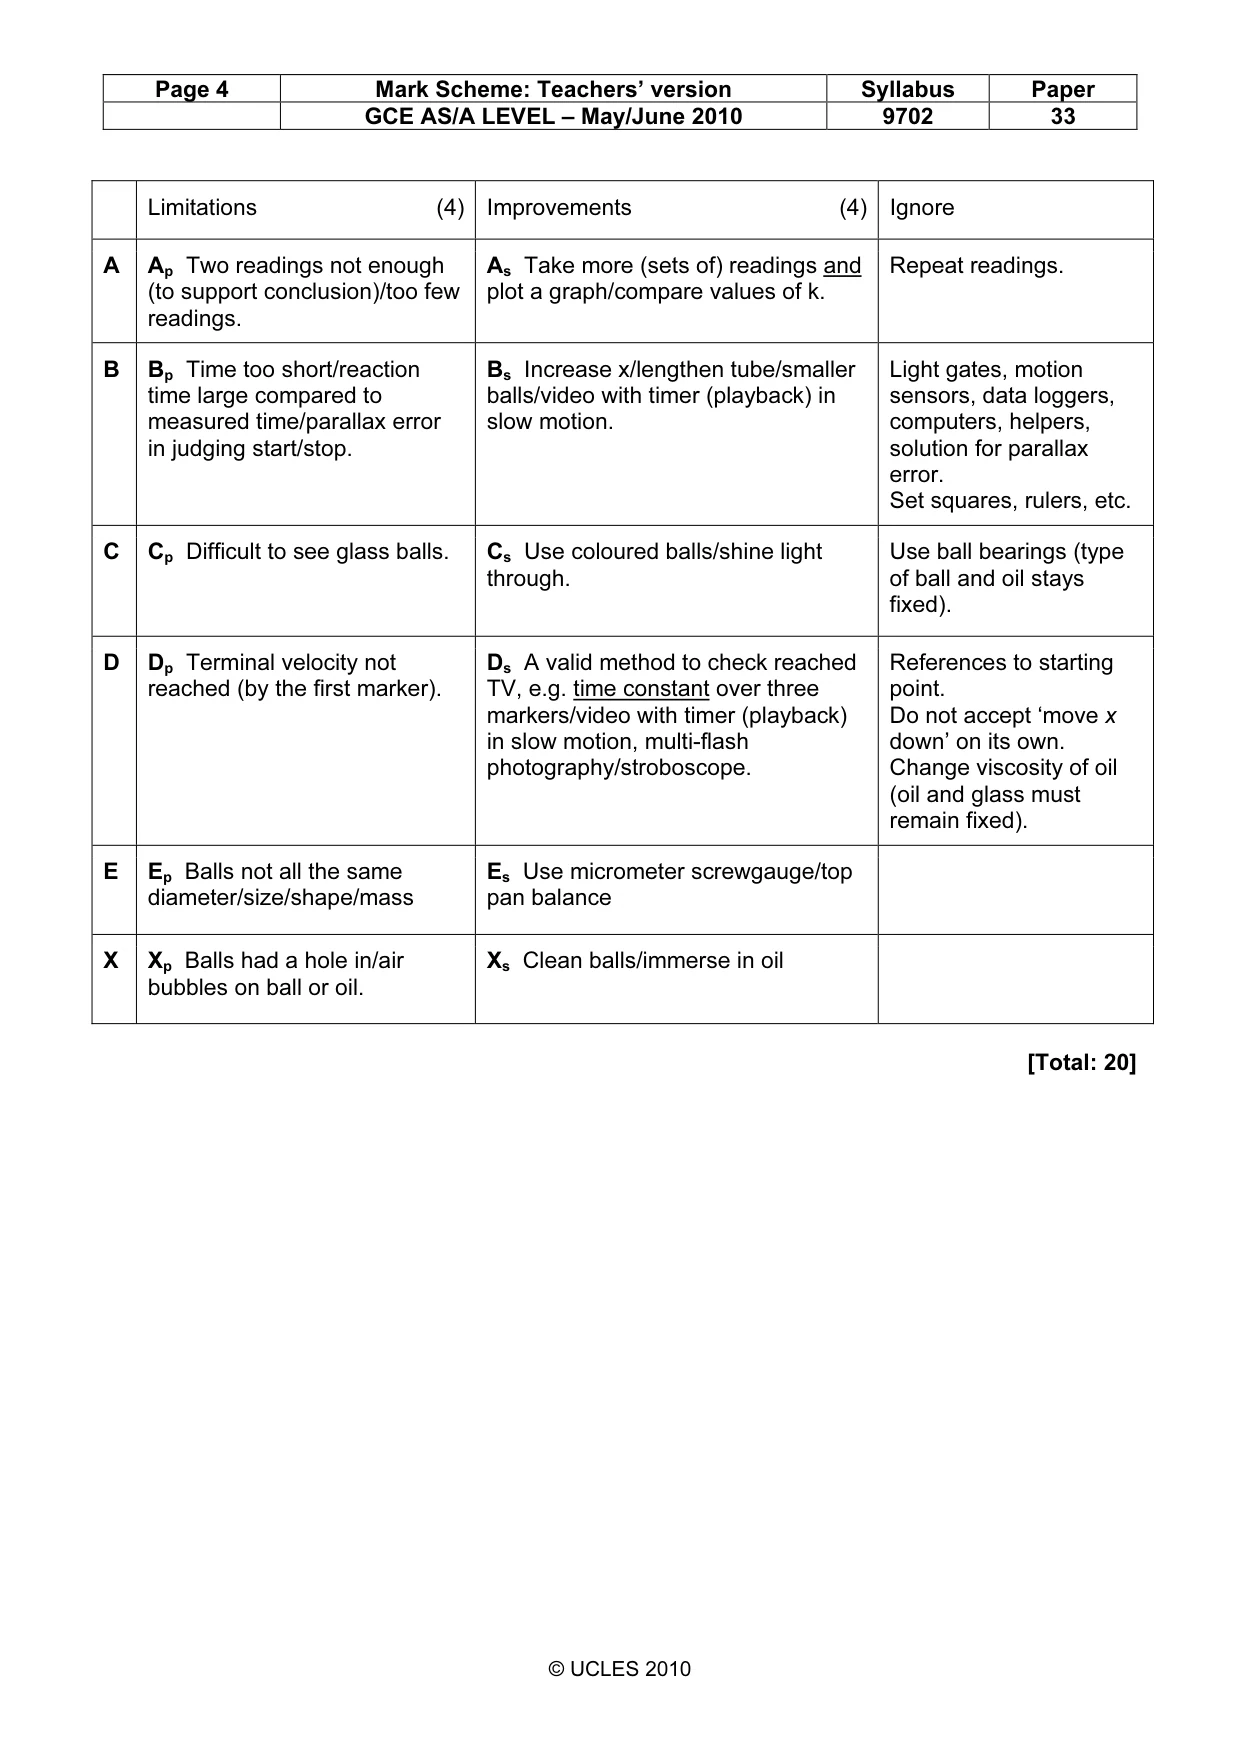
Page 4 Mark Scheme: Teachers’ version Syllabus Paper GCE AS/A LEVEL – May/June 2010 9702 33 © UCLES 2010 Limitations (4) Improvements (4) Ignore A Ap Two readings not enough (to support conclusion)/too few readings. As Take more (sets of) readings and plot a graph/compare values of k. Repeat readings. B Bp Time too short/reaction time large compared to measured time/parallax error in judging start/stop. Bs Increase x/lengthen tube/smaller balls/video with timer (playback) in slow motion. Light gates, motion sensors, data loggers, computers, helpers, solution for parallax error. Set squares, rulers, etc. C Cp Difficult to see glass balls. Cs Use coloured balls/shine light through. Use ball bearings (type of ball and oil stays fixed). D Dp Terminal velocity not reached (by the first marker). Ds A valid method to check reached TV, e.g. time constant over three markers/video with timer (playback) in slow motion, multi-flash photography/stroboscope. References to starting point. Do not accept ‘move x down’ on its own. Change viscosity of oil (oil and glass must remain fixed). E Ep Balls not all the same diameter/size/shape/mass Es Use micrometer screwgauge/top pan balance X Xp Balls had a hole in/air bubbles on ball or oil. Xs Clean balls/immerse in oil [Total: 20]
What you needed in this session
Cambridge’s own grade thresholds for 2010 May/June, Paper 3 · Variant 3. A higher threshold means an easier paper — the bar moves with how the cohort did.