Cambridge A Level Physics 9702 — 2007 Oct/Nov Paper 5 · Variant 1
9702/51/O/N/07 · 30 marks · ≈34 min
The question paper and its mark scheme, free to read here and free to download. This is Cambridge’s own paper, exactly as it was sat.
Question paper8 pages

Mark scheme5 pages
Answers below. Sit the paper first if you are practising.
Paper as text
Question paper, page 1
This document consists of 8 printed pages. SP (SJF4236/CGW) T22991/2 © UCLES 2007 [Turn over UNIVERSITY OF CAMBRIDGE INTERNATIONAL EXAMINATIONS General Certificate of Education Advanced Level READ THESE INSTRUCTIONS FIRST Write your Centre number, candidate number and name on all the work you hand in. Write in dark blue or black pen. You may use a soft pencil for any diagrams, graphs or rough working. Do not use staples, paper clips, highlighters, glue or correction fluid. DO NOT WRITE IN ANY BARCODES. Answer all questions. You may lose marks if you do not show your working or if you do not use appropriate units. At the end of the examination, fasten all your work securely together. The number of marks is given in brackets [ ] at the end of each question or part question. * 3 4 9 9 5 8 9 2 3 6 * PHYSICS 9702/05 Paper 5 Planning, Analysis and Evaluation October/November 2007 1 hour 15 minutes Candidates answer on the Question Paper. No Additional Materials are required. For Examiner’s Use 1 2 Total
Question paper, page 2
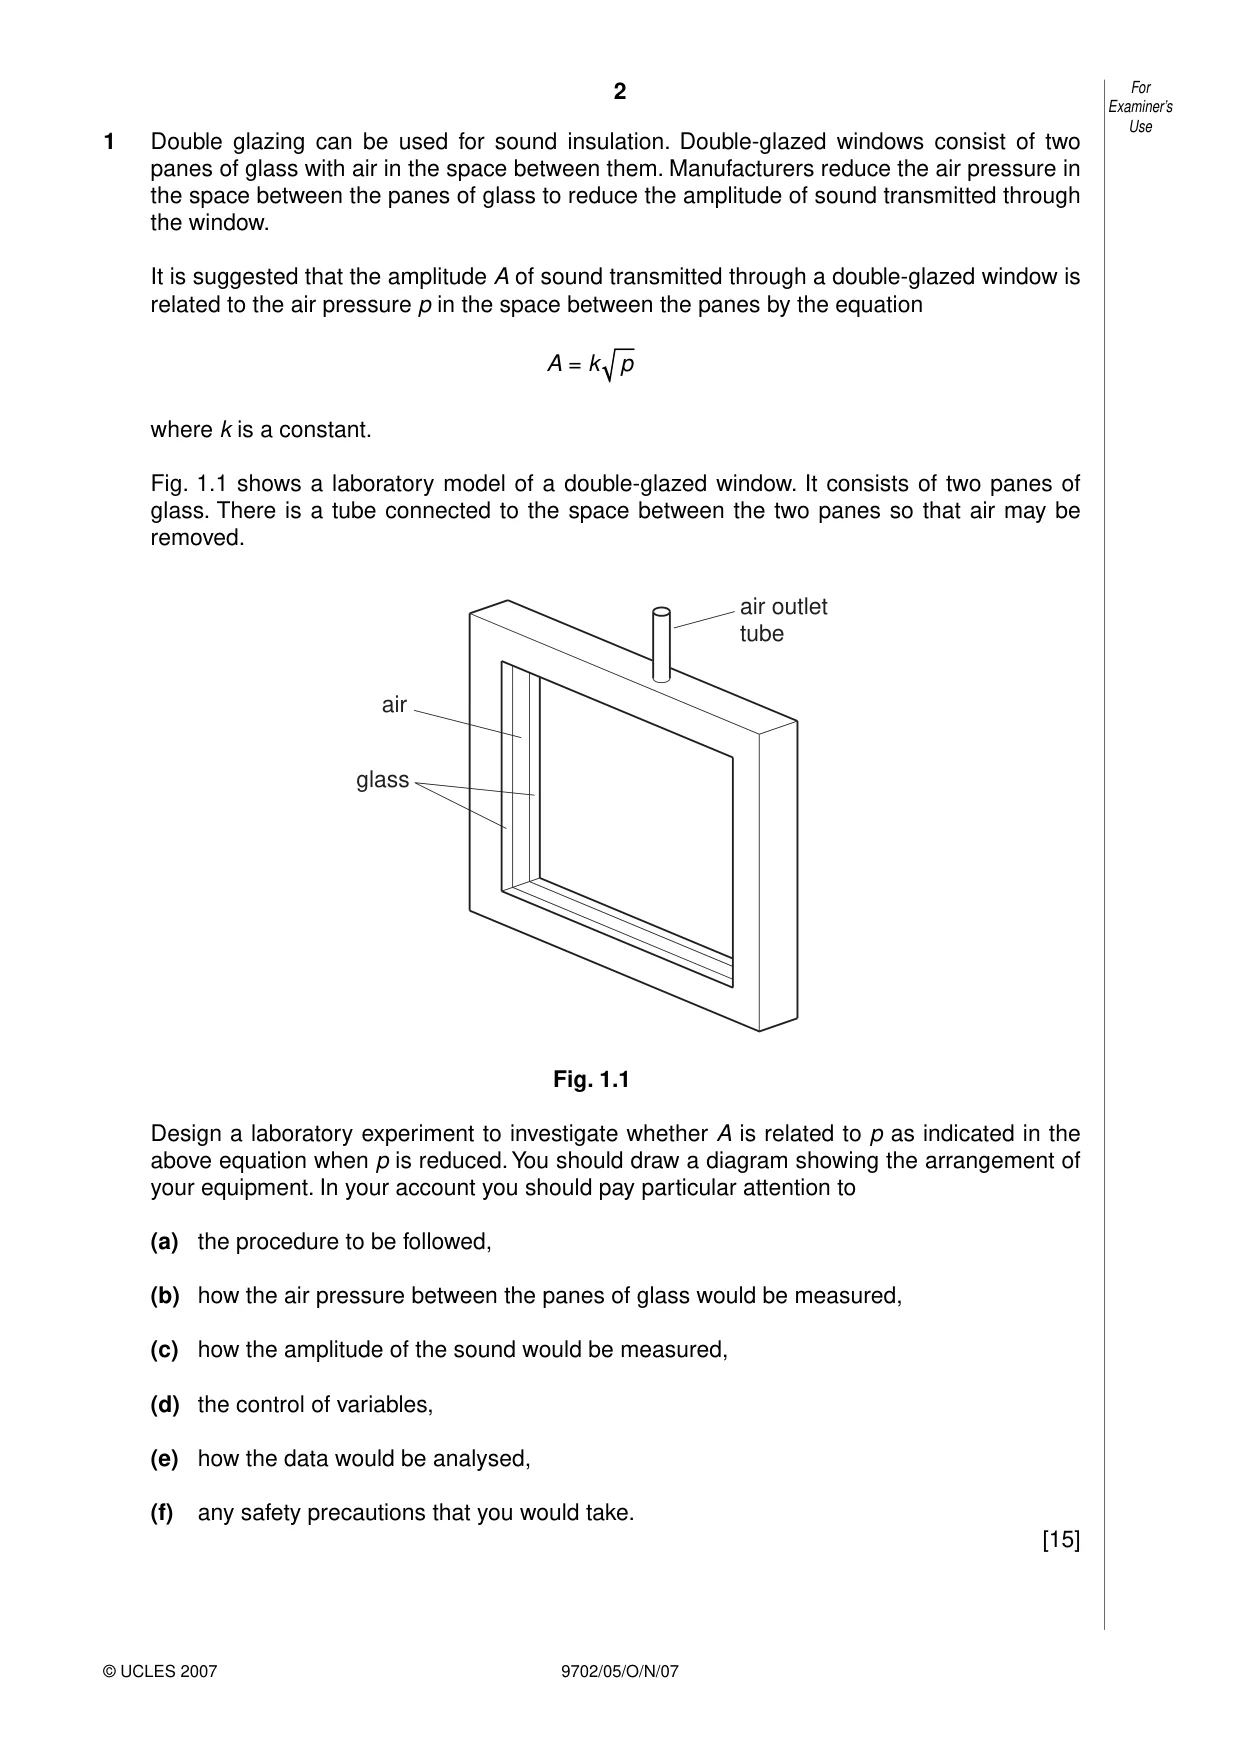
2 9702/05/O/N/07 For Examiner’s Use © UCLES 2007 1 Double glazing can be used for sound insulation. Double-glazed windows consist of two panes of glass with air in the space between them. Manufacturers reduce the air pressure in the space between the panes of glass to reduce the amplitude of sound transmitted through the window. It is suggested that the amplitude A of sound transmitted through a double-glazed window is related to the air pressure p in the space between the panes by the equation A = k p where k is a constant. Fig. 1.1 shows a laboratory model of a double-glazed window. It consists of two panes of glass. There is a tube connected to the space between the two panes so that air may be removed. air glass air outlet tube Fig. 1.1 Design a laboratory experiment to investigate whether A is related to p as indicated in the above equation when p is reduced. You should draw a diagram showing the arrangement of your equipment. In your account you should pay particular attention to (a) the procedure to be followed, (b) how the air pressure between the panes of glass would be measured, (c) how the amplitude of the sound would be measured, (d) the control of variables, (e) how the data would be analysed, (f) any safety precautions that you would take. [15]
Question paper, page 3
3 9702/05/O/N/07 [Turn over For Examiner’s Use © UCLES 2007 Diagram … … … … … … … … … … … … … … …
Question paper, page 4
4 9702/05/O/N/07 For Examiner’s Use © UCLES 2007 … … … … … … … … … … … … … … … … … … … … … … … … … … …
Question paper, page 5
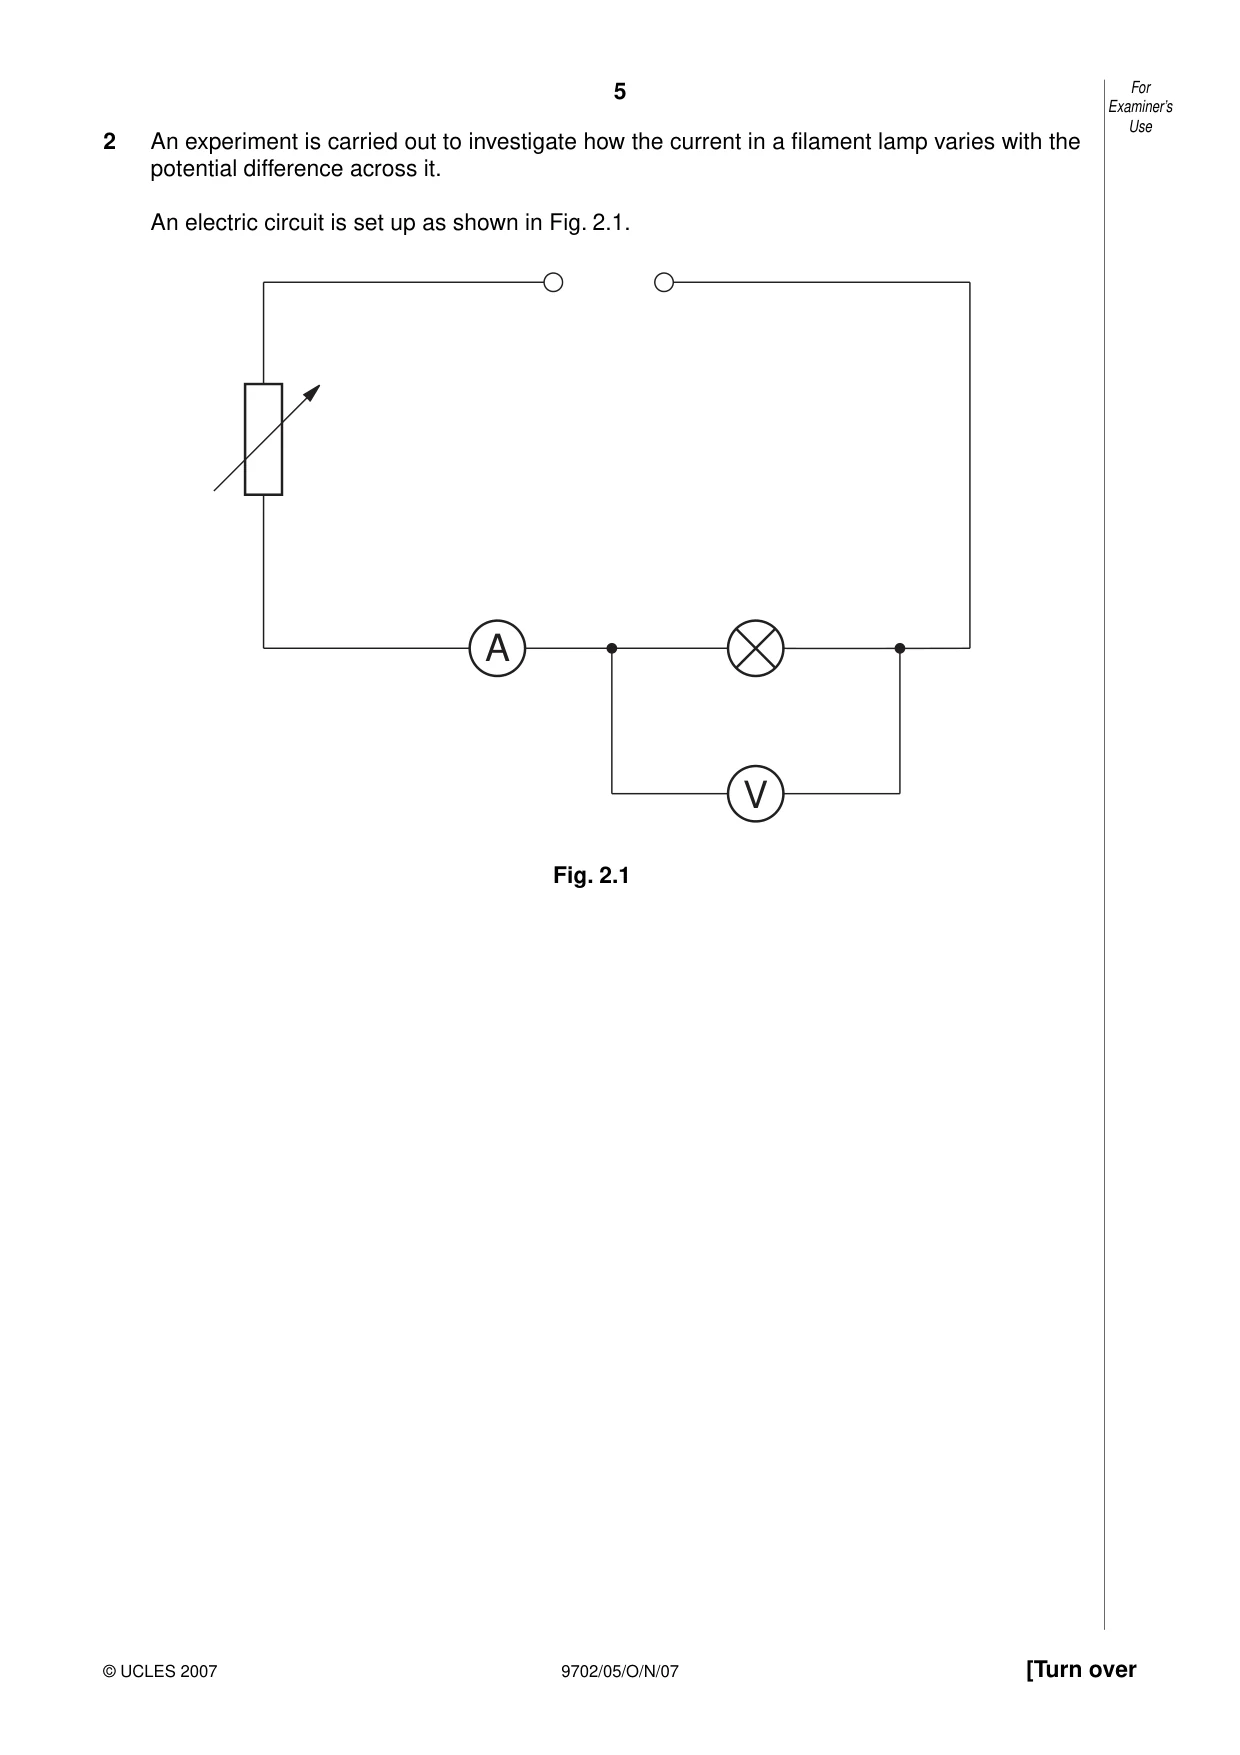
5 9702/05/O/N/07 [Turn over For Examiner’s Use © UCLES 2007 2 An experiment is carried out to investigate how the current in a filament lamp varies with the potential difference across it. An electric circuit is set up as shown in Fig. 2.1. A V Fig. 2.1
Question paper, page 6
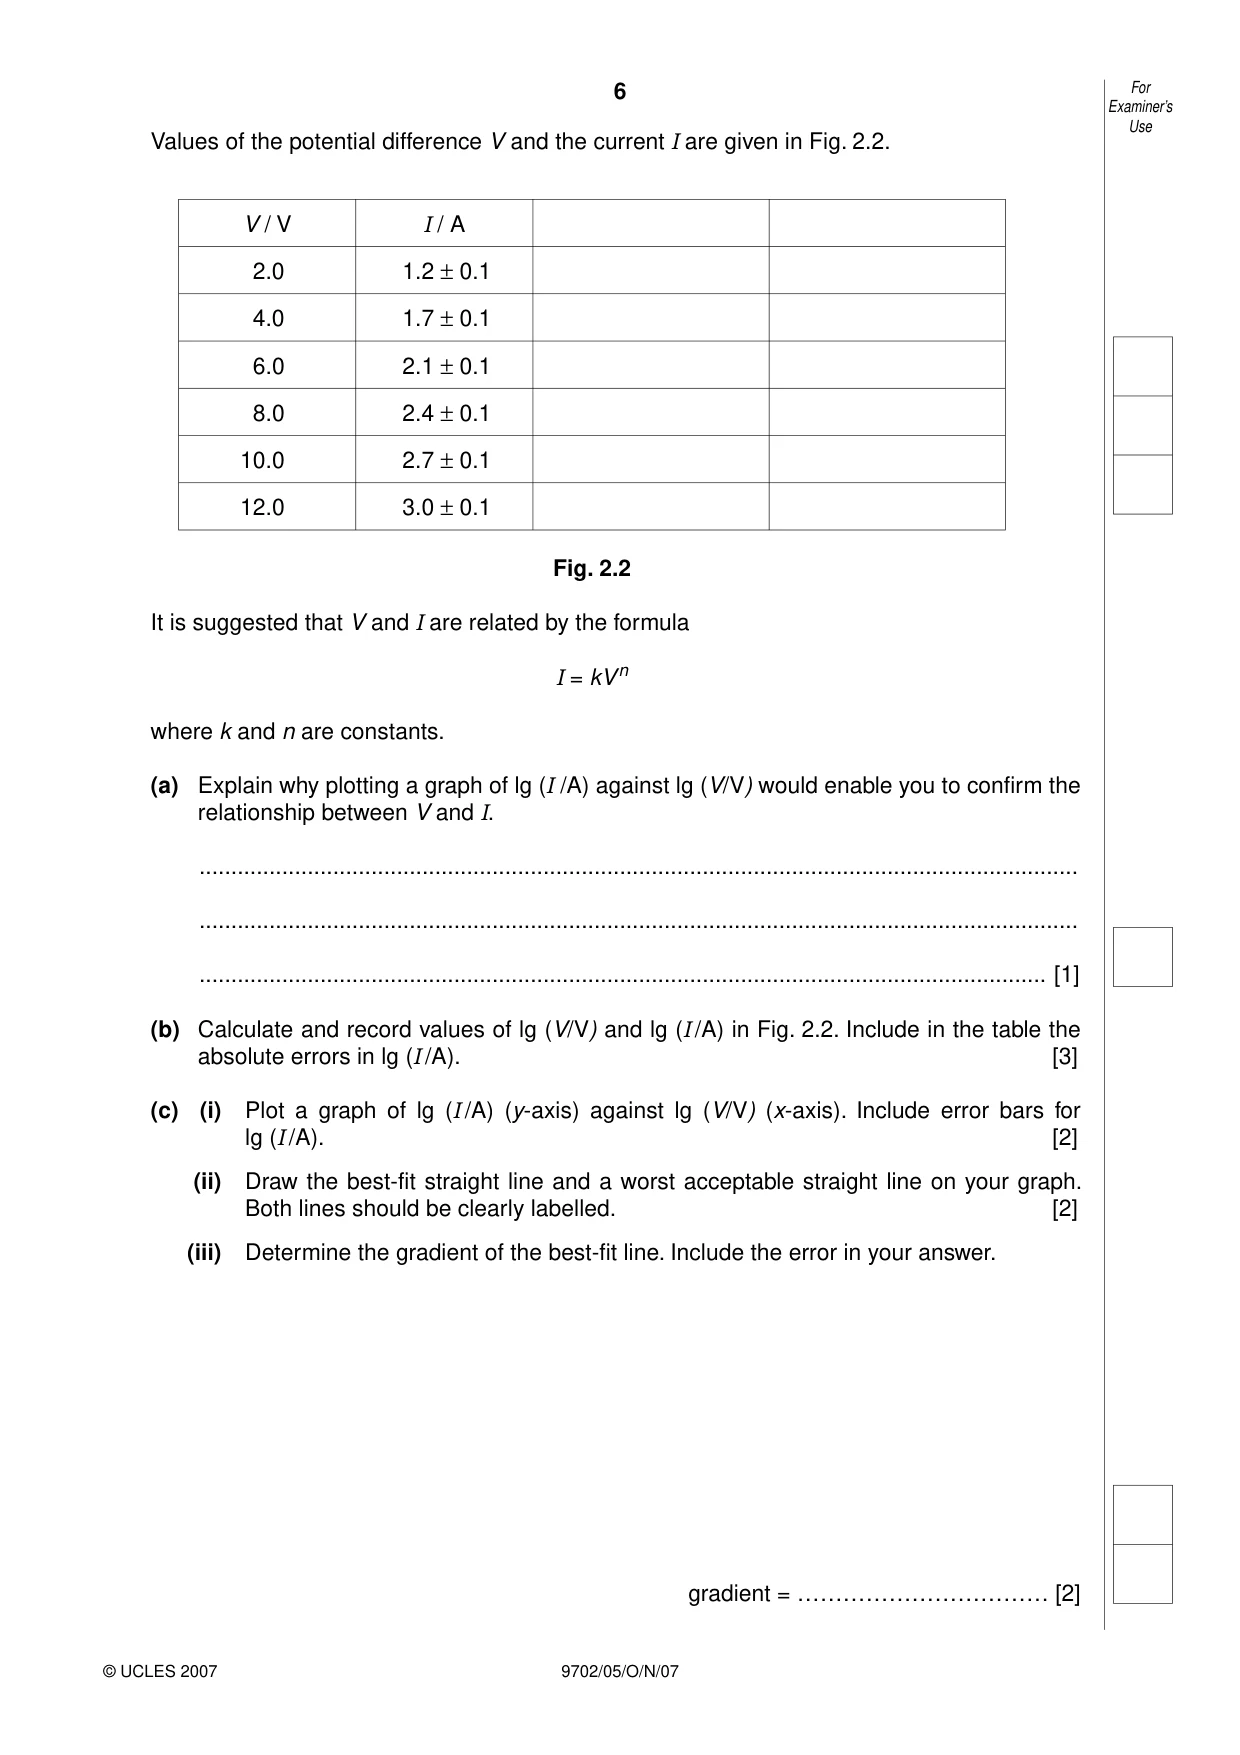
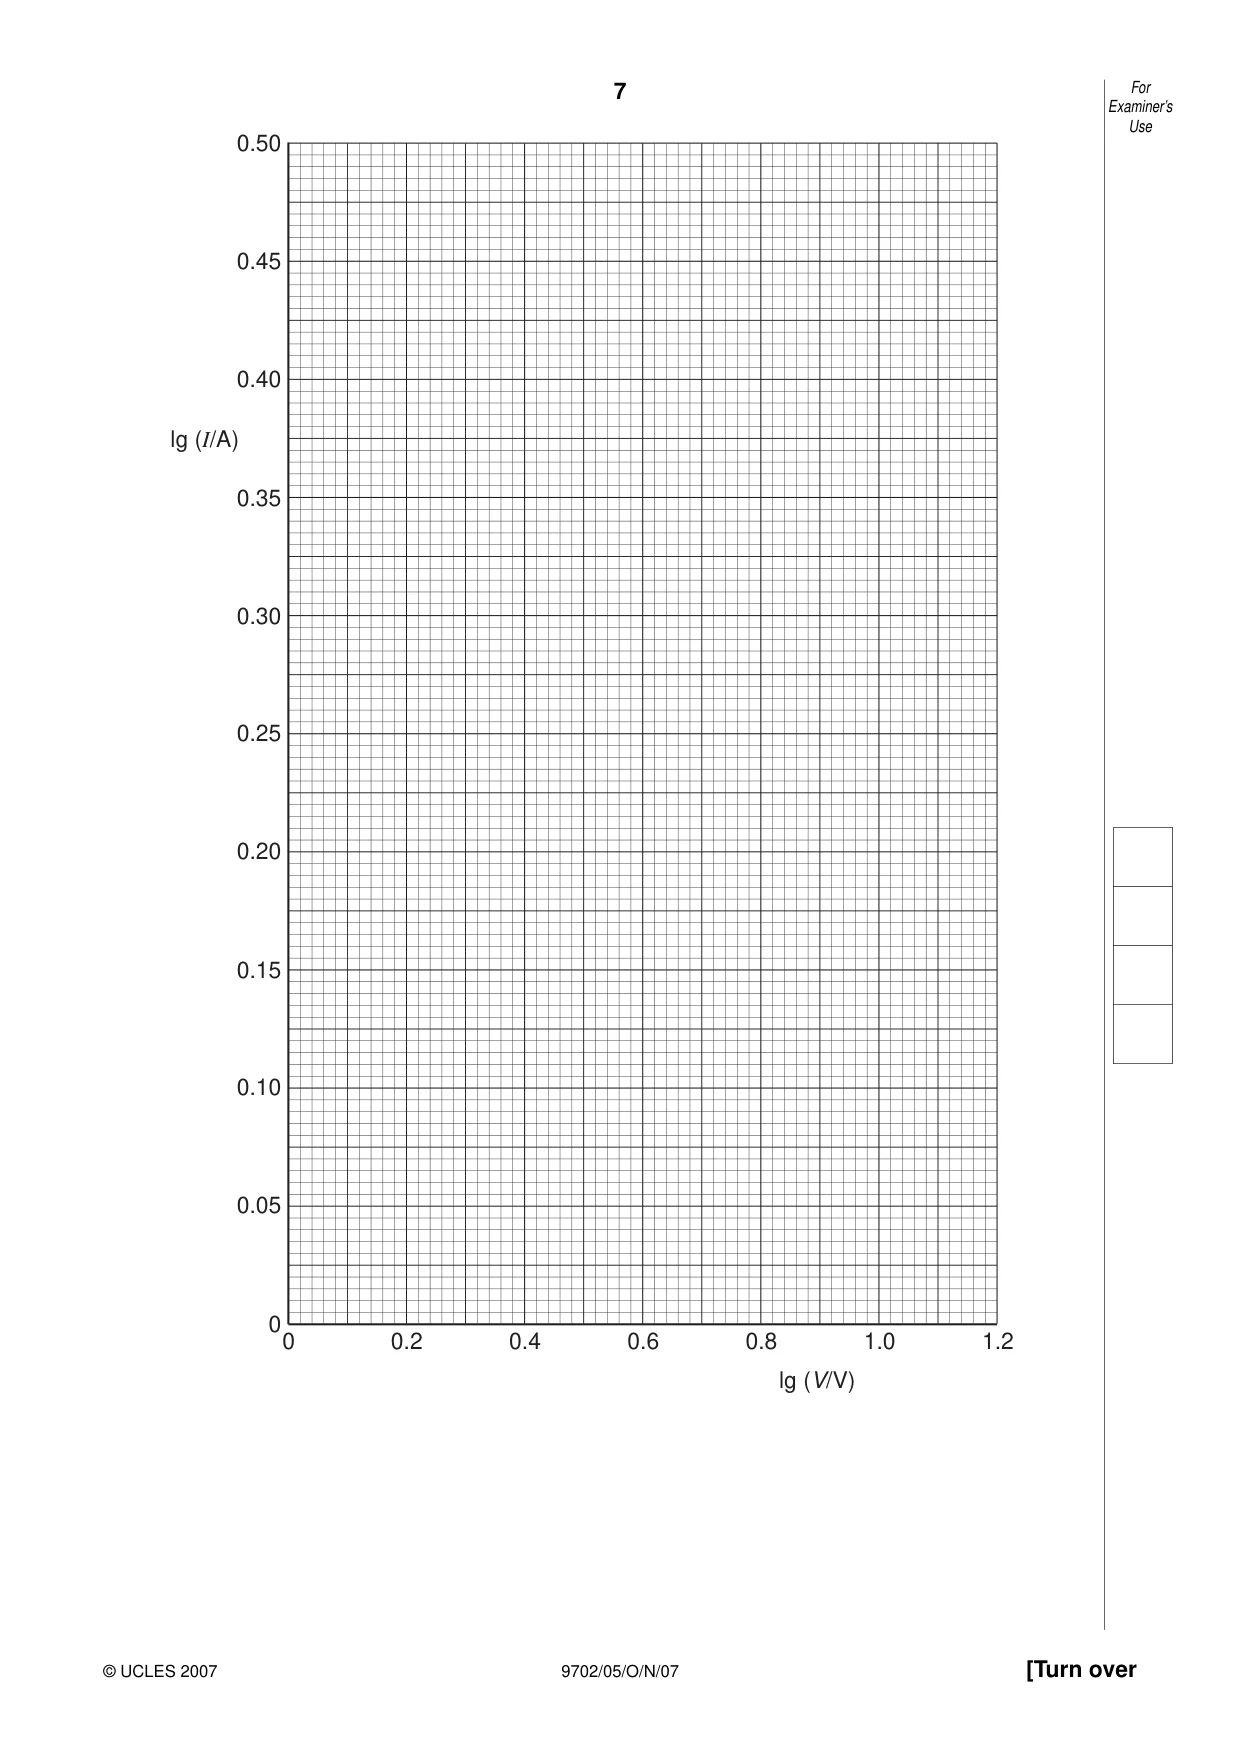
6 9702/05/O/N/07 For Examiner’s Use © UCLES 2007 Values of the potential difference V and the current I are given in Fig. 2.2. V / V I / A 2.0 1.2 ± 0.1 4.0 1.7 ± 0.1 6.0 2.1 ± 0.1 8.0 2.4 ± 0.1 10.0 2.7 ± 0.1 12.0 3.0 ± 0.1 Fig. 2.2 It is suggested that V and I are related by the formula I = kVn where k and n are constants. (a) Explain why plotting a graph of lg (I /A) against lg (V/V) would enable you to confirm the relationship between V and I. … … … [1] (b) Calculate and record values of lg (V/V) and lg (I /A) in Fig. 2.2. Include in the table the absolute errors in lg (I /A). [3] (c) (i) Plot a graph of lg (I /A) (y-axis) against lg (V/V) (x-axis). Include error bars for lg (I /A). [2] (ii) Draw the best-fit straight line and a worst acceptable straight line on your graph. Both lines should be clearly labelled. [2] (iii) Determine the gradient of the best-fit line. Include the error in your answer. gradient = …………………………… [2]
Question paper, page 7
7 9702/05/O/N/07 [Turn over For Examiner’s Use © UCLES 2007 0.50 0.45 0.40 0.35 0.30 0.25 0.20 0.15 0.10 0.05 00 0.2 0.4 0.6 0.8 1.0 lg (V/V) lg (I/A) 1.2
Question paper, page 8
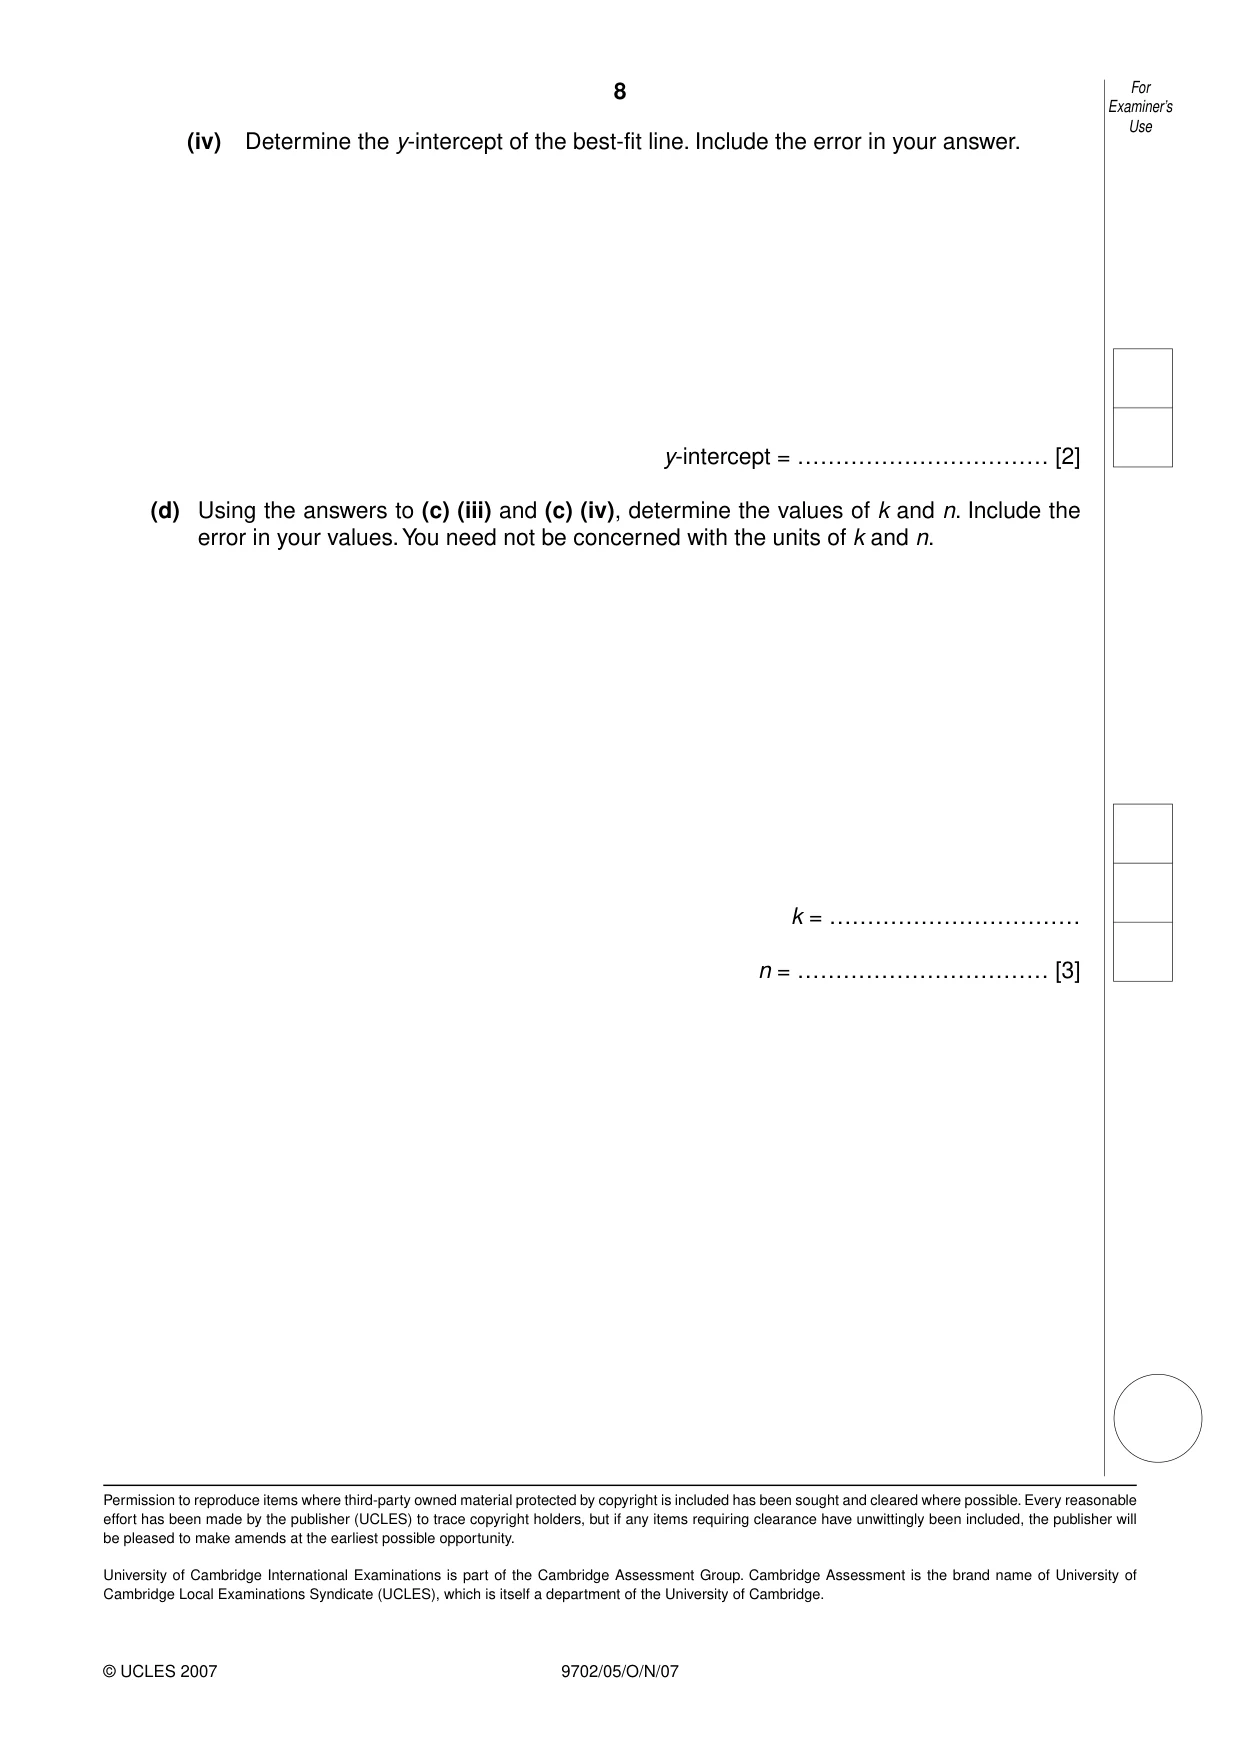
8 9702/05/O/N/07 © UCLES 2007 Permission to reproduce items where third-party owned material protected by copyright is included has been sought and cleared where possible. Every reasonable effort has been made by the publisher (UCLES) to trace copyright holders, but if any items requiring clearance have unwittingly been included, the publisher will be pleased to make amends at the earliest possible opportunity. University of Cambridge International Examinations is part of the Cambridge Assessment Group. Cambridge Assessment is the brand name of University of Cambridge Local Examinations Syndicate (UCLES), which is itself a department of the University of Cambridge. (iv) Determine the y-intercept of the best-fit line. Include the error in your answer. y-intercept = …………………………… [2] (d) Using the answers to (c) (iii) and (c) (iv), determine the values of k and n. Include the error in your values. You need not be concerned with the units of k and n. k = …………………………… n = …………………………… [3] For Examiner’s Use
Mark scheme, page 1
UNIVERSITY OF CAMBRIDGE INTERNATIONAL EXAMINATIONS GCE Advanced Subsidiary Level and GCE Advanced Level MARK SCHEME for the October/November 2007 question paper 9702 PHYSICS 9702/05 Paper 5 (Planning, Analysis and Evaluation), maximum raw mark 30 This mark scheme is published as an aid to teachers and candidates, to indicate the requirements of the examination. It shows the basis on which Examiners were instructed to award marks. It does not indicate the details of the discussions that took place at an Examiners’ meeting before marking began. All Examiners are instructed that alternative correct answers and unexpected approaches in candidates’ scripts must be given marks that fairly reflect the relevant knowledge and skills demonstrated. Mark schemes must be read in conjunction with the question papers and the report on the examination. • CIE will not enter into discussions or correspondence in connection with these mark schemes. CIE is publishing the mark schemes for the October/November 2007 question papers for most IGCSE, GCE Advanced Level and Advanced Subsidiary Level syllabuses and some Ordinary Level syllabuses.
Mark scheme, page 2
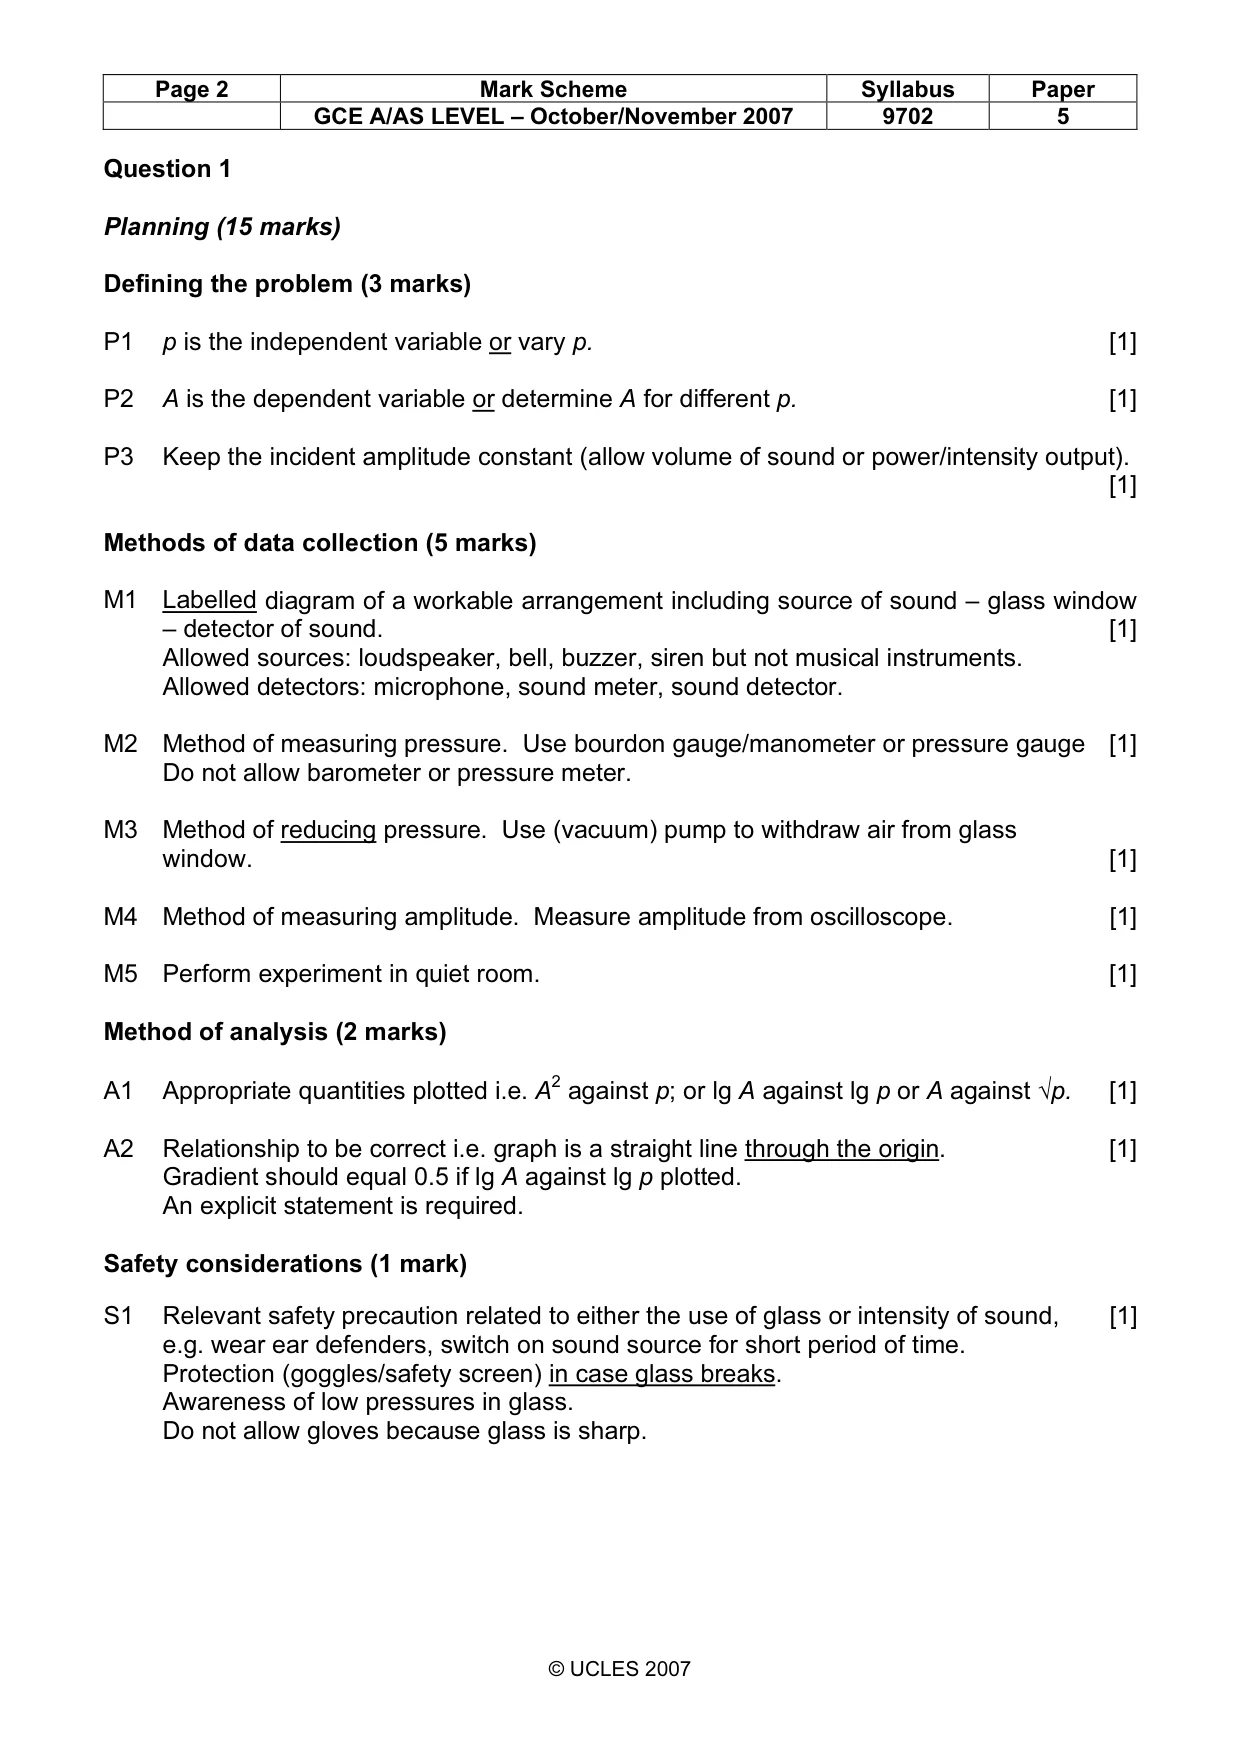
Page 2 Mark Scheme Syllabus Paper GCE A/AS LEVEL – October/November 2007 9702 5 © UCLES 2007 Question 1 Planning (15 marks) Defining the problem (3 marks) P1 p is the independent variable or vary p. [1] P2 A is the dependent variable or determine A for different p. [1] P3 Keep the incident amplitude constant (allow volume of sound or power/intensity output). [1] Methods of data collection (5 marks) M1 Labelled diagram of a workable arrangement including source of sound – glass window – detector of sound. [1] Allowed sources: loudspeaker, bell, buzzer, siren but not musical instruments. Allowed detectors: microphone, sound meter, sound detector. M2 Method of measuring pressure. Use bourdon gauge/manometer or pressure gauge [1] Do not allow barometer or pressure meter. M3 Method of reducing pressure. Use (vacuum) pump to withdraw air from glass window. [1] M4 Method of measuring amplitude. Measure amplitude from oscilloscope. [1] M5 Perform experiment in quiet room. [1] Method of analysis (2 marks) A1 Appropriate quantities plotted i.e. A2 against p; or lg A against lg p or A against √p. [1] A2 Relationship to be correct i.e. graph is a straight line through the origin. [1] Gradient should equal 0.5 if lg A against lg p plotted. An explicit statement is required. Safety considerations (1 mark) S1 Relevant safety precaution related to either the use of glass or intensity of sound, [1] e.g. wear ear defenders, switch on sound source for short period of time. Protection (goggles/safety screen) in case glass breaks. Awareness of low pressures in glass. Do not allow gloves because glass is sharp.
Mark scheme, page 3
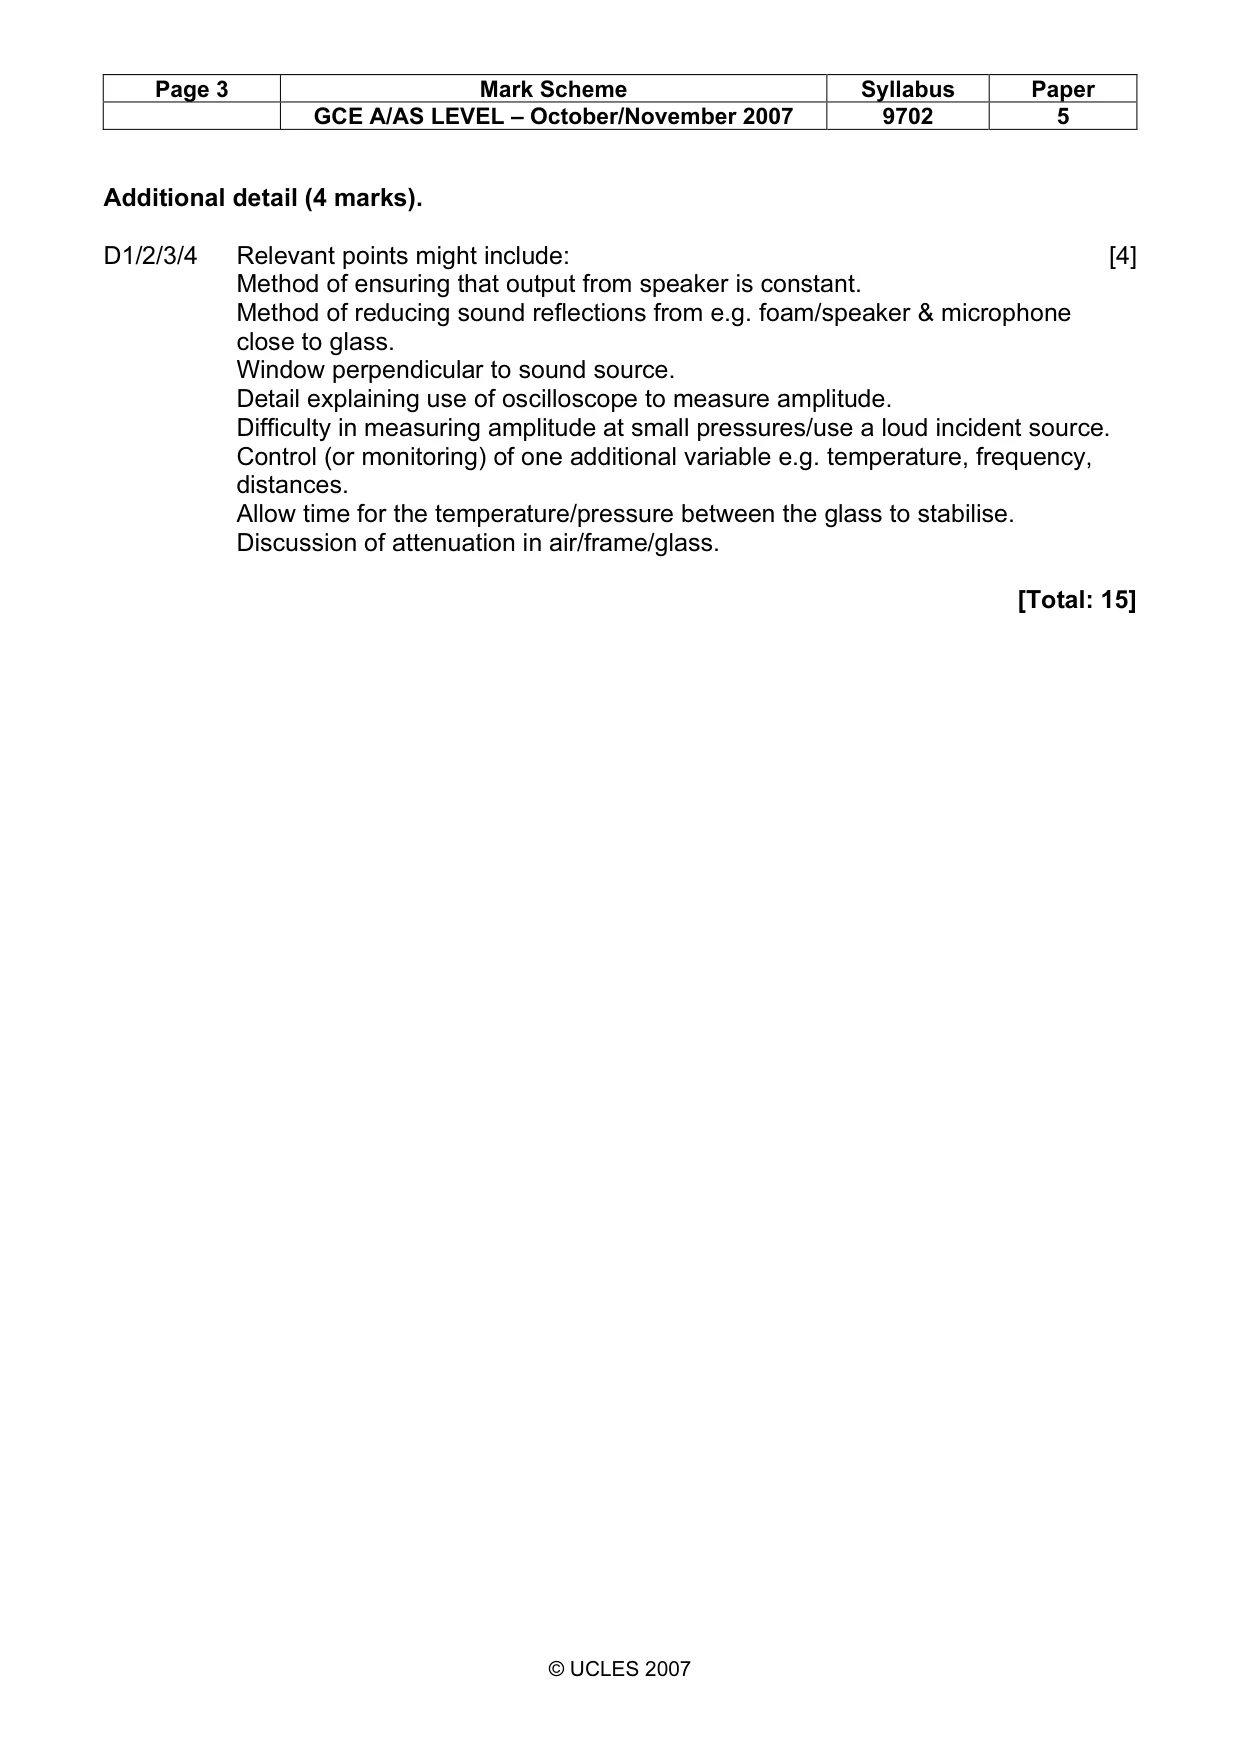
Page 3 Mark Scheme Syllabus Paper GCE A/AS LEVEL – October/November 2007 9702 5 © UCLES 2007 Additional detail (4 marks). D1/2/3/4 Relevant points might include: [4] Method of ensuring that output from speaker is constant. Method of reducing sound reflections from e.g. foam/speaker & microphone close to glass. Window perpendicular to sound source. Detail explaining use of oscilloscope to measure amplitude. Difficulty in measuring amplitude at small pressures/use a loud incident source. Control (or monitoring) of one additional variable e.g. temperature, frequency, distances. Allow time for the temperature/pressure between the glass to stabilise. Discussion of attenuation in air/frame/glass. [Total: 15]
Mark scheme, page 4
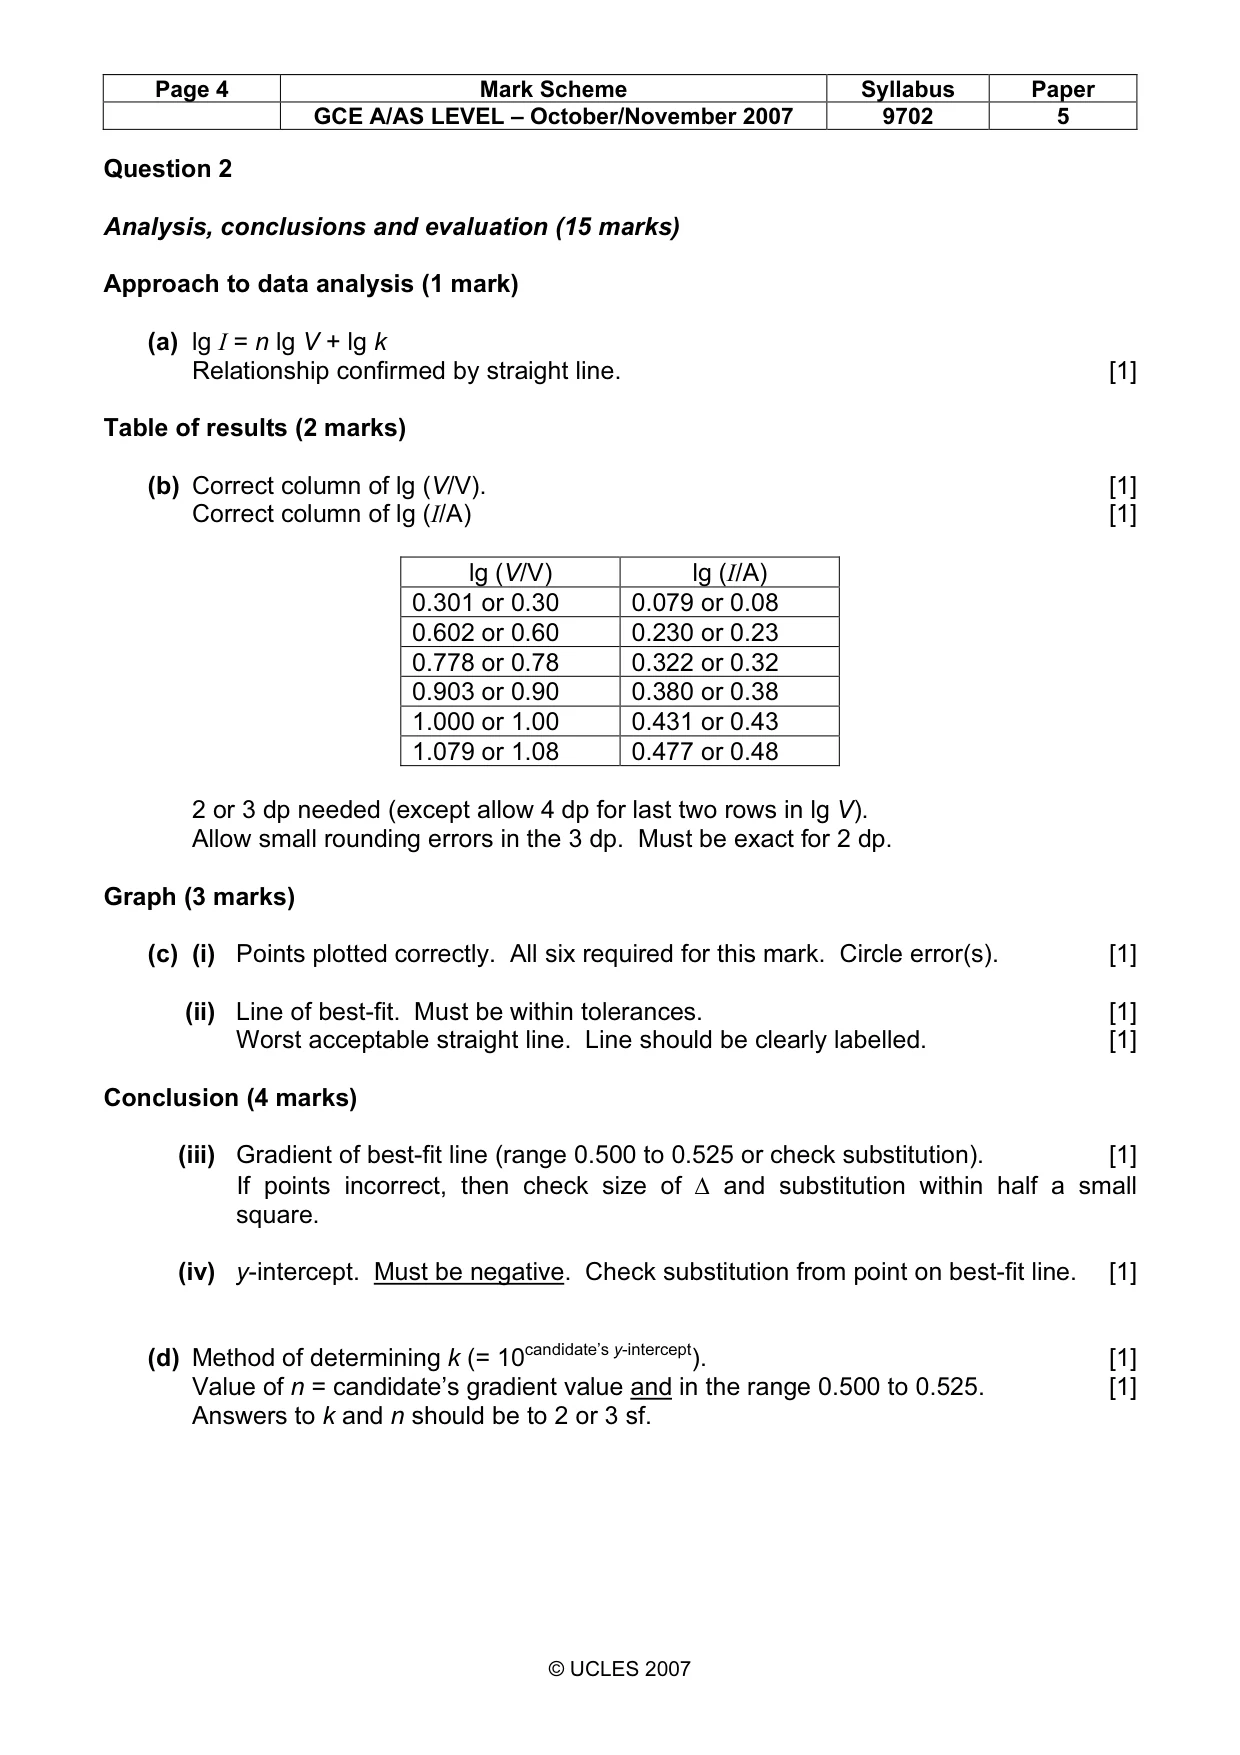
Page 4 Mark Scheme Syllabus Paper GCE A/AS LEVEL – October/November 2007 9702 5 © UCLES 2007 Question 2 Analysis, conclusions and evaluation (15 marks) Approach to data analysis (1 mark) (a) lg I = n lg V + lg k Relationship confirmed by straight line. [1] Table of results (2 marks) (b) Correct column of lg (V/V). [1] Correct column of lg (I/A) [1] lg (V/V) lg (I/A) 0.301 or 0.30 0.079 or 0.08 0.602 or 0.60 0.230 or 0.23 0.778 or 0.78 0.322 or 0.32 0.903 or 0.90 0.380 or 0.38 1.000 or 1.00 0.431 or 0.43 1.079 or 1.08 0.477 or 0.48 2 or 3 dp needed (except allow 4 dp for last two rows in lg V). Allow small rounding errors in the 3 dp. Must be exact for 2 dp. Graph (3 marks) (c) (i) Points plotted correctly. All six required for this mark. Circle error(s). [1] (ii) Line of best-fit. Must be within tolerances. [1] Worst acceptable straight line. Line should be clearly labelled. [1] Conclusion (4 marks) (iii) Gradient of best-fit line (range 0.500 to 0.525 or check substitution). [1] If points incorrect, then check size of ∆ and substitution within half a small square. (iv) y-intercept. Must be negative. Check substitution from point on best-fit line. [1] (d) Method of determining k (= 10candidate’s y-intercept). [1] Value of n = candidate’s gradient value and in the range 0.500 to 0.525. [1] Answers to k and n should be to 2 or 3 sf.
Mark scheme, page 5
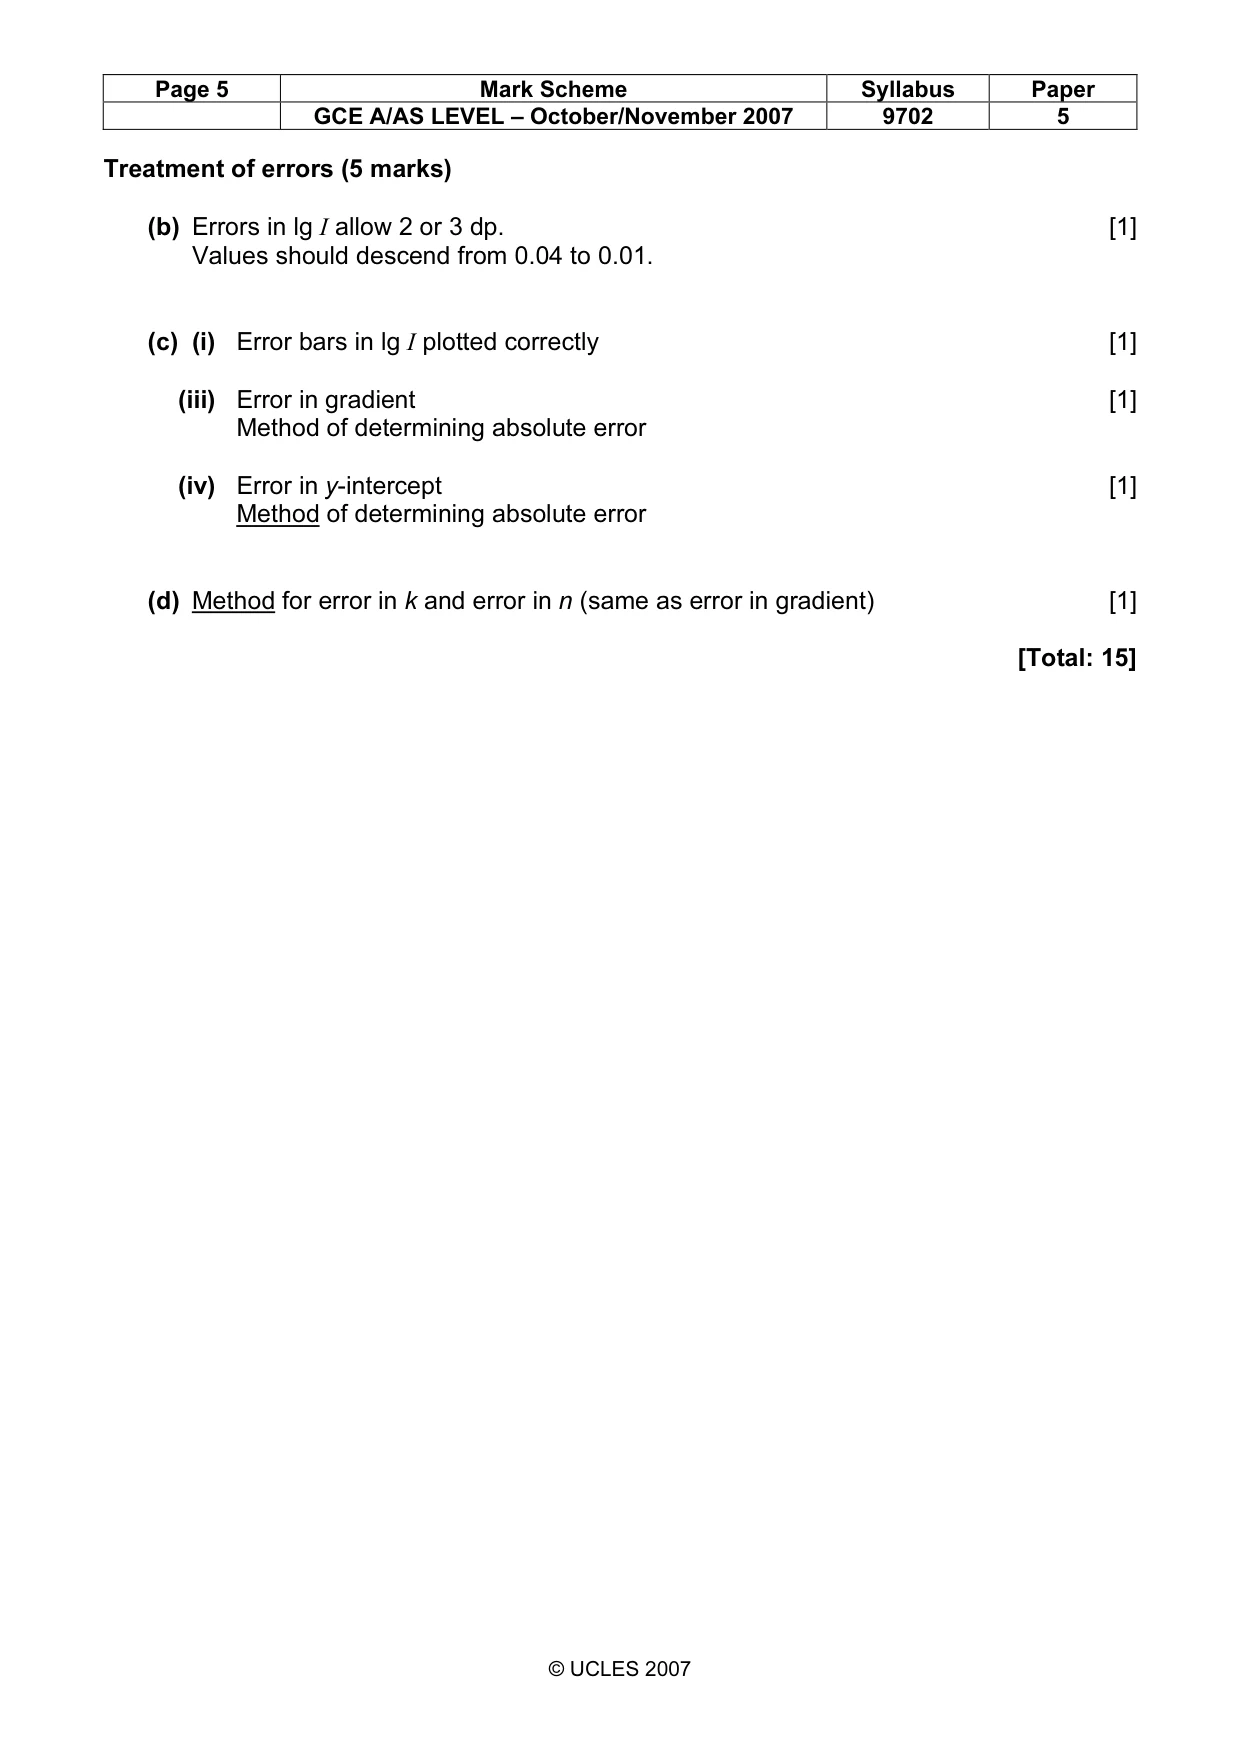
Page 5 Mark Scheme Syllabus Paper GCE A/AS LEVEL – October/November 2007 9702 5 © UCLES 2007 Treatment of errors (5 marks) (b) Errors in lg I allow 2 or 3 dp. [1] Values should descend from 0.04 to 0.01. (c) (i) Error bars in lg I plotted correctly [1] (iii) Error in gradient [1] Method of determining absolute error (iv) Error in y-intercept [1] Method of determining absolute error (d) Method for error in k and error in n (same as error in gradient) [1] [Total: 15]
What you needed in this session
Cambridge’s own grade thresholds for 2007 Oct/Nov, Paper 5 · Variant 1. A higher threshold means an easier paper — the bar moves with how the cohort did.