Questions as text
Q1 · The times, in milliseconds, taken by a computer to perform a certain task were recorded… 9231/41 May/June 2020
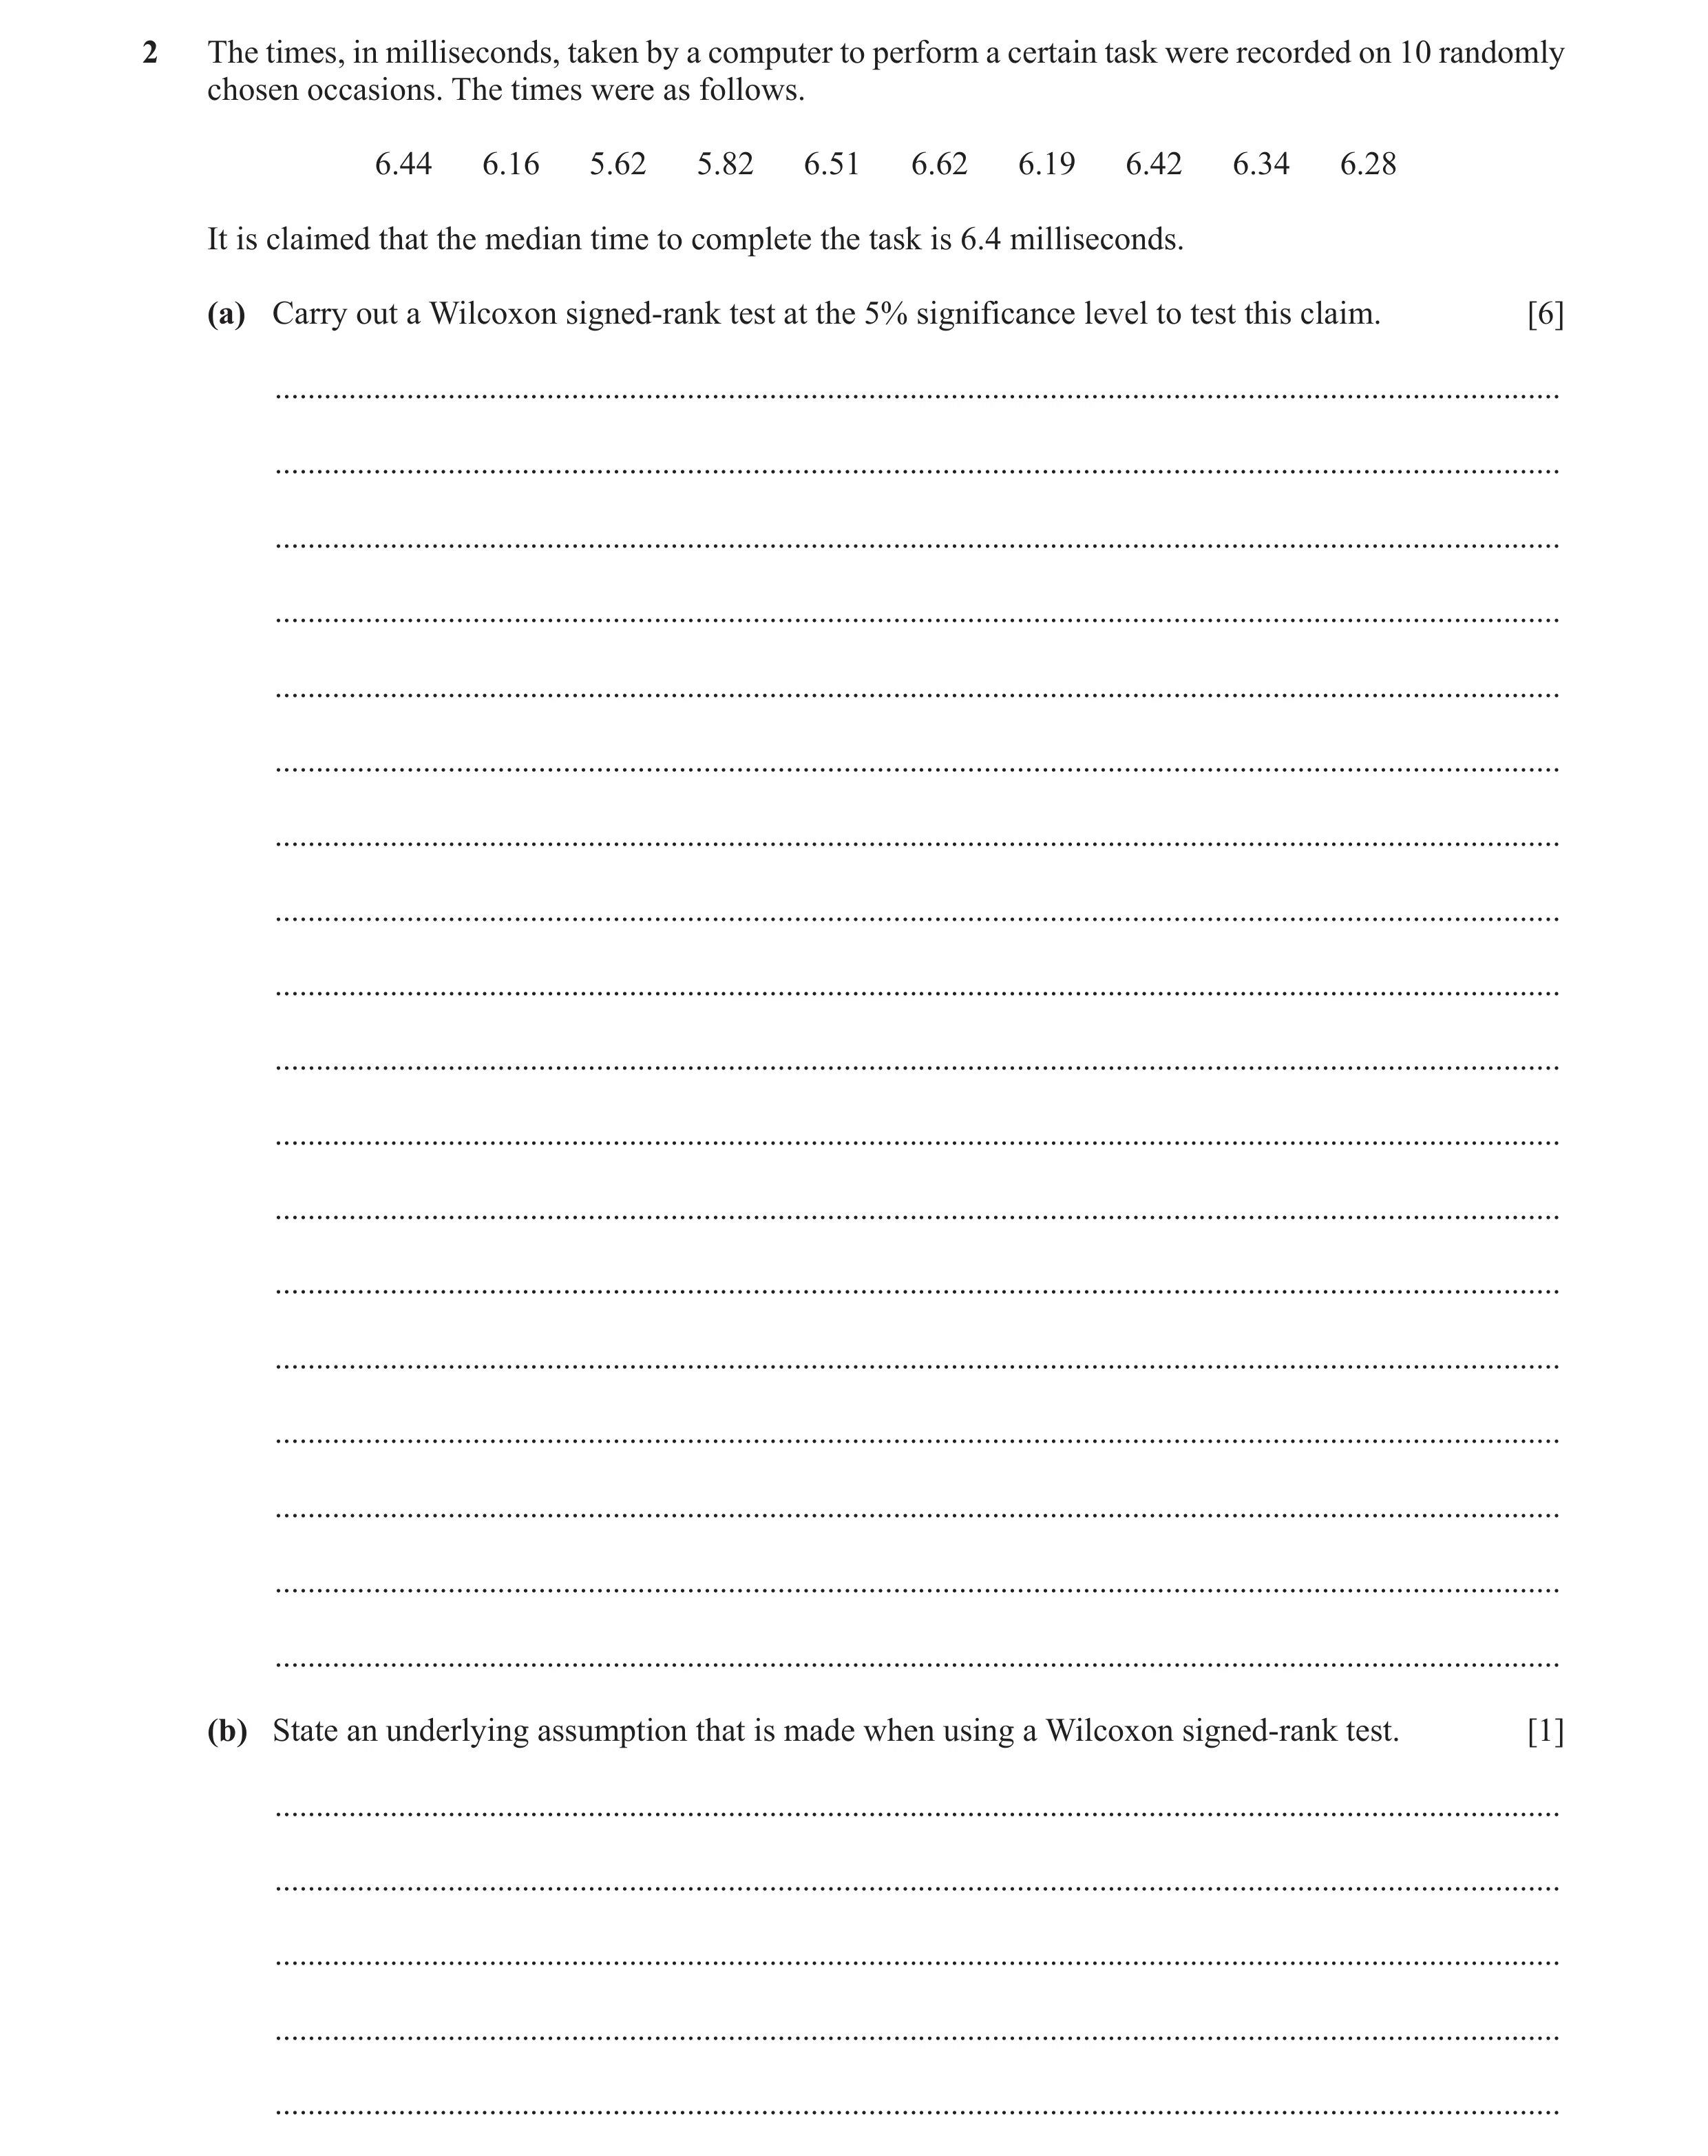
2 The times, in milliseconds, taken by a computer to perform a certain task were recorded on 10 randomly chosen occasions. The times were as follows. 6.44 6.16 5.62 5.82 6.51 6.62 6.19 6.42 6.34 6.28 It is claimed that the median time to complete the task is 6.4 milliseconds. (a) Carry out a Wilcoxon signed-rank test at the 5% significance level to test this claim. [6] … … … … … … … … … … … … … … … … … … (b) State an underlying assumption that is made when using a Wilcoxon signed-rank test. [1] … … … … …
7 marks
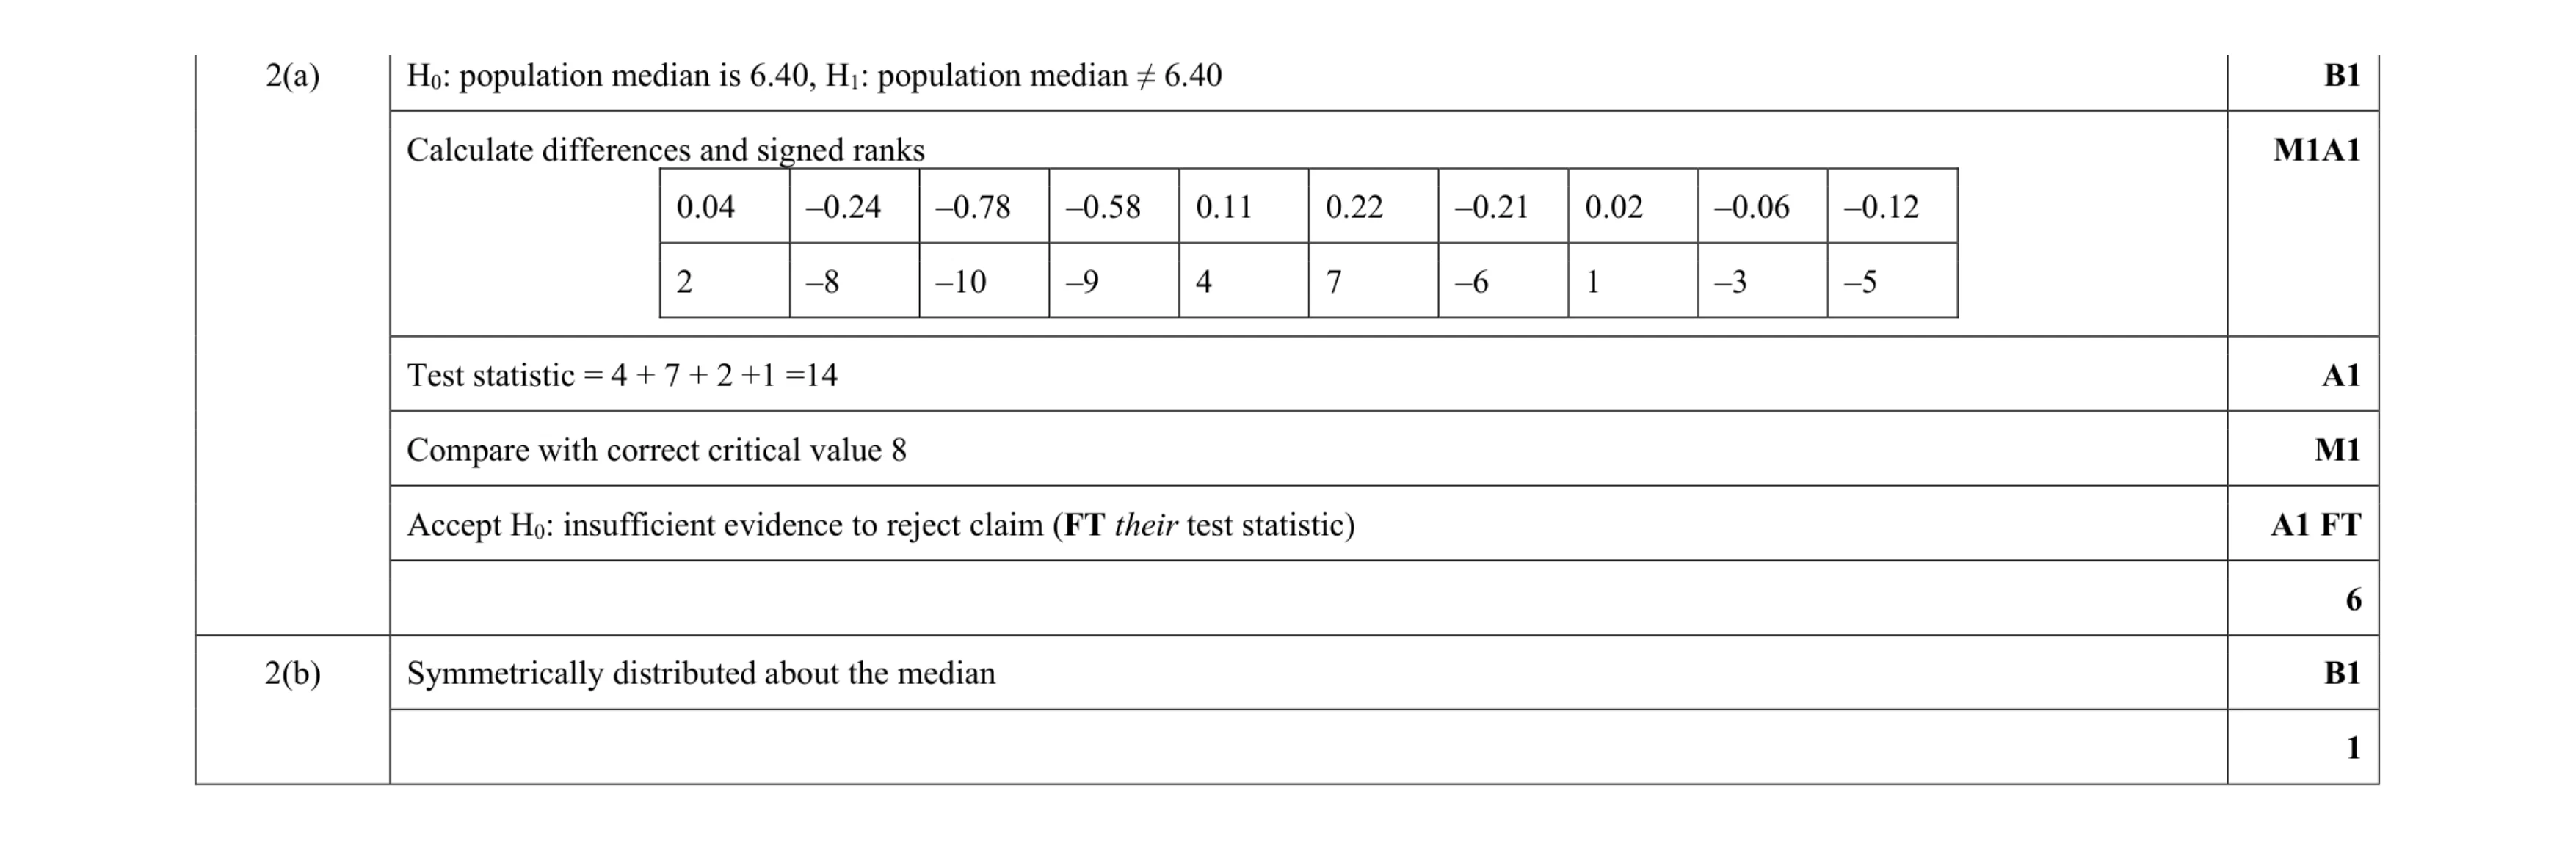
Mark scheme: 2(a) H0: population median is 6.40, H1: population median ≠ 6.40 B1 Calculate differences and signed ranks 0.04 –0.24 –0.78 –0.58 0.11 0.22 –0.21 0.02 –0.06 –0.12 2 –8 –10 –9 4 7 –6 1 –3 –5 M1A1 Test statistic = 4 + 7 + 2 +1 =14 A1 Compare with correct critical value 8 M1 Accept H0: insufficient evidence to reject claim (FT their test statistic) A1 FT 6 2(b) Symmetrically distributed about the median B1 1
This question in 9231/41 May/June 2020
Q2 · The times, in milliseconds, taken by a computer to perform a certain task were recorded… 9231/42 May/June 2020
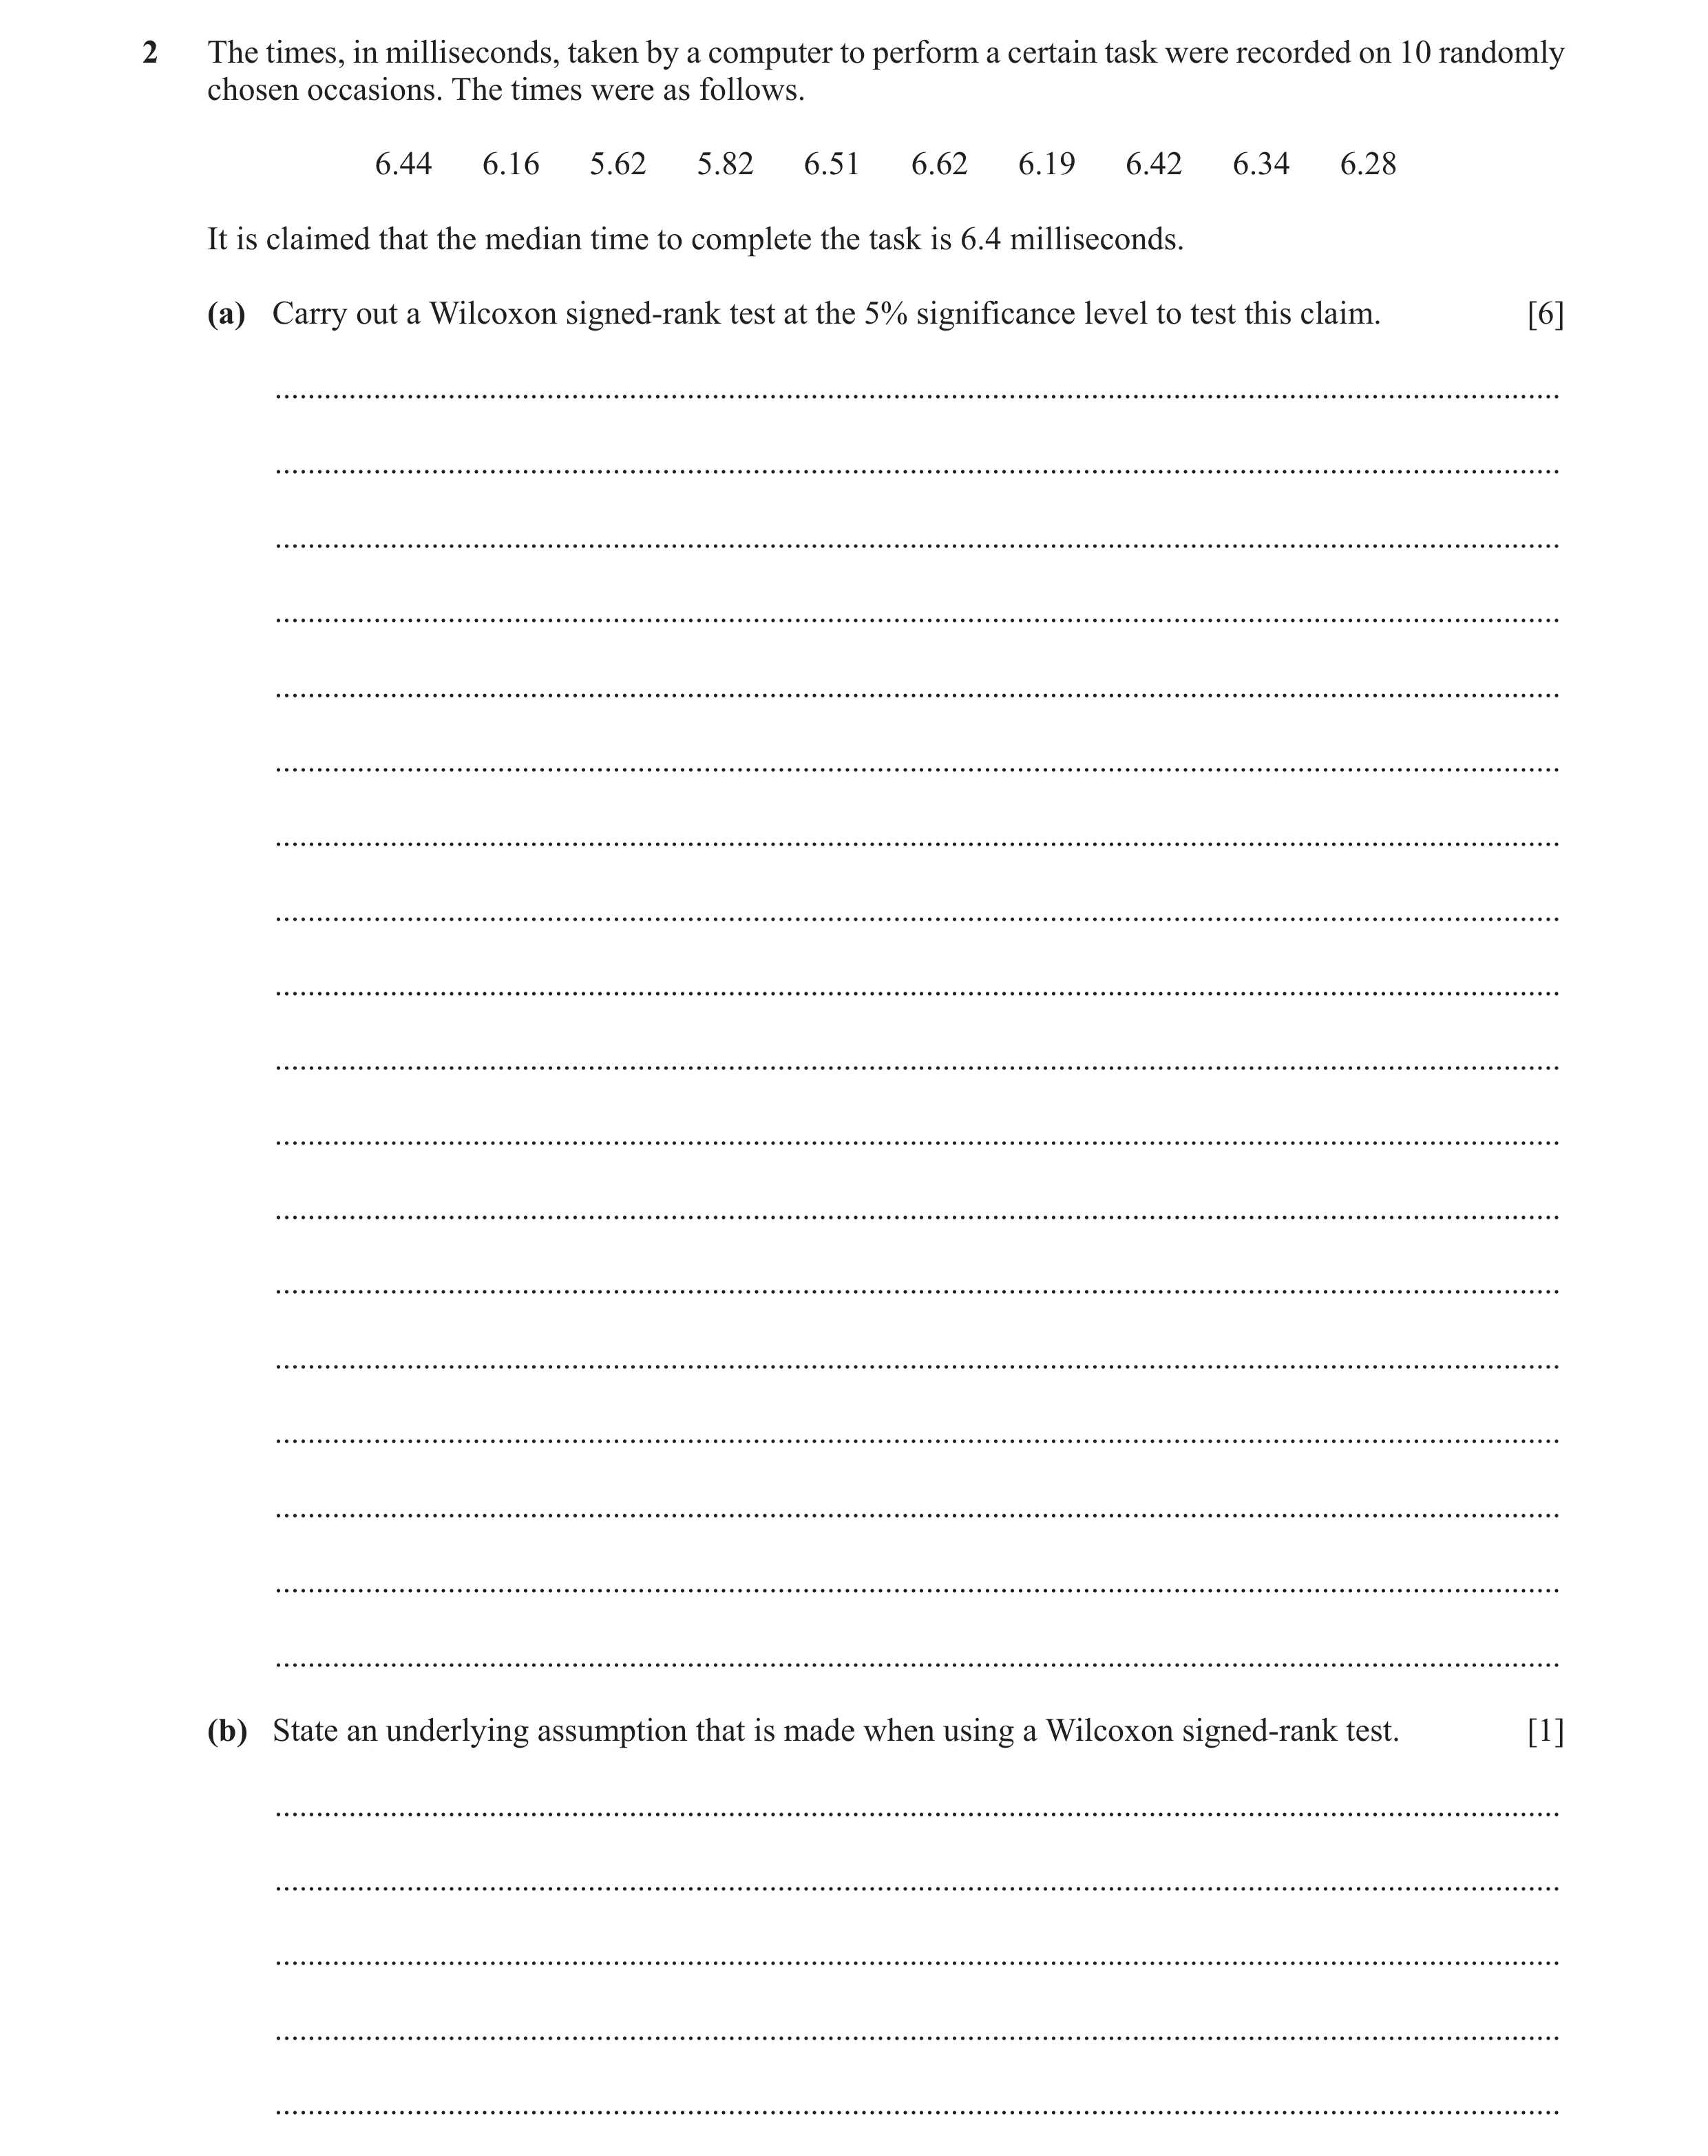
2 The times, in milliseconds, taken by a computer to perform a certain task were recorded on 10 randomly chosen occasions. The times were as follows. 6.44 6.16 5.62 5.82 6.51 6.62 6.19 6.42 6.34 6.28 It is claimed that the median time to complete the task is 6.4 milliseconds. (a) Carry out a Wilcoxon signed-rank test at the 5% significance level to test this claim. [6] … … … … … … … … … … … … … … … … … … (b) State an underlying assumption that is made when using a Wilcoxon signed-rank test. [1] … … … … …
7 marks
Mark scheme: 2(a) H0: population median is 6.40, H1: population median ≠ 6.40 B1 Calculate differences and signed ranks 0.04 –0.24 –0.78 –0.58 0.11 0.22 –0.21 0.02 –0.06 –0.12 2 –8 –10 –9 4 7 –6 1 –3 –5 M1A1 Test statistic = 4 + 7 + 2 +1 =14 A1 Compare with correct critical value 8 M1 Accept H0: insufficient evidence to reject claim (FT their test statistic) A1 FT 6 2(b) Symmetrically distributed about the median B1 1
This question in 9231/42 May/June 2020
Q3 · A biologist is studying the effect of nutrients on the heights to which plants grow 9231/43 May/June 2020
6 A biologist is studying the effect of nutrients on the heights to which plants grow. A random sample of 24 similar young plants is divided into two equal groups A and B. The plants in group A are fed with nutrients and water and the plants in group B are given only water. After four weeks, the height, in cm, of each plant is measured and the results are as follows. Group A 12.3 11.8 12.1 13.2 11.1 10.6 13.8 12.0 12.2 12.4 13.5 13.9 Group B 11.7 10.8 10.9 11.3 11.2 12.6 11.0 10.5 11.9 12.5 10.7 11.6 The biologist decides to carry out a test at the 5% significance level to test whether the nutrients have resulted in an increase in growth. (a) She carries out a Wilcoxon rank-sum test. Give a reason why this is an appropriate choice of test. [1] … … … … … … (b) Carry out the Wilcoxon rank-sum test for these results. [10] … … … … … … … … … … … … … … … … … … … … … … … … … … … … … … … … … … … … … … … … … … Additional Page If you use the following lined page to complete the answer(s) to any question(s), the question number(s) must be clearly shown. … … … … … … … … … … … … … … … … … … … … … …
11 marks
Mark scheme: 6(a) Difference of location test for populations not known to be normal B1 1 Question Answer Marks 6(b) 10.6 2 10.5 1 11.1 7 10.7 3 11.8 12 10.8 4 12.0 14 10.9 5 12.1 15 11.0 6 12.2 16 11.2 8 12.3 17 11.3 9 12.4 18 11.6 10 13.2 21 11.7 11 13.5 22 11.9 13 13.8 23 12.5 19 13.9 24 12.6 20 M1 Total ranks: 109 or 191 A1 H0: = x y m m H1: > x y m m B1 Use normal approximation with attempts at mean and variance M1 mean = 150, variance = 300 A1 Question Answer Marks 6(b) 109.5 150 2.338 300 − = − M1A1 Probability 0.0097 A1 This is less than 0.05, so reject H0 M1 There is evidence of an effect on growth A1 10
This question in 9231/43 May/June 2020
Q4 · Metal rods produced by a certain factory are claimed to have a median breaking strength… 9231/41 Oct/Nov 2020
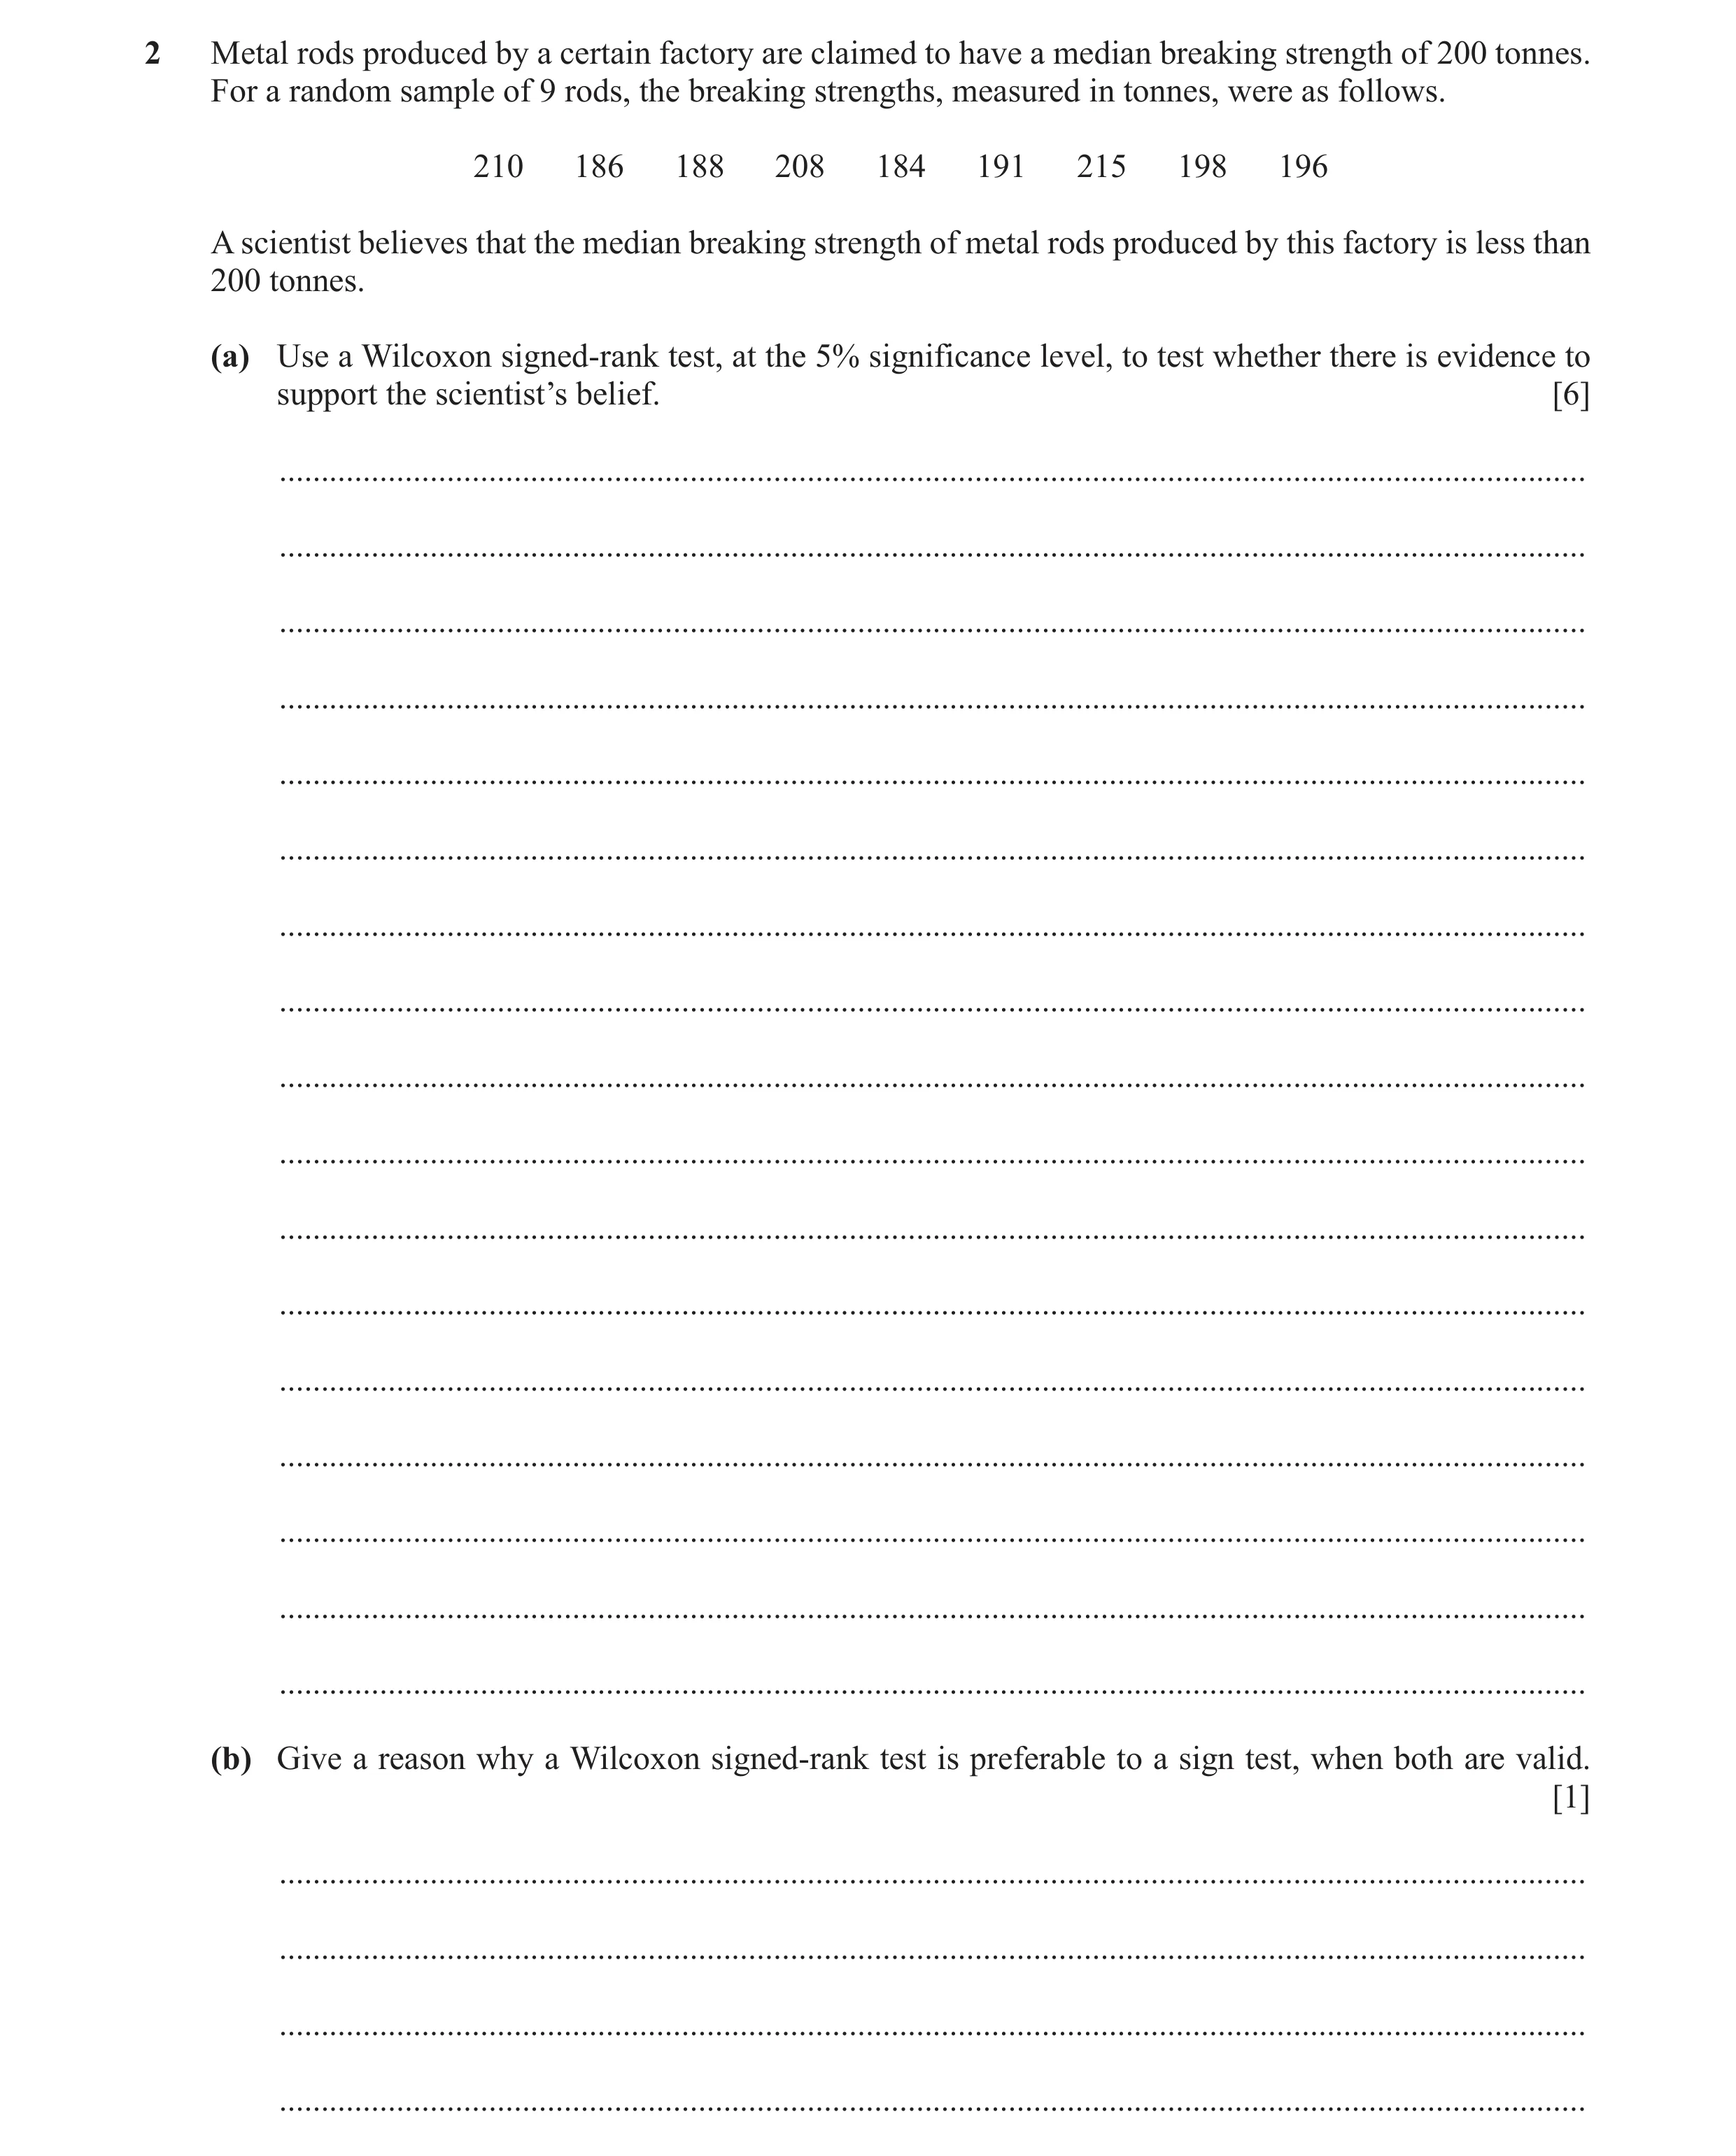
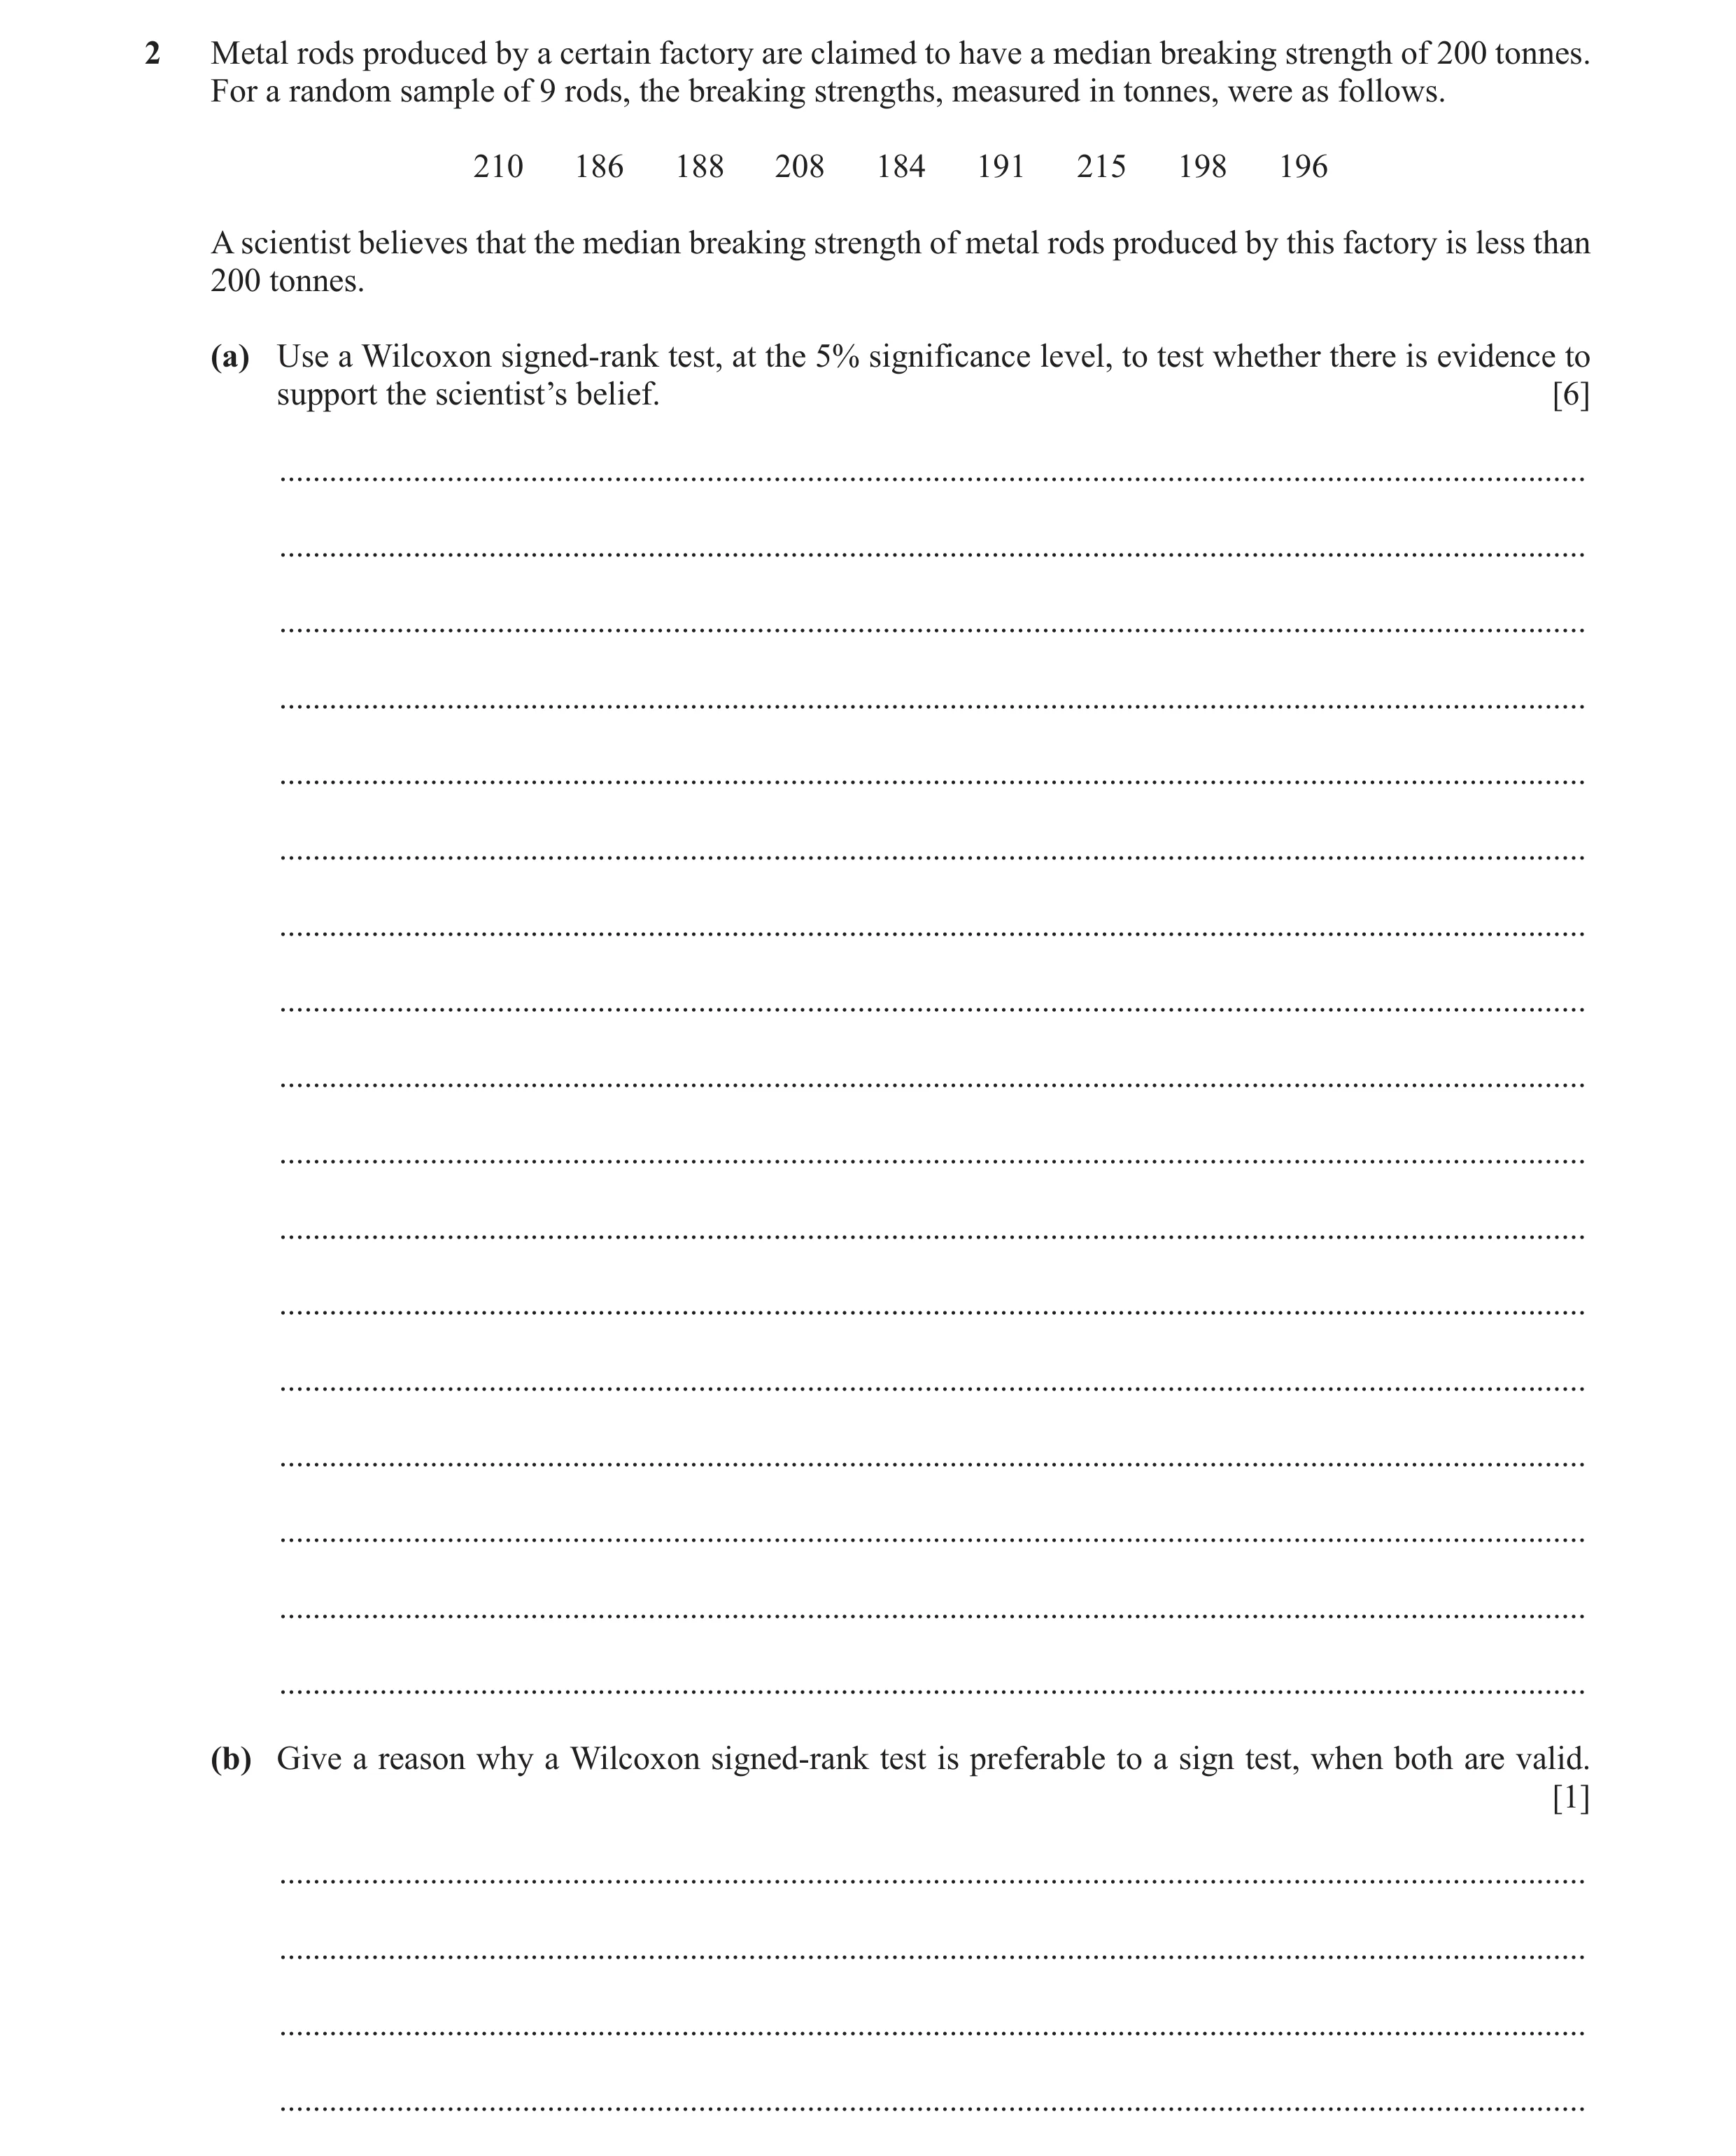
2 Metal rods produced by a certain factory are claimed to have a median breaking strength of 200 tonnes. For a random sample of 9 rods, the breaking strengths, measured in tonnes, were as follows. 210 186 188 208 184 191 215 198 196 A scientist believes that the median breaking strength of metal rods produced by this factory is less than 200 tonnes. (a) Use a Wilcoxon signed-rank test, at the 5% significance level, to test whether there is evidence to support the scientist’s belief. [6] … … … … … … … … … … … … … … … … … (b) Give a reason why a Wilcoxon signed-rank test is preferable to a sign test, when both are valid. [1] … … … …
7 marks
Mark scheme: 2(a) H0: m = 200 H1: m < 200 B1 Allow ‘median’ in words, allow m not defined 10 14 12 8 16 9 1 5 2 4 − − − − − − M1 Signed differences (at most 3 errors) Ranks: 5 7 6 3 9 4 8 1 2 − − − − − − A1 Award for correct rank order, ignore signs Sum ranks T = 16 A1 CWO Critical value 8 and compare ‘16’ > 8 M1 Compare their T with 8 Accept H0 Insufficient evidence to support scientist’s belief A1 In context, all correct, except possibly hypotheses. Level of uncertainty in language used. No contradictions 6 2(b) Magnitude of differences from median are taken into account B1 Must mention magnitude and differences 1
This question in 9231/41 Oct/Nov 2020
Q5 · A large school is holding an essay competition and each student has submitted an essay 9231/42 Oct/Nov 2020
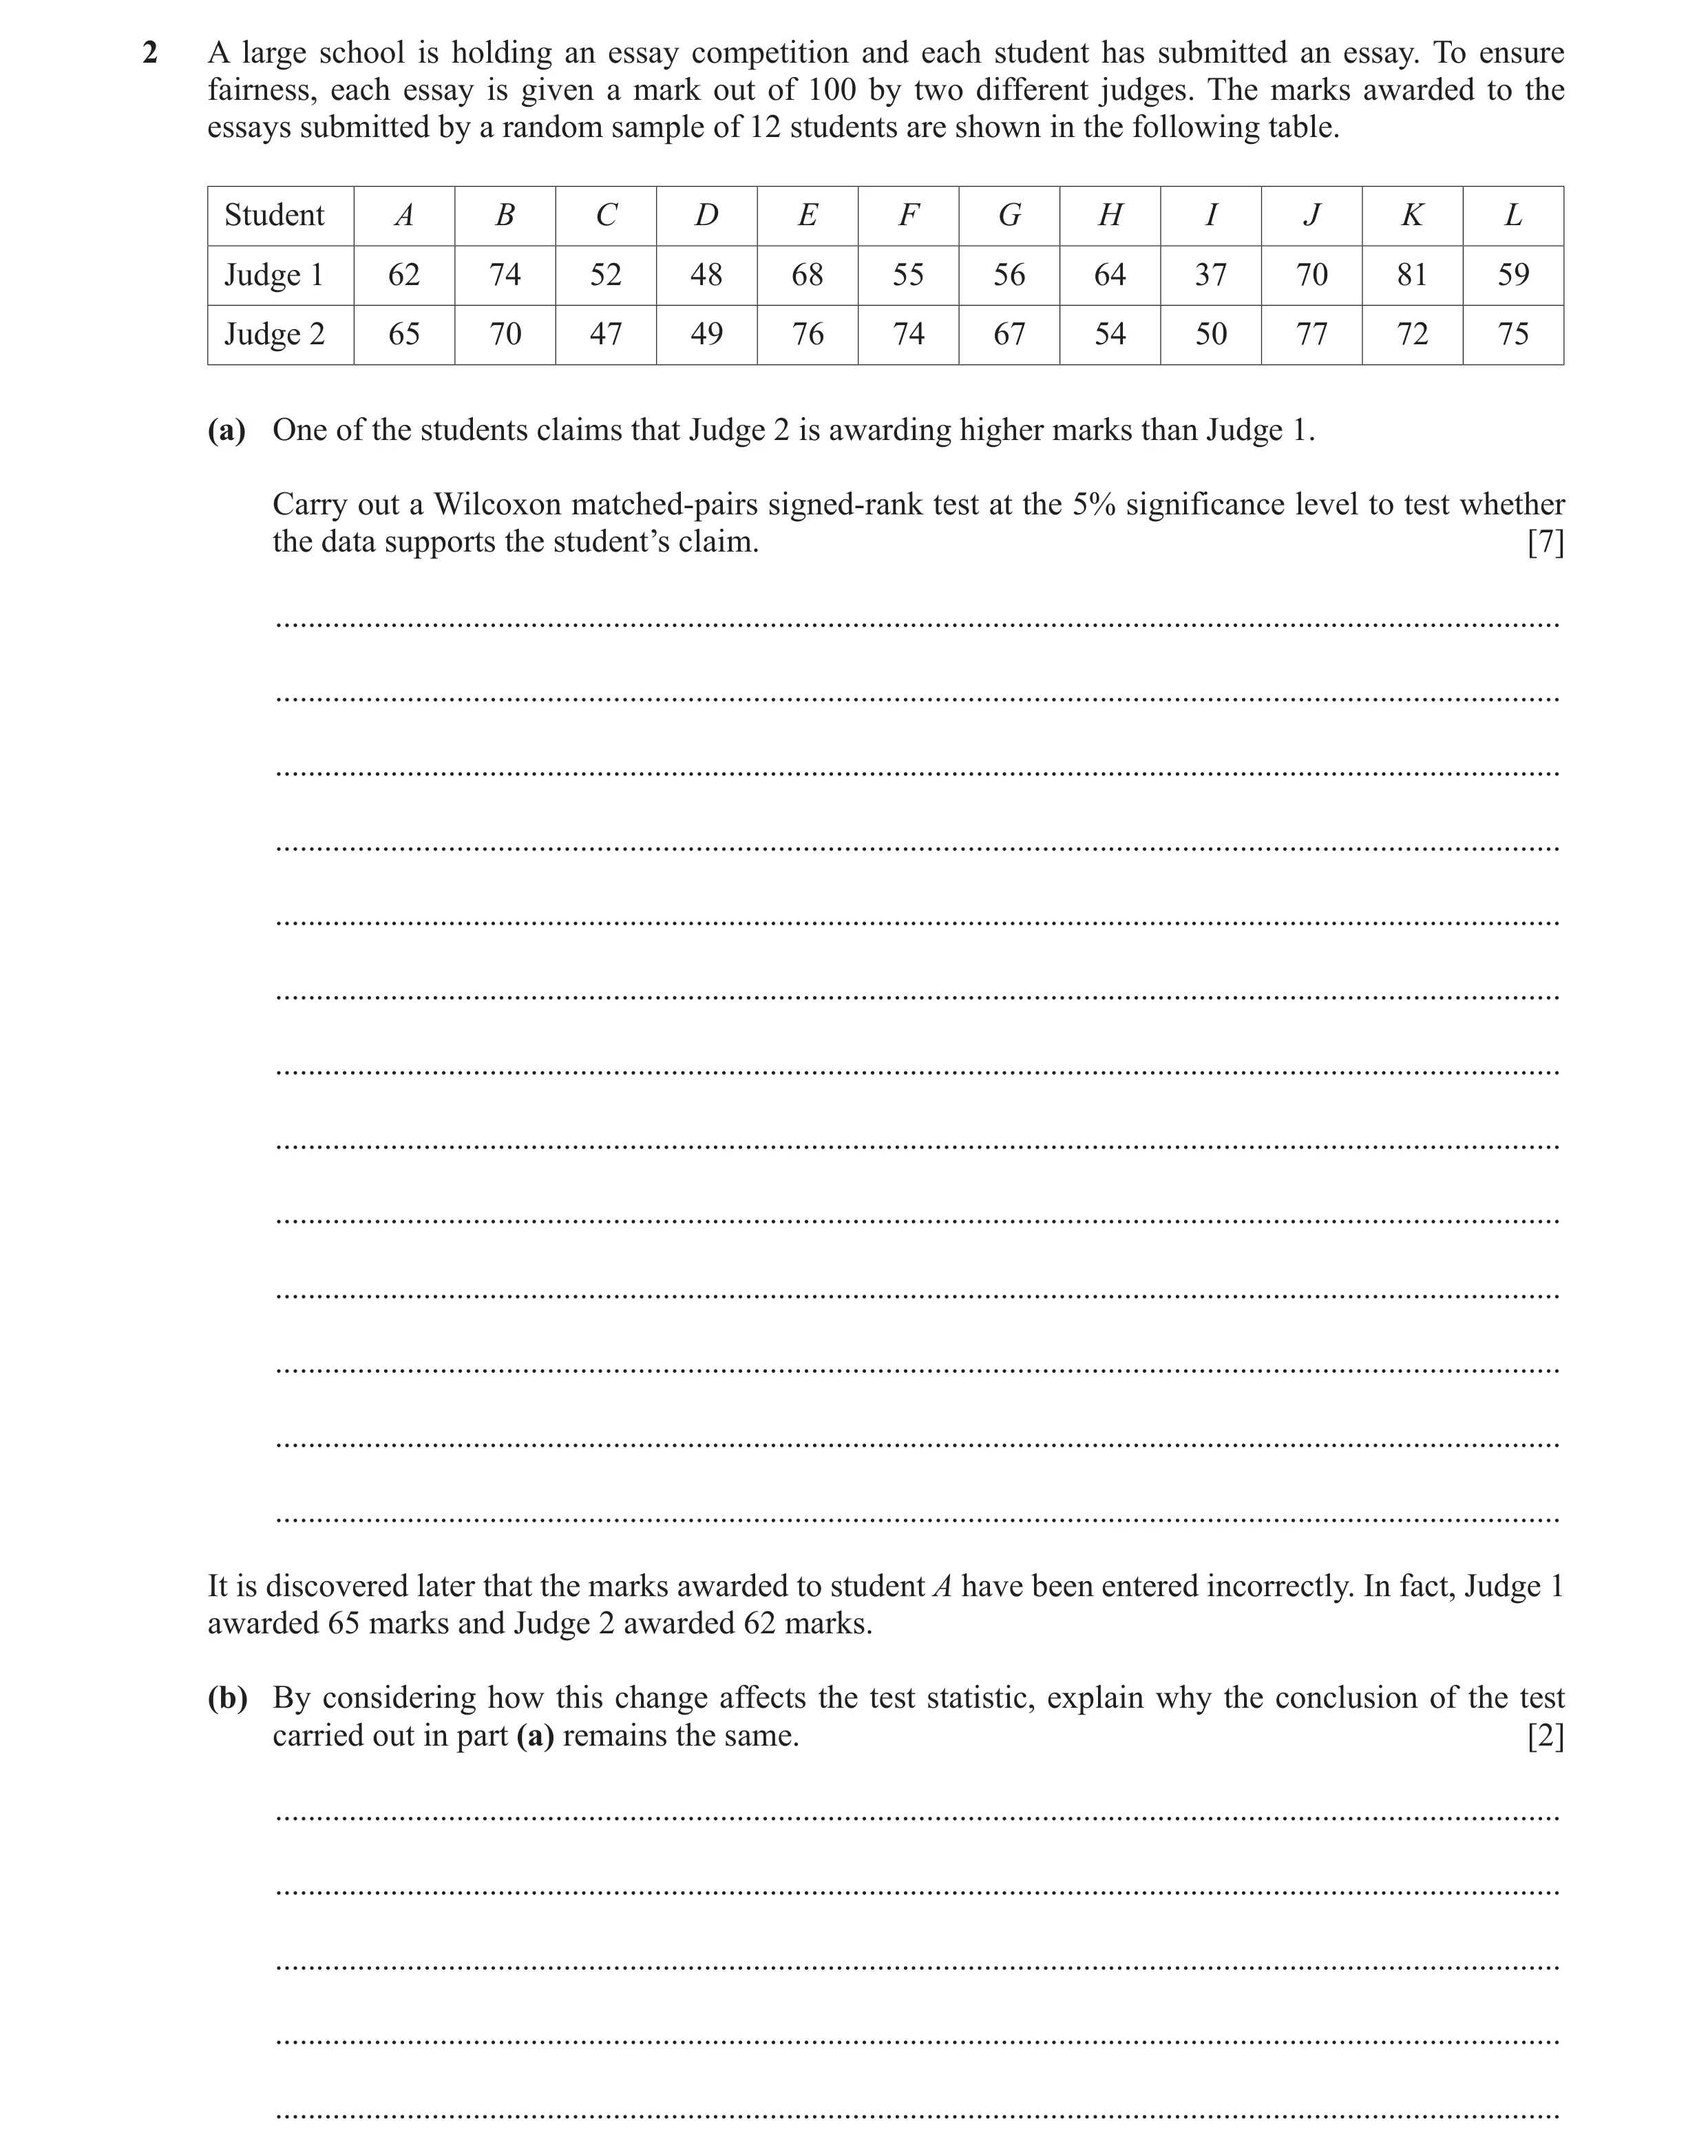
2 A large school is holding an essay competition and each student has submitted an essay. To ensure fairness, each essay is given a mark out of 100 by two different judges. The marks awarded to the essays submitted by a random sample of 12 students are shown in the following table. Student A B C D E F G H I J K L Judge 1 62 74 52 48 68 55 56 64 37 70 81 59 Judge 2 65 70 47 49 76 74 67 54 50 77 72 75 (a) One of the students claims that Judge 2 is awarding higher marks than Judge 1. Carry out a Wilcoxon matched-pairs signed-rank test at the 5% significance level to test whether the data supports the student’s claim. [7] … … … … … … … … … … … … … It is discovered later that the marks awarded to student A have been entered incorrectly. In fact, Judge 1 awarded 65 marks and Judge 2 awarded 62 marks. (b) By considering how this change affects the test statistic, explain why the conclusion of the test carried out in part (a) remains the same. [2] … … … … …
9 marks
Mark scheme: 2(a) H0: difference in (population) medians = 0 H1: difference in (population) medians < 0 (or >0) B1 B1 Correct hypotheses (median or m) All notation identified e.g. m = population median if used Differences: 3 4 5 1 8 19 11 1 0 13 7 9 16 − − − − − − − − M1 At most 3 errors Ranks: 2 3 4 1 6 12 9 8 10 5 7 11 − − − − − − − − A1 Award for correct rank order, ignore signs Sum T = 3 + 4 + 8 + 7 = 22 A1 cwo Compare with critical value 17: ‘22’ > 17 M1 Compare their T with 17 Accept H0 Data does not support student’s claim A1 In context, all correct, except possibly second B1 Level of uncertainty in language used. No contradictions. 7 2(b) Rank for A becomes + 2, M1 T = 24 Changing sign of difference can only reduce evidence in favour of the claim. A1 still > 17 and test result unchanged 2
This question in 9231/42 Oct/Nov 2020
Q6 · Metal rods produced by a certain factory are claimed to have a median breaking strength… 9231/43 Oct/Nov 2020
2 Metal rods produced by a certain factory are claimed to have a median breaking strength of 200 tonnes. For a random sample of 9 rods, the breaking strengths, measured in tonnes, were as follows. 210 186 188 208 184 191 215 198 196 A scientist believes that the median breaking strength of metal rods produced by this factory is less than 200 tonnes. (a) Use a Wilcoxon signed-rank test, at the 5% significance level, to test whether there is evidence to support the scientist’s belief. [6] … … … … … … … … … … … … … … … … … (b) Give a reason why a Wilcoxon signed-rank test is preferable to a sign test, when both are valid. [1] … … … …
7 marks
Mark scheme: 2(a) H0: m = 200 H1: m < 200 B1 Allow ‘median’ in words, allow m not defined 10 14 12 8 16 9 1 5 2 4 − − − − − − M1 Signed differences (at most 3 errors) Ranks: 5 7 6 3 9 4 8 1 2 − − − − − − A1 Award for correct rank order, ignore signs Sum ranks T = 16 A1 CWO Critical value 8 and compare ‘16’ > 8 M1 Compare their T with 8 Accept H0 Insufficient evidence to support scientist’s belief A1 In context, all correct, except possibly hypotheses. Level of uncertainty in language used. No contradictions 6 2(b) Magnitude of differences from median are taken into account B1 Must mention magnitude and differences 1
This question in 9231/43 Oct/Nov 2020
Q7 · Georgio has designed two new uniforms X and Y for the employees of an airline company 9231/41 May/June 2021
5 Georgio has designed two new uniforms X and Y for the employees of an airline company. A random sample of 11 employees are each asked to assess each of the two uniforms for practicality and appearance, and to give a total score out of 100. The scores are given in the table. Employee A B C D E F G H I J K Uniform X 82 74 42 59 60 73 94 98 62 36 50 Uniform Y 78 75 63 56 67 82 99 90 72 48 61 (a) Give a reason why a Wilcoxon signed-rank test may be more appropriate than a t-test for investigating whether there is any evidence of a preference for one of the uniforms. [1] … … … … … … … … (b) Carry out a Wilcoxon matched-pairs signed-rank test at the 10% significance level. [7] … … … … … … … … … … … … … … … … … … … … … … … … … … … … … … … … … … … … … … … … …
8 marks
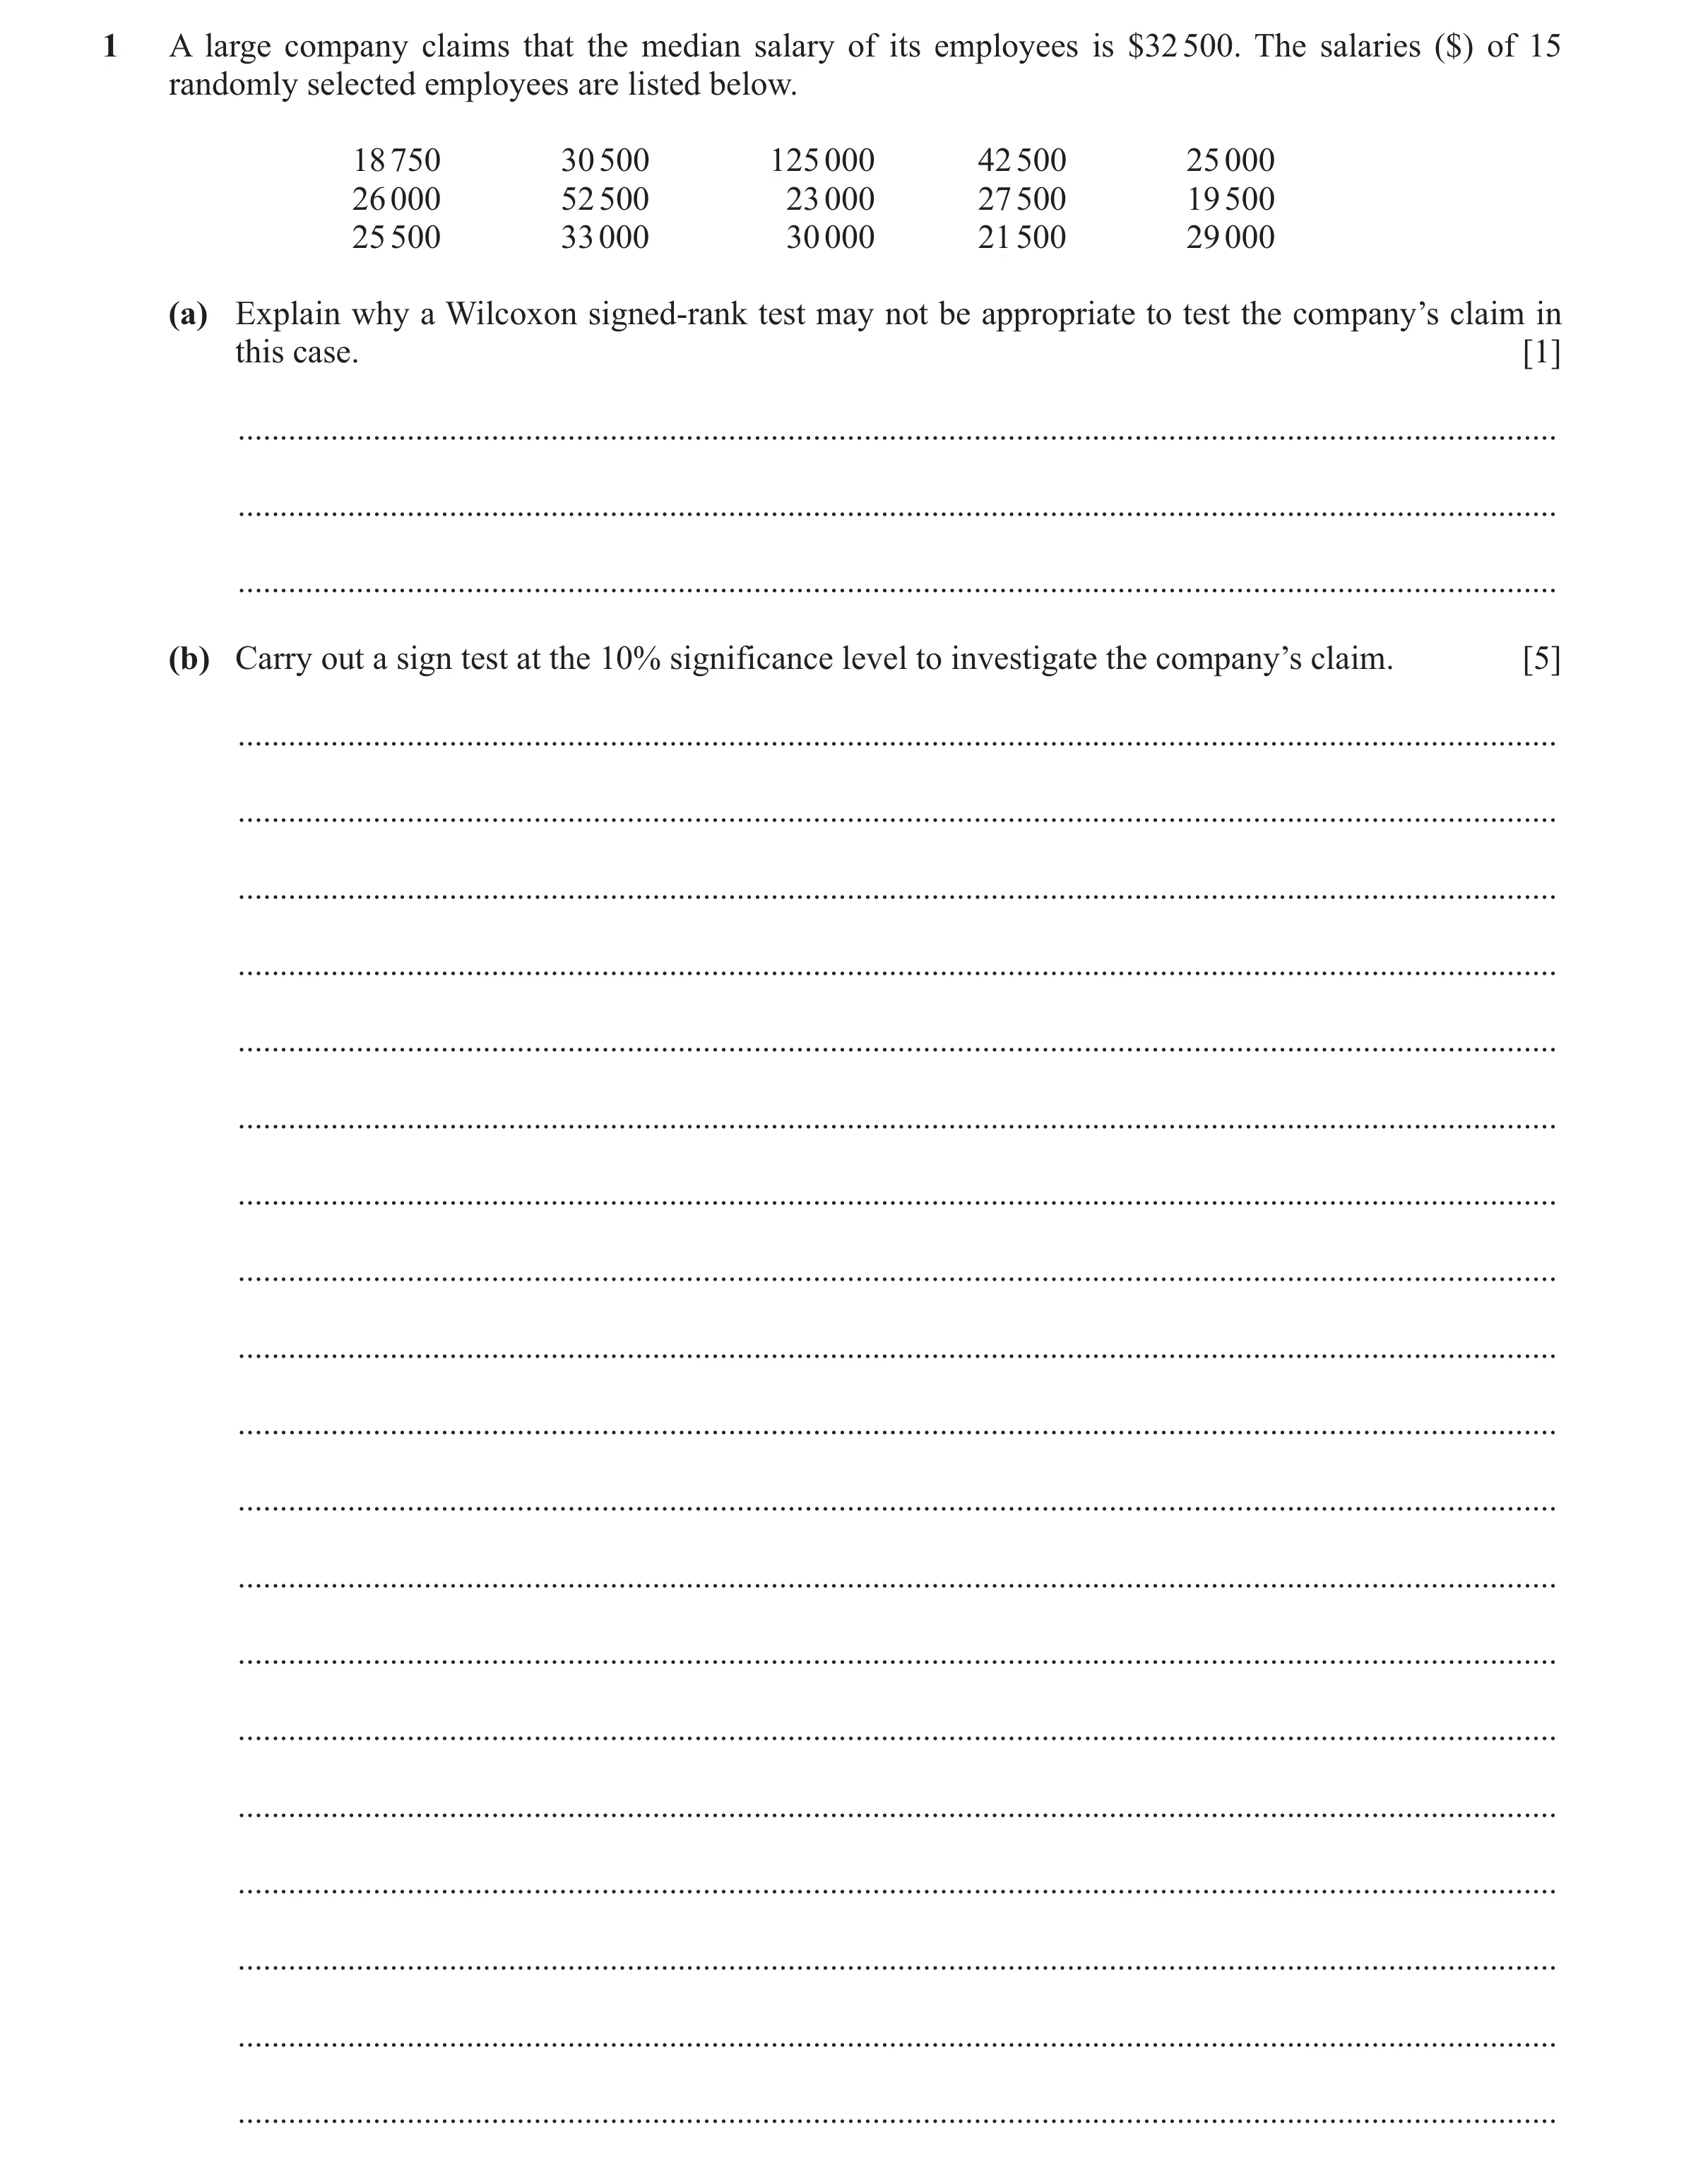
Mark scheme: 5(a) Underlying distribution or population of differences is unknown Underlying distributions or population of scores for both X and Y are unknown B1 Not known to be normal. Condone ‘scores for X and Y cannot be assumed to be normally distributed’. 1 5(b) 0 :difference of population medians 0 H = B1 Correct hypotheses, allow m but not μ or mean. 1 :difference of population median 0 H ≠ B1 ‘population’ included. Diff: 4 −1 −21 3 −7 −9 −5 8 −10 −12 −11 M1 Differences, allow one error. Rank: 3 −1 −11 2 −5 −7 −4 6 −8 −10 −9 M1 Signed ranks, allow one sign error. [ ] 55, 11 Q P =− = A1 P = 11 Critical tabular value = 13 ‘11’ < 13 so reject 0 H M1 Comparison with 13 and correct ft conclusion. Sufficient evidence of a preference for one of the uniforms OE A1 Correct conclusion, in context, following correct work, except possibly second B1. Level of uncertainty in language is used. 7
This question in 9231/41 May/June 2021
Q8 · Georgio has designed two new uniforms X and Y for the employees of an airline company 9231/42 May/June 2021
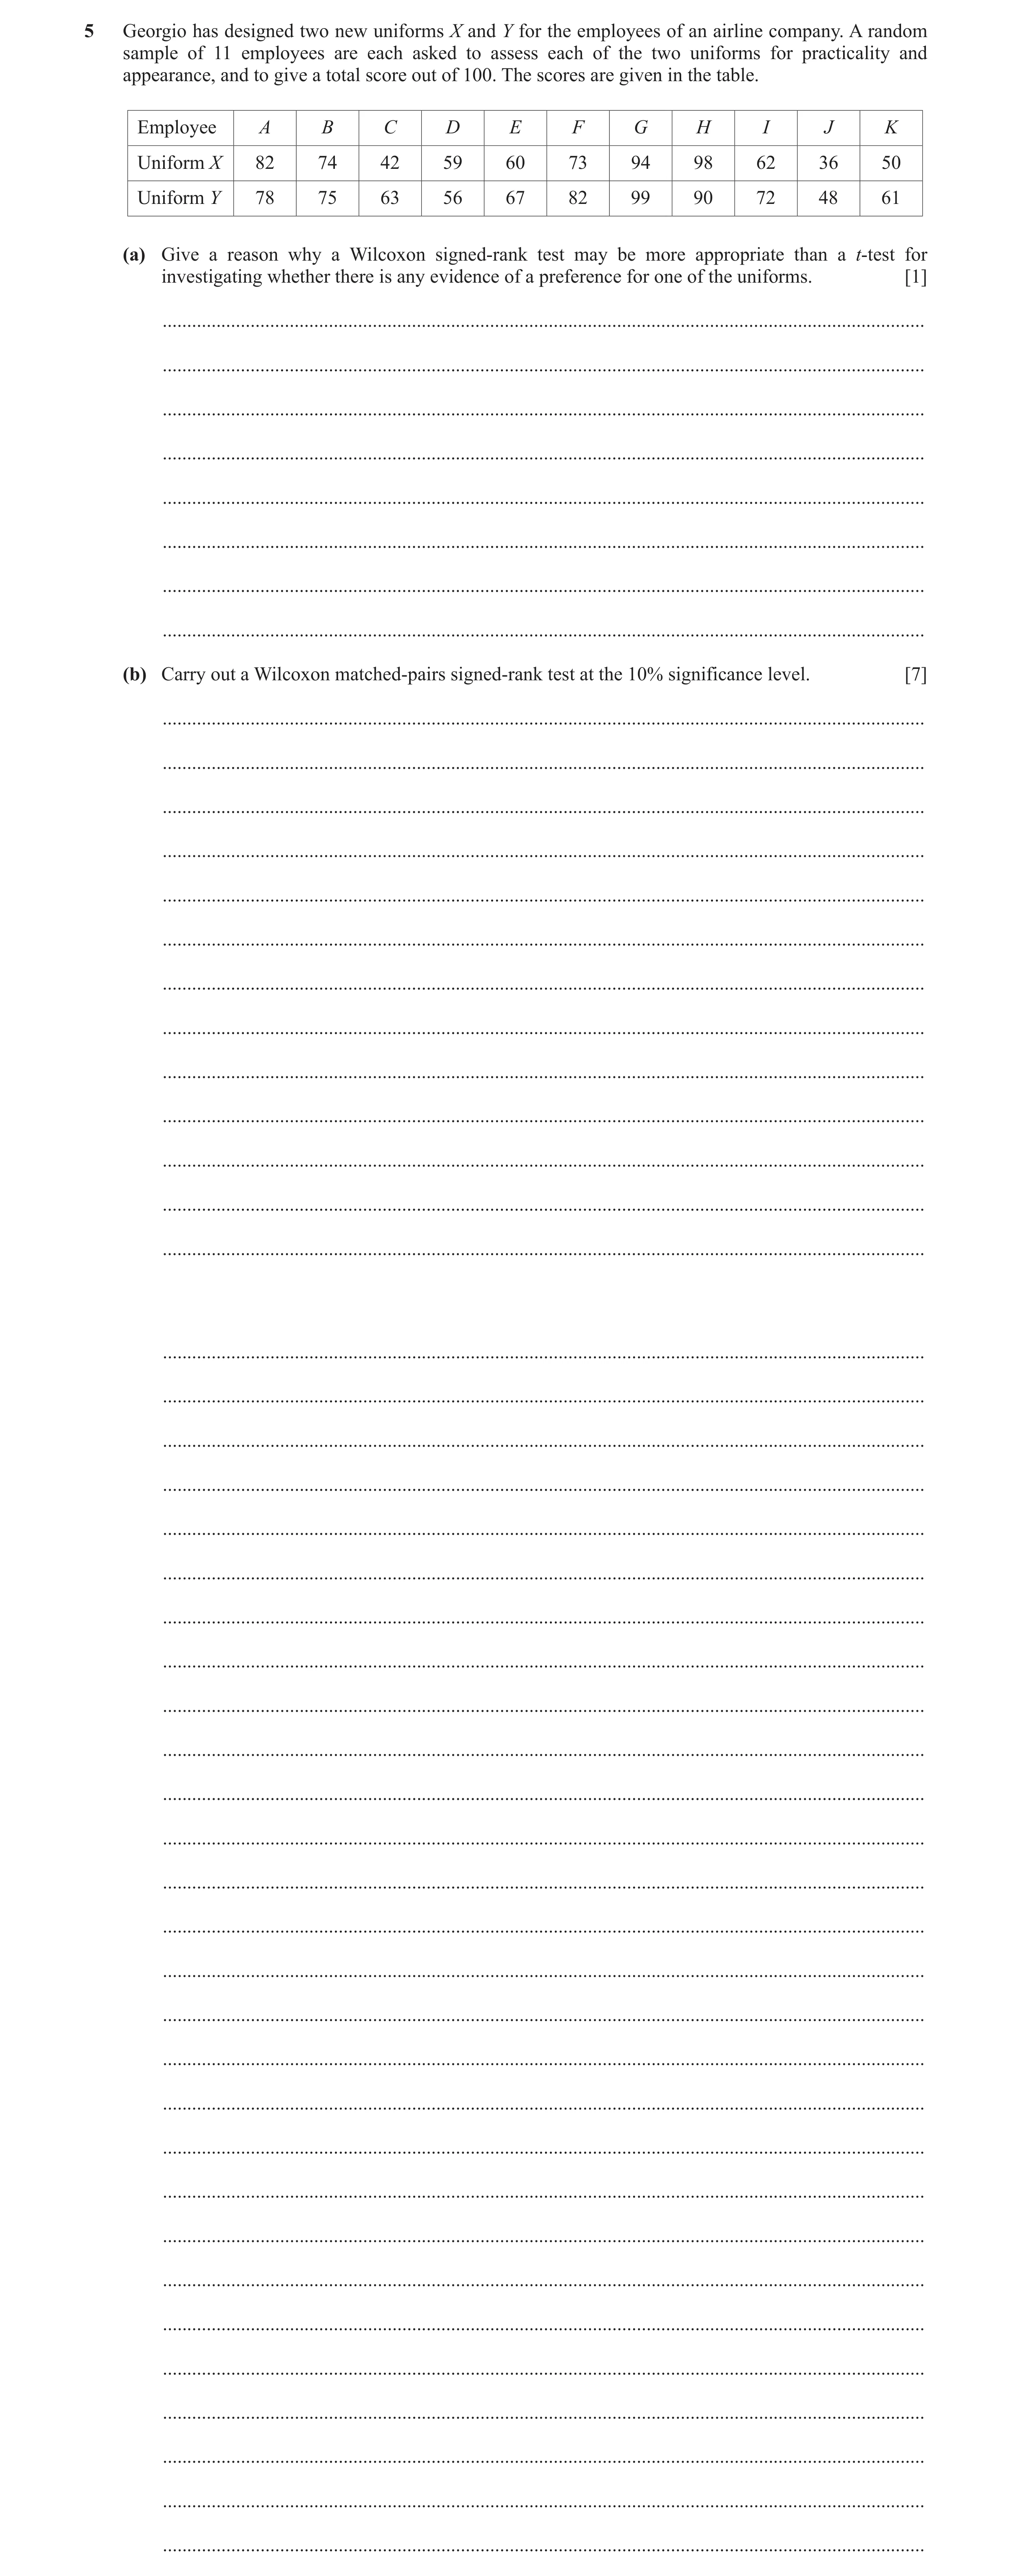
5 Georgio has designed two new uniforms X and Y for the employees of an airline company. A random sample of 11 employees are each asked to assess each of the two uniforms for practicality and appearance, and to give a total score out of 100. The scores are given in the table. Employee A B C D E F G H I J K Uniform X 82 74 42 59 60 73 94 98 62 36 50 Uniform Y 78 75 63 56 67 82 99 90 72 48 61 (a) Give a reason why a Wilcoxon signed-rank test may be more appropriate than a t-test for investigating whether there is any evidence of a preference for one of the uniforms. [1] … … … … … … … … (b) Carry out a Wilcoxon matched-pairs signed-rank test at the 10% significance level. [7] … … … … … … … … … … … … … … … … … … … … … … … … … … … … … … … … … … … … … … … … …
8 marks
Mark scheme: 5(a) Underlying distribution or population of differences is unknown Underlying distributions or population of scores for both X and Y are unknown B1 Not known to be normal. Condone ‘scores for X and Y cannot be assumed to be normally distributed’. 1 5(b) 0 :difference of population medians 0 H = B1 Correct hypotheses, allow m but not μ or mean. 1 :difference of population median 0 H ≠ B1 ‘population’ included. Diff: 4 −1 −21 3 −7 −9 −5 8 −10 −12 −11 M1 Differences, allow one error. Rank: 3 −1 −11 2 −5 −7 −4 6 −8 −10 −9 M1 Signed ranks, allow one sign error. [ ] 55, 11 Q P =− = A1 P = 11 Critical tabular value = 13 ‘11’ < 13 so reject 0 H M1 Comparison with 13 and correct ft conclusion. Sufficient evidence of a preference for one of the uniforms OE A1 Correct conclusion, in context, following correct work, except possibly second B1. Level of uncertainty in language is used. 7
This question in 9231/42 May/June 2021
Q9 · A company is developing a new flavour of chocolate by varying the quantities of the… 9231/43 May/June 2021
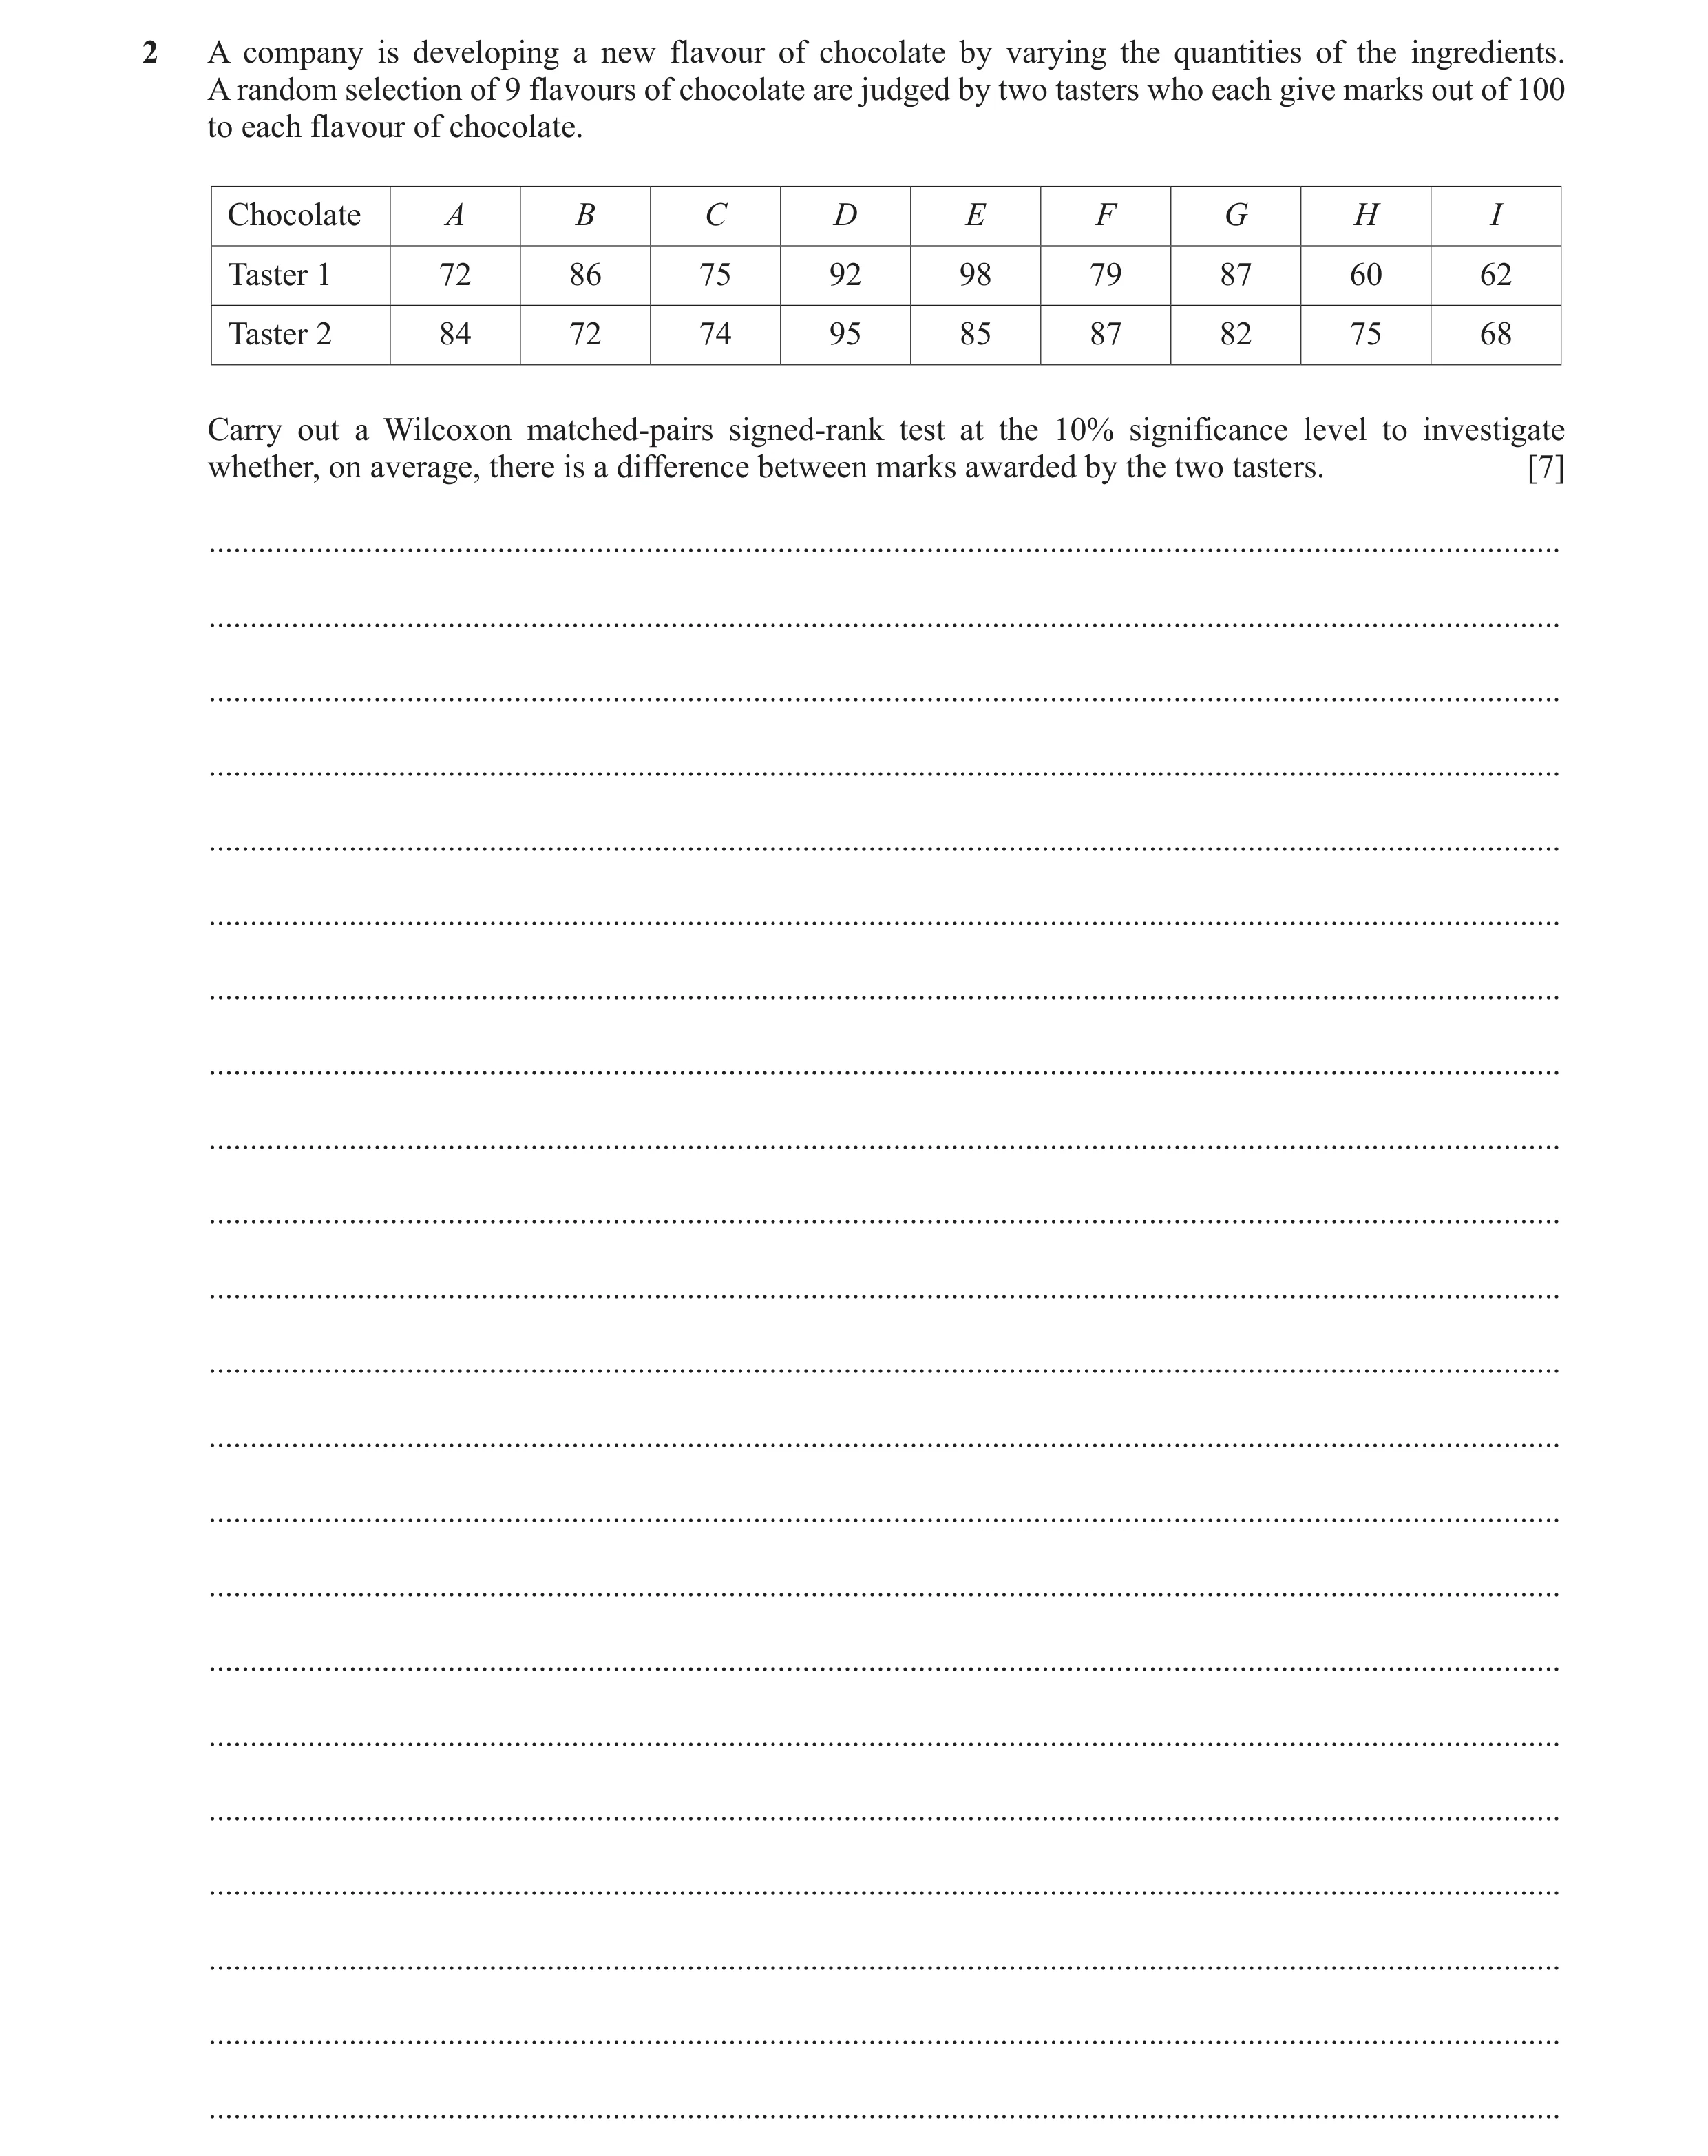
2 A company is developing a new flavour of chocolate by varying the quantities of the ingredients. A random selection of 9 flavours of chocolate are judged by two tasters who each give marks out of 100 to each flavour of chocolate. Chocolate A B C D E F G H I Taster 1 72 86 75 92 98 79 87 60 62 Taster 2 84 72 74 95 85 87 82 75 68 Carry out a Wilcoxon matched-pairs signed-rank test at the 10% significance level to investigate whether, on average, there is a difference between marks awarded by the two tasters. [7] … … … … … … … … … … … … … … … … … … … … … …
7 marks
Mark scheme: 2 H0: difference in population medians = 0 (ma = mb) B1 Correct hypotheses, allow md . Do not allow μ or mean. H1: difference in population medians ≠ 0 (ma ≠ mb) B1 ‘population’ included. Diff: 12 −14 −1 3 −13 8 −5 15 6 M1 Allow one error. Rank: 6 −8 −1 2 −7 5 −3 9 4 M1 Allow one error. Smaller sum 19 A1 (Other sum is 26.) Critical tabular value = 8 ‘19’ > 8 so accept H0 M1 Comparison with 8 and correct FT conclusion. There is insufficient evidence that marks differ A1 Correct conclusion, in context, following correct work, except possibly the hypotheses. Level of uncertainty in language is used. 7
This question in 9231/43 May/June 2021
Q10 · The blood cholesterol levels, measured in suitable units, of a random sample of 11 women… 9231/41 Oct/Nov 2021
6 The blood cholesterol levels, measured in suitable units, of a random sample of 11 women and a random sample of 12 men are shown below. Women 51 55 242 167 152 256 75 137 98 238 235 Men 311 262 170 302 175 320 220 260 72 351 86 333 Carry out a Wilcoxon rank-sum test, at the 5% significance level, to test whether, on average, there is a difference in cholesterol levels between women and men. [9] … … … … … … … … … … … … … … … … … … … … … … … … … … … … … … … … … … … … … … … … … … … … … … … … … … … … Additional Page If you use the following lined page to complete the answer(s) to any question(s), the question number(s) must be clearly shown. … … … … … … … … … … … … … … … … … … … … … … … … …
9 marks
Mark scheme: 6 51 1 72 3 55 2 86 5 75 4 170 10 98 6 175 11 137 7 220 12 152 8 260 17 167 9 262 18 235 13 302 19 238 14 311 20 242 15 320 21 256 16 333 22 351 23 M1 Attempt at ranking. Total ranks: 95 A1 0 1 : and : x y x y H m m H m m = ≠ B1 Allow words, must include ‘population’ median. Use normal approximation with attempts at mean and variance. M1 Mean =132, variance = 264 A1 95.5 132 264 − M1 Allow no or wrong continuity correction for M1 only. Question Answer Marks Guidance 6 – 2.246 A1 CAO Critical value is – 1.96. – 2.246 < – 1.96 reject 0 H . M1 Compare their value with – 1.96. Or area comparison 0.0123 or 0.0124 with 0.025 and FT conclusion. There is sufficient evidence of a difference in levels. A1 Correct conclusion, in context, following correct work. Level of uncertainty in language is used. 9
This question in 9231/41 Oct/Nov 2021
Q11 · Applicants for a particular college take a written test when they attend for interview 9231/42 Oct/Nov 2021
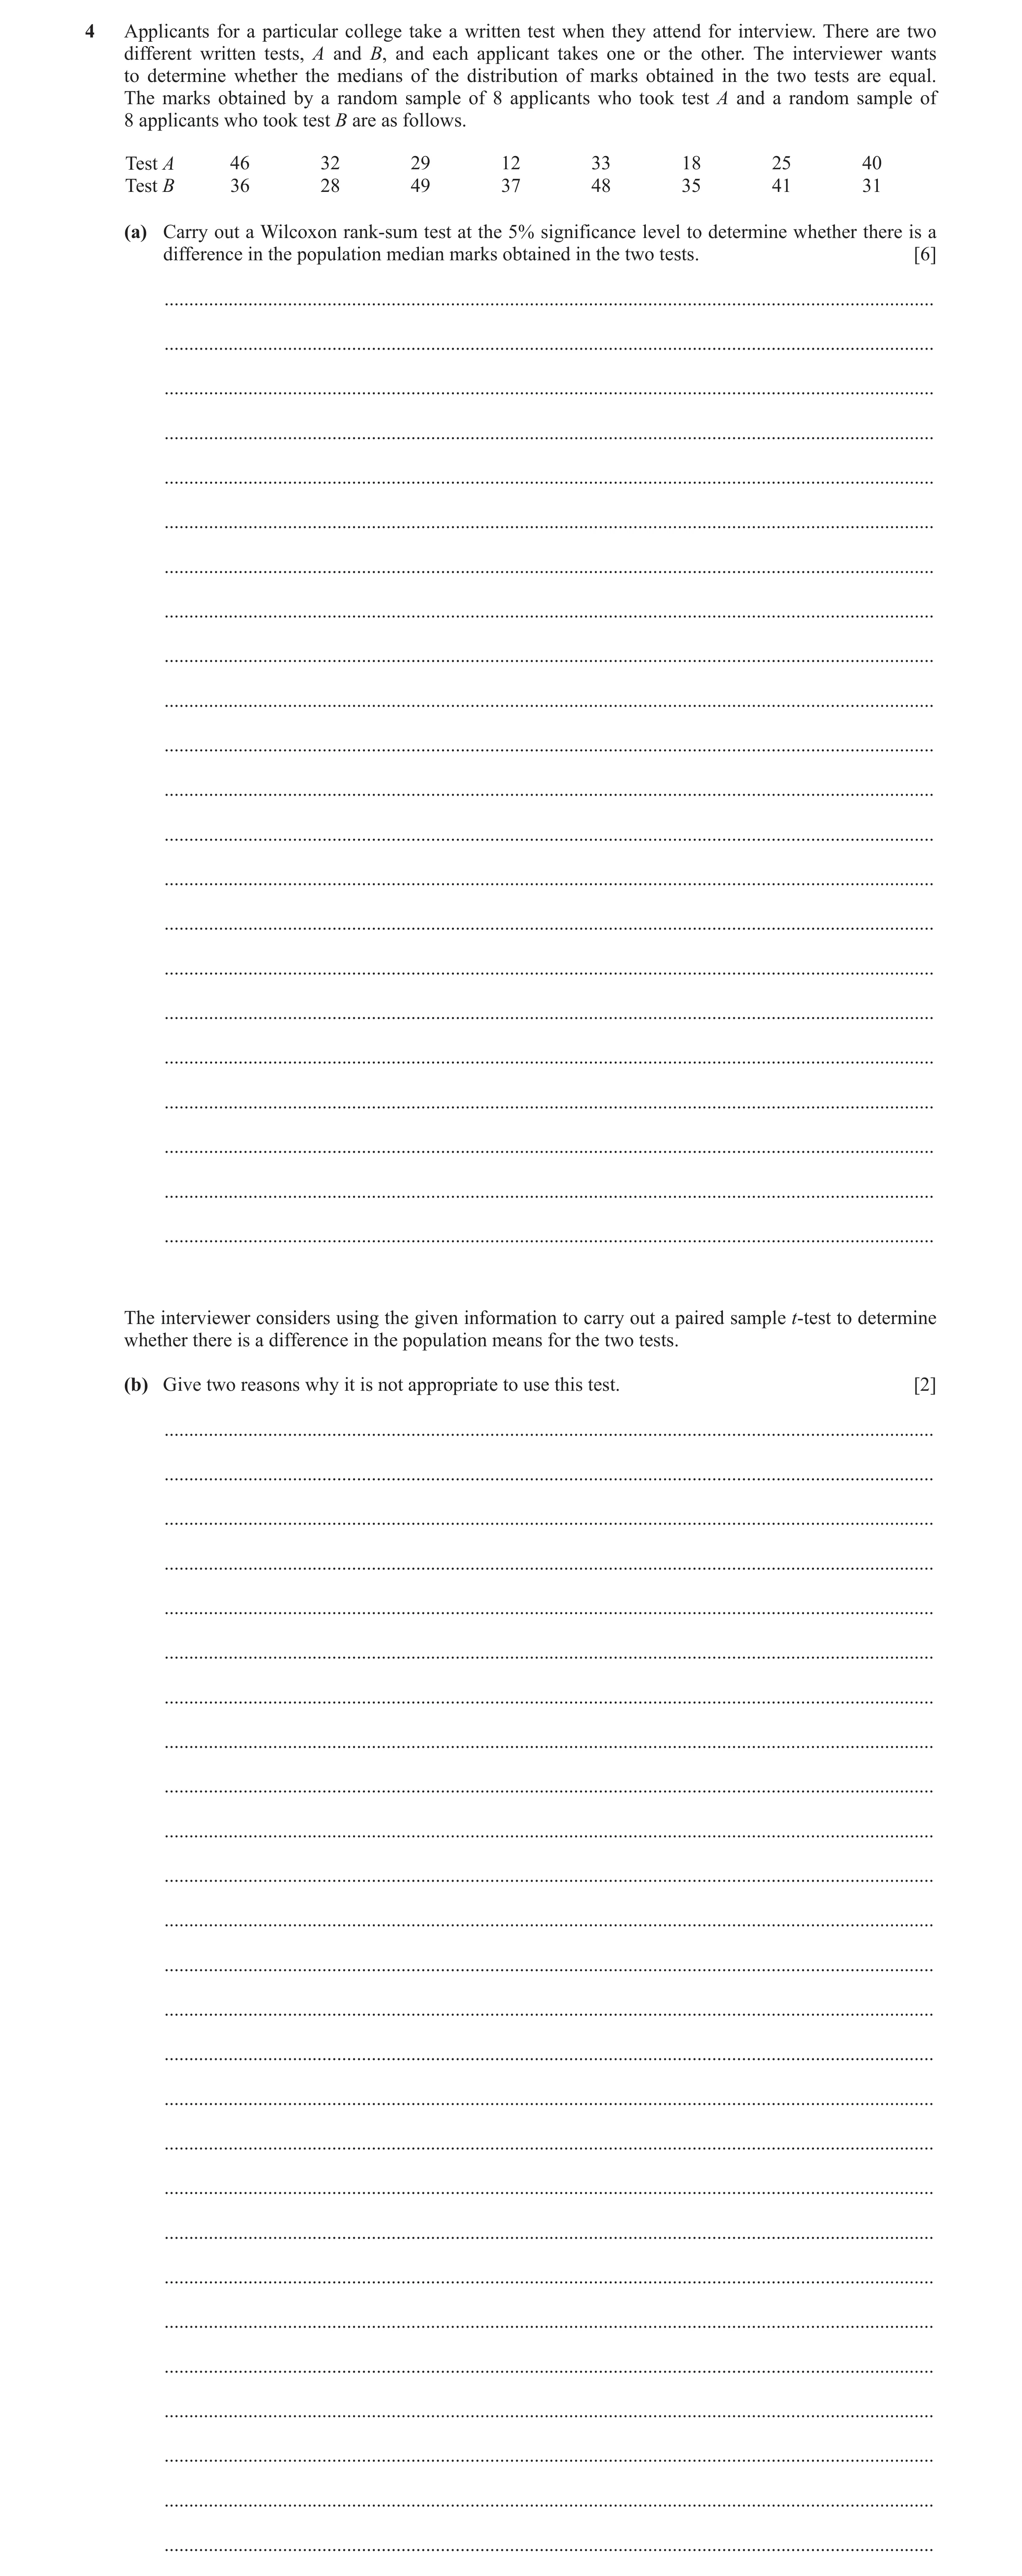
4 Applicants for a particular college take a written test when they attend for interview. There are two different written tests, A and B, and each applicant takes one or the other. The interviewer wants to determine whether the medians of the distribution of marks obtained in the two tests are equal. The marks obtained by a random sample of 8 applicants who took test A and a random sample of 8 applicants who took test B are as follows. Test A 46 32 29 12 33 18 25 40 Test B 36 28 49 37 48 35 41 31 (a) Carry out a Wilcoxon rank-sum test at the 5% significance level to determine whether there is a difference in the population median marks obtained in the two tests. [6] … … … … … … … … … … … … … … … … … … … … … … The interviewer considers using the given information to carry out a paired sample t-test to determine whether there is a difference in the population means for the two tests. (b) Give two reasons why it is not appropriate to use this test. [2] … … … … … … … … … … … … … … … … … … … … … … … … … …
8 marks
Mark scheme: 4(a) 12 1 28 4 18 2 31 6 25 3 35 9 29 5 36 10 32 7 37 11 33 8 41 13 40 12 48 15 46 14 49 16 M1 Attempt at ranking. Test statistic: 52 A1 0 1 and : : x y x y H m m H m m = ≠ B1 Allow in words but ‘population’ must be included. Critical value for (8, 8) is 49. *B1 Allow 51 if clearly one-tail test in hypotheses. 52 > 49 Accept 0 H DM1 Compare their calculated value with 49 and correct FT conclusion. Insufficient evidence of difference in medians. A1 Correct conclusion, in context, following correct work. Level of uncertainty in language is used. 6 4(b) Not a paired sample. B1 Underlying distribution/population not (known to be) normal Underlying distribution/population unknown B1 B0 for ‘data is not normally distributed’ B0 for ‘marks are not normally distributed’ 2
This question in 9231/42 Oct/Nov 2021
Q12 · The blood cholesterol levels, measured in suitable units, of a random sample of 11 women… 9231/43 Oct/Nov 2021
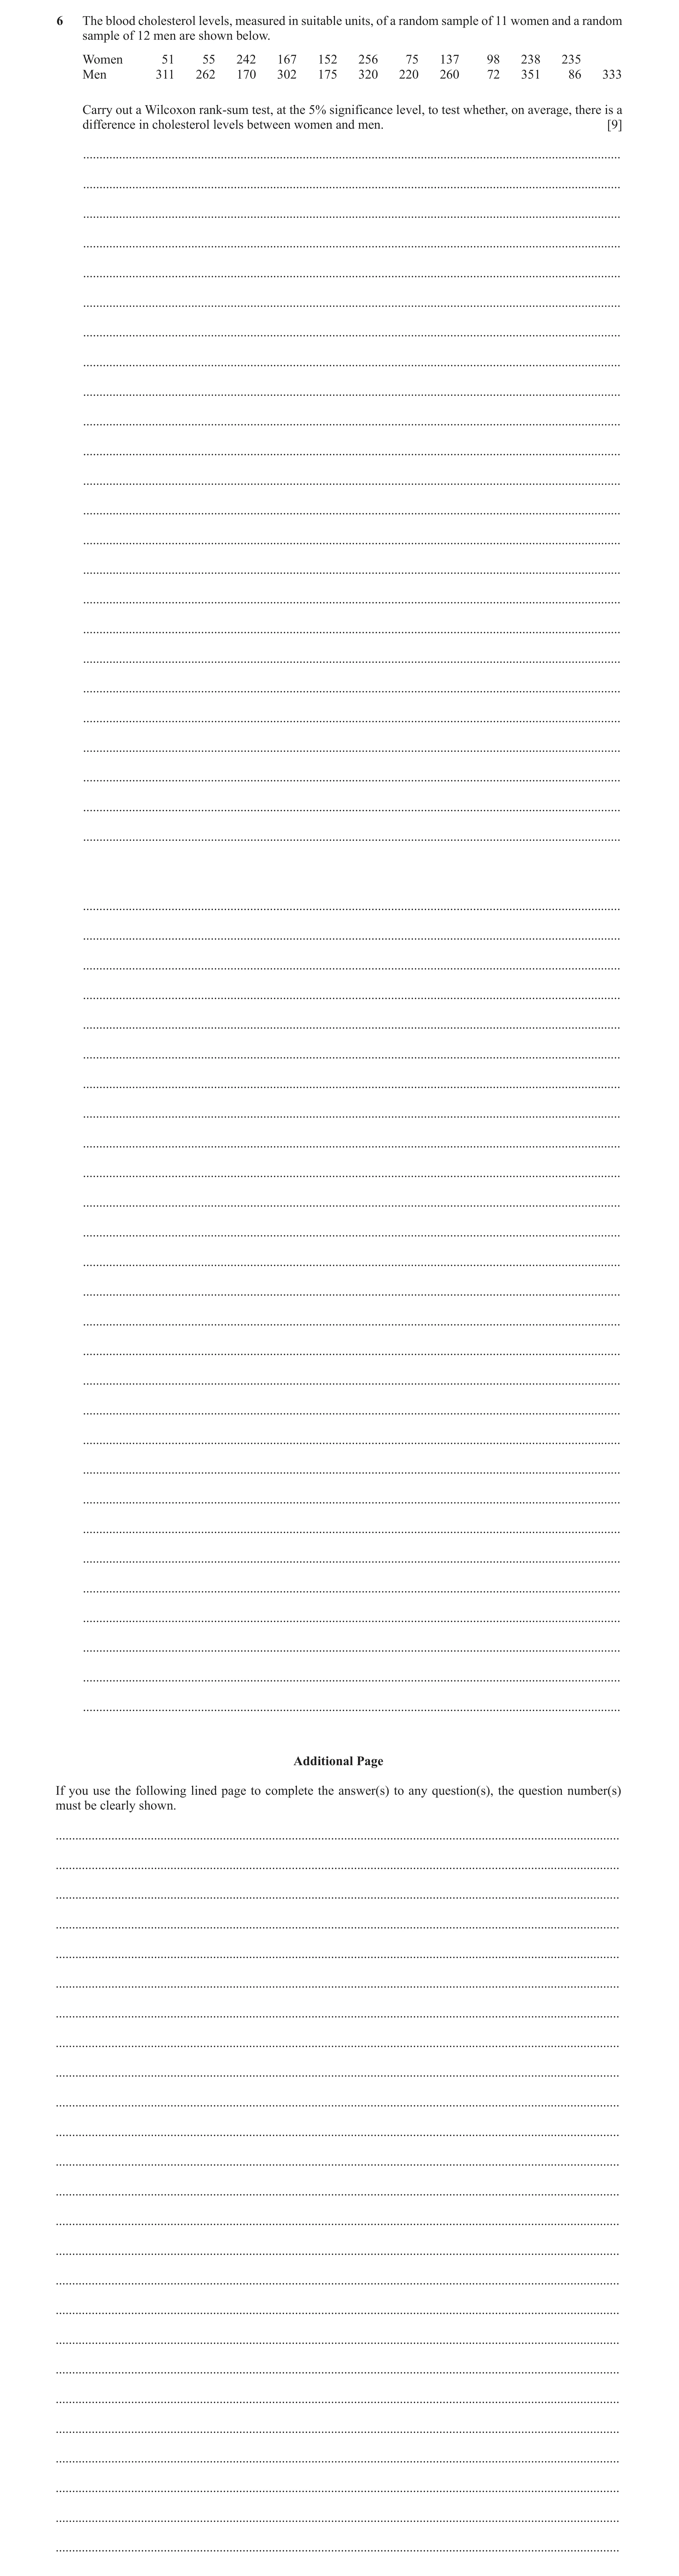
6 The blood cholesterol levels, measured in suitable units, of a random sample of 11 women and a random sample of 12 men are shown below. Women 51 55 242 167 152 256 75 137 98 238 235 Men 311 262 170 302 175 320 220 260 72 351 86 333 Carry out a Wilcoxon rank-sum test, at the 5% significance level, to test whether, on average, there is a difference in cholesterol levels between women and men. [9] … … … … … … … … … … … … … … … … … … … … … … … … … … … … … … … … … … … … … … … … … … … … … … … … … … … … Additional Page If you use the following lined page to complete the answer(s) to any question(s), the question number(s) must be clearly shown. … … … … … … … … … … … … … … … … … … … … … … … … …
9 marks
Mark scheme: 6 51 1 72 3 55 2 86 5 75 4 170 10 98 6 175 11 137 7 220 12 152 8 260 17 167 9 262 18 235 13 302 19 238 14 311 20 242 15 320 21 256 16 333 22 351 23 M1 Attempt at ranking. Total ranks: 95 A1 0 1 : and : x y x y H m m H m m = ≠ B1 Allow words, must include ‘population’ median. Use normal approximation with attempts at mean and variance. M1 Mean =132, variance = 264 A1 95.5 132 264 − M1 Allow no or wrong continuity correction for M1 only. Question Answer Marks Guidance 6 – 2.246 A1 CAO Critical value is – 1.96. – 2.246 < – 1.96 reject 0 H . M1 Compare their value with – 1.96. Or area comparison 0.0123 or 0.0124 with 0.025 and FT conclusion. There is sufficient evidence of a difference in levels. A1 Correct conclusion, in context, following correct work. Level of uncertainty in language is used. 9
This question in 9231/43 Oct/Nov 2021
Q13 · A teacher at a large college gave a mathematical puzzle to all the students 9231/41 May/June 2022
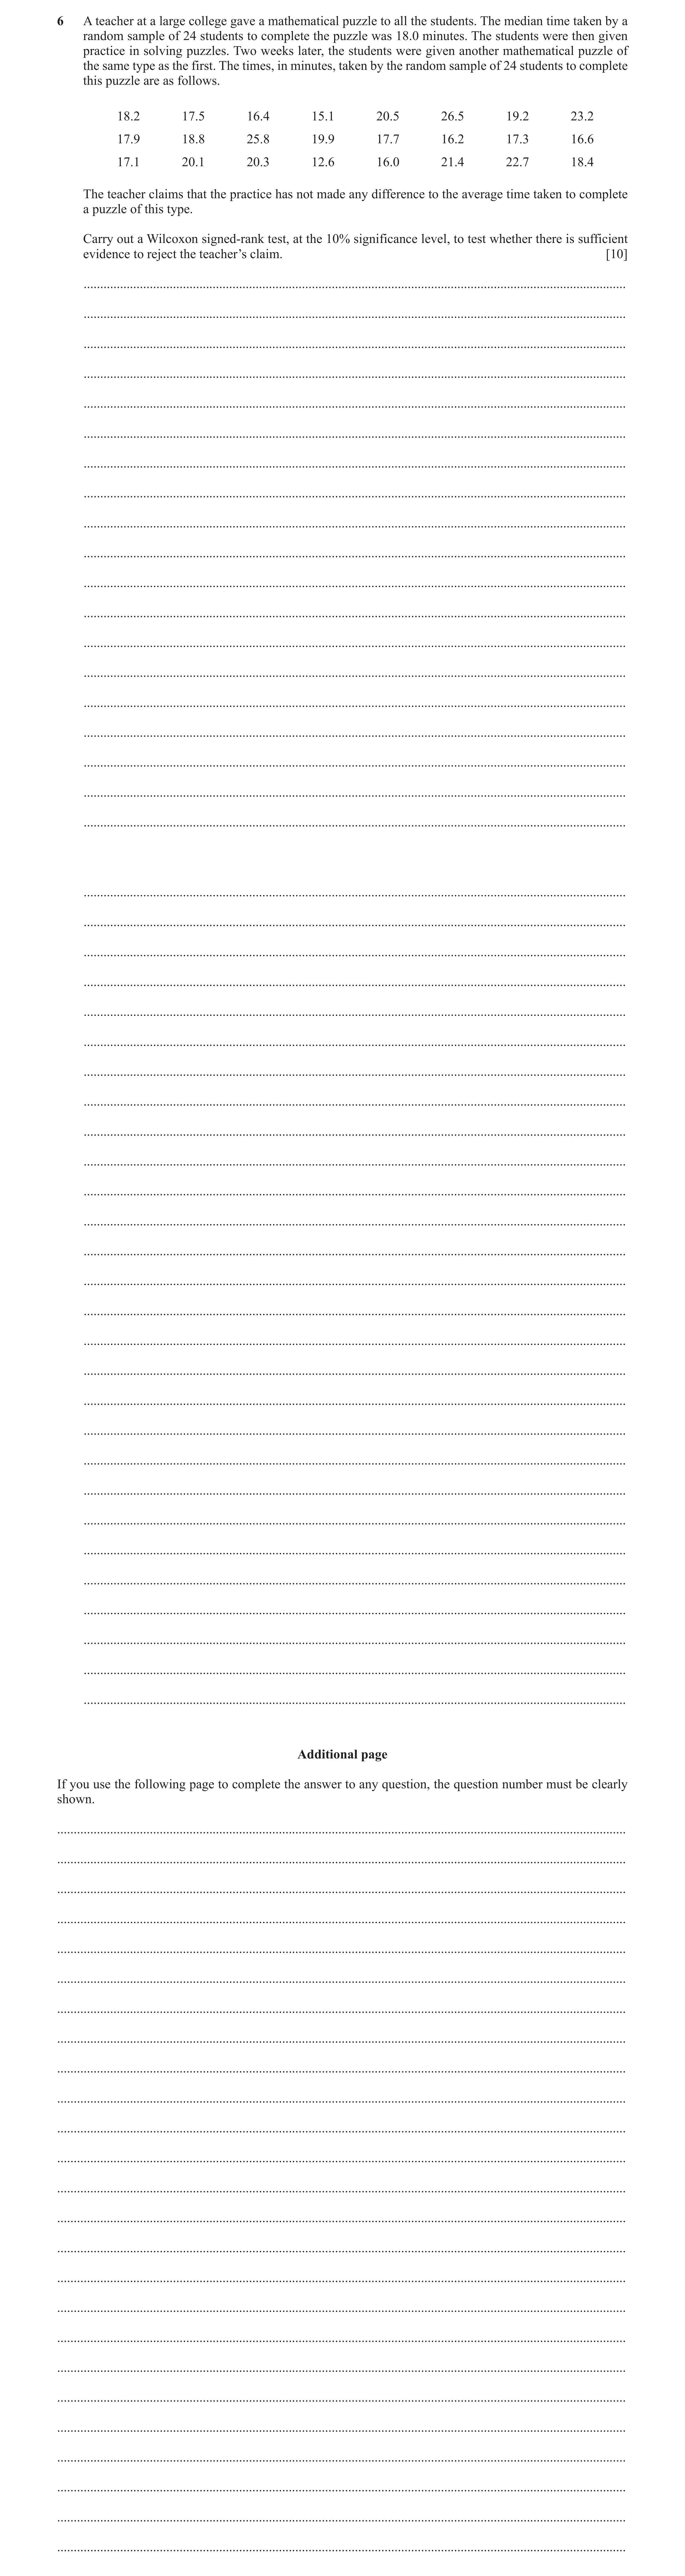
6 A teacher at a large college gave a mathematical puzzle to all the students. The median time taken by a random sample of 24 students to complete the puzzle was 18.0 minutes. The students were then given practice in solving puzzles. Two weeks later, the students were given another mathematical puzzle of the same type as the first. The times, in minutes, taken by the random sample of 24 students to complete this puzzle are as follows. 18.2 17.5 16.4 15.1 20.5 26.5 19.2 23.2 17.9 18.8 25.8 19.9 17.7 16.2 17.3 16.6 17.1 20.1 20.3 12.6 16.0 21.4 22.7 18.4 The teacher claims that the practice has not made any difference to the average time taken to complete a puzzle of this type. Carry out a Wilcoxon signed-rank test, at the 10% significance level, to test whether there is sufficient evidence to reject the teacher’s claim. [10] … … … … … … … … … … … … … … … … … … … … … … … … … … … … … … … … … … … … … … … … … … … … … … … Additional page If you use the following page to complete the answer to any question, the question number must be clearly shown. … … … … … … … … … … … … … … … … … … … … … … … … …
10 marks
Mark scheme: 6 Differences/rank: 0.2 – 0.5 –1.6 –2.9 2.5 8.5 1.2 5.2 2 –5 –11 –18 17 24 9 21 –0.1 0.8 7.8 1.9 –0.3 –1.8 –0.7 –1.4 –1 7 23 13 –3 –12 –6 –10 –0.9 2.1 2.3 –5.4 –2.0 3.4 4.7 0.4 –8 15 16 –22 –14 19 20 4 M1 A1 Attempt at differences, allow 4 errors. Q = 110 P = 190 A1 Either sum correct. H0: population median =18.0 and H1: population median 18.0 B1 Must be ‘population’, allow m. Mean = 1 1 1 24 25 150 4 4 n n B1 Normal approximation: mean. Variance = 1 1 1 2 1 24 25 49 1225 24 24 n n n B1 110.5 150 1225 M1 Attempt at test statistic, allow incorrect or missing cc, FT their 110. 1.129 A1 Question Answer Marks Guidance 6 10% 2-tail, critical value is 1.645 1.129 1.645 or 0.1296 > 0.05, accept H0. M1 Compare with 1.645, correct FT conclusion. Insufficient evidence to suggest that median is not 18.0/ Insufficient evidence to reject teacher’s claim. A1 Correct conclusion, in context. Level of uncertainty in language is used. 10
This question in 9231/41 May/June 2022
Q14 · A teacher at a large college gave a mathematical puzzle to all the students 9231/42 May/June 2022
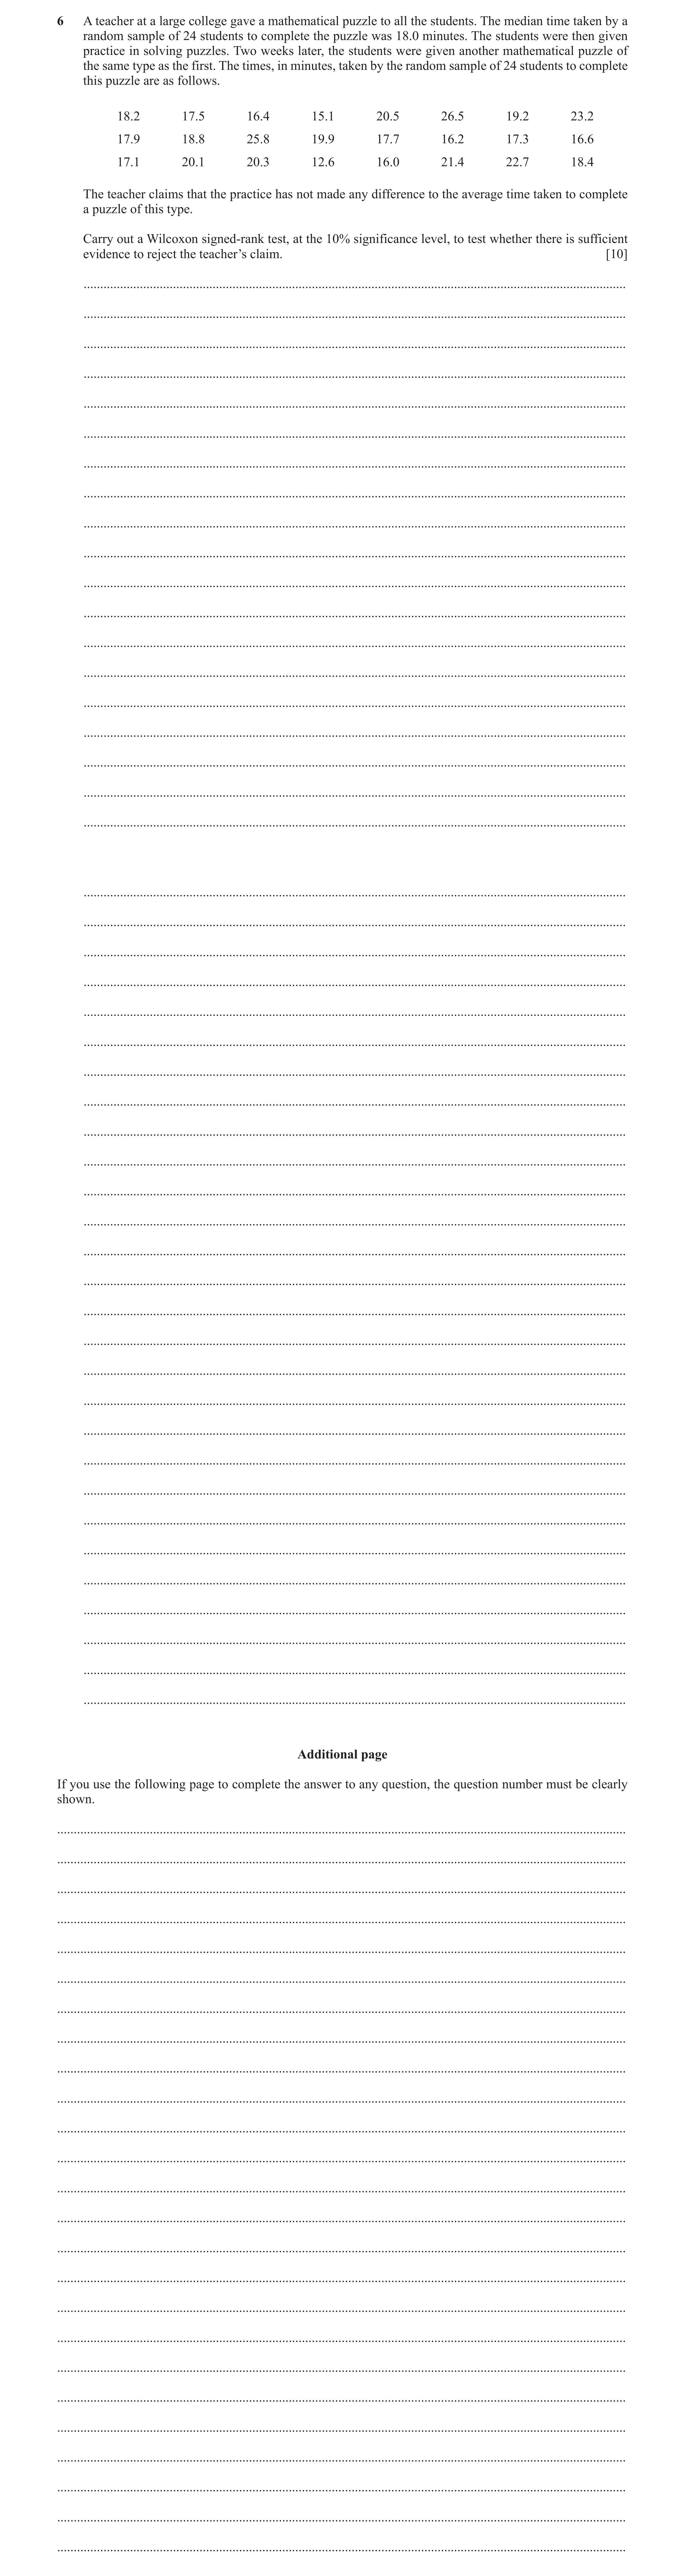
6 A teacher at a large college gave a mathematical puzzle to all the students. The median time taken by a random sample of 24 students to complete the puzzle was 18.0 minutes. The students were then given practice in solving puzzles. Two weeks later, the students were given another mathematical puzzle of the same type as the first. The times, in minutes, taken by the random sample of 24 students to complete this puzzle are as follows. 18.2 17.5 16.4 15.1 20.5 26.5 19.2 23.2 17.9 18.8 25.8 19.9 17.7 16.2 17.3 16.6 17.1 20.1 20.3 12.6 16.0 21.4 22.7 18.4 The teacher claims that the practice has not made any difference to the average time taken to complete a puzzle of this type. Carry out a Wilcoxon signed-rank test, at the 10% significance level, to test whether there is sufficient evidence to reject the teacher’s claim. [10] … … … … … … … … … … … … … … … … … … … … … … … … … … … … … … … … … … … … … … … … … … … … … … … Additional page If you use the following page to complete the answer to any question, the question number must be clearly shown. … … … … … … … … … … … … … … … … … … … … … … … … …
10 marks
Mark scheme: 6 Differences/rank: 0.2 – 0.5 –1.6 –2.9 2.5 8.5 1.2 5.2 2 –5 –11 –18 17 24 9 21 –0.1 0.8 7.8 1.9 –0.3 –1.8 –0.7 –1.4 –1 7 23 13 –3 –12 –6 –10 –0.9 2.1 2.3 –5.4 –2.0 3.4 4.7 0.4 –8 15 16 –22 –14 19 20 4 M1 A1 Attempt at differences, allow 4 errors. Q = 110 P = 190 A1 Either sum correct. H0: population median =18.0 and H1: population median 18.0 B1 Must be ‘population’, allow m. Mean = 1 1 1 24 25 150 4 4 n n B1 Normal approximation: mean. Variance = 1 1 1 2 1 24 25 49 1225 24 24 n n n B1 110.5 150 1225 M1 Attempt at test statistic, allow incorrect or missing cc, FT their 110. 1.129 A1 Question Answer Marks Guidance 6 10% 2-tail, critical value is 1.645 1.129 1.645 or 0.1296 > 0.05, accept H0. M1 Compare with 1.645, correct FT conclusion. Insufficient evidence to suggest that median is not 18.0/ Insufficient evidence to reject teacher’s claim. A1 Correct conclusion, in context. Level of uncertainty in language is used. 10
This question in 9231/42 May/June 2022
Q15 · A manager claims that the lengths of the rubber tubes that his company produces have a… 9231/43 May/June 2022
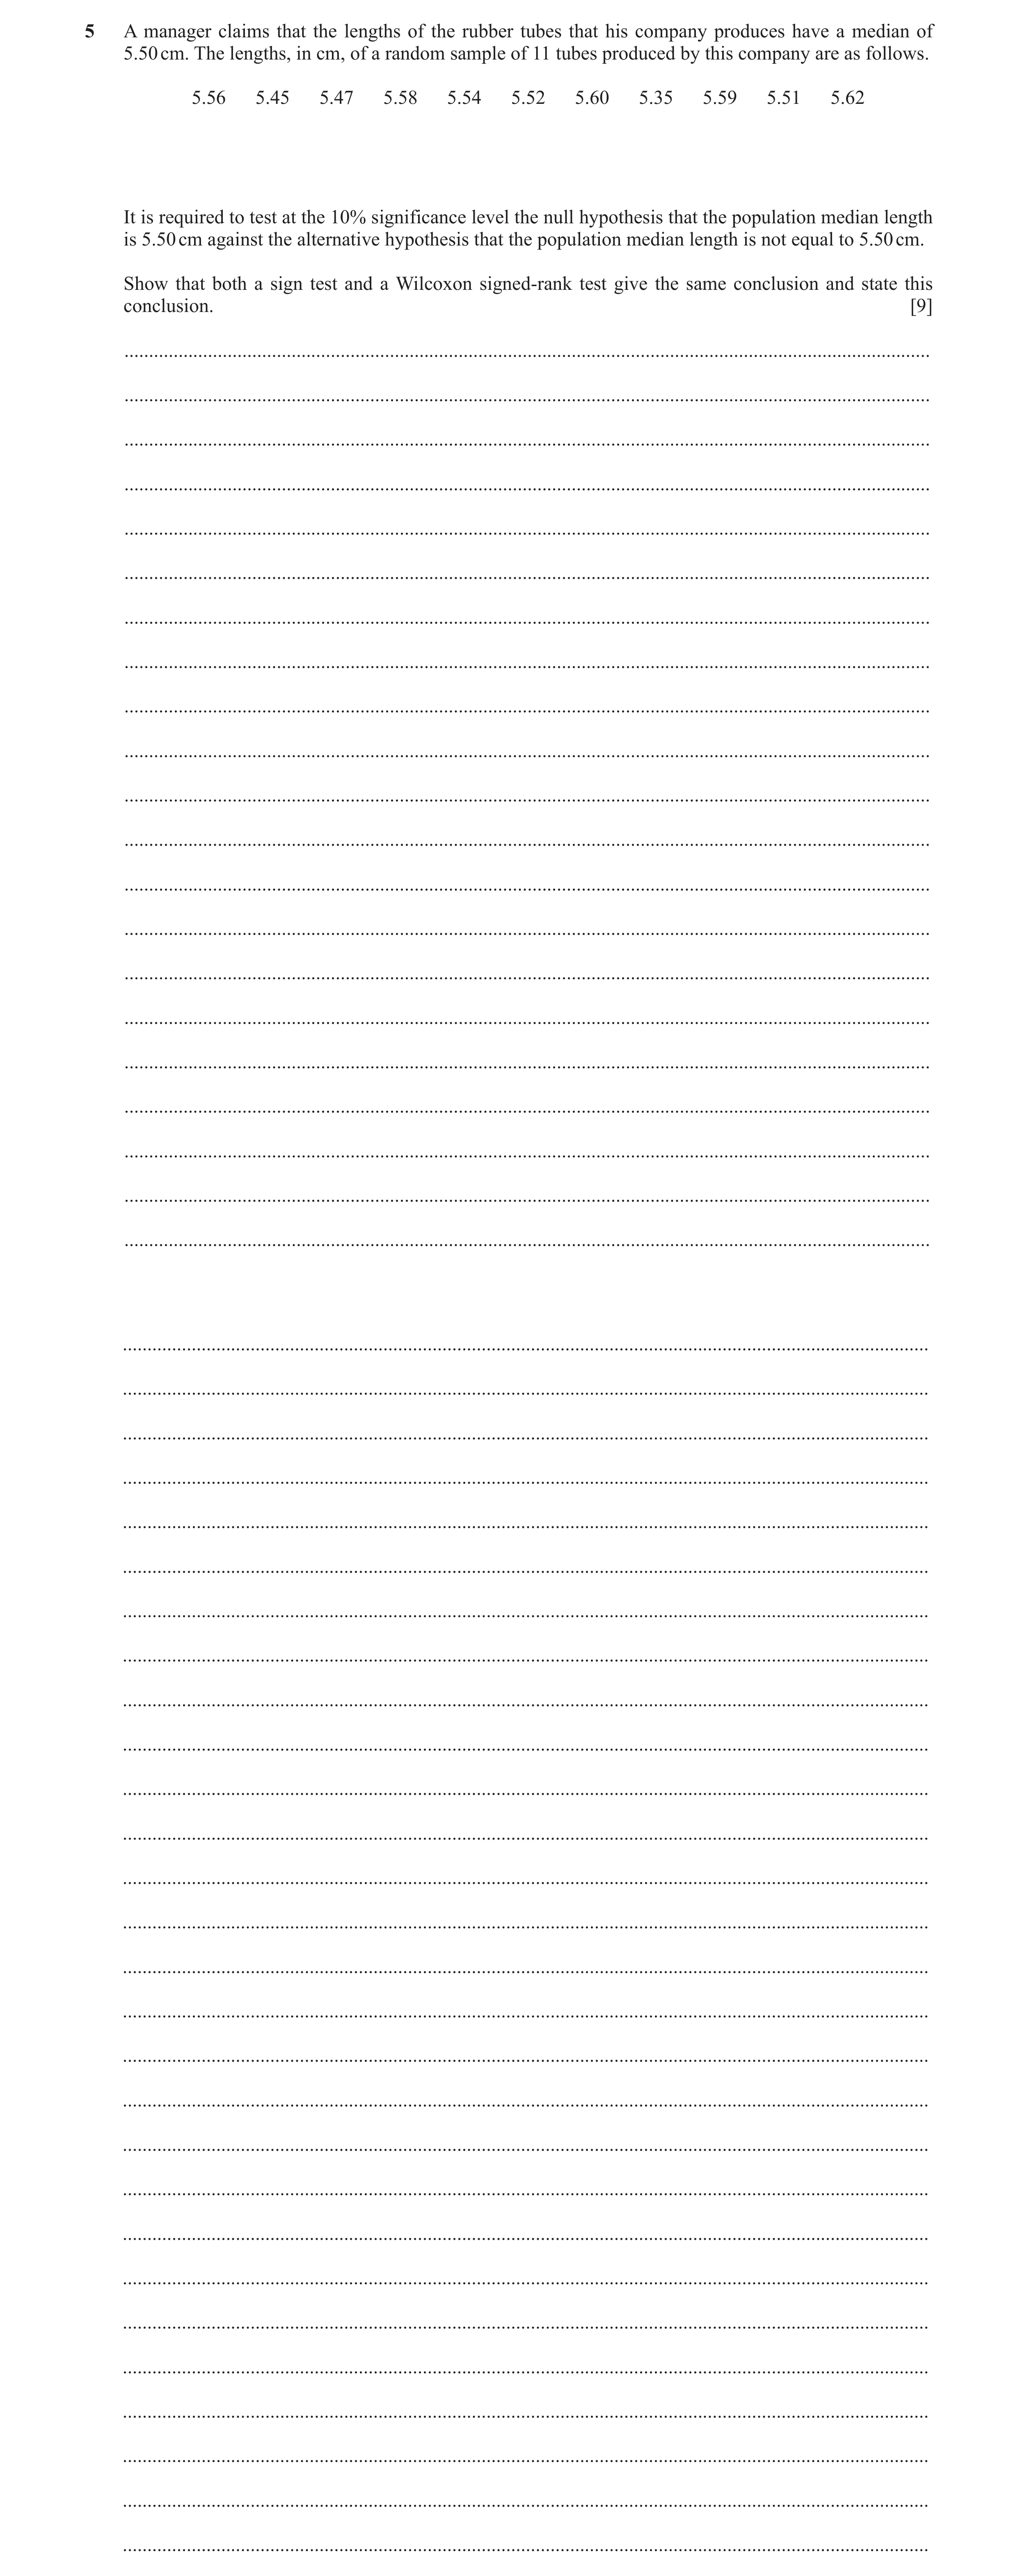
5 A manager claims that the lengths of the rubber tubes that his company produces have a median of 5.50 cm. The lengths, in cm, of a random sample of 11 tubes produced by this company are as follows. 5.56 5.45 5.47 5.58 5.54 5.52 5.60 5.35 5.59 5.51 5.62 It is required to test at the 10% significance level the null hypothesis that the population median length is 5.50 cm against the alternative hypothesis that the population median length is not equal to 5.50 cm. Show that both a sign test and a Wilcoxon signed-rank test give the same conclusion and state this conclusion. [9] … … … … … … … … … … … … … … … … … … … … … … … … … … … … … … … … … … … … … … … … … … … … … … … … …
9 marks
Mark scheme: 5 Signs: + – – + + + + – + + + and use Binomial M1 11 signs (values not needed) allow one error. Consider B(11, 0.5) with P( 8) X or P( 3) X M1 Use of correct binomial. Compare 0.227 with 0.1 or 0.113 with 0.05 A1 Differences: 0.06 –0.05 –0.03 0.08 0.04 0.02 0.10 –0.15 0.09 0.01 0.12 M1 Allow one error. Signed Ranks: 6 -5 -3 7 4 2 9 -11 8 1 10 M1 Allow one swap. (P = 47) Q = 19 A1 Critical value from table = 13 B1 19 > 13 Accept H0 M1 FT their (19) compared with 13 and correct FT conclusion Insufficient evidence to support median not being 5.50 A1 BOTH conclusions correct from correct working, in context. Level of uncertainty in language. 9
This question in 9231/43 May/June 2022
Q16 · A large college is holding a piano competition 9231/41 Oct/Nov 2022
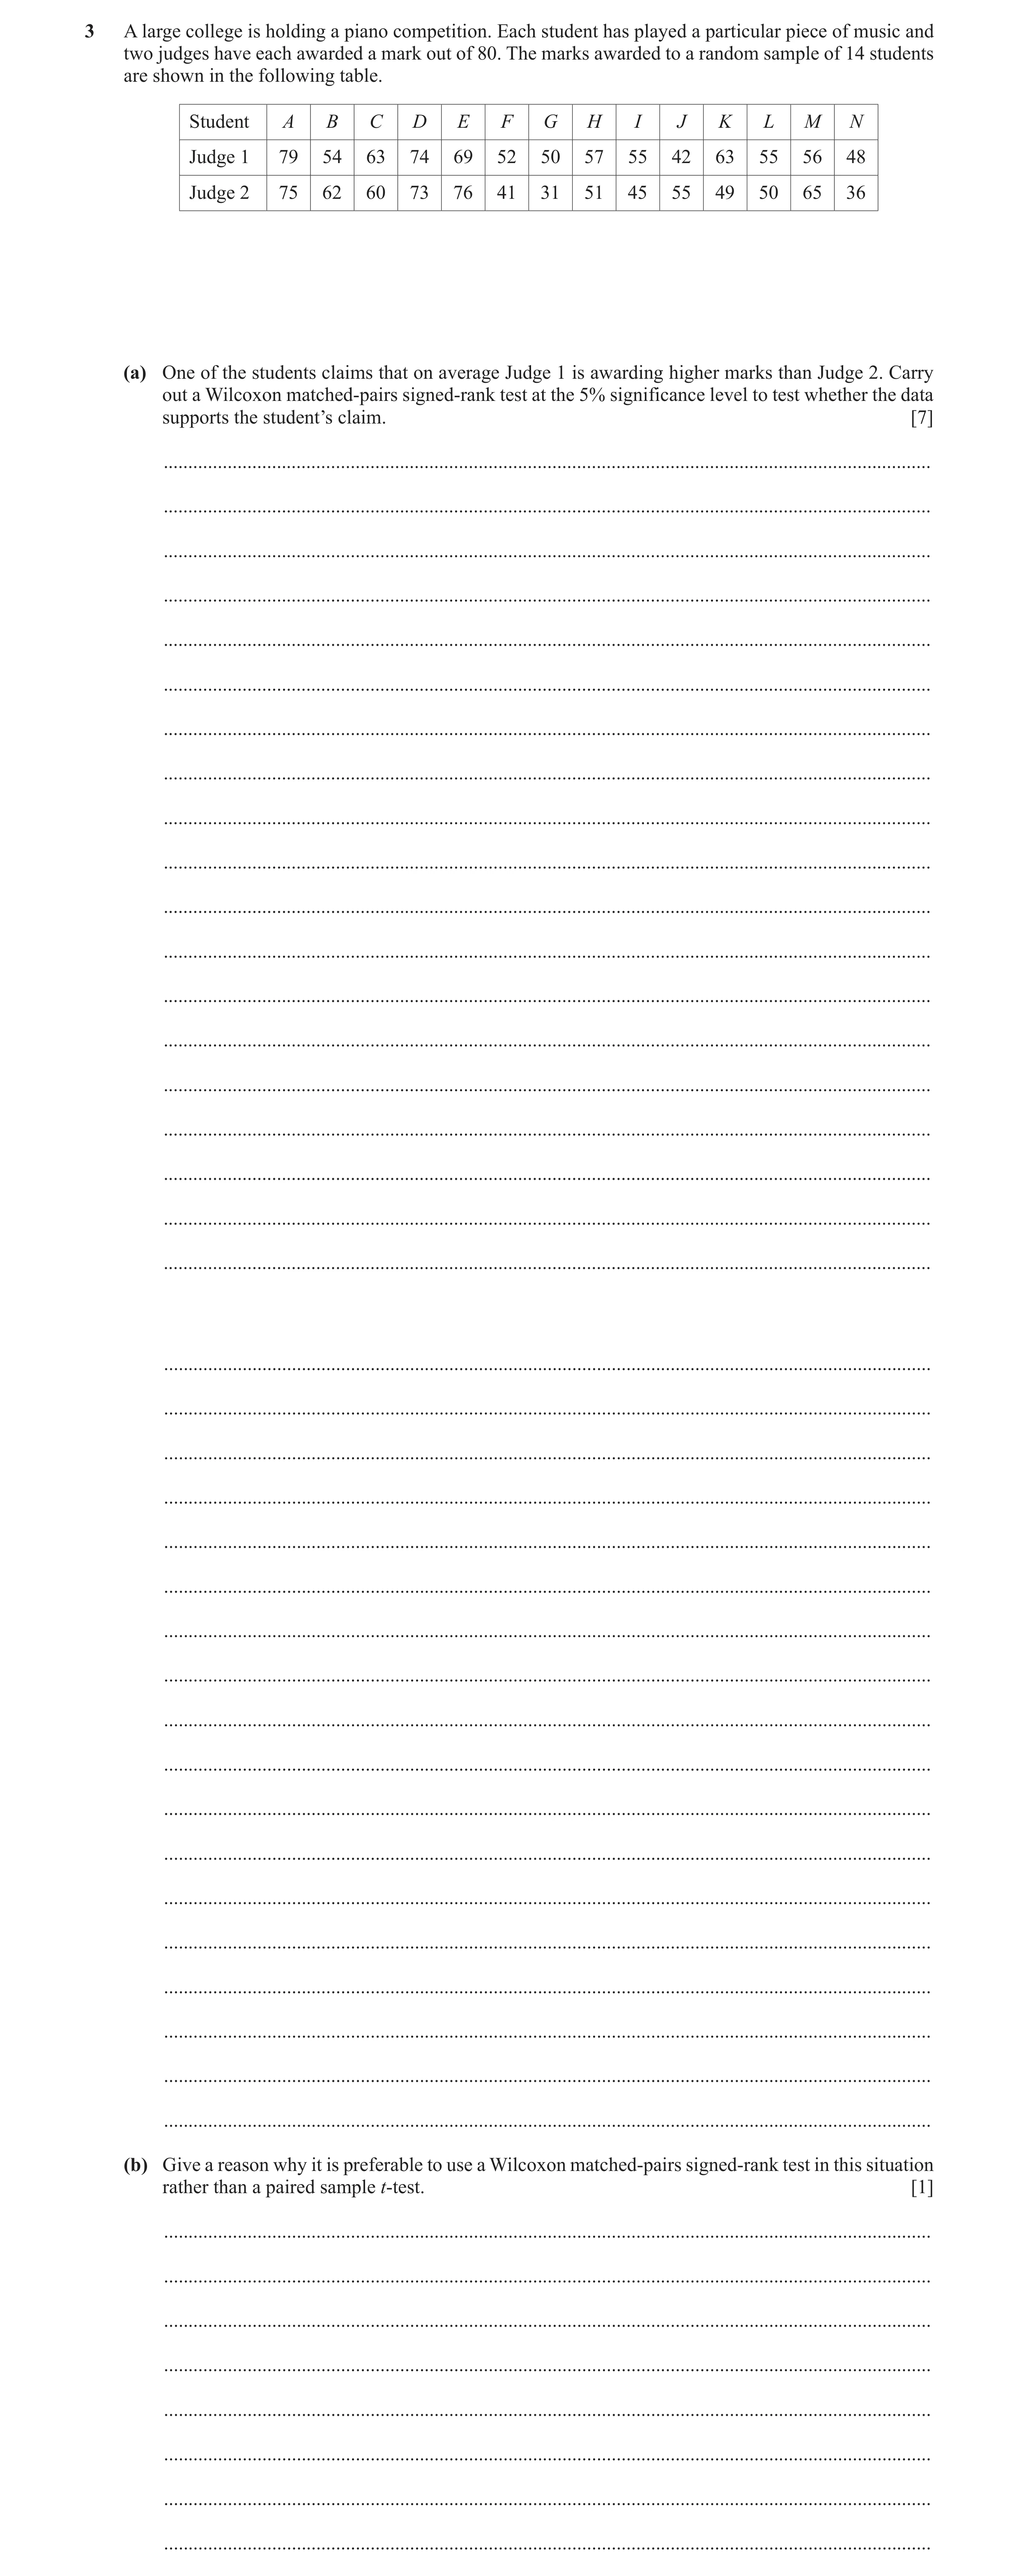
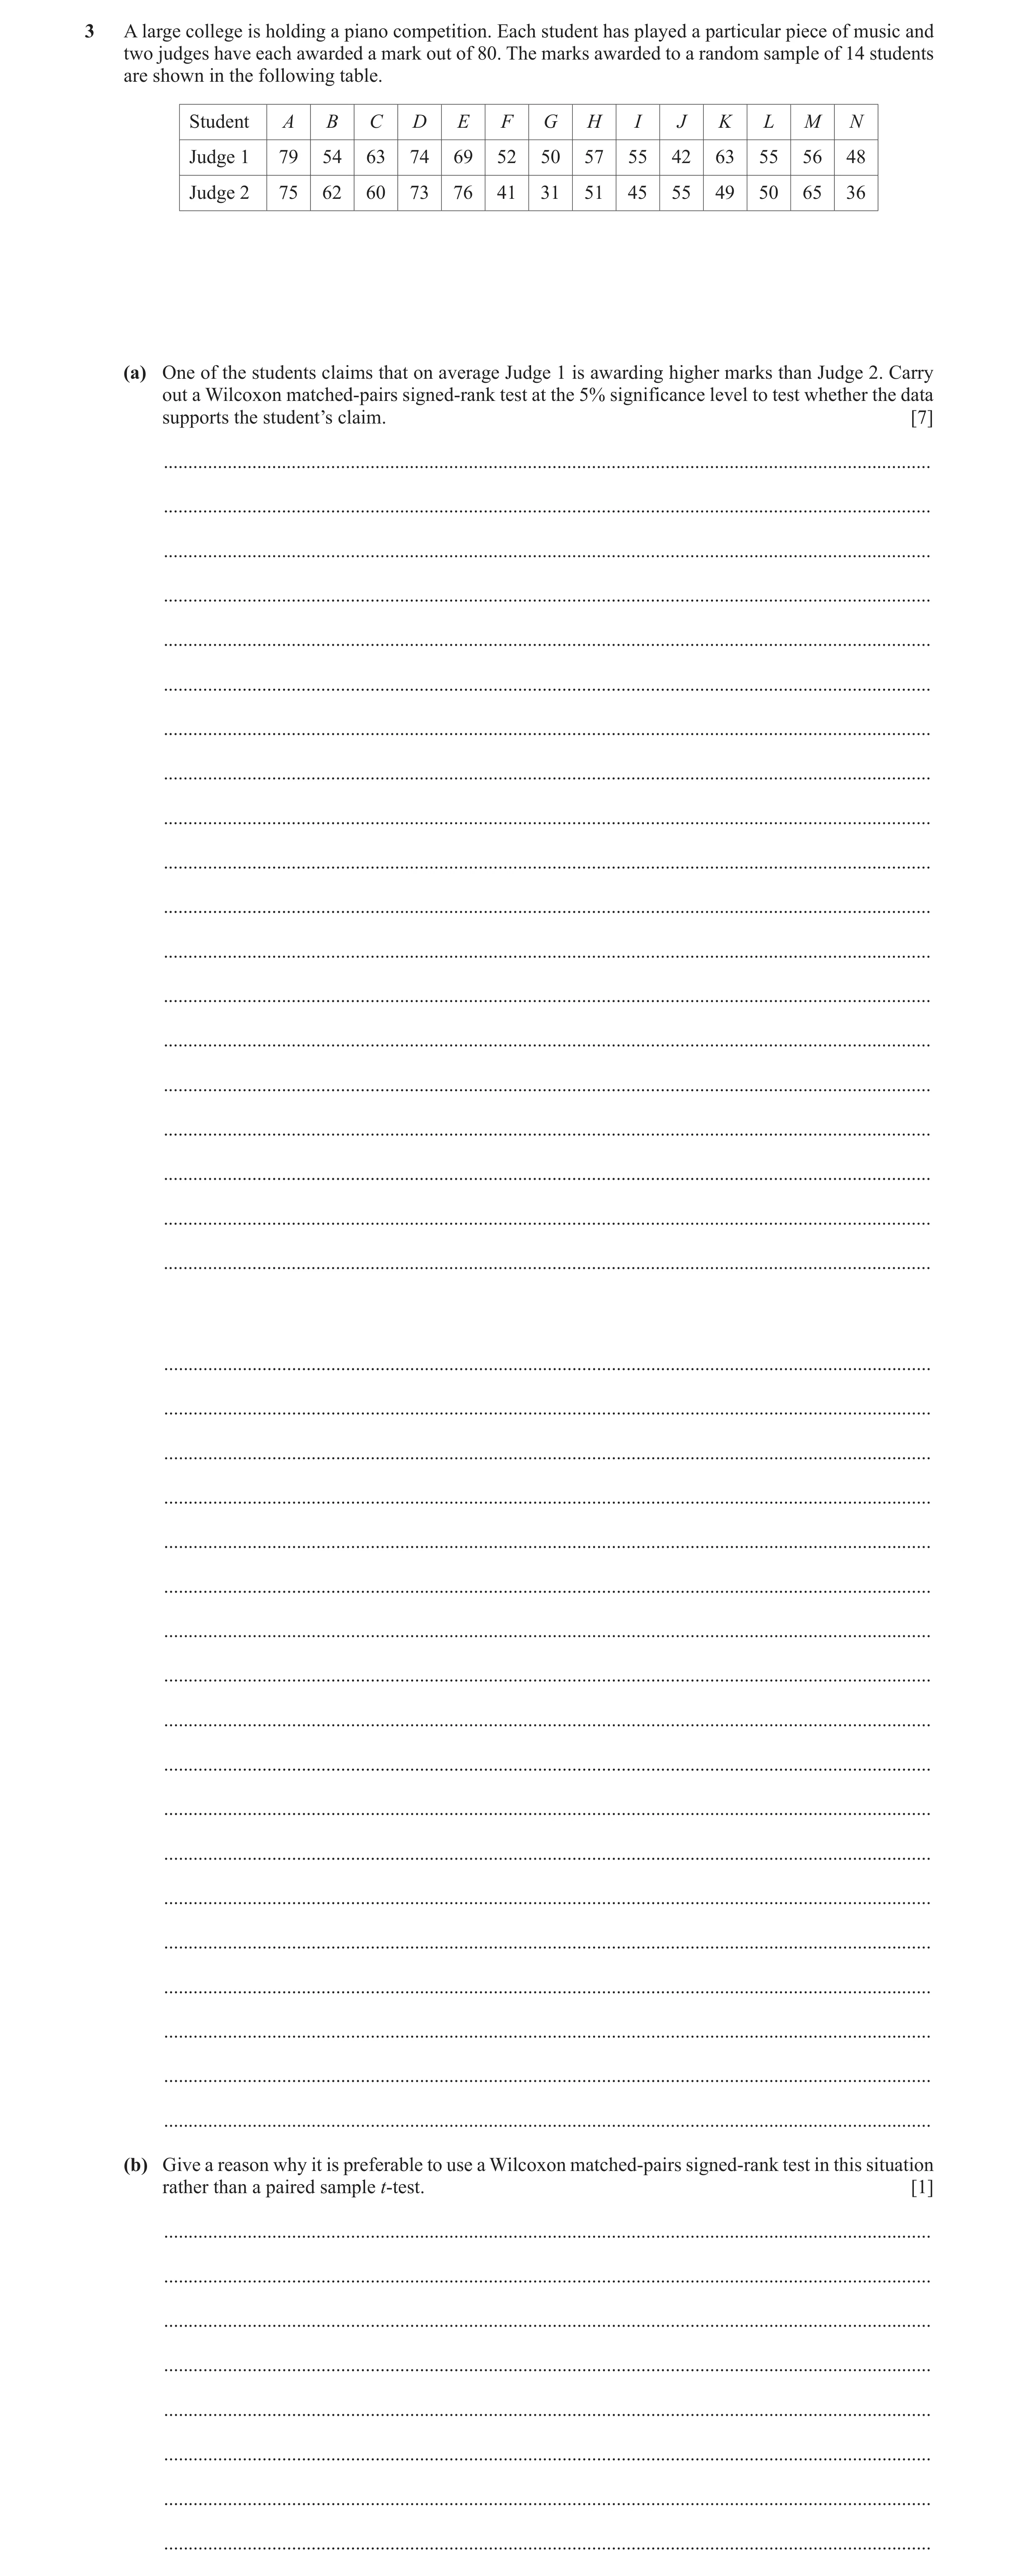
3 A large college is holding a piano competition. Each student has played a particular piece of music and two judges have each awarded a mark out of 80. The marks awarded to a random sample of 14 students are shown in the following table. Student A B C D E F G H I J K L M N Judge 1 79 54 63 74 69 52 50 57 55 42 63 55 56 48 Judge 2 75 62 60 73 76 41 31 51 45 55 49 50 65 36 (a) One of the students claims that on average Judge 1 is awarding higher marks than Judge 2. Carry out a Wilcoxon matched-pairs signed-rank test at the 5% significance level to test whether the data supports the student’s claim. [7] … … … … … … … … … … … … … … … … … … … … … … … … … … … … … … … … … … … … … (b) Give a reason why it is preferable to use a Wilcoxon matched-pairs signed-rank test in this situation rather than a paired sample t-test. [1] … … … … … … … …
8 marks
Mark scheme: 3(a) Differences: M1 4 -8 3 1 –7 11 19 6 10 –13 14 5 –9 12 Attempt at signed differences, allow 2 errors. Signed Ranks: M1 3 –7 2 1 –6 10 14 5 9 –12 13 4 –8 11 Ranks, allow 4 errors. [P = 72, Q = 33] T = 33 A1 33 clearly identified. H0: difference in population medians = 0 B1 H1: difference in population medians > 0 Correct, allow m for this mark. Critical tabular value = 25 B1 33 > 25 M1 Compares their value of sum of ranks with their 25 and accept H0 conclusion. Insufficient evidence to support claim A1 All correct except possibly first B1, in context, level of uncertainty in language. ‘Prove’ scores A0. 7 3(b) Underlying/population distribution of differences is unknown (not B1 known to be normal) 1
This question in 9231/41 Oct/Nov 2022
Q17 · The manager of a technology company A claims that his employees earn more per year than… 9231/42 Oct/Nov 2022
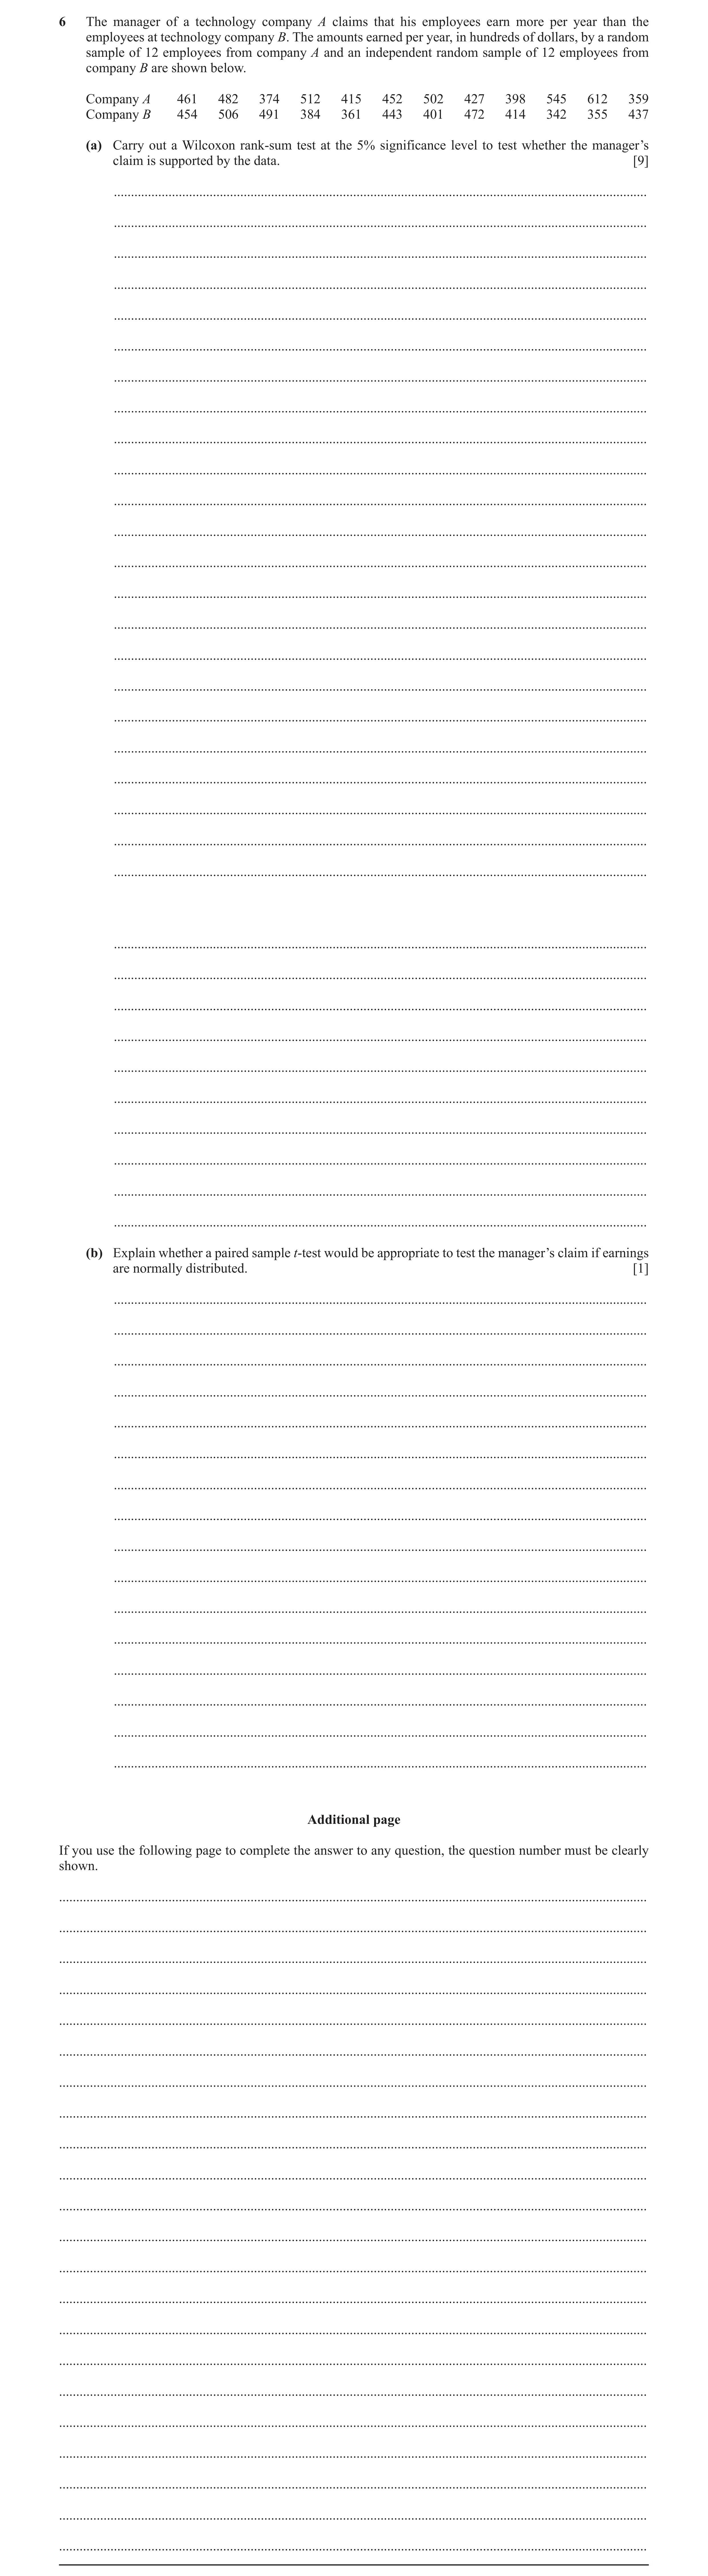
6 The manager of a technology company A claims that his employees earn more per year than the employees at technology company B. The amounts earned per year, in hundreds of dollars, by a random sample of 12 employees from company A and an independent random sample of 12 employees from company B are shown below. Company A 461 482 374 512 415 452 502 427 398 545 612 359 Company B 454 506 491 384 361 443 401 472 414 342 355 437 (a) Carry out a Wilcoxon rank‑sum test at the 5% significance level to test whether the manager’s claim is supported by the data. [9] … … … … … … … … … … … … … … … … … … … … … … … … … … … … … … … … … (b) Explain whether a paired sample t‑test would be appropriate to test the manager’s claim if earnings are normally distributed. [1] … … … … … … … … … … … … … … … … Additional page If you use the following page to complete the answer to any question, the question number must be clearly shown. … … … … … … … … … … … … … … … … … … … … … …
10 marks
Mark scheme: 6(a) M1 Wrong test: max B1 for hypotheses, B1B1 for correct mean and 359 3 342 1 variance 374 5 355 2 398 7 361 4 Attempt at rankings (allow up to 4 errors) 415 10 384 6 427 11 401 8 452 14 414 9 461 16 437 12 482 18 443 13 502 20 454 15 512 22 472 17 545 23 491 19 612 24 506 21 Test statistic = 127 A1 Clearly identified H0: population medians are equal B1 H1: population median for X is greater than population median for Y 1 B1 Mean = 12 25 = 150 2 1 B1 Variance = 12 12 25 = 300 12 6(a) 127.5 − 150 M1 Allow incorrect or no continuity correction. 300 −1.299 A1 Compare with −1.645: −1.299 −1.645 , or 0.097 > 0.05 M1 Valid comparison with 1.645 or 0.05 and reach correct ft Accept H0 conclusion. Insufficient evidence to support manager’s claim A1 Correct conclusion in context, following correct work, level of uncertainty in language. ‘Prove’ is A0. 9 6(b) Not appropriate/no, not the same people B1 OE No and reason needed, e.g. individuals in the samples cannot be paired up. 1
This question in 9231/42 Oct/Nov 2022
Q18 · A large college is holding a piano competition 9231/43 Oct/Nov 2022
3 A large college is holding a piano competition. Each student has played a particular piece of music and two judges have each awarded a mark out of 80. The marks awarded to a random sample of 14 students are shown in the following table. Student A B C D E F G H I J K L M N Judge 1 79 54 63 74 69 52 50 57 55 42 63 55 56 48 Judge 2 75 62 60 73 76 41 31 51 45 55 49 50 65 36 (a) One of the students claims that on average Judge 1 is awarding higher marks than Judge 2. Carry out a Wilcoxon matched-pairs signed-rank test at the 5% significance level to test whether the data supports the student’s claim. [7] … … … … … … … … … … … … … … … … … … … … … … … … … … … … … … … … … … … … … (b) Give a reason why it is preferable to use a Wilcoxon matched-pairs signed-rank test in this situation rather than a paired sample t-test. [1] … … … … … … … …
8 marks
Mark scheme: 3(a) Differences: M1 4 -8 3 1 –7 11 19 6 10 –13 14 5 –9 12 Attempt at signed differences, allow 2 errors. Signed Ranks: M1 3 –7 2 1 –6 10 14 5 9 –12 13 4 –8 11 Ranks, allow 4 errors. [P = 72, Q = 33] T = 33 A1 33 clearly identified. H0: difference in population medians = 0 B1 H1: difference in population medians > 0 Correct, allow m for this mark. Critical tabular value = 25 B1 33 > 25 M1 Compares their value of sum of ranks with their 25 and accept H0 conclusion. Insufficient evidence to support claim A1 All correct except possibly first B1, in context, level of uncertainty in language. ‘Prove’ scores A0. 7 3(b) Underlying/population distribution of differences is unknown (not B1 known to be normal) 1
This question in 9231/43 Oct/Nov 2022
Q19 · A random sample of 13 technology companies is chosen and the numbers of employees in 2018… 9231/41 May/June 2023
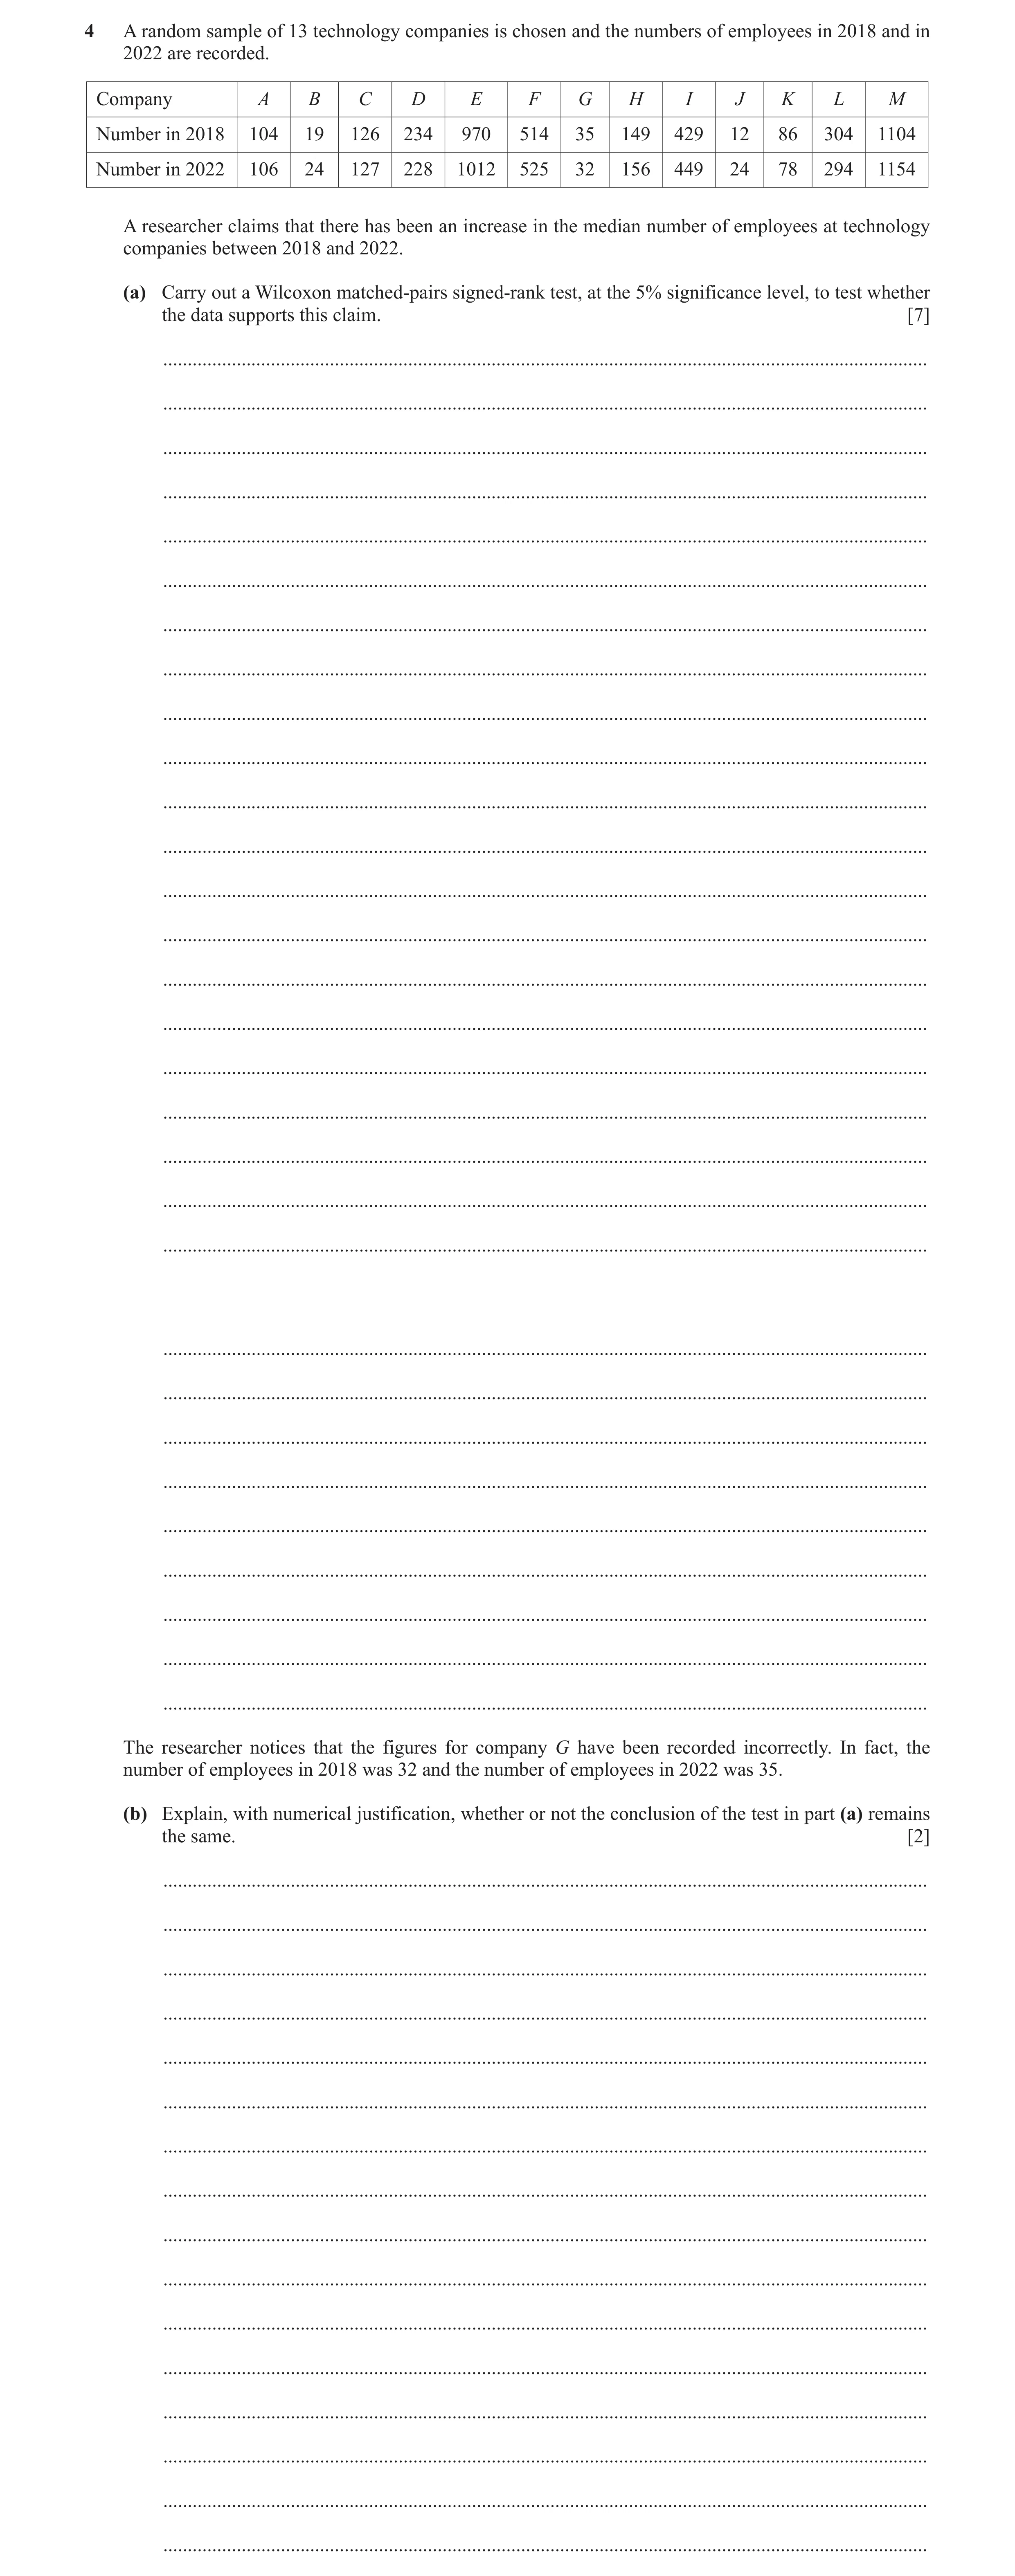
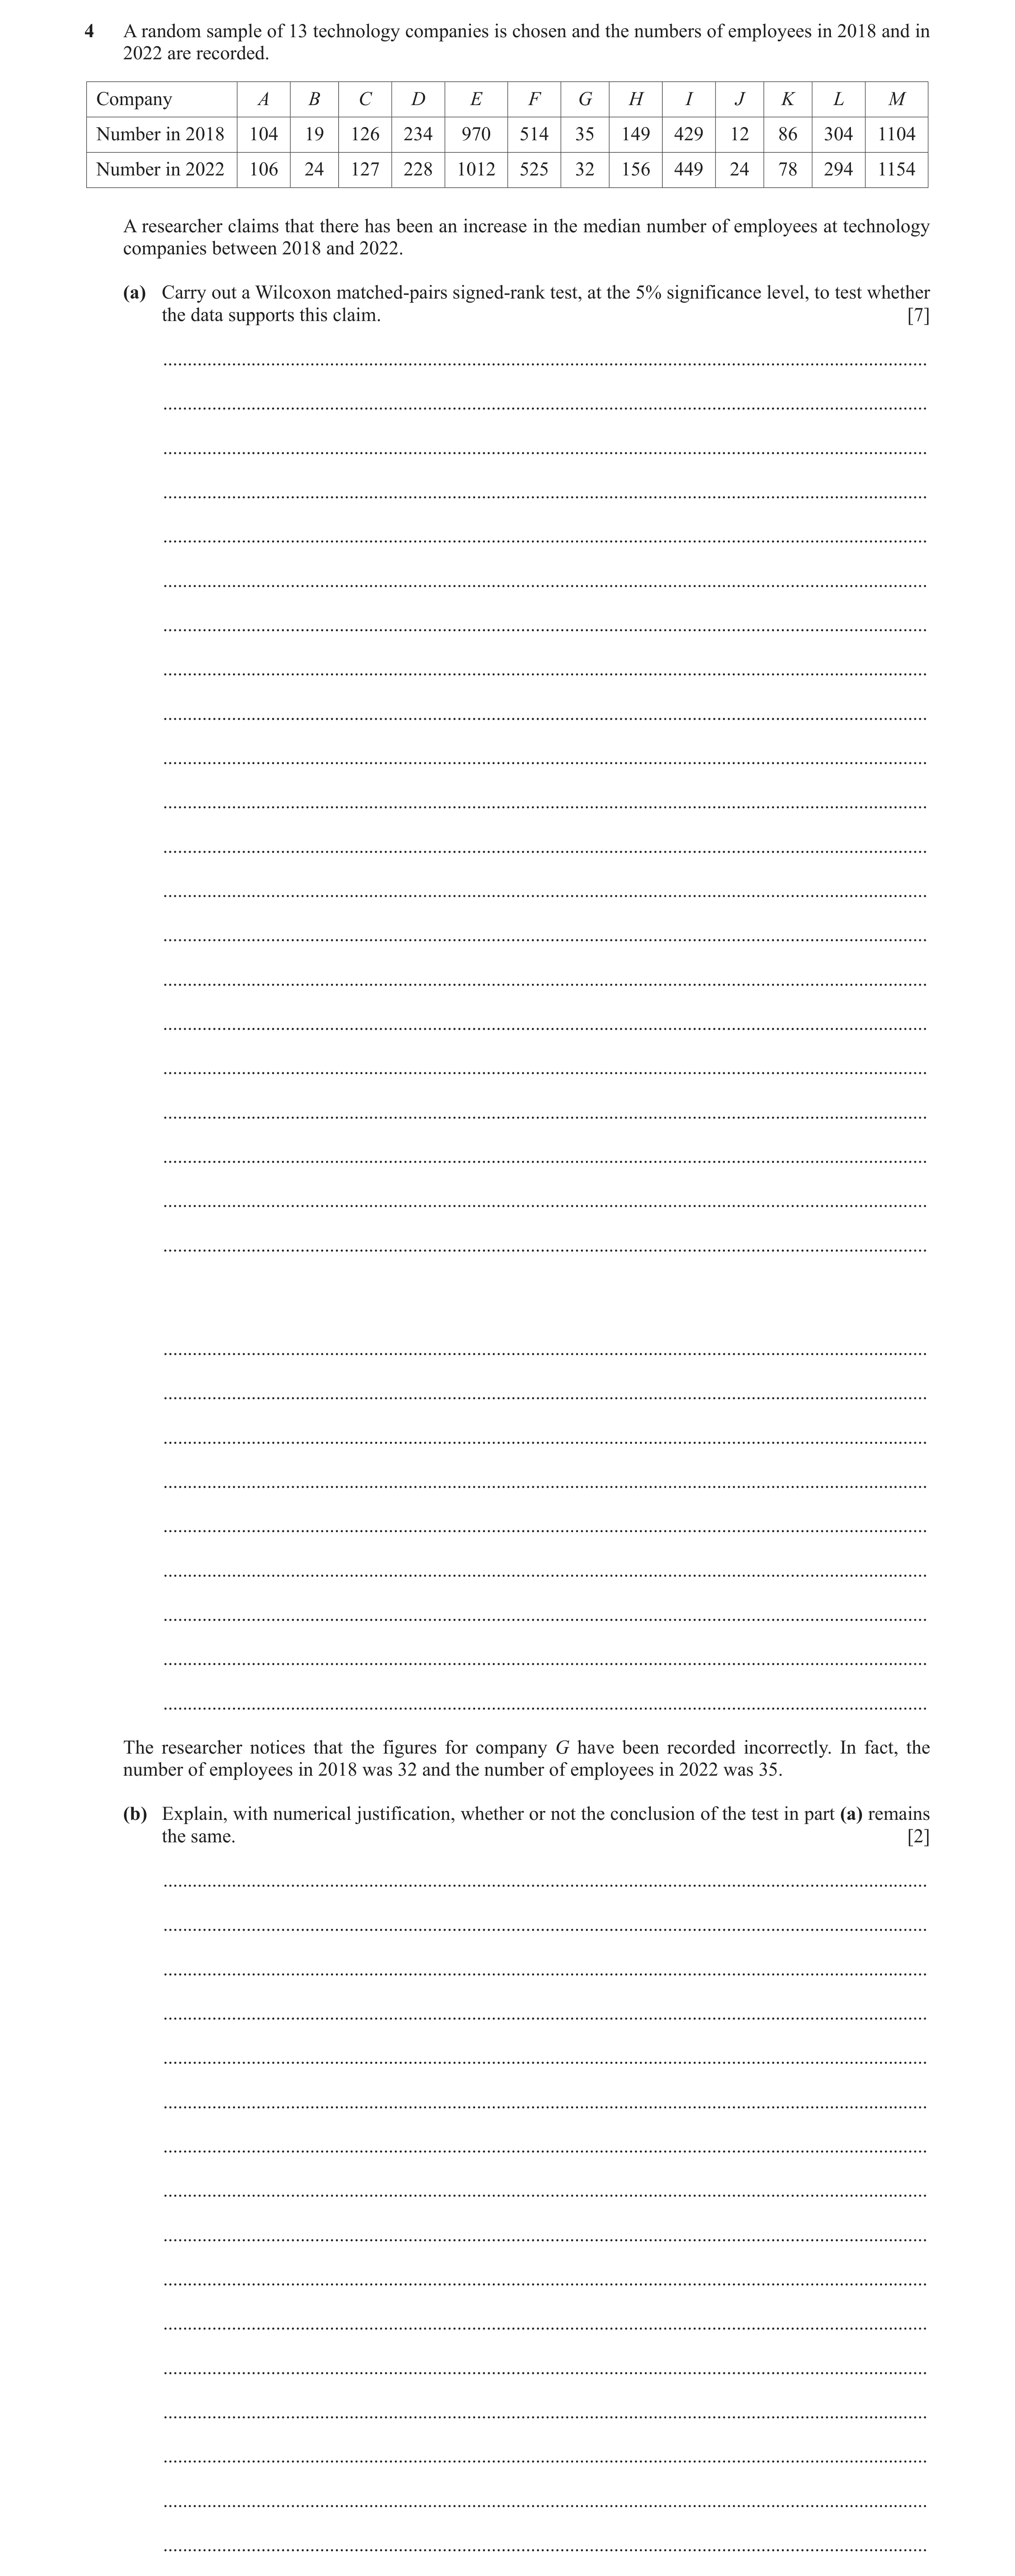
4 A random sample of 13 technology companies is chosen and the numbers of employees in 2018 and in 2022 are recorded. Company A B C D E F G H I J K L M Number in 2018 104 19 126 234 970 514 35 149 429 12 86 304 1104 Number in 2022 106 24 127 228 1012 525 32 156 449 24 78 294 1154 A researcher claims that there has been an increase in the median number of employees at technology companies between 2018 and 2022. (a) Carry out a Wilcoxon matched-pairs signed-rank test, at the 5% significance level, to test whether the data supports this claim. [7] … … … … … … … … … … … … … … … … … … … … … … … … … … … … … … The researcher notices that the figures for company G have been recorded incorrectly. In fact, the number of employees in 2018 was 32 and the number of employees in 2022 was 35. (b) Explain, with numerical justification, whether or not the conclusion of the test in part (a) remains the same. [2] … … … … … … … … … … … … … … … …
9 marks
Mark scheme: 4(a) 2 5 1 –6 42 11 –3 7 20 12 –8 –10 50 2 4 1 –5 12 9 –3 6 11 10 –7 –8 13 M1 Differences (allow up to 3 errors) A1 Correct rank order, ignore signs 68, 23 P Q A1 CWO H0: difference in population medians = 0 H1: population median in 2022 > population median in 2018 B1 ‘Population’ required. Accept use of m, not . Do not accept ‘difference between population medians > 0’ without 2022, 2018 OE specified Critical value 21 B1 ‘23’ > ‘21’ and accept H0 M1 Compare their 23 with their 21 and FT conclusion. Their 23 must be less than 46. Insufficient evidence to support researcher’s belief / insufficient evidence that the (median) number of employees in 2022 is greater than the (median) number of employees in 2018 A1 Correct conclusion in context, following correct work, level of uncertainty in language (not ‘prove’, not ‘there is no evidence’), no contradictions. A0 if hypotheses reversed 7 4(b) Rank for G will now be +3, giving Q = 20 which is < 21 M1 Must include numbers, ft their 21 from part (a) and ft their 20 (23 – 3) Change in conclusion A1 CWO Condone ‘reject H0’ OE. 2
This question in 9231/41 May/June 2023
Q20 · A random sample of 13 technology companies is chosen and the numbers of employees in 2018… 9231/42 May/June 2023
4 A random sample of 13 technology companies is chosen and the numbers of employees in 2018 and in 2022 are recorded. Company A B C D E F G H I J K L M Number in 2018 104 19 126 234 970 514 35 149 429 12 86 304 1104 Number in 2022 106 24 127 228 1012 525 32 156 449 24 78 294 1154 A researcher claims that there has been an increase in the median number of employees at technology companies between 2018 and 2022. (a) Carry out a Wilcoxon matched-pairs signed-rank test, at the 5% significance level, to test whether the data supports this claim. [7] … … … … … … … … … … … … … … … … … … … … … … … … … … … … … … The researcher notices that the figures for company G have been recorded incorrectly. In fact, the number of employees in 2018 was 32 and the number of employees in 2022 was 35. (b) Explain, with numerical justification, whether or not the conclusion of the test in part (a) remains the same. [2] … … … … … … … … … … … … … … … …
9 marks
Mark scheme: 4(a) 2 5 1 –6 42 11 –3 7 20 12 –8 –10 50 2 4 1 –5 12 9 –3 6 11 10 –7 –8 13 M1 Differences (allow up to 3 errors) A1 Correct rank order, ignore signs 68, 23 P Q A1 CWO H0: difference in population medians = 0 H1: population median in 2022 > population median in 2018 B1 ‘Population’ required. Accept use of m, not . Do not accept ‘difference between population medians > 0’ without 2022, 2018 OE specified Critical value 21 B1 ‘23’ > ‘21’ and accept H0 M1 Compare their 23 with their 21 and FT conclusion. Their 23 must be less than 46. Insufficient evidence to support researcher’s belief / insufficient evidence that the (median) number of employees in 2022 is greater than the (median) number of employees in 2018 A1 Correct conclusion in context, following correct work, level of uncertainty in language (not ‘prove’, not ‘there is no evidence’), no contradictions. A0 if hypotheses reversed 7 4(b) Rank for G will now be +3, giving Q = 20 which is < 21 M1 Must include numbers, ft their 21 from part (a) and ft their 20 (23 – 3) Change in conclusion A1 CWO Condone ‘reject H0’ OE. 2
This question in 9231/42 May/June 2023
Q21 · A large number of students took two test papers in mathematics 9231/43 May/June 2023
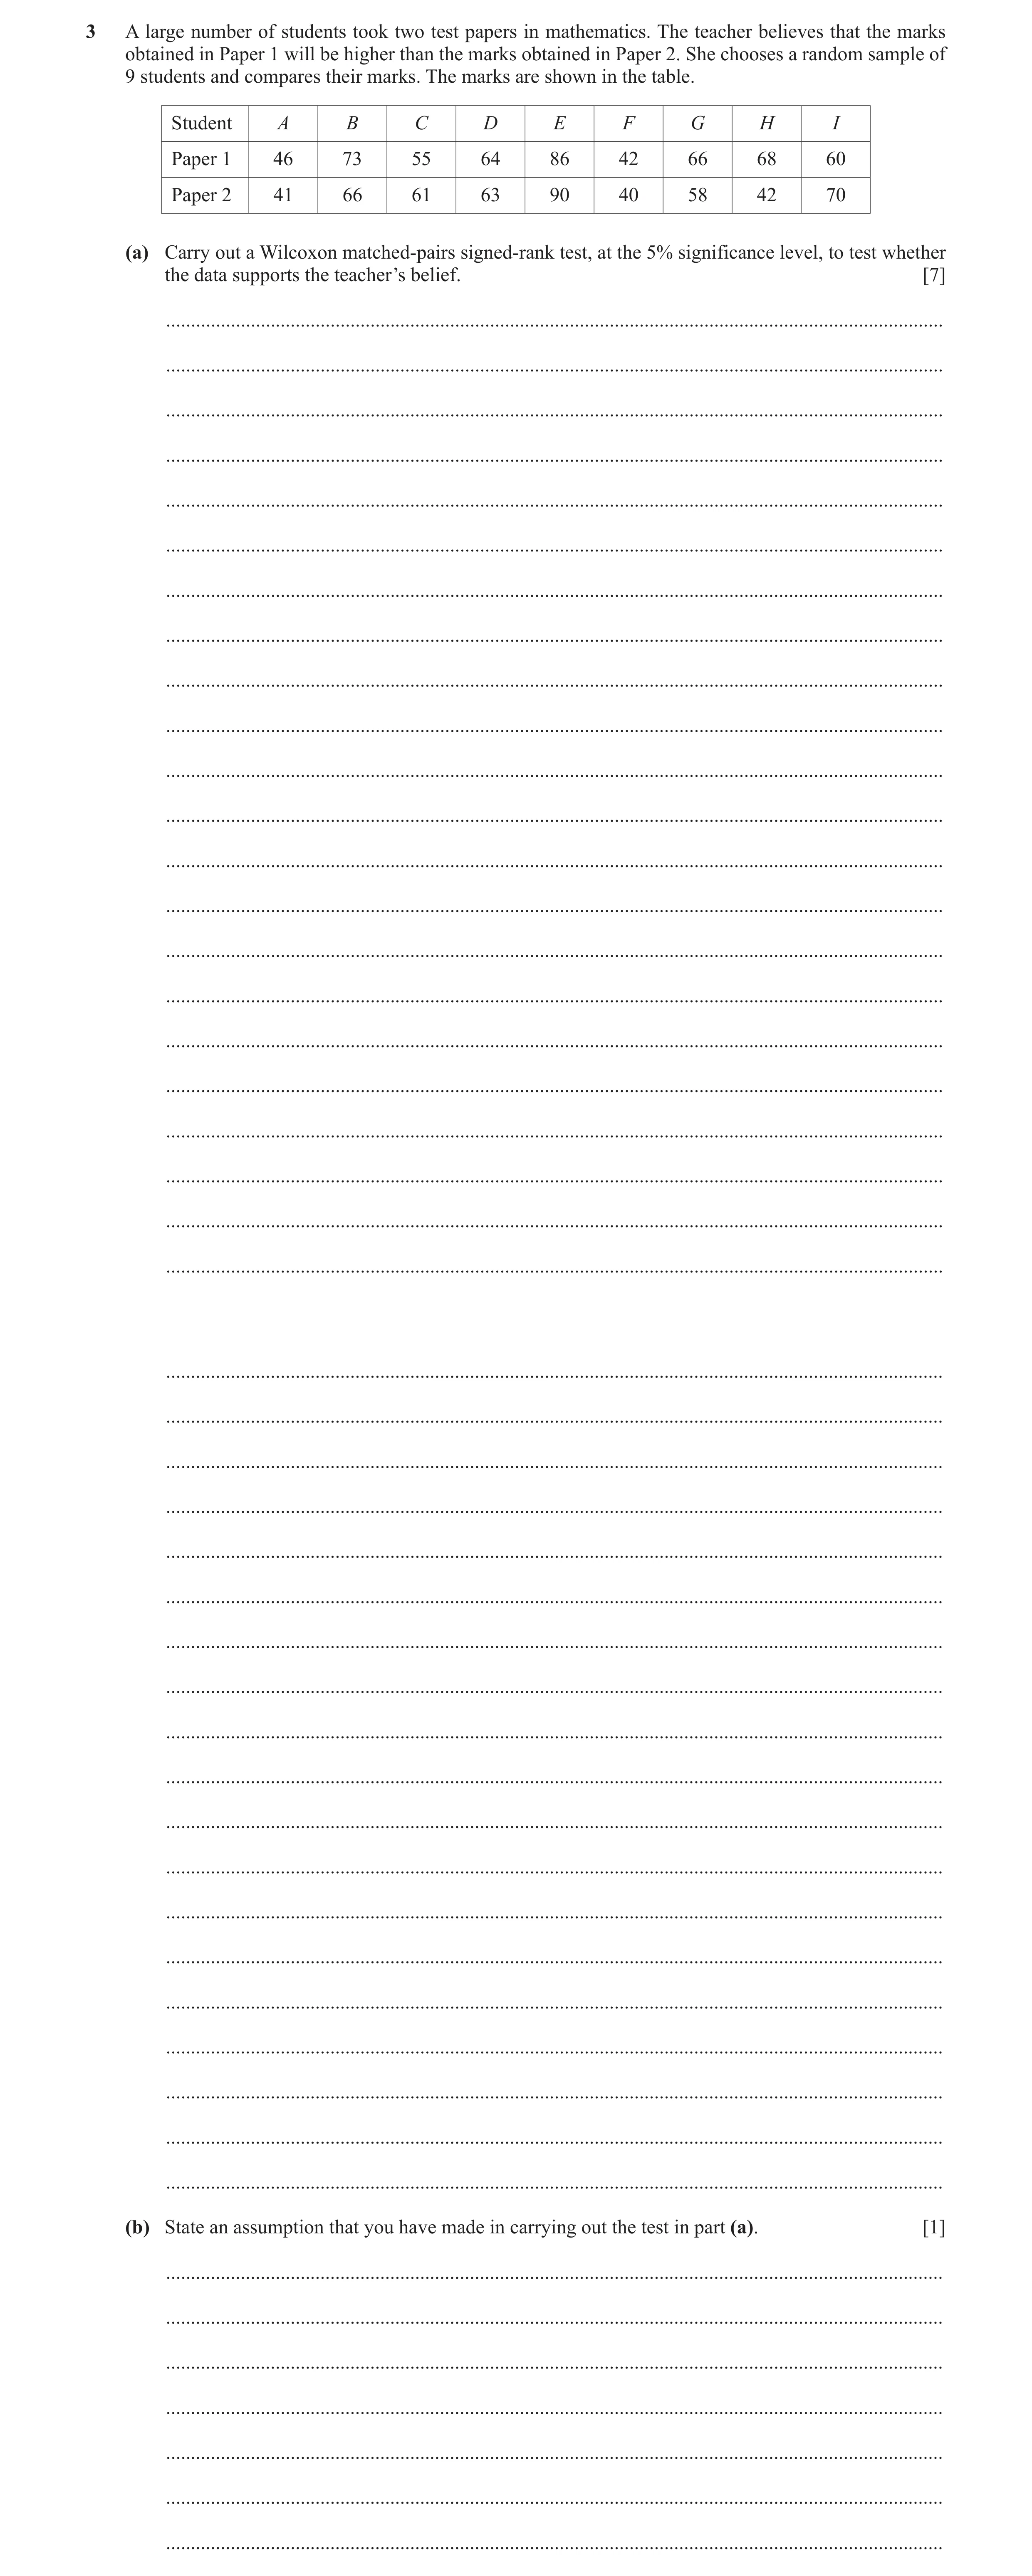
3 A large number of students took two test papers in mathematics. The teacher believes that the marks obtained in Paper 1 will be higher than the marks obtained in Paper 2. She chooses a random sample of 9 students and compares their marks. The marks are shown in the table. Student A B C D E F G H I Paper 1 46 73 55 64 86 42 66 68 60 Paper 2 41 66 61 63 90 40 58 42 70 (a) Carry out a Wilcoxon matched-pairs signed-rank test, at the 5% significance level, to test whether the data supports the teacher’s belief. [7] … … … … … … … … … … … … … … … … … … … … … … … … … … … … … … … … … … … … … … … … … (b) State an assumption that you have made in carrying out the test in part (a). [1] … … … … … … …
8 marks
Mark scheme: 3(a) 5 7 -6 1 –4 2 8 26 –10 4 6 -5 1 –3 2 7 9 –8 M1 Differences, allow at most 2 errors. A1 Correct rank order, ignore signs. [P = 29] Q = 16 A1 Condone P not excluded. H0: population medians equal or 1 2 m m H1: population median X > population median Y or 1 2 m m B1 ‘Population’ required. Accept use of m, not . Do not accept ‘difference between population medians > 0’ without X, Y OE specified. Critical value = 8 B1 16 > 8 and accept Ho / not significant M1 Compare their ‘16’ with their ‘8’ and conclusion. Their ‘16’ must be less than 23. Ignore their hypotheses. Condone ‘reject H1’. Insufficient evidence to support teacher’s belief or insufficient evidence that the marks/median in Paper 1 are/is higher than the marks/median in Paper 2 A1 Correct conclusion in context, following correct work, level of uncertainty in language (not ‘prove’, not ‘there is no evidence’), no contradictions. e.g. Proves that the teacher is incorrect scores A0. A0 if hypotheses wrong way round. 7 3(b) The population differences are symmetrical (about the median difference) B1 Words in bold, or their equivalent, are required. 1
This question in 9231/43 May/June 2023
Q22 · A school is conducting an experiment to see whether the distance that children can throw… 9231/41 Oct/Nov 2023
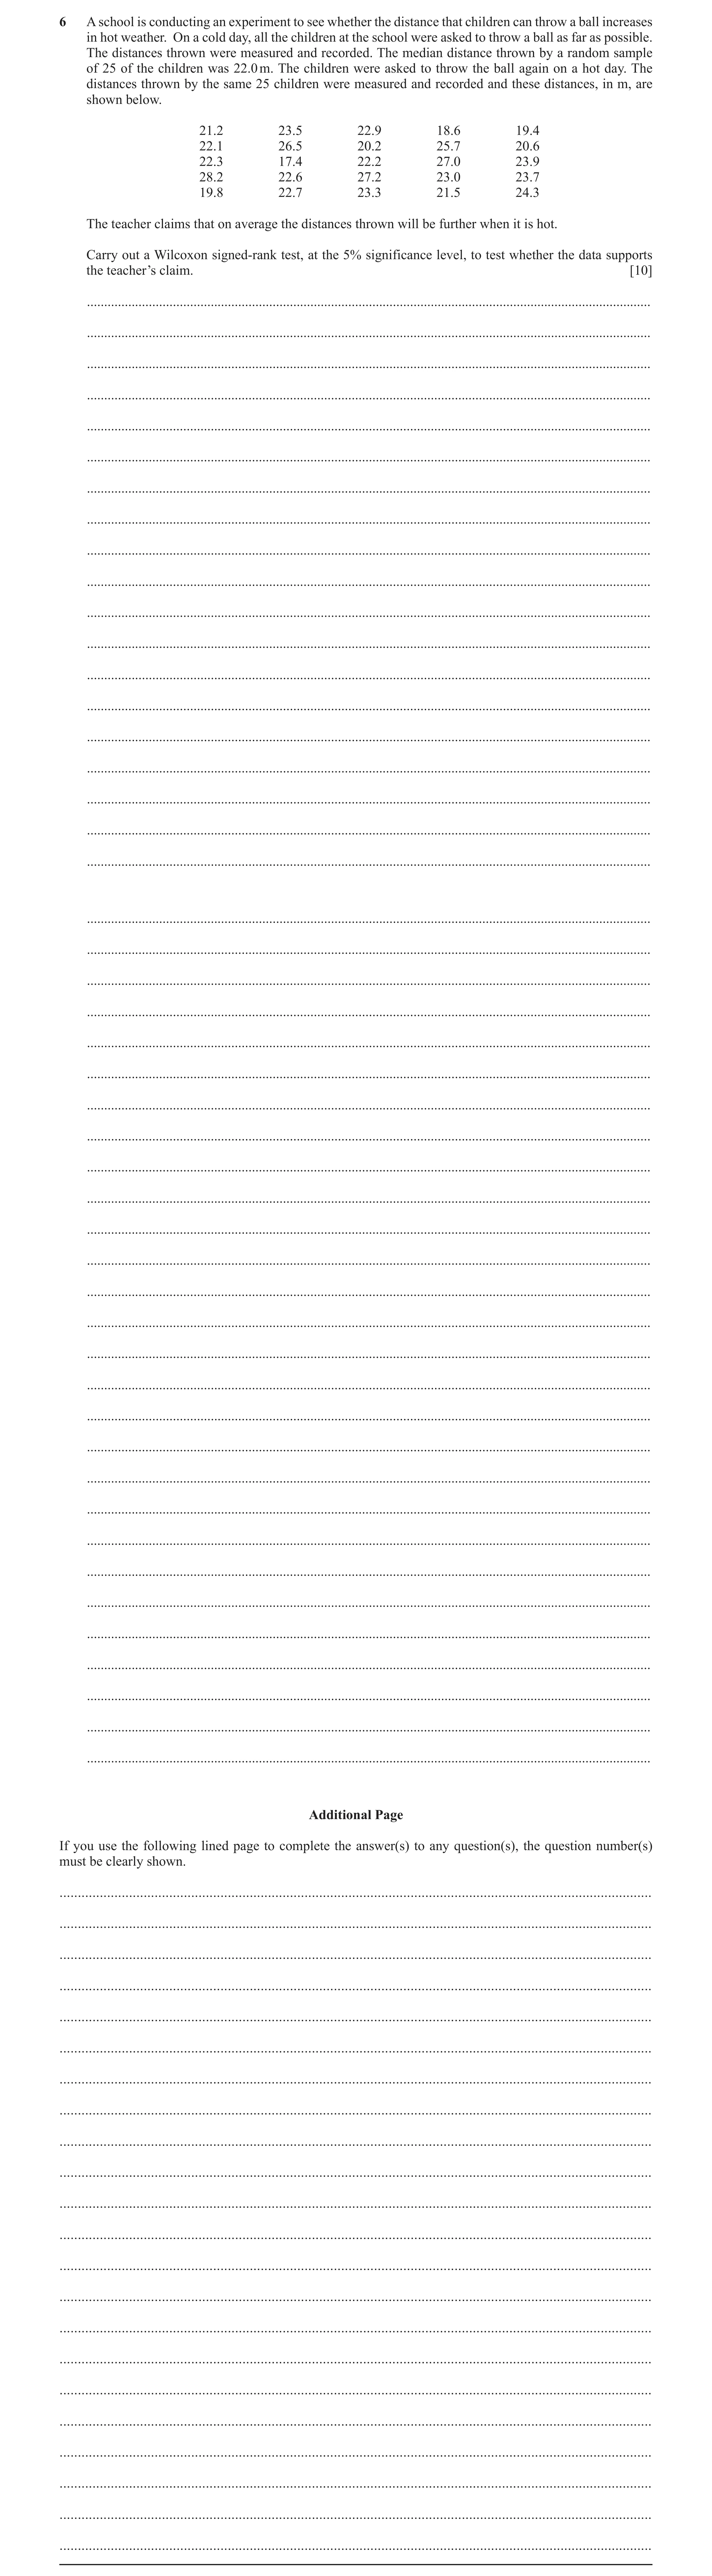
6 A school is conducting an experiment to see whether the distance that children can throw a ball increases in hot weather. On a cold day, all the children at the school were asked to throw a ball as far as possible. The distances thrown were measured and recorded. The median distance thrown by a random sample of 25 of the children was 22.0 m. The children were asked to throw the ball again on a hot day. The distances thrown by the same 25 children were measured and recorded and these distances, in m, are shown below. 21.2 23.5 22.9 18.6 19.4 22.1 26.5 20.2 25.7 20.6 22.3 17.4 22.2 27.0 23.9 28.2 22.6 27.2 23.0 23.7 19.8 22.7 23.3 21.5 24.3 The teacher claims that on average the distances thrown will be further when it is hot. Carry out a Wilcoxon signed-rank test, at the 5% significance level, to test whether the data supports the teacher’s claim. [10] … … … … … … … … … … … … … … … … … … … … … … … … … … … … … … … … … … … … … … … … … … … … … … … Additional Page If you use the following lined page to complete the answer(s) to any question(s), the question number(s) must be clearly shown. … … … … … … … … … … … … … … … … … … … … … …
10 marks
Mark scheme: 6 H0: population medians are equal B1 Do not accept ‘differences between population medians < H1: population median after > population median before 0’ unless difference defined. Allow H 0 : m = 22, H1 : m 22.0 M1 Signed differences, allow at most 4 errors –0.8 -7 1.5 12 0.9 8 –3.4 –19 –2.6 –18 0.1 1 4.5 21 –1.8 –14 3.7 20 –1.4 –11 M1 Attempt at ranks (ignore signs). 0.3 3 –4.6 –22 0.2 2 5 23 1.9 15 6.2 25 0.6 5 5.2 24 1 9 1.7 13 –2.2 -16 0.7 6 1.3 10 –0.5 –4 2.3 17 (W+ = 214) W− = 111 A1 Cao identified, or used, as test statistic. 1 1 B1 Normal: mean = n ( n + 1) = 25 26 = 162.5 4 4 1 1 B1 Variance = n ( n + 1)( 2n + 1) = 25 26 51 = 1381.25 24 24 111.5 − 162.5 M1 Allow missing or incorrect continuity correction. z- value: Their 111 must come from ranks. 1381.25 −1.37 A1 CAO Tabular value is −1.645 : ‘ −1.37' −1.645 , or 0.915<0.95 oe, accept H0, M1 Consistent signs. Allow ‘not significant’. Insufficient evidence to support the teacher’s claim A1 All correct. Correct conclusion in context, following Insufficient evidence to suggest that the distances thrown are further when it correct work, level of uncertainty in language. is hot A0 if hypotheses wrong way round or missing 10
This question in 9231/41 Oct/Nov 2023
Q23 · A company is deciding which of two machines, X and Y, can make a certain type of… 9231/42 Oct/Nov 2023
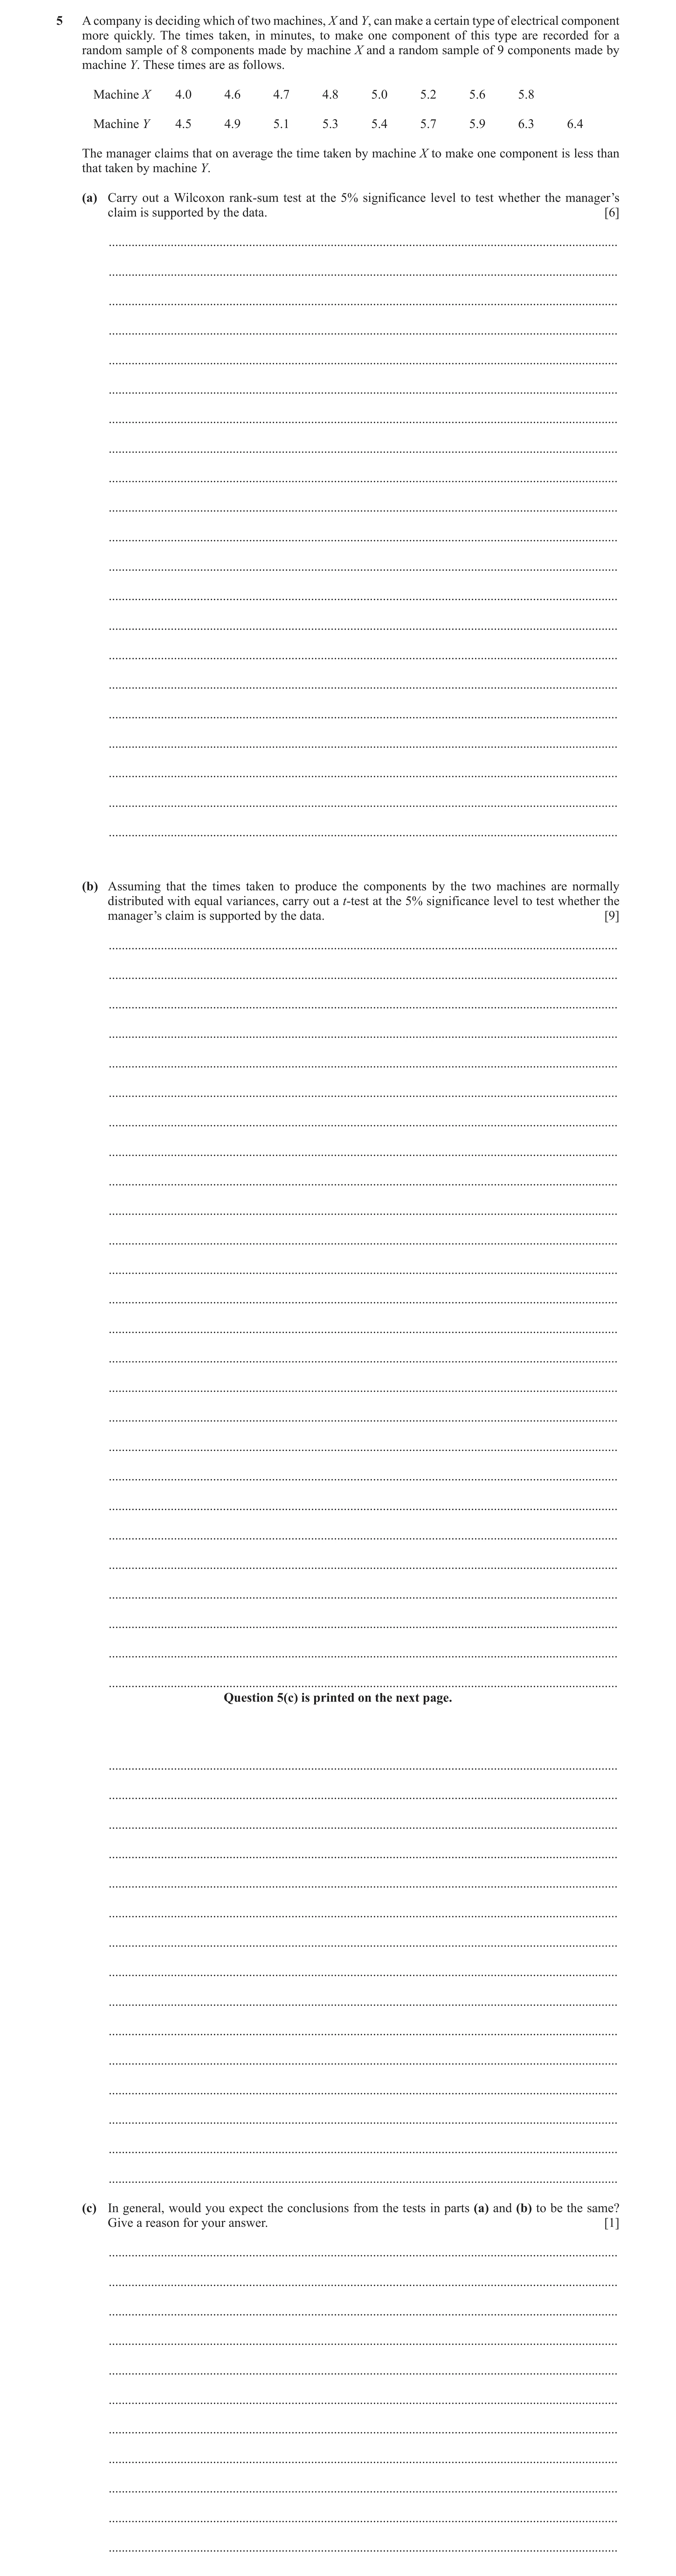
5 A company is deciding which of two machines, X and Y, can make a certain type of electrical component more quickly. The times taken, in minutes, to make one component of this type are recorded for a random sample of 8 components made by machine X and a random sample of 9 components made by machine Y. These times are as follows. Machine X 4.0 4.6 4.7 4.8 5.0 5.2 5.6 5.8 Machine Y 4.5 4.9 5.1 5.3 5.4 5.7 5.9 6.3 6.4 The manager claims that on average the time taken by machine X to make one component is less than that taken by machine Y. (a) Carry out a Wilcoxon rank‑sum test at the 5% significance level to test whether the manager’s claim is supported by the data. [6] … … … … … … … … … … … … … … … … … … … … … (b) Assuming that the times taken to produce the components by the two machines are normally distributed with equal variances, carry out a t‑test at the 5% significance level to test whether the manager’s claim is supported by the data. [9] … … … … … … … … … … … … … … … … … … … … … … … … … … Question 5(c) is printed on the next page. … … … … … … … … … … … … … … … (c) In general, would you expect the conclusions from the tests in parts (a) and (b) to be the same? Give a reason for your answer. [1] … … … … … … … … … … …
16 marks
Mark scheme: 5(a) H0: population medians are equal or mx = my B1 Do not accept ‘difference between population H1: population median for X < population median for Y or mx < my medians < 0’ without X or Y oe specified. M1 Rankings, allow at most 3 errors. X Y 4.0 1 4.5 2 4.6 3 4.9 6 4.7 4 5.1 8 4.8 5 5.3 10 5.0 7 5.4 11 5.2 9 5.7 13 5.6 12 5.9 15 5.8 14 6.3 16 6.4 17 Sum: 55 98 Test statistic = 55 A1 Tabular value for m = 8, n = 9 is 54 B1 ‘55’ > ‘54’, accept H0 /not significant M1 Ft their ‘55’ Must come from ranks. Ft their ‘54’, must come from table. Insufficient evidence to support manager’s claim. A1 Correct conclusion in context, following correct Insufficient evidence to suggest that the median time of machine X is less than the work, level of uncertainty in language. median time of machine Y. A0 if hypotheses the wrong way round or missing. 6 5(b) H0: 𝜇𝑥= 𝜇𝑦 H1: 𝜇𝑥< 𝜇𝑦 B1 x = 39.7 x 2 = 199.33 y = 49.5 y 2 = 275.47 B1 2 1 39.7 2 xs = 199.33 − = 0.33125 7 8 2 1 49.5 2 B1 ys = 275.47 − = 0.4025 8 9 2 7 0.33125 + 8 0.4025 M1 Pooled variance s = 8 + 9 − 2 0.36925 A1 39.7 − 49.5 M1 t = 8 9 s 1 + 1 8 9 t = −1.82 A1 Tabular value = 1.753: 1.82 > 1.753 M1 Reject H0, sufficient evidence that mean for machine X is less than mean for machine A1 CWO Y. Correct conclusion in context, following correct work, level of uncertainty in language. 9 5(c) t-test is assuming a normal distribution, and with equal variances. This may not be B1 Not specific to data in question. true. So, no reason to expect results to be the same. Mention of normal distribution is not enough. Outliers affect part (b) but not part (a). 1
This question in 9231/42 Oct/Nov 2023
Q24 · A school is conducting an experiment to see whether the distance that children can throw… 9231/43 Oct/Nov 2023
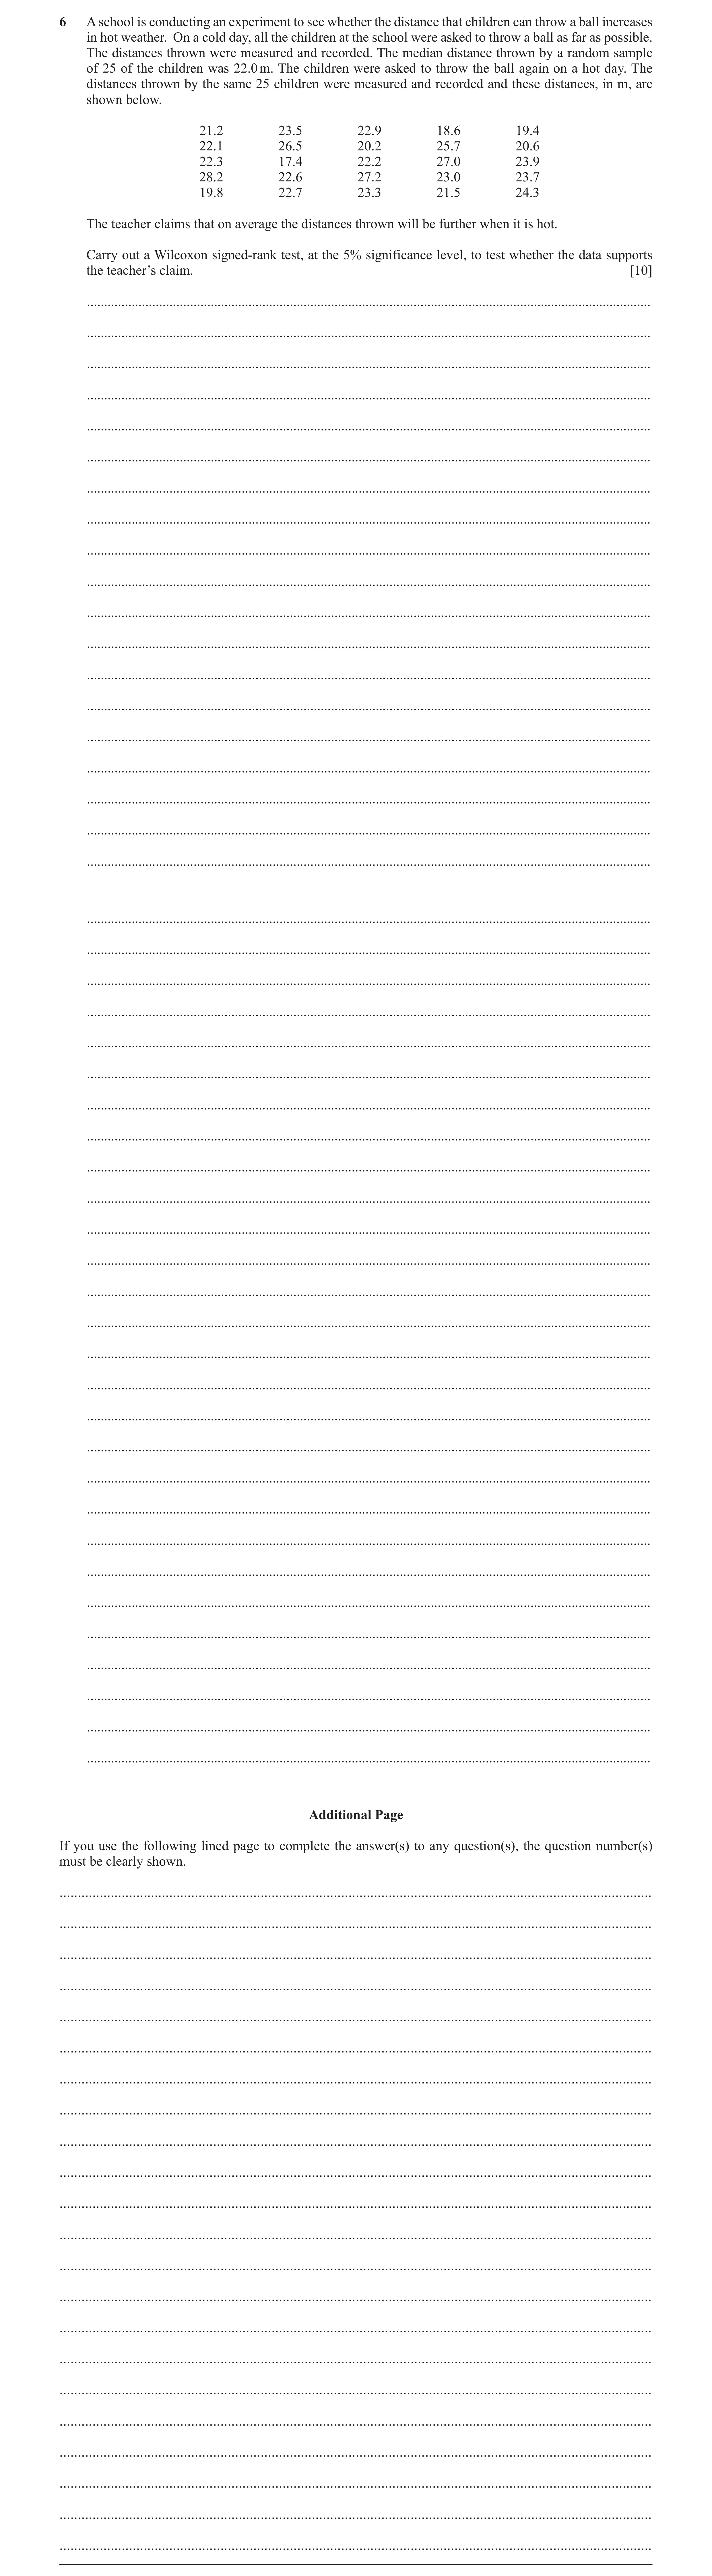
6 A school is conducting an experiment to see whether the distance that children can throw a ball increases in hot weather. On a cold day, all the children at the school were asked to throw a ball as far as possible. The distances thrown were measured and recorded. The median distance thrown by a random sample of 25 of the children was 22.0 m. The children were asked to throw the ball again on a hot day. The distances thrown by the same 25 children were measured and recorded and these distances, in m, are shown below. 21.2 23.5 22.9 18.6 19.4 22.1 26.5 20.2 25.7 20.6 22.3 17.4 22.2 27.0 23.9 28.2 22.6 27.2 23.0 23.7 19.8 22.7 23.3 21.5 24.3 The teacher claims that on average the distances thrown will be further when it is hot. Carry out a Wilcoxon signed-rank test, at the 5% significance level, to test whether the data supports the teacher’s claim. [10] … … … … … … … … … … … … … … … … … … … … … … … … … … … … … … … … … … … … … … … … … … … … … … … Additional Page If you use the following lined page to complete the answer(s) to any question(s), the question number(s) must be clearly shown. … … … … … … … … … … … … … … … … … … … … … …
10 marks
Mark scheme: 6 H0: population medians are equal B1 Do not accept ‘differences between population medians < H1: population median after > population median before 0’ unless difference defined. Allow H 0 : m = 22, H1 : m 22.0 M1 Signed differences, allow at most 4 errors –0.8 -7 1.5 12 0.9 8 –3.4 –19 –2.6 –18 0.1 1 4.5 21 –1.8 –14 3.7 20 –1.4 –11 M1 Attempt at ranks (ignore signs). 0.3 3 –4.6 –22 0.2 2 5 23 1.9 15 6.2 25 0.6 5 5.2 24 1 9 1.7 13 –2.2 -16 0.7 6 1.3 10 –0.5 –4 2.3 17 (W+ = 214) W− = 111 A1 Cao identified, or used, as test statistic. 1 1 B1 Normal: mean = n ( n + 1) = 25 26 = 162.5 4 4 1 1 B1 Variance = n ( n + 1)( 2n + 1) = 25 26 51 = 1381.25 24 24 111.5 − 162.5 M1 Allow missing or incorrect continuity correction. z- value: Their 111 must come from ranks. 1381.25 −1.37 A1 CAO Tabular value is −1.645 : ‘ −1.37' −1.645 , or 0.915<0.95 oe, accept H0, M1 Consistent signs. Allow ‘not significant’. Insufficient evidence to support the teacher’s claim A1 All correct. Correct conclusion in context, following Insufficient evidence to suggest that the distances thrown are further when it correct work, level of uncertainty in language. is hot A0 if hypotheses wrong way round or missing 10
This question in 9231/43 Oct/Nov 2023
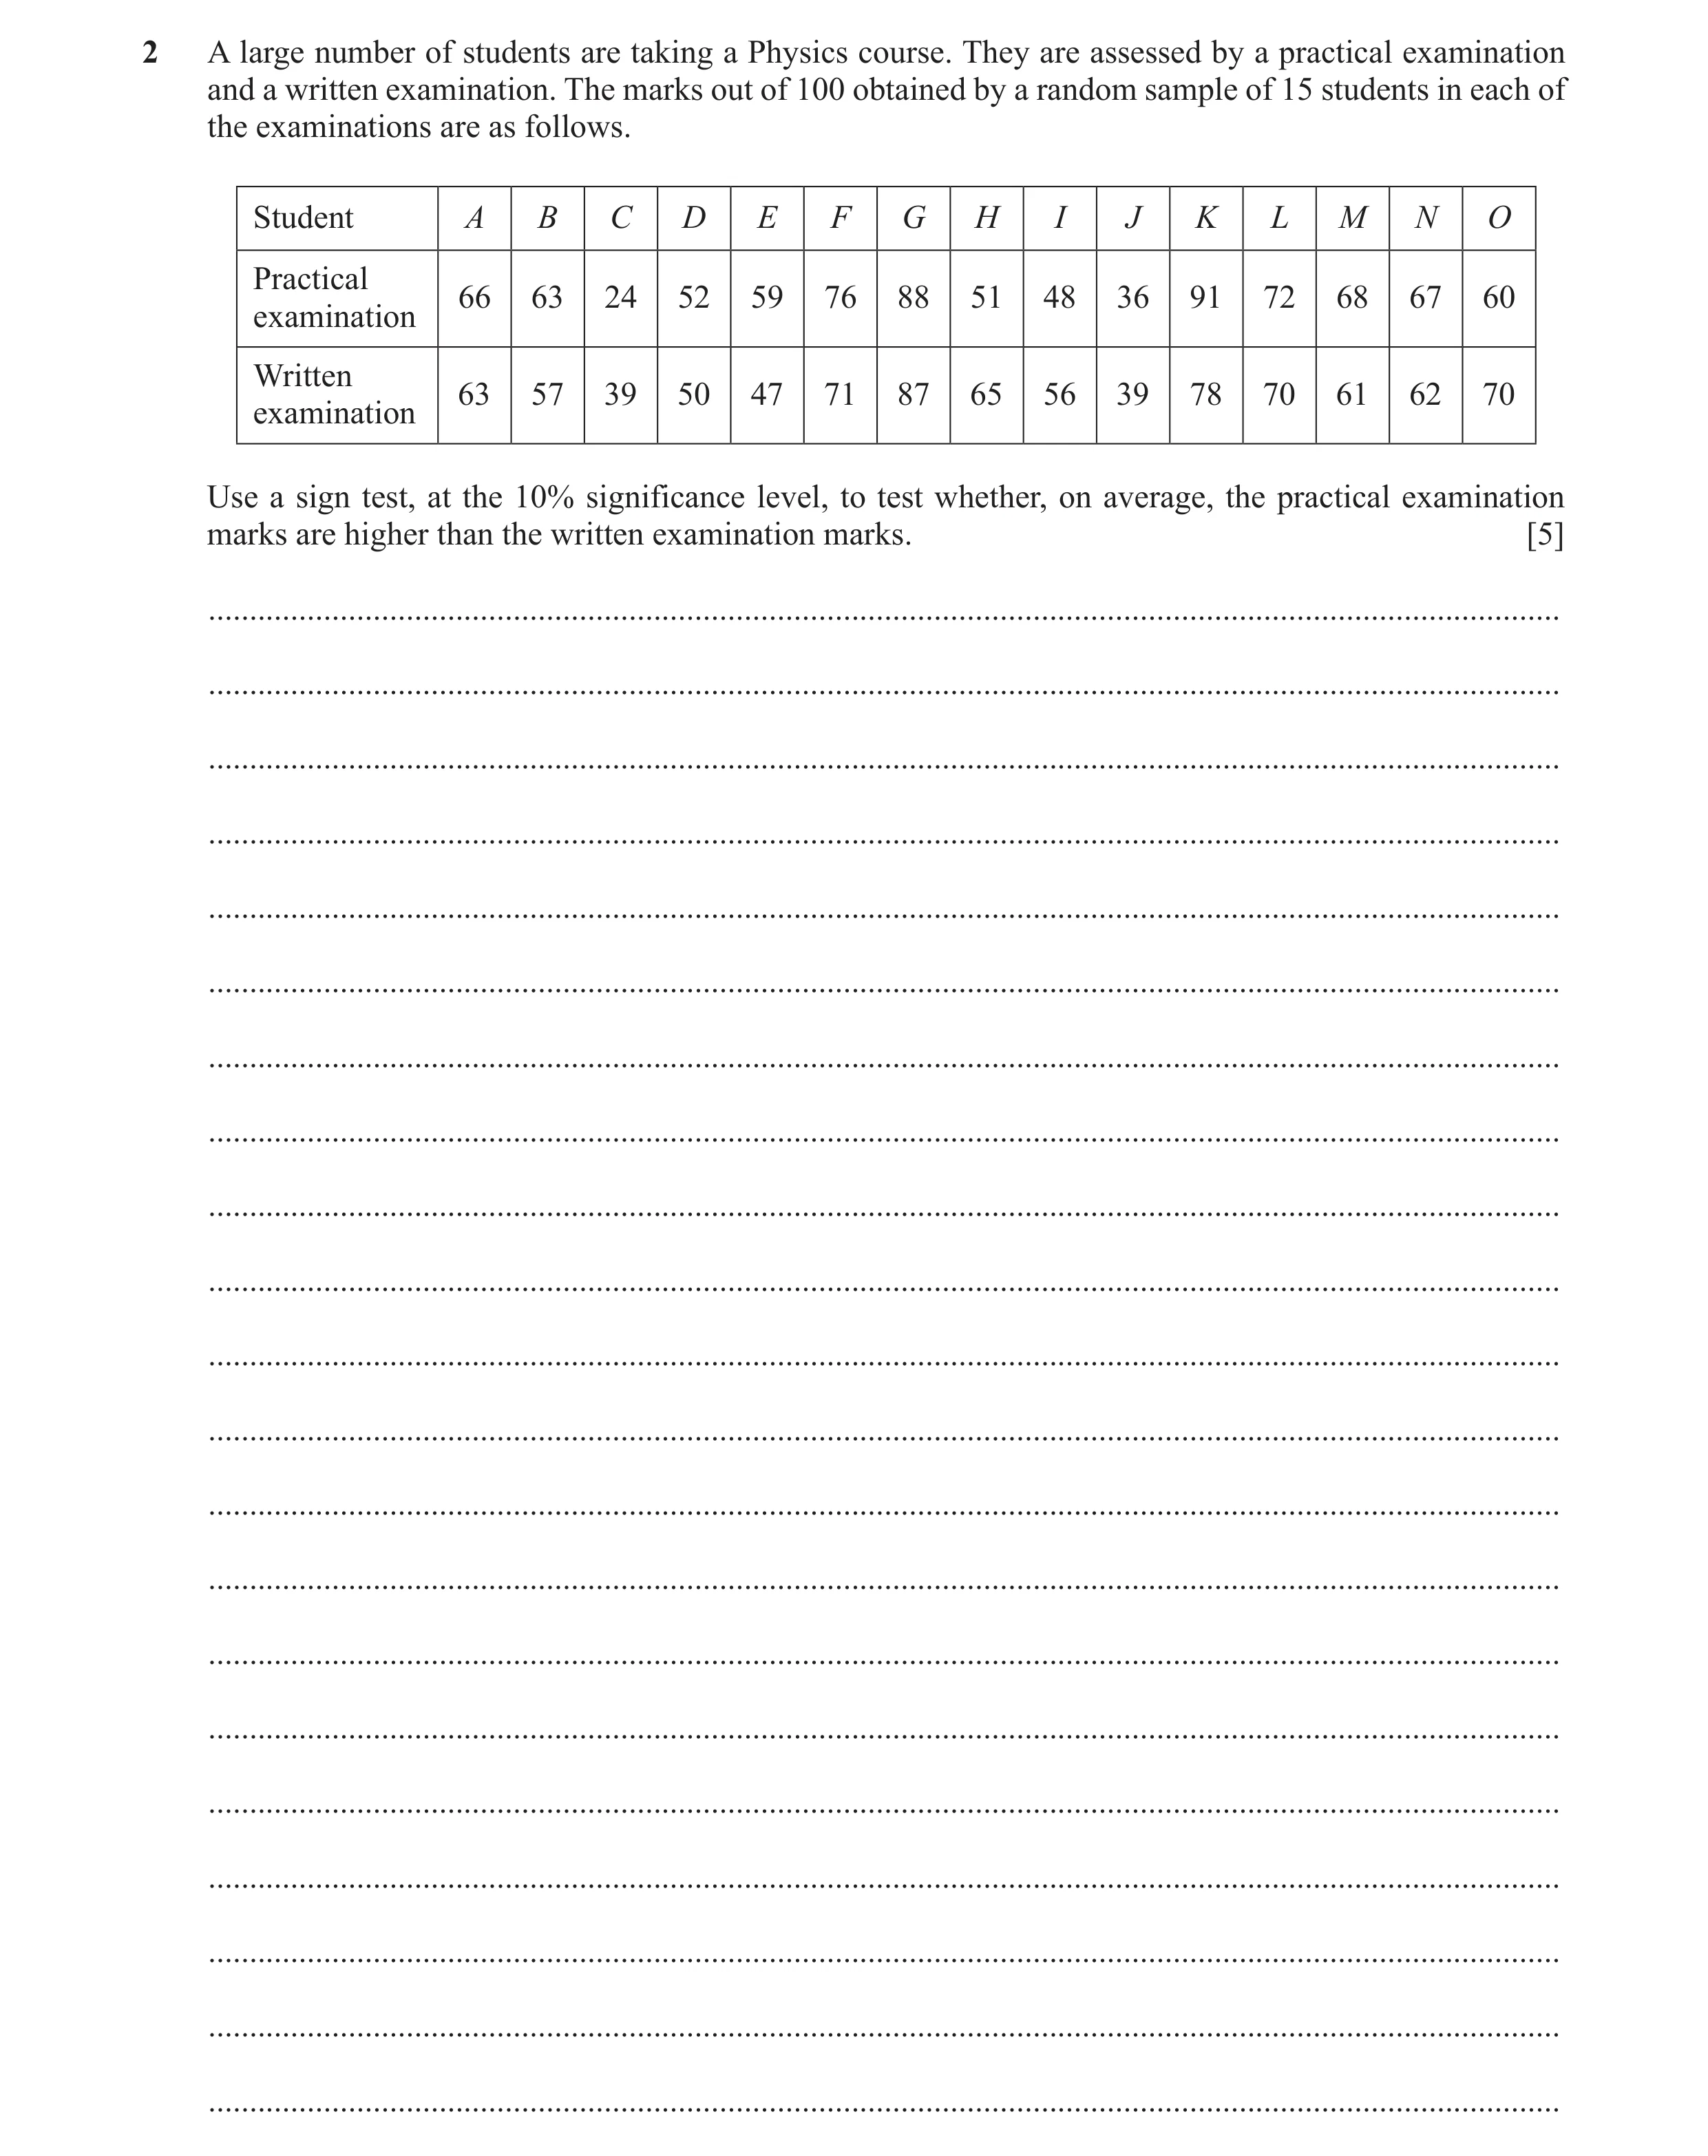
Q25 · A large number of students are taking a Physics course 9231/41 May/June 2024
2 A large number of students are taking a Physics course. They are assessed by a practical examination and a written examination. The marks out of 100 obtained by a random sample of 15 students in each of the examinations are as follows. Student A B C D E F G H I J K L M N O Practical 66 63 24 52 59 76 88 51 48 36 91 72 68 67 60 examination Written 63 57 39 50 47 71 87 65 56 39 78 70 61 62 70 examination Use a sign test, at the 10% significance level, to test whether, on average, the practical examination marks are higher than the written examination marks. [5] … … … … … … … … … … … … … … … … … … … … …
5 marks
Mark scheme: 2 H0: practical results and written results are equal H1: practical results are greater than written results B1 Or H0 : 0 P W m m , H1 : 0 P W m m , oe (m is population median). There are 10 + signs; B(15, 0.5) soi M1 (P( 10) 1 P 9 X X =) 1 – 0.849 = 0.151 A1 P(X ⩽ 5) = 0.151 (implies M1) Compare with 0.1: ‘0.151’ > 0.1 accept H0 M1 ‘0.151’ must come from a valid binomial calculation Correct ft conclusion for their 0.151 and 0.1 Condone Reject H1 ‘Accept H0’ can be implied by a conclusion that is consistent with their 0.151 and 0.1 Insufficient evidence to suggest that practical results are greater than written results A1 Correct work only, ignoring their hypotheses, conclusion in context with level of uncertainty in language. Not ‘prove’. Condone ‘no sufficient’ ‘not enough’. Do not accept statements such as ‘there is sufficient evidence to suggest…..’. 5
This question in 9231/41 May/June 2024
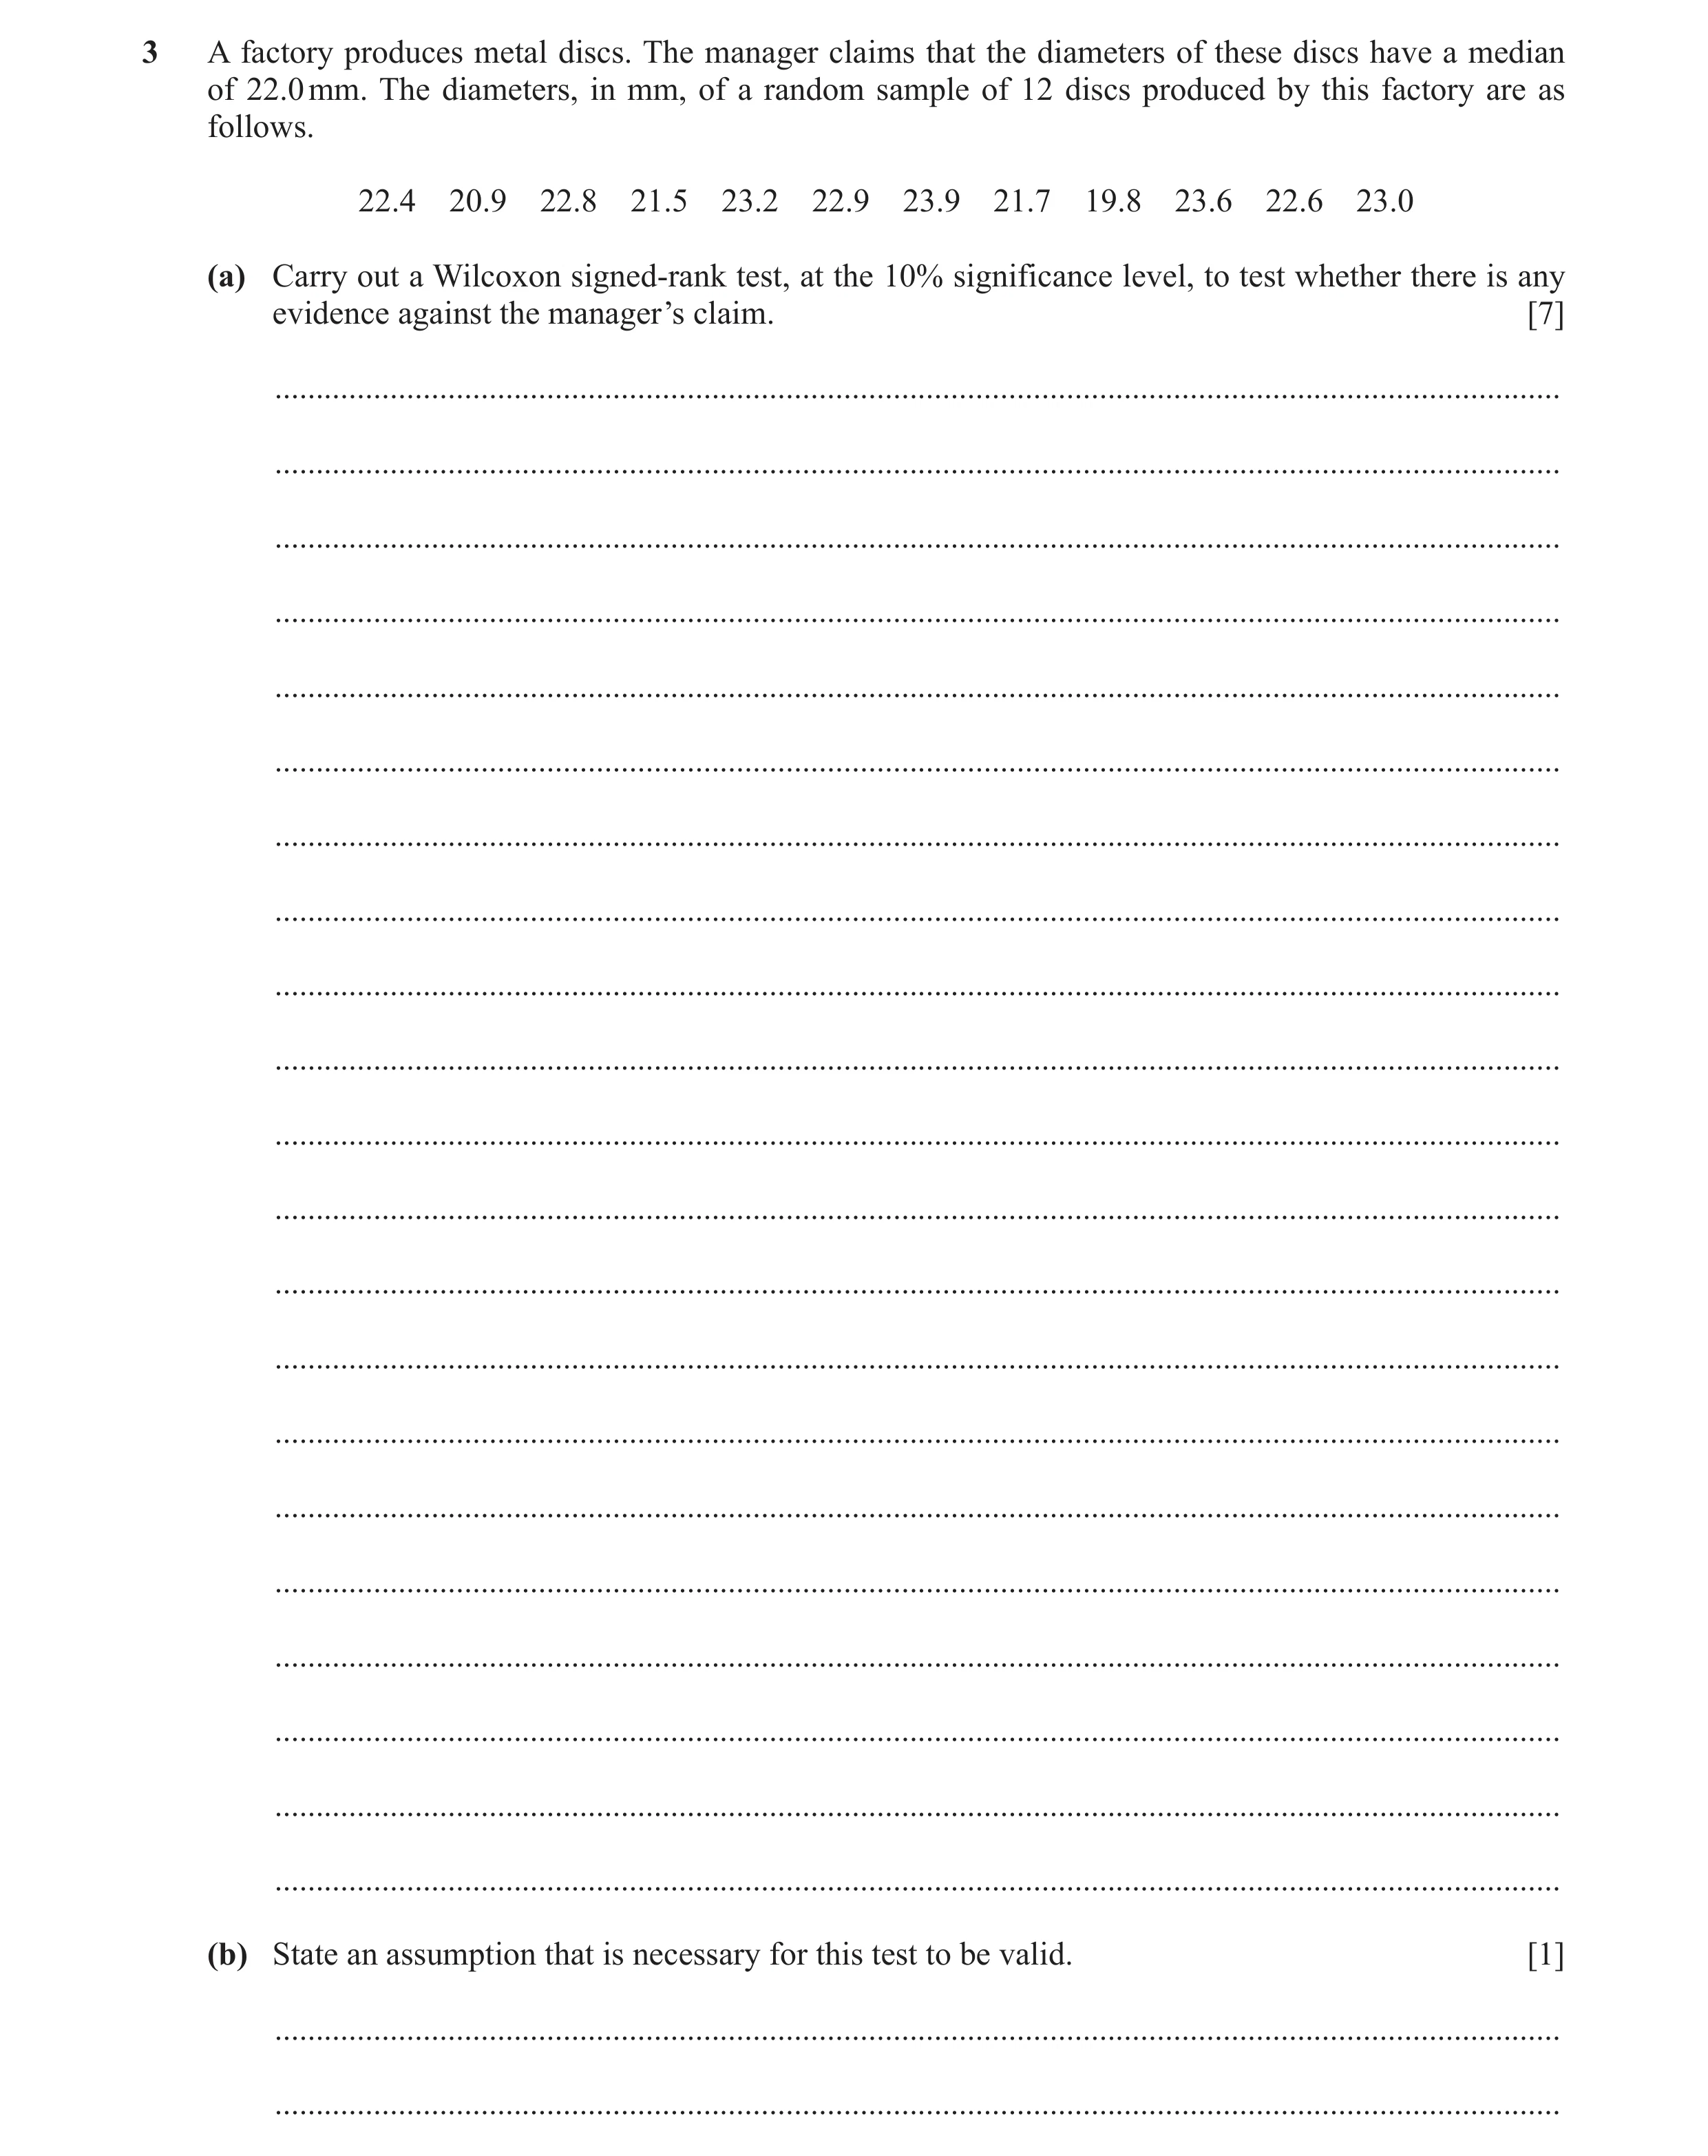
Q26 · A factory produces metal discs 9231/41 May/June 2024
3 A factory produces metal discs. The manager claims that the diameters of these discs have a median of 22.0 mm. The diameters, in mm, of a random sample of 12 discs produced by this factory are as follows. 22.4 20.9 22.8 21.5 23.2 22.9 23.9 21.7 19.8 23.6 22.6 23.0 (a) Carry out a Wilcoxon signed-rank test, at the 10% significance level, to test whether there is any evidence against the manager’s claim. [7] … … … … … … … … … … … … … … … … … … … … … (b) State an assumption that is necessary for this test to be valid. [1] … …
8 marks
Mark scheme: 3(a) Signed differences 0.4 1.1 0.8 0.5 1 .2 0.9 1 .9 0.3 2.2 1 .6 0.6 1 .0 Ranks: 2 8 5 3 9 6 1 1 1 12 1 0 4 7 M1 Attempt at ranking. (P+ = 54) P- = 24 A1 All ranks must be correct. H0: population median = 22.0 H1: population median 22.0 B1 Accept m used as ‘population median’ Critical value from table = 17 B1 ‘24’ > ‘17’ Accept H0 M1 ‘24’ must come from a ranking of signed differences, ‘17’ must be critical value from tables (7, 9, 10, 13, 17 or 21). Correct ft conclusion for their 24 and their 17. Condone Reject H1. ‘Accept H0’ can be implied by a conclusion that is consistent with their 24 and their 17. Insufficient evidence to support (population) median not being 22.0 Insufficient evidence against the manager’s claim A1 Correct work only, ignoring their hypotheses, conclusion in context with level of uncertainty in language. Not ‘prove’. Condone ‘no sufficient’ ‘not enough’. Do not accept statements such as ‘there is sufficient evidence to suggest…..’. 7 Question Answer Marks Guidance 3(b) Distribution is symmetric about the population median Underlying/population distribution is symmetric about the median B1 Need to see population or underlying distribution mentioned. Underlying distribution is symmetric B0. Population distribution is symmetric B0. ‘data’ implies B0 but condone ‘population data’ ‘mean’ implies B0. 1 Question Answer Marks Guidance G’Y (t) =
This question in 9231/41 May/June 2024
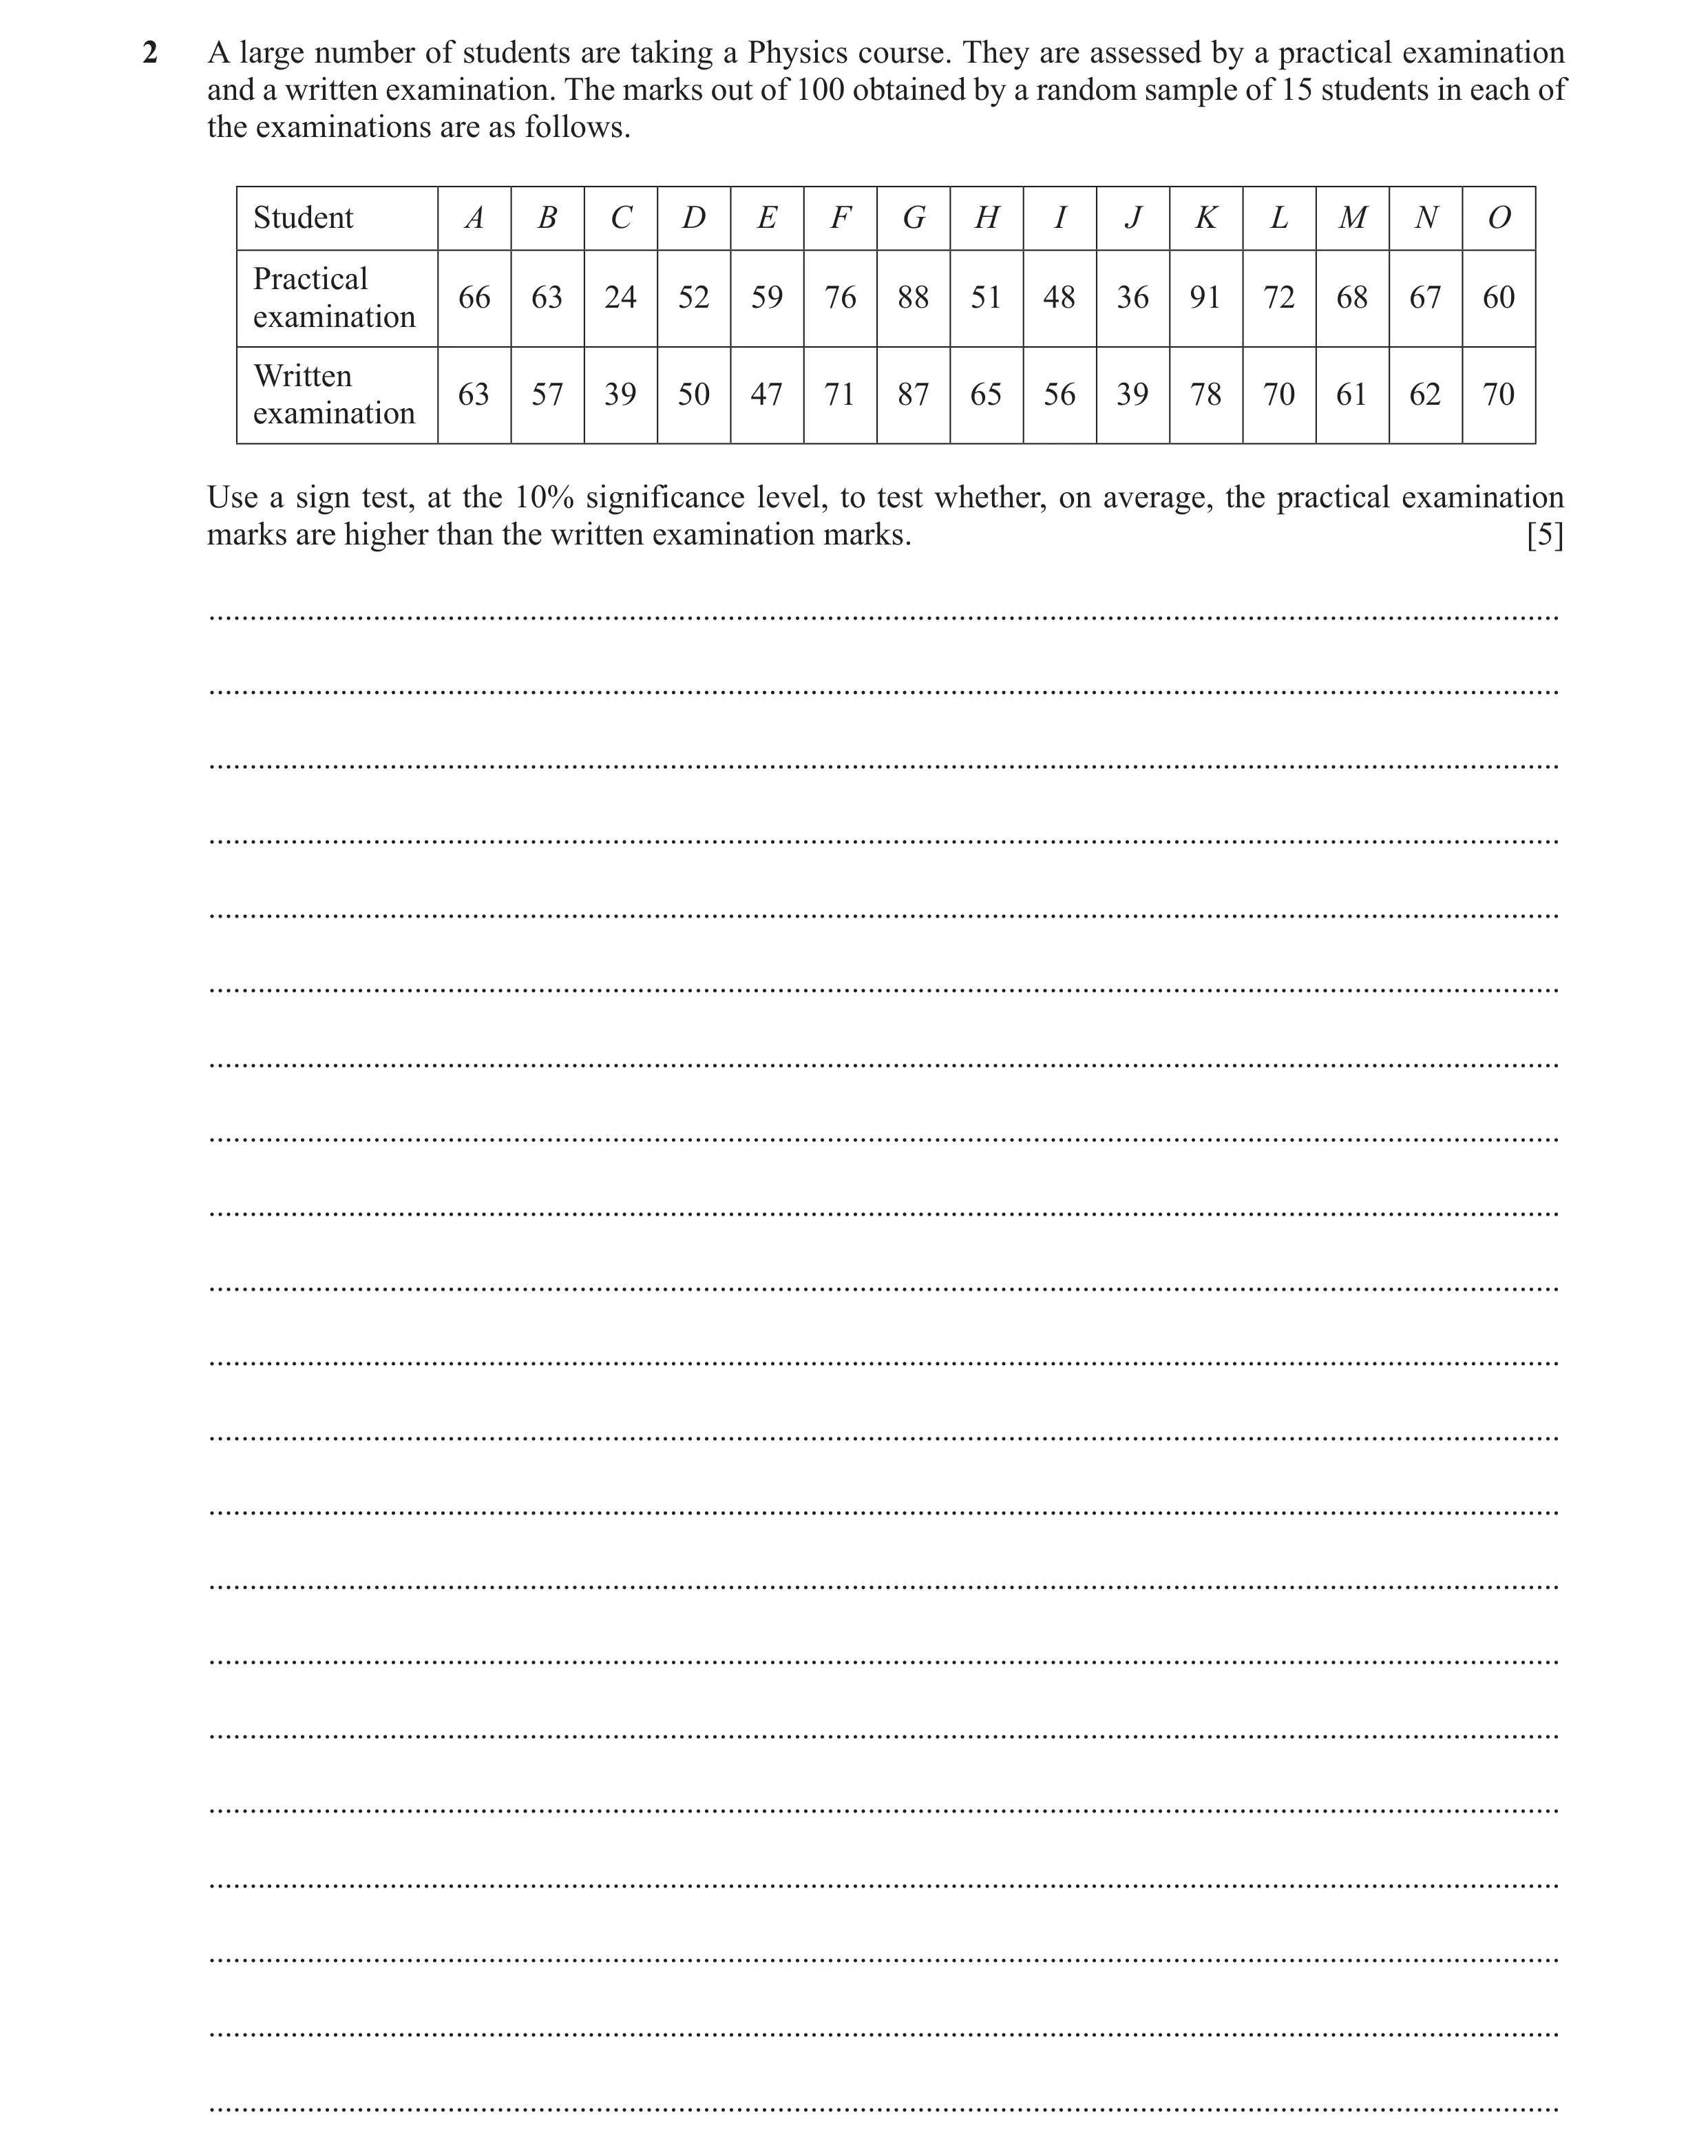
Q27 · A large number of students are taking a Physics course 9231/42 May/June 2024
2 A large number of students are taking a Physics course. They are assessed by a practical examination and a written examination. The marks out of 100 obtained by a random sample of 15 students in each of the examinations are as follows. Student A B C D E F G H I J K L M N O Practical 66 63 24 52 59 76 88 51 48 36 91 72 68 67 60 examination Written 63 57 39 50 47 71 87 65 56 39 78 70 61 62 70 examination Use a sign test, at the 10% significance level, to test whether, on average, the practical examination marks are higher than the written examination marks. [5] … … … … … … … … … … … … … … … … … … … … …
5 marks
Mark scheme: 2 H0: practical results and written results are equal H1: practical results are greater than written results B1 Or H0 : 0 P W m m , H1 : 0 P W m m , oe (m is population median). There are 10 + signs; B(15, 0.5) soi M1 (P( 10) 1 P 9 X X =) 1 – 0.849 = 0.151 A1 P(X ⩽ 5) = 0.151 (implies M1) Compare with 0.1: ‘0.151’ > 0.1 accept H0 M1 ‘0.151’ must come from a valid binomial calculation Correct ft conclusion for their 0.151 and 0.1 Condone Reject H1 ‘Accept H0’ can be implied by a conclusion that is consistent with their 0.151 and 0.1 Insufficient evidence to suggest that practical results are greater than written results A1 Correct work only, ignoring their hypotheses, conclusion in context with level of uncertainty in language. Not ‘prove’. Condone ‘no sufficient’ ‘not enough’. Do not accept statements such as ‘there is sufficient evidence to suggest…..’. 5
This question in 9231/42 May/June 2024
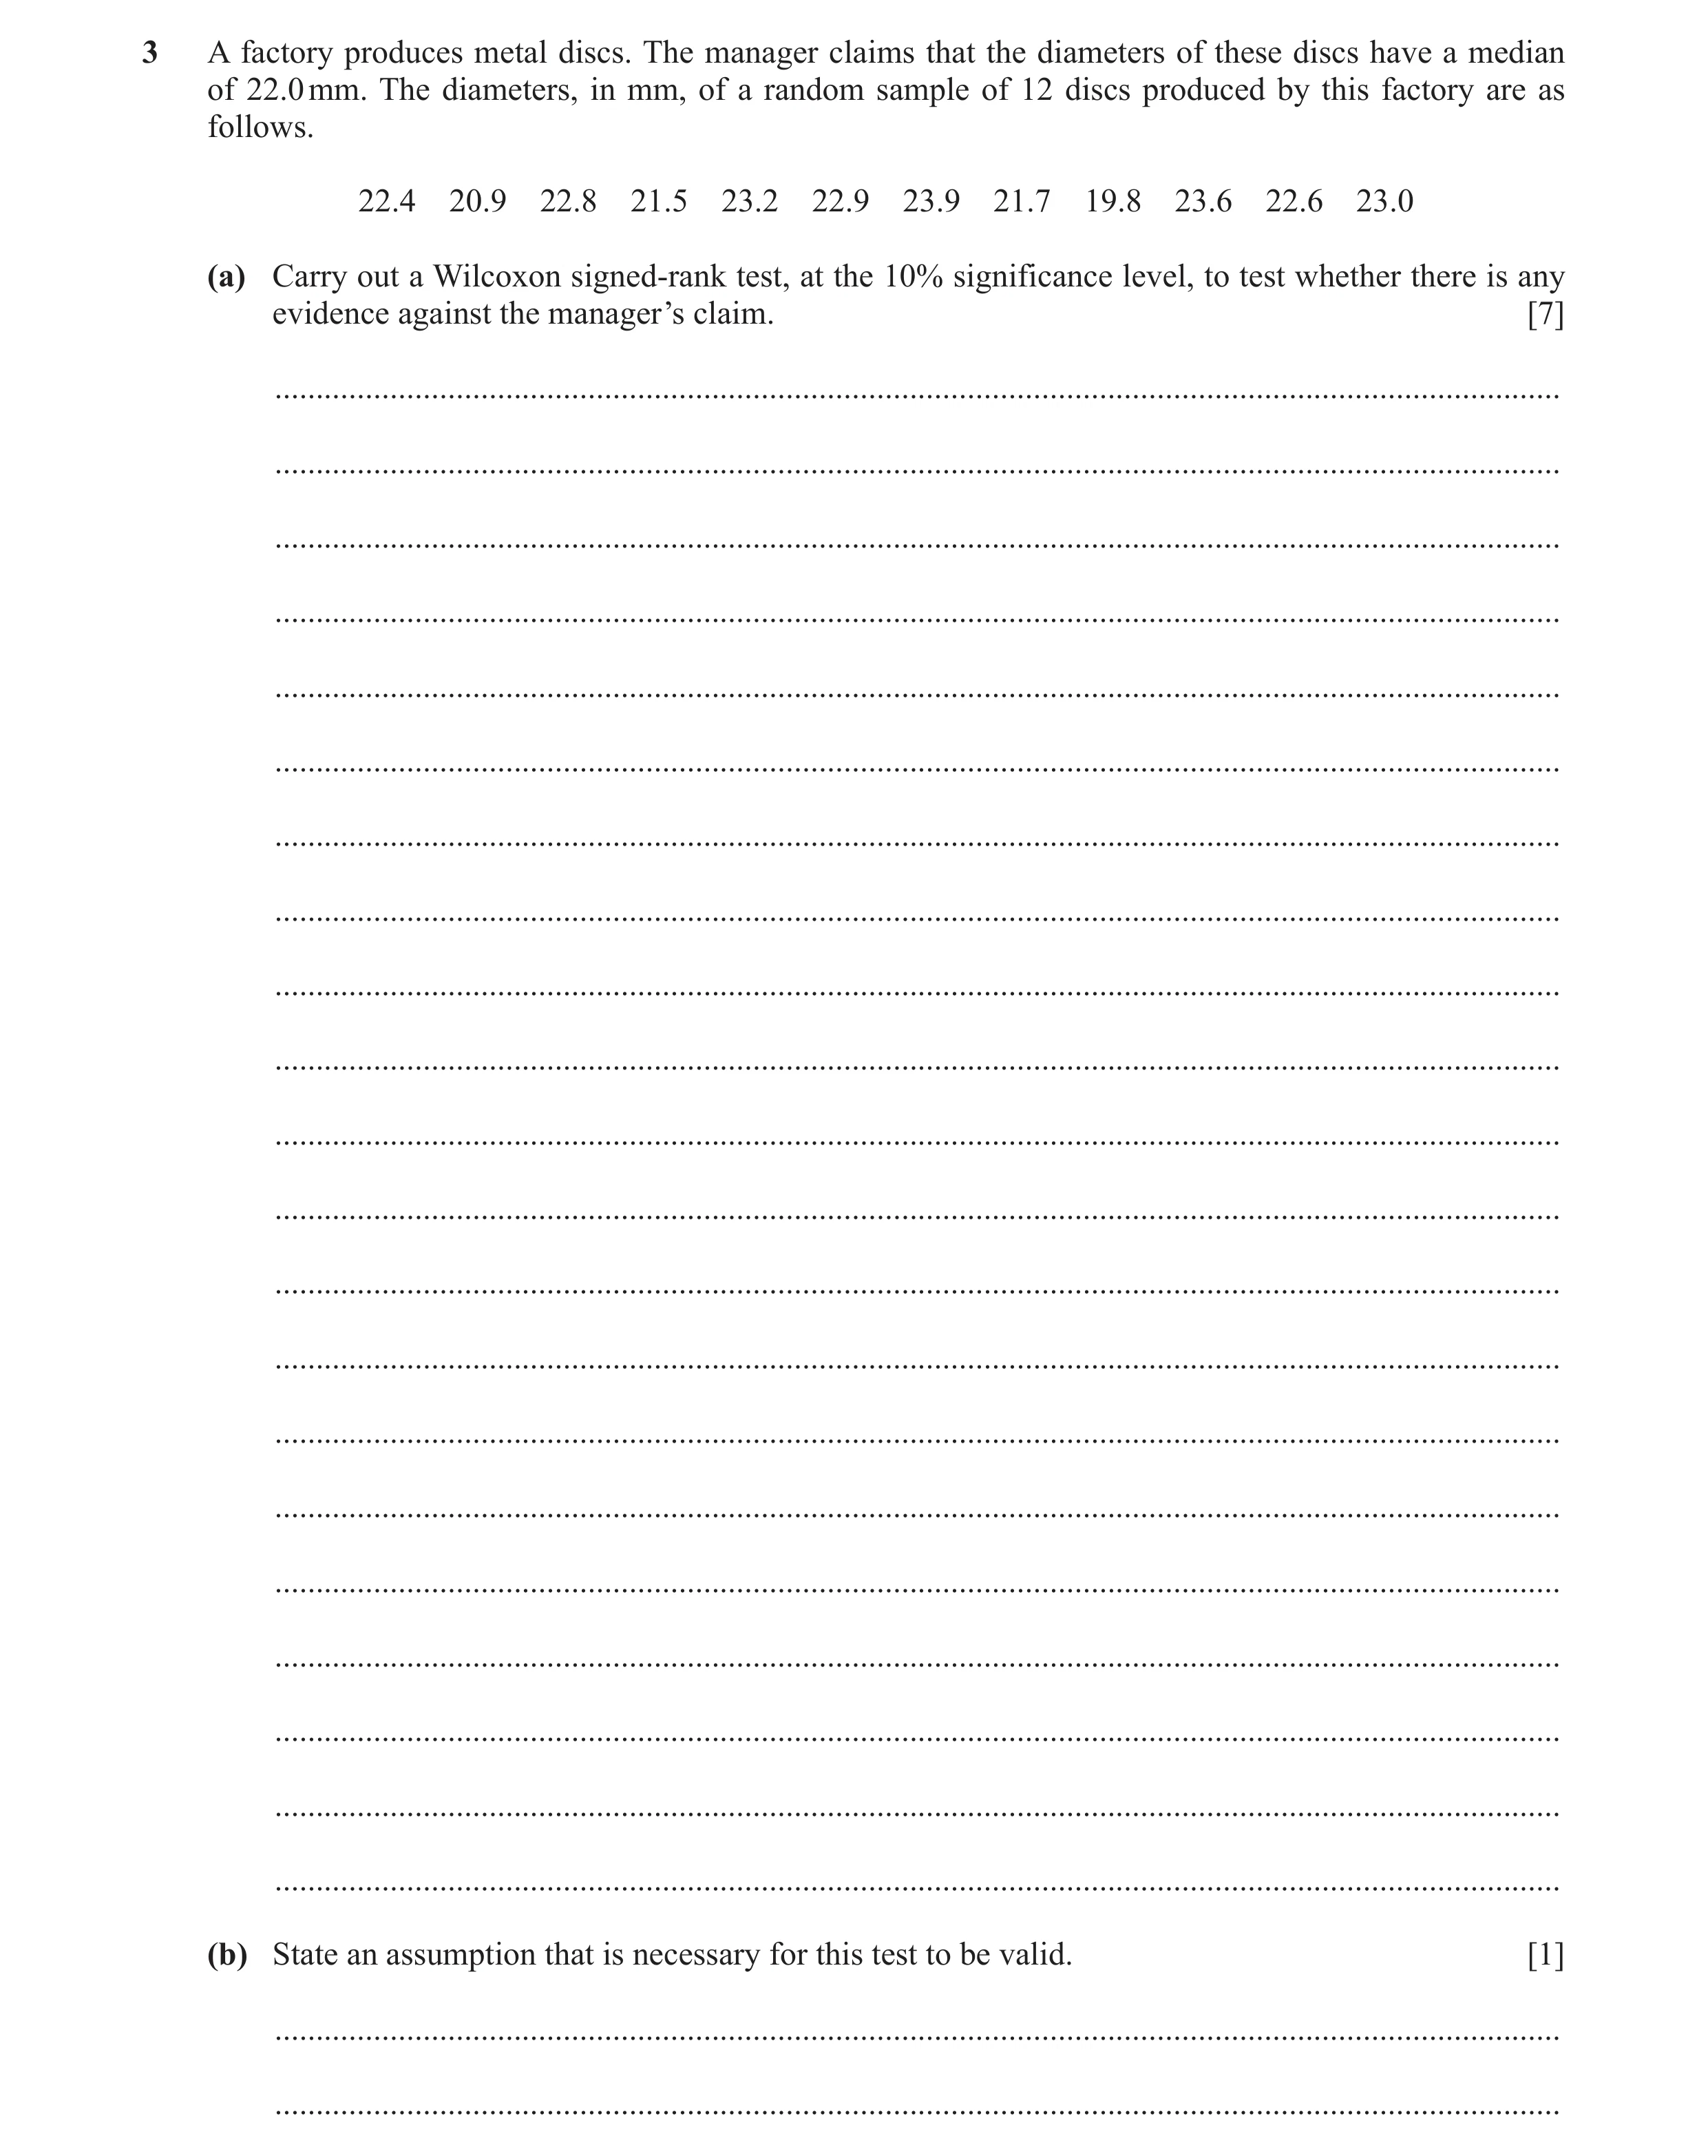
Q28 · A factory produces metal discs 9231/42 May/June 2024
3 A factory produces metal discs. The manager claims that the diameters of these discs have a median of 22.0 mm. The diameters, in mm, of a random sample of 12 discs produced by this factory are as follows. 22.4 20.9 22.8 21.5 23.2 22.9 23.9 21.7 19.8 23.6 22.6 23.0 (a) Carry out a Wilcoxon signed-rank test, at the 10% significance level, to test whether there is any evidence against the manager’s claim. [7] … … … … … … … … … … … … … … … … … … … … … (b) State an assumption that is necessary for this test to be valid. [1] … …
8 marks
Mark scheme: 3(a) Signed differences 0.4 1.1 0.8 0.5 1 .2 0.9 1 .9 0.3 2.2 1 .6 0.6 1 .0 Ranks: 2 8 5 3 9 6 1 1 1 12 1 0 4 7 M1 Attempt at ranking. (P+ = 54) P- = 24 A1 All ranks must be correct. H0: population median = 22.0 H1: population median 22.0 B1 Accept m used as ‘population median’ Critical value from table = 17 B1 ‘24’ > ‘17’ Accept H0 M1 ‘24’ must come from a ranking of signed differences, ‘17’ must be critical value from tables (7, 9, 10, 13, 17 or 21). Correct ft conclusion for their 24 and their 17. Condone Reject H1. ‘Accept H0’ can be implied by a conclusion that is consistent with their 24 and their 17. Insufficient evidence to support (population) median not being 22.0 Insufficient evidence against the manager’s claim A1 Correct work only, ignoring their hypotheses, conclusion in context with level of uncertainty in language. Not ‘prove’. Condone ‘no sufficient’ ‘not enough’. Do not accept statements such as ‘there is sufficient evidence to suggest…..’. 7 Question Answer Marks Guidance 3(b) Distribution is symmetric about the population median Underlying/population distribution is symmetric about the median B1 Need to see population or underlying distribution mentioned. Underlying distribution is symmetric B0. Population distribution is symmetric B0. ‘data’ implies B0 but condone ‘population data’ ‘mean’ implies B0. 1 Question Answer Marks Guidance G’Y (t) =
This question in 9231/42 May/June 2024
Q29 · A school with a large number of students is updating its logo 9231/41 Oct/Nov 2024
2 A school with a large number of students is updating its logo. Each student has designed a new logo and two teachers have each awarded a mark out of 50 for each logo. The marks awarded to a random sample of 12 students are shown in the following table. Student A B C D E F G H I J K L Teacher 1 36 38 40 36 22 34 45 44 48 35 28 30 Teacher 2 38 42 32 41 32 41 42 50 36 44 42 41 One of the students claims that Teacher 2 is awarding higher marks than Teacher 1. (a) Carry out a Wilcoxon matched-pairs signed-rank test, at the 5% significance level, to test whether the data supports the claim. [7] … … … … … … … … … … … … … … … … … … … … … It was later discovered that Teacher 1 had entered her mark for student C incorrectly. Her intended mark was 24 not 40. This was corrected. (b) Determine whether this correction affects the conclusion of the test carried out in part (a). [2] … … … … … … … … … … … … … … … … … … … … … … … … … …
9 marks
Mark scheme: 2(a) 2 4 −8 5 10 7 −3 6 −12 9 14 11 M1 Signed differences, allow one error. 1 3 −7 4 9 6 −2 5 −11 8 12 10 M1 Attempt at ranking. (Sum of + ranks = 58) Test statistic = 20 A1 H0: population median for teacher 2 = population median for teacher 1 B1 H1: population median for teacher 2 > population median for teacher 1 Allow use of m for population median. Critical value, from tables, is 17 B1 ‘20’ > 17, accept H0 M1 Insufficient evidence to support the claim A1 Correct work only except possibly hypotheses, in Insufficient evidence that the scores of Teacher 2 are higher than those of Teacher 1 context, level of uncertainty in language. 7 2(b) New test statistic is ‘13’ B1 FT Their 20 minus 7. 13 < 17, so conclusion is now ‘reject H0’, (sufficient evidence to support claim) B1 Must be 13 and 17. 2
This question in 9231/41 Oct/Nov 2024
Q30 · A school with a large number of students is updating its logo 9231/43 Oct/Nov 2024
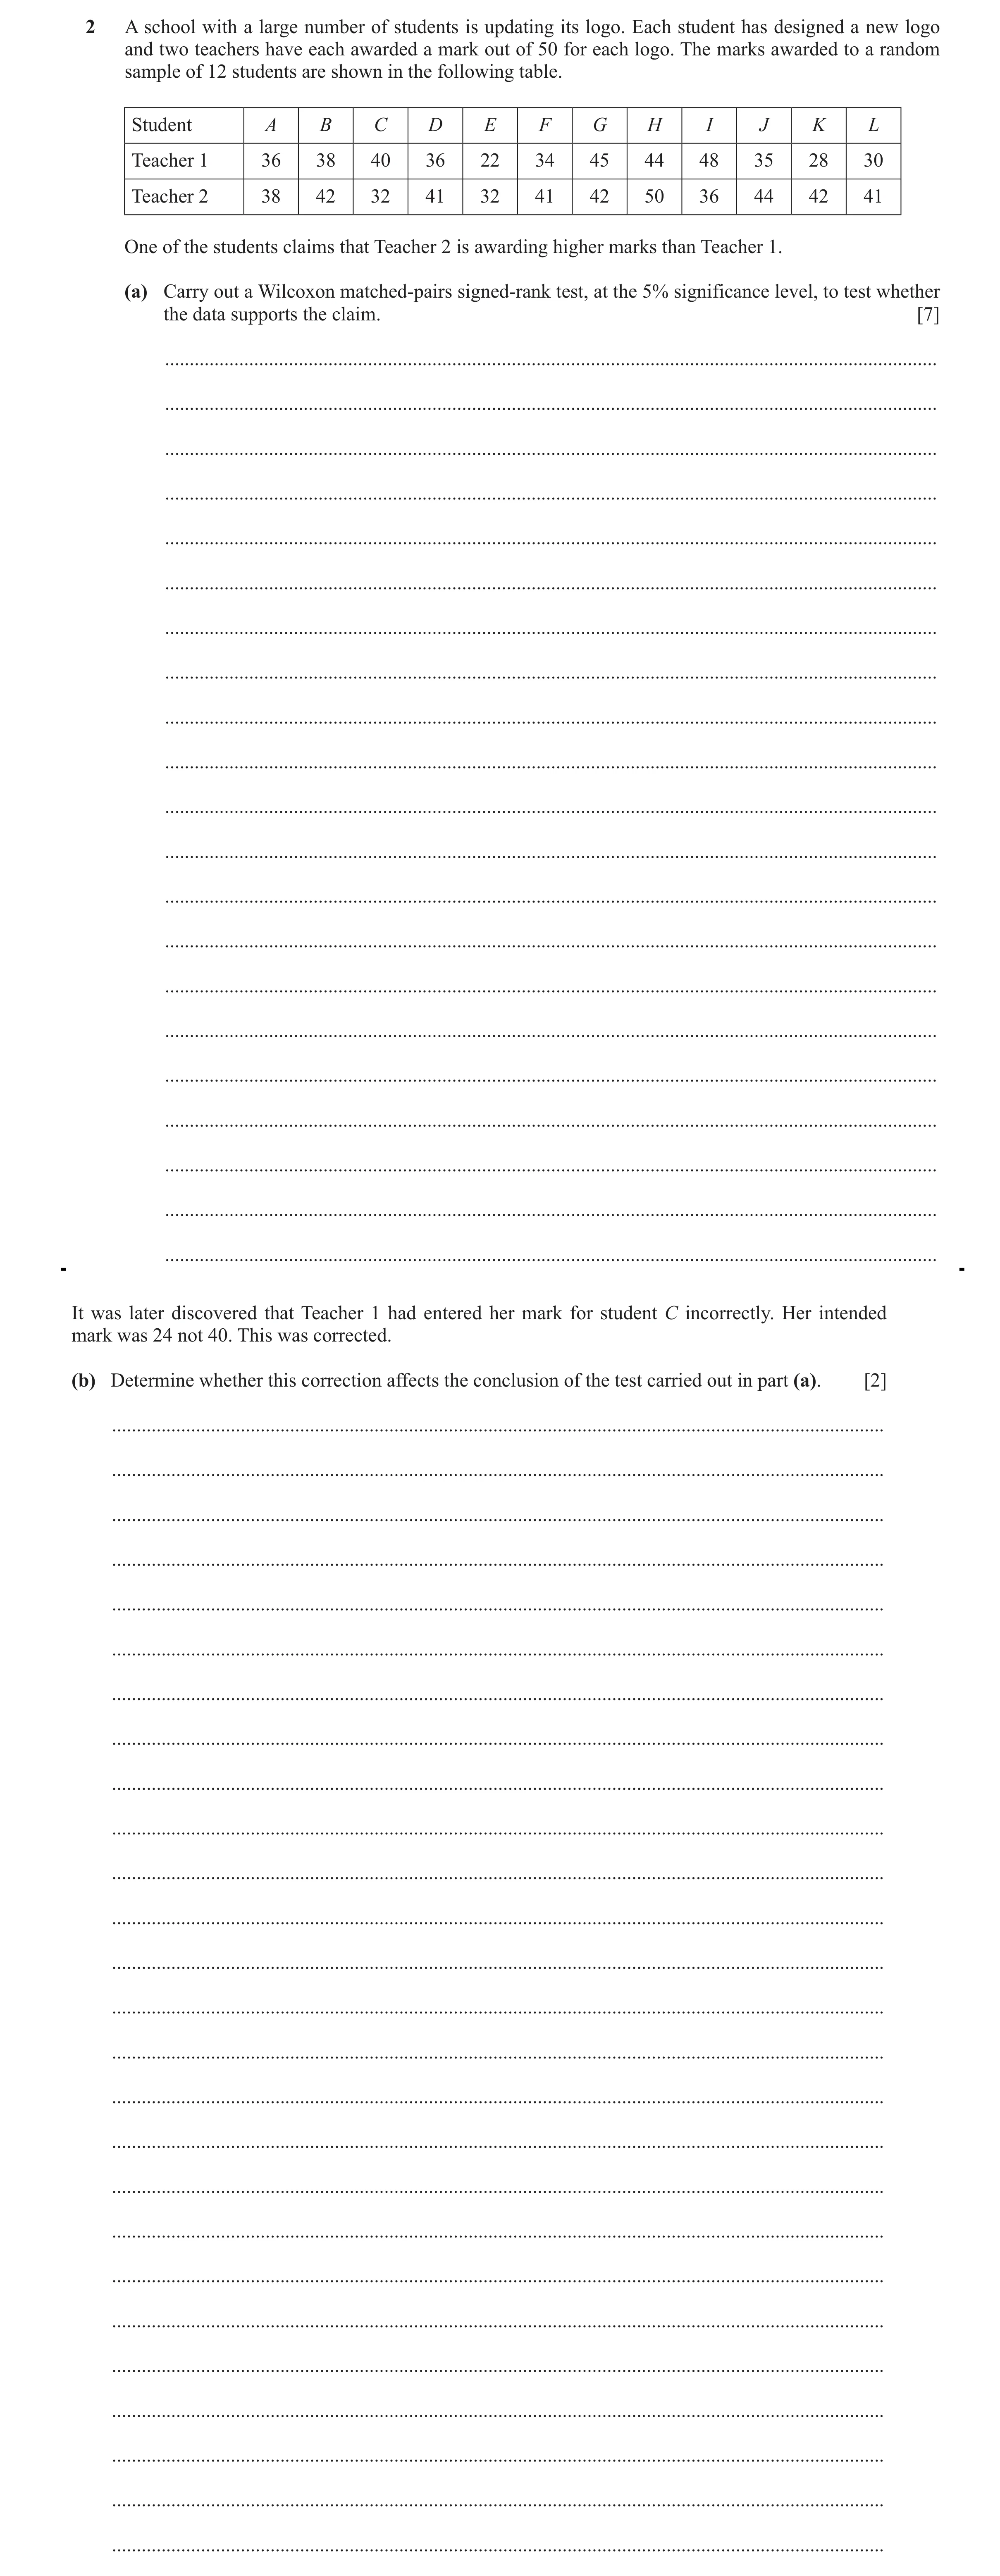
2 A school with a large number of students is updating its logo. Each student has designed a new logo and two teachers have each awarded a mark out of 50 for each logo. The marks awarded to a random sample of 12 students are shown in the following table. Student A B C D E F G H I J K L Teacher 1 36 38 40 36 22 34 45 44 48 35 28 30 Teacher 2 38 42 32 41 32 41 42 50 36 44 42 41 One of the students claims that Teacher 2 is awarding higher marks than Teacher 1. (a) Carry out a Wilcoxon matched-pairs signed-rank test, at the 5% significance level, to test whether the data supports the claim. [7] … … … … … … … … … … … … … … … … … … … … … It was later discovered that Teacher 1 had entered her mark for student C incorrectly. Her intended mark was 24 not 40. This was corrected. (b) Determine whether this correction affects the conclusion of the test carried out in part (a). [2] … … … … … … … … … … … … … … … … … … … … … … … … … …
9 marks
Mark scheme: 2(a) 2 4 −8 5 10 7 −3 6 −12 9 14 11 M1 Signed differences, allow one error. 1 3 −7 4 9 6 −2 5 −11 8 12 10 M1 Attempt at ranking. (Sum of + ranks = 58) Test statistic = 20 A1 H0: population median for teacher 2 = population median for teacher 1 B1 H1: population median for teacher 2 > population median for teacher 1 Allow use of m for population median. Critical value, from tables, is 17 B1 ‘20’ > 17, accept H0 M1 Insufficient evidence to support the claim A1 Correct work only except possibly hypotheses, in Insufficient evidence that the scores of Teacher 2 are higher than those of Teacher 1 context, level of uncertainty in language. 7 2(b) New test statistic is ‘13’ B1 FT Their 20 minus 7. 13 < 17, so conclusion is now ‘reject H0’, (sufficient evidence to support claim) B1 Must be 13 and 17. 2
This question in 9231/43 Oct/Nov 2024
Q31 · The level of sound produced by a particular type of machine was measured for a random… 9231/44 May/June 2025
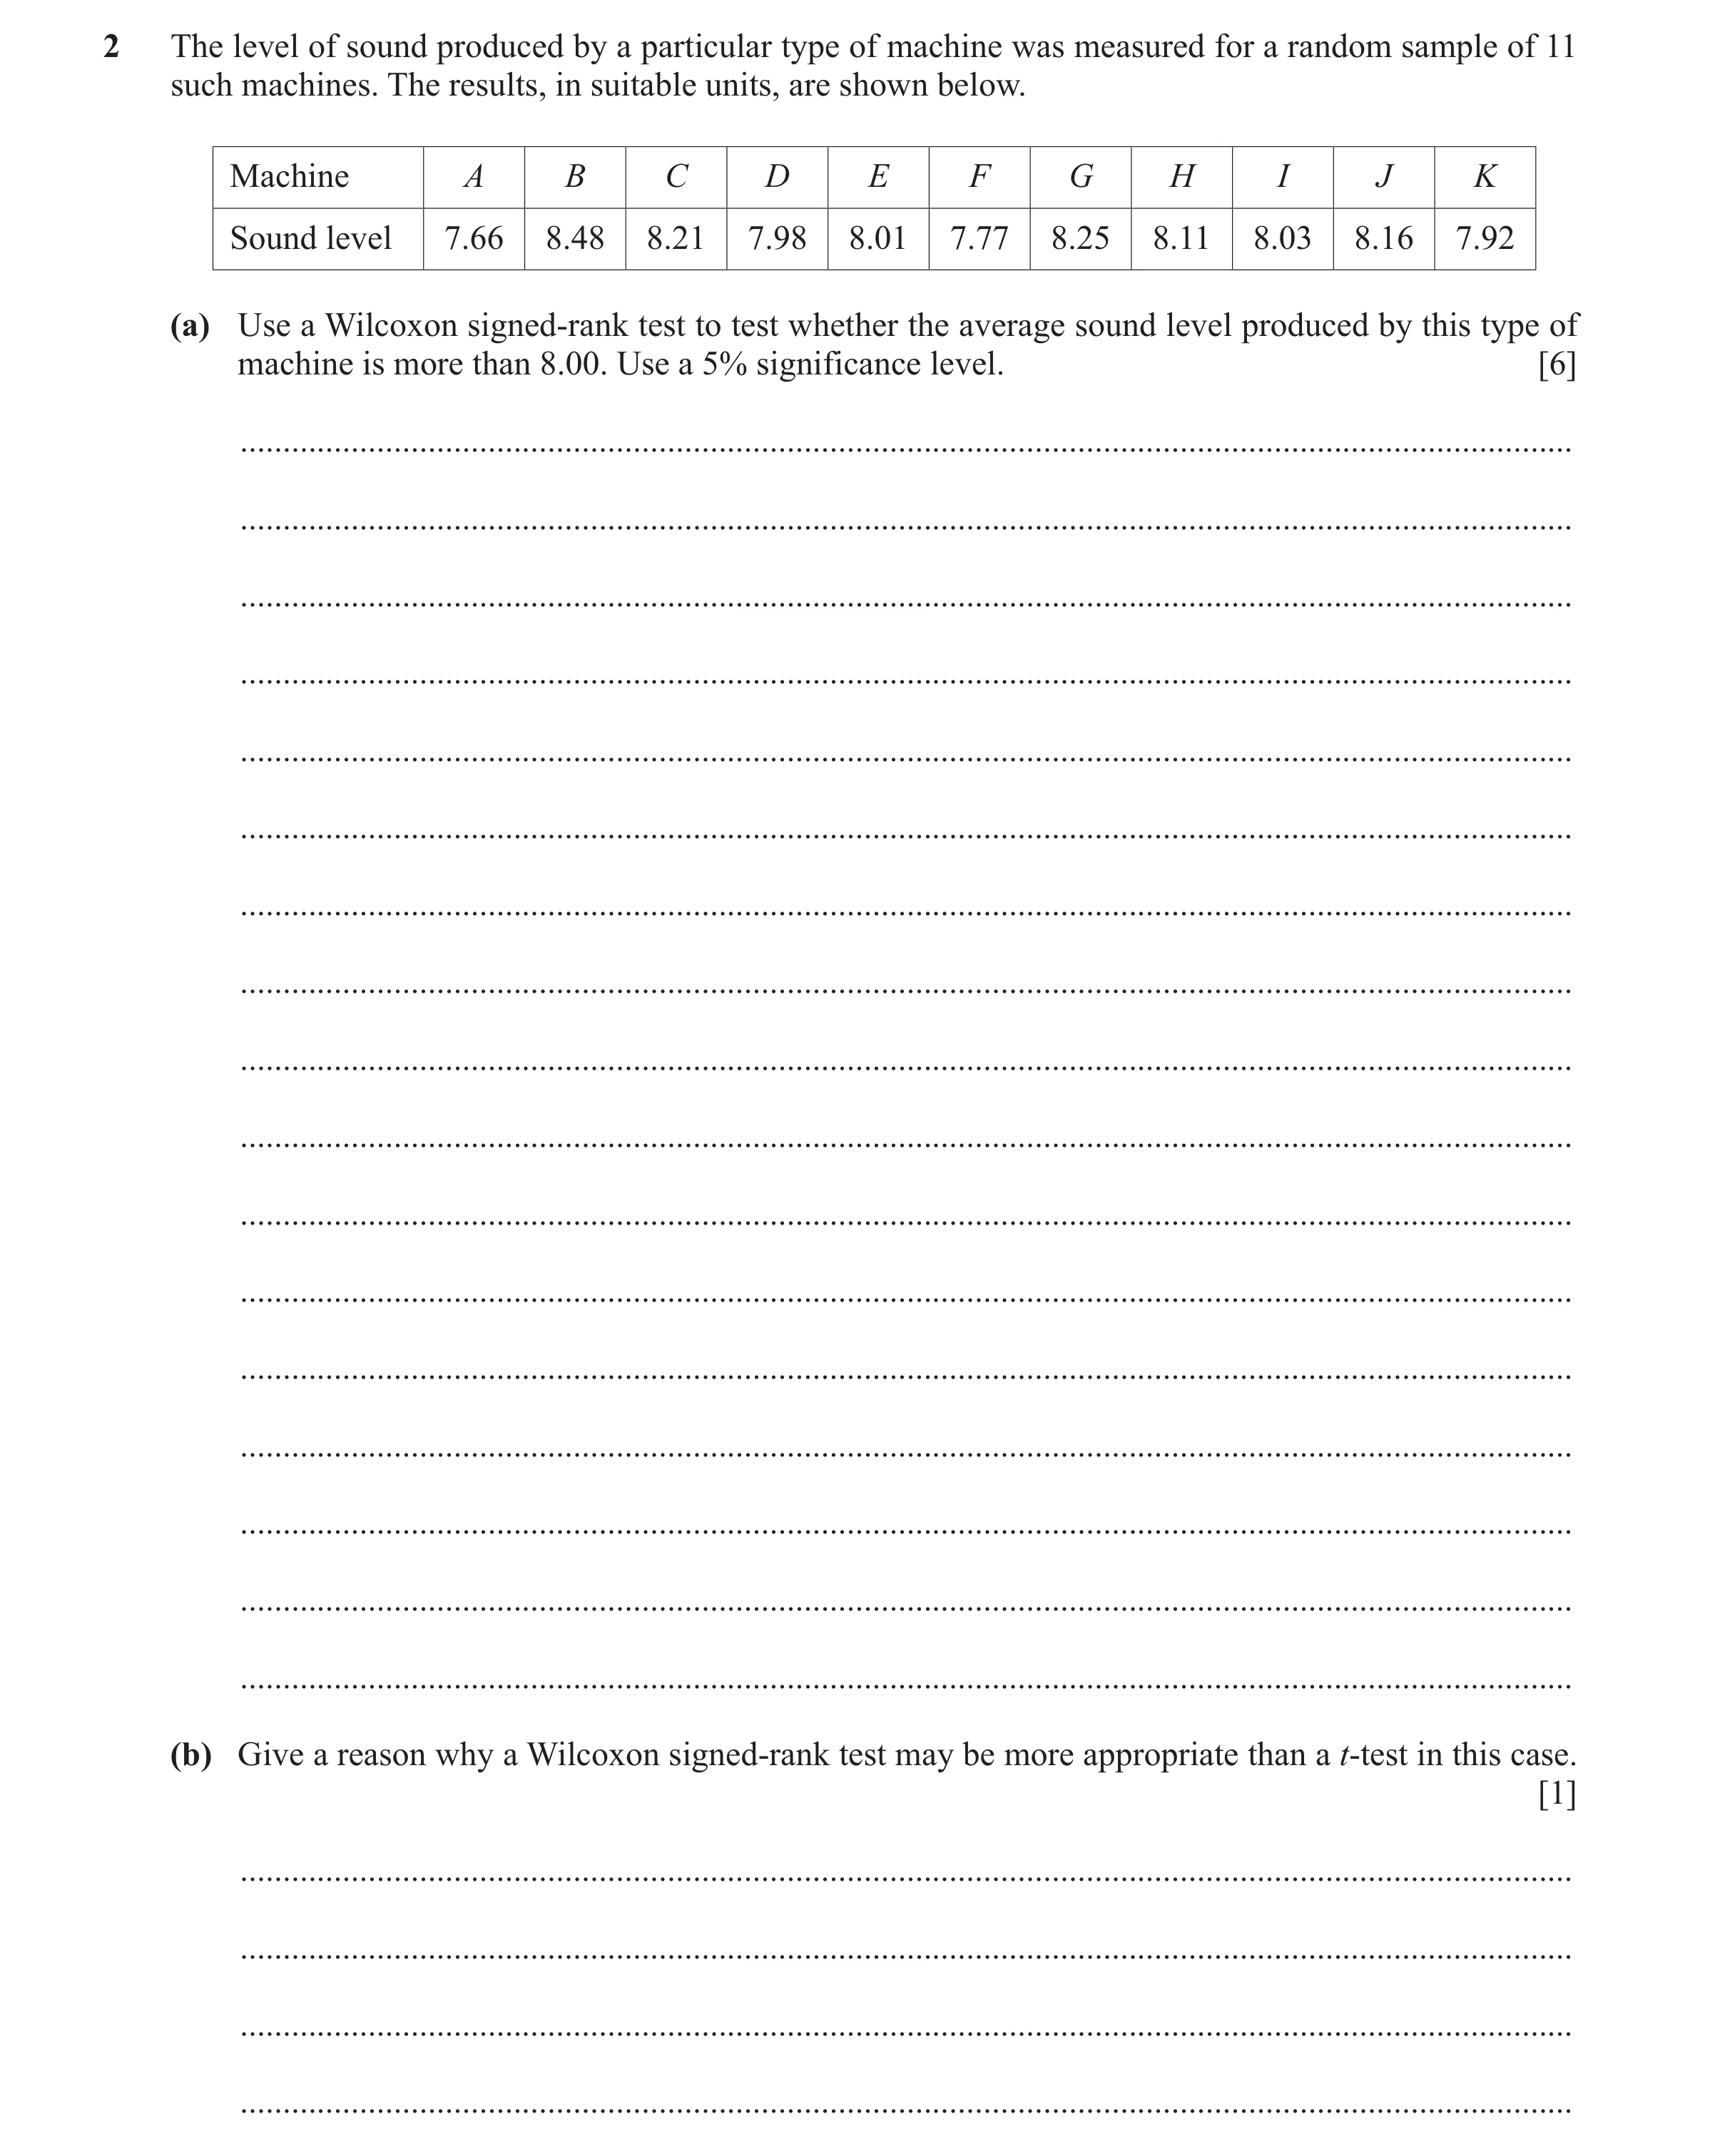
2 The level of sound produced by a particular type of machine was measured for a random sample of 11 such machines. The results, in suitable units, are shown below. Machine A B C D E F G H I J K Sound level 7.66 8.48 8.21 7.98 8.01 7.77 8.25 8.11 8.03 8.16 7.92 (a) Use a Wilcoxon signed-rank test to test whether the average sound level produced by this type of machine is more than 8.00. Use a 5% significance level. [6] … … … … … … … … … … … … … … … … … (b) Give a reason why a Wilcoxon signed-rank test may be more appropriate than a t-test in this case. [1] … … … …
7 marks
Mark scheme: 2(a) H0 : population median = 8.00 B1 Allow m , but not . If m defined, must see population. H1 : population median 8.00 –0.34, 0.48, 0.21, –0.02, 0.01, –0.23, 0.25, 0.11, 0.03, 0.16, –0.08 M1 Attempt at (signed) differences. –10, 11, 7, –2, 1, –8, 9, 5, 3, 6, –4 M1 Attempt at (signed) ranks, ranks may be reversed. ( P = 42, Q = 24) T = 24 A1 '24' > 13, accept H 0 (not significant). M1 Compare their 24 (from rank sum only) with 13 and appropriate conclusion (may be in terms of H1). Accept H0 can be implied by an attempt at an appropriate conclusion in context. Allow M1 for comparison of their 24 (from rank sum only) with 10 and appropriate conclusion. Insufficient evidence to support/suggest that the average sound A1 Correct conclusion in context from correct working ignoring level is more than 8.00. hypotheses. Level of uncertainty in language used (for example, not ‘prove’). Must refer to average/median sound (level). 6 2(b) It is not known if the population is normal. B1 Must refer to population and/or distribution. It is not known if the (underlying) distribution is normal. B0 for data is normal. B0 for (population) differences are normal. 1
This question in 9231/44 May/June 2025
Q32 · A researcher believes that the median m of a population has changed from its known… 9231/41 Oct/Nov 2025
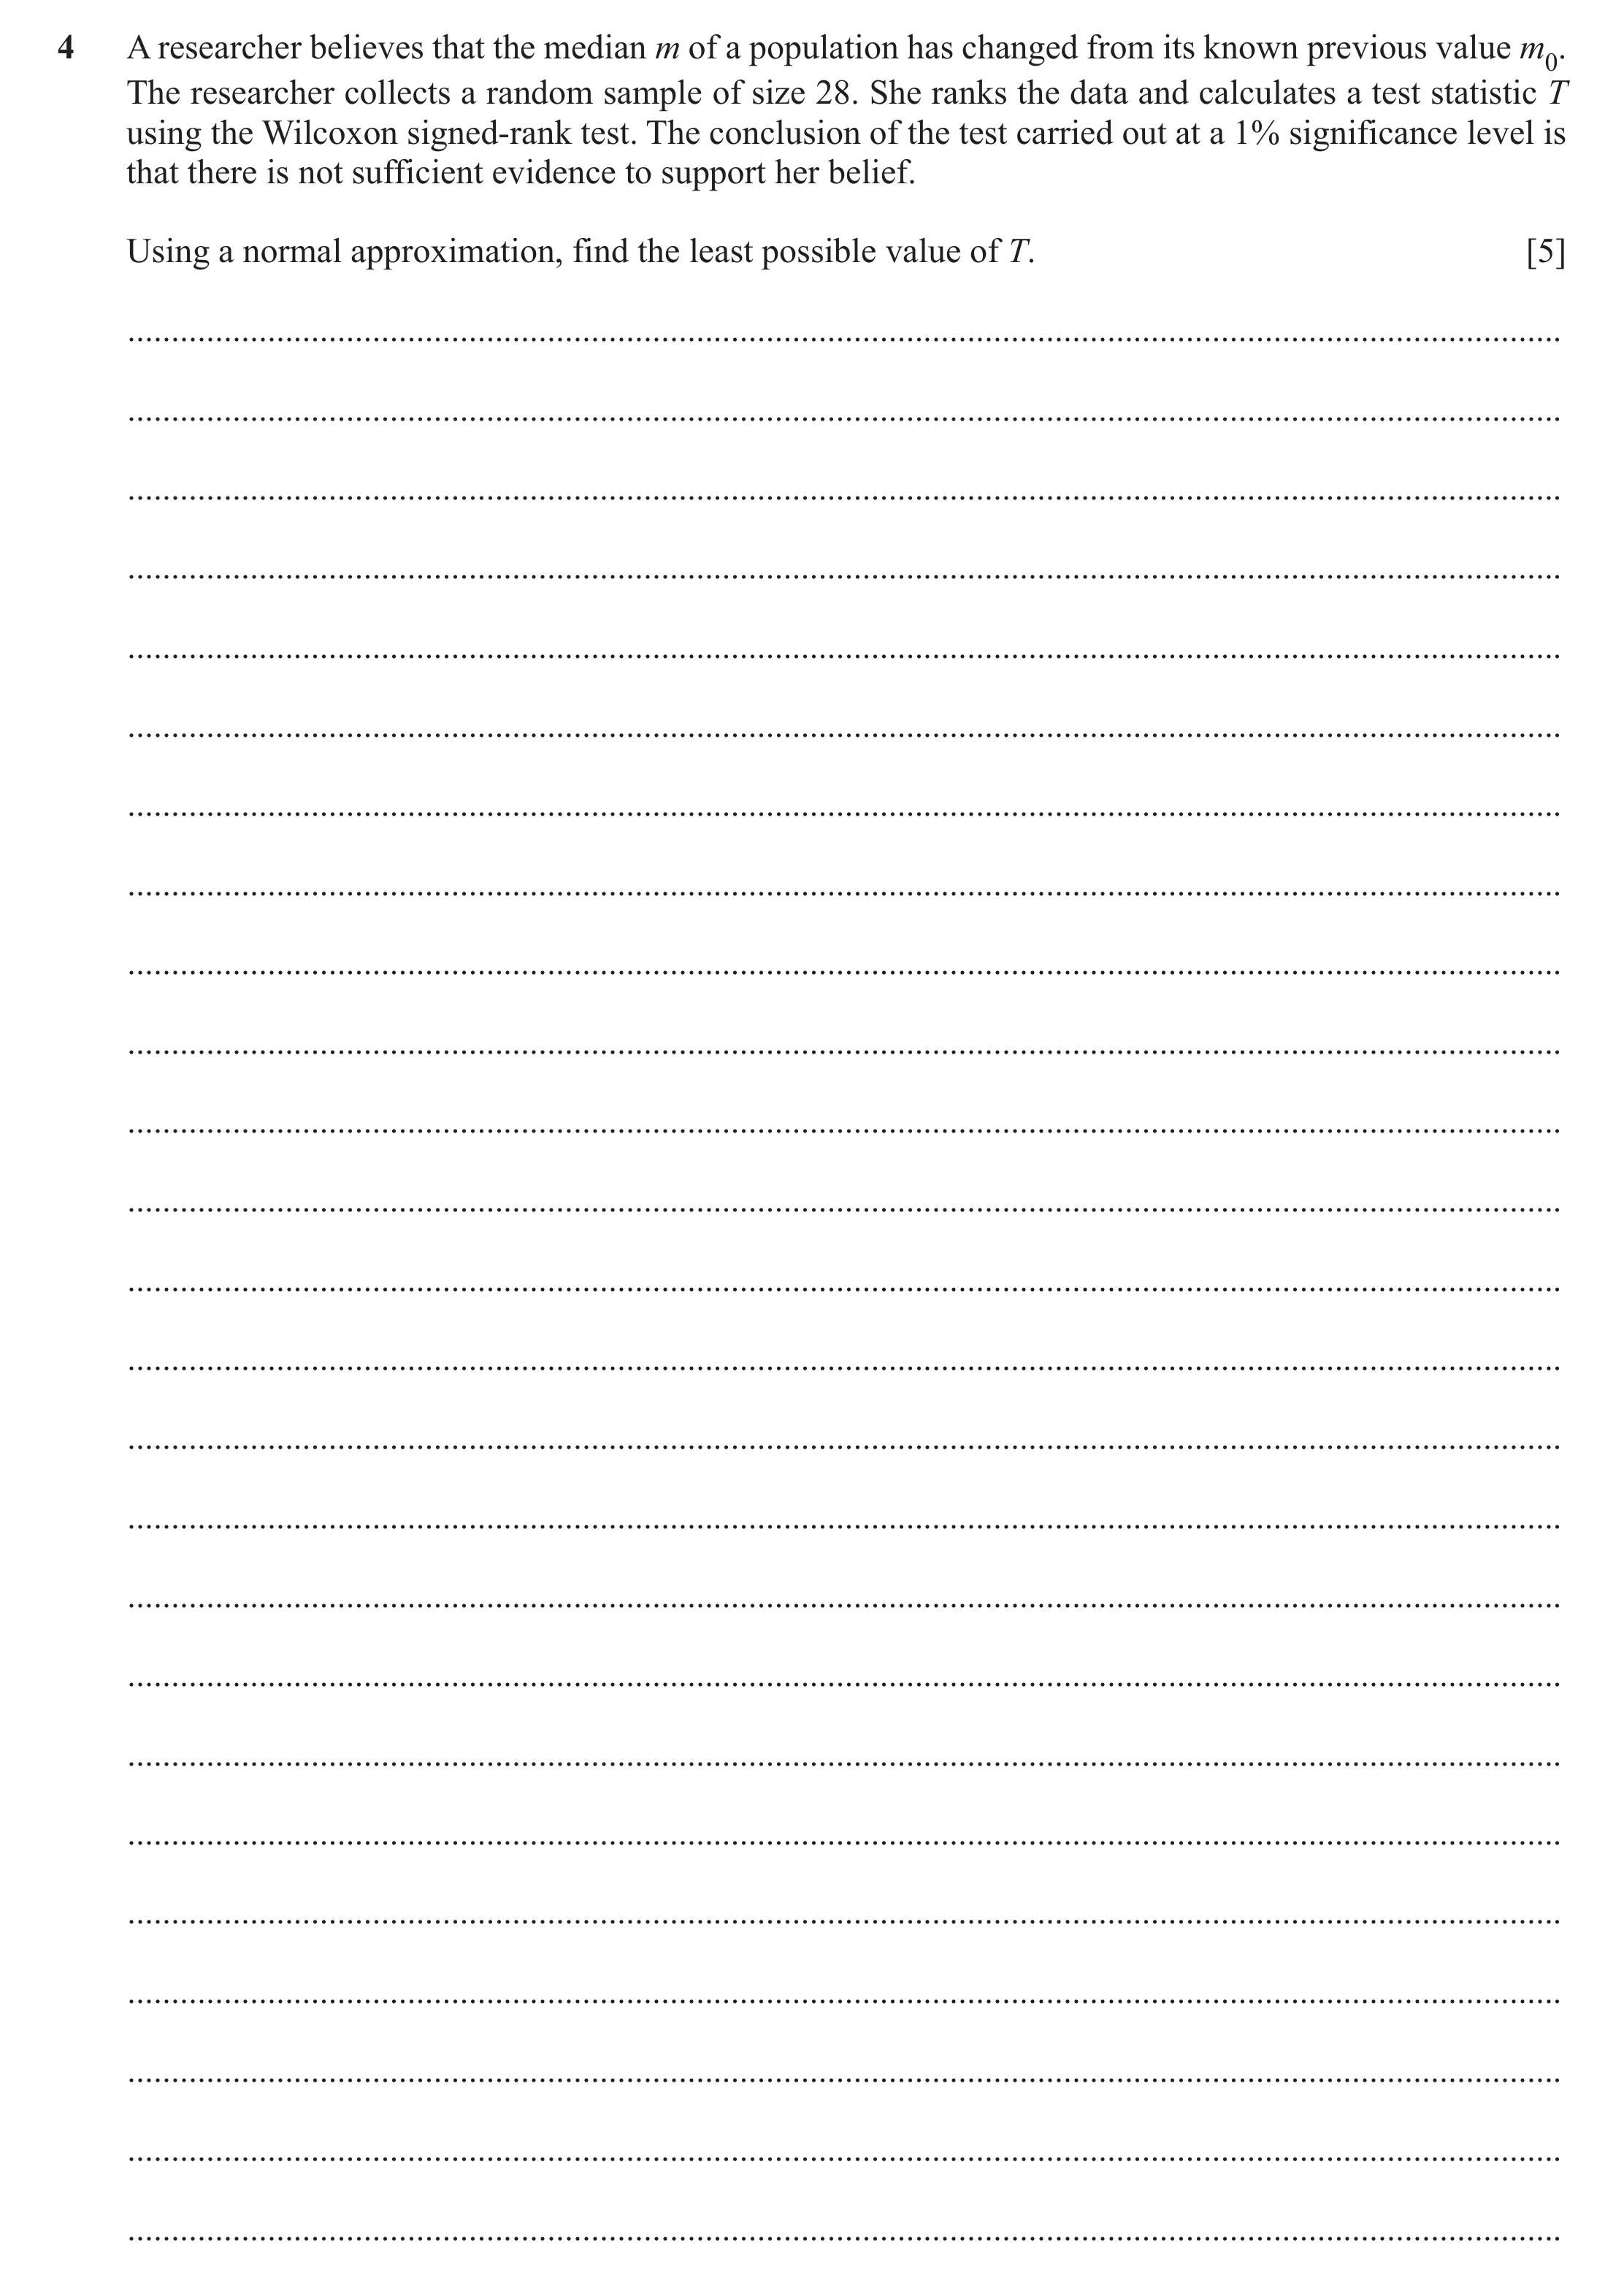
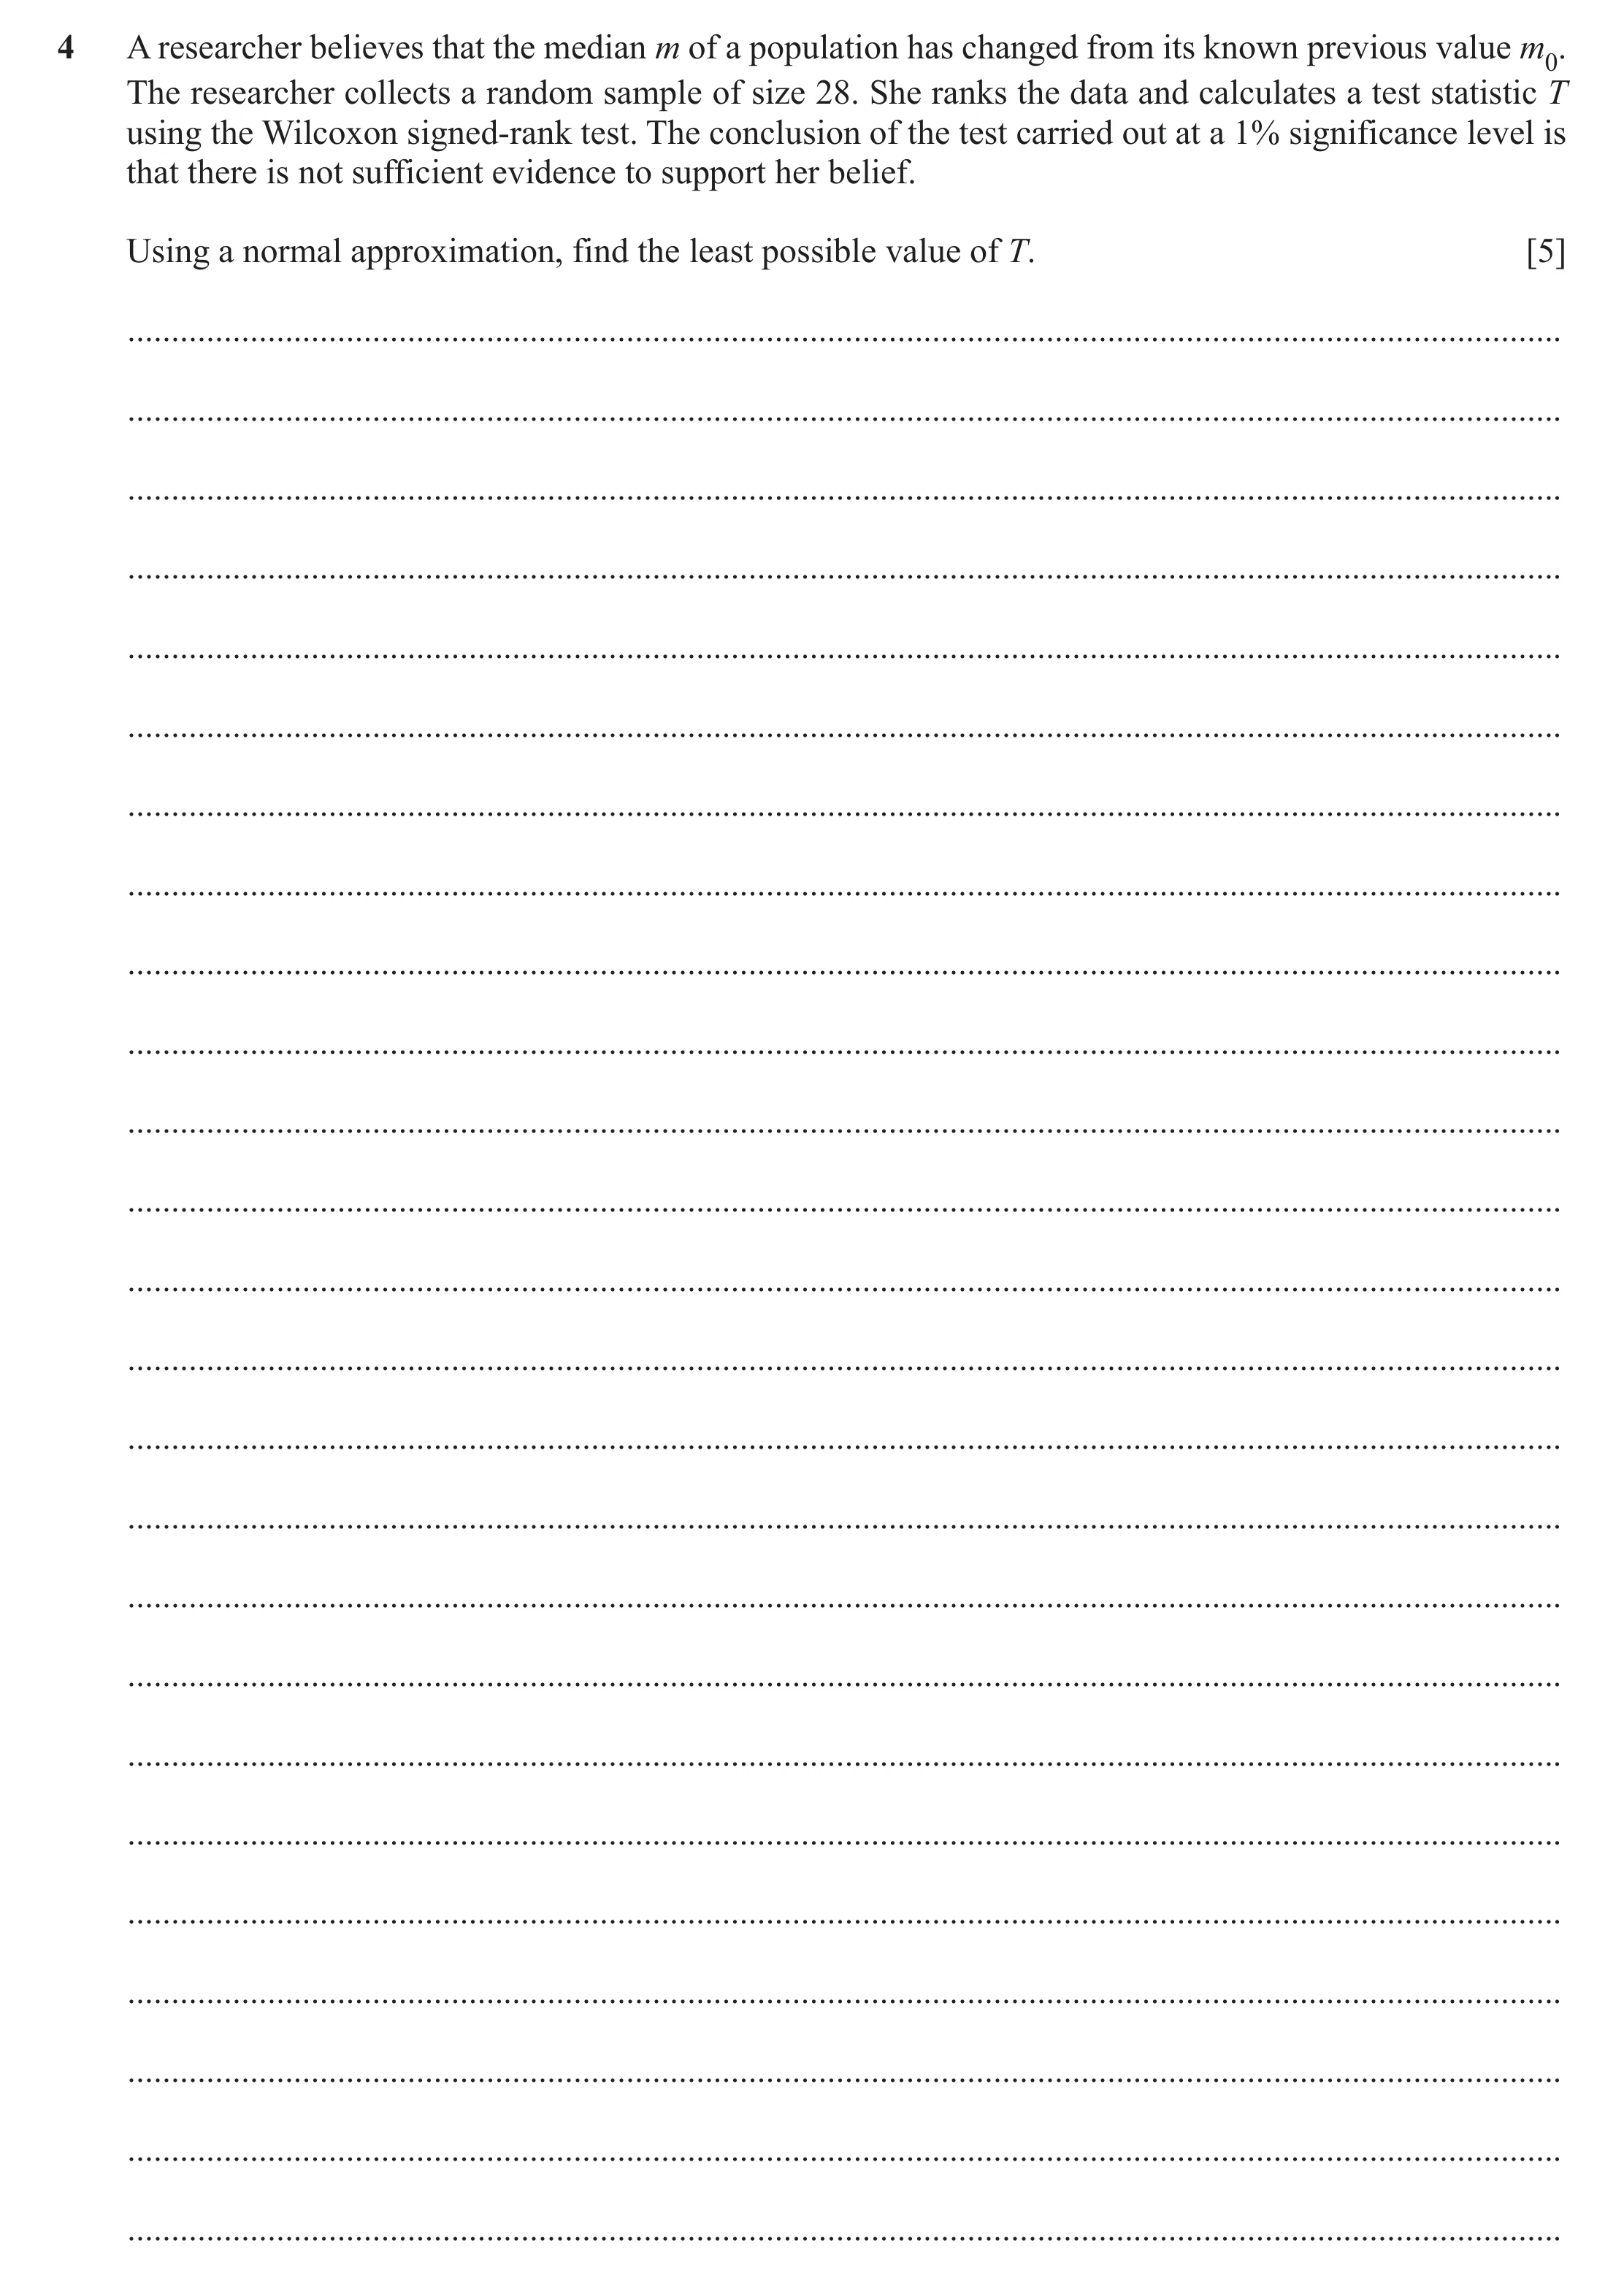
4 A researcher believes that the median m of a population has changed from its known previous value m0. The researcher collects a random sample of size 28. She ranks the data and calculates a test statistic T using the Wilcoxon signed-rank test. The conclusion of the test carried out at a 1% significance level is that there is not sufficient evidence to support her belief. Using a normal approximation, find the least possible value of T. [5] … … … … … … … … … … … … … … … … … … … … … … … … …
5 marks
Mark scheme: 4 1 4 28 ( 28 + 1) = 203 B1 Both expressions correct. Implied by 203 and 1928.5 seen. 1 28 ( 28 + 1) ( 56 + 1) = 1928.5 24 T + 0.5 − '203' M1 Correct form or expression for CI with any z-value. z = Condone T or T − 0.5 instead of T + 0.5 for M1. '1928.5' T + 0.5 − '203' M1 Compares their z with 2.576 . −2.576 '1928.5' Condone T or T − 0.5 instead of T + 0.5 for M1. T 89.4 A1 Allow T = 89.4 . T = 90 A1 All correct with no errors seen, including correct continuity correction. 5
This question in 9231/41 Oct/Nov 2025
Q33 · Nine athletes in a club have a new coach 9231/41 Oct/Nov 2025
6 Nine athletes in a club have a new coach. The coach adopts a new training programme which he believes will reduce the race times of these athletes. Each athlete completes a 1500 m time trial before and after completing the new training programme. Their times, in seconds (s), are recorded. Athlete A B C D E F G H I Time before training (s) 250 251 252 267 276 291 310 320 335 Time after training (s) 245 251 253 261 275 293 302 313 320 (a) Carry out a paired t-test at the 5% significance level to test the coach’s belief. [7] … … … … … … … … … … … … … … … … … … … … … … … … … … … … … … … … … … … … … … … Further research suggests that the effects of the training programme tend to reduce the times of the slower athletes by more than those of the faster athletes. (b) Suggest a reason why the paired t-test used in part (a) may not have been an appropriate test in this case. [1] … … … (c) Suggest a suitable alternative test that could have been used instead of a paired t-test. [1] … … … …
9 marks
Mark scheme: 6(a) H 0: B = A H1: B A B1 If in words, must contain ‘population means’. Allow H 0: d = 0, H1: d 0 if defined or consistent with working. Differences: 5, 0, −1, 6, 1, −2, 8, 7, 15 M1 Attempt at signed differences. = 29.5 M1 Correct form for ds2 , note that ds = 5.43 . ds2 = 18 ( '405'− '39'9 2 ) '39' M1 Correct form. 9 = 2.393 '29.5' 9 A1 AWRT 2.39. '2.393' 1.860 , reject H0 / significant. M1 Compare their 2.393 with 1.860 and appropriate result (may be in terms of H1). Allow M1 for comparison from 2-sample test using 1.746. Test result may be implied by an attempt at an appropriate conclusion in context ignoring hypotheses. Sufficient evidence to suggest new training programme results in A1 Correct conclusion from correct working ignoring hypotheses. reduced times. In context. OR Level of uncertainty in language is used (for example, not ‘prove’). Sufficient evidence to support the coach’s belief. Do not accept statements such as “there is insufficient evidence to suggest…”. 7 6(b) The population of differences may not be normally distributed. B1 Must mention population/distribution and differences. The population of differences may not be symmetrical (and hence Accept “the sample may not be random” or “times may not be not normal). independent”. 1 6(c) A Wilcoxon matched-pairs signed-rank test. B1 Must refer to pairs / paired. OR A paired-sample sign test. Accept “paired Wilcoxon test” or “paired sign test”. 1
This question in 9231/41 Oct/Nov 2025
Q34 · A large company claims that the median salary of its employees is $32 500 9231/42 Oct/Nov 2025
1 A large company claims that the median salary of its employees is $32 500. The salaries ($) of 15 randomly selected employees are listed below. 18 750 30 500 125 000 42 500 25 000 26 000 52 500 23 000 27 500 19 500 25 500 33 000 30 000 21 500 29 000 (a) Explain why a Wilcoxon signed-rank test may not be appropriate to test the company’s claim in this case. [1] … … … (b) Carry out a sign test at the 10% significance level to investigate the company’s claim. [5] … … … … … … … … … … … … … … … … … … …
6 marks
Mark scheme: Question Answer Marks Guidance 1(a) Data has outliers / is skewed / lacks symmetry, suggesting B1 Must be in context. population/distribution may not be symmetrical. Condone no explicit mention of population/distribution or a definite statement relating to population. 1 1(b) H0: population median is [$]32,500. B1 Allow m , but not . If m defined, must see population. H1: population median is not [$]32,500. Median not mean or average. Test statistic = 4 (or 11) B1 Can be implied by P( X ≤ 4) or P( X 4) . (For use of Normal approximation, the value of the test statistic can be implied by 4.5 or 3.5 for 4 and 10.5 or 11.5 for 11). [ X ~ B (15,0.5 ) ] B1 AWRT 0.0592. Might see 0.1184/0.1185/0.118/0.119 from 2P( X ≤ 4) or 2P( X ≥ 11) . P( X ≤ 4) = 0.0592 OR P( X ≥ 11) = 0.0592 Use of N(7.5,3.75) scores B1 for ±1.549. '0.0592' 0.05 , accept H0 / do not reject H0 / not significant. M1 Compare their 0.0592 (must be a tail probability) with 0.05 (or 0.1 if 1-tail test used) OE and appropriate result (may be in terms of H1). Result may be implied by an attempt at an appropriate conclusion in context ignoring hypotheses. Use of Normal: compare their ±1.549 with ±1.645, signs must be consistent (1.282 for 1-tail test). Insufficient evidence to reject [company’s] claim. A1 Correct conclusion from correct working ignoring hypotheses. OR In context. Insufficient evidence to suggest that median [salary] is not Level of uncertainty in language is used (for example, not ‘prove’). [$]32,500. Allow “Not enough evidence / no sufficient evidence that / to show / conclude that…”. Do not accept “No evidence…”. Do not accept statements such as “there is sufficient evidence to suggest…”. 5
This question in 9231/42 Oct/Nov 2025
Q35 · A researcher believes that the median m of a population has changed from its known… 9231/43 Oct/Nov 2025
4 A researcher believes that the median m of a population has changed from its known previous value m0. The researcher collects a random sample of size 28. She ranks the data and calculates a test statistic T using the Wilcoxon signed-rank test. The conclusion of the test carried out at a 1% significance level is that there is not sufficient evidence to support her belief. Using a normal approximation, find the least possible value of T. [5] … … … … … … … … … … … … … … … … … … … … … … … … …
5 marks
Mark scheme: 4 1 4 28 ( 28 + 1) = 203 B1 Both expressions correct. Implied by 203 and 1928.5 seen. 1 28 ( 28 + 1) ( 56 + 1) = 1928.5 24 T + 0.5 − '203' M1 Correct form or expression for CI with any z-value. z = Condone T or T − 0.5 instead of T + 0.5 for M1. '1928.5' T + 0.5 − '203' M1 Compares their z with 2.576 . −2.576 '1928.5' Condone T or T − 0.5 instead of T + 0.5 for M1. T 89.4 A1 Allow T = 89.4 . T = 90 A1 All correct with no errors seen, including correct continuity correction. 5
This question in 9231/43 Oct/Nov 2025
Q36 · Nine athletes in a club have a new coach 9231/43 Oct/Nov 2025
6 Nine athletes in a club have a new coach. The coach adopts a new training programme which he believes will reduce the race times of these athletes. Each athlete completes a 1500 m time trial before and after completing the new training programme. Their times, in seconds (s), are recorded. Athlete A B C D E F G H I Time before training (s) 250 251 252 267 276 291 310 320 335 Time after training (s) 245 251 253 261 275 293 302 313 320 (a) Carry out a paired t-test at the 5% significance level to test the coach’s belief. [7] … … … … … … … … … … … … … … … … … … … … … … … … … … … … … … … … … … … … … … … Further research suggests that the effects of the training programme tend to reduce the times of the slower athletes by more than those of the faster athletes. (b) Suggest a reason why the paired t-test used in part (a) may not have been an appropriate test in this case. [1] … … … (c) Suggest a suitable alternative test that could have been used instead of a paired t-test. [1] … … … …
9 marks
Mark scheme: 6(a) H 0: B = A H1: B A B1 If in words, must contain ‘population means’. Allow H 0: d = 0, H1: d 0 if defined or consistent with working. Differences: 5, 0, −1, 6, 1, −2, 8, 7, 15 M1 Attempt at signed differences. = 29.5 M1 Correct form for ds2 , note that ds = 5.43 . ds2 = 18 ( '405'− '39'9 2 ) '39' M1 Correct form. 9 = 2.393 '29.5' 9 A1 AWRT 2.39. '2.393' 1.860 , reject H0 / significant. M1 Compare their 2.393 with 1.860 and appropriate result (may be in terms of H1). Allow M1 for comparison from 2-sample test using 1.746. Test result may be implied by an attempt at an appropriate conclusion in context ignoring hypotheses. Sufficient evidence to suggest new training programme results in A1 Correct conclusion from correct working ignoring hypotheses. reduced times. In context. OR Level of uncertainty in language is used (for example, not ‘prove’). Sufficient evidence to support the coach’s belief. Do not accept statements such as “there is insufficient evidence to suggest…”. 7 6(b) The population of differences may not be normally distributed. B1 Must mention population/distribution and differences. The population of differences may not be symmetrical (and hence Accept “the sample may not be random” or “times may not be not normal). independent”. 1 6(c) A Wilcoxon matched-pairs signed-rank test. B1 Must refer to pairs / paired. OR A paired-sample sign test. Accept “paired Wilcoxon test” or “paired sign test”. 1
This question in 9231/43 Oct/Nov 2025
 1 / 64
 2 / 64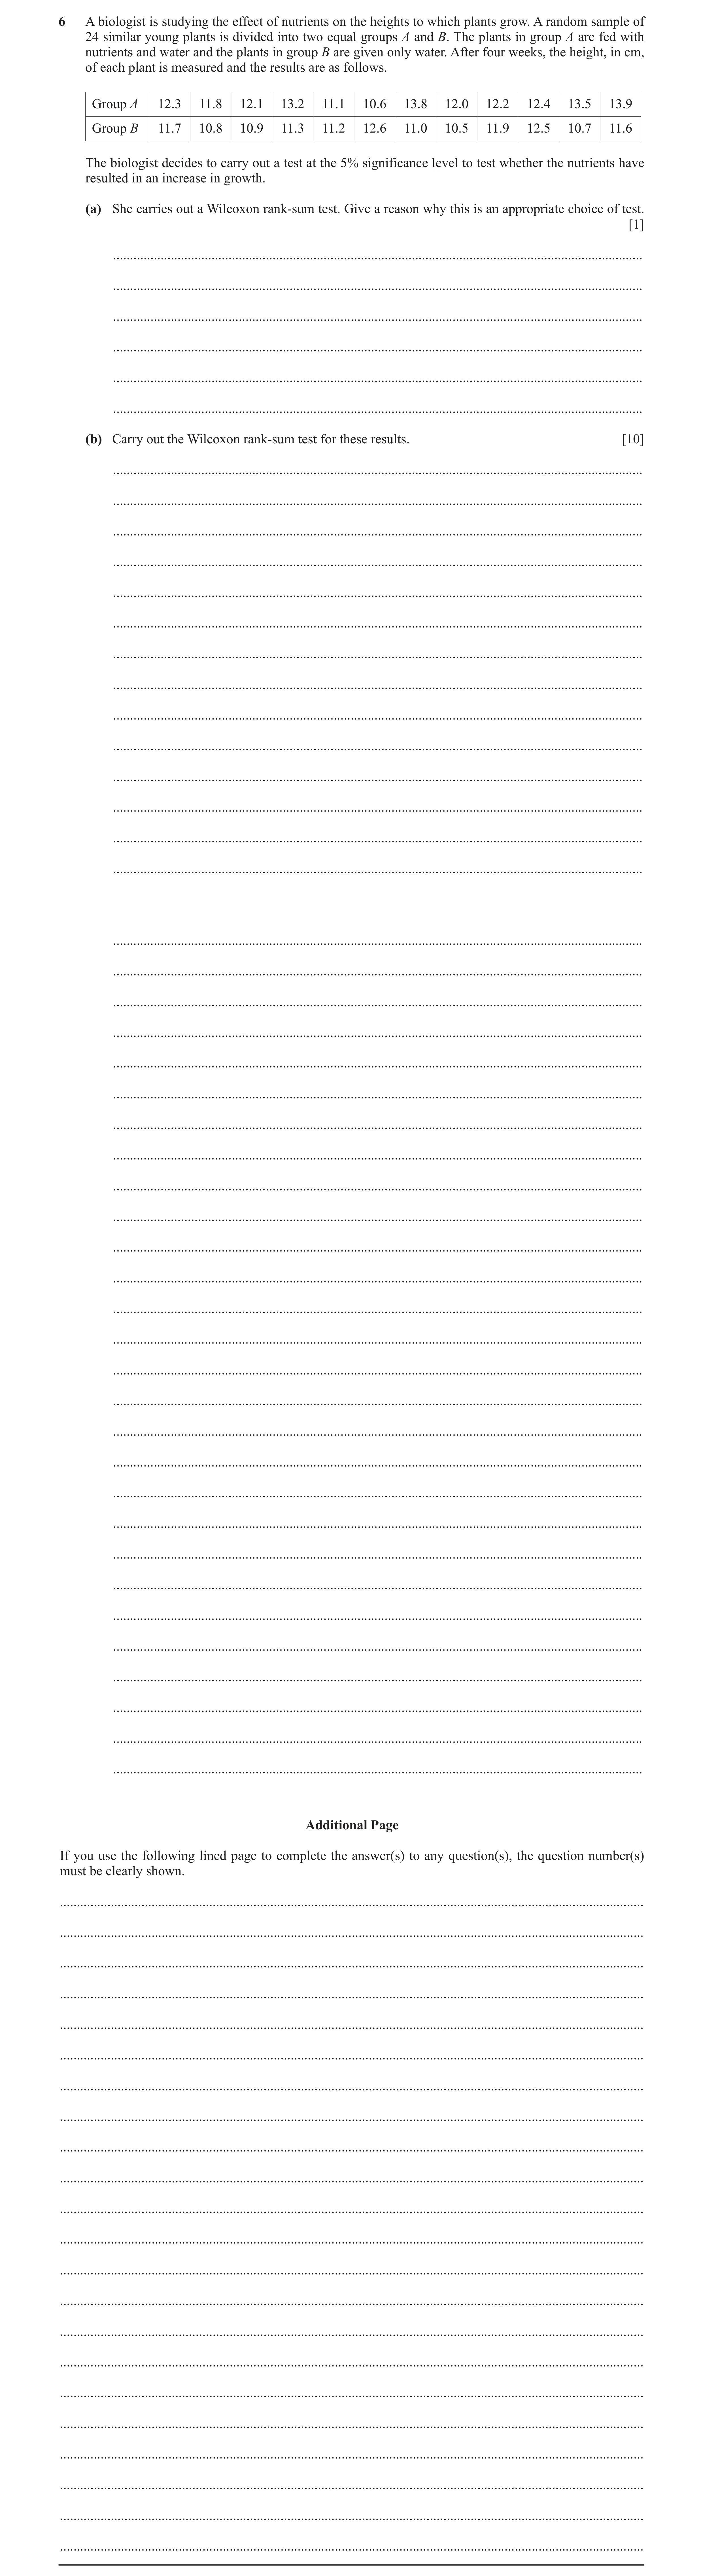
 6 / 64
 7 / 64
 8 / 64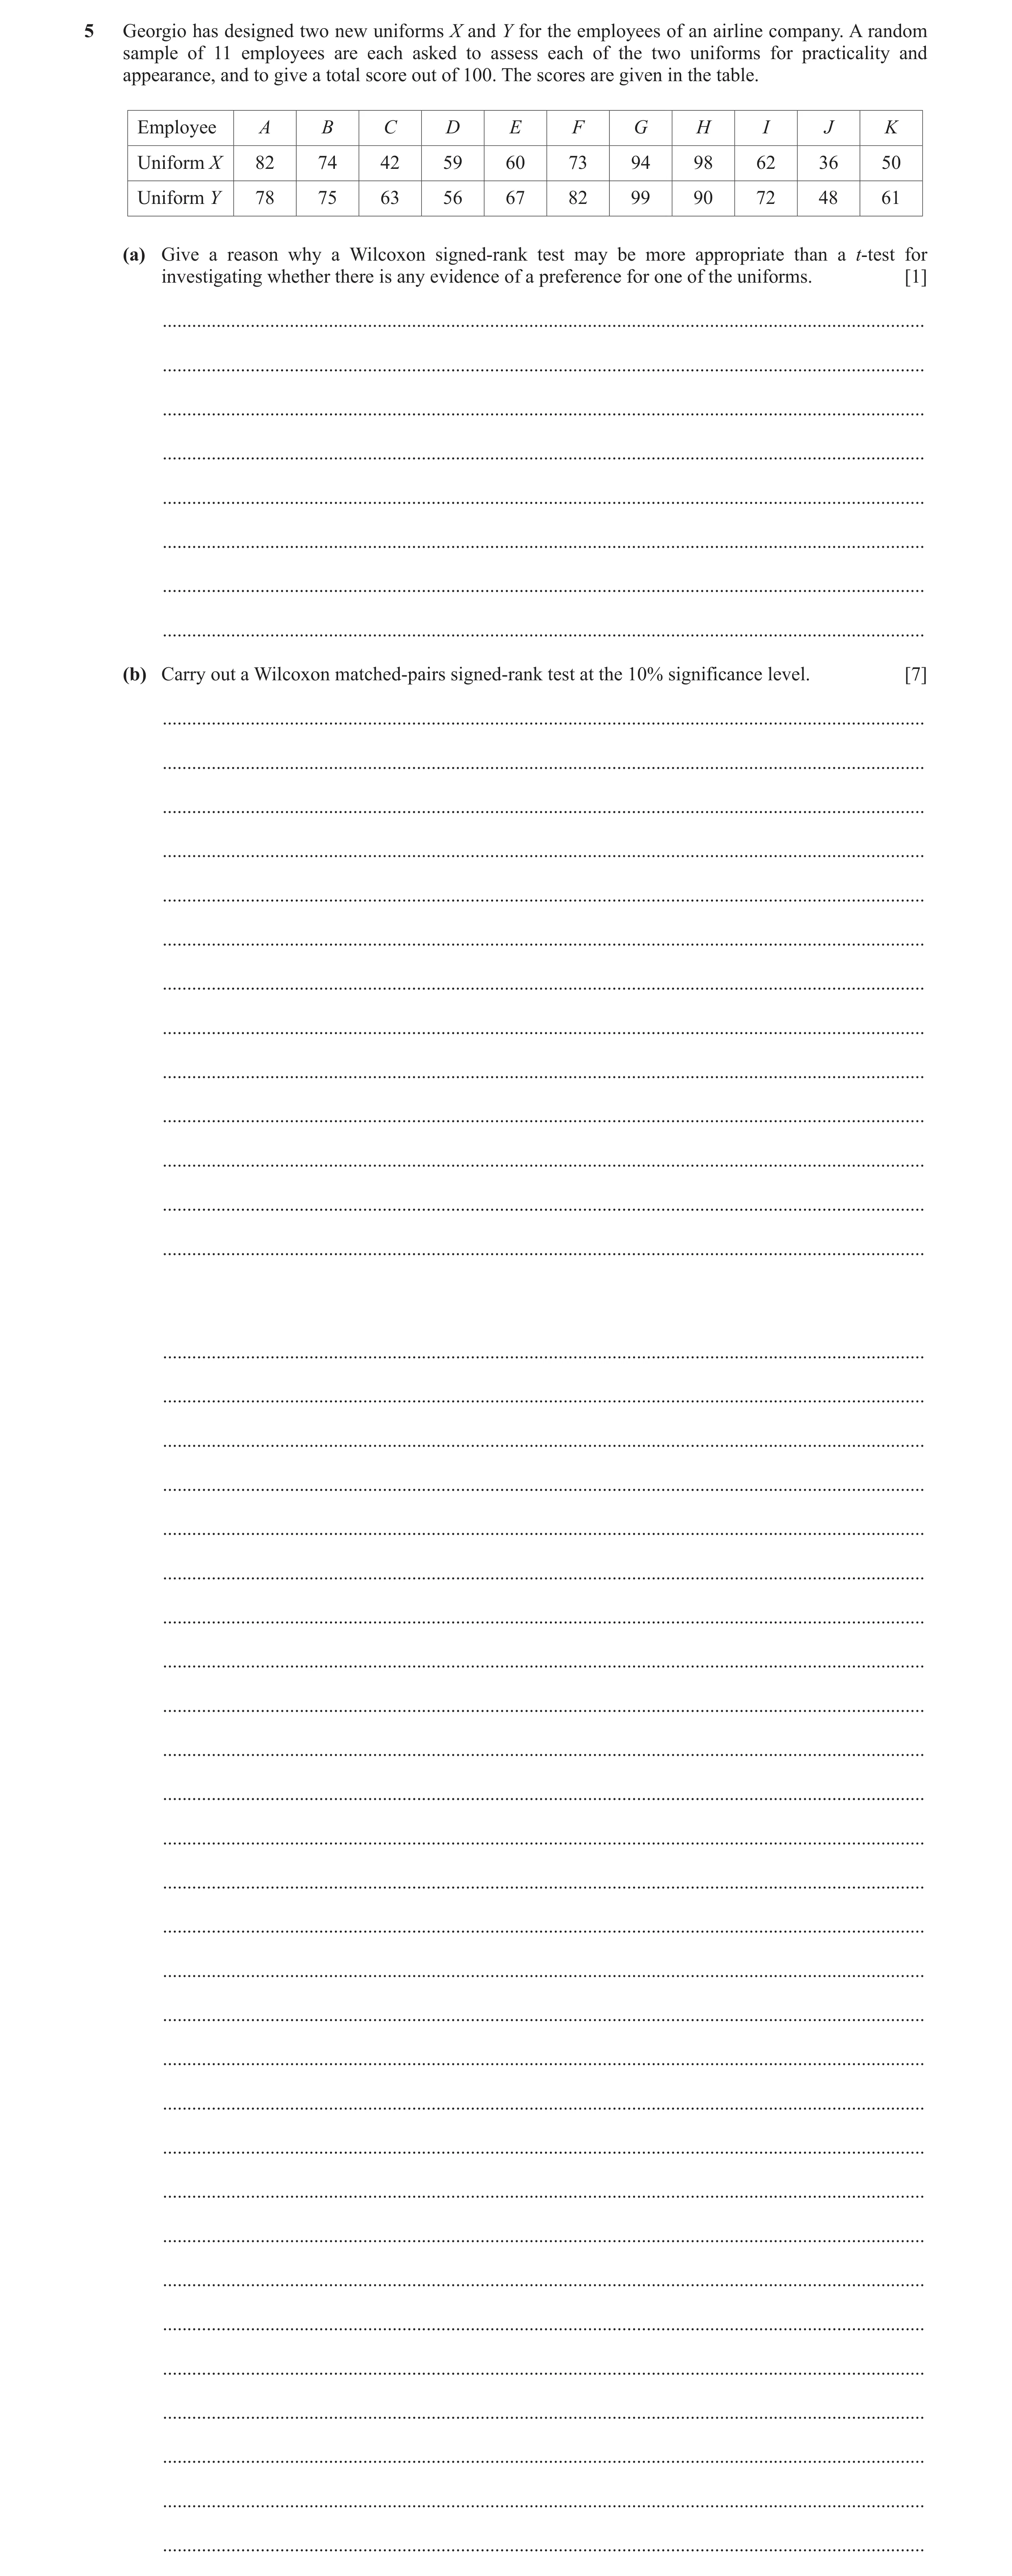
 13 / 64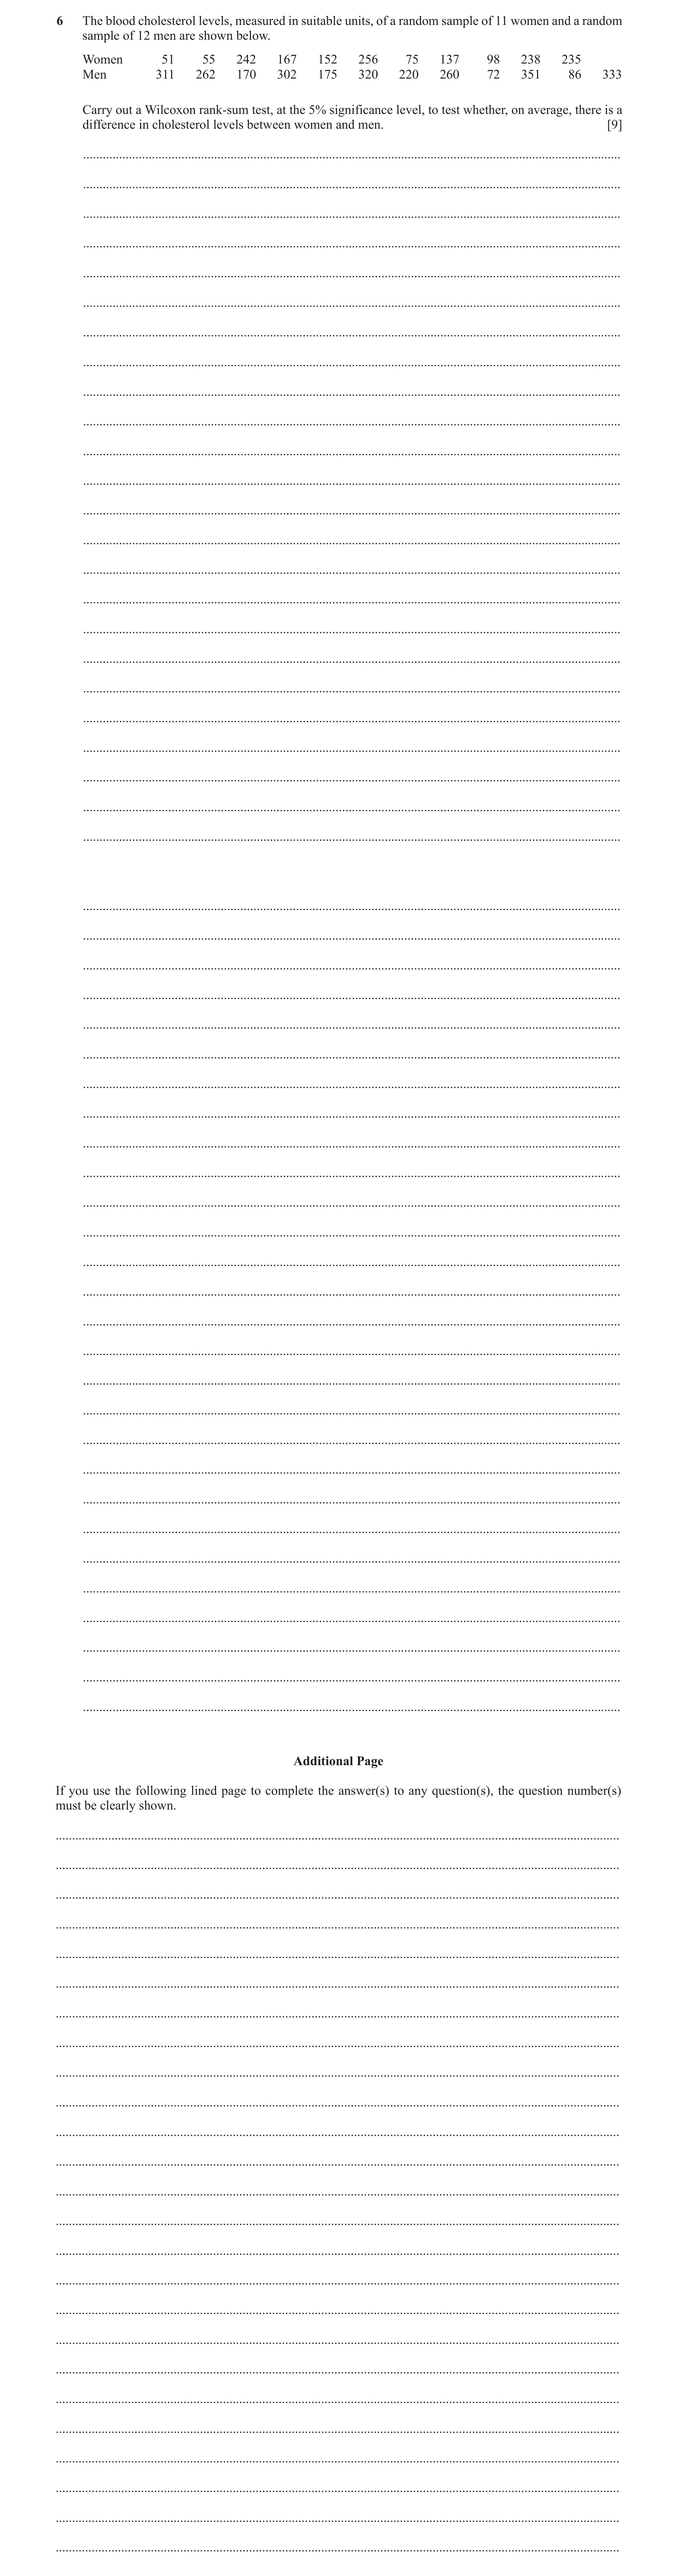
 49 / 64
 50 / 64
 51 / 64
 52 / 64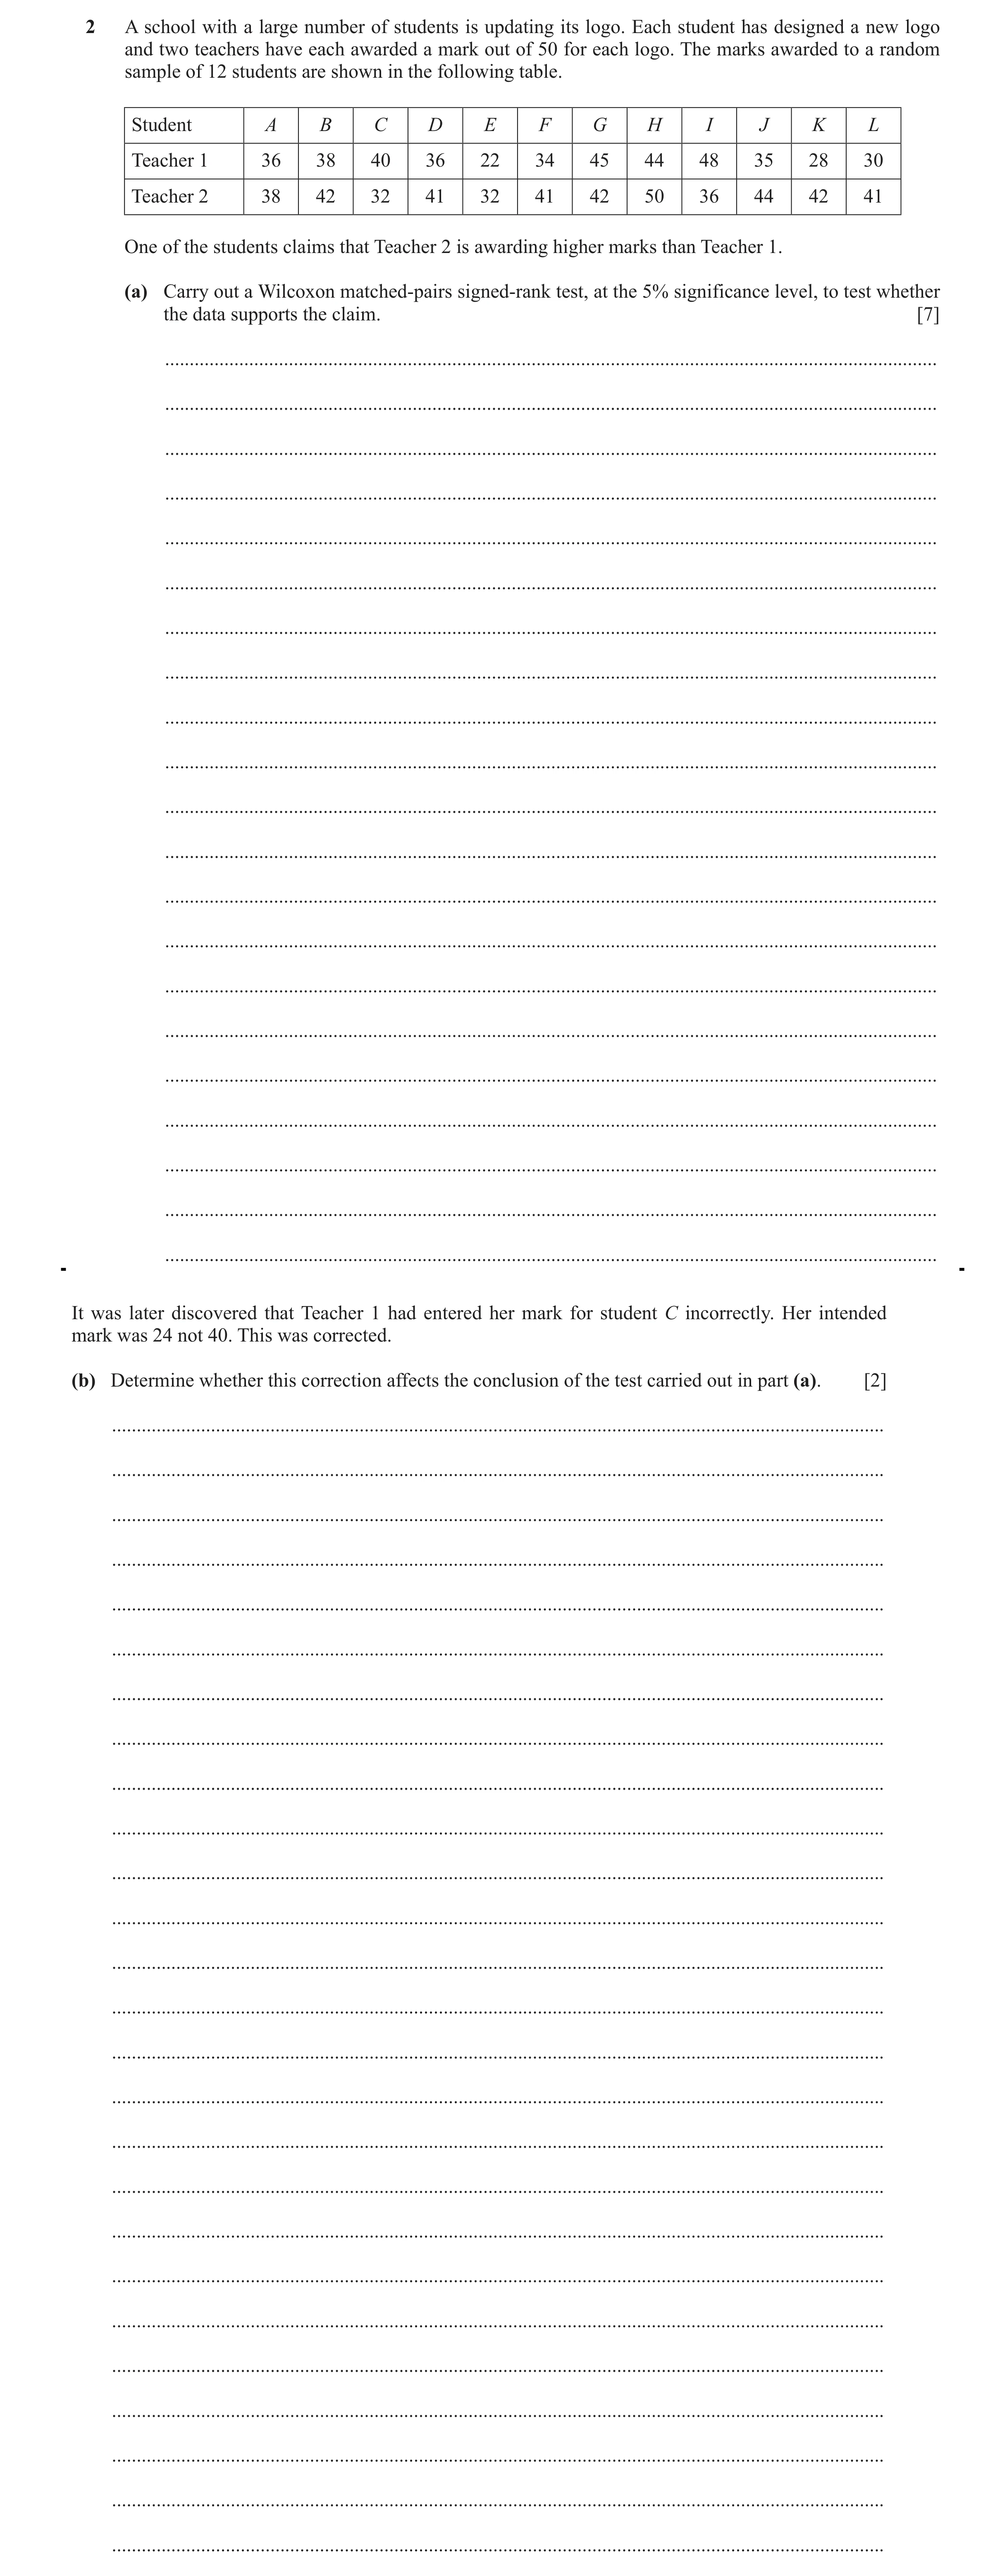
 57 / 64
 58 / 64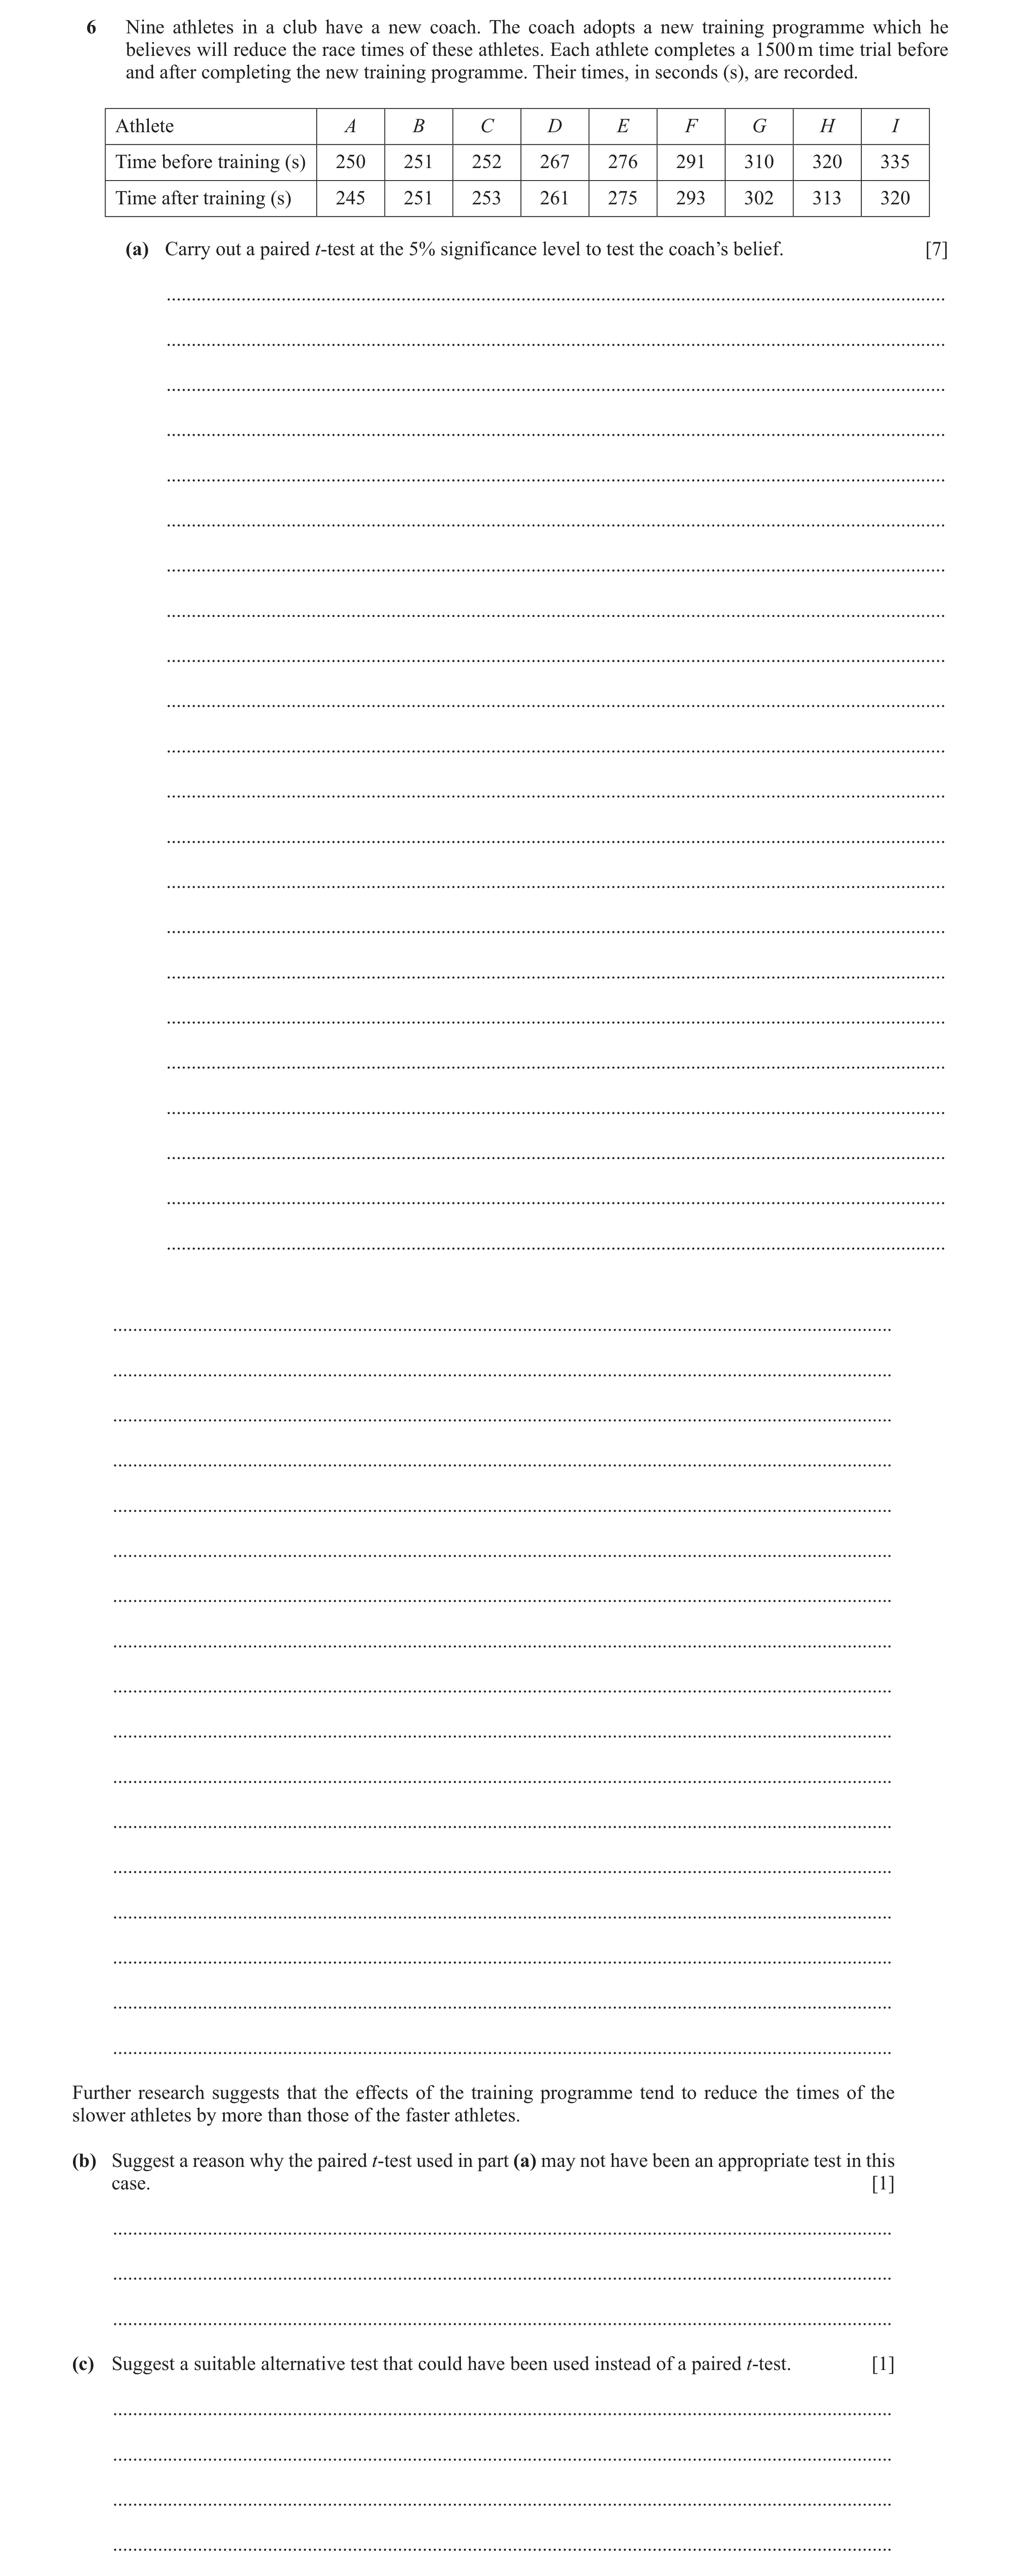
 61 / 64
 62 / 64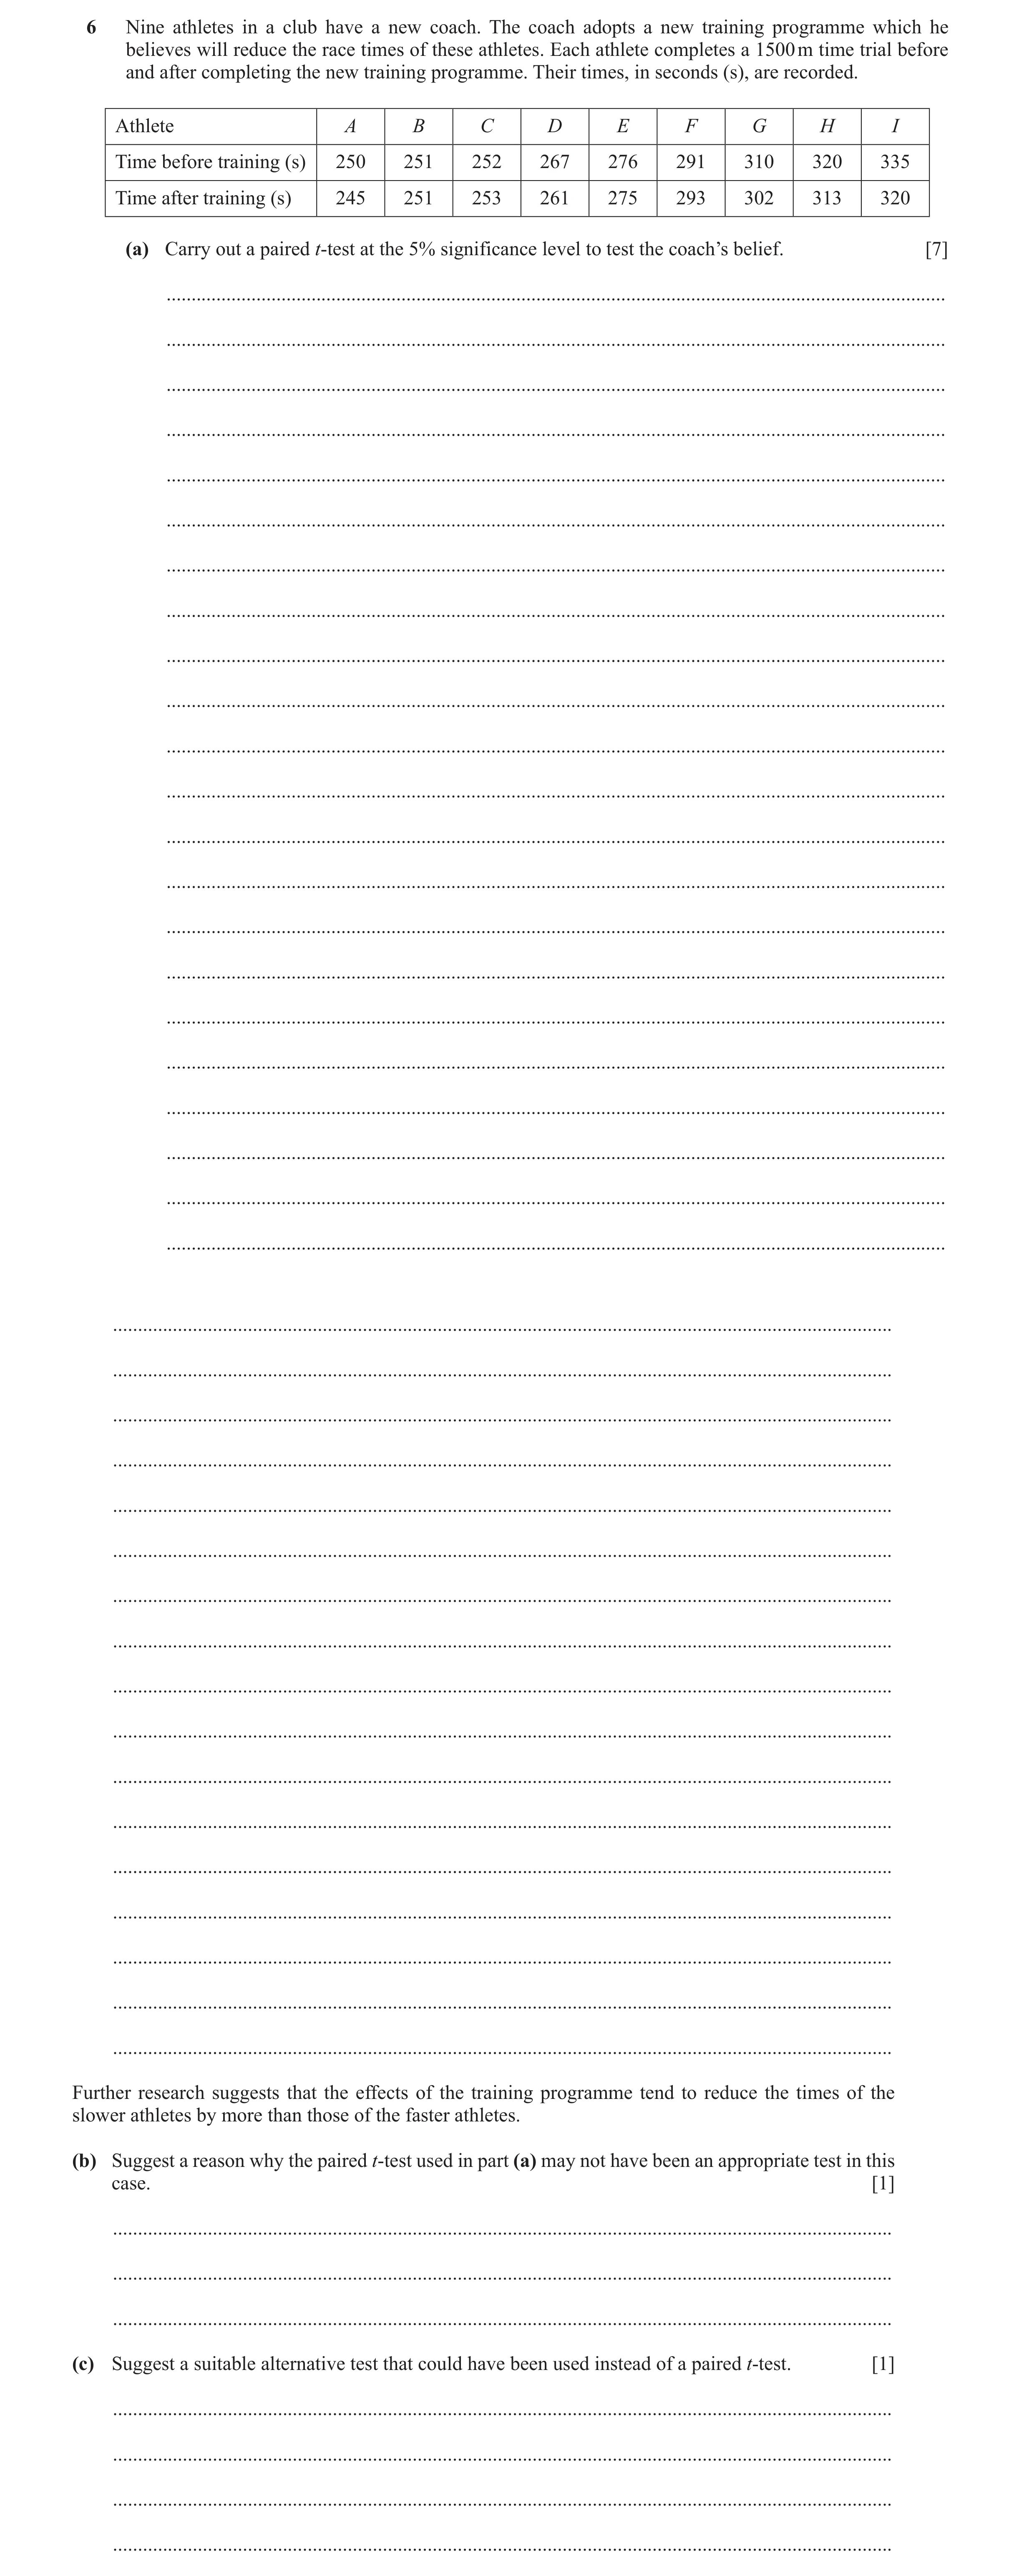
 7
7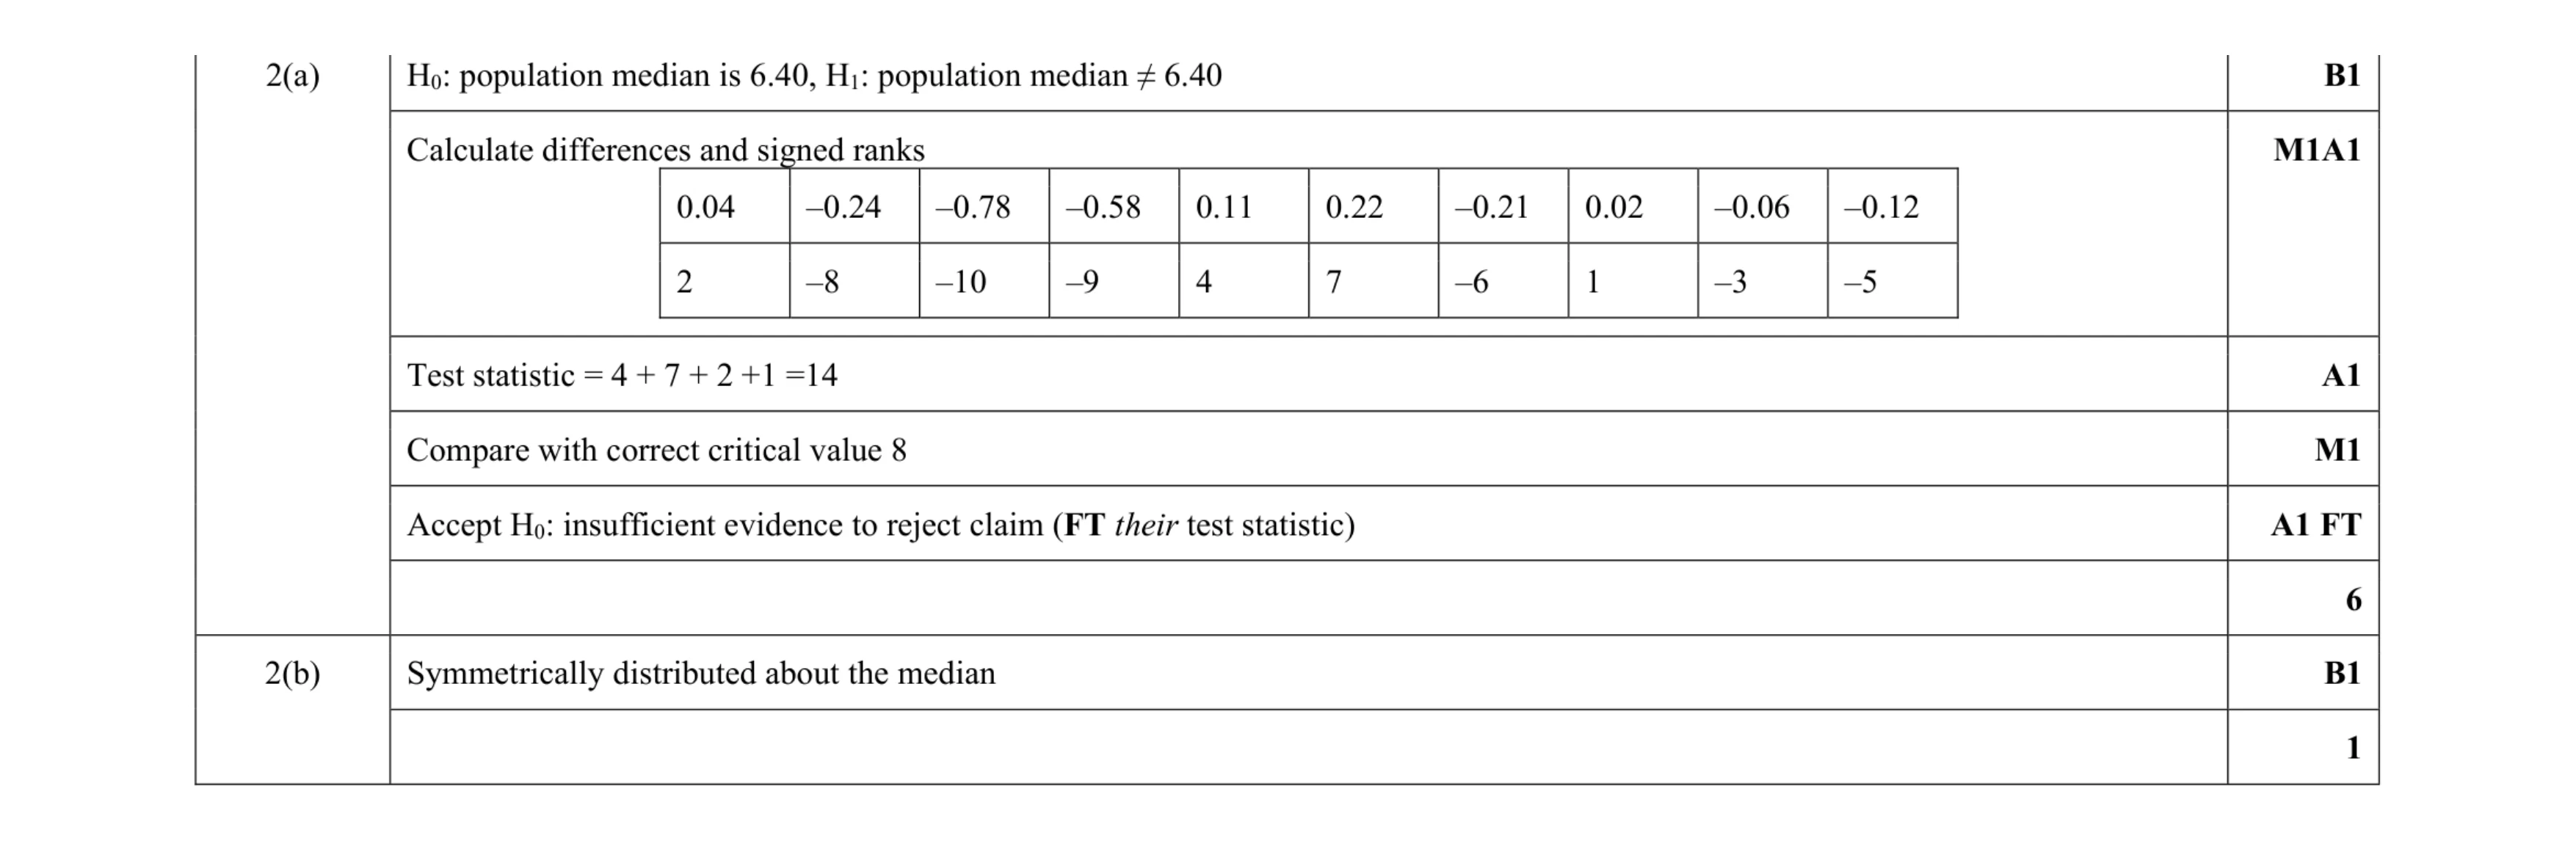 7
7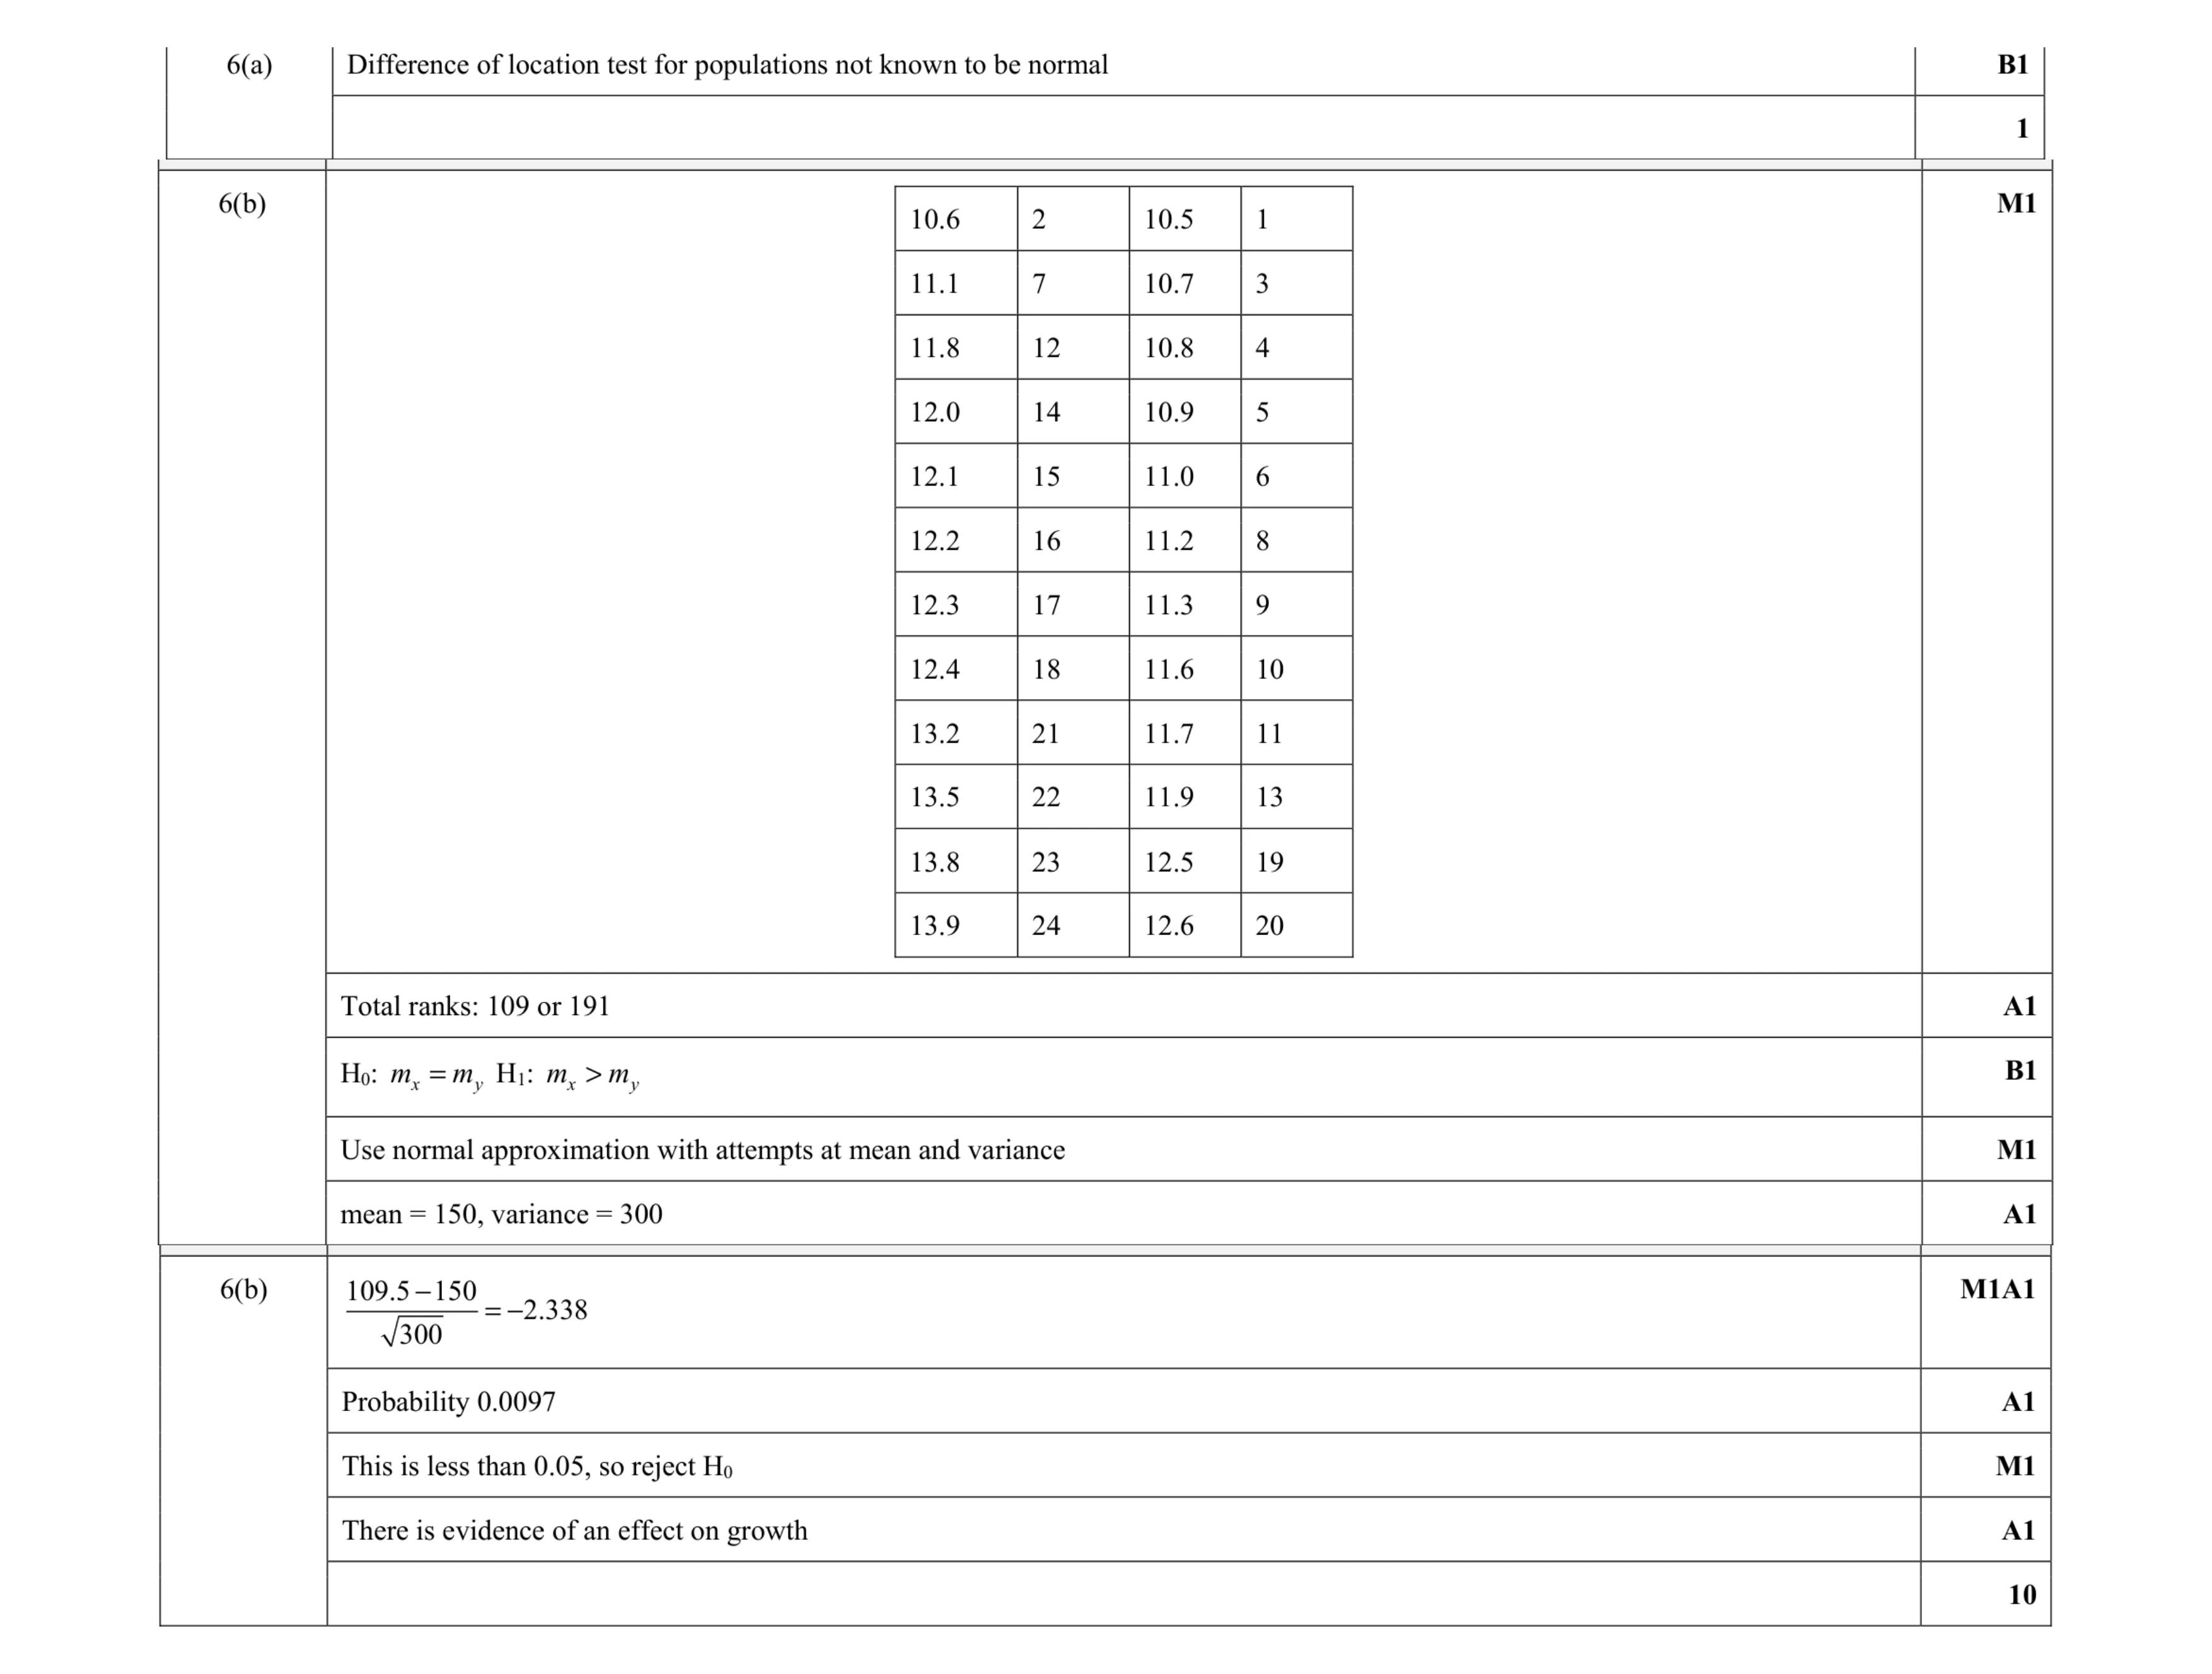 11
11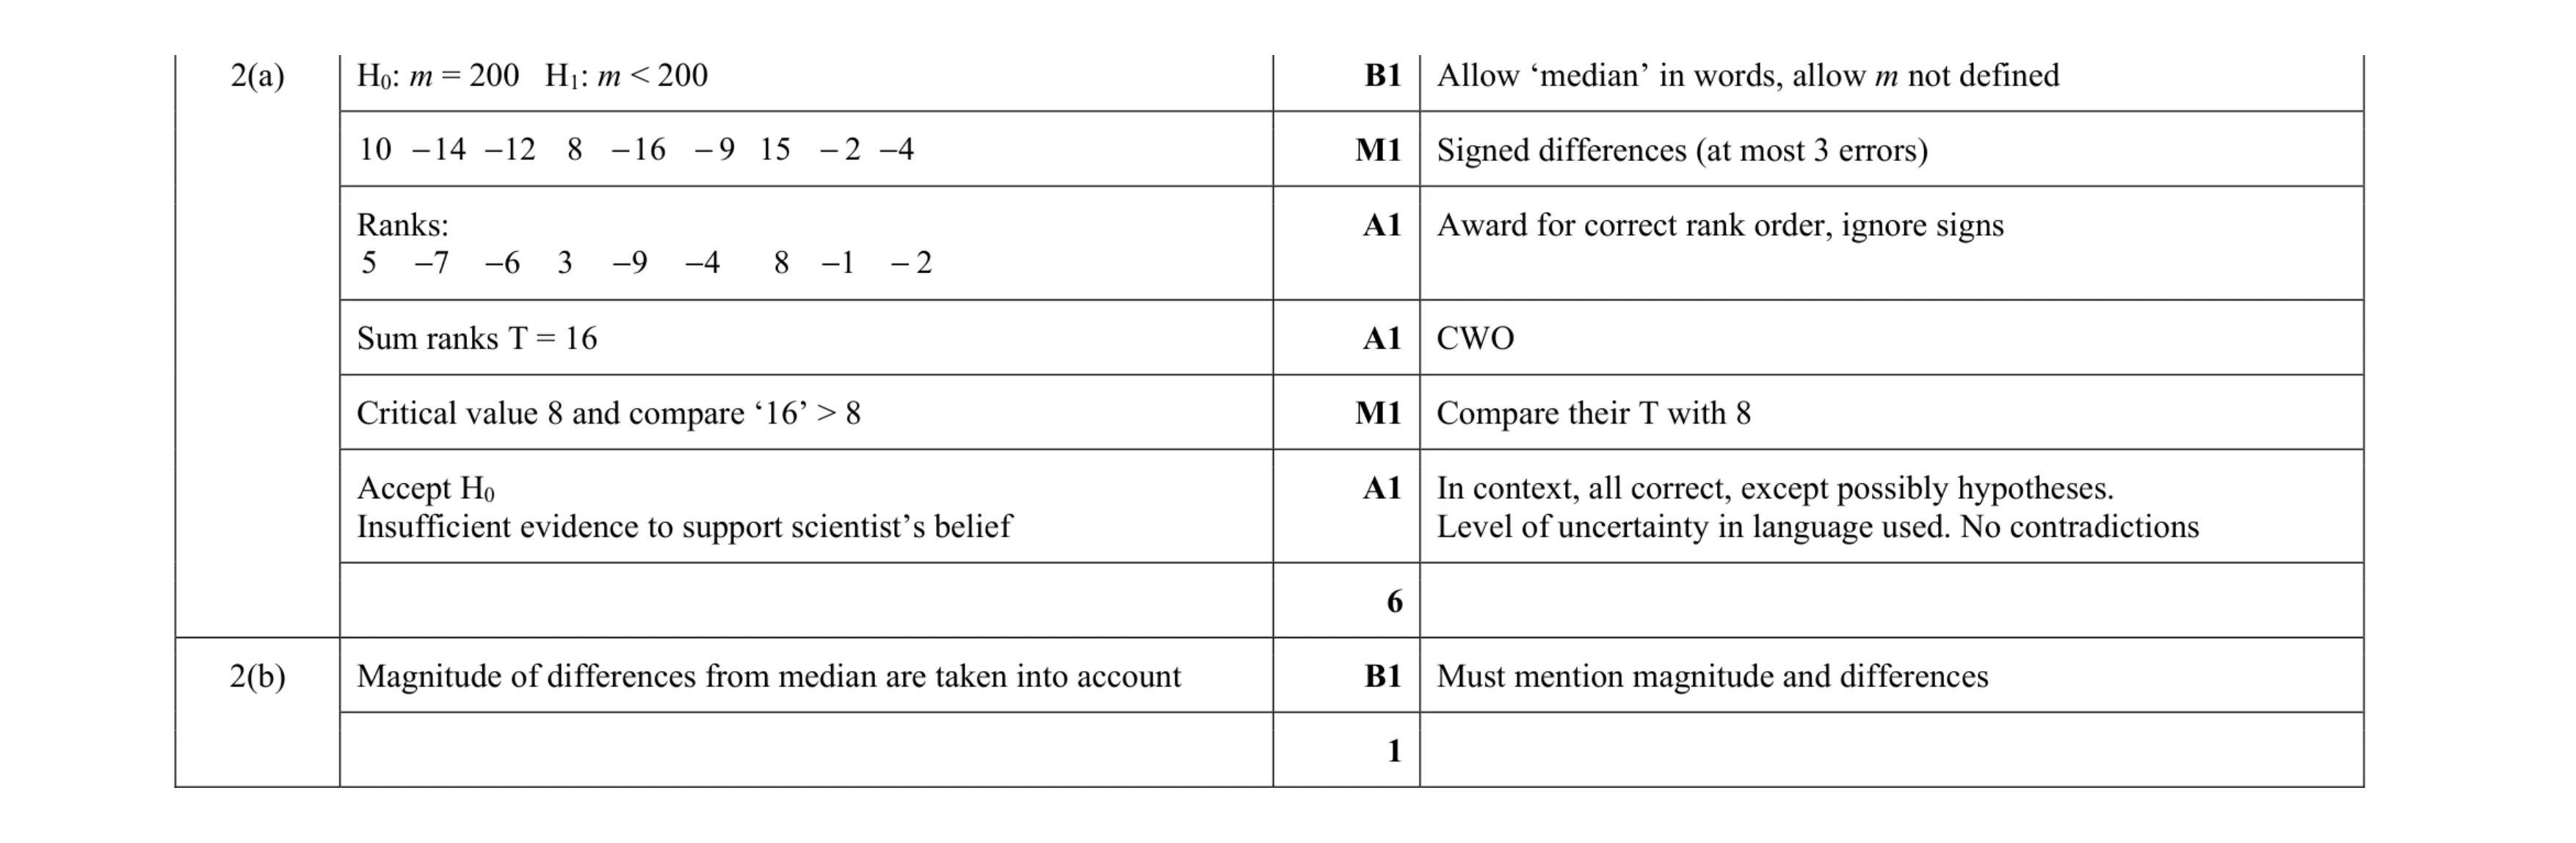 7
7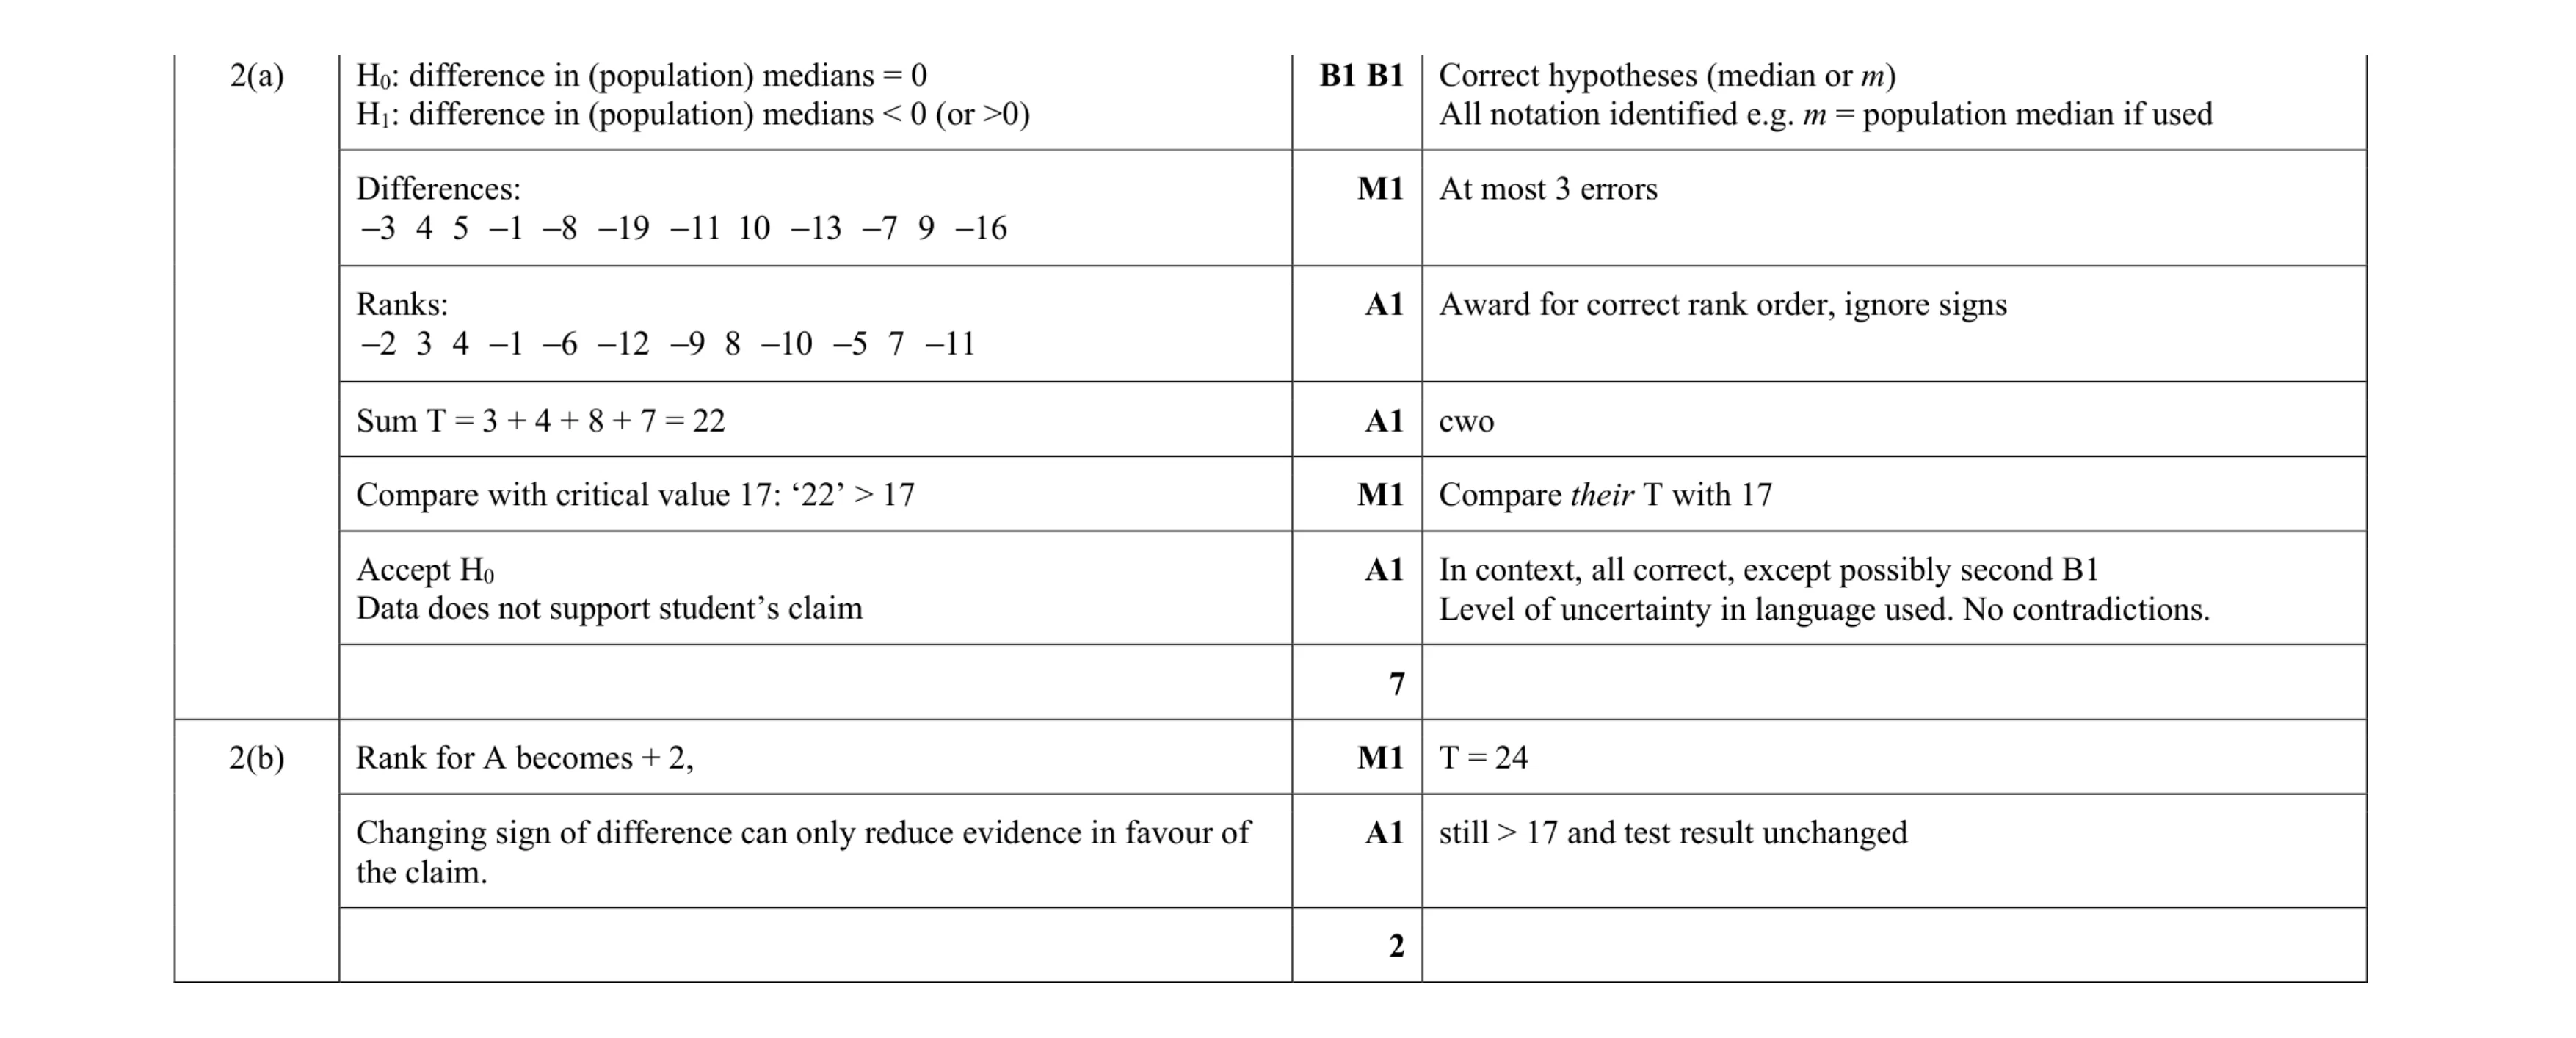 9
9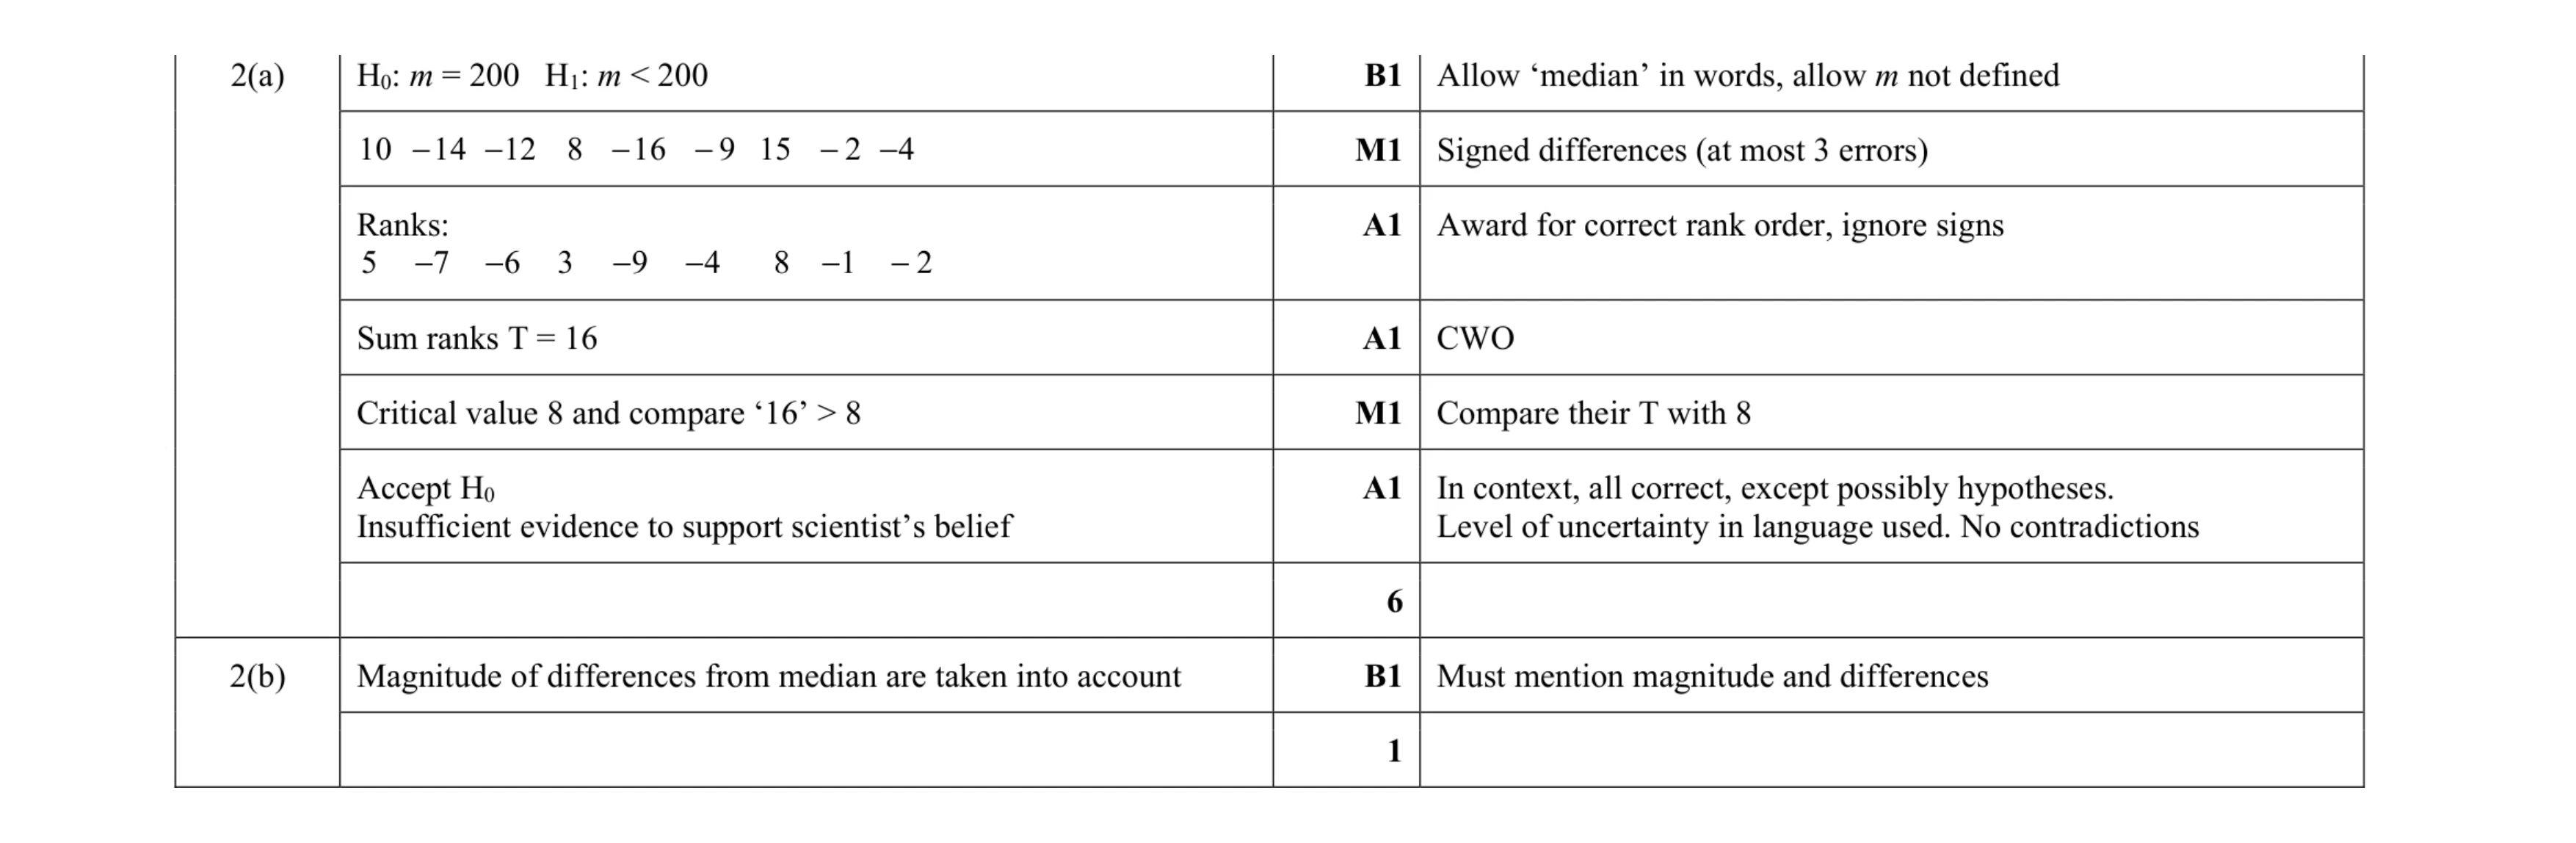 7
7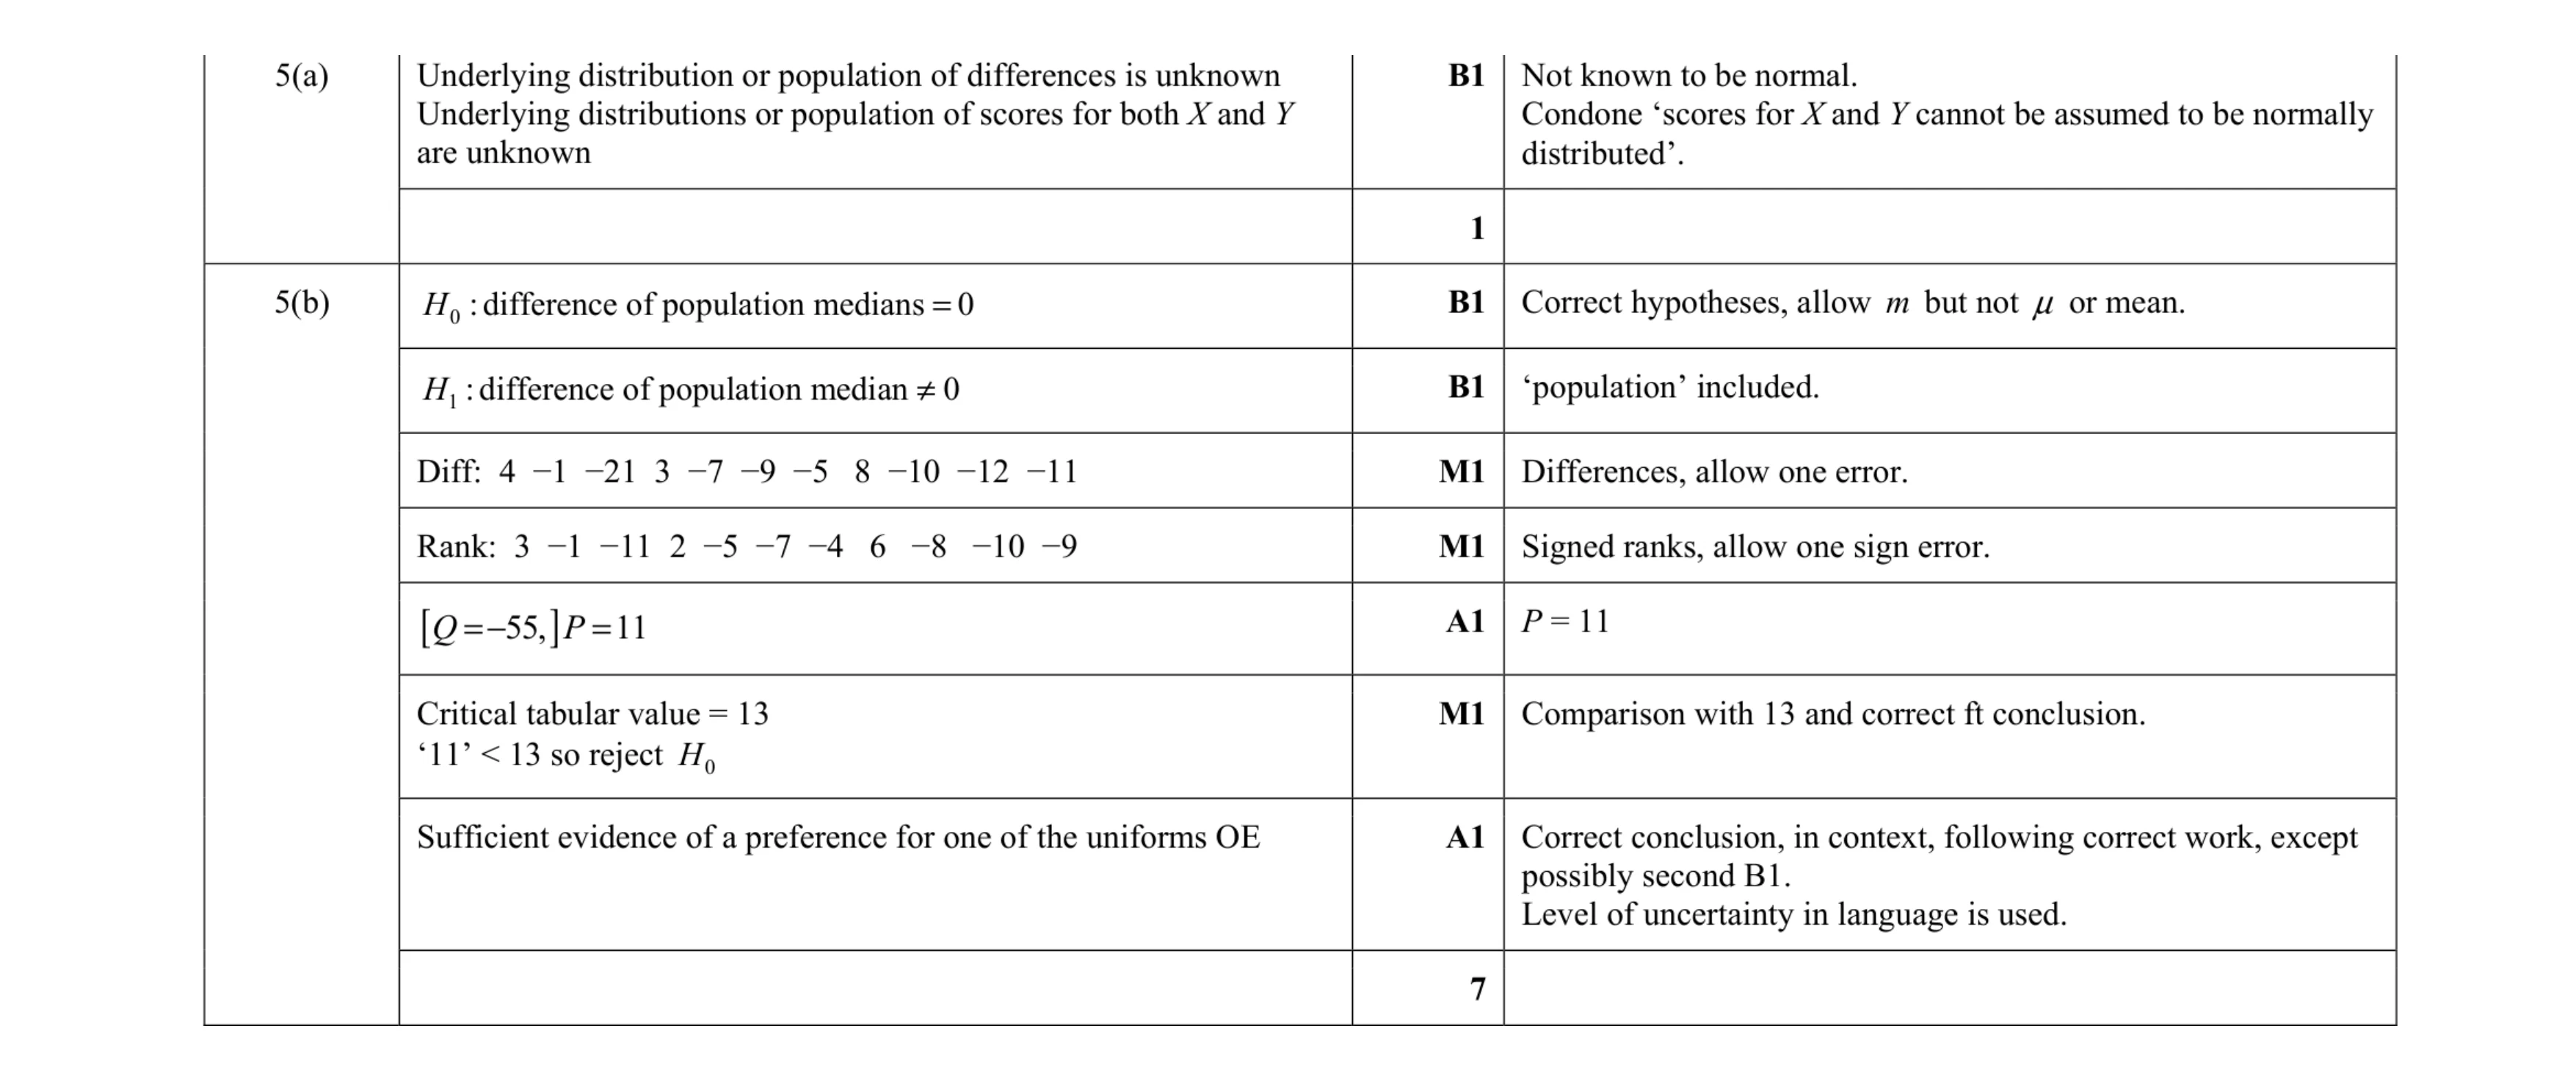 8
8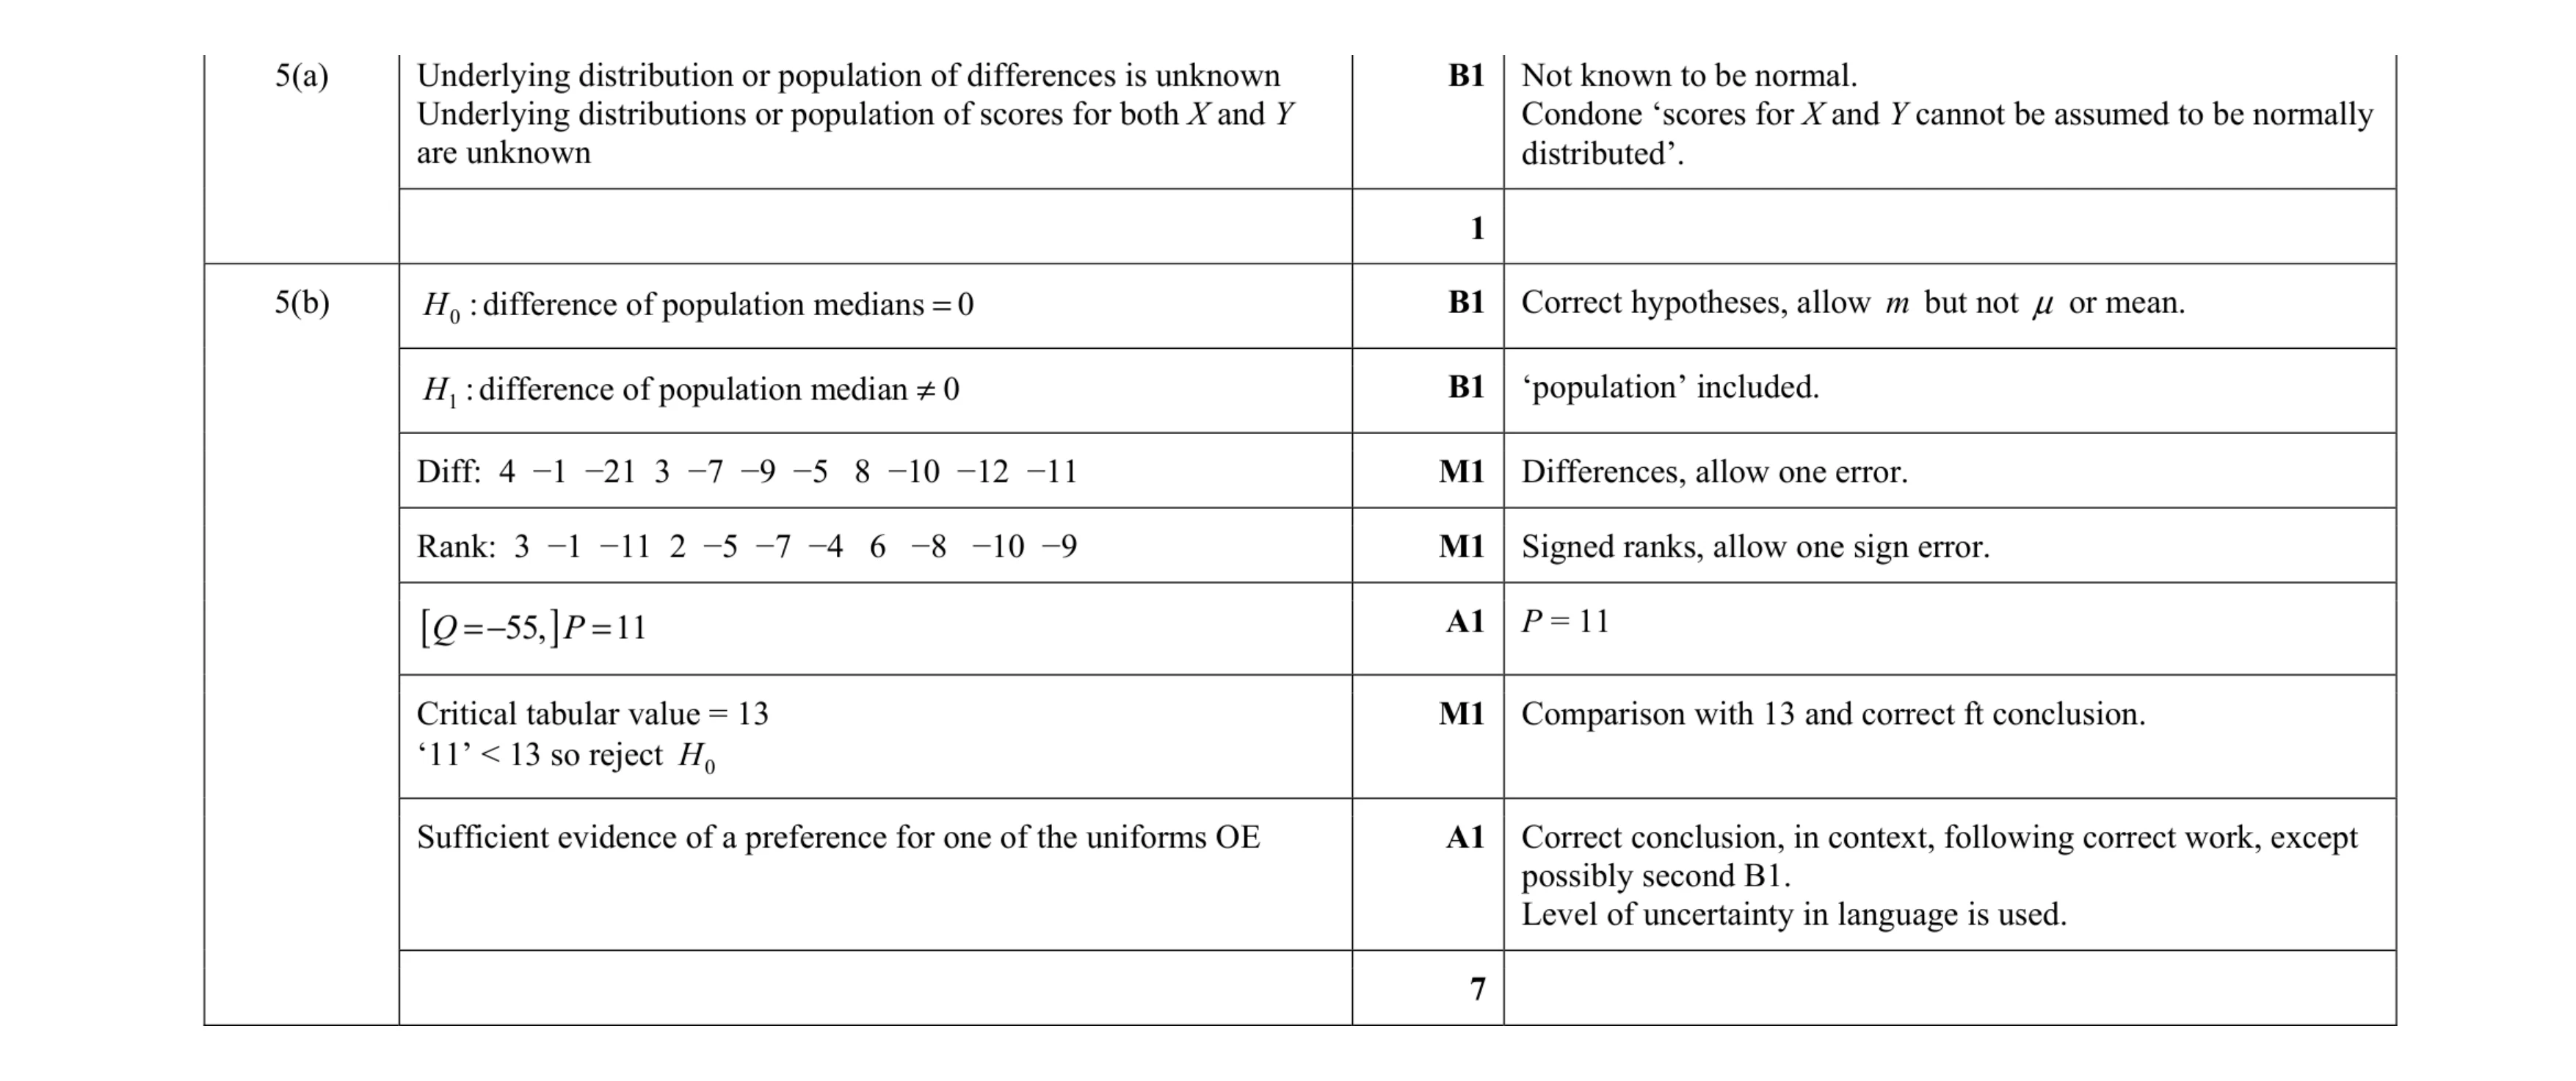 8
8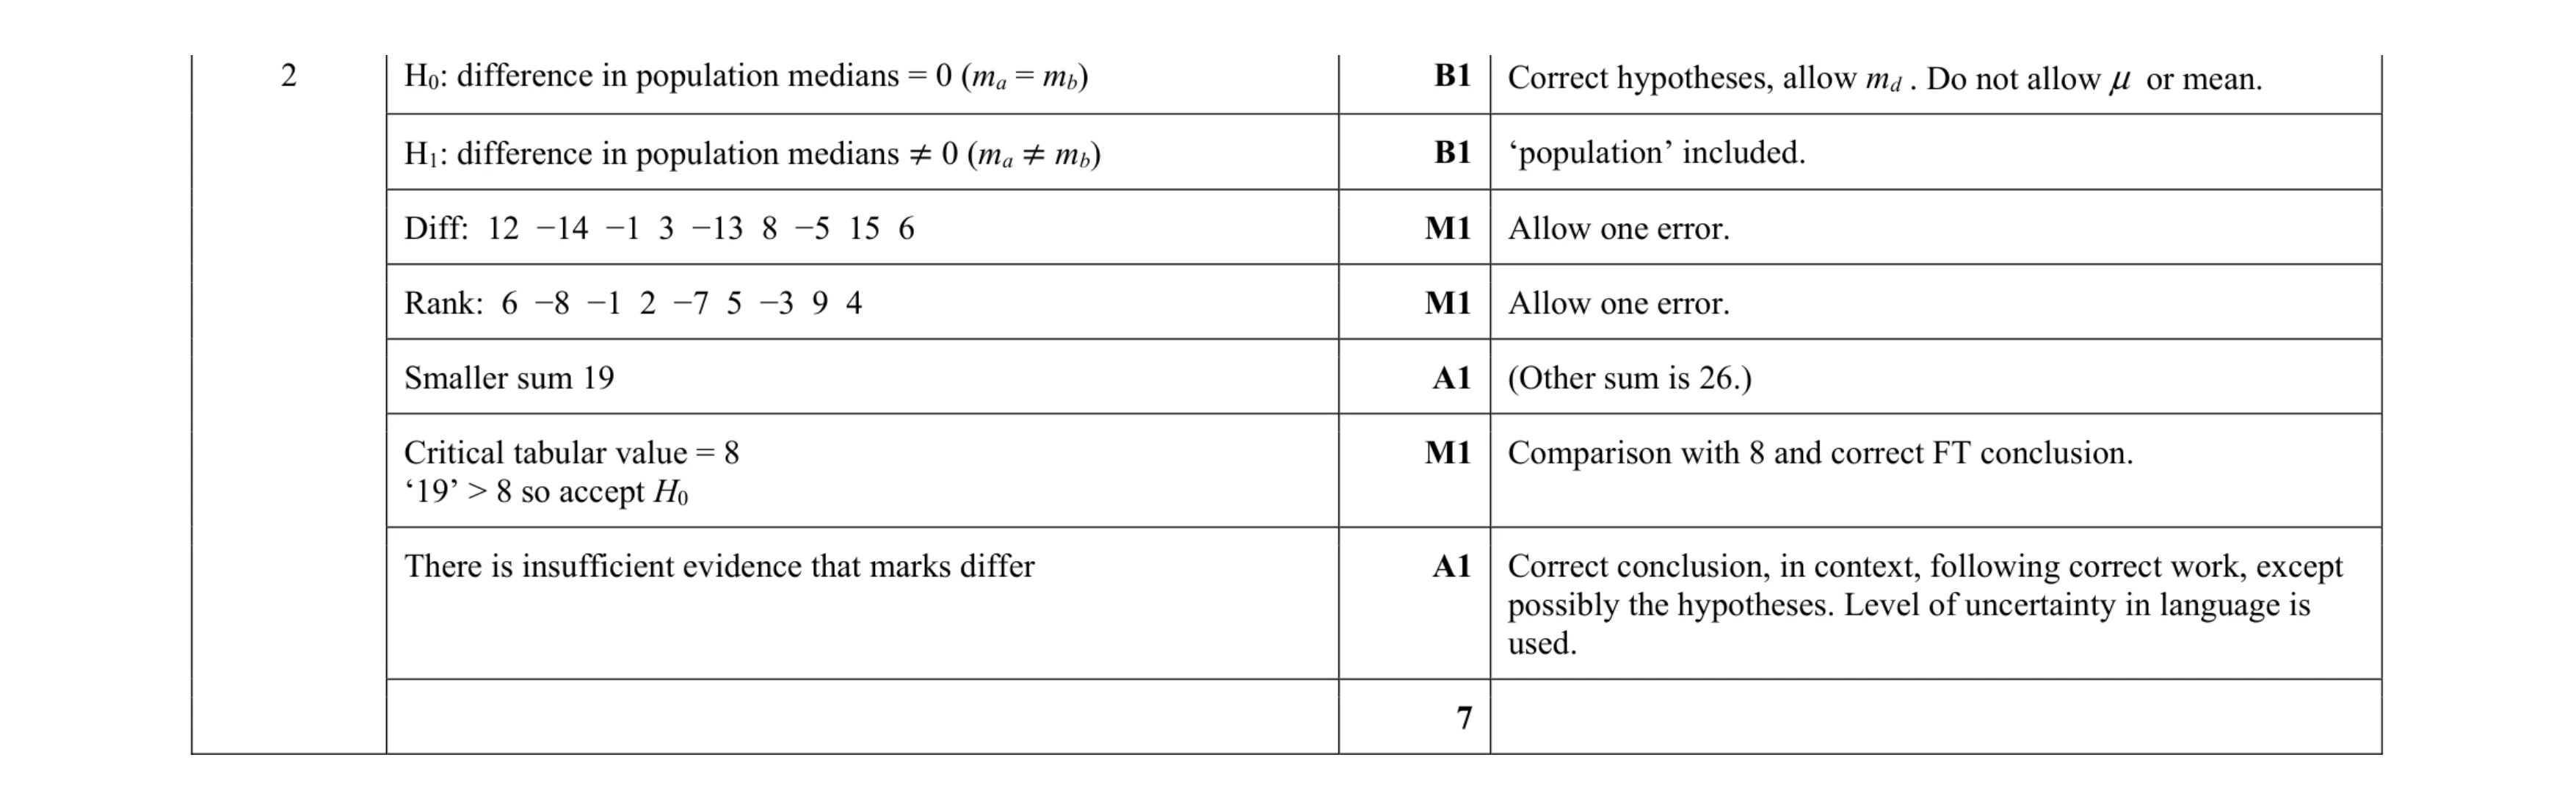 7
7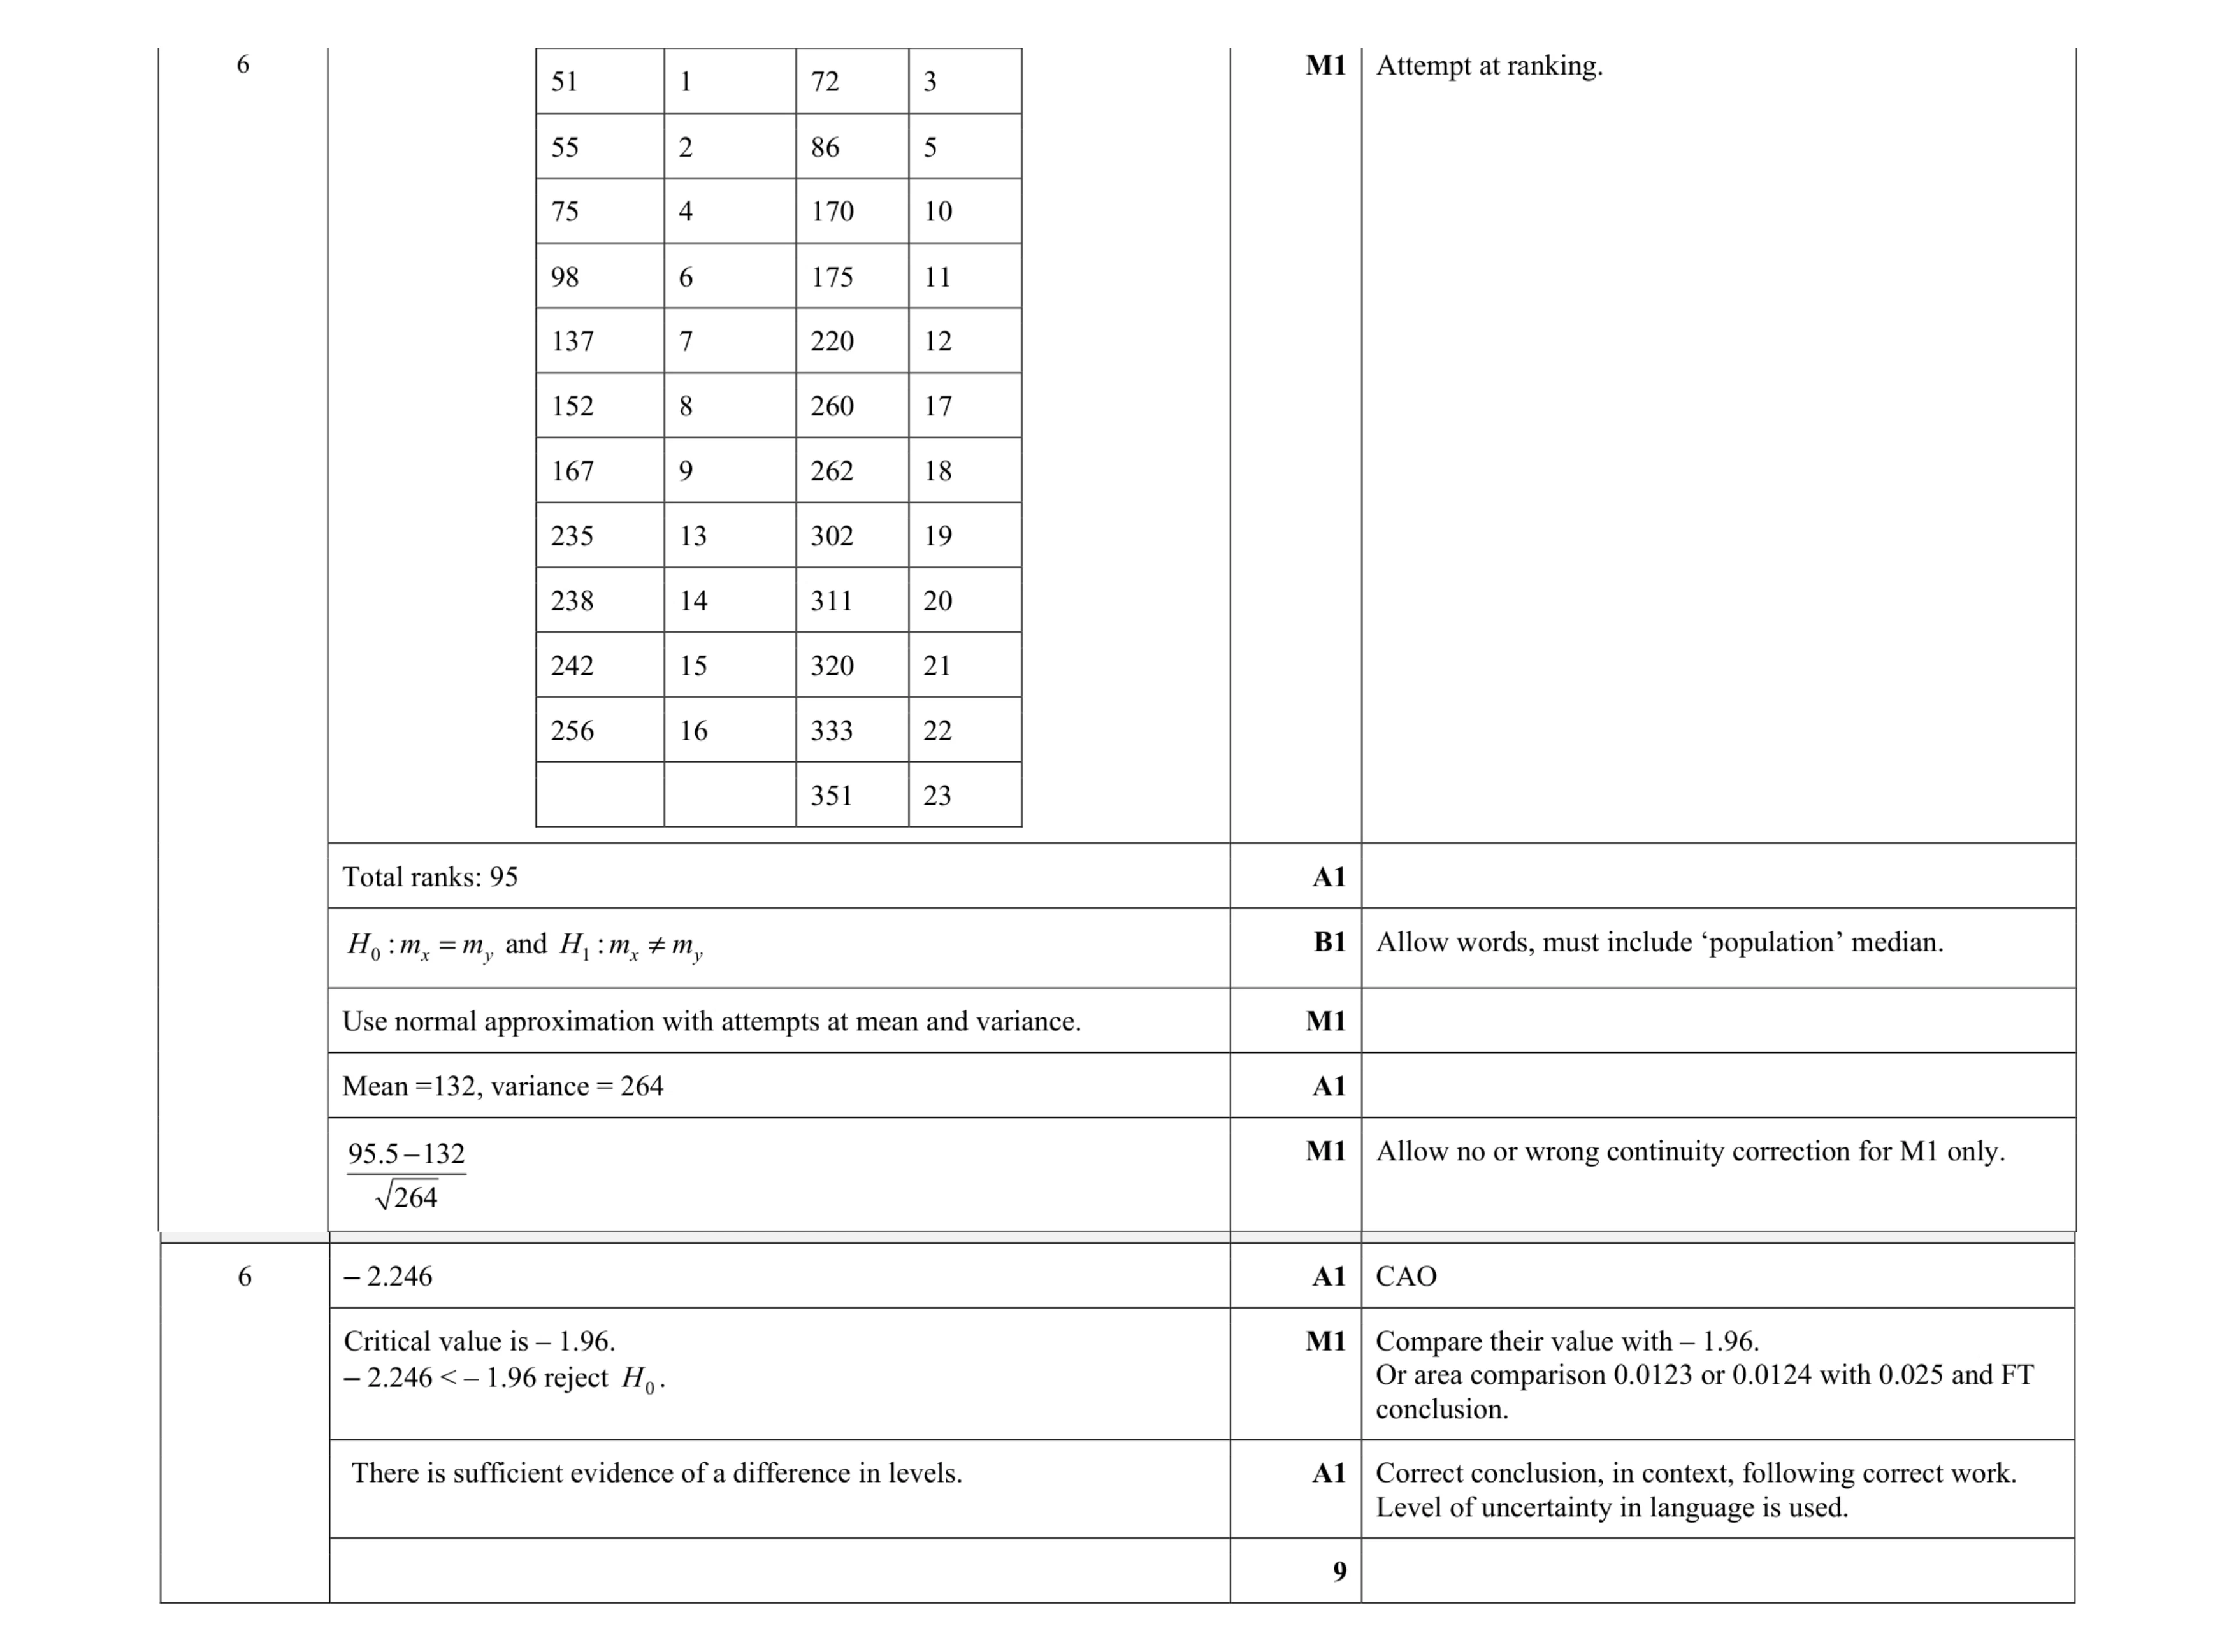 9
9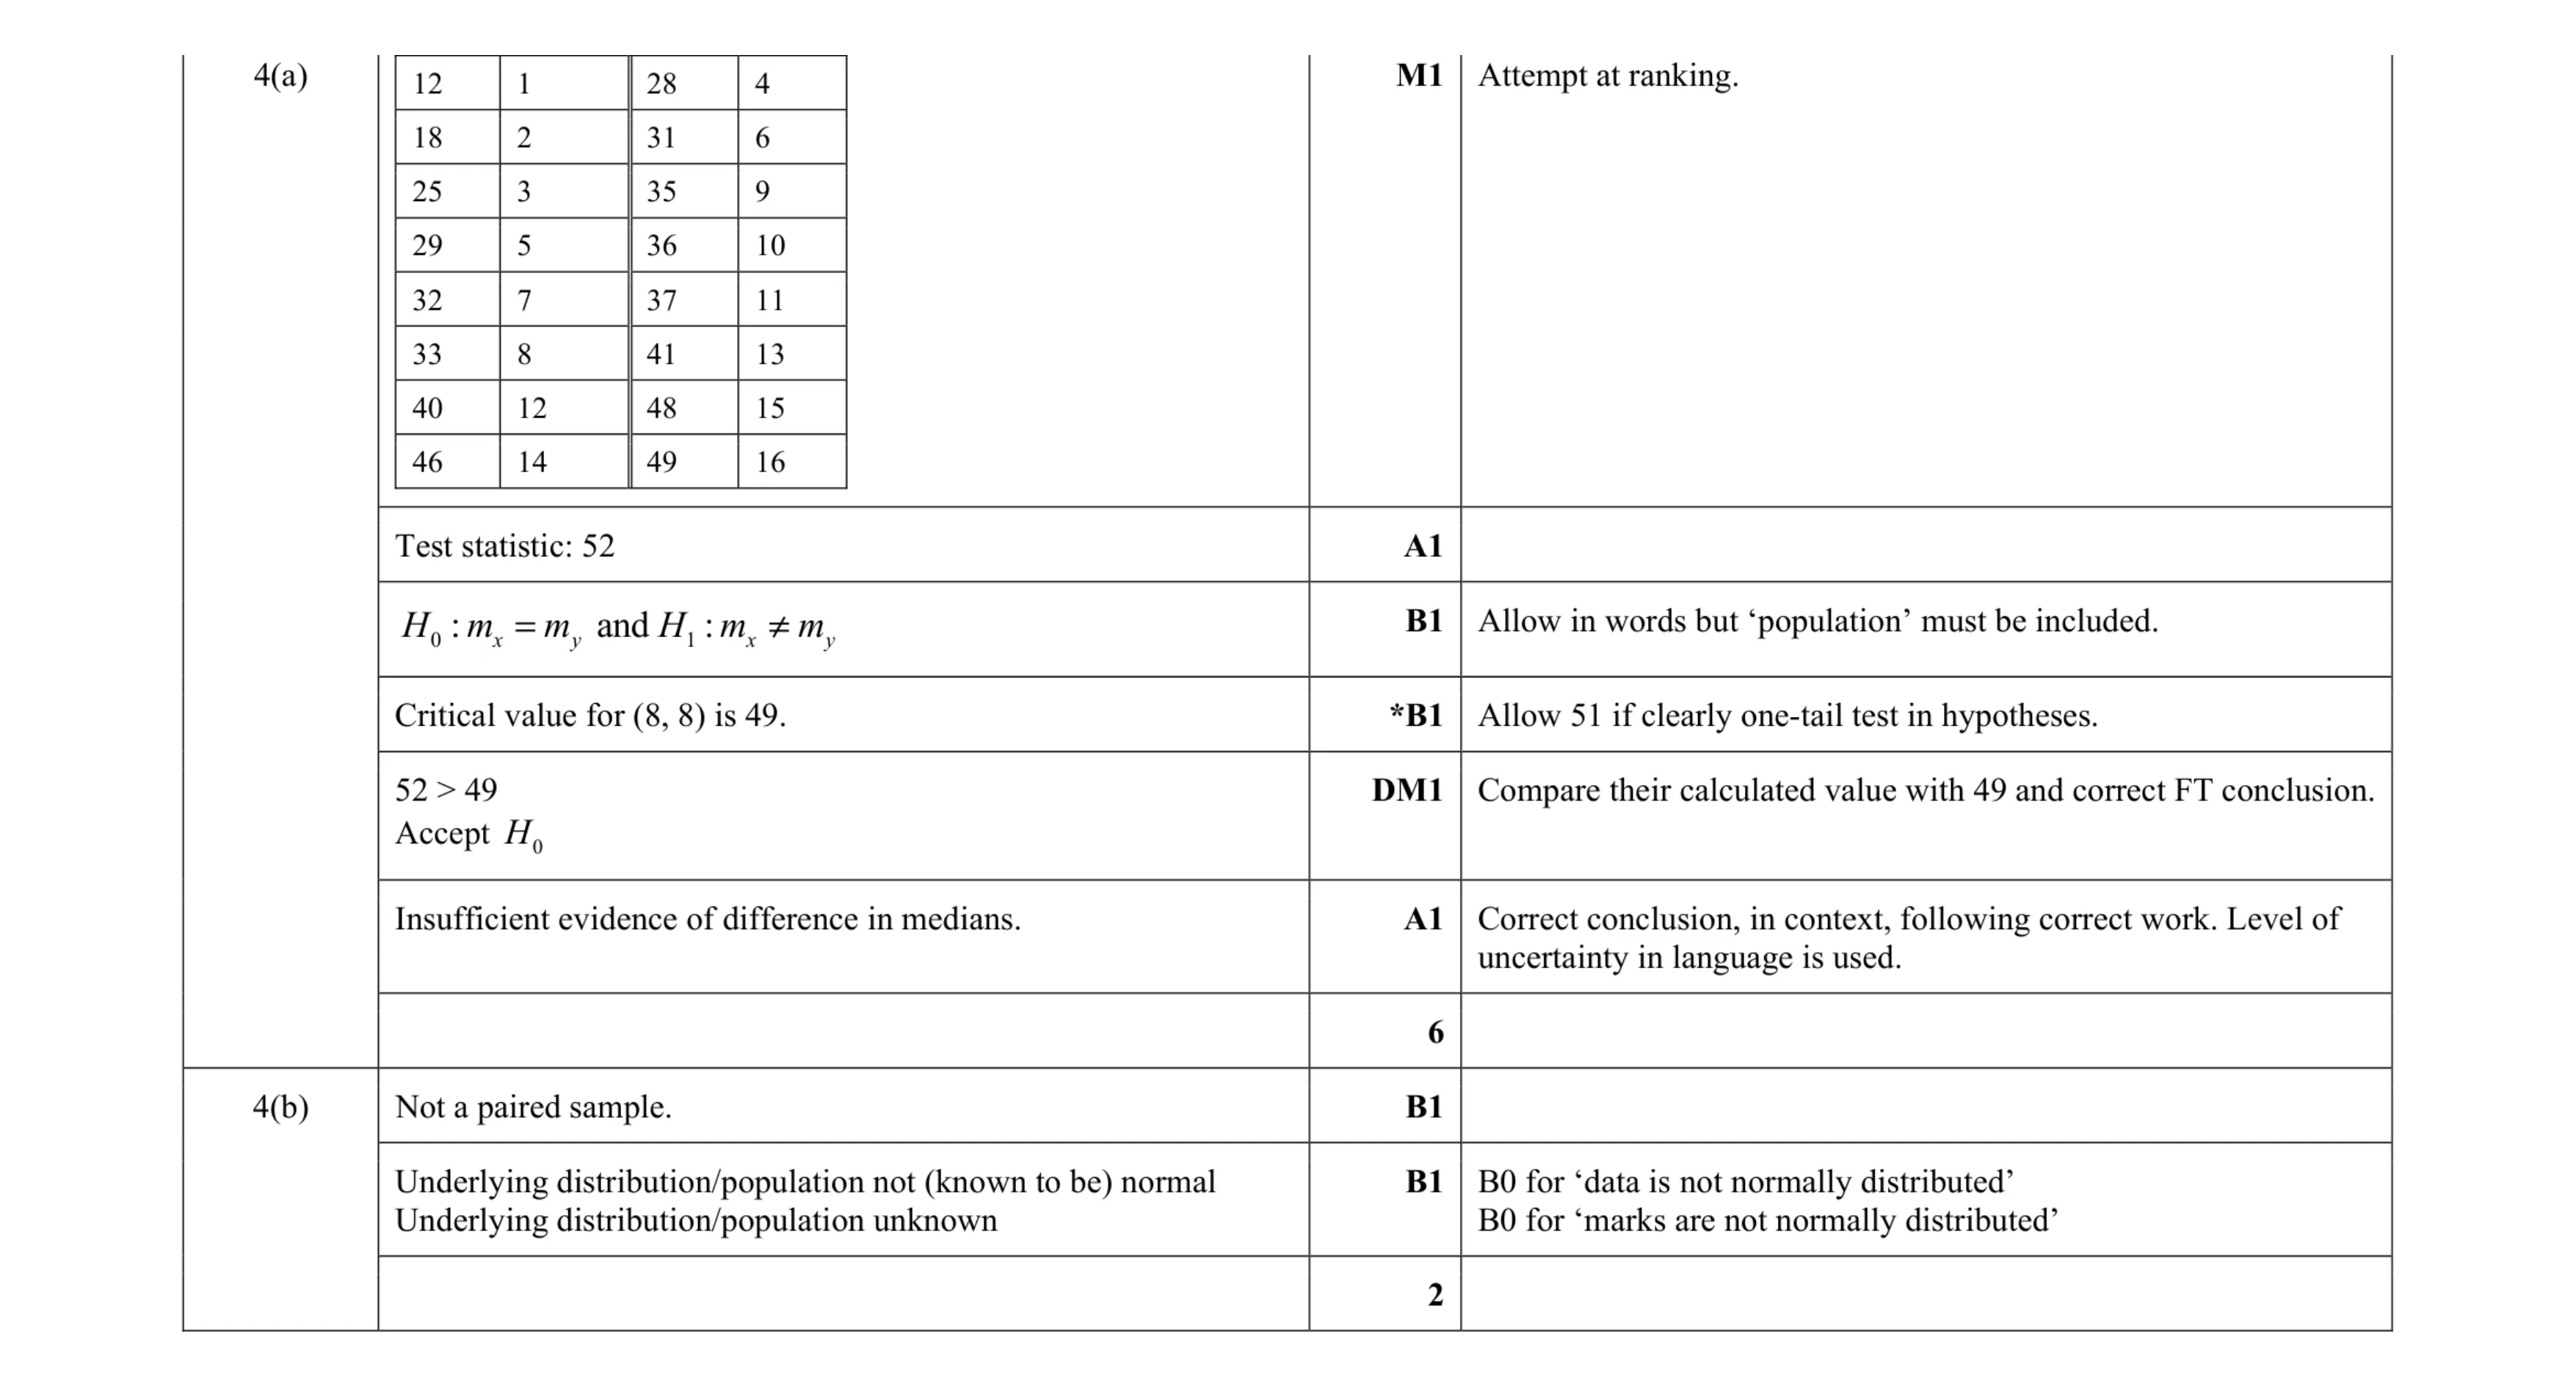 8
8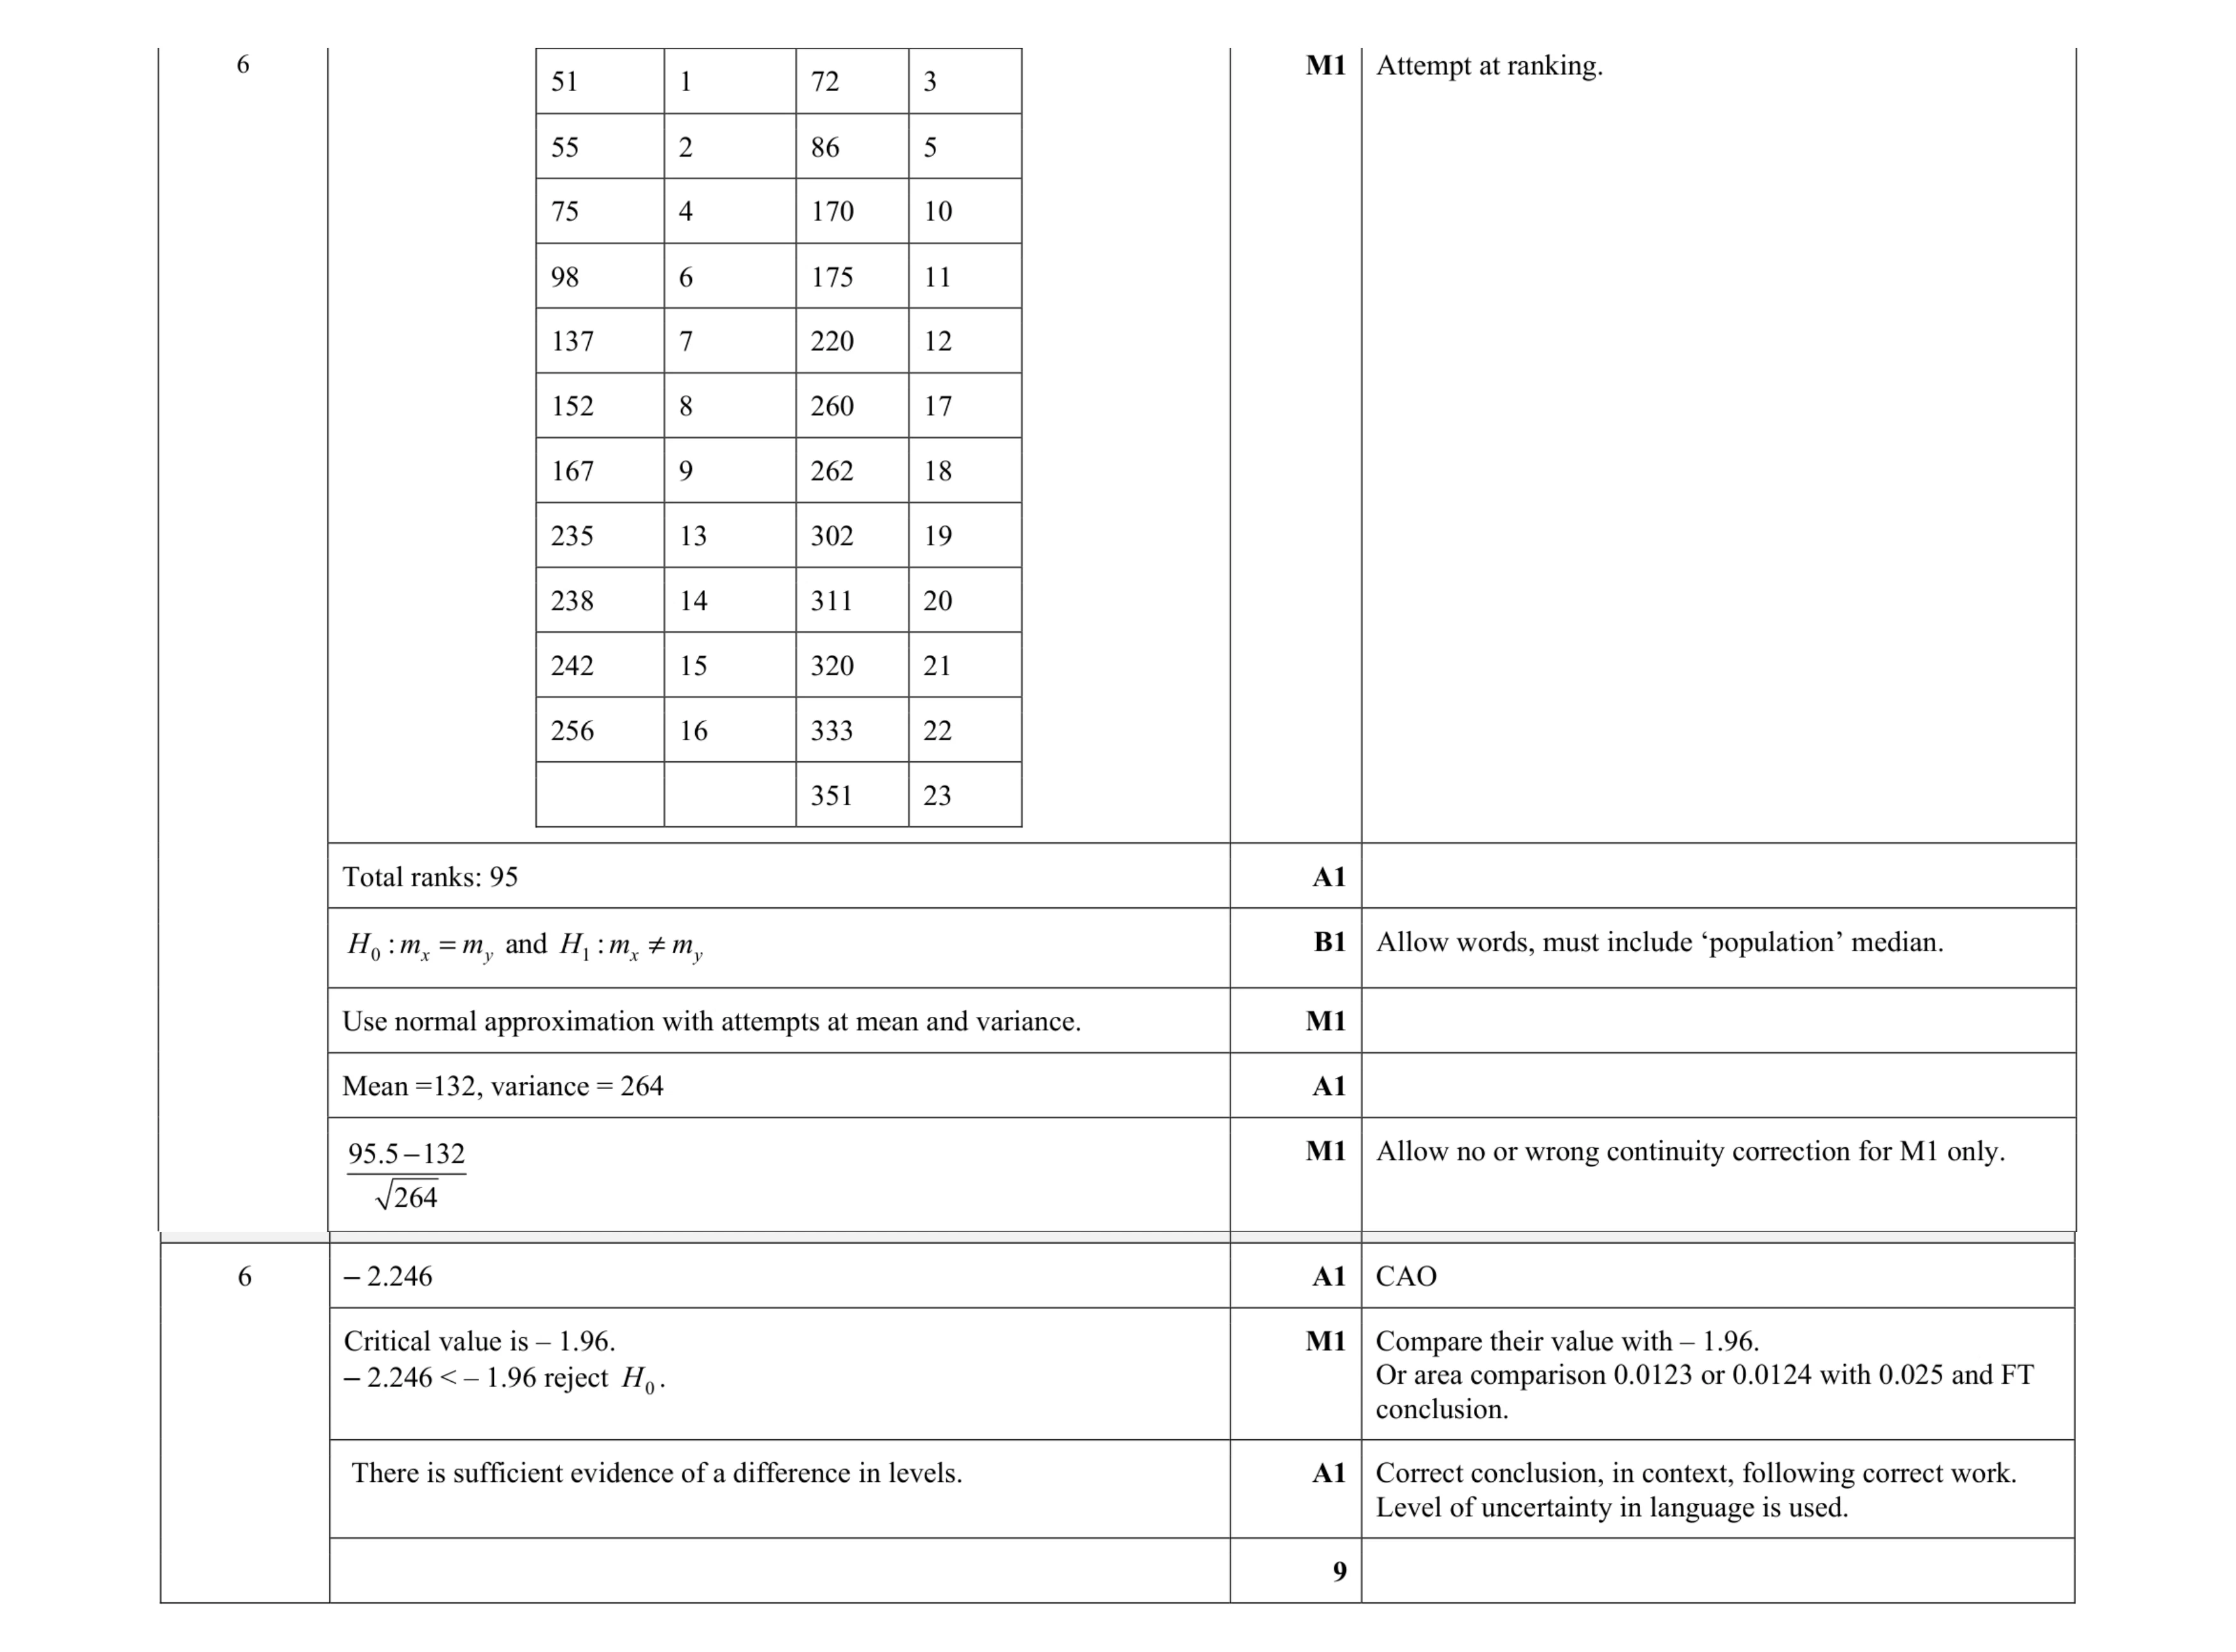 9
9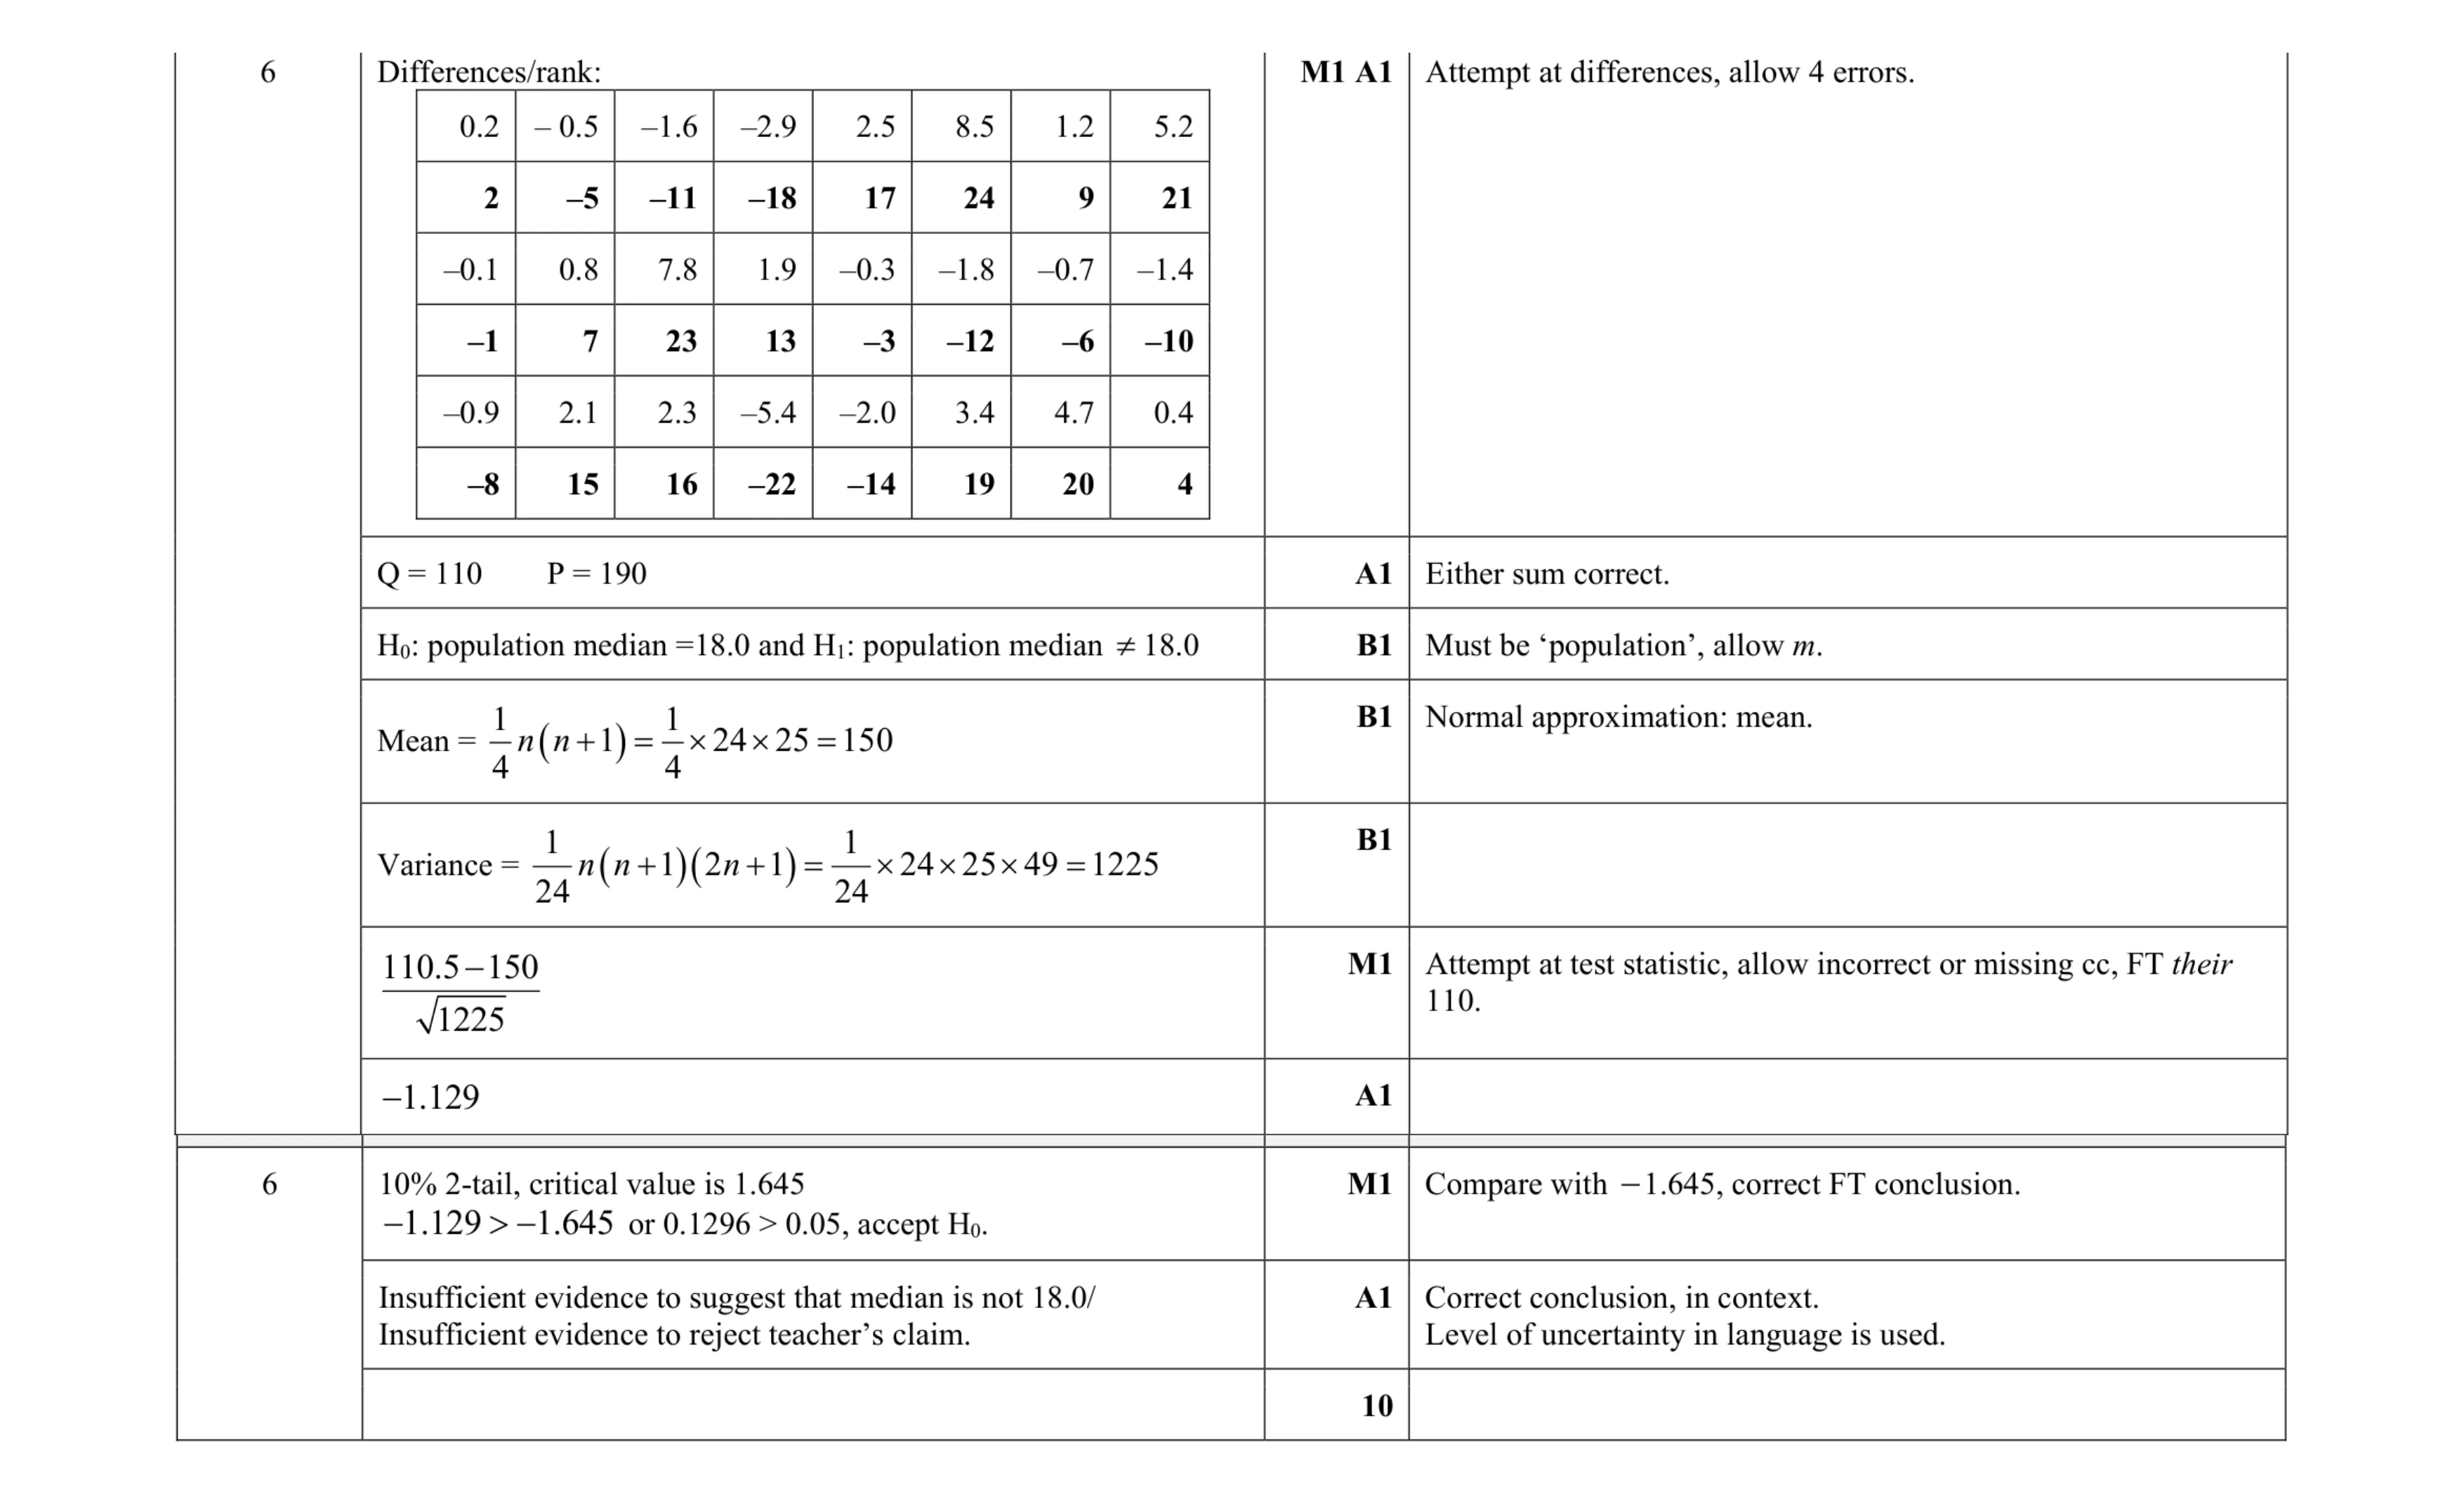 10
10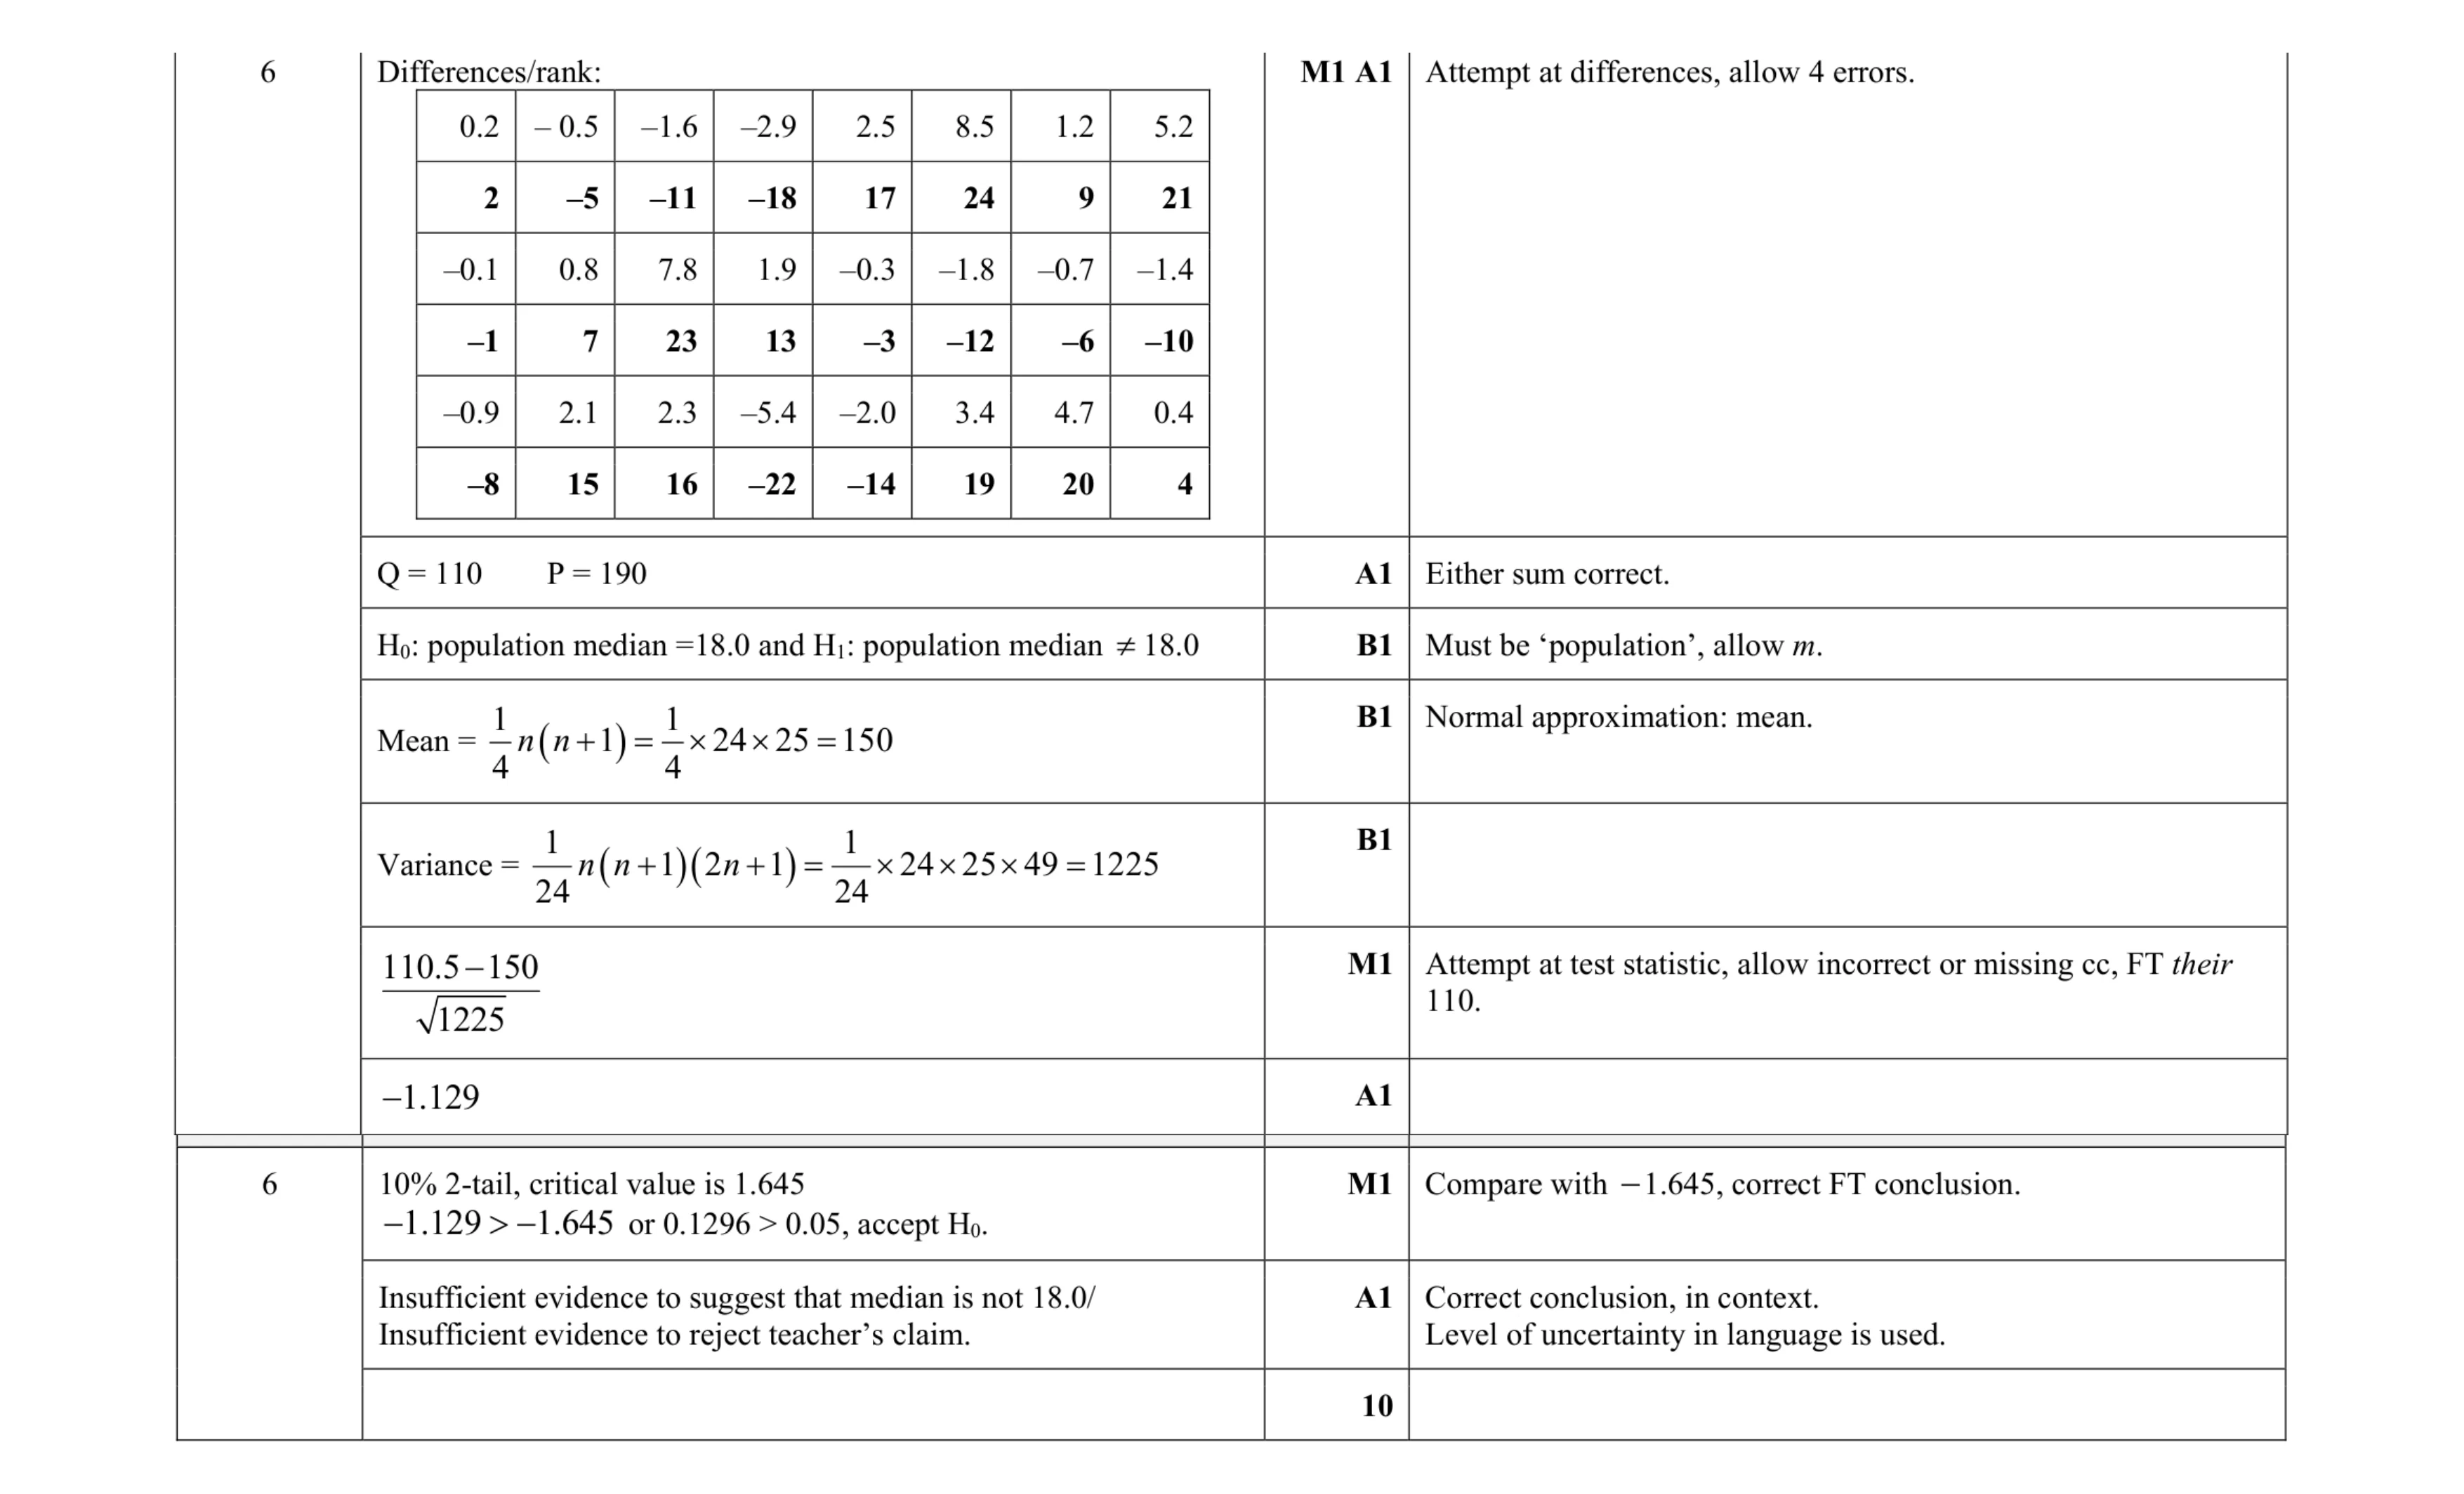 10
10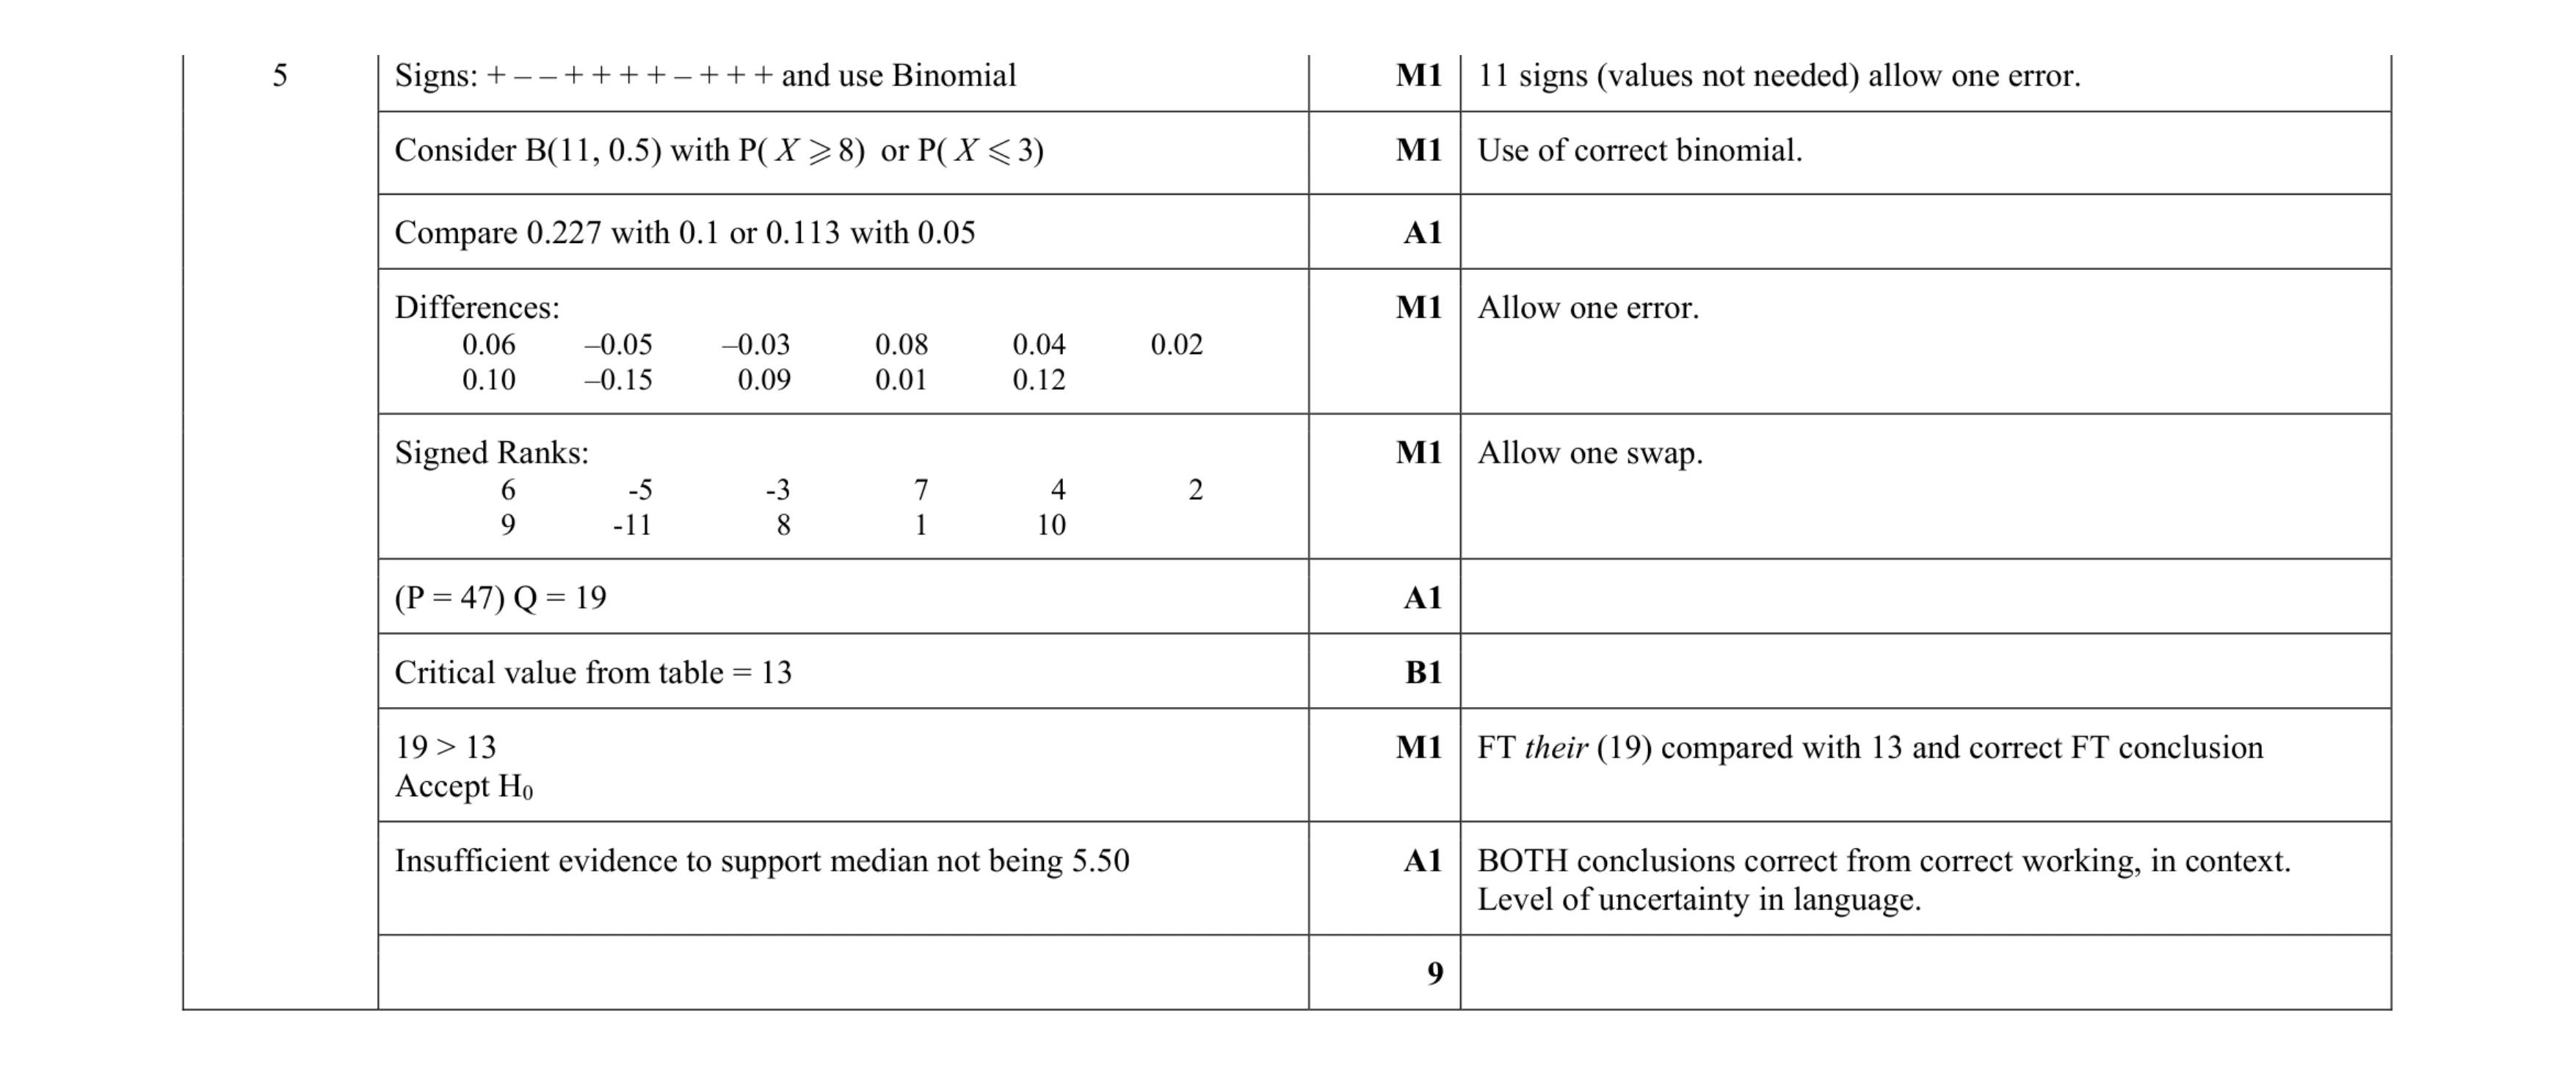 9
9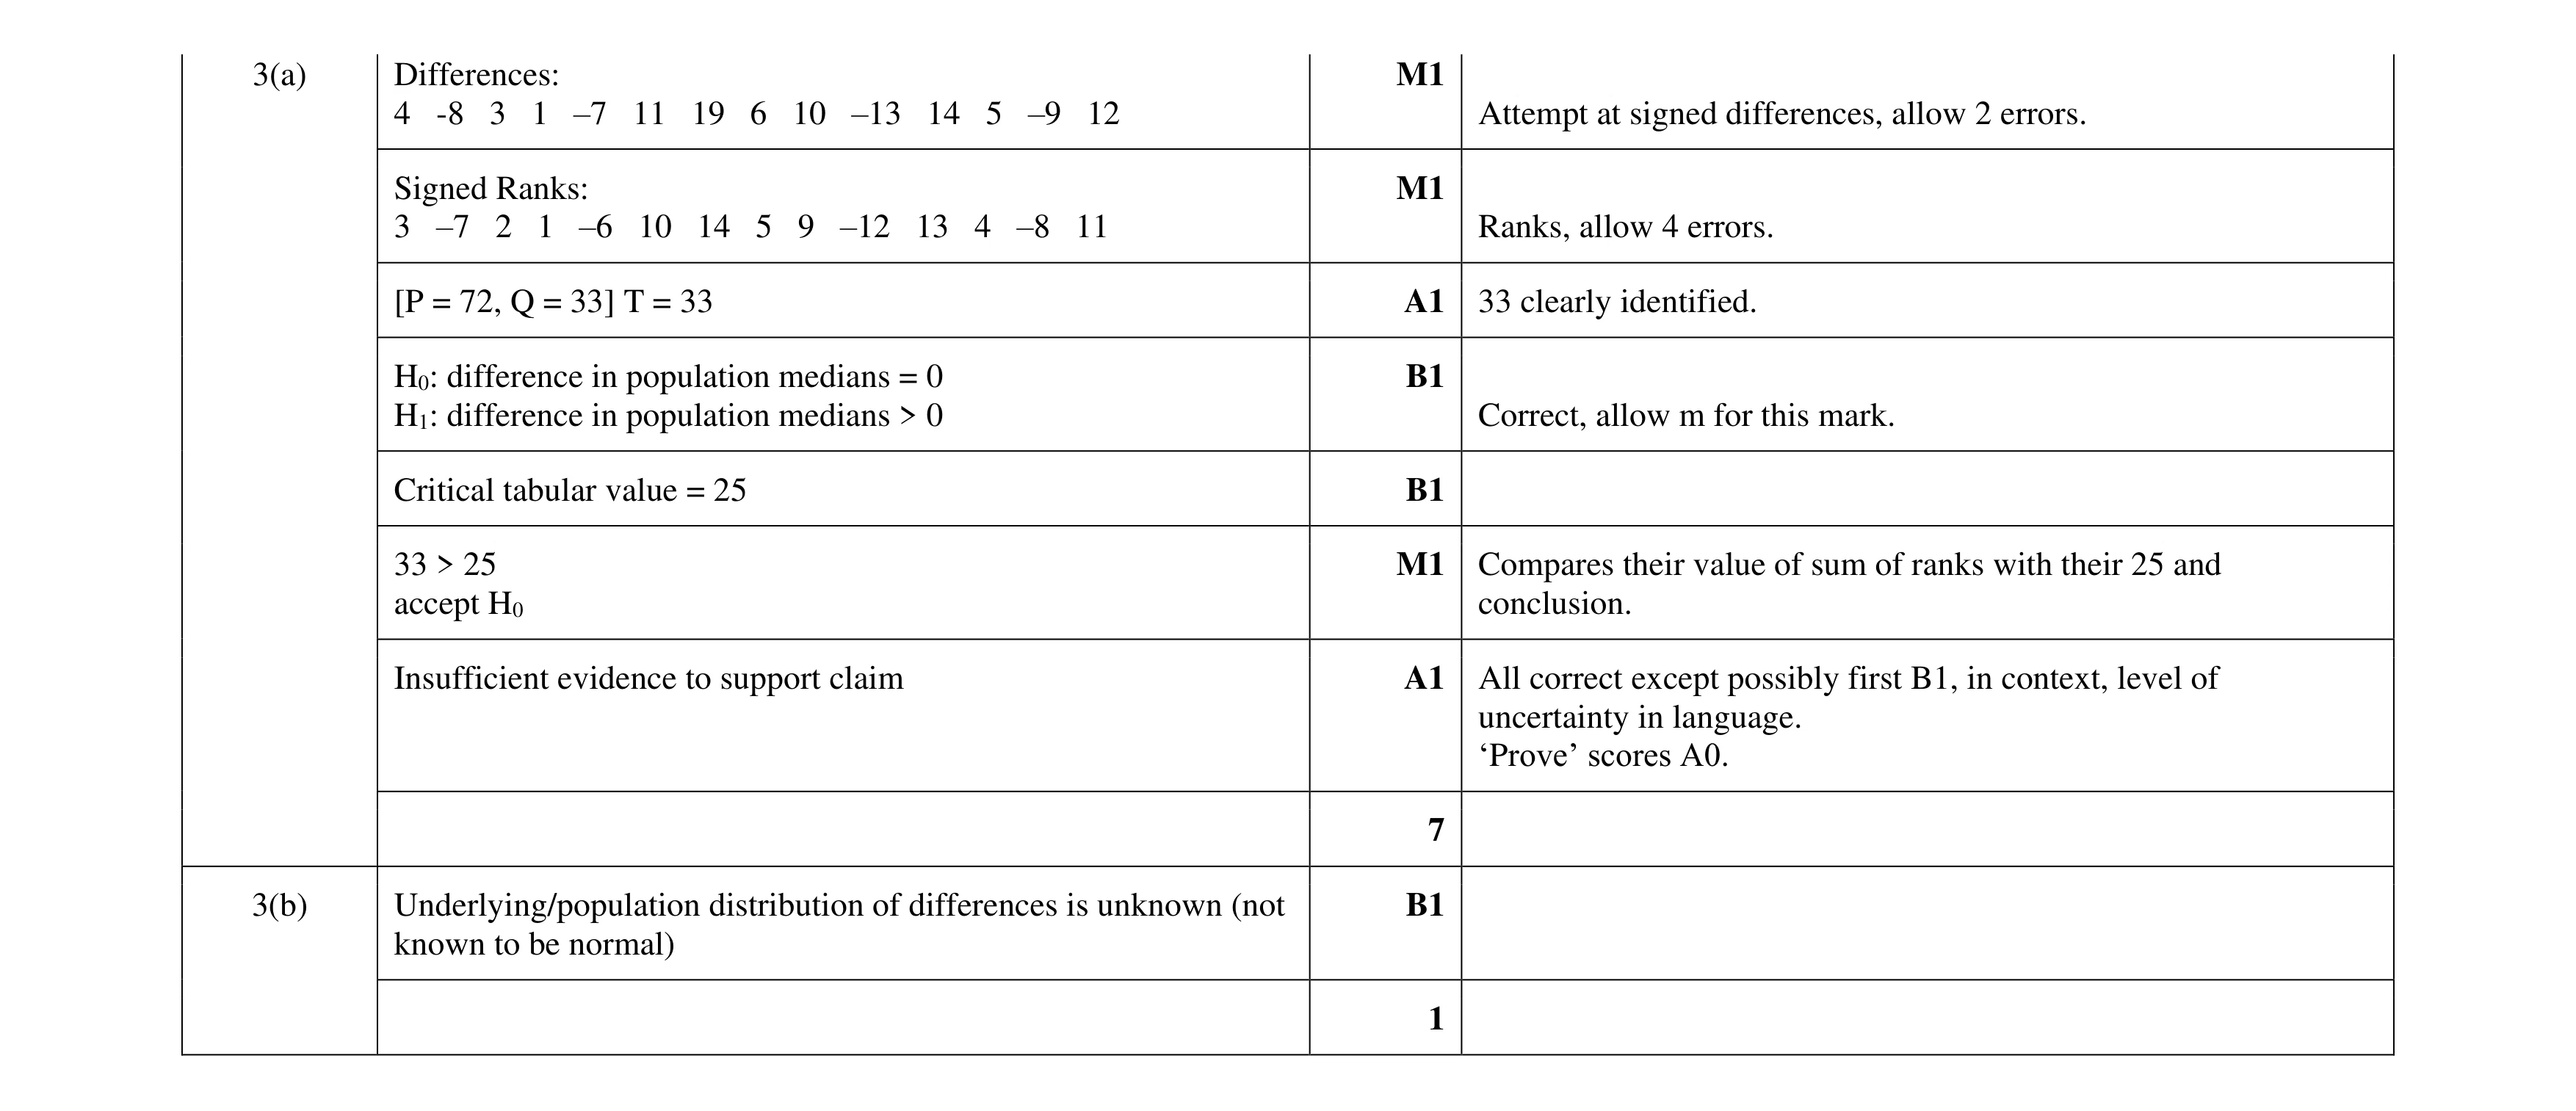 8
8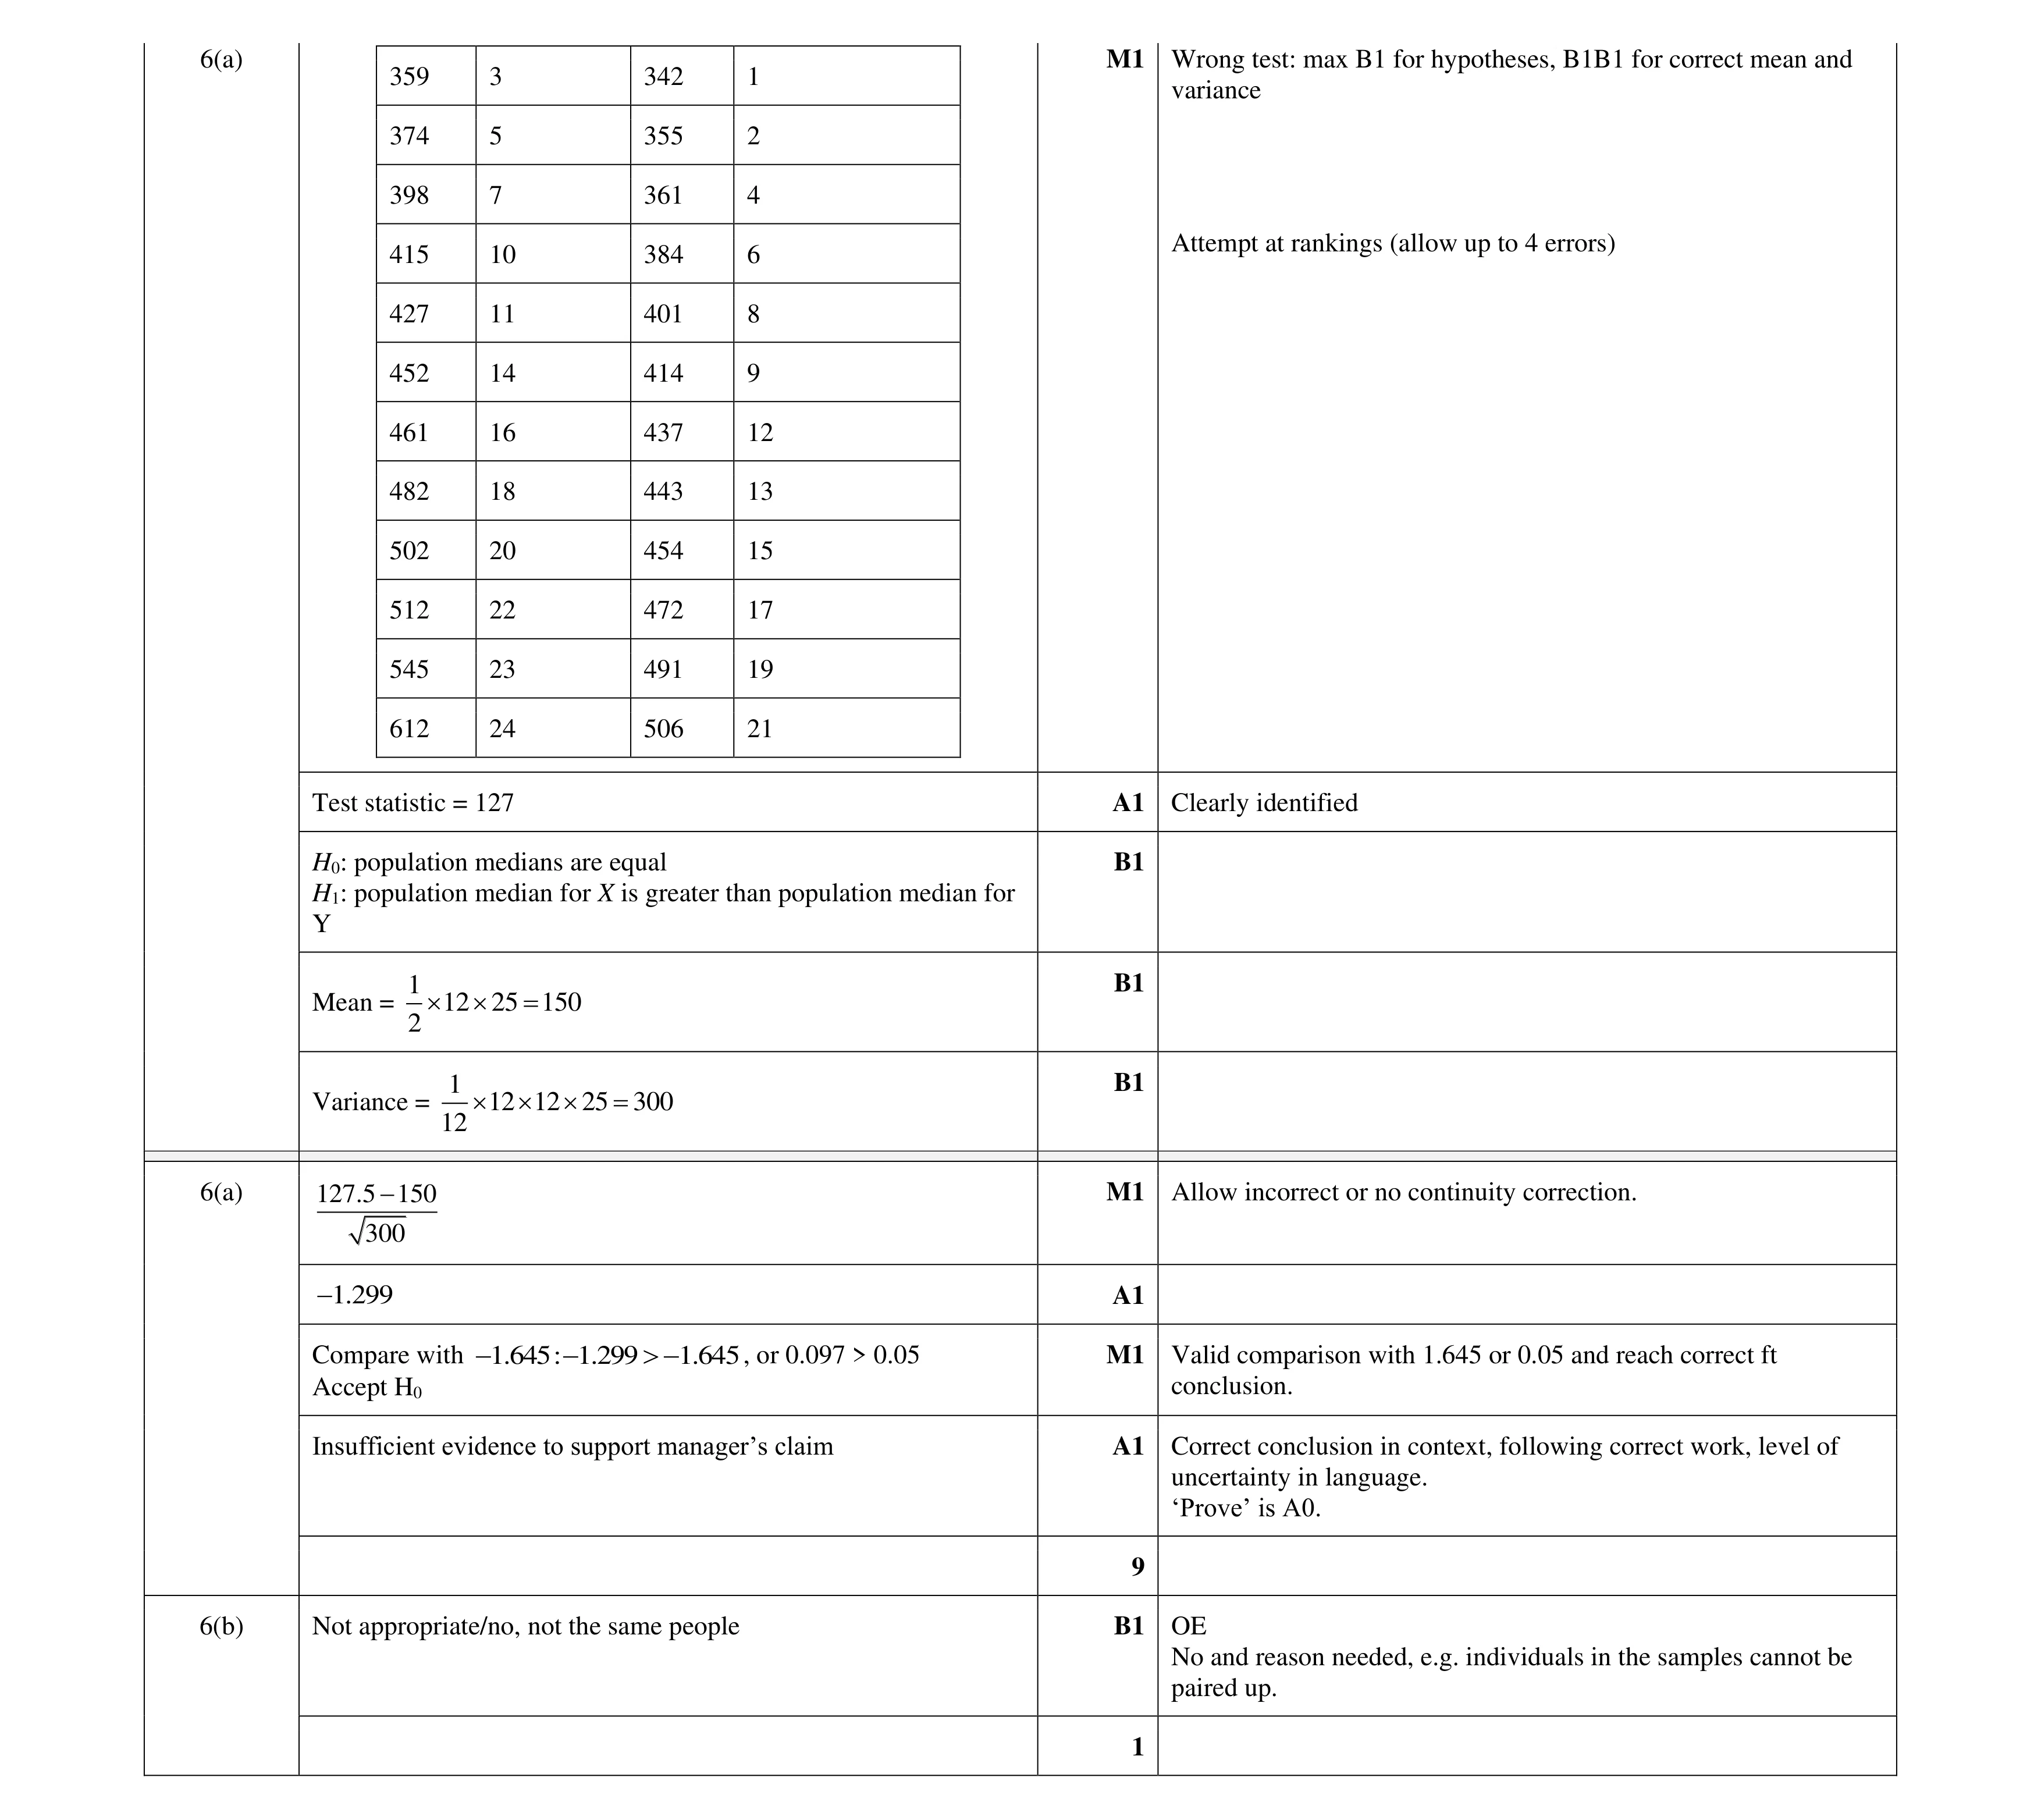 10
10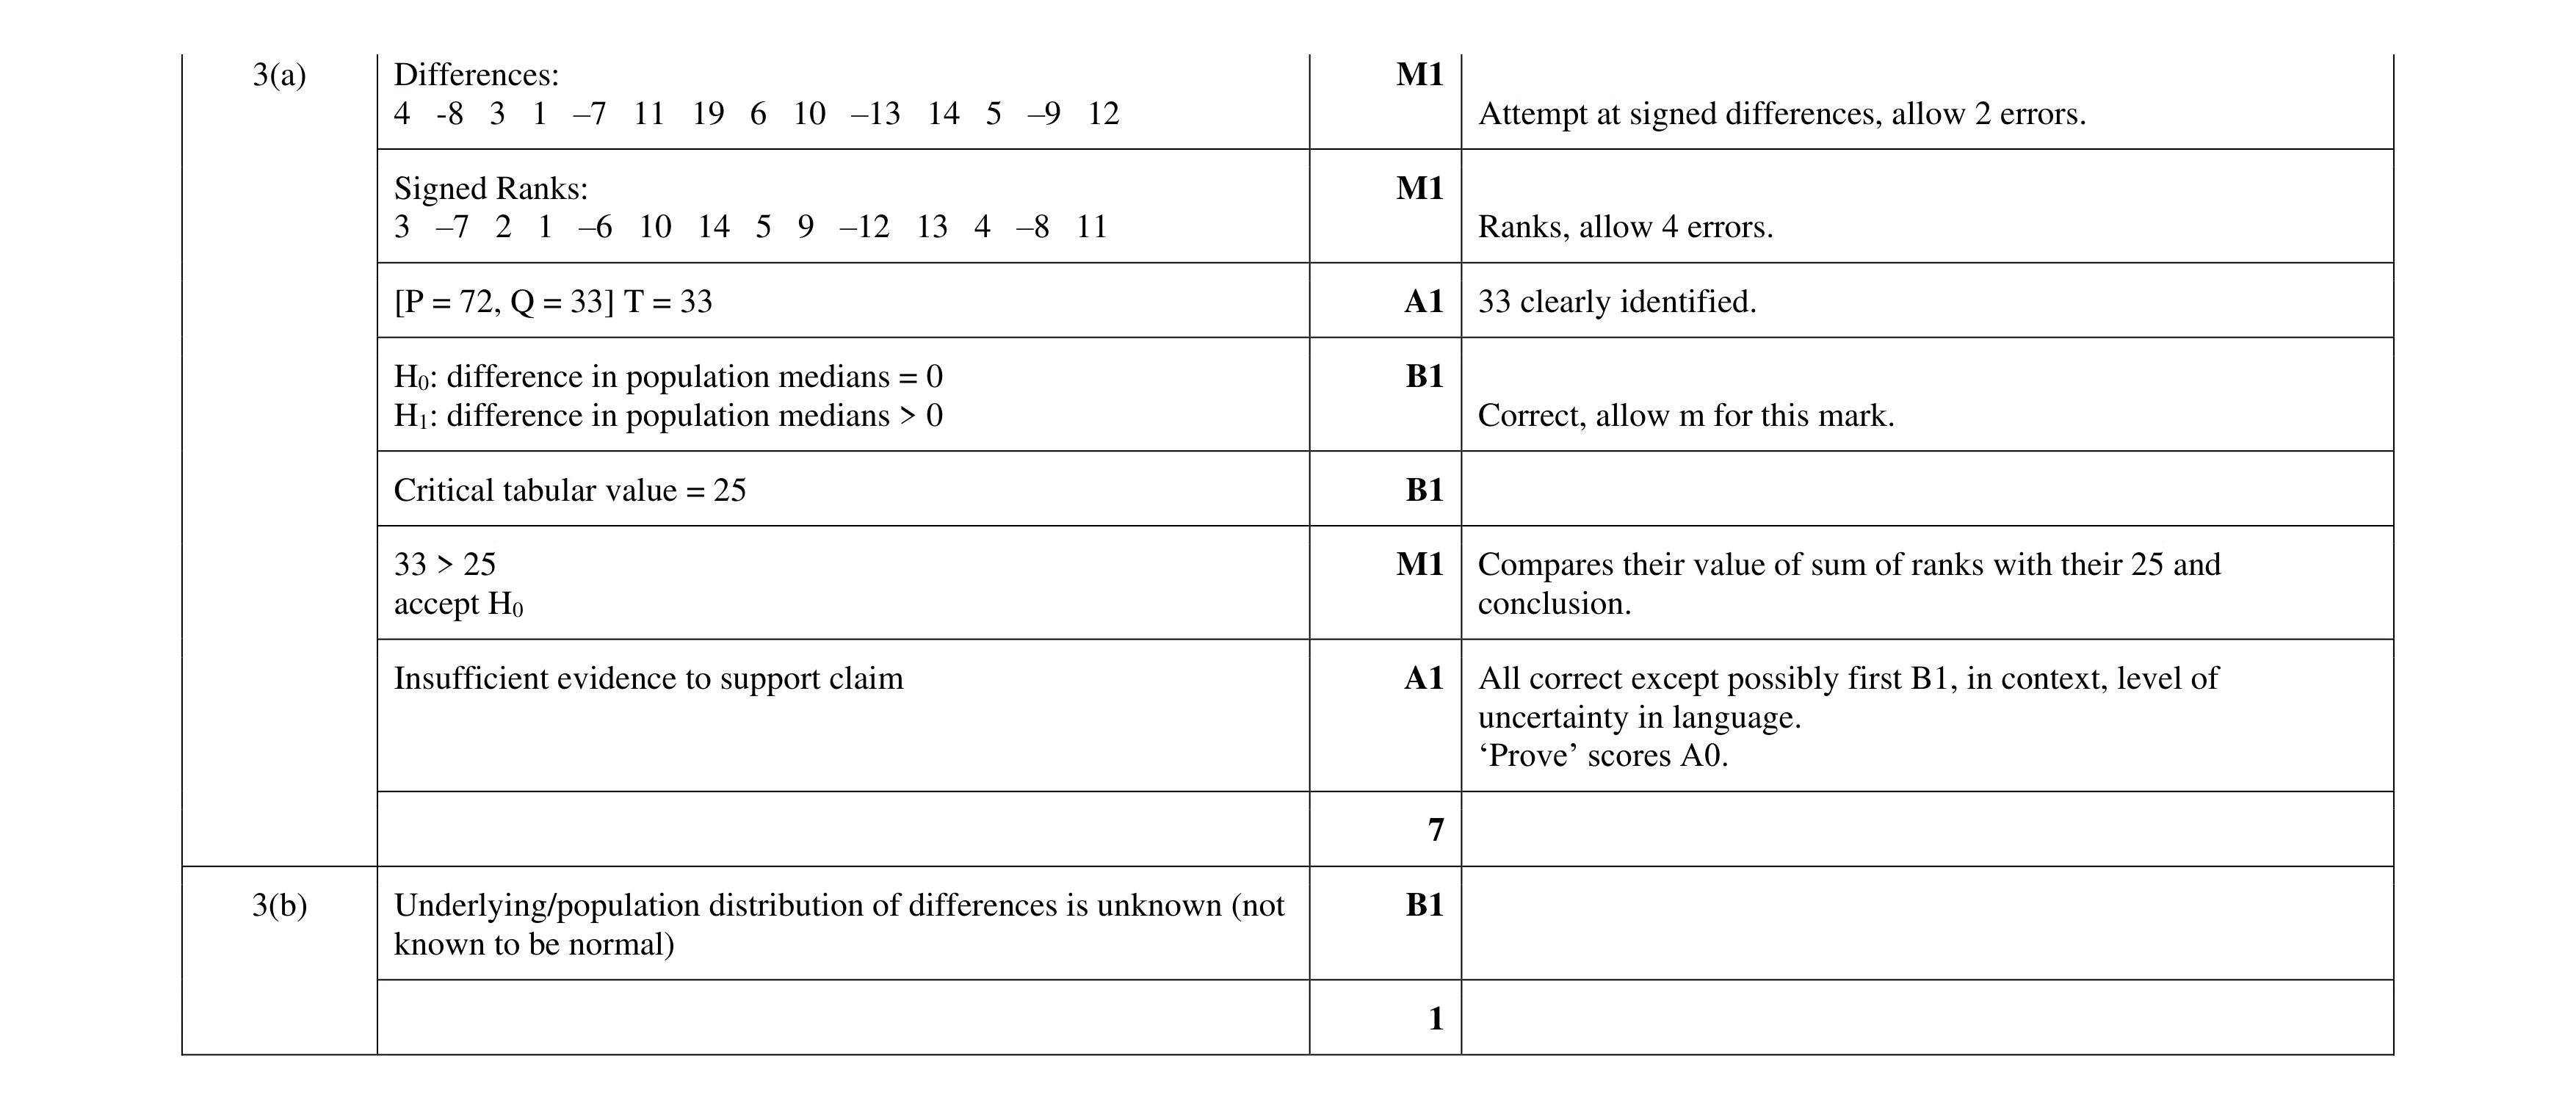 8
8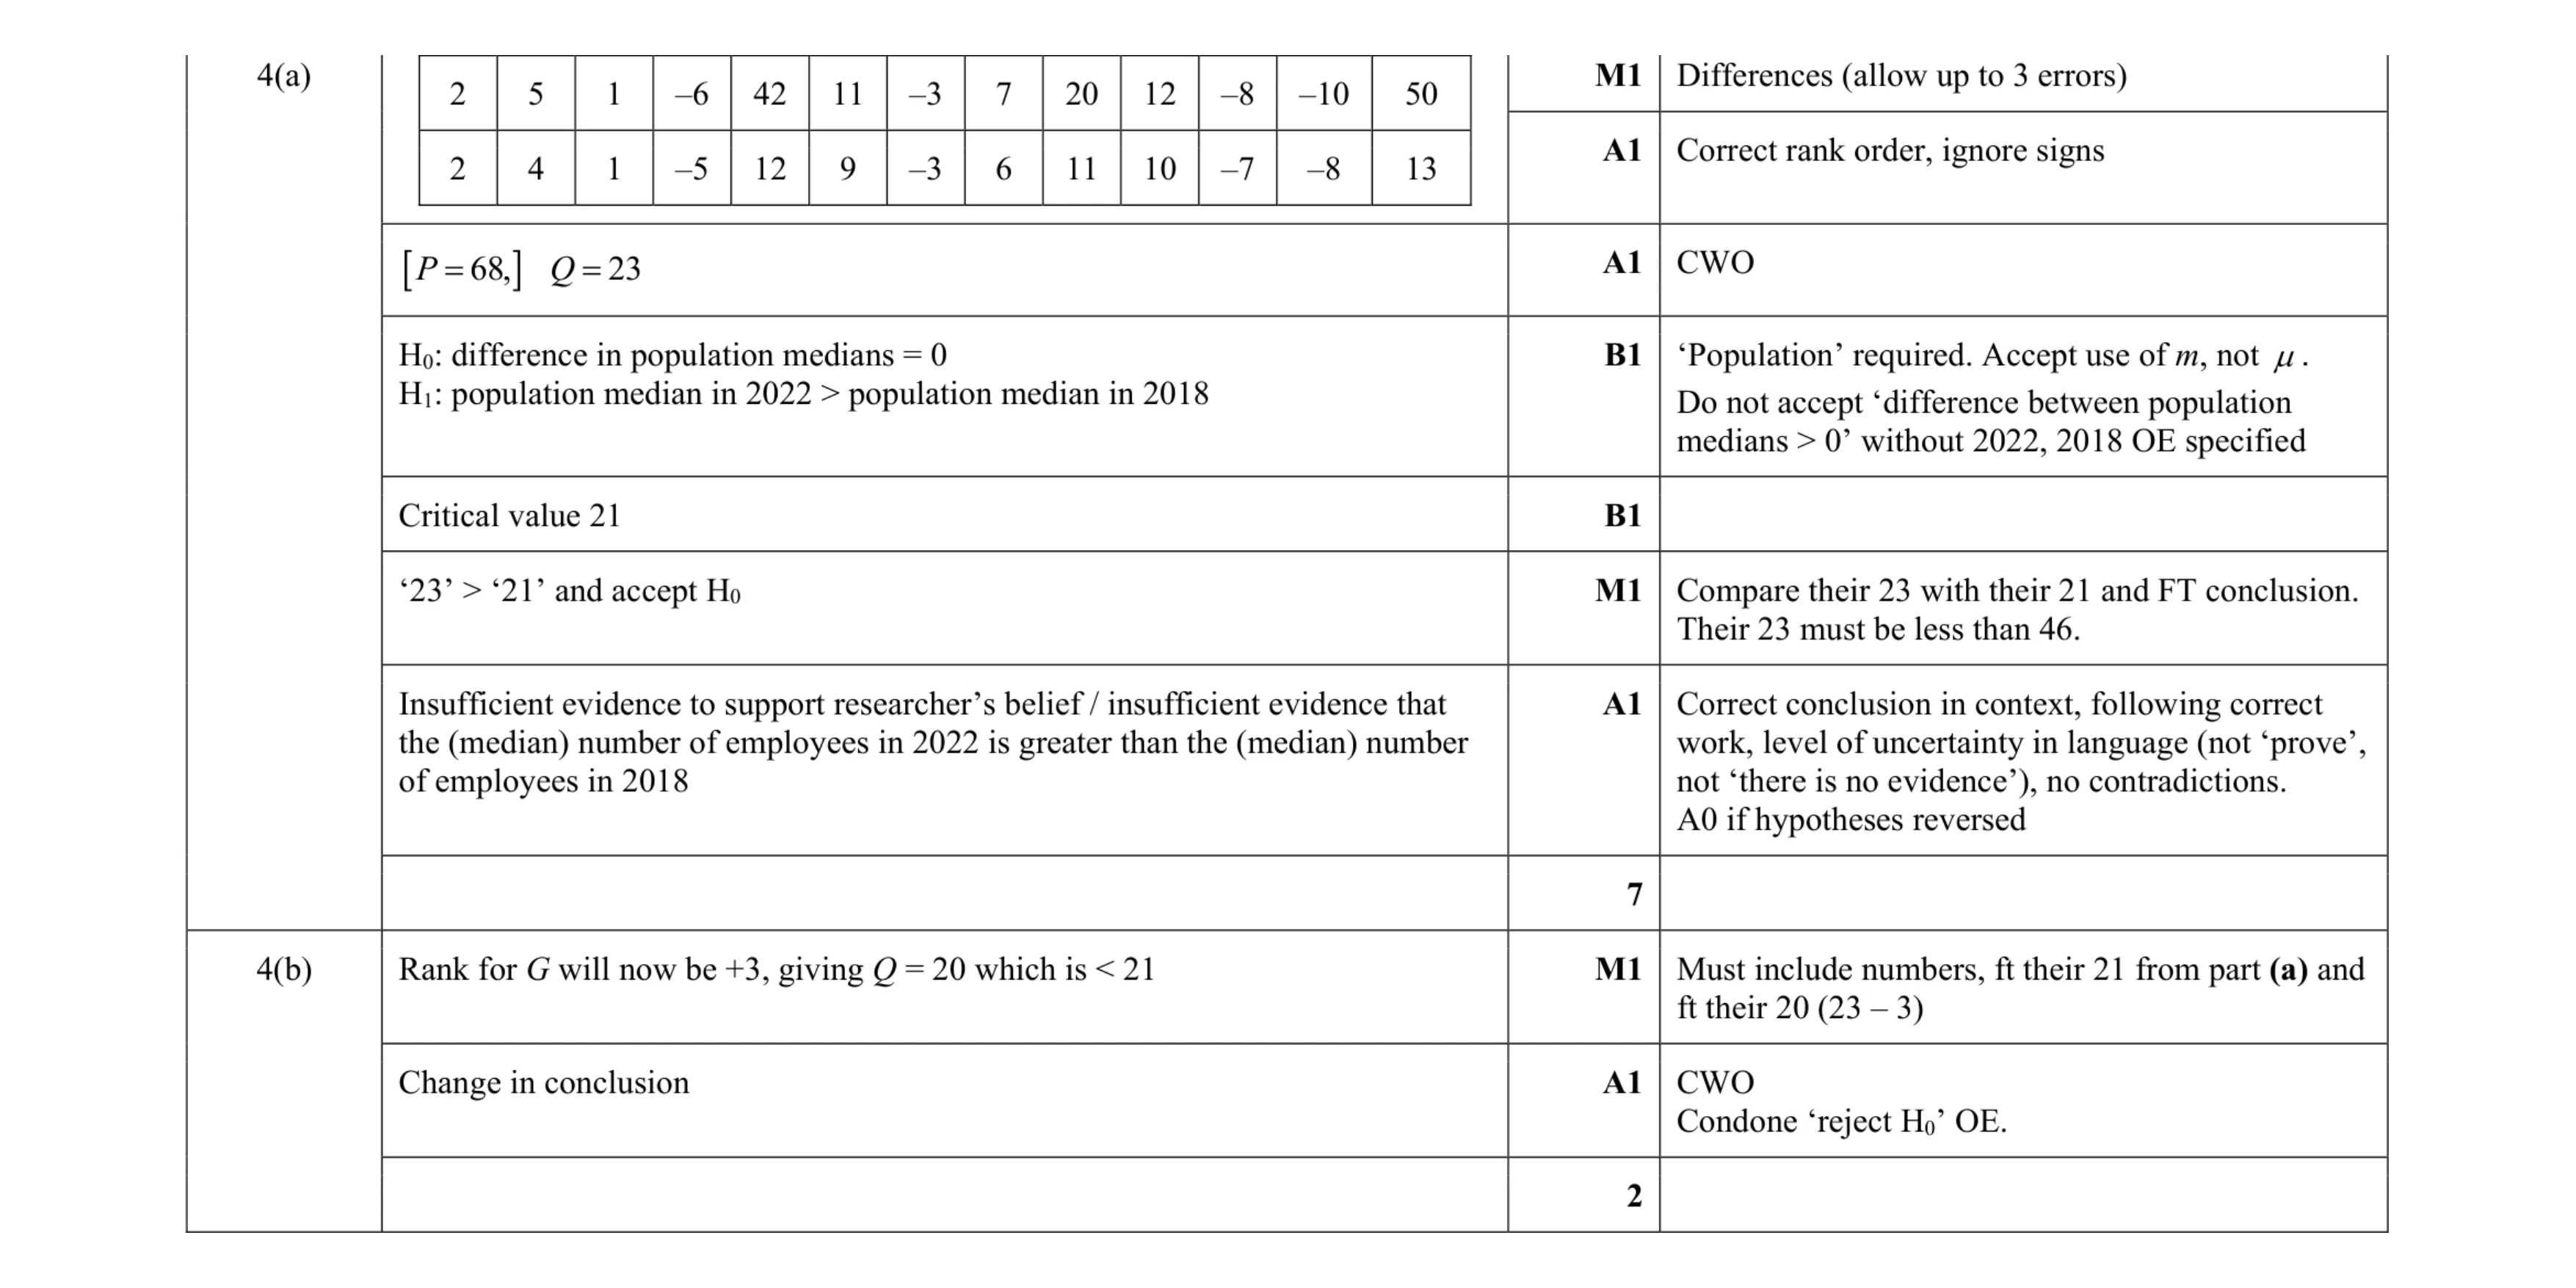 9
9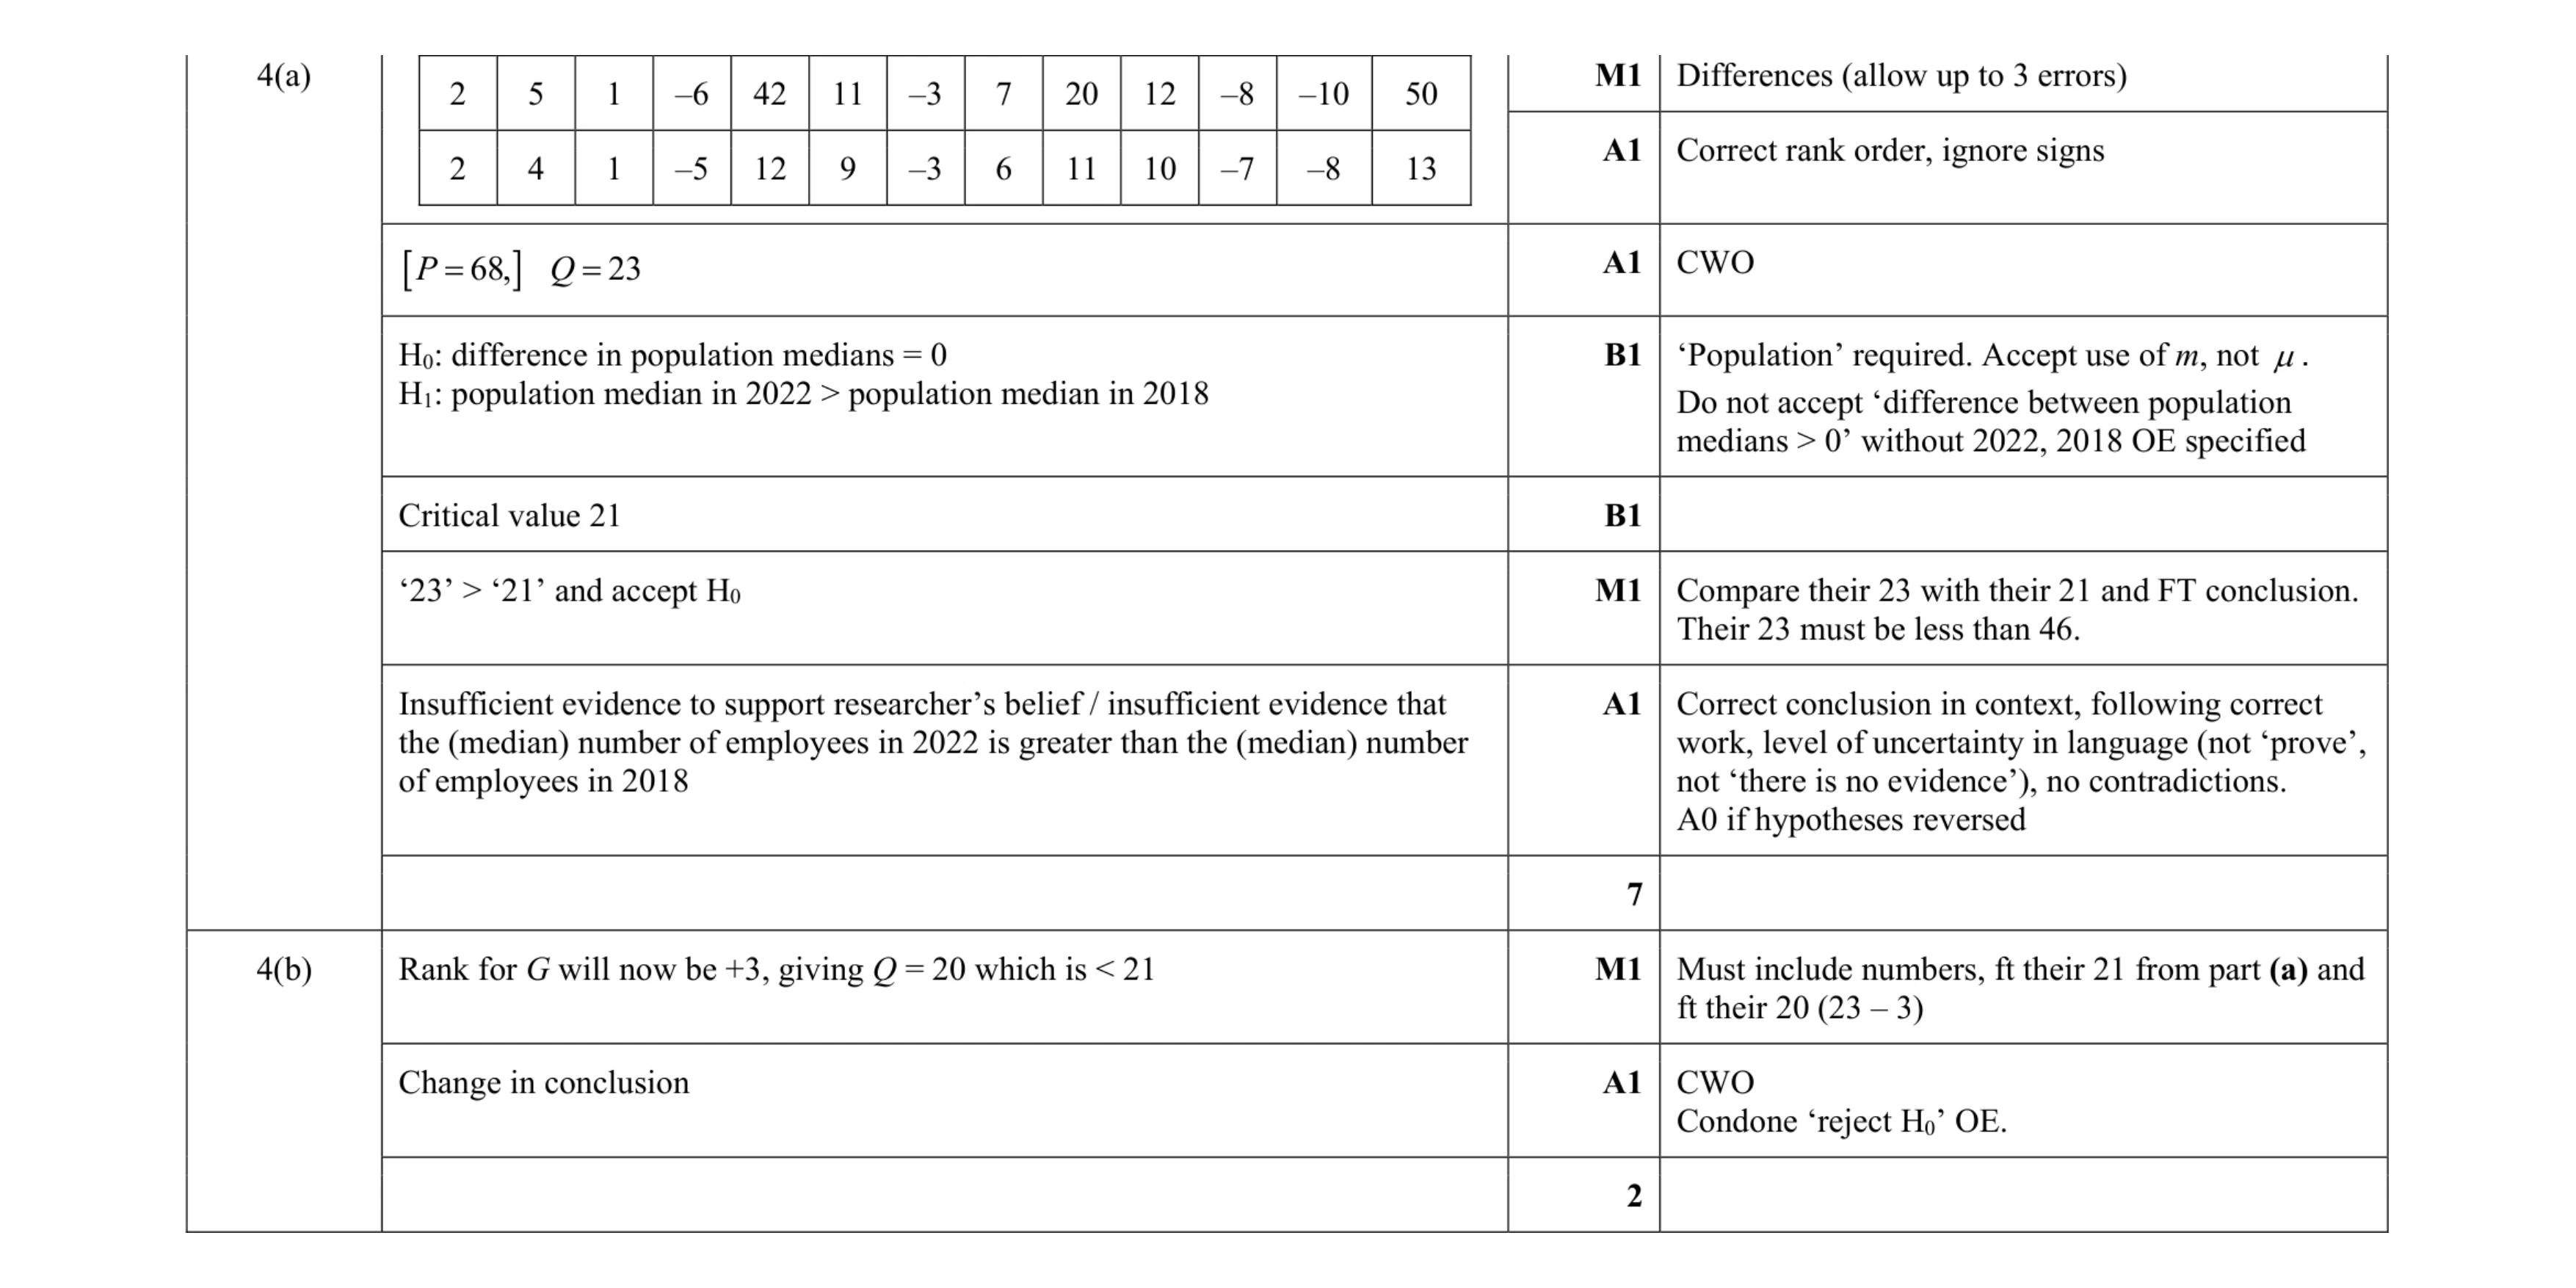 9
9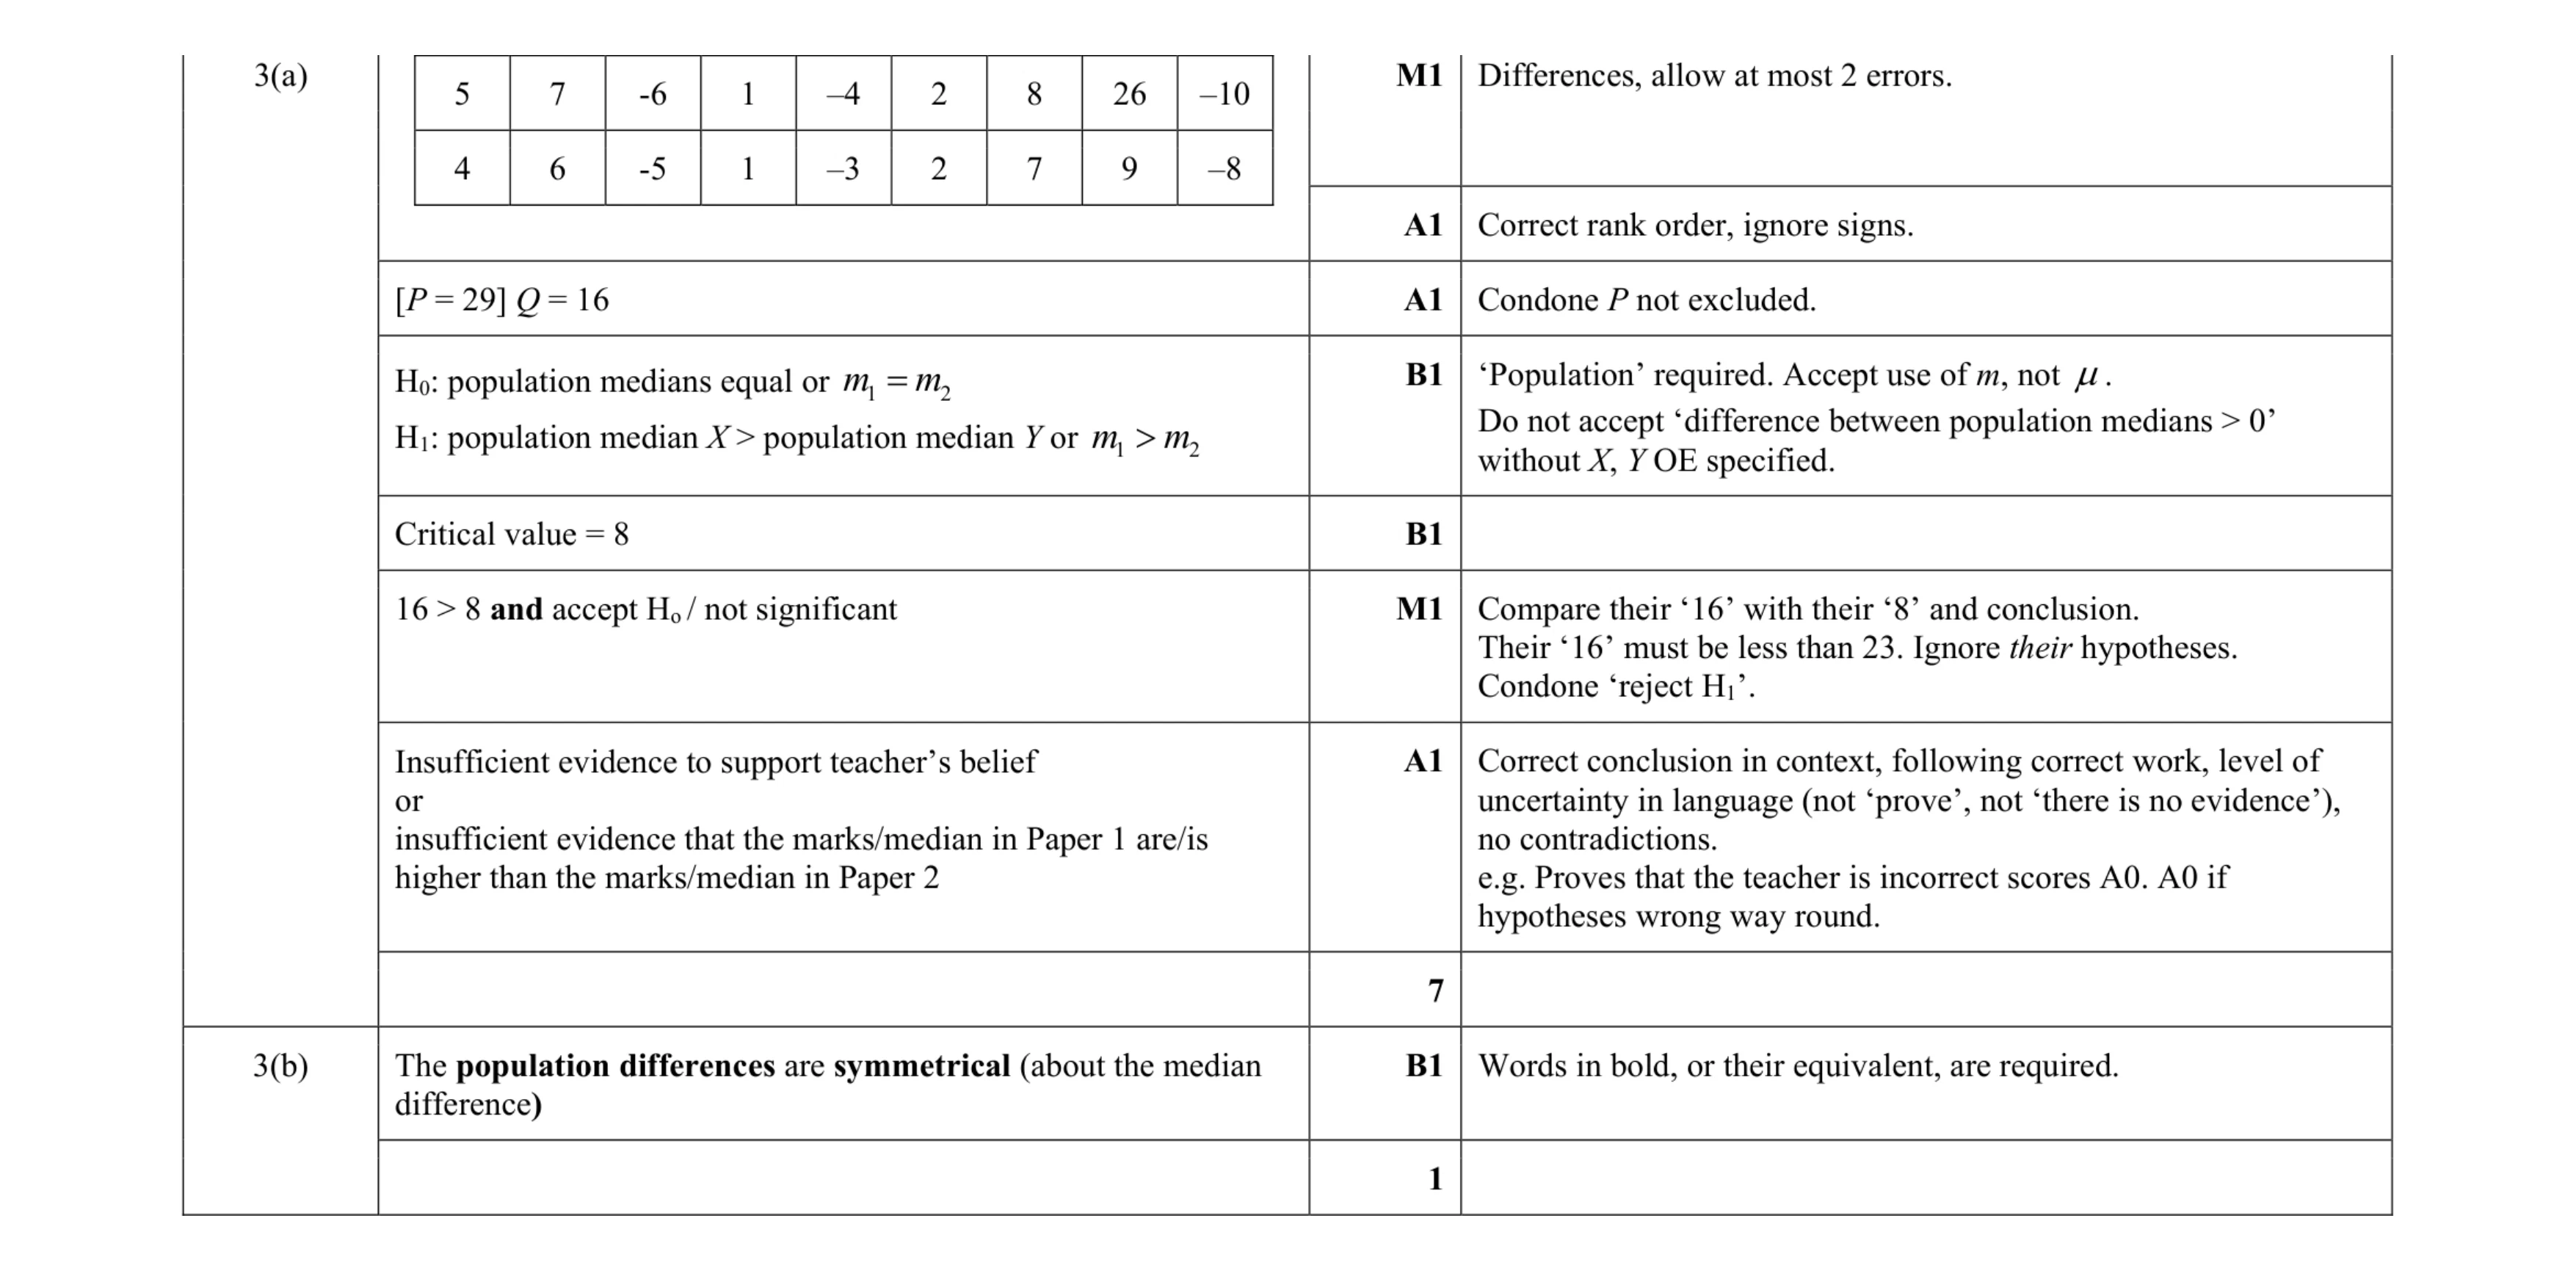 8
8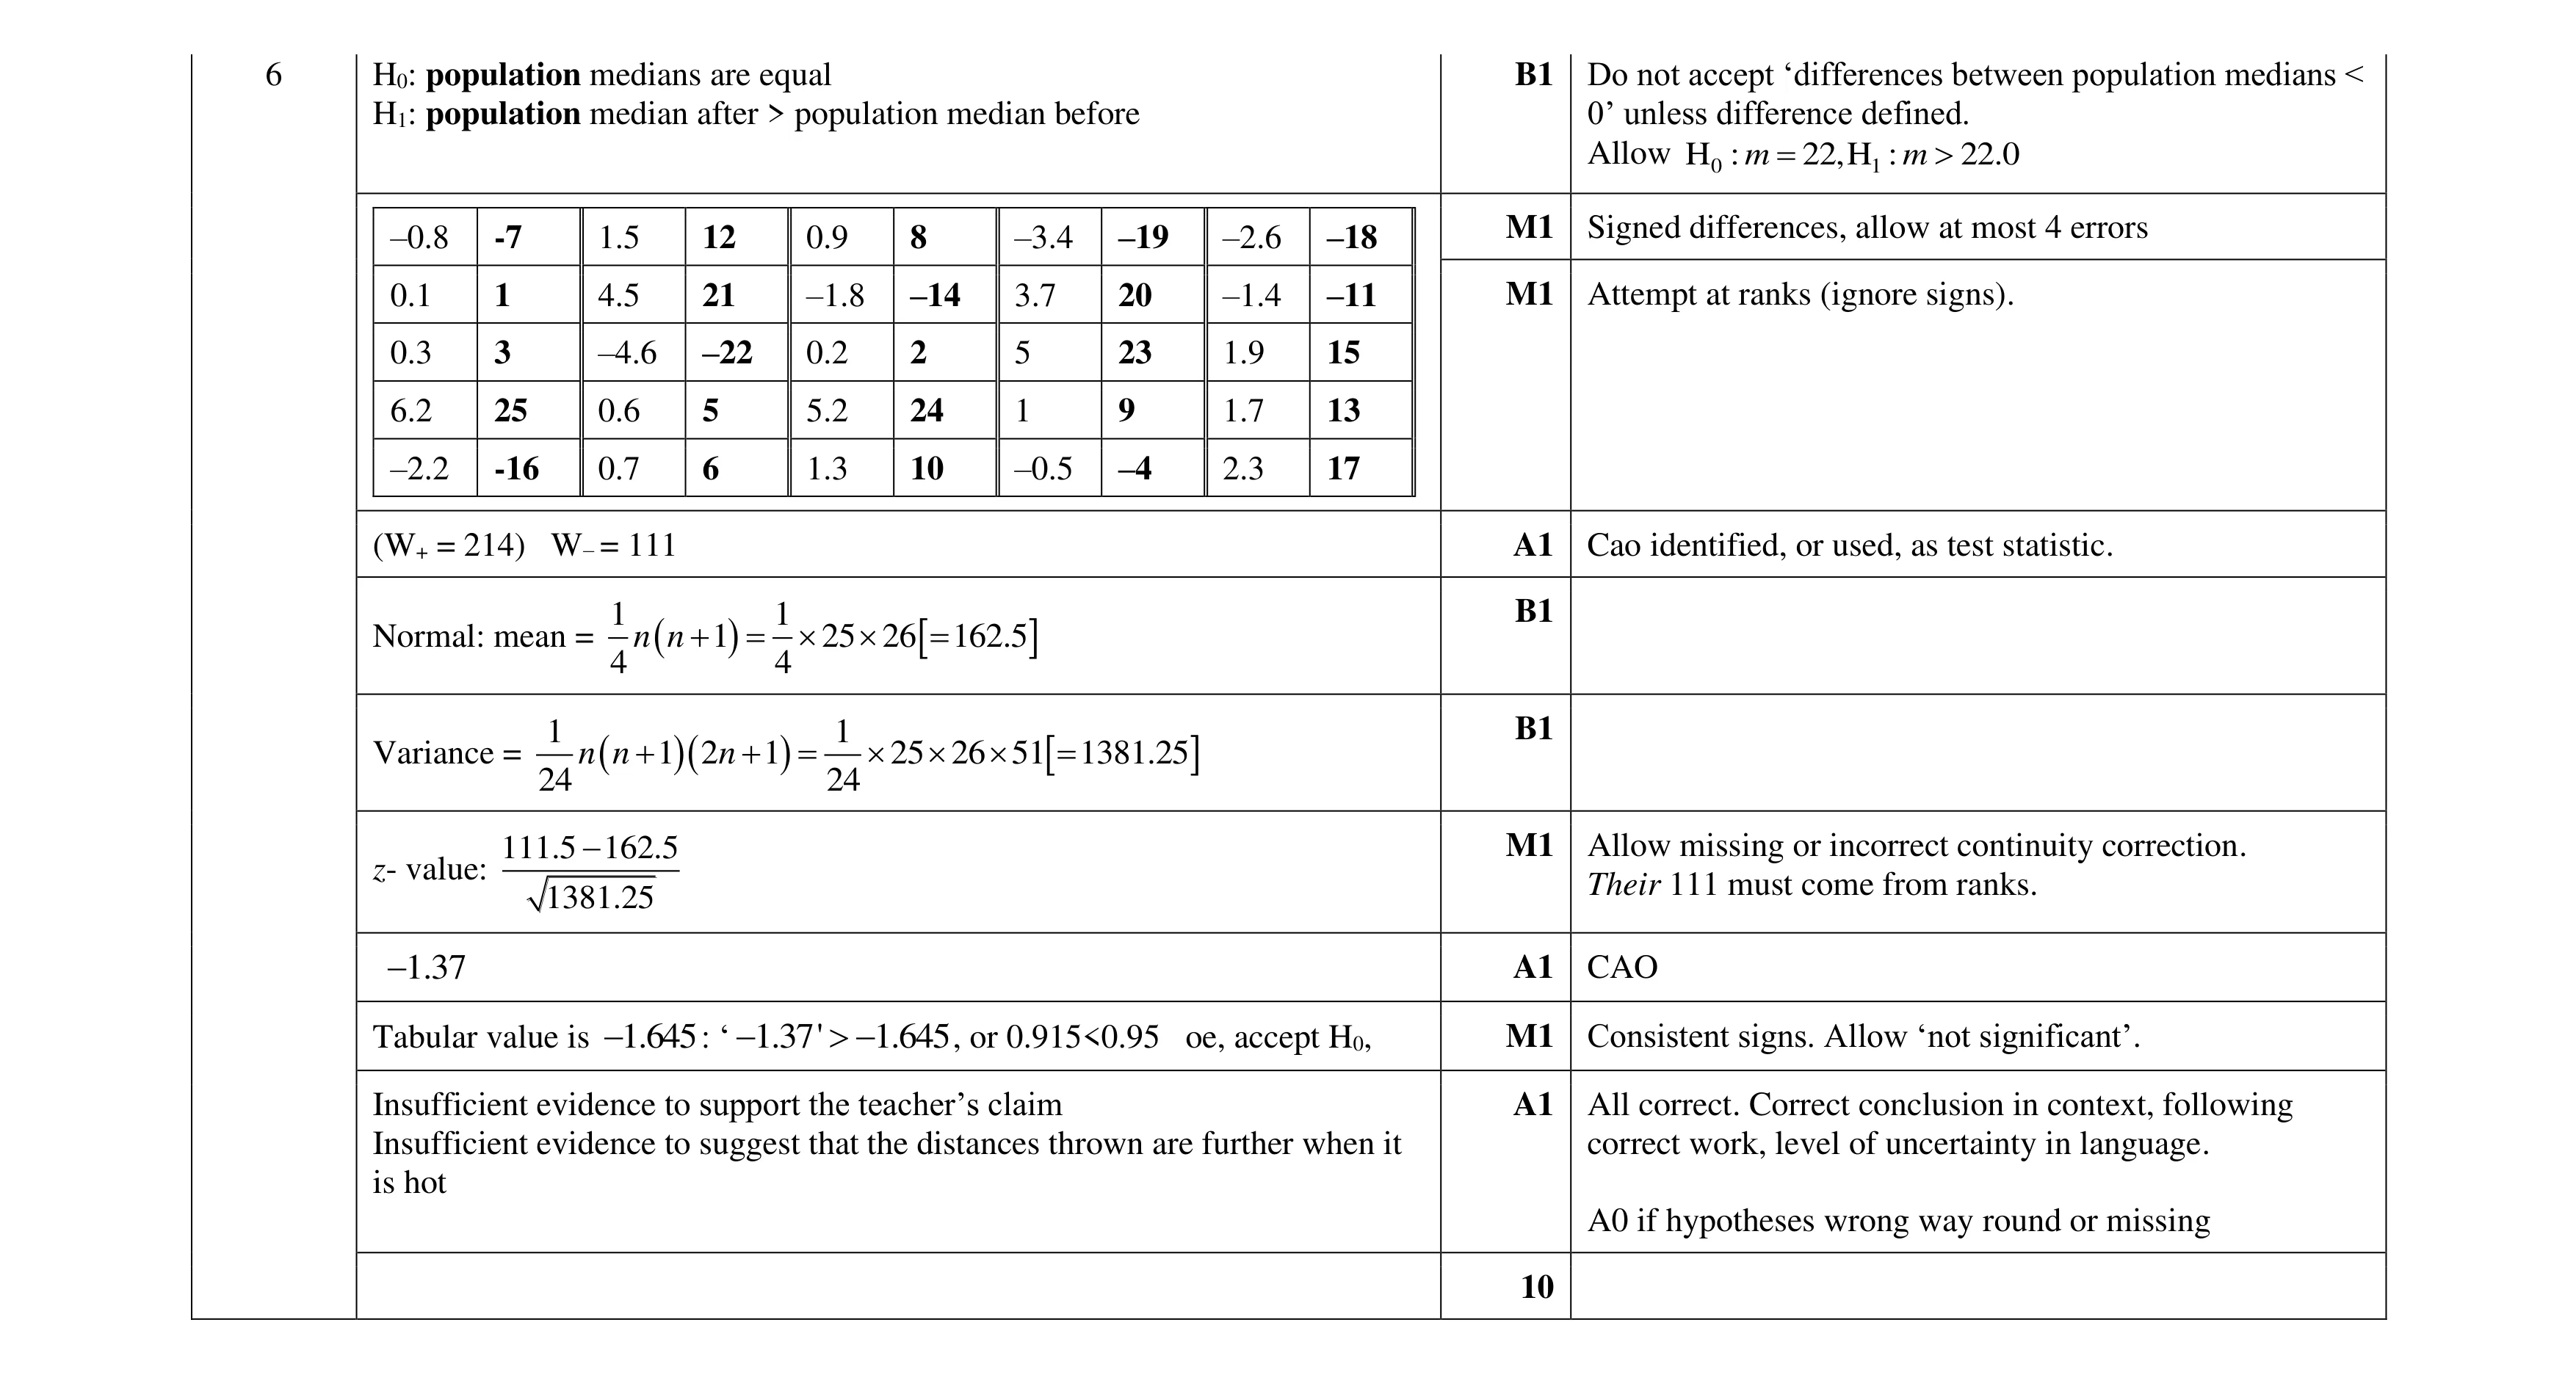 10
10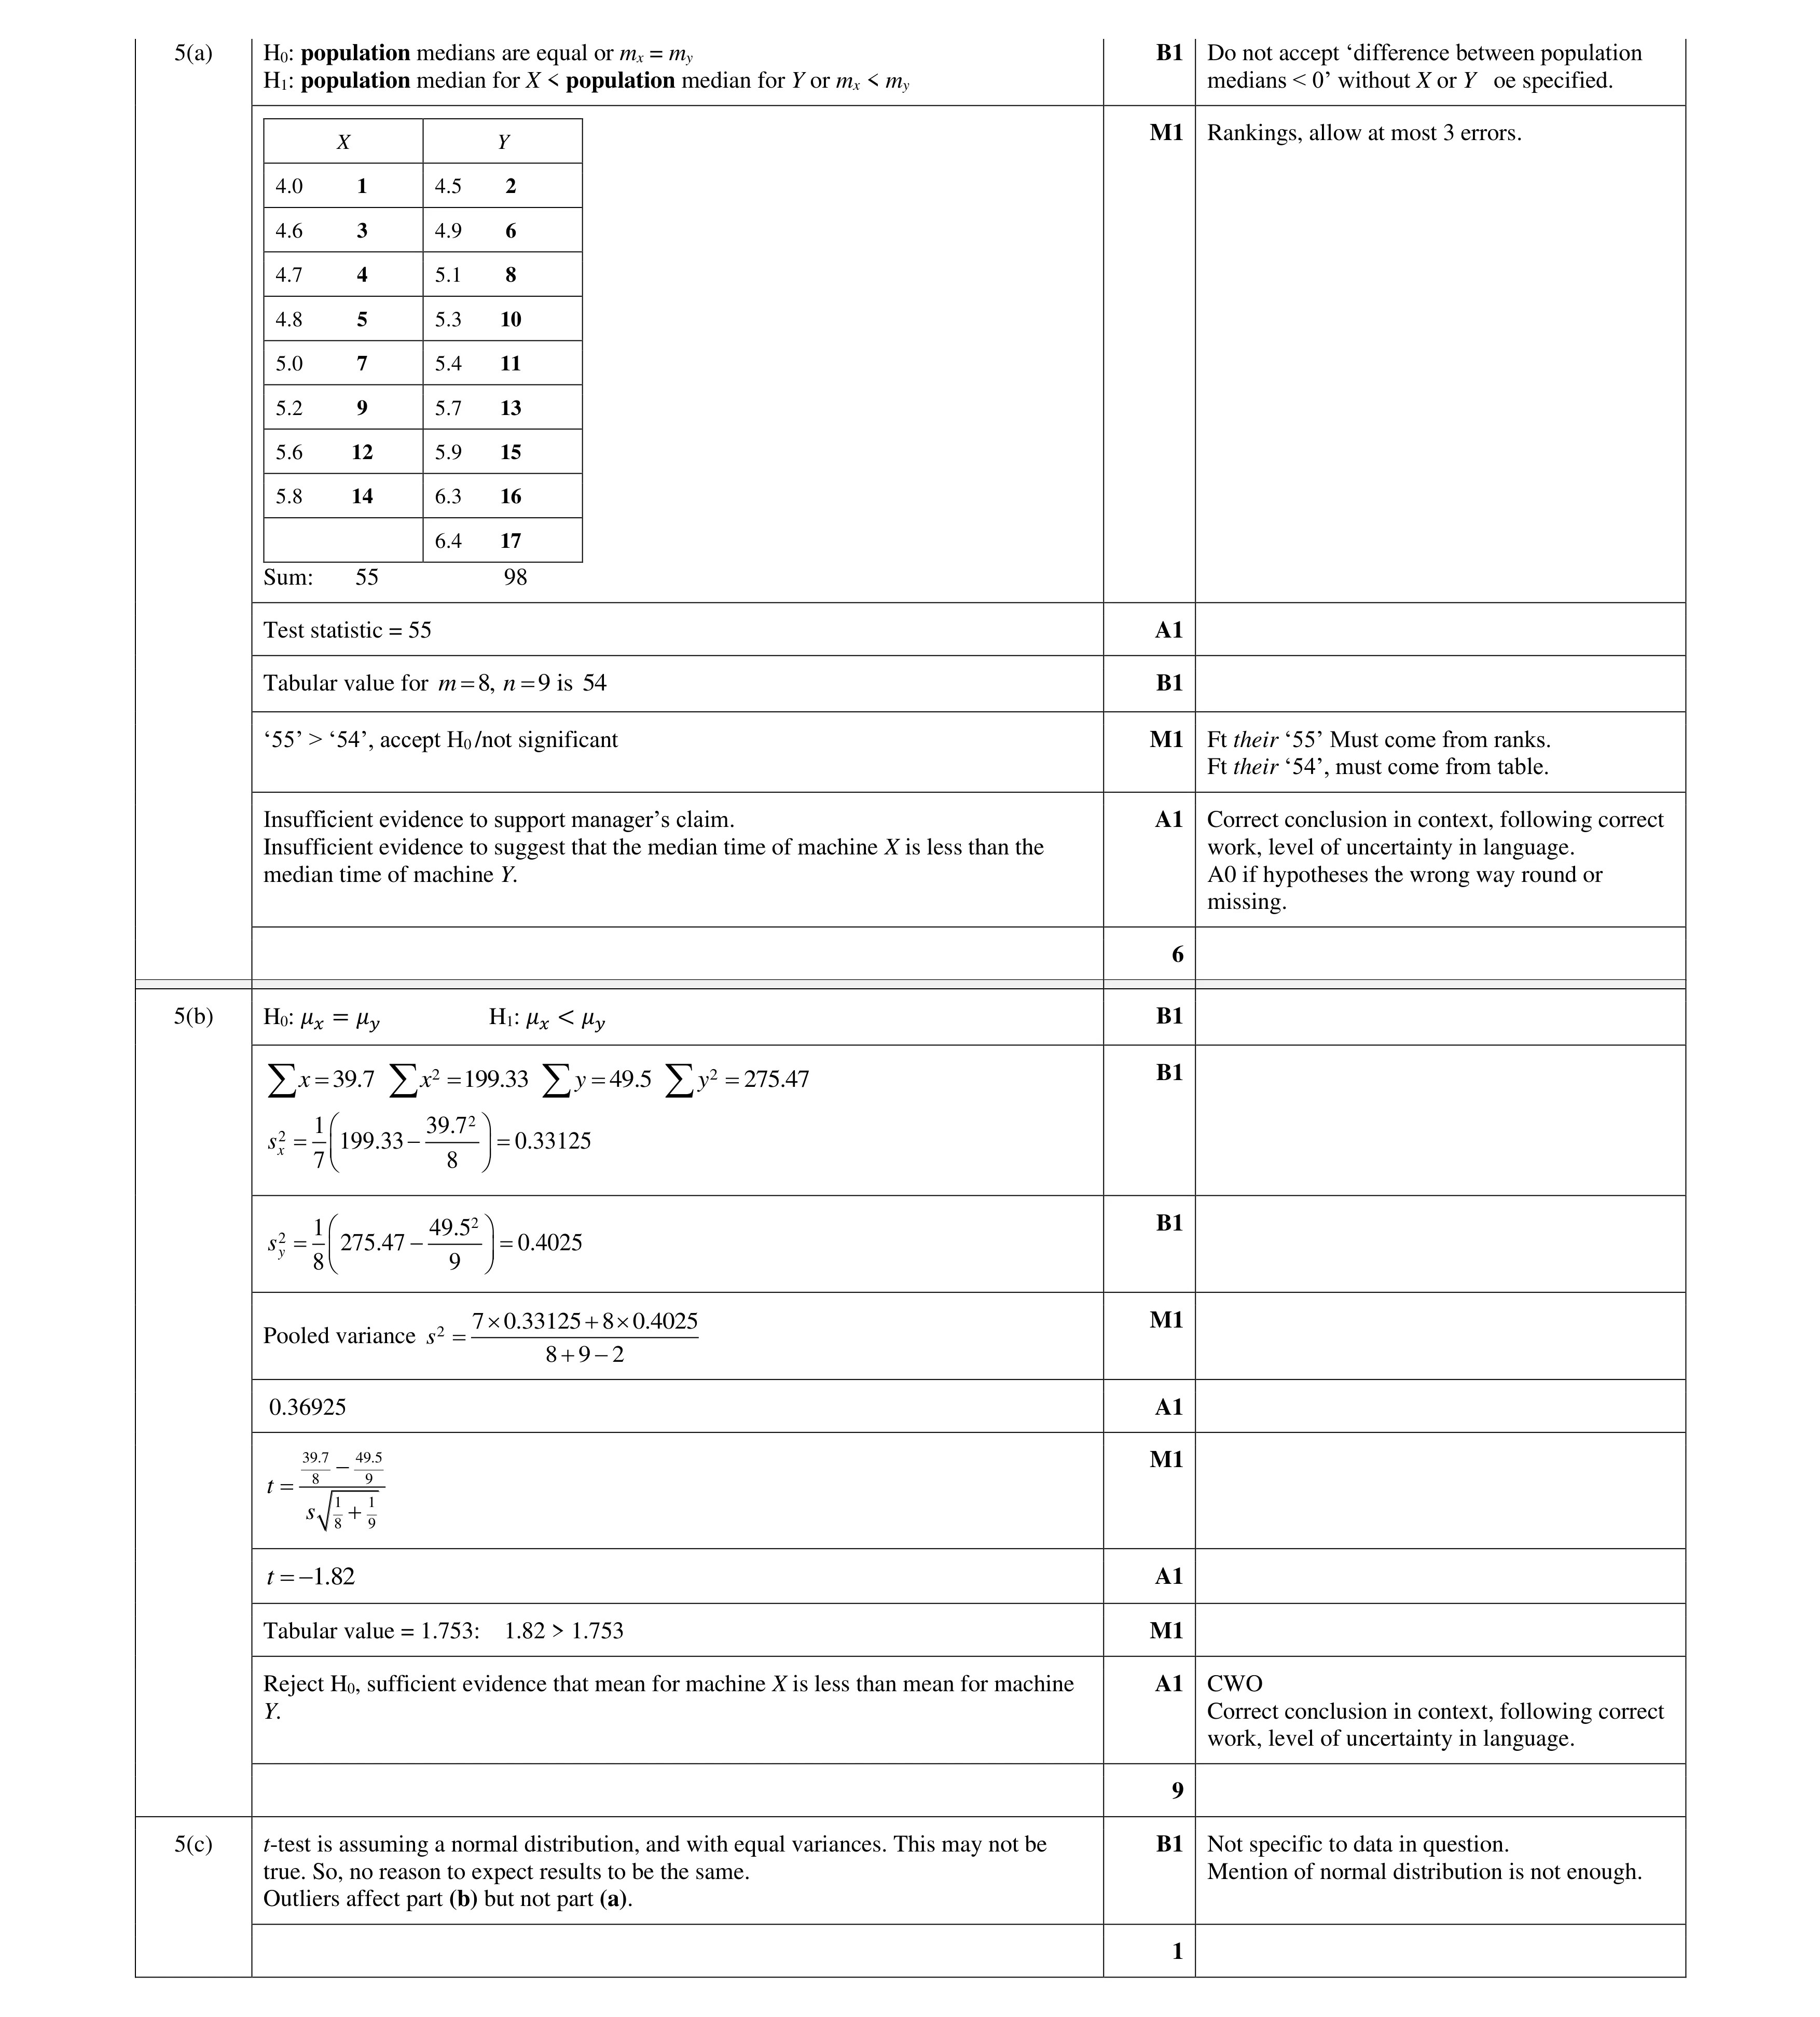 16
16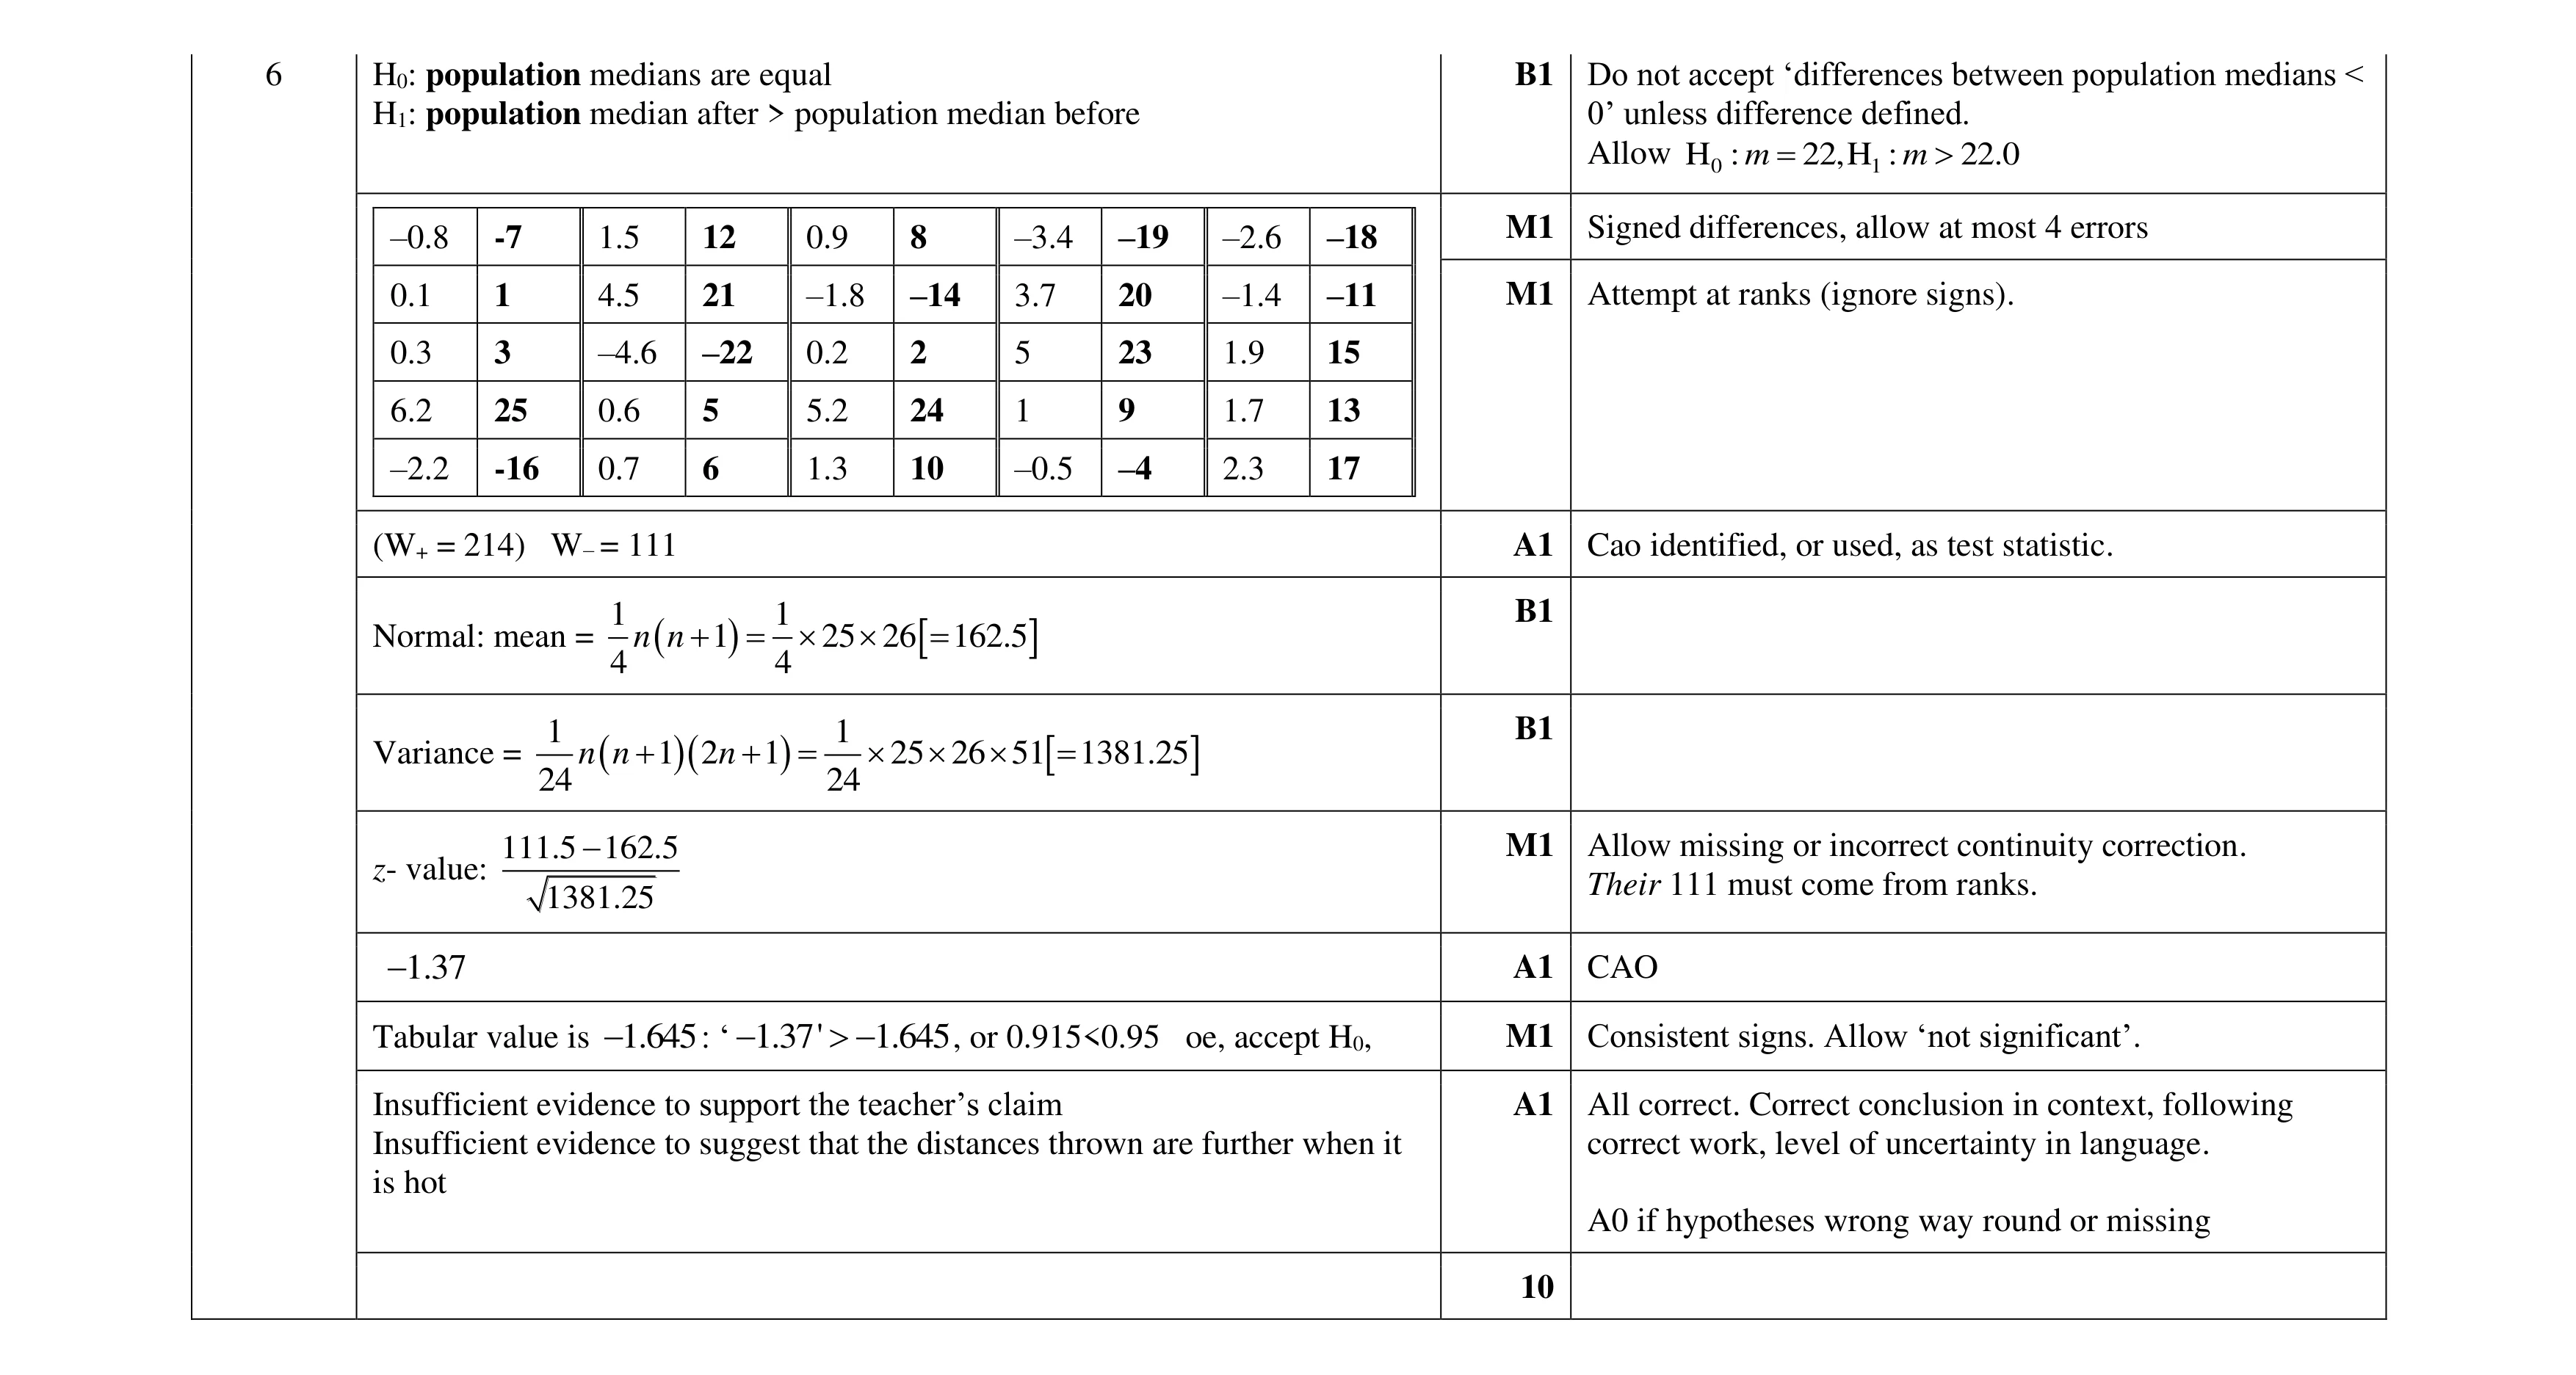 10
10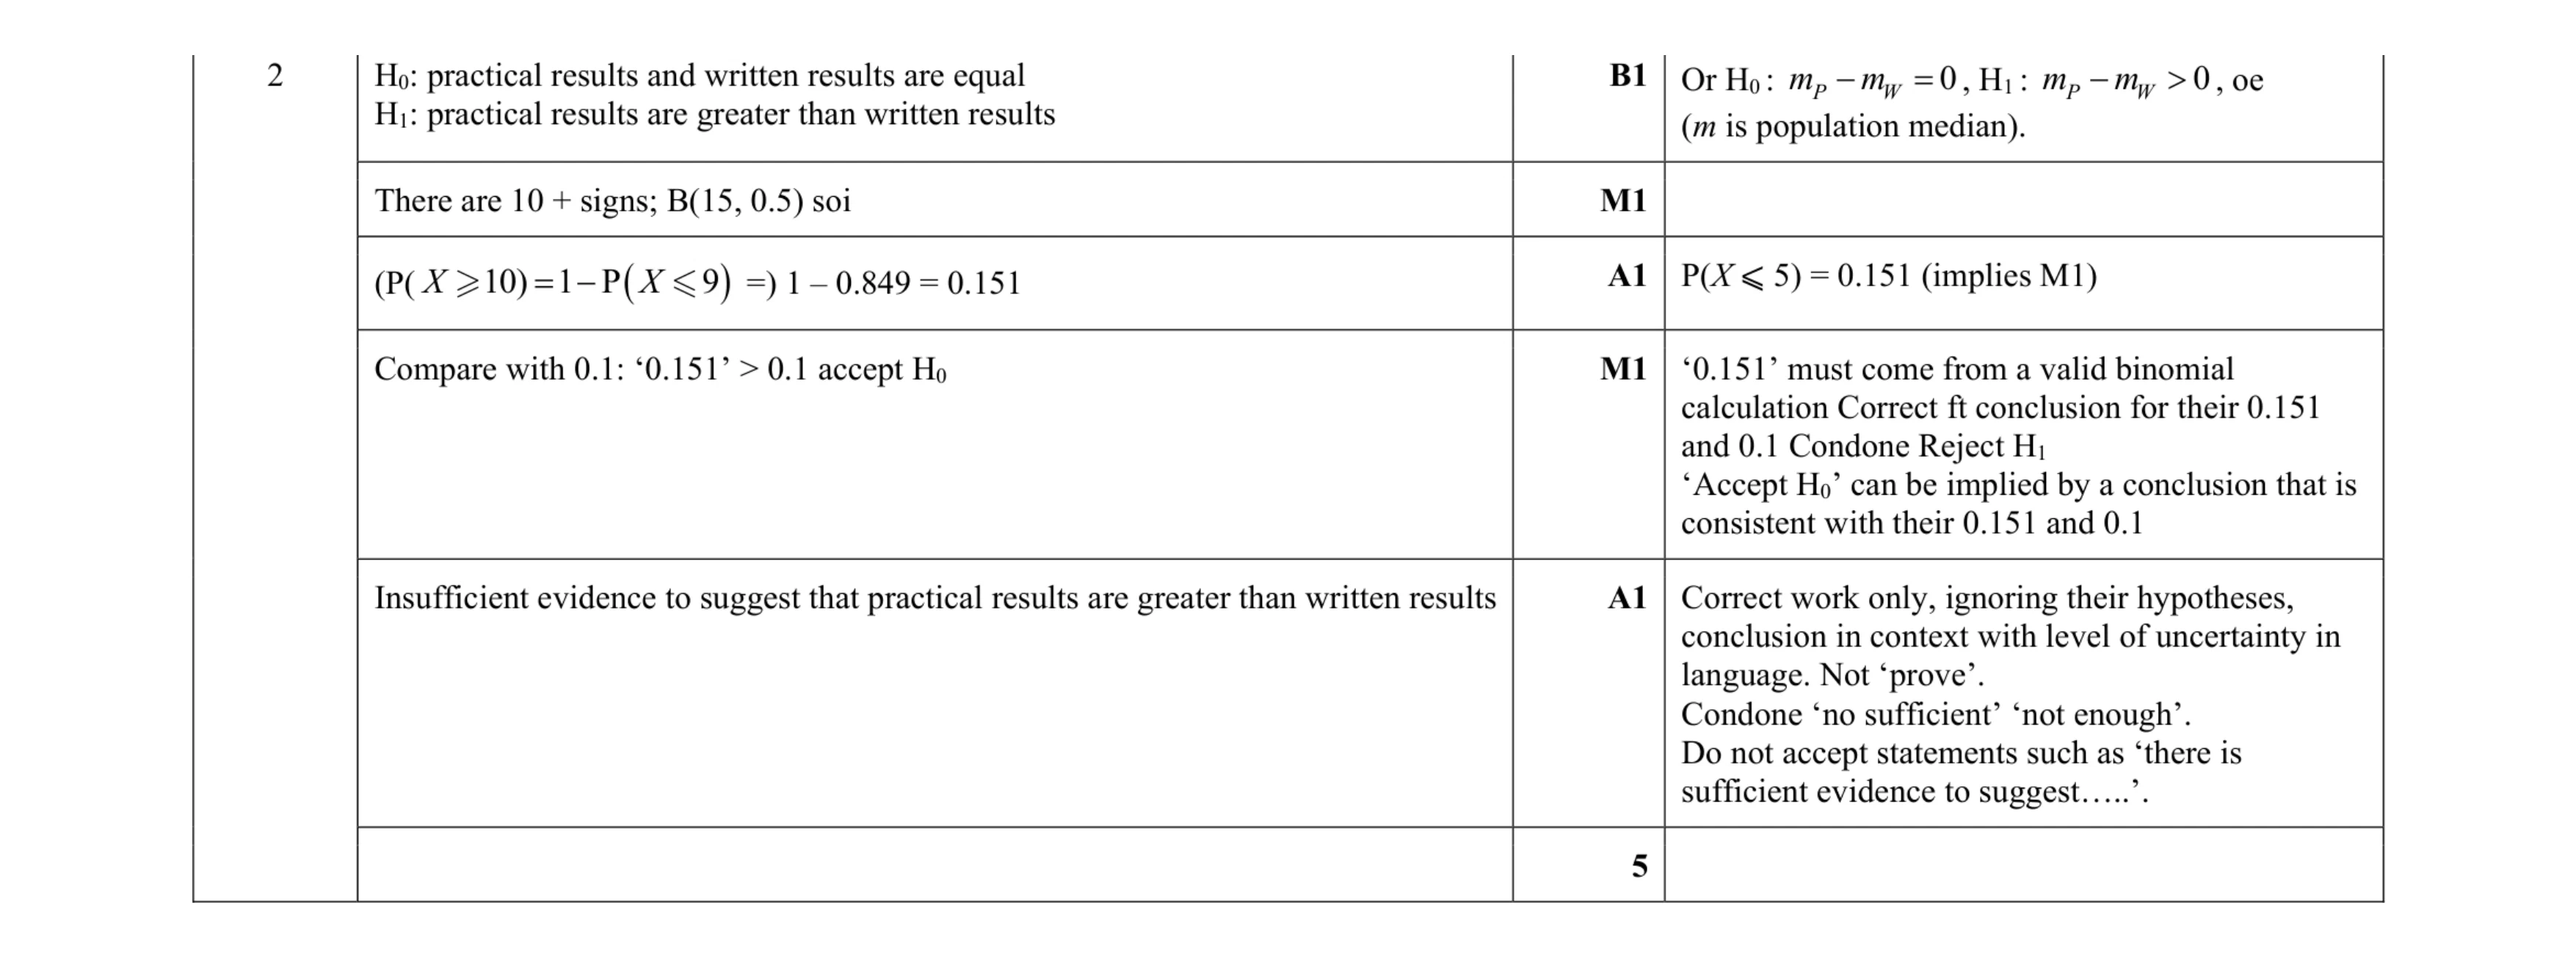 5
5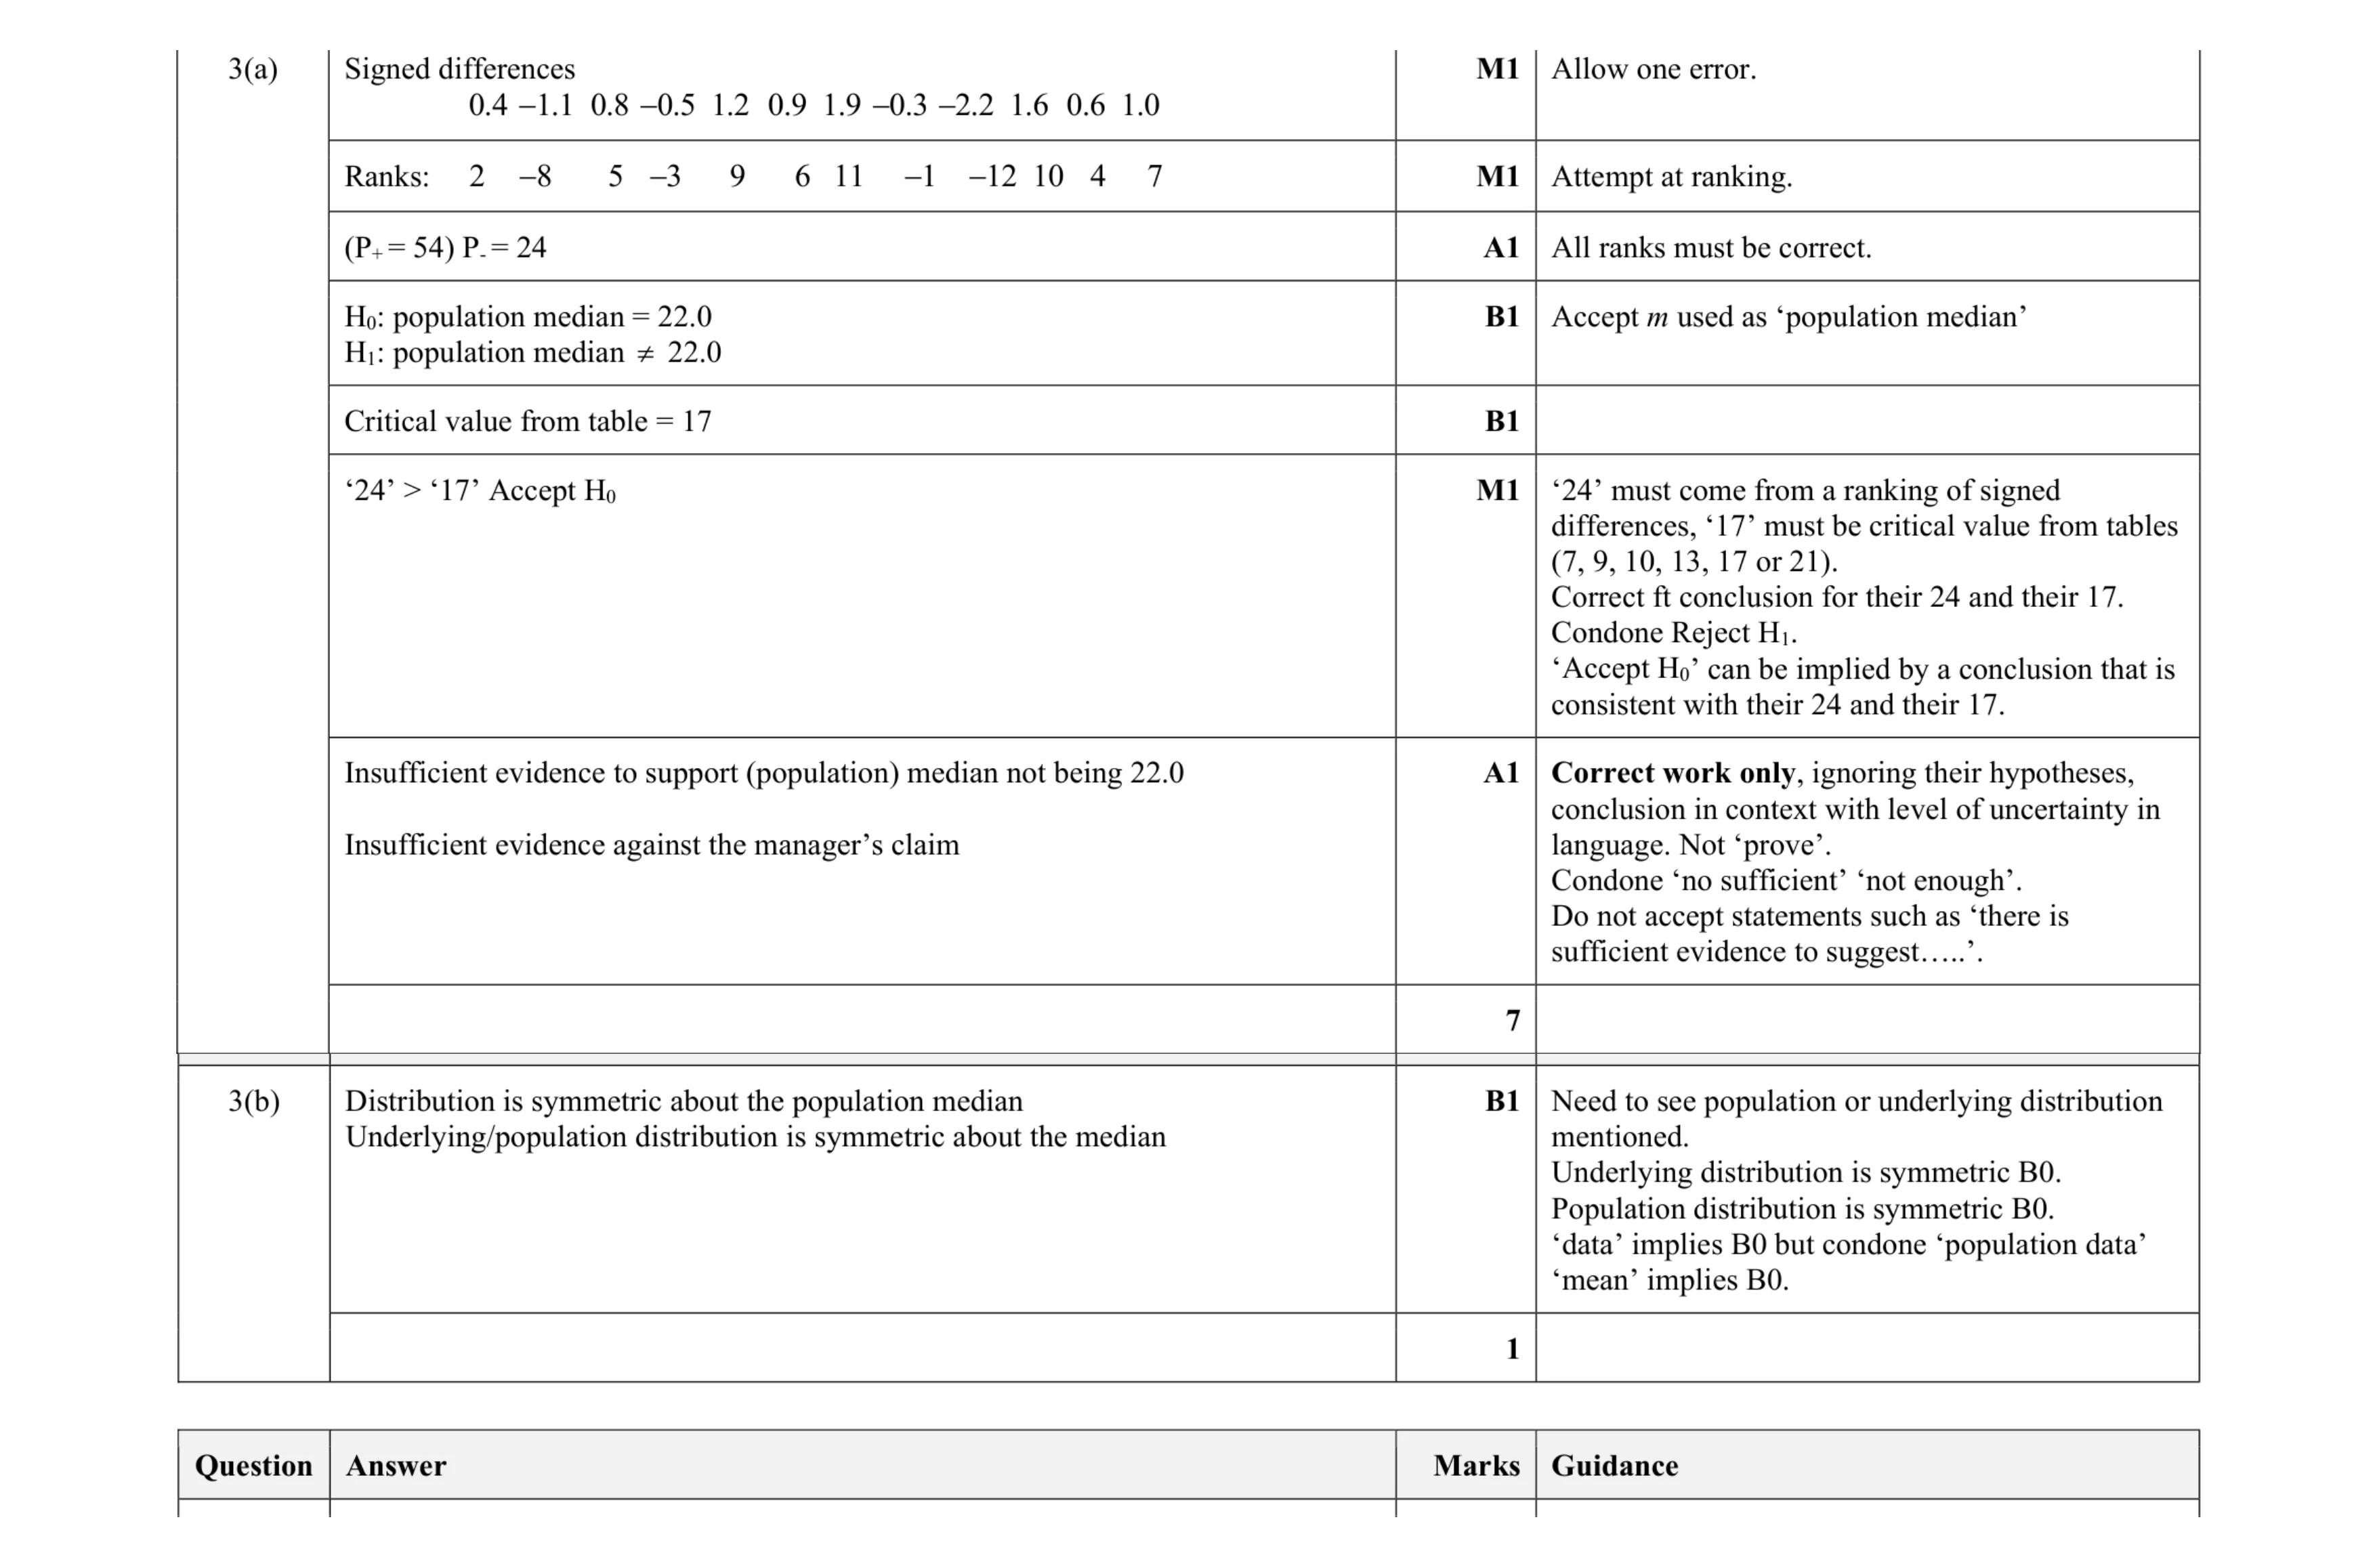 8
8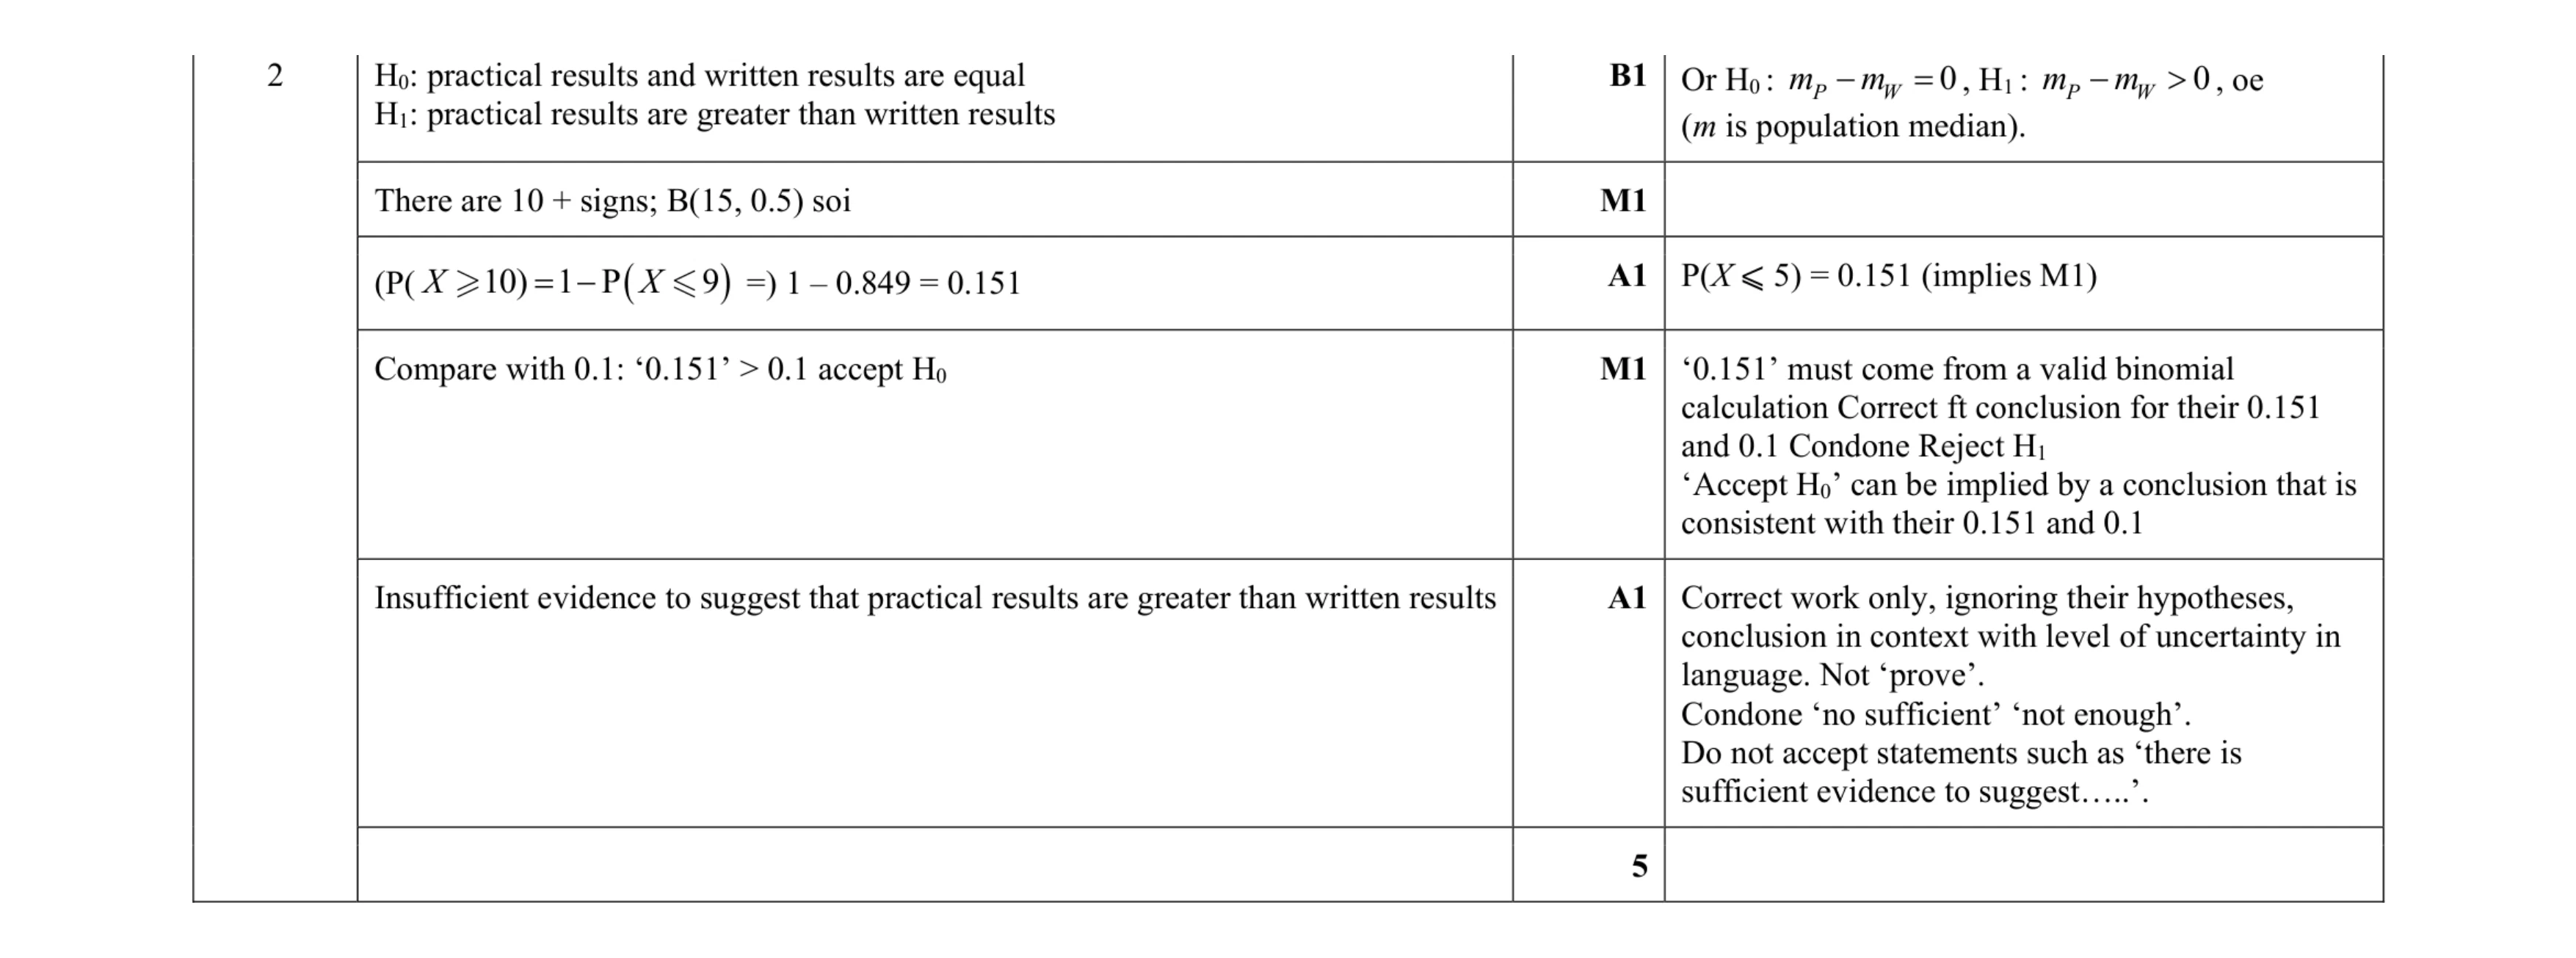 5
5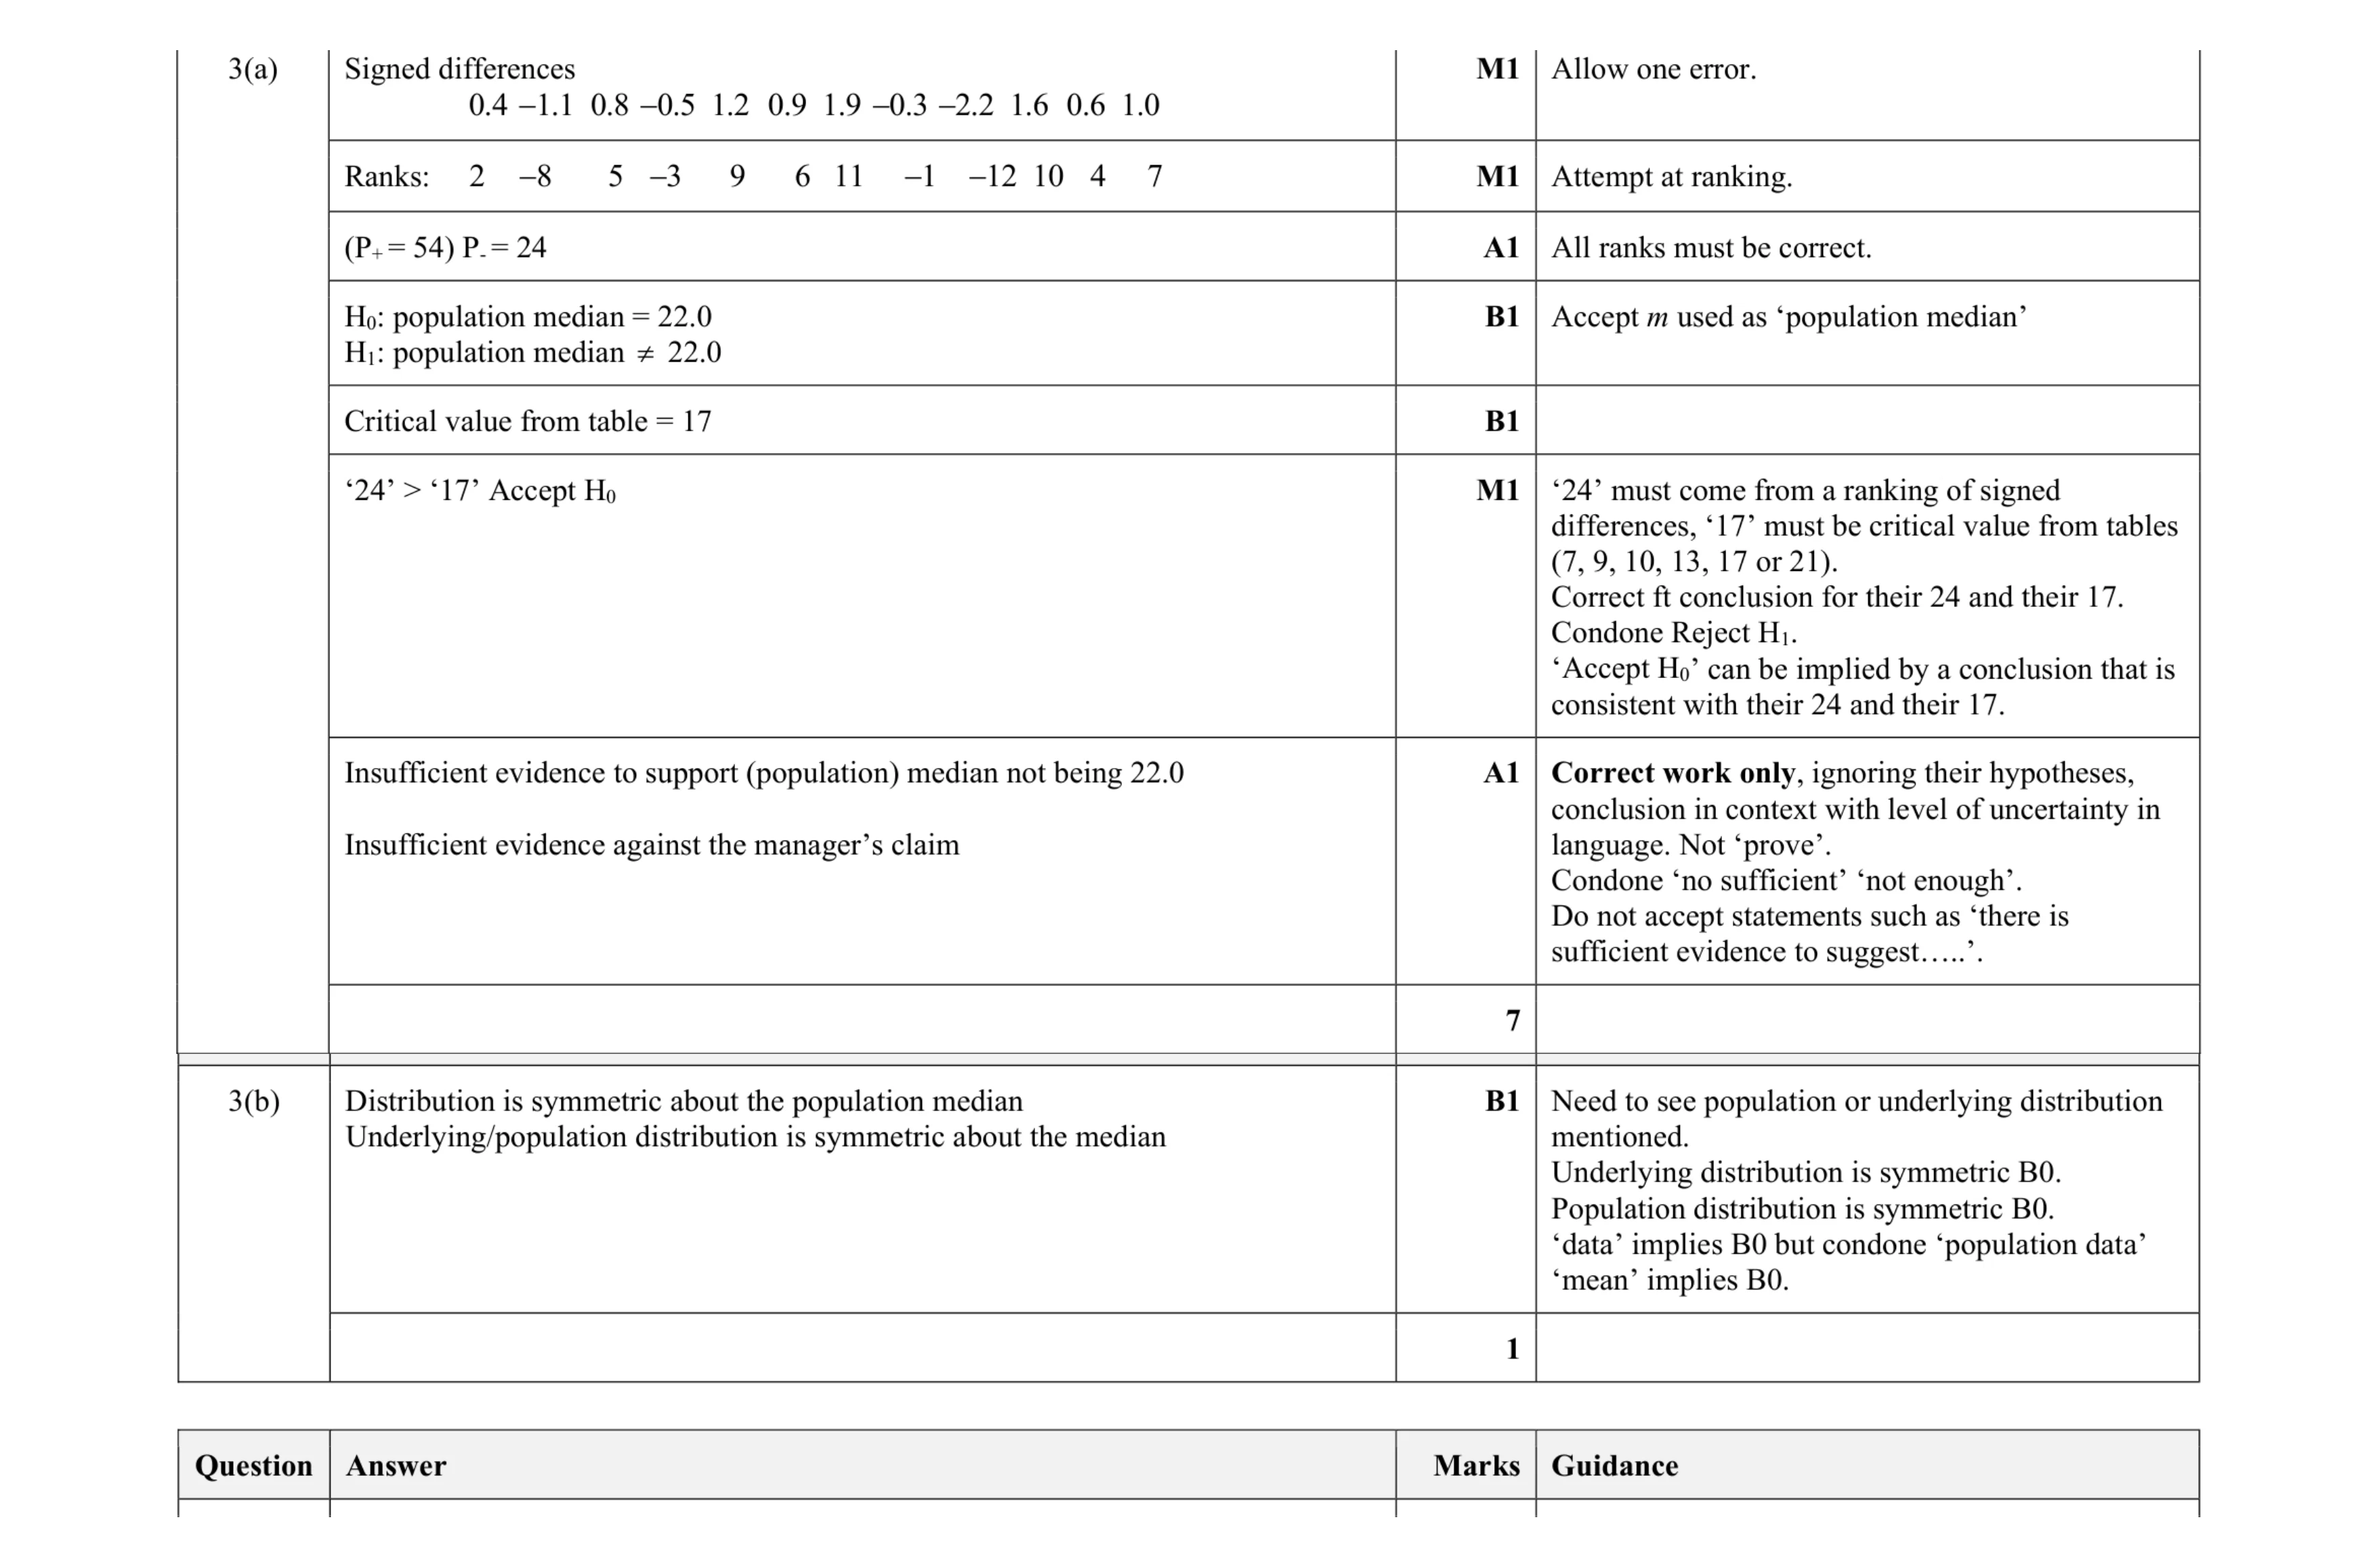 8
8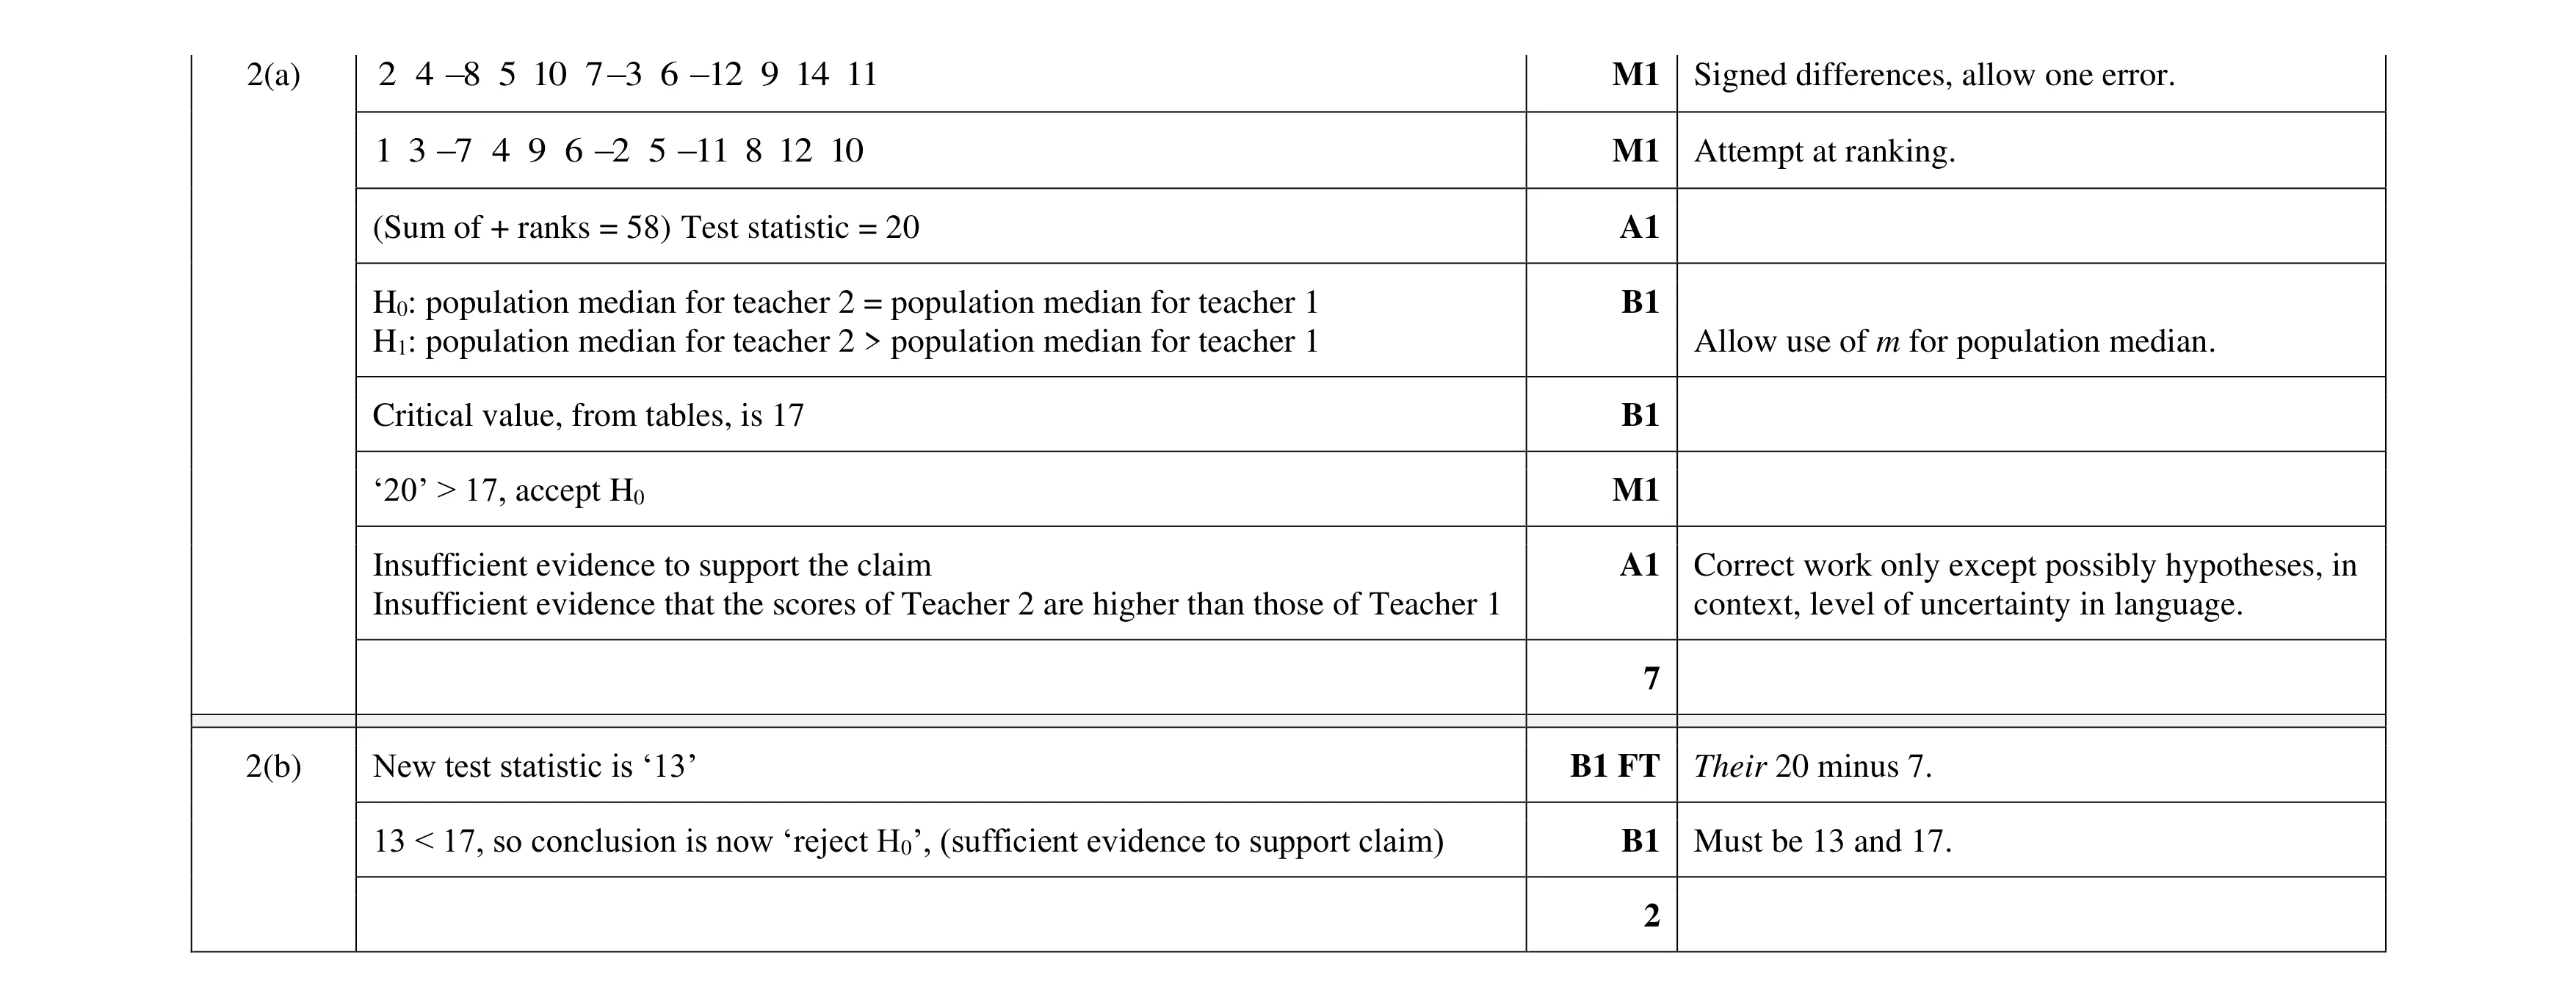 9
9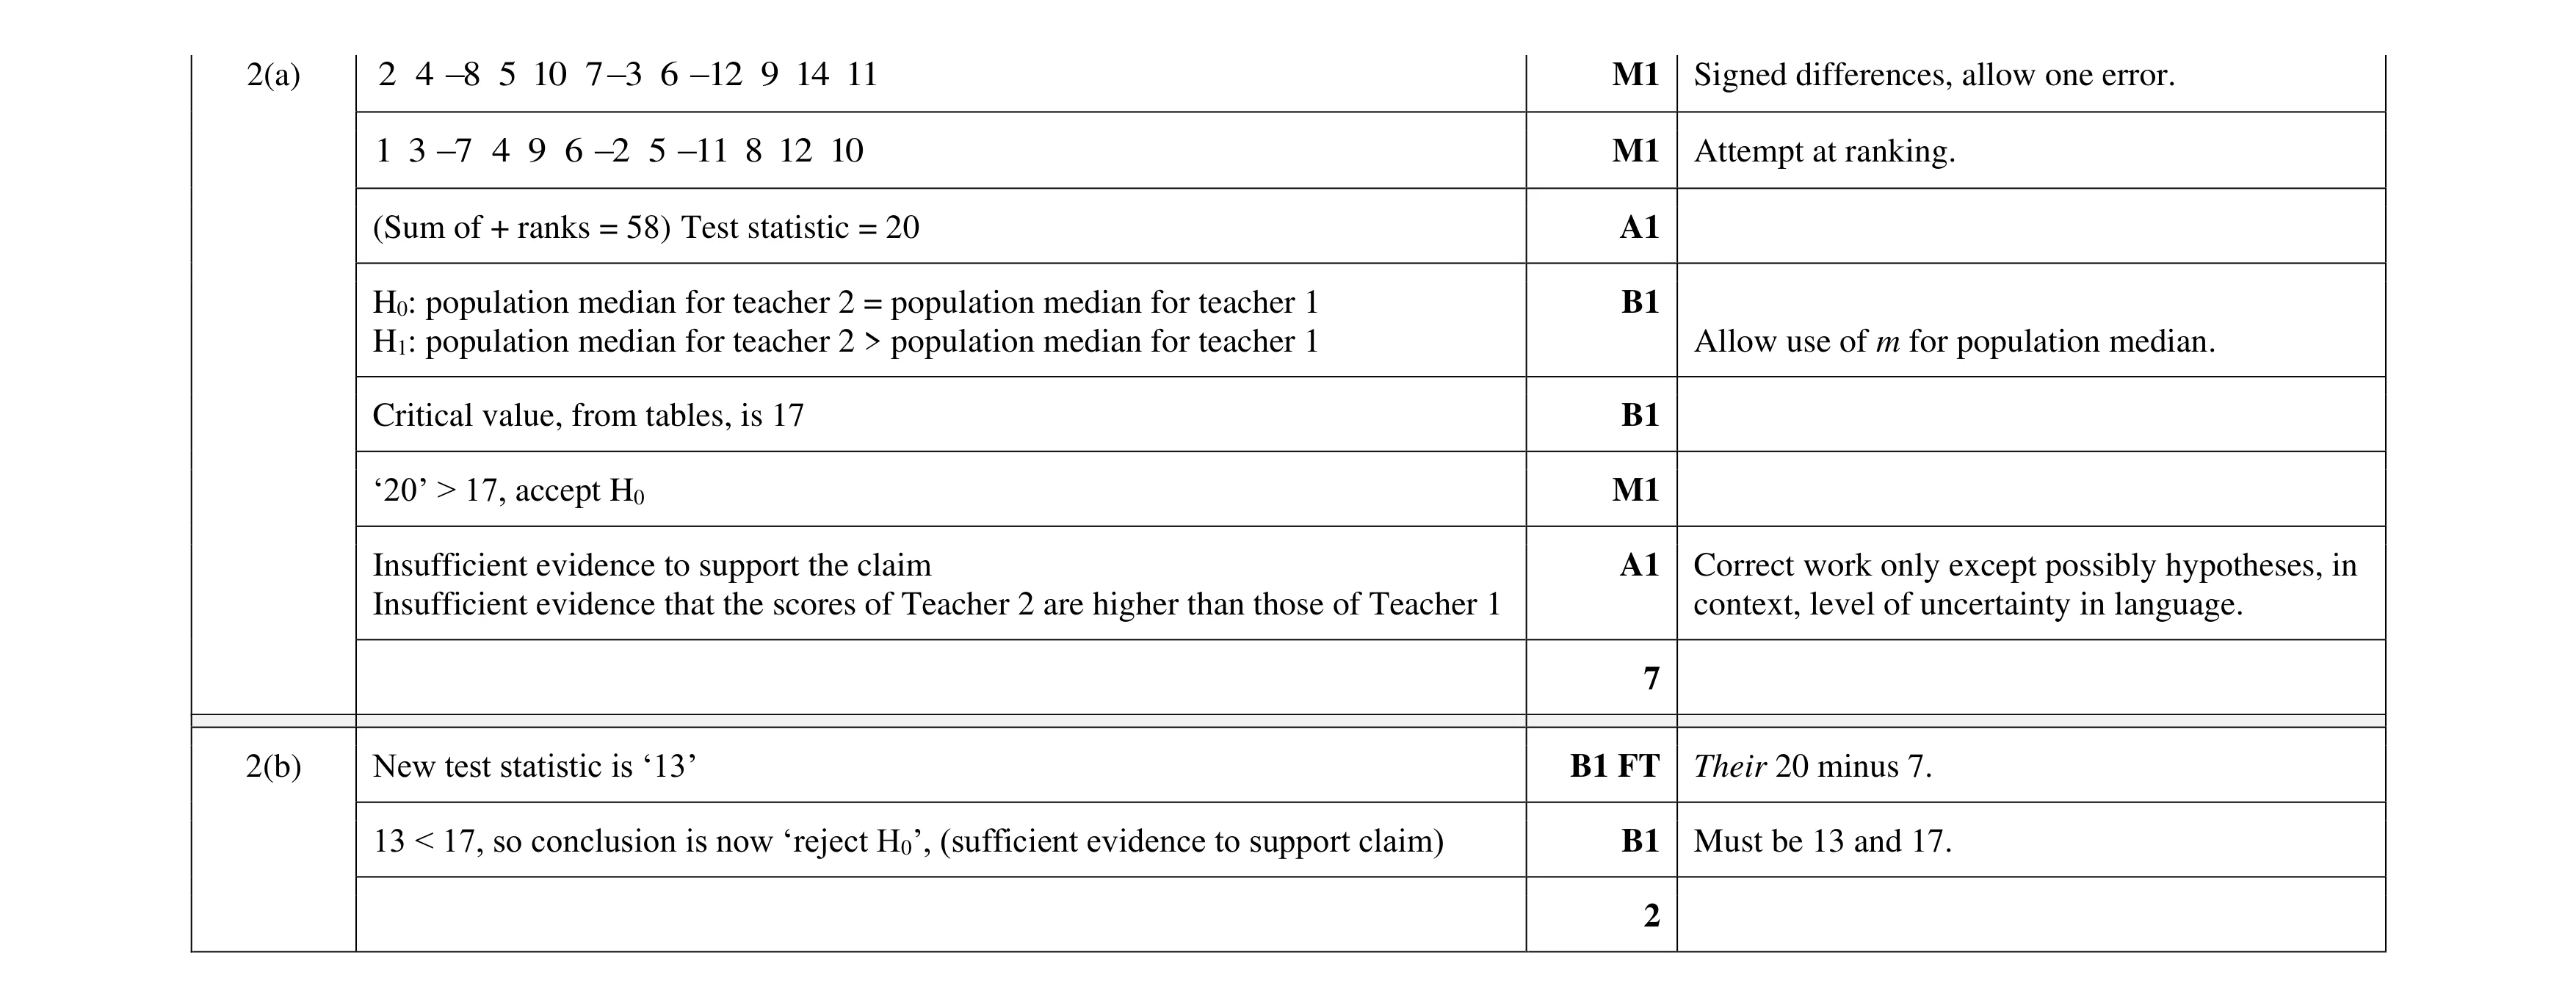 9
9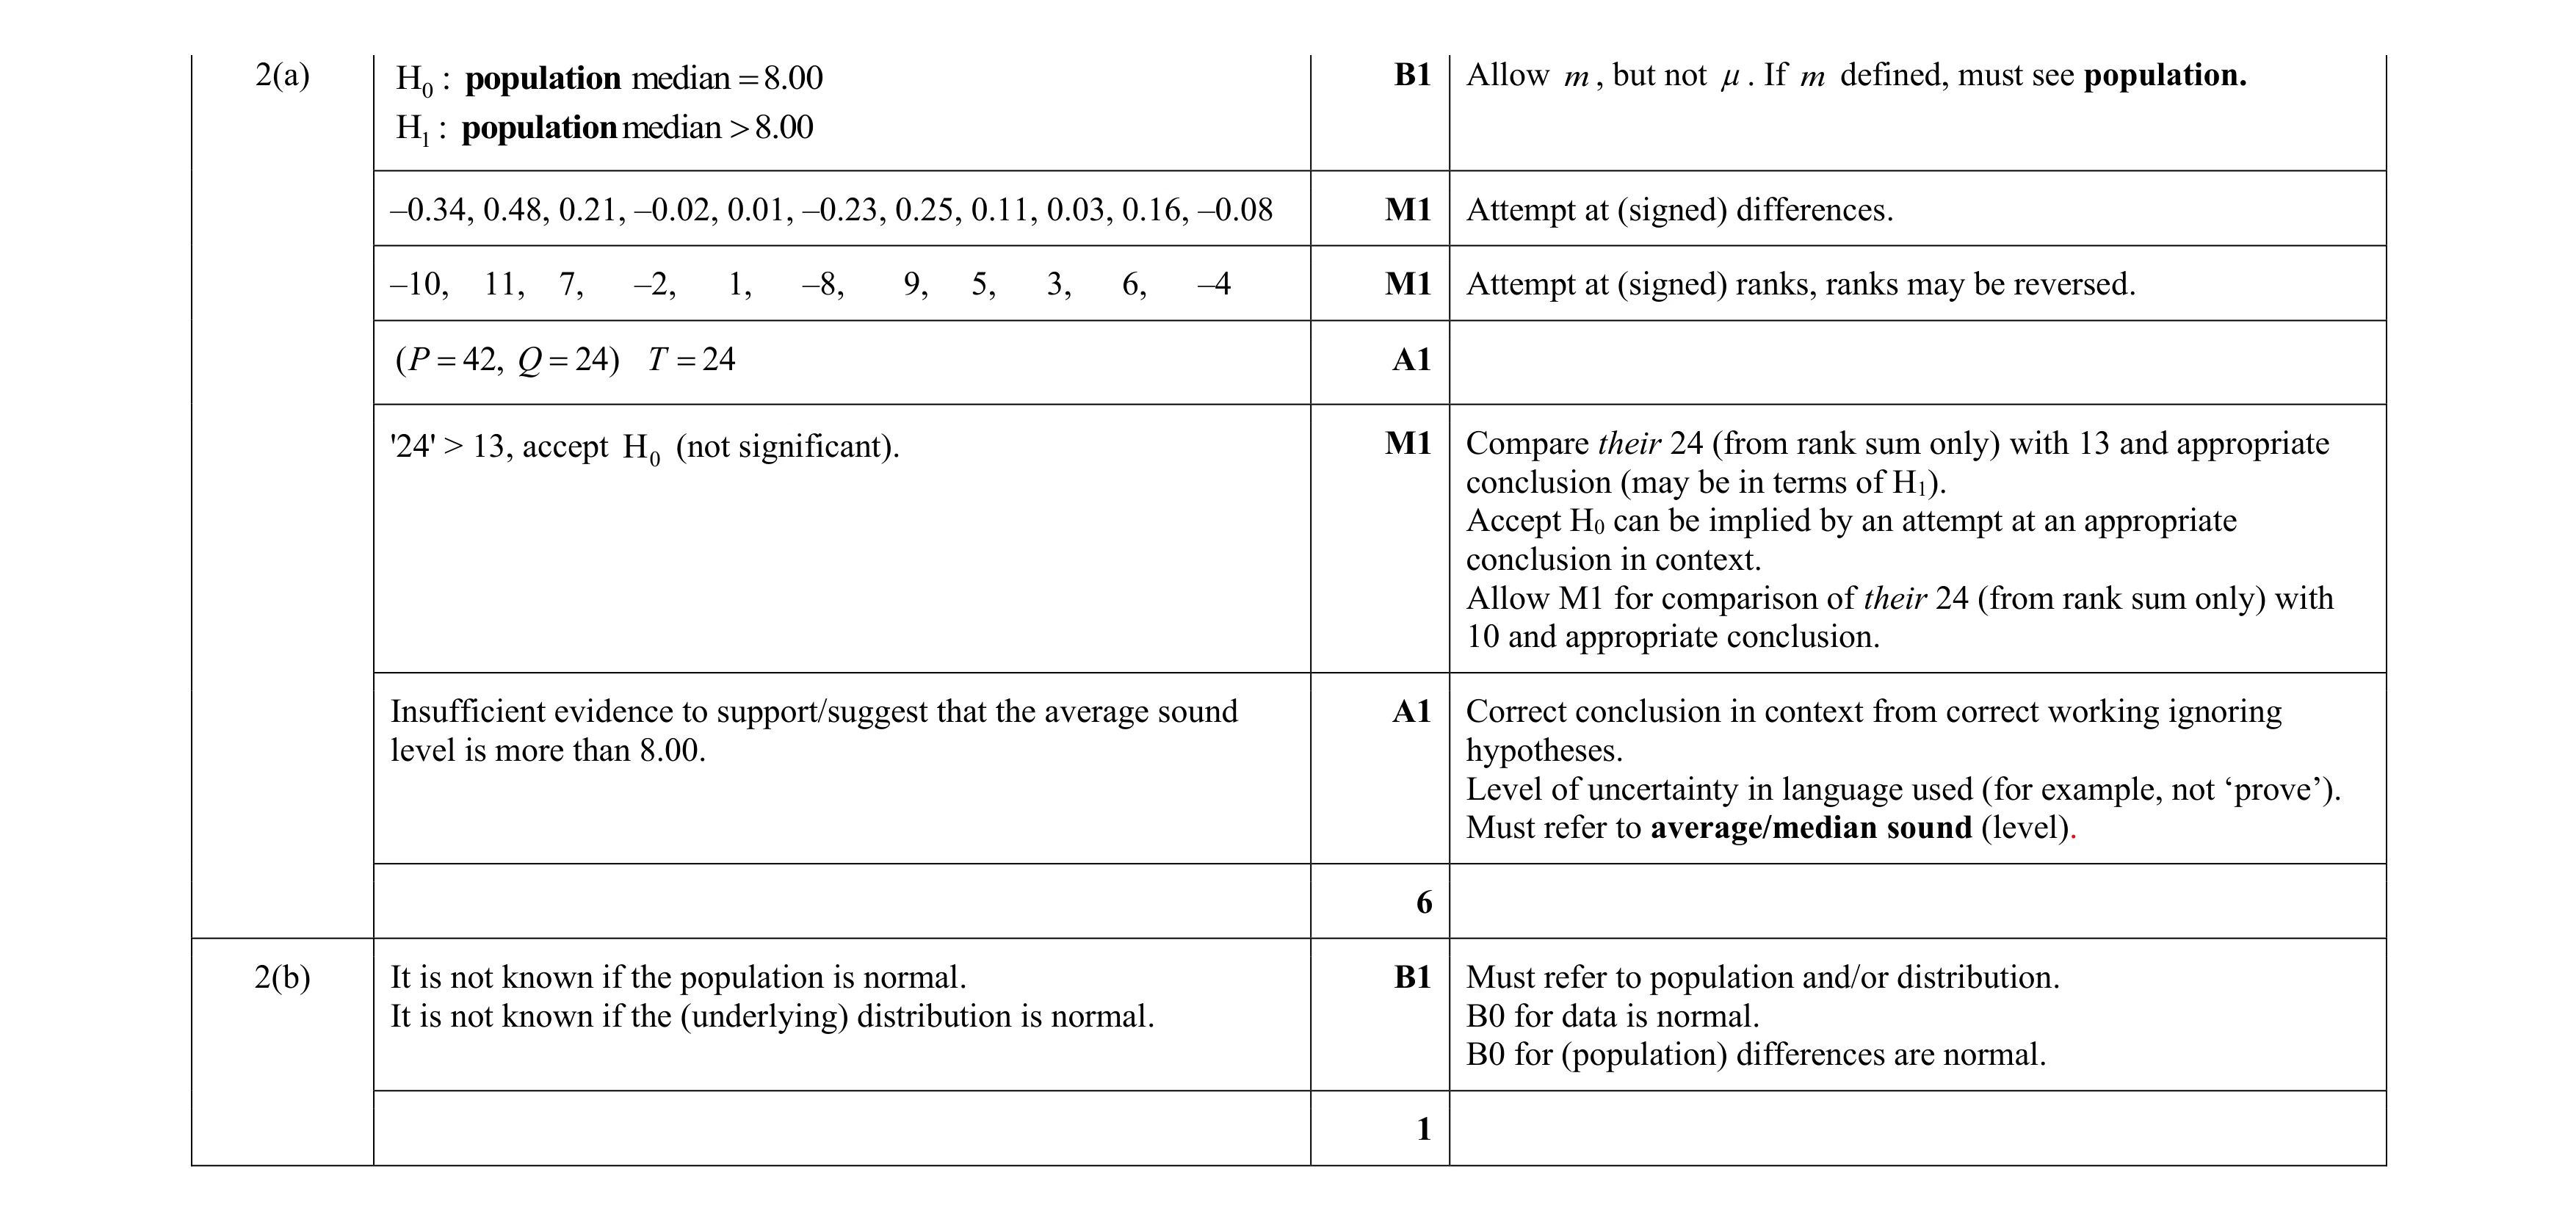 7
7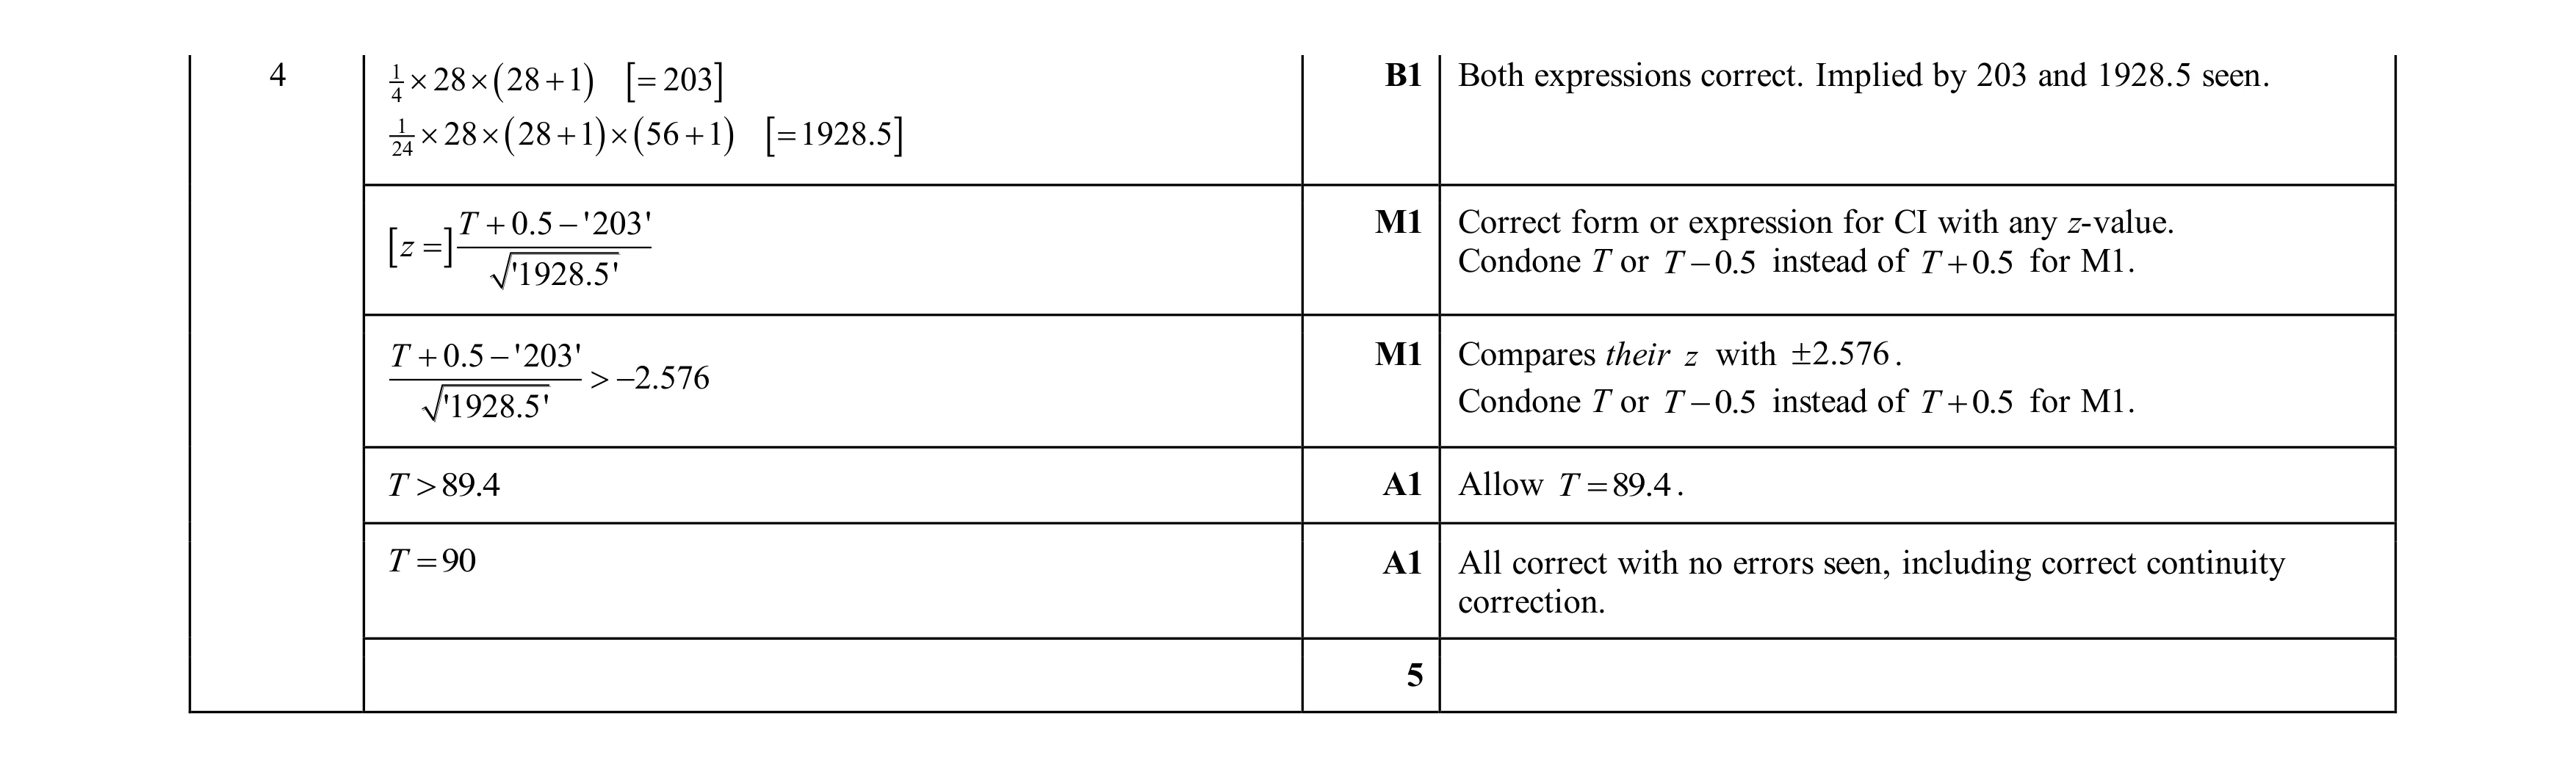 5
5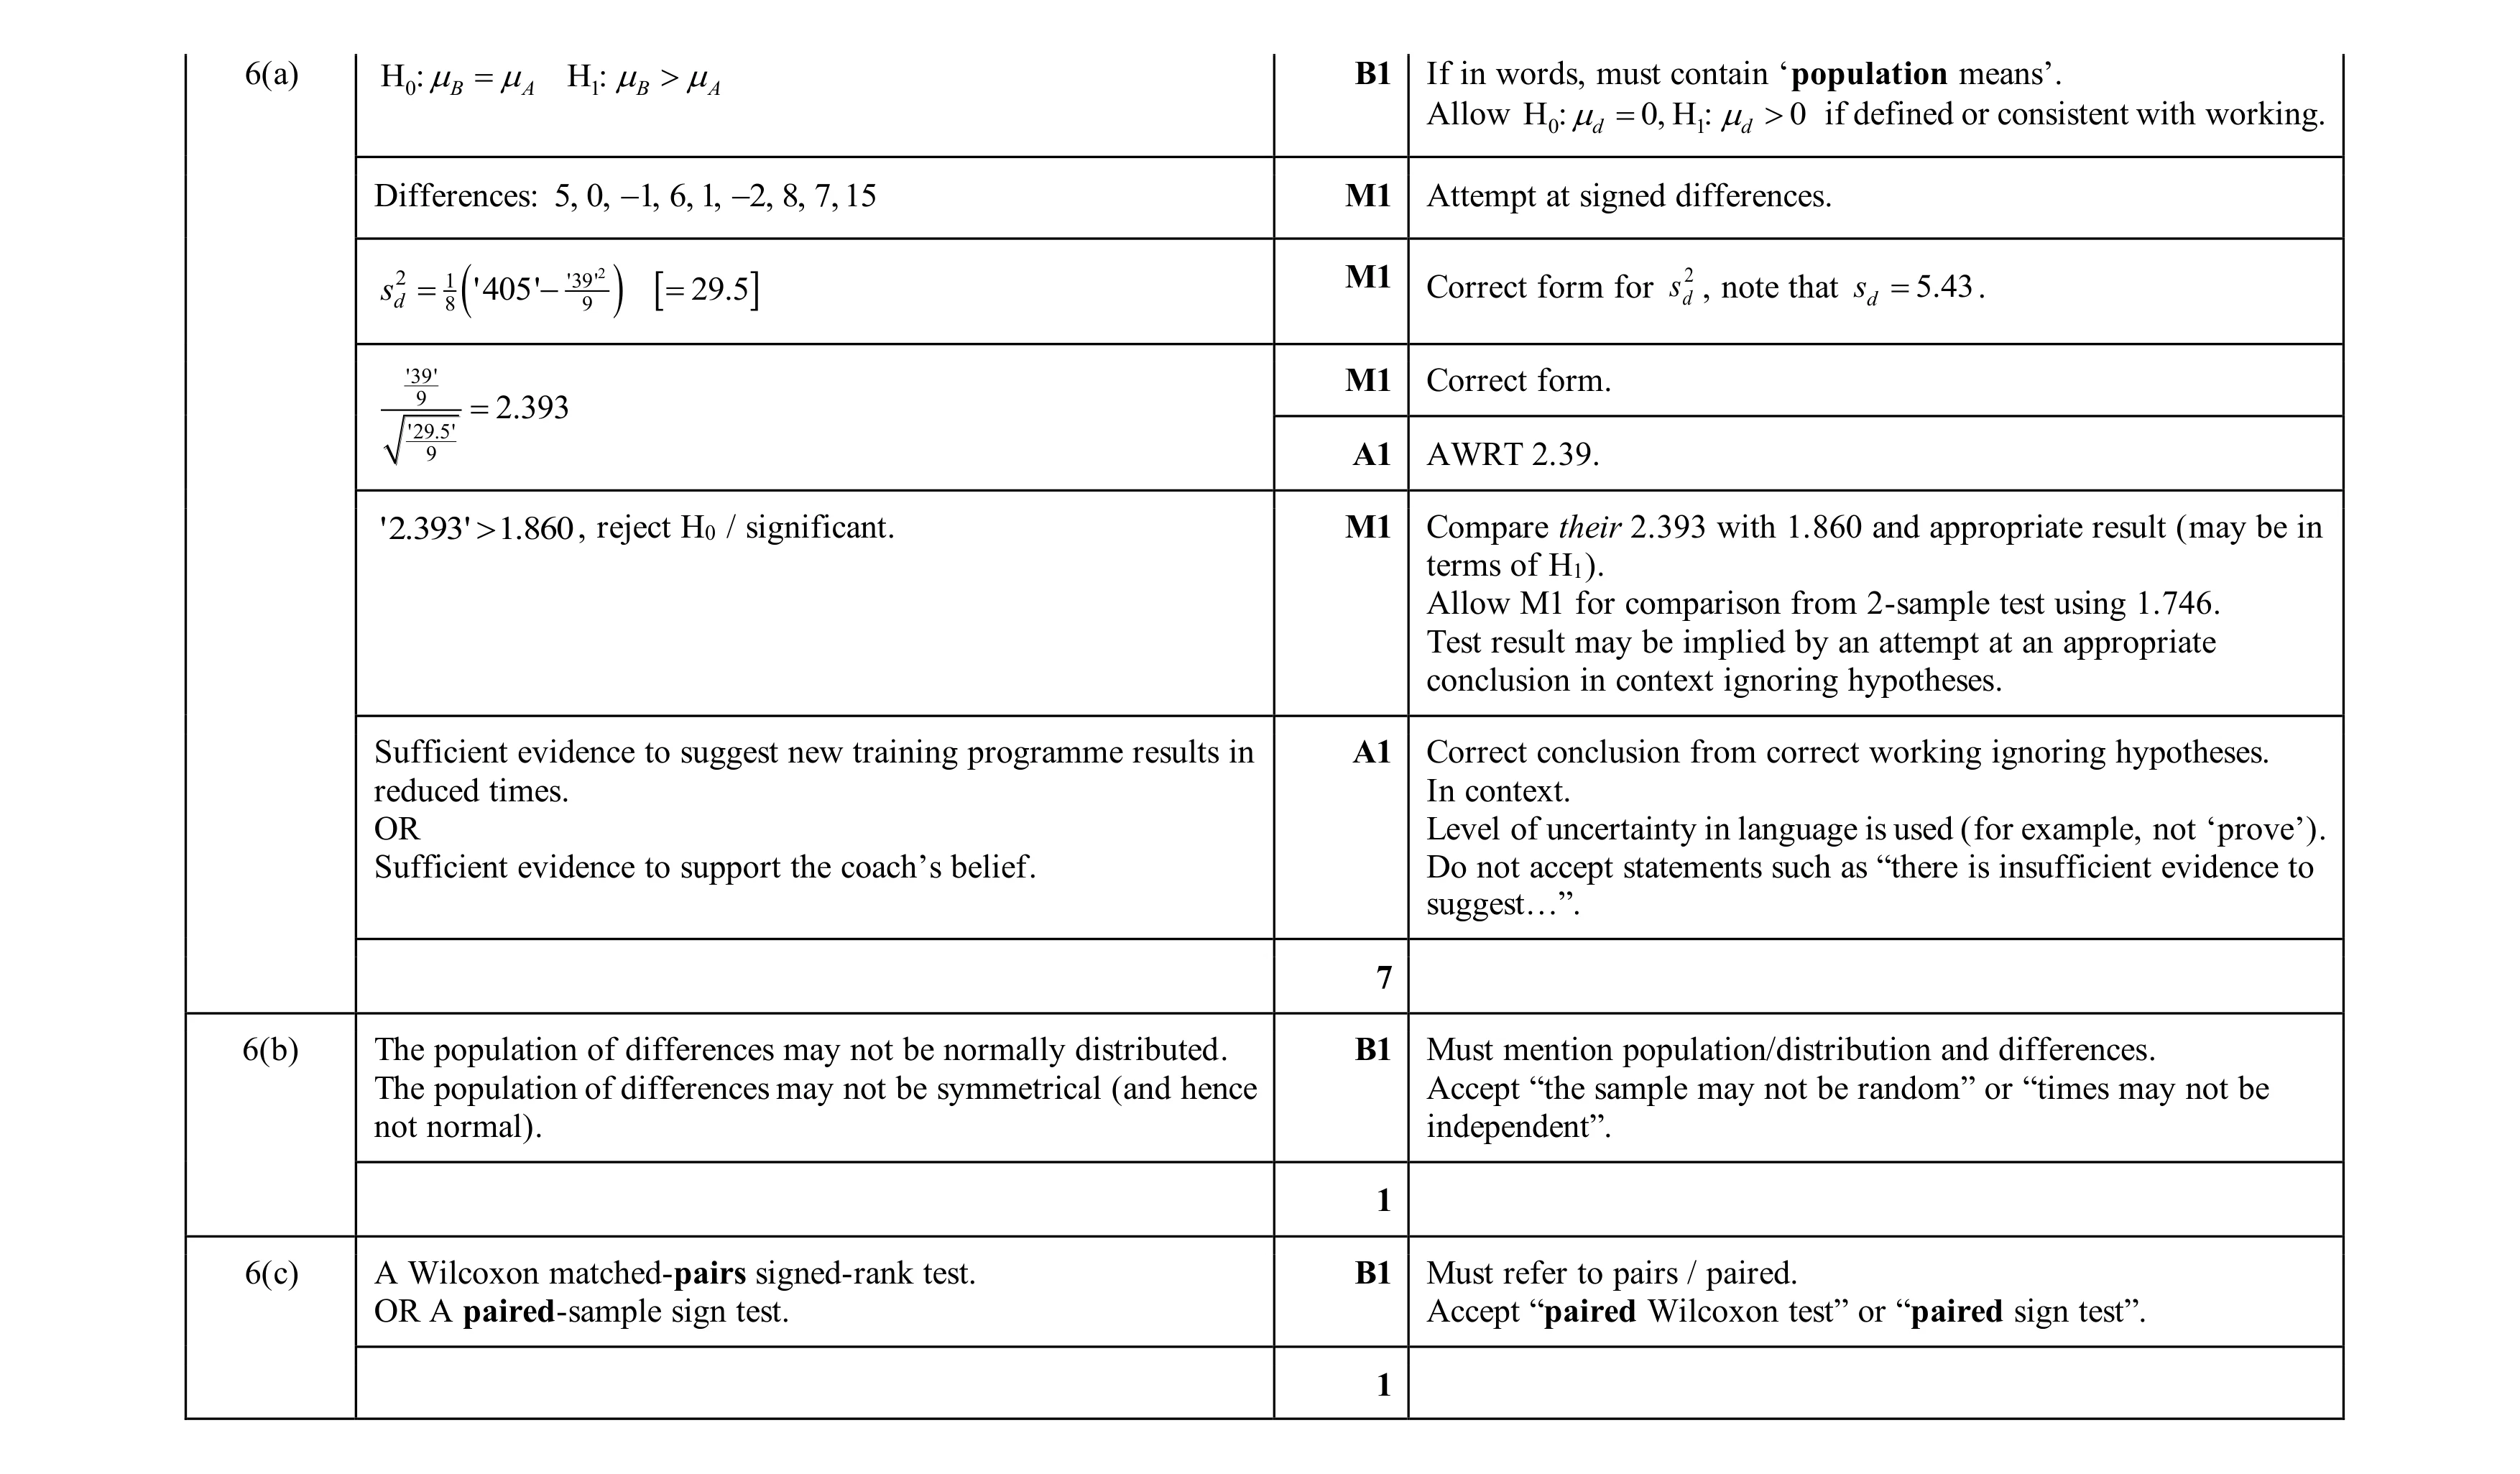 9
9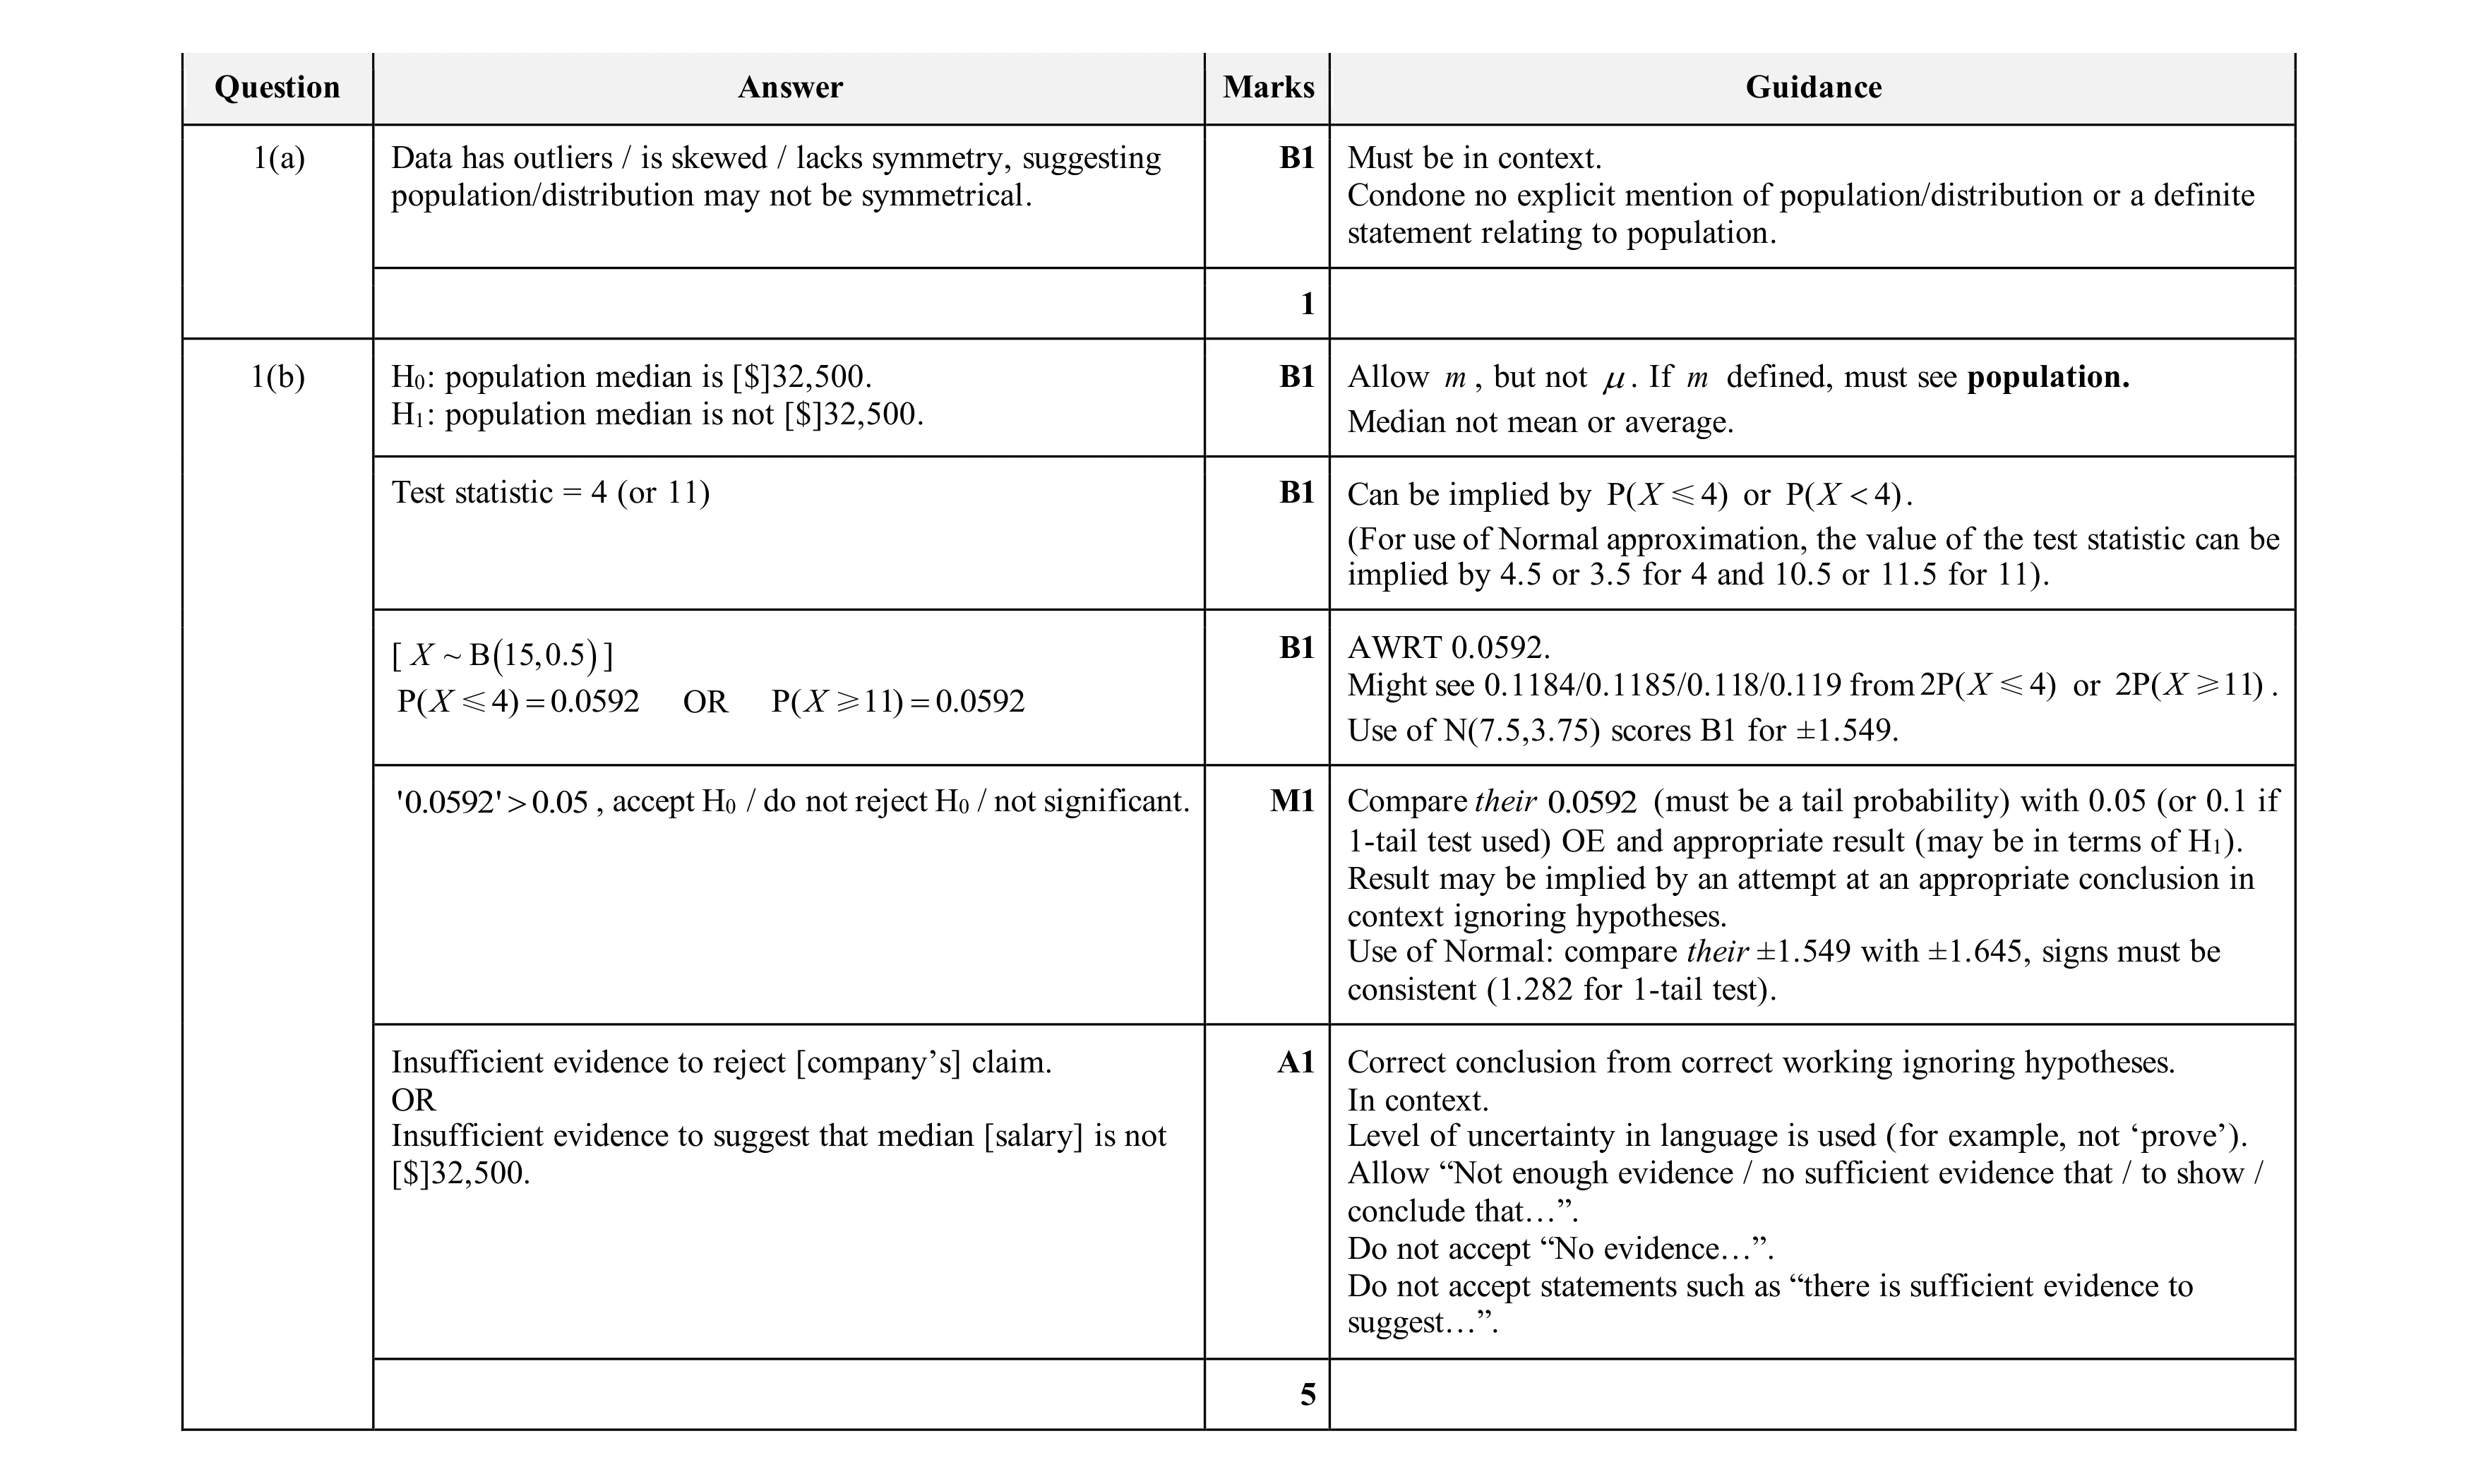 6
6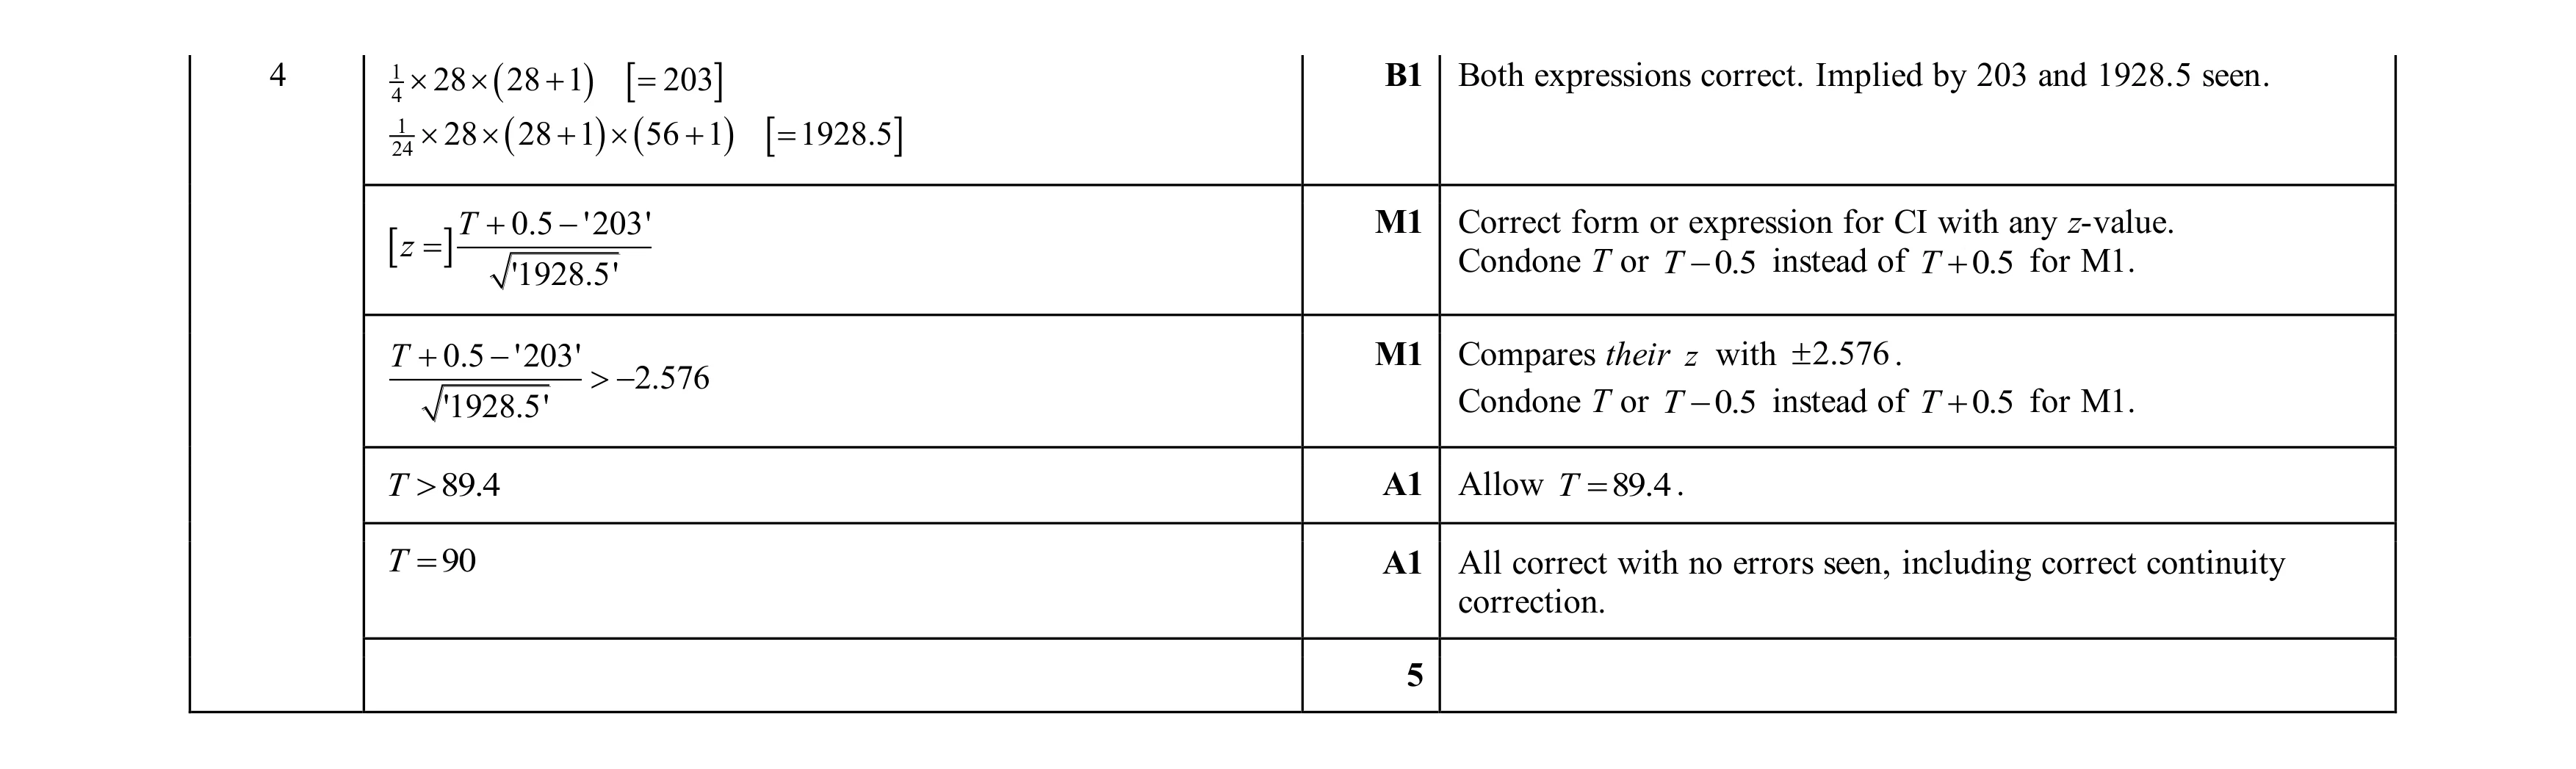 5
5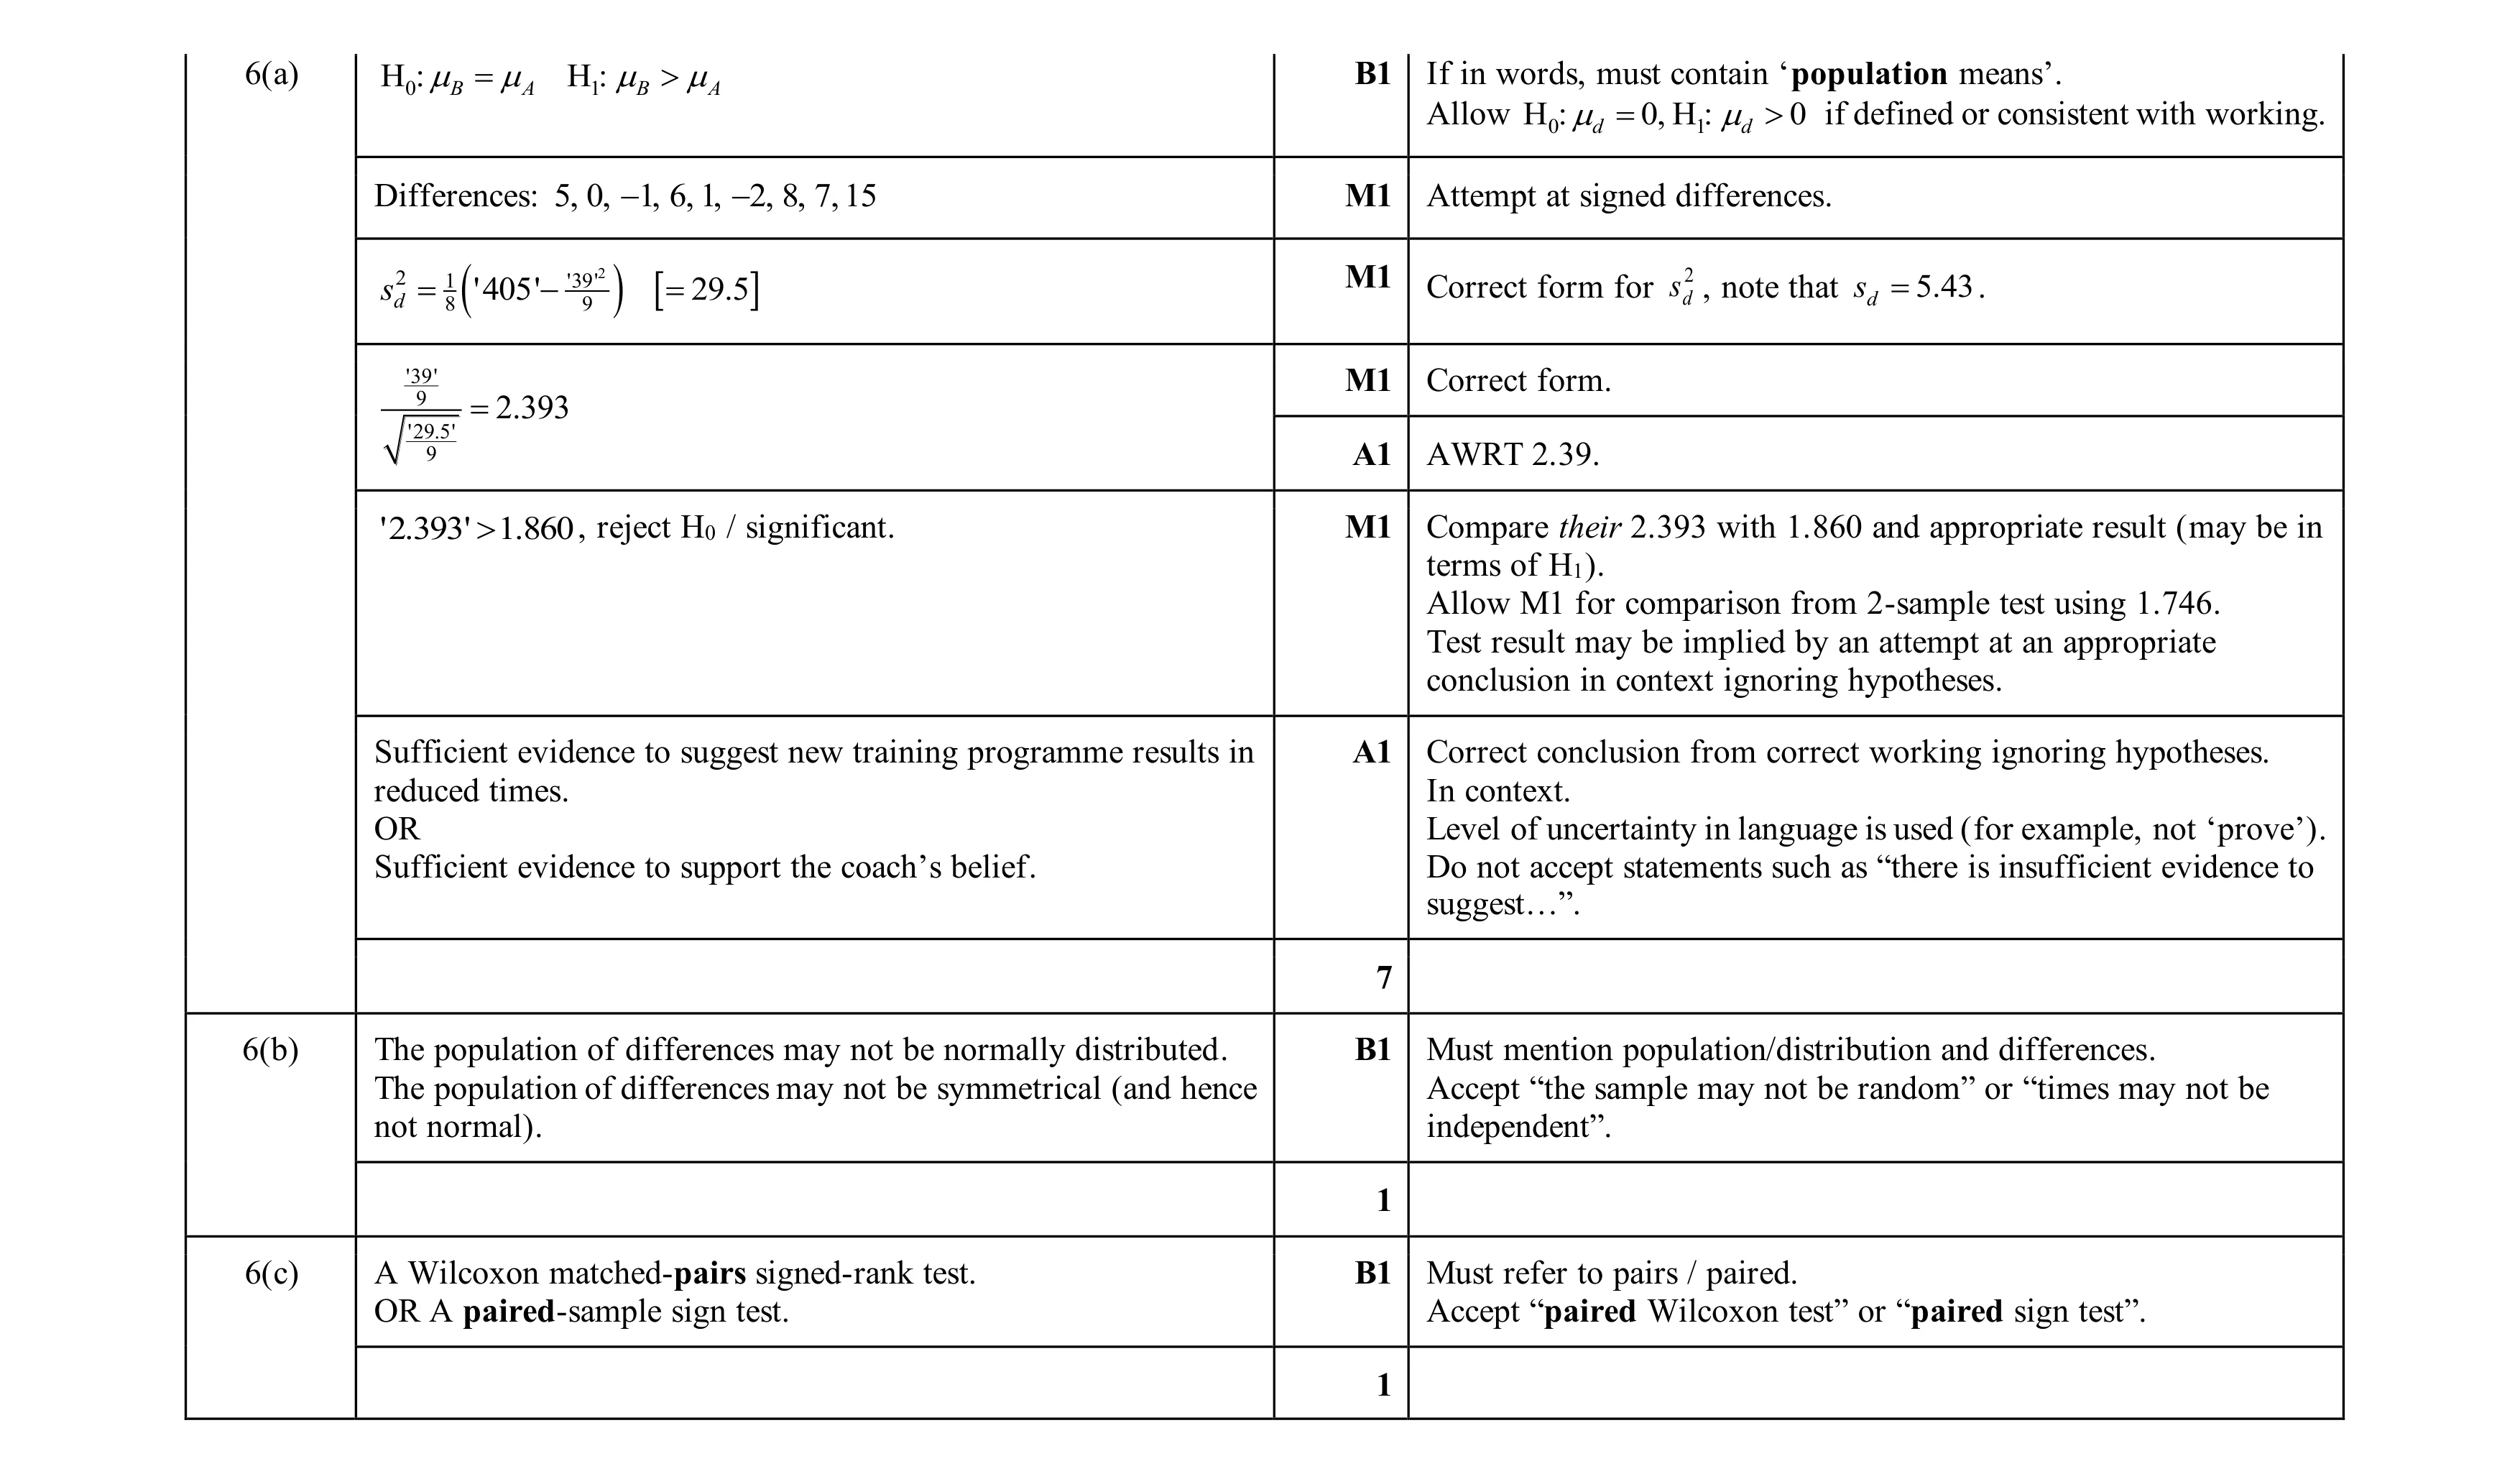 9
9