Cambridge A Level Mathematics 9709 — 2022 Oct/Nov Paper 5 · Variant 1
9709/51/O/N/22 · 4 questions · 50 marks · ≈56 min
The question paper and its mark scheme, free to read here and free to download. This is Cambridge’s own paper, exactly as it was sat.
Question paper12 pages

Mark scheme15 pages
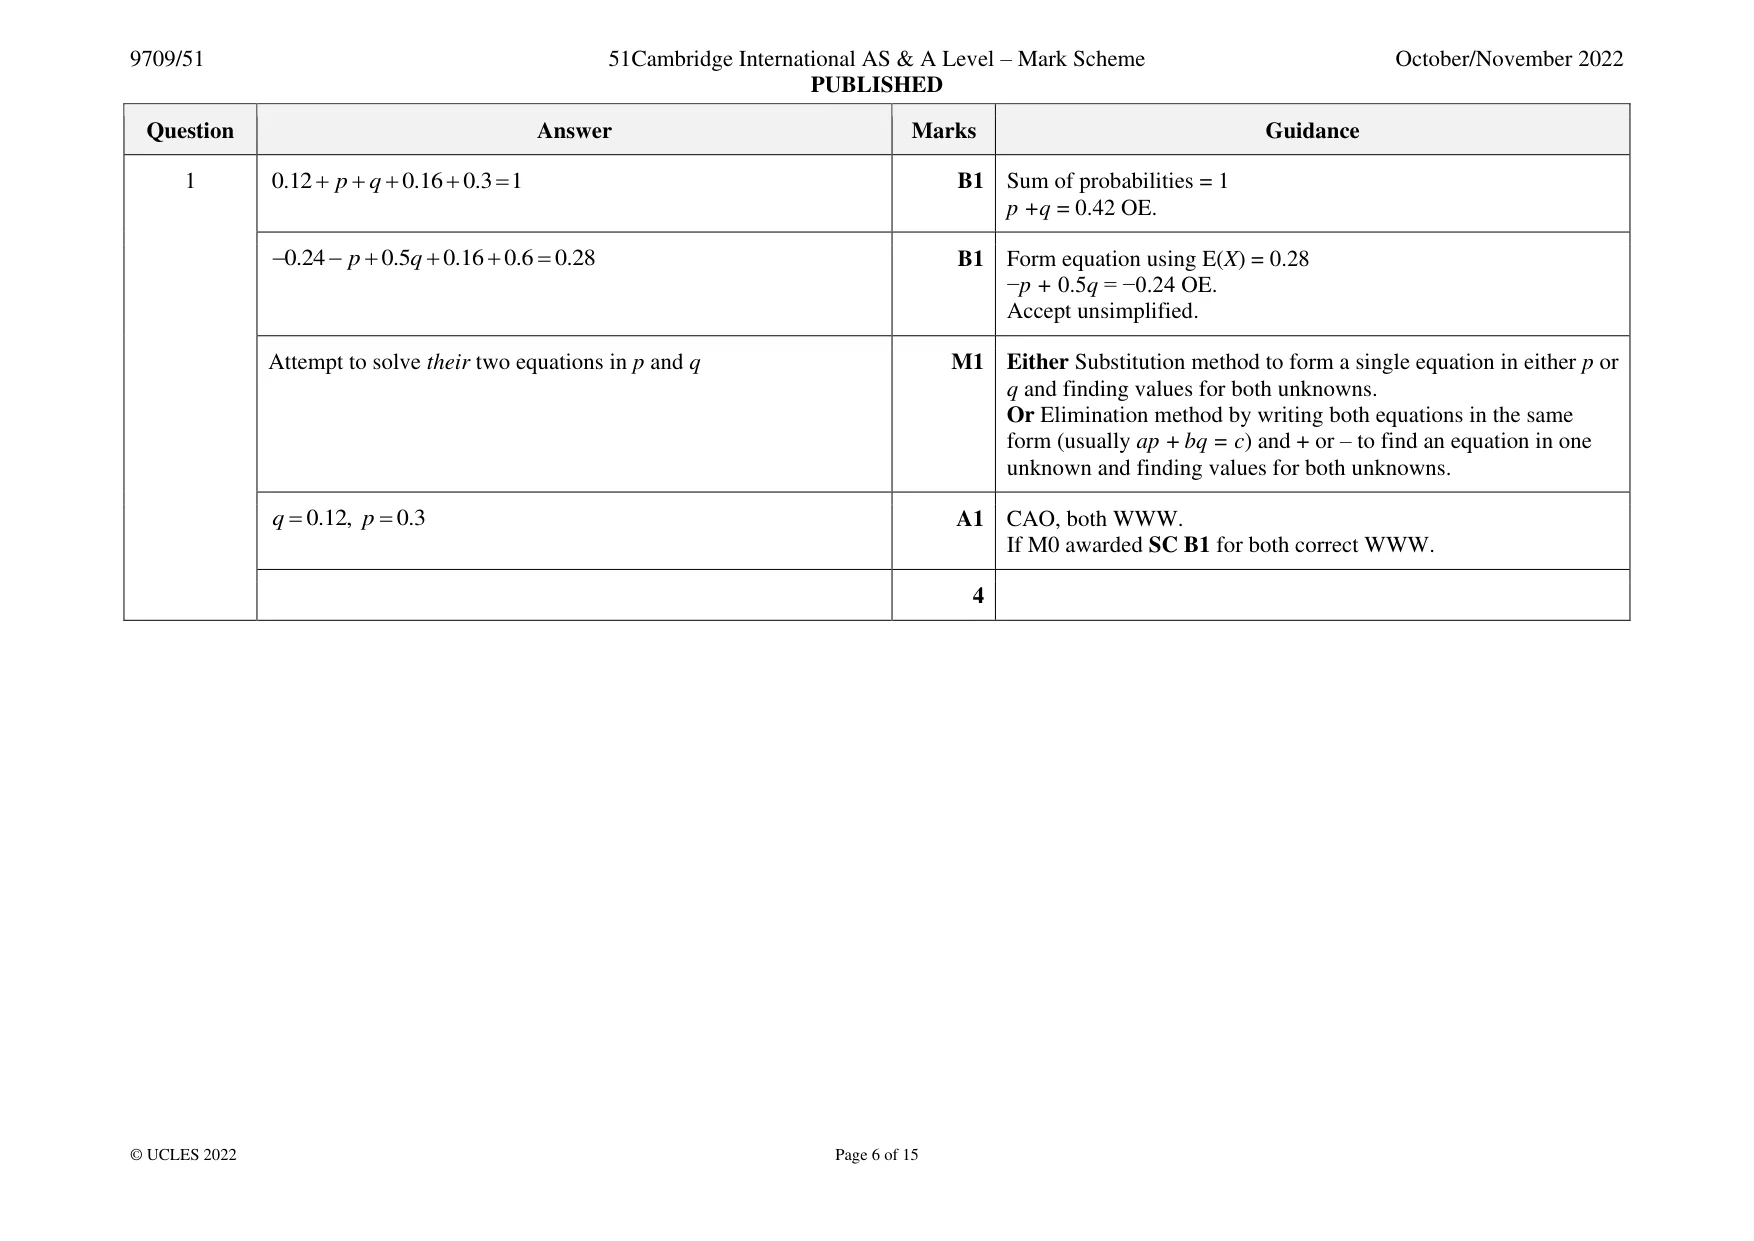
Answers below. Sit the paper first if you are practising.
Questions as text
Q2 · The residents of Persham were surveyed about the reliability of their internet service
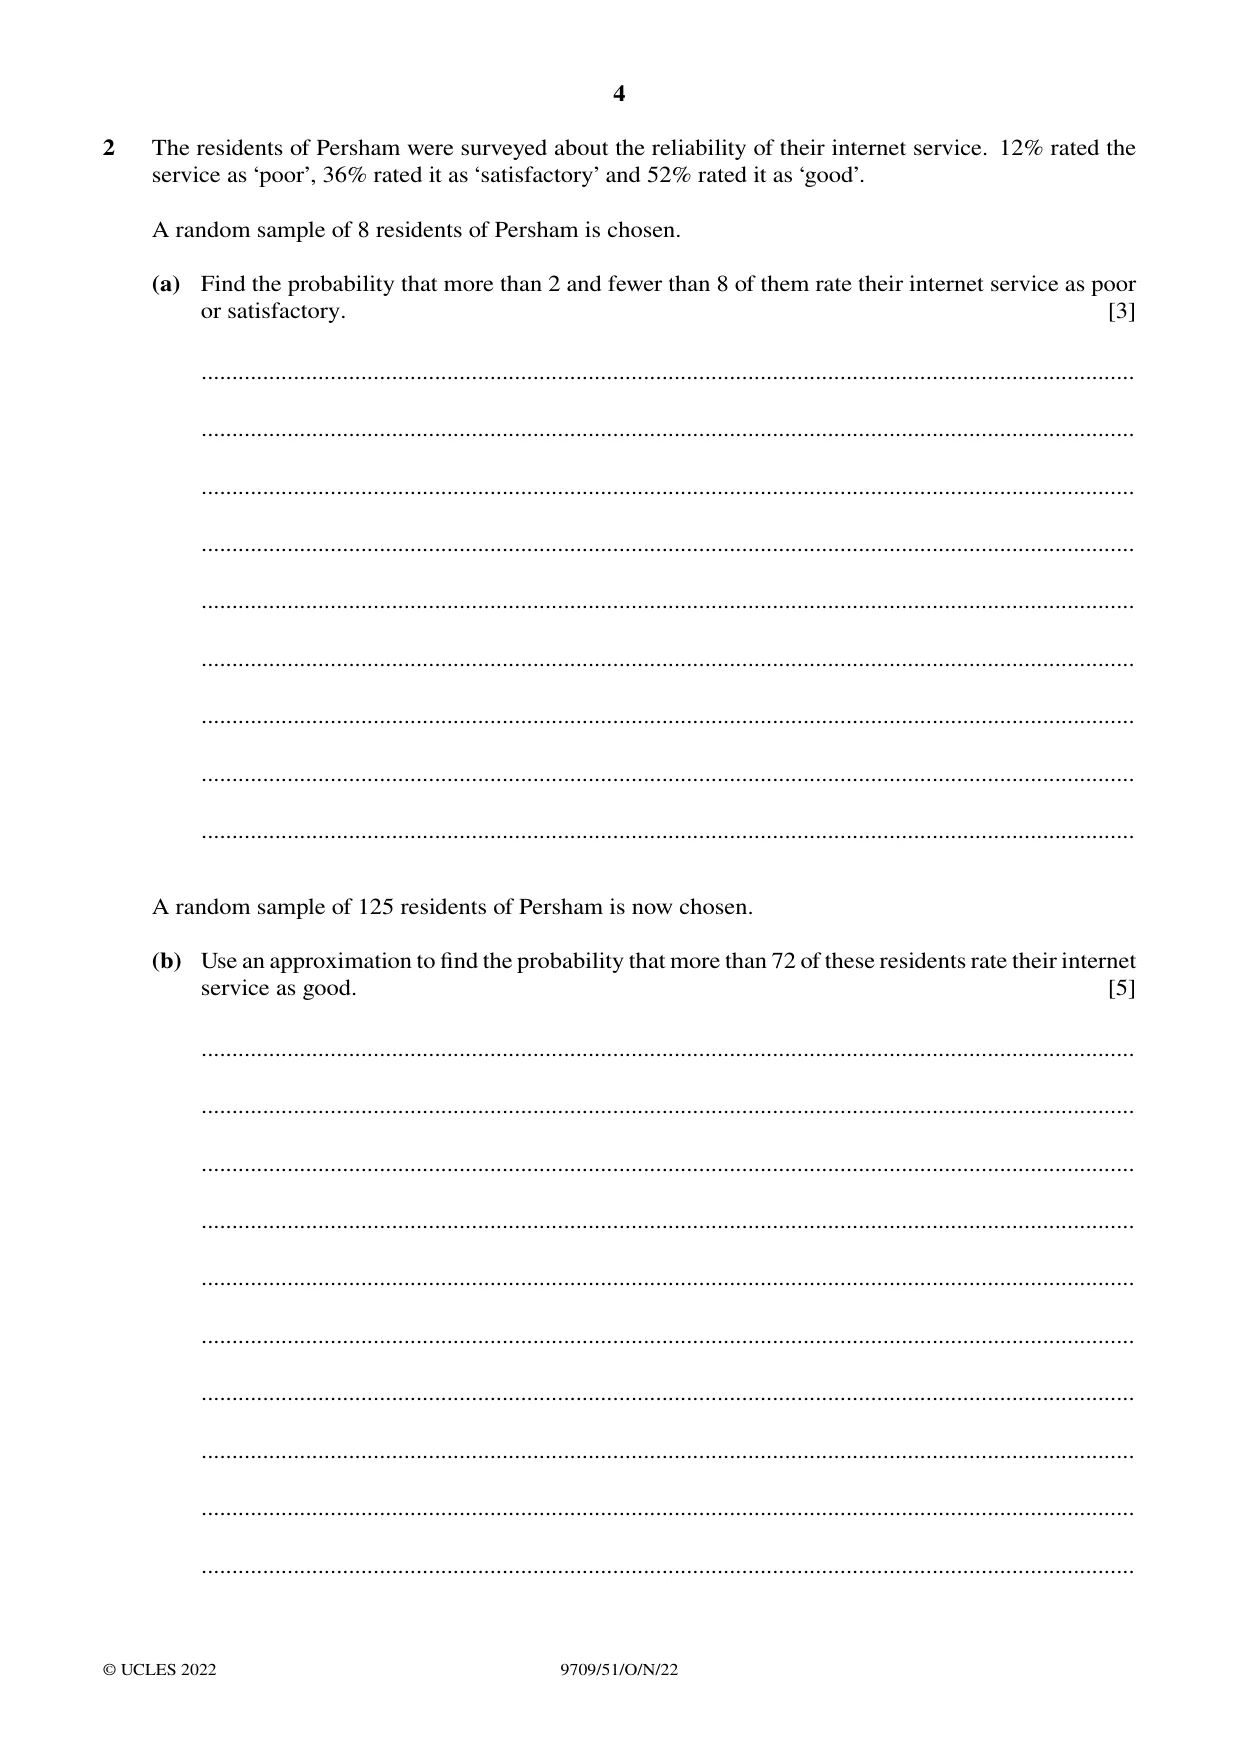
2 The residents of Persham were surveyed about the reliability of their internet service. 12% rated the service as ‘poor’, 36% rated it as ‘satisfactory’ and 52% rated it as ‘good’. A random sample of 8 residents of Persham is chosen. (a) Find the probability that more than 2 and fewer than 8 of them rate their internet service as poor or satisfactory. [3] ........................................................................................................................................................ ........................................................................................................................................................ ........................................................................................................................................................ ........................................................................................................................................................ ........................................................................................................................................................ ........................................................................................................................................................ ........................................................................................................................................................ ........................................................................................................................................................ ........................................................................................................................................................ A random sample of 125 residents of Persham is now chosen. (b) Use an approximation to find the probability that more than 72 of these residents rate their internet service as good. [5] ........................................................................................................................................................ ........................................................................................................................................................ ........................................................................................................................................................ ........................................................................................................................................................ ........................................................................................................................................................ ........................................................................................................................................................ ........................................................................................................................................................ ........................................................................................................................................................ ........................................................................................................................................................ ........................................................................................................................................................
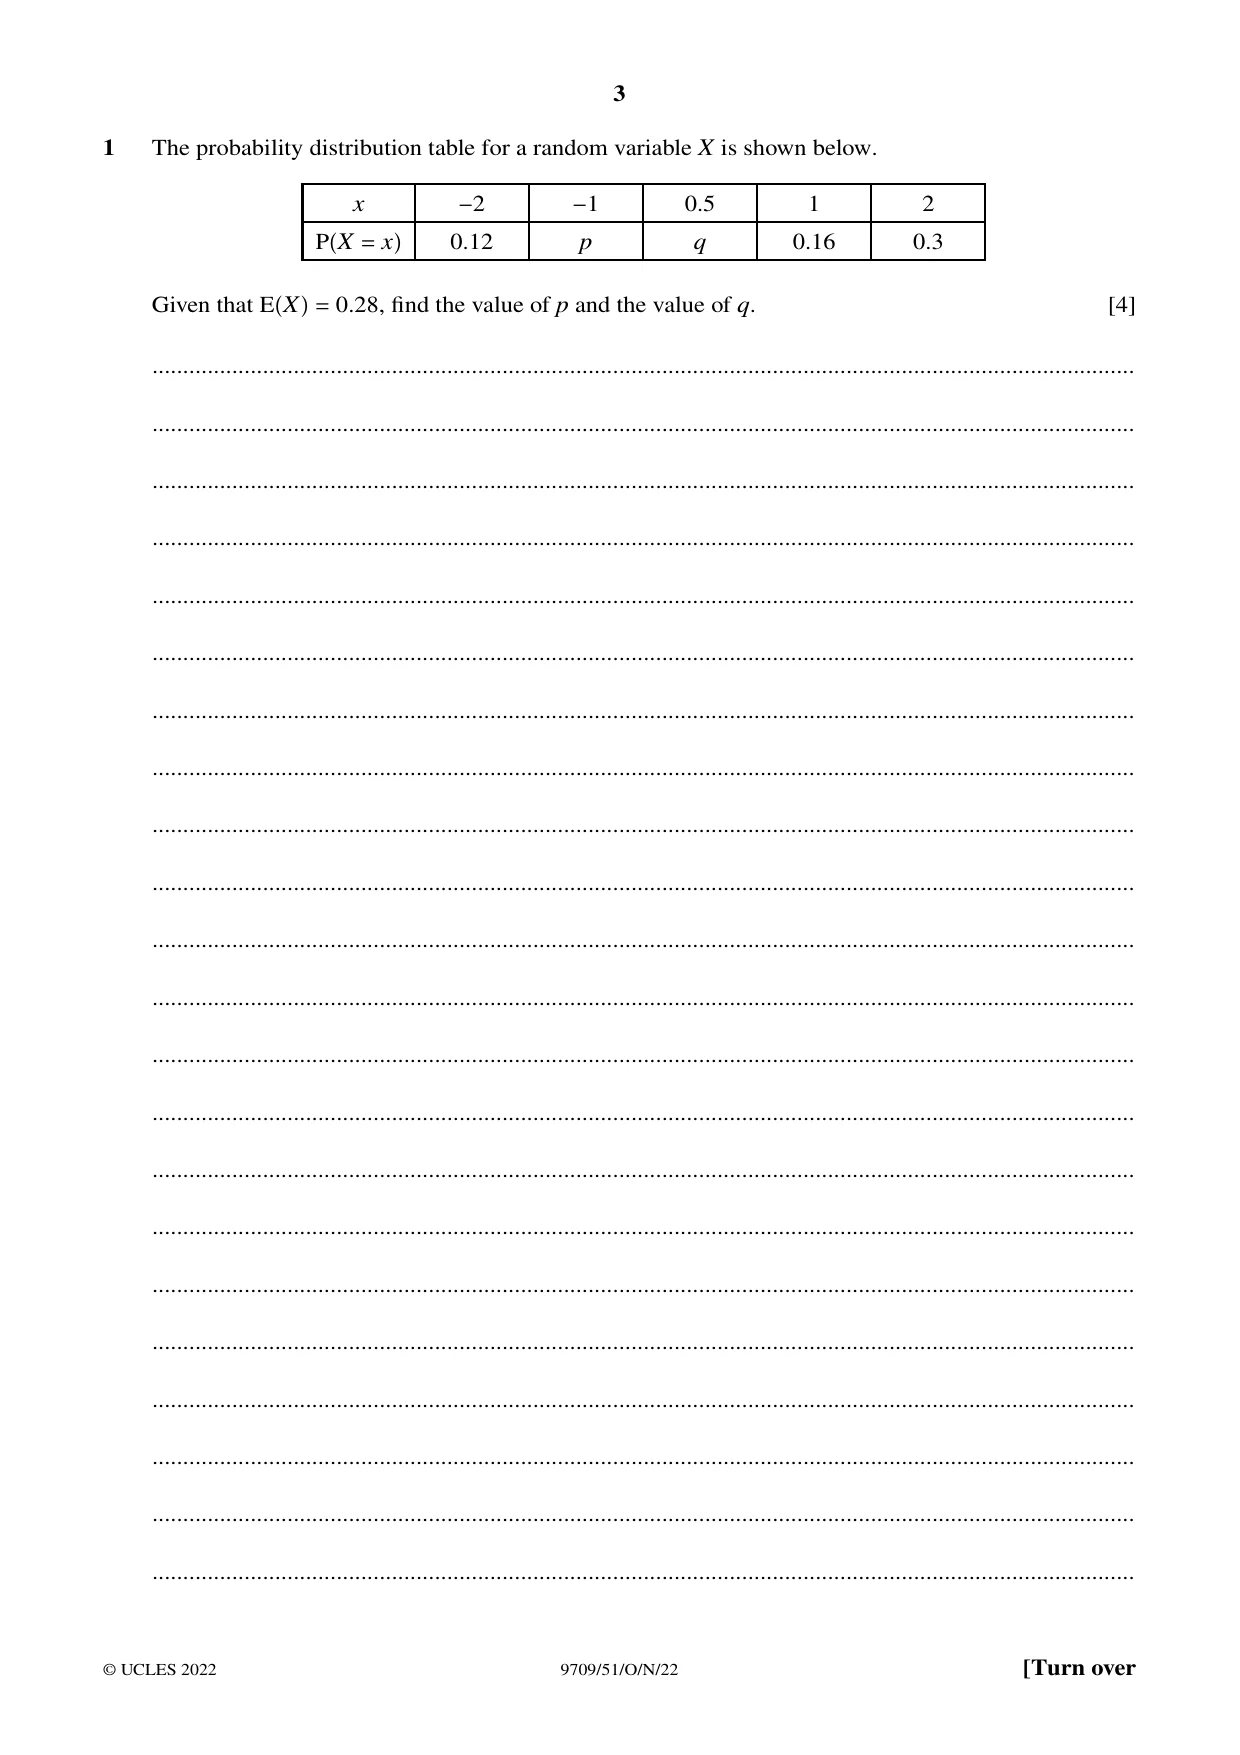
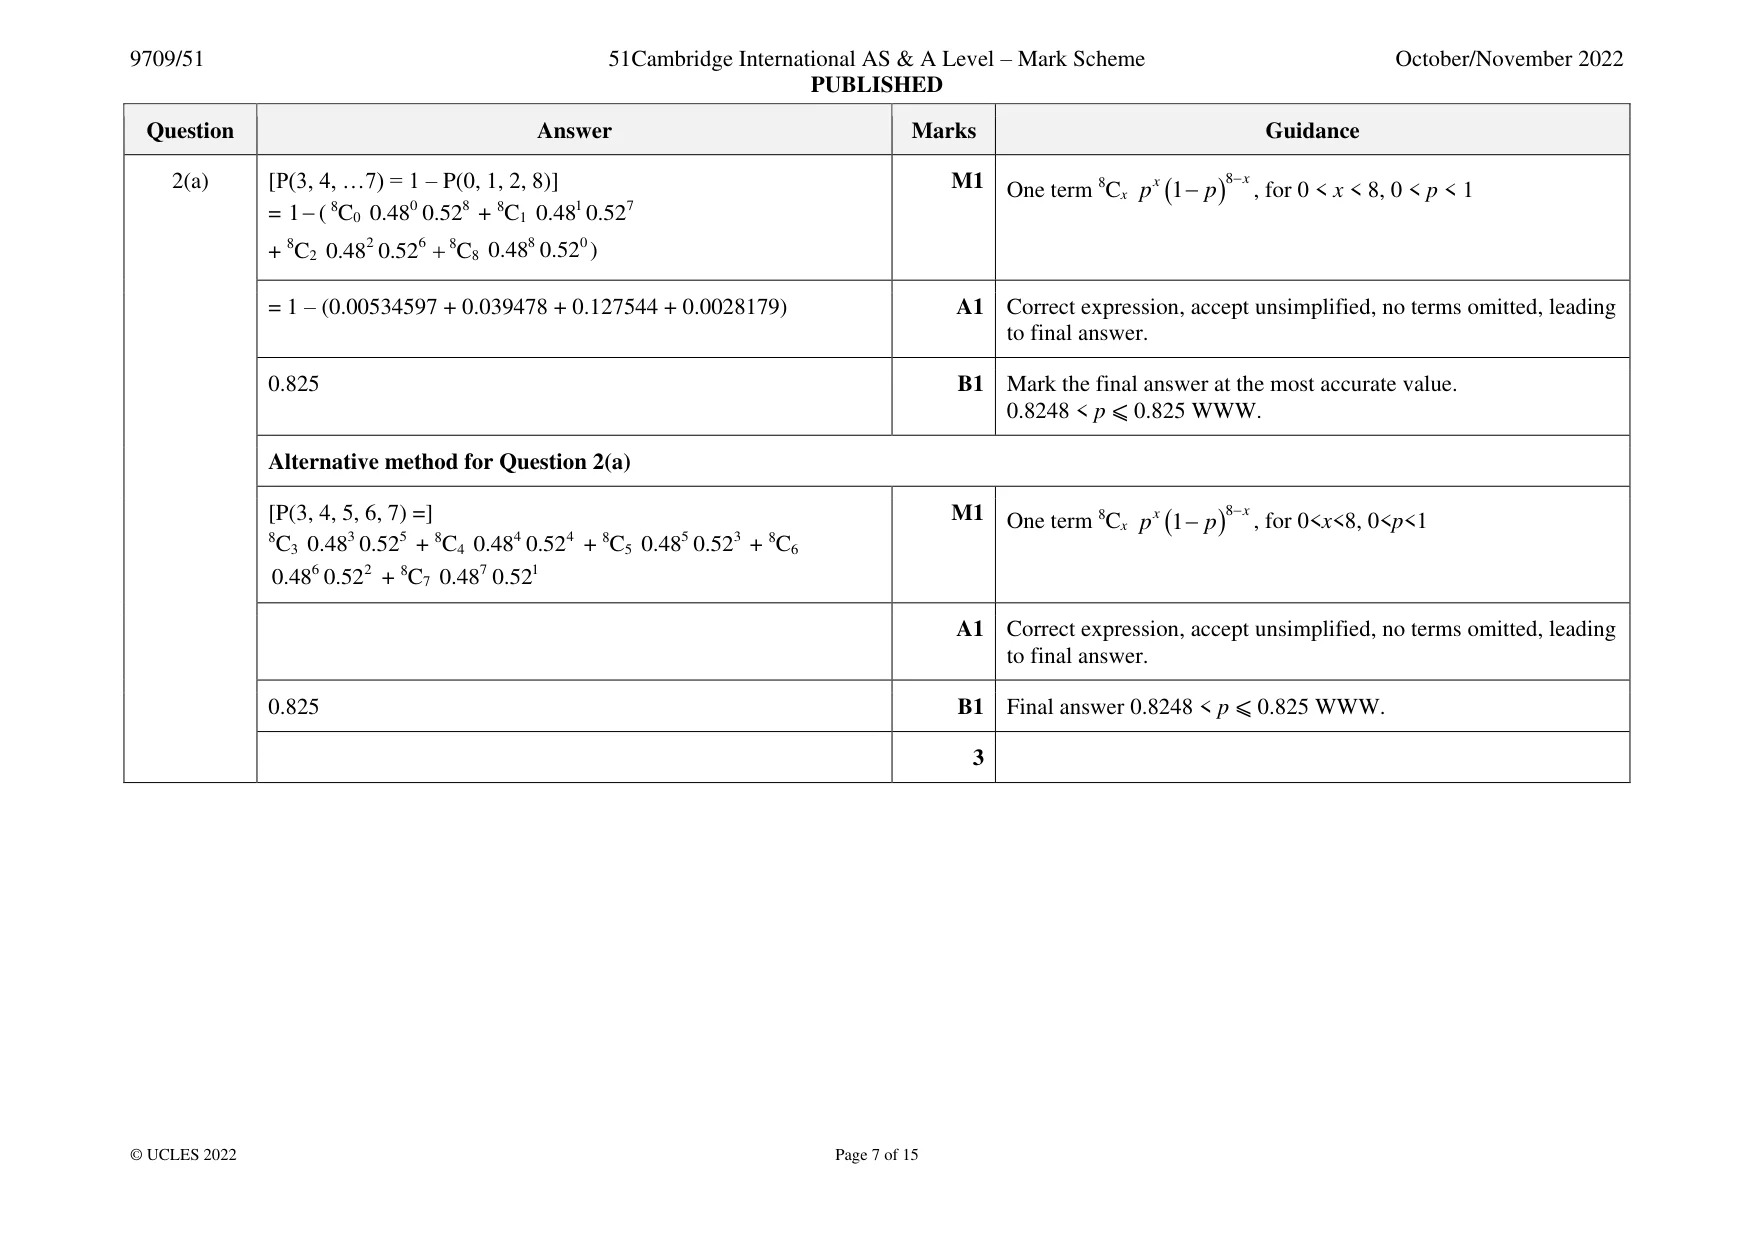
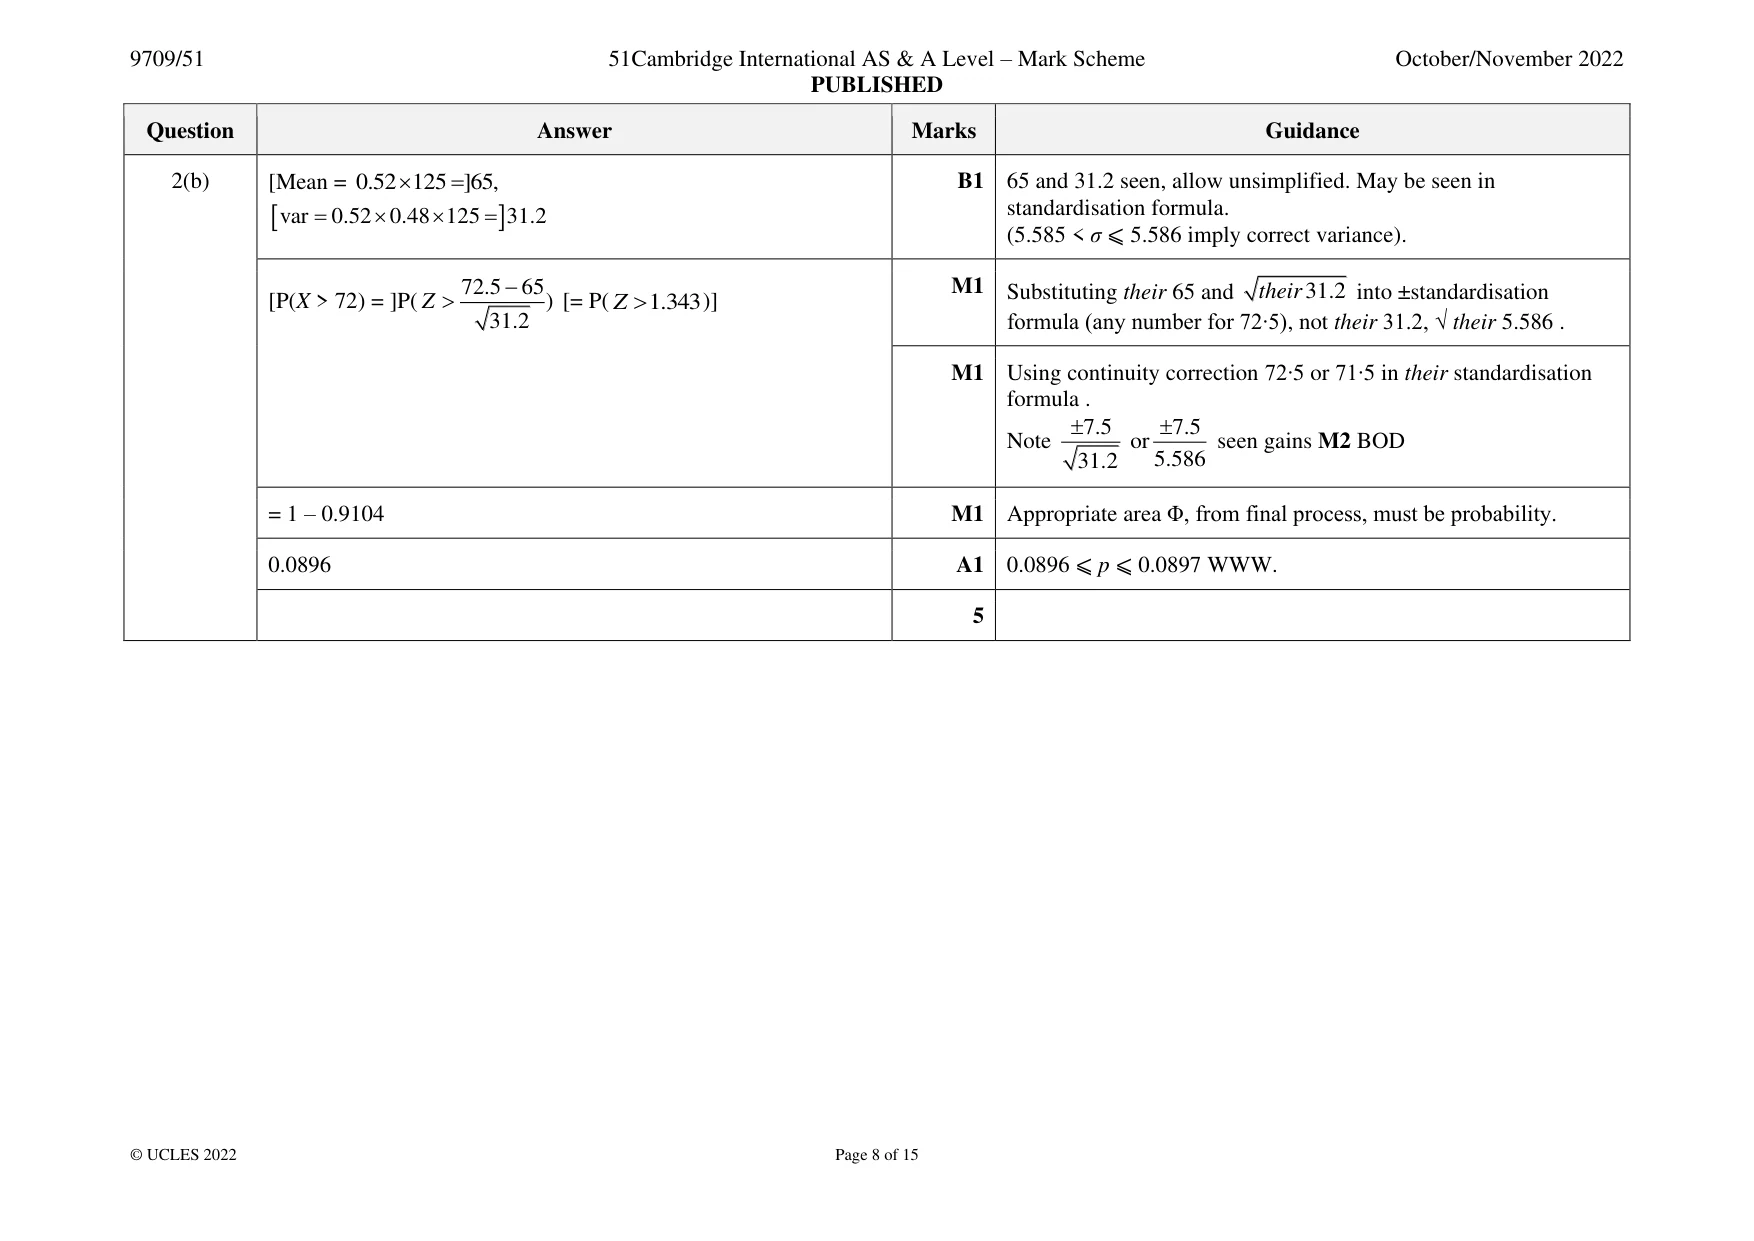
Mark scheme: 2(a) [P(3, 4, …7) = 1 – P(0, 1, 2, 8)] M1 x 8 − x One term 8Cx p (1 − p ) , for 0 < x < 8, 0 < p < 1 = 1 − ( 8C0 0.480 0.528 + 8C1 0.481 0.52 7 + 8C2 0.482 0.526 + 8C8 0.488 0.52 0 ) = 1 – (0.00534597 + 0.039478 + 0.127544 + 0.0028179) A1 Correct expression, accept unsimplified, no terms omitted, leading to final answer. 0.825 B1 Mark the final answer at the most accurate value. 0.8248 < p ⩽ 0.825 WWW. Alternative method for Question 2(a) [P(3, 4, 5, 6, 7) =] M1 x 8 − x One term 8Cx p (1 − p ) , for 0<x<8, 0<p<1 8C3 0.483 0.525 + 8C4 0.484 0.52 4 + 8C5 0.485 0.523 + 8C6 0.486 0.52 2 + 8C7 0.487 0.521 A1 Correct expression, accept unsimplified, no terms omitted, leading to final answer. 0.825 B1 Final answer 0.8248 < p ⩽ 0.825 WWW. 3 2(b) [Mean = 0.52 125 =]65, B1 65 and 31.2 seen, allow unsimplified. May be seen in var = 0.52 0.48 125 = 31.2 standardisation formula. (5.585 < σ ⩽ 5.586 imply correct variance). 72.5 − M1 Substituting their 65 and their 31.2 into ±standardisation [P(X > 72) = ]P( Z 65) [= P( Z 1.343 )] 31.2 formula (any number for 72∙5), not their 31.2, √ their 5.586 . M1 Using continuity correction 72∙5 or 71∙5 in their standardisation formula . 7.5 7.5 Note or seen gains M2 BOD 31.2 5.586 = 1 – 0.9104 M1 Appropriate area Φ, from final process, must be probability. 0.0896 A1 0.0896 ⩽ p ⩽ 0.0897 WWW. 5
Q3 · The Lions and the Tigers are two basketball clubs
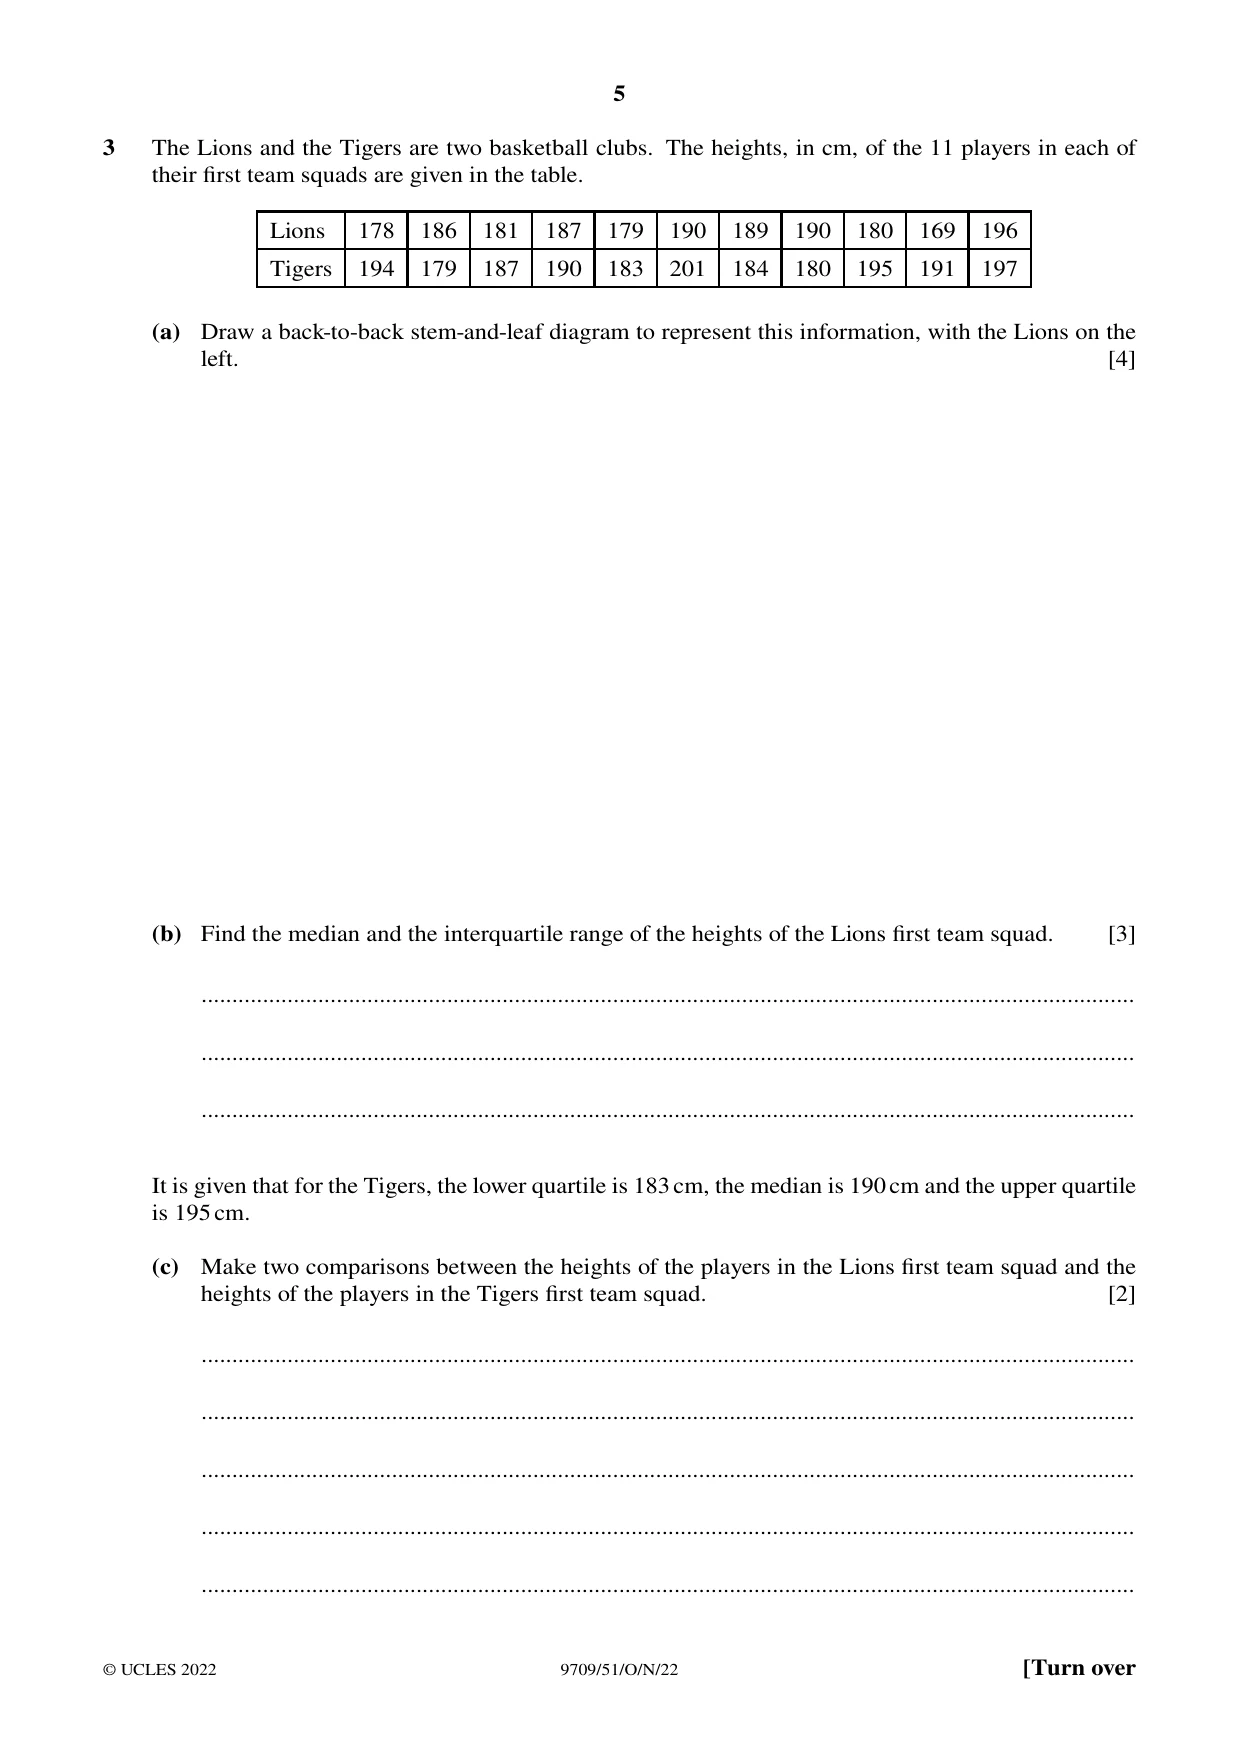
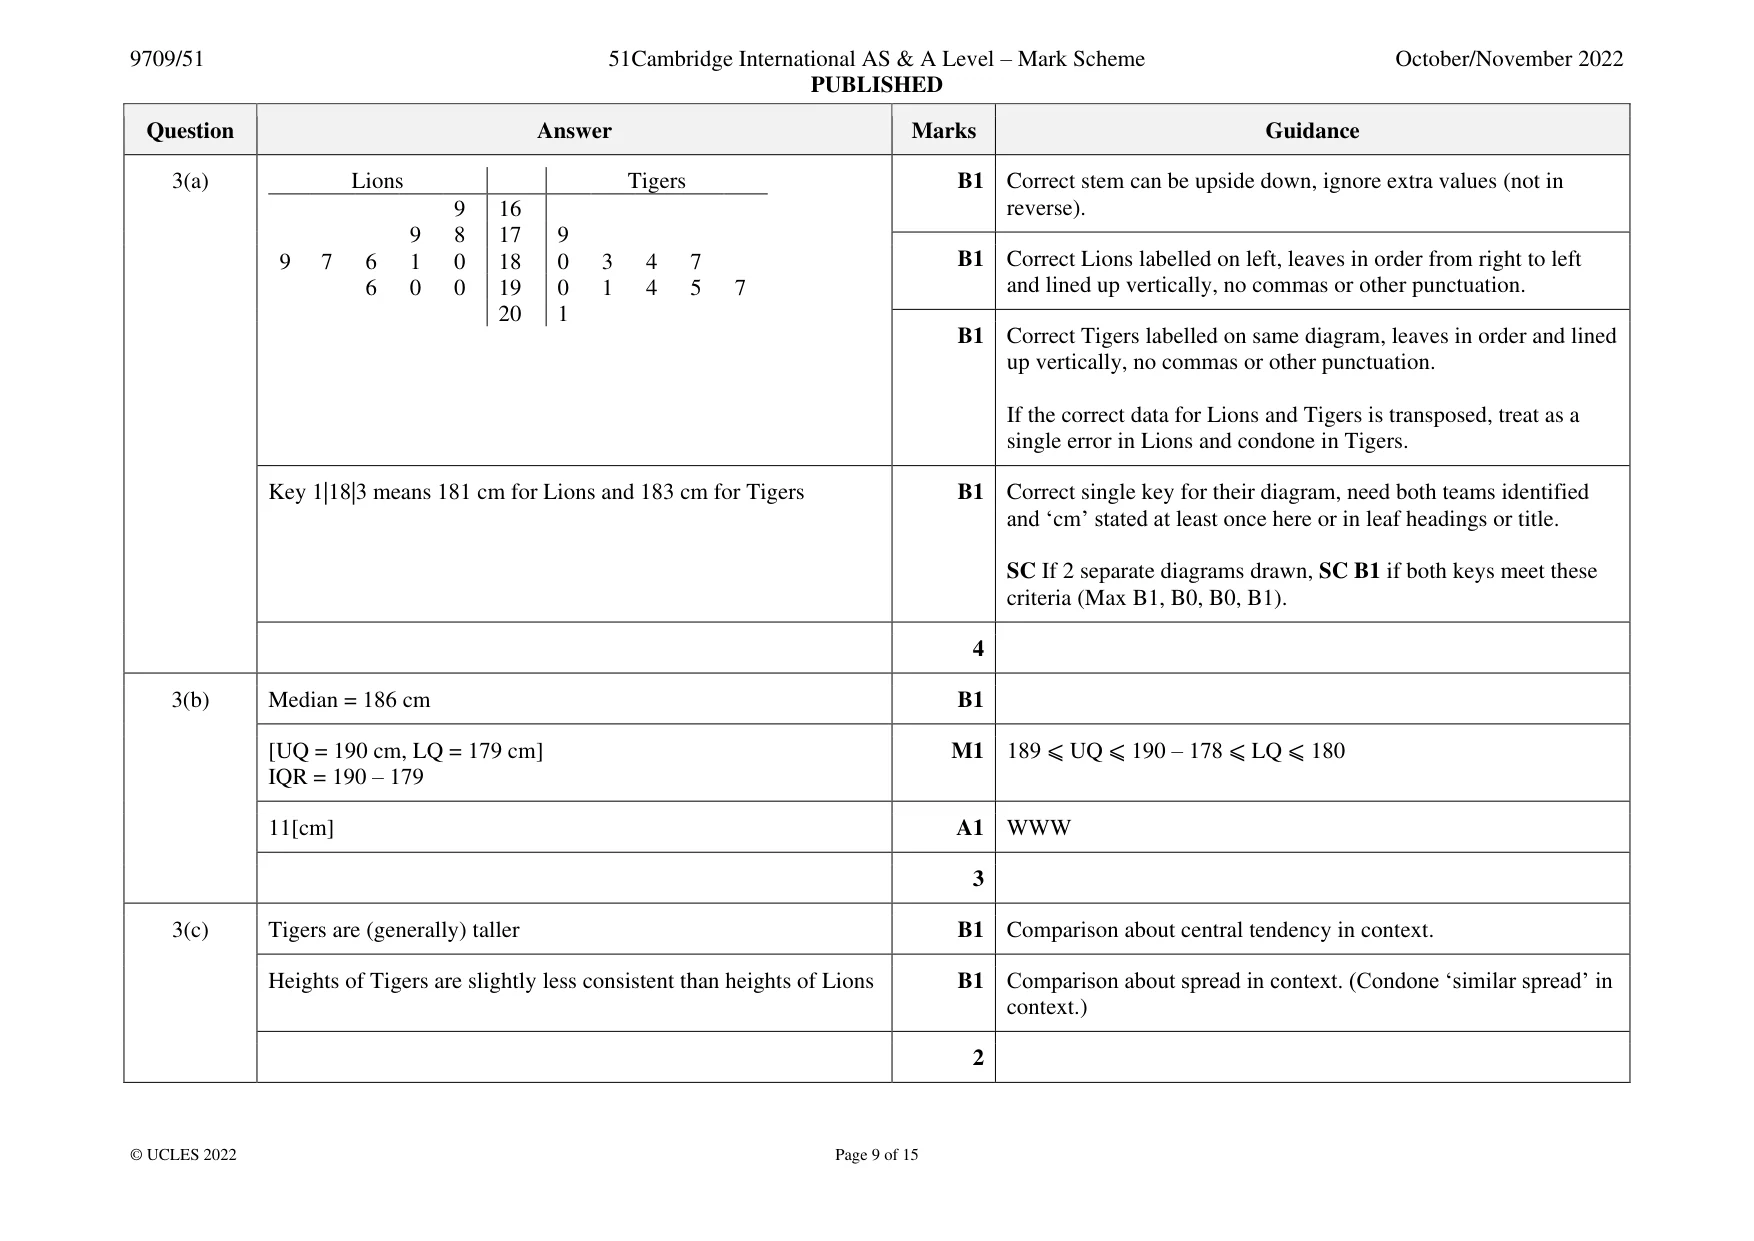
3 The Lions and the Tigers are two basketball clubs. The heights, in cm, of the 11 players in each of their first team squads are given in the table. Lions 178 186 181 187 179 190 189 190 180 169 196 Tigers 194 179 187 190 183 201 184 180 195 191 197 (a) Draw a back-to-back stem-and-leaf diagram to represent this information, with the Lions on the left. [4] (b) Find the median and the interquartile range of the heights of the Lions first team squad. [3] ........................................................................................................................................................ ........................................................................................................................................................ ........................................................................................................................................................ It is given that for the Tigers, the lower quartile is 183cm, the median is 190cm and the upper quartile is 195cm. (c) Make two comparisons between the heights of the players in the Lions first team squad and the heights of the players in the Tigers first team squad. [2] ........................................................................................................................................................ ........................................................................................................................................................ ........................................................................................................................................................ ........................................................................................................................................................ ........................................................................................................................................................
Mark scheme: 3(a) Lions Tigers B1 Correct stem can be upside down, ignore extra values (not in 9 16 reverse). 9 8 17 9 9 7 6 1 0 18 0 3 4 7 B1 Correct Lions labelled on left, leaves in order from right to left 6 0 0 19 0 1 4 5 7 and lined up vertically, no commas or other punctuation. 20 1 B1 Correct Tigers labelled on same diagram, leaves in order and lined up vertically, no commas or other punctuation. If the correct data for Lions and Tigers is transposed, treat as a single error in Lions and condone in Tigers. Key 1|18|3 means 181 cm for Lions and 183 cm for Tigers B1 Correct single key for their diagram, need both teams identified and ‘cm’ stated at least once here or in leaf headings or title. SC If 2 separate diagrams drawn, SC B1 if both keys meet these criteria (Max B1, B0, B0, B1). 4 3(b) Median = 186 cm B1 [UQ = 190 cm, LQ = 179 cm] M1 189 ⩽ UQ ⩽ 190 – 178 ⩽ LQ ⩽ 180 IQR = 190 – 179 11[cm] A1 WWW 3 3(c) Tigers are (generally) taller B1 Comparison about central tendency in context. Heights of Tigers are slightly less consistent than heights of Lions B1 Comparison about spread in context. (Condone ‘similar spread’ in context.) 2
Q4 · In a large population, the systolic blood pressure (SBP) of adults is normally…
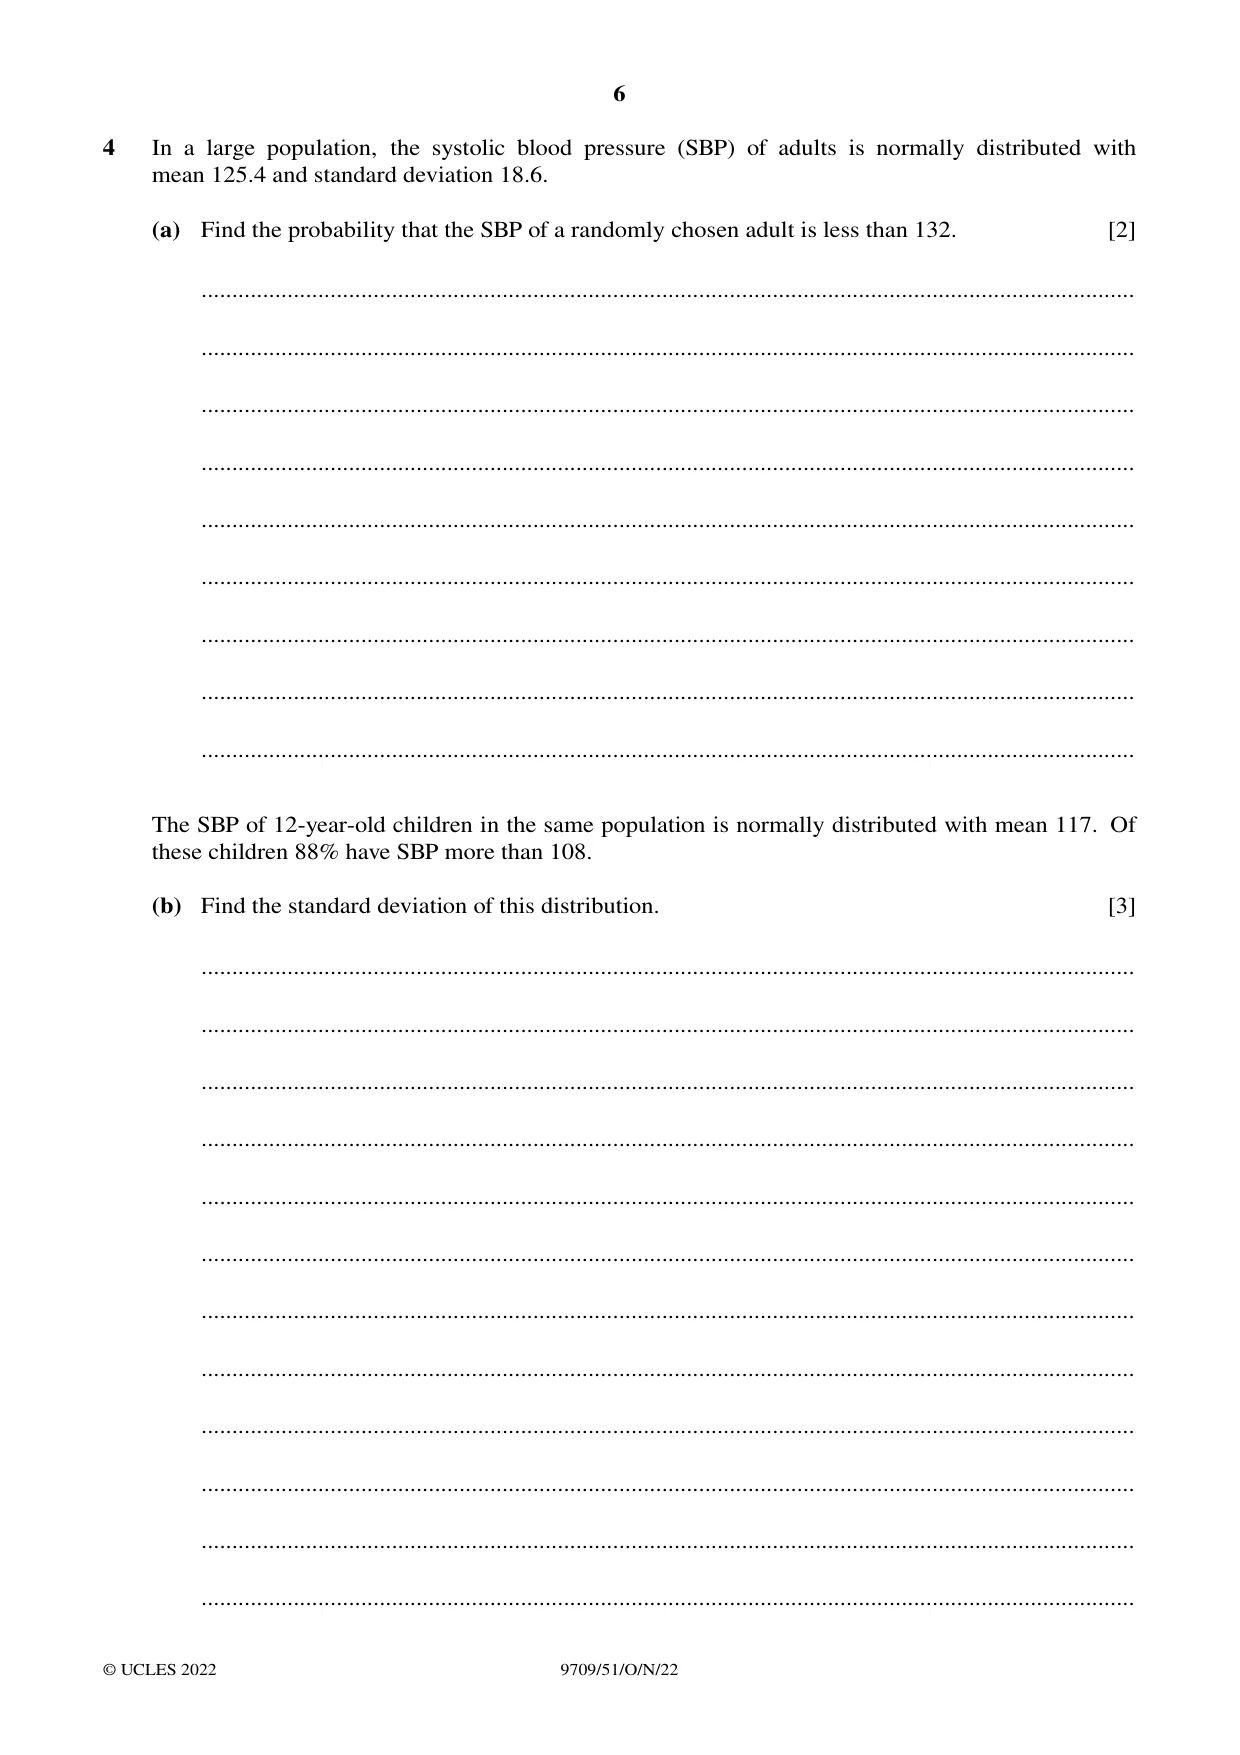
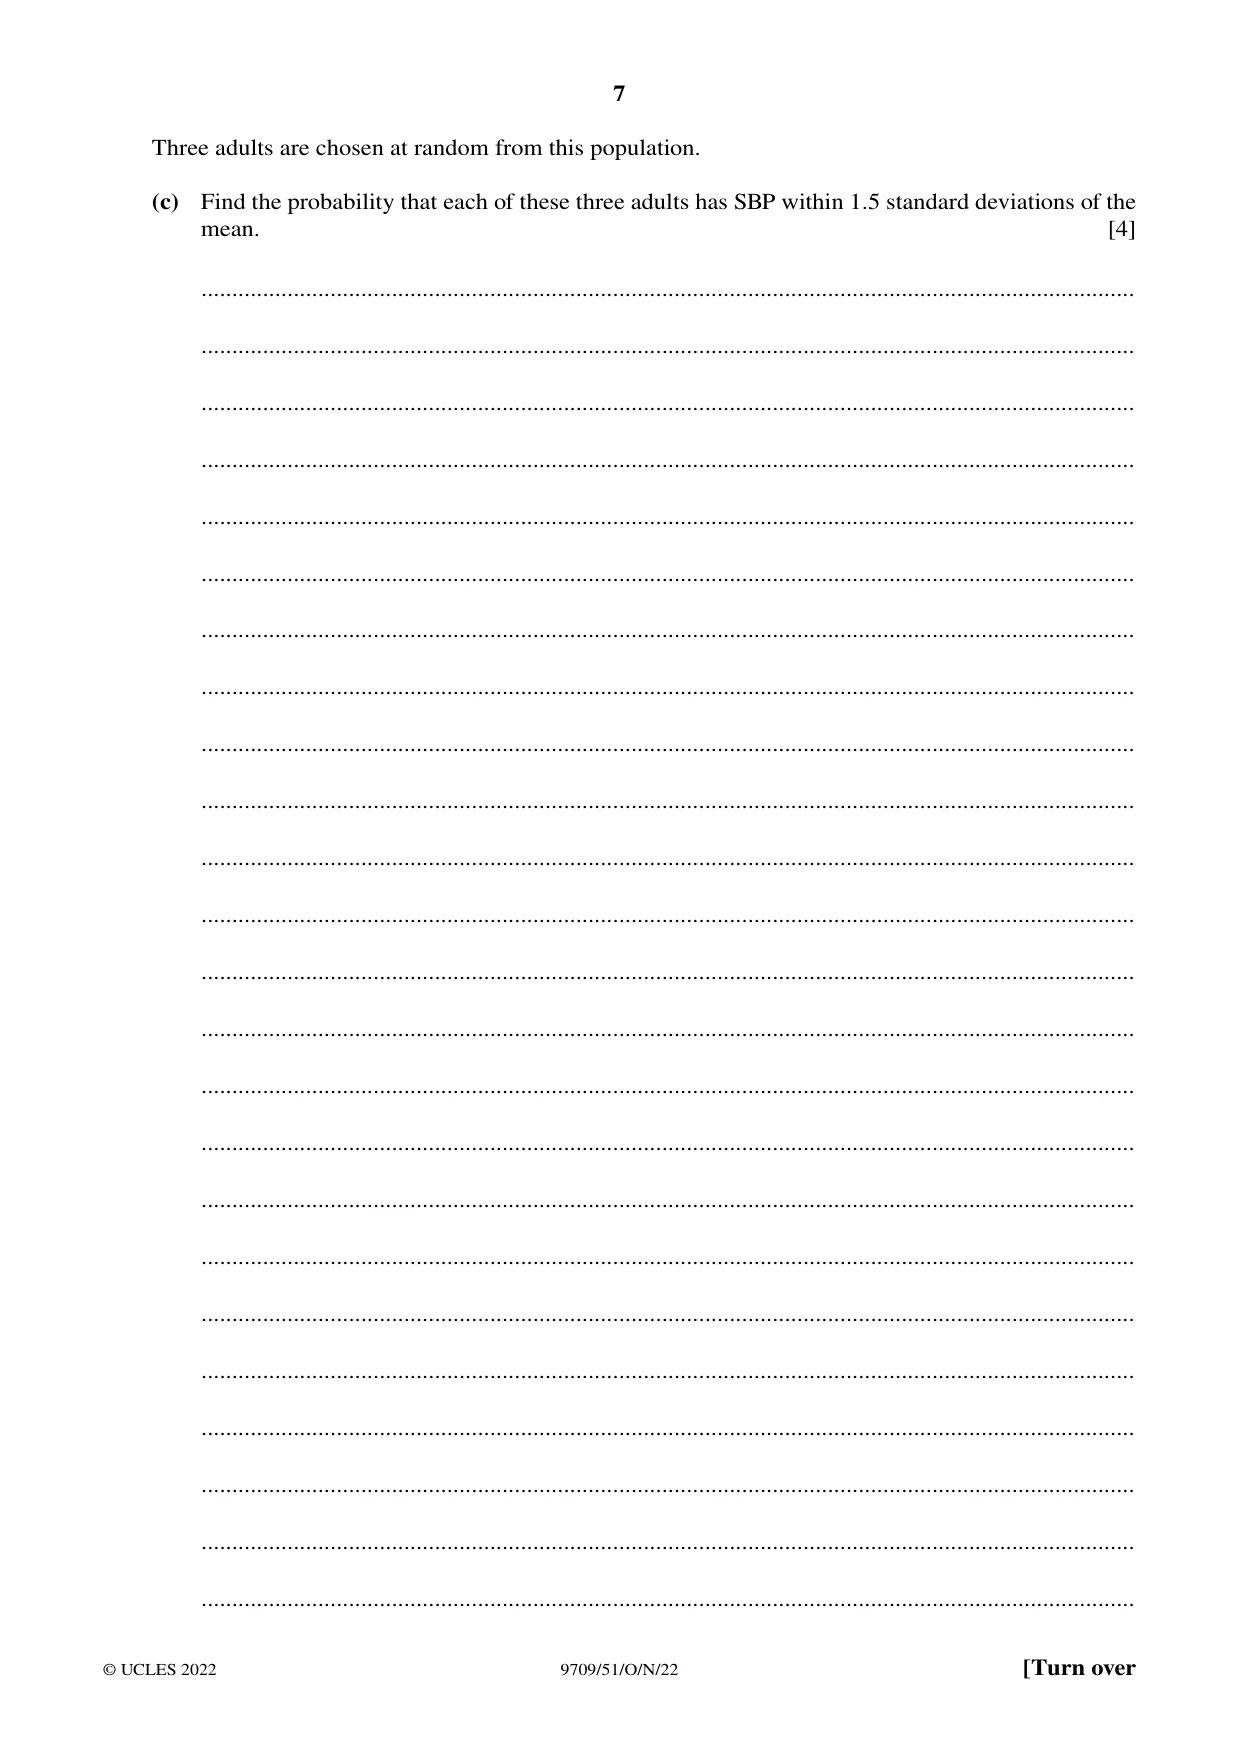
4 In a large population, the systolic blood pressure (SBP) of adults is normally distributed with mean 125.4 and standard deviation 18.6. (a) Find the probability that the SBP of a randomly chosen adult is less than 132. [2] ........................................................................................................................................................ ........................................................................................................................................................ ........................................................................................................................................................ ........................................................................................................................................................ ........................................................................................................................................................ ........................................................................................................................................................ ........................................................................................................................................................ ........................................................................................................................................................ ........................................................................................................................................................ The SBP of 12-year-old children in the same population is normally distributed with mean 117. Of these children 88% have SBP more than 108. (b) Find the standard deviation of this distribution. [3] ........................................................................................................................................................ ........................................................................................................................................................ ........................................................................................................................................................ ........................................................................................................................................................ ........................................................................................................................................................ ........................................................................................................................................................ ........................................................................................................................................................ ........................................................................................................................................................ ........................................................................................................................................................ ........................................................................................................................................................ ........................................................................................................................................................ ........................................................................................................................................................ Three adults are chosen at random from this population. (c) Find the probability that each of these three adults has SBP within 1.5 standard deviations of the mean. [4] ........................................................................................................................................................ ........................................................................................................................................................ ........................................................................................................................................................ ........................................................................................................................................................ ........................................................................................................................................................ ........................................................................................................................................................ ........................................................................................................................................................ ........................................................................................................................................................ ........................................................................................................................................................ ........................................................................................................................................................ ........................................................................................................................................................ ........................................................................................................................................................ ........................................................................................................................................................ ........................................................................................................................................................ ........................................................................................................................................................ ........................................................................................................................................................ ........................................................................................................................................................ ........................................................................................................................................................ ........................................................................................................................................................ ........................................................................................................................................................ ........................................................................................................................................................ ........................................................................................................................................................ ........................................................................................................................................................ ........................................................................................................................................................
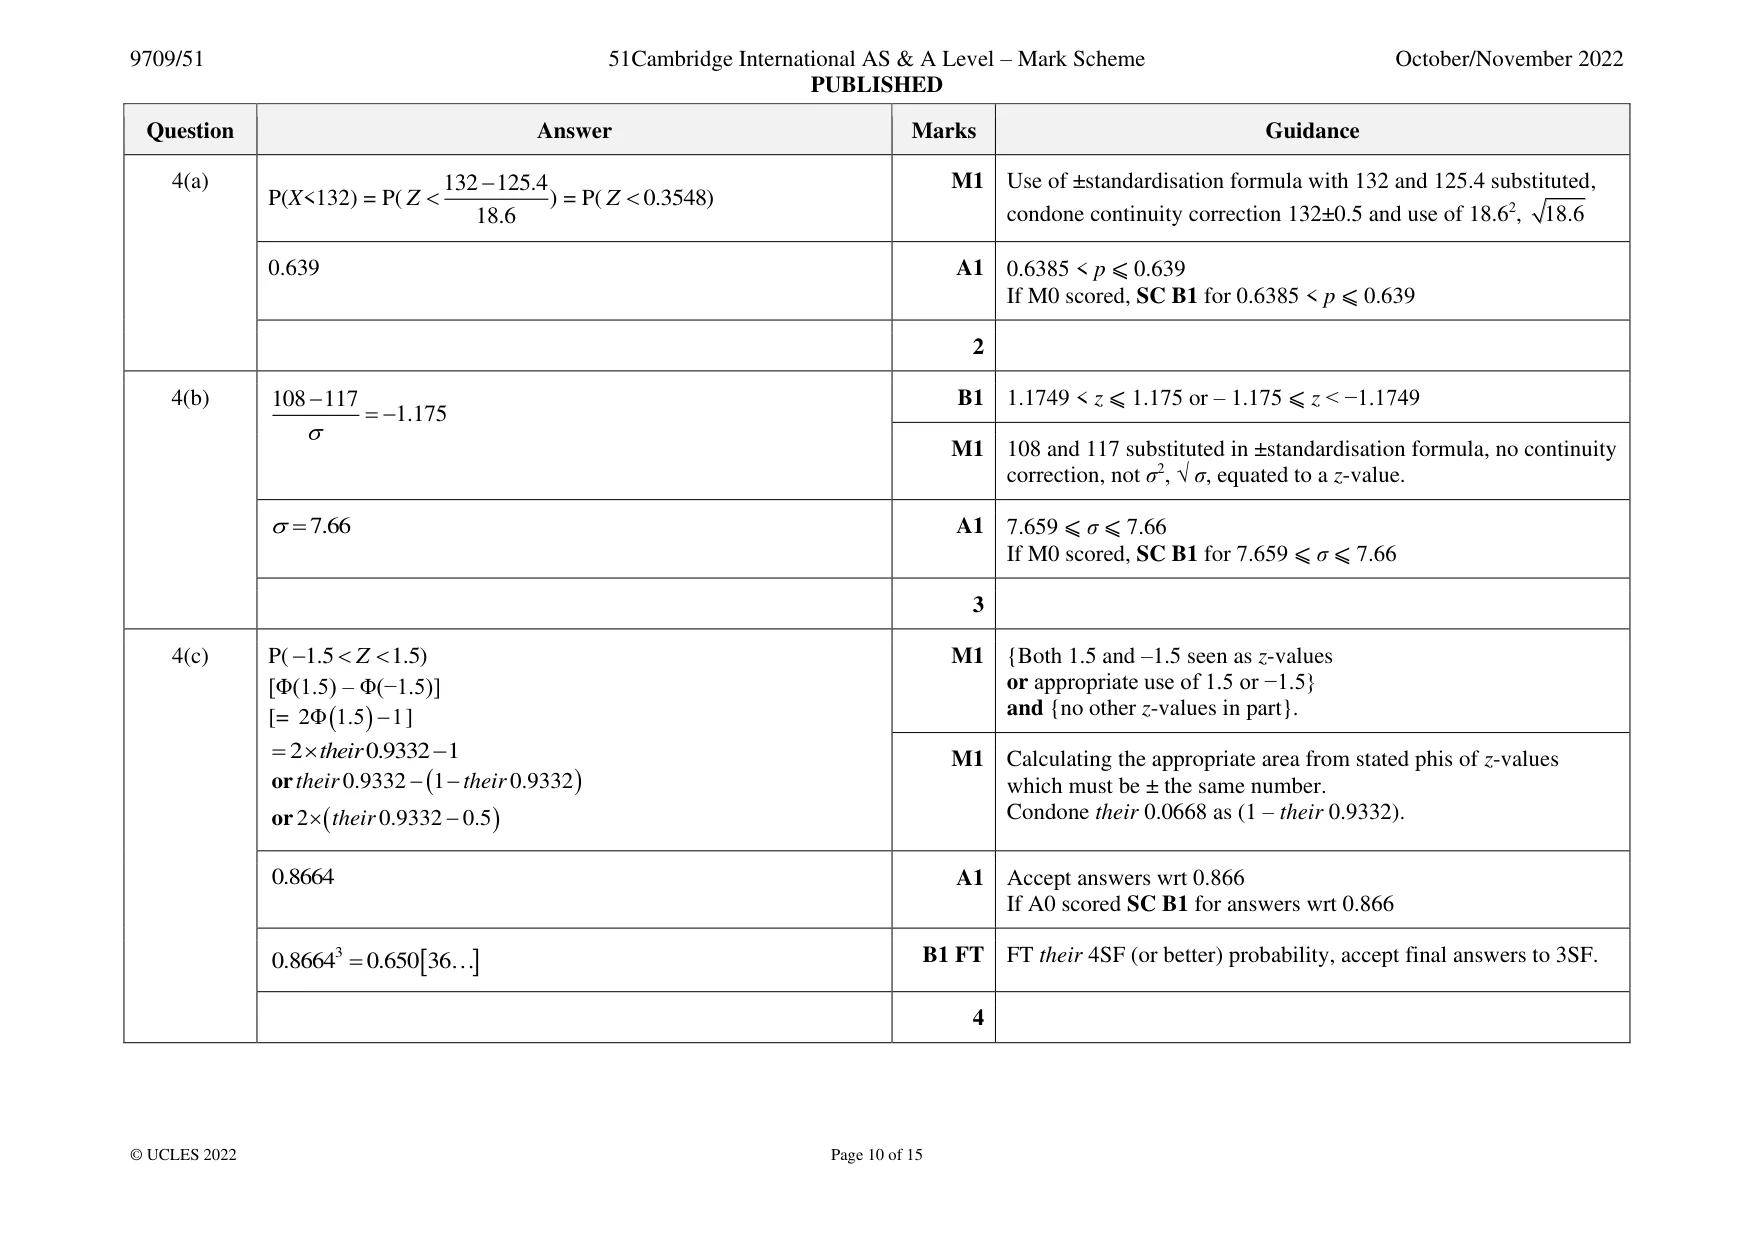
Mark scheme: 4(a) 132 − M1 Use of ±standardisation formula with 132 and 125.4 substituted, P(X<132) = P( Z 125.4) = P( Z 0.3548) 18.6 condone continuity correction 132±0.5 and use of 18.62, 18.6 0.639 A1 0.6385 < p ⩽ 0.639 If M0 scored, SC B1 for 0.6385 < p ⩽ 0.639 2 4(b) 108 − 117 B1 1.1749 < z ⩽ 1.175 or – 1.175 ⩽ z < −1.1749 = −1.175 M1 108 and 117 substituted in ±standardisation formula, no continuity correction, not σ2, √ σ, equated to a z-value. = 7.66 A1 7.659 ⩽ σ ⩽ 7.66 If M0 scored, SC B1 for 7.659 ⩽ σ ⩽ 7.66 3 4(c) P( −1.5 Z 1.5) M1 {Both 1.5 and –1.5 seen as z-values [Φ(1.5) – Φ(−1.5)] or appropriate use of 1.5 or −1.5} and {no other z-values in part}. [= 2Φ (1.5 ) −]1 = 2 their 0.9332 − 1 M1 Calculating the appropriate area from stated phis of z-values or their 0.9332 − (1 − their 0.9332 ) which must be ± the same number. Condone their 0.0668 as (1 – their 0.9332). or 2 ( their 0.9332 − 0.5 ) 0.8664 A1 Accept answers wrt 0.866 If A0 scored SC B1 for answers wrt 0.866 0.86643 = 0.650 36 B1 FT FT their 4SF (or better) probability, accept final answers to 3SF. 4
Q6 · A Social Club has 15 members, of whom 8 are men and 7 are women
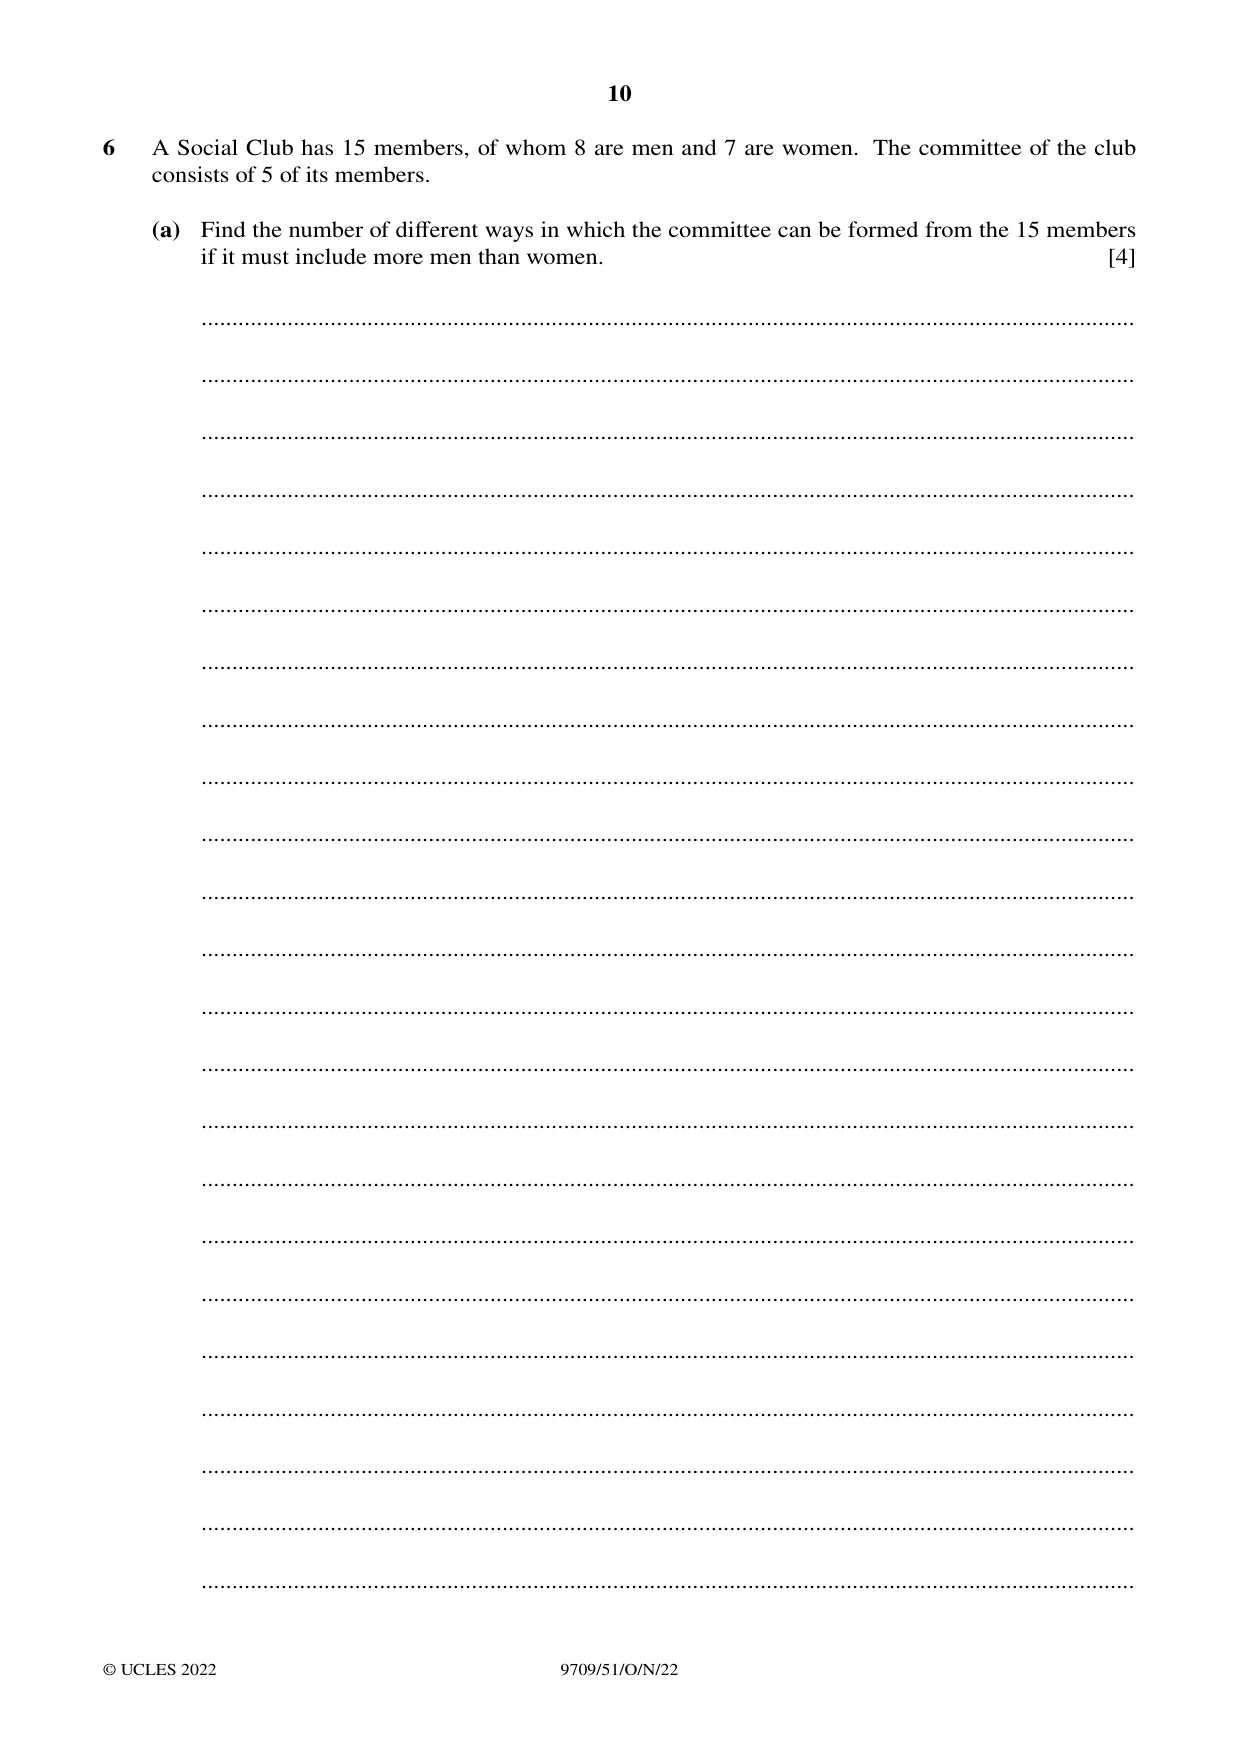
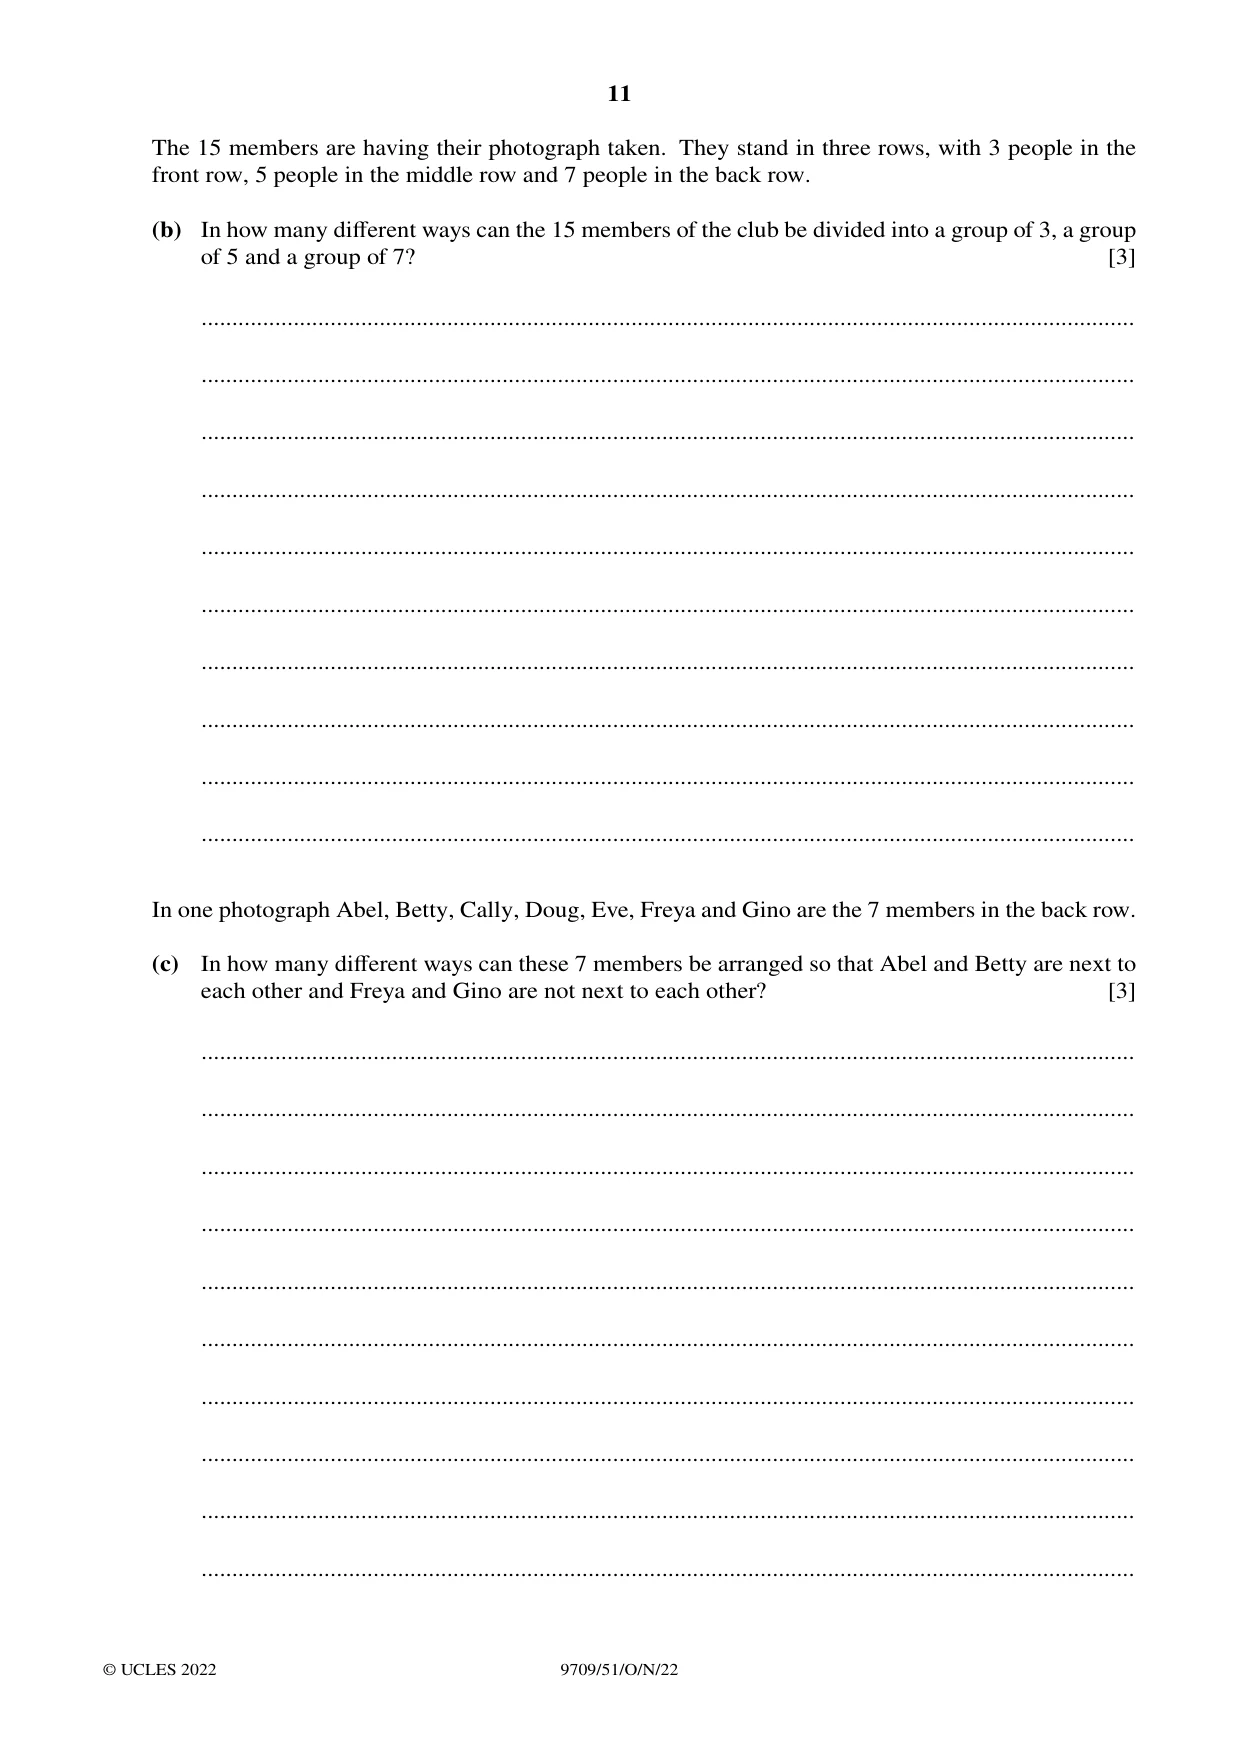
6 A Social Club has 15 members, of whom 8 are men and 7 are women. The committee of the club consists of 5 of its members. (a) Find the number of different ways in which the committee can be formed from the 15 members if it must include more men than women. [4] ........................................................................................................................................................ ........................................................................................................................................................ ........................................................................................................................................................ ........................................................................................................................................................ ........................................................................................................................................................ ........................................................................................................................................................ ........................................................................................................................................................ ........................................................................................................................................................ ........................................................................................................................................................ ........................................................................................................................................................ ........................................................................................................................................................ ........................................................................................................................................................ ........................................................................................................................................................ ........................................................................................................................................................ ........................................................................................................................................................ ........................................................................................................................................................ ........................................................................................................................................................ ........................................................................................................................................................ ........................................................................................................................................................ ........................................................................................................................................................ ........................................................................................................................................................ ........................................................................................................................................................ ........................................................................................................................................................ The 15 members are having their photograph taken. They stand in three rows, with 3 people in the front row, 5 people in the middle row and 7 people in the back row. (b) In how many different ways can the 15 members of the club be divided into a group of 3, a group of 5 and a group of 7? [3] ........................................................................................................................................................ ........................................................................................................................................................ ........................................................................................................................................................ ........................................................................................................................................................ ........................................................................................................................................................ ........................................................................................................................................................ ........................................................................................................................................................ ........................................................................................................................................................ ........................................................................................................................................................ ........................................................................................................................................................ In one photograph Abel, Betty, Cally, Doug, Eve, Freya and Gino are the 7 members in the back row. (c) In how many different ways can these 7 members be arranged so that Abel and Betty are next to each other and Freya and Gino are not next to each other? [3] ........................................................................................................................................................ ........................................................................................................................................................ ........................................................................................................................................................ ........................................................................................................................................................ ........................................................................................................................................................ ........................................................................................................................................................ ........................................................................................................................................................ ........................................................................................................................................................ ........................................................................................................................................................ ........................................................................................................................................................
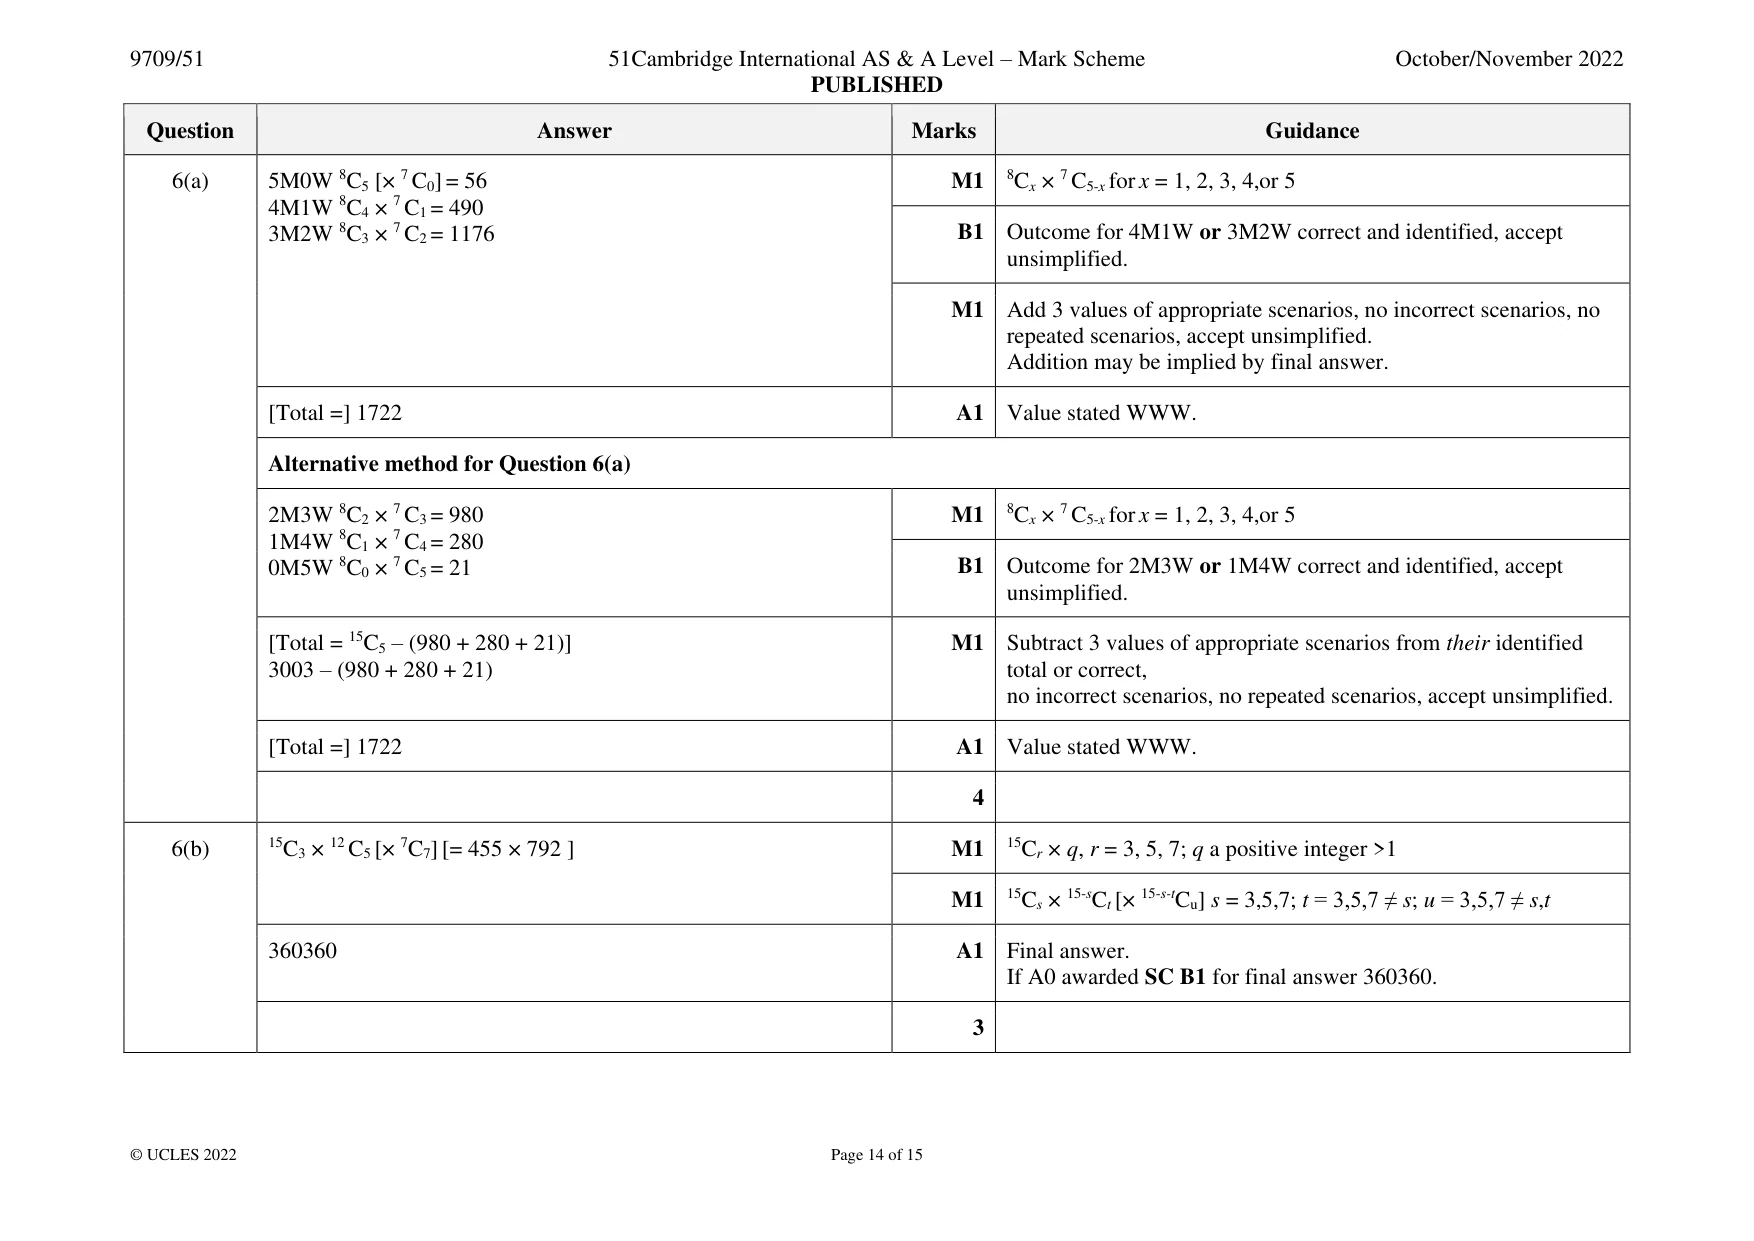
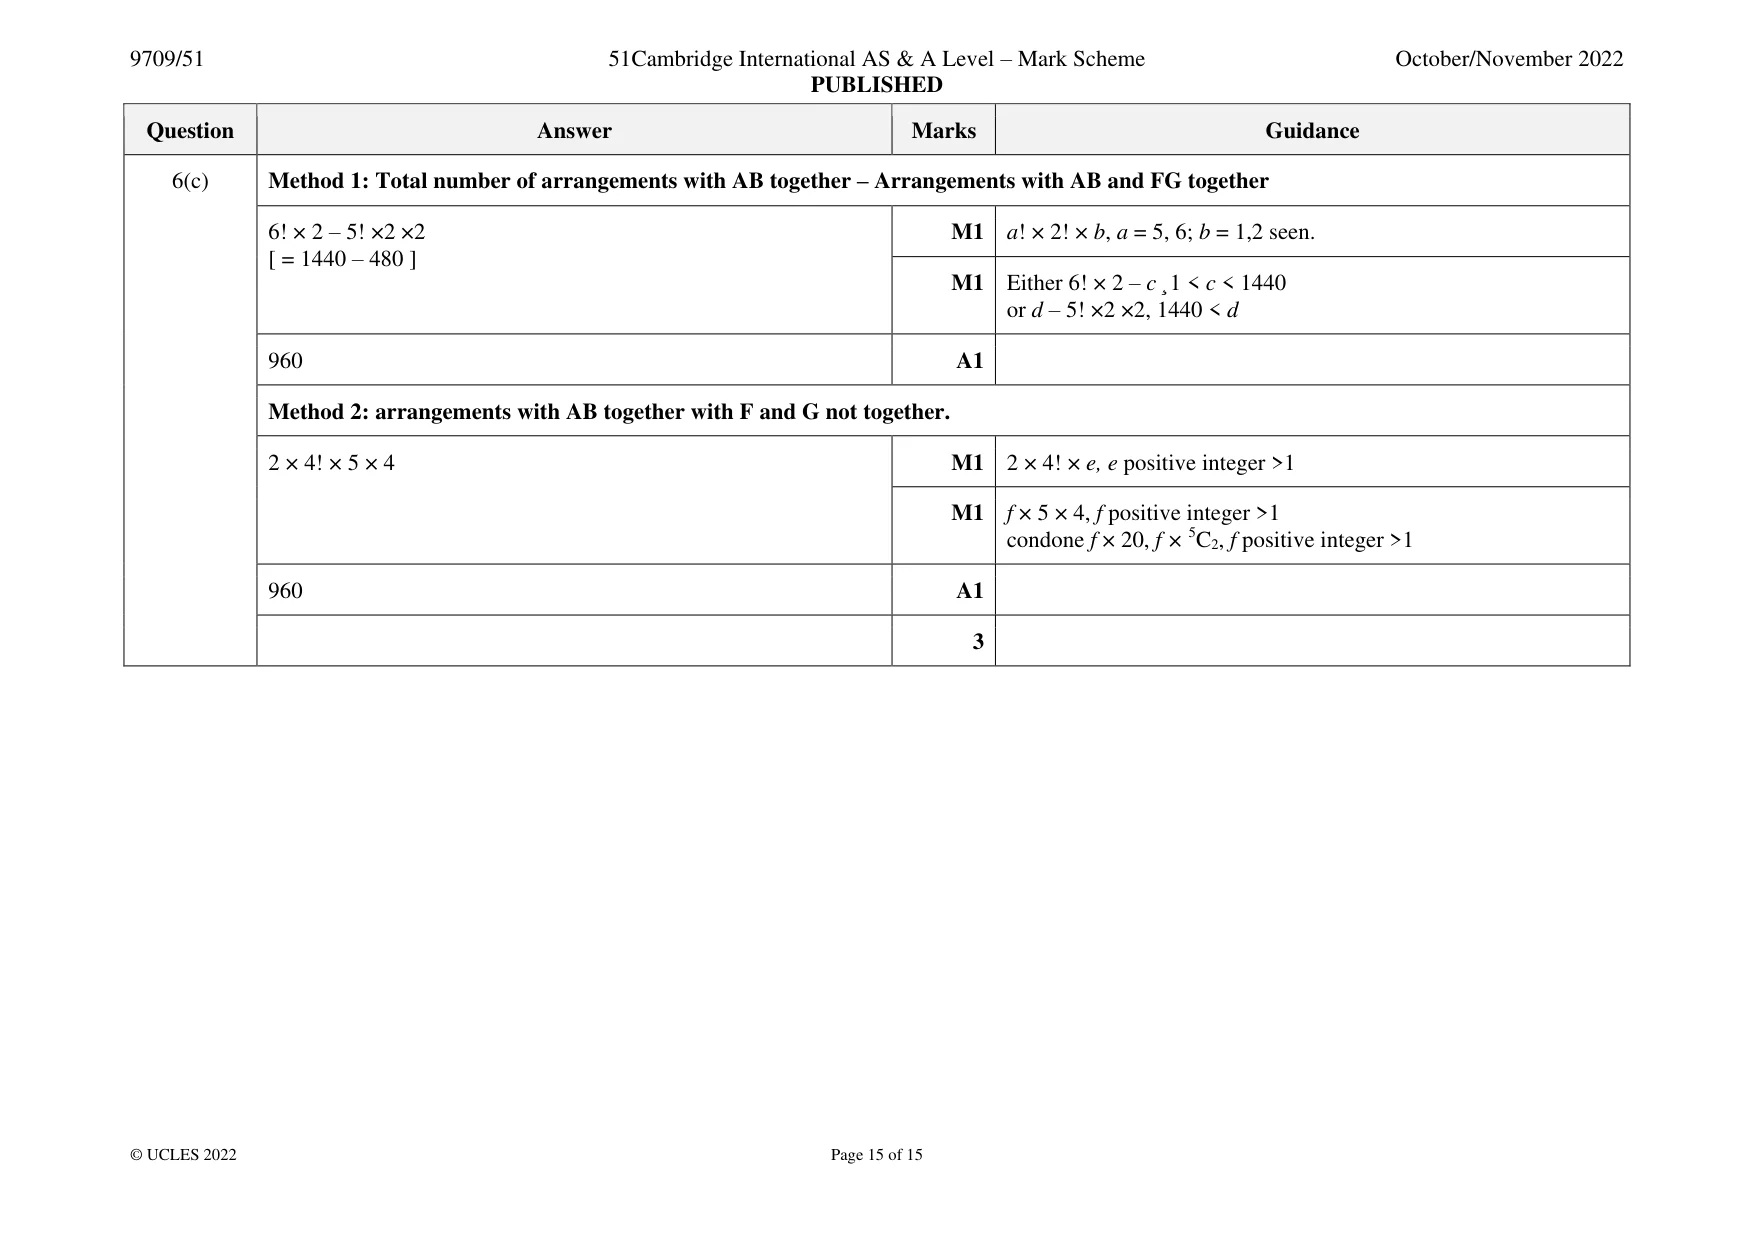
Mark scheme: 6(a) 5M0W 8C5 [× 7 C0] = 56 M1 8Cx × 7 C5-x for x = 1, 2, 3, 4,or 5 4M1W 8C4 × 7 C1 = 490 3M2W 8C3 × 7 C2 = 1176 B1 Outcome for 4M1W or 3M2W correct and identified, accept unsimplified. M1 Add 3 values of appropriate scenarios, no incorrect scenarios, no repeated scenarios, accept unsimplified. Addition may be implied by final answer. [Total =] 1722 A1 Value stated WWW. Alternative method for Question 6(a) 2M3W 8C2 × 7 C3 = 980 M1 8Cx × 7 C5-x for x = 1, 2, 3, 4,or 5 1M4W 8C1 × 7 C4 = 280 0M5W 8C0 × 7 C5 = 21 B1 Outcome for 2M3W or 1M4W correct and identified, accept unsimplified. [Total = 15C5 – (980 + 280 + 21)] M1 Subtract 3 values of appropriate scenarios from their identified 3003 – (980 + 280 + 21) total or correct, no incorrect scenarios, no repeated scenarios, accept unsimplified. [Total =] 1722 A1 Value stated WWW. 4 6(b) 15C3 × 12 C5 [× 7C7] [= 455 × 792 ] M1 15Cr × q, r = 3, 5, 7; q a positive integer >1 M1 15Cs × 15-sCt [× 15-s-tCu] s = 3,5,7; t = 3,5,7 ≠ s; u = 3,5,7 ≠ s,t 360360 A1 Final answer. If A0 awarded SC B1 for final answer 360360. 3 6(c) Method 1: Total number of arrangements with AB together – Arrangements with AB and FG together 6! × 2 – 5! ×2 ×2 M1 a! × 2! × b, a = 5, 6; b = 1,2 seen. [ = 1440 – 480 ] M1 Either 6! × 2 – c ¸1 < c < 1440 or d – 5! ×2 ×2, 1440 < d 960 A1 Method 2: arrangements with AB together with F and G not together. 2 × 4! × 5 × 4 M1 2 × 4! × e, e positive integer >1 M1 f × 5 × 4, f positive integer >1 condone f × 20, f × 5C2, f positive integer >1 960 A1 3
What was in this paper
The subtopics covered by these 4 questions, and how many questions each got. Open one in a new tab to see every Cambridge question on it.
What you needed in this session
Cambridge’s own grade thresholds for 2022 Oct/Nov, Paper 5 · Variant 1. A higher threshold means an easier paper — the bar moves with how the cohort did.