Cambridge A Level Mathematics 9709 — 2016 May/June Paper 6 · Variant 1
9709/61/M/J/16 · 4 questions · 50 marks · ≈56 min
The question paper and its mark scheme, free to read here and free to download. This is Cambridge’s own paper, exactly as it was sat.
Question paper4 pages
Mark scheme6 pages
Answers below. Sit the paper first if you are practising.
Questions as text
Q1 · The height of maize plants in Mpapwa is normally distributed with mean 1.62 m and…
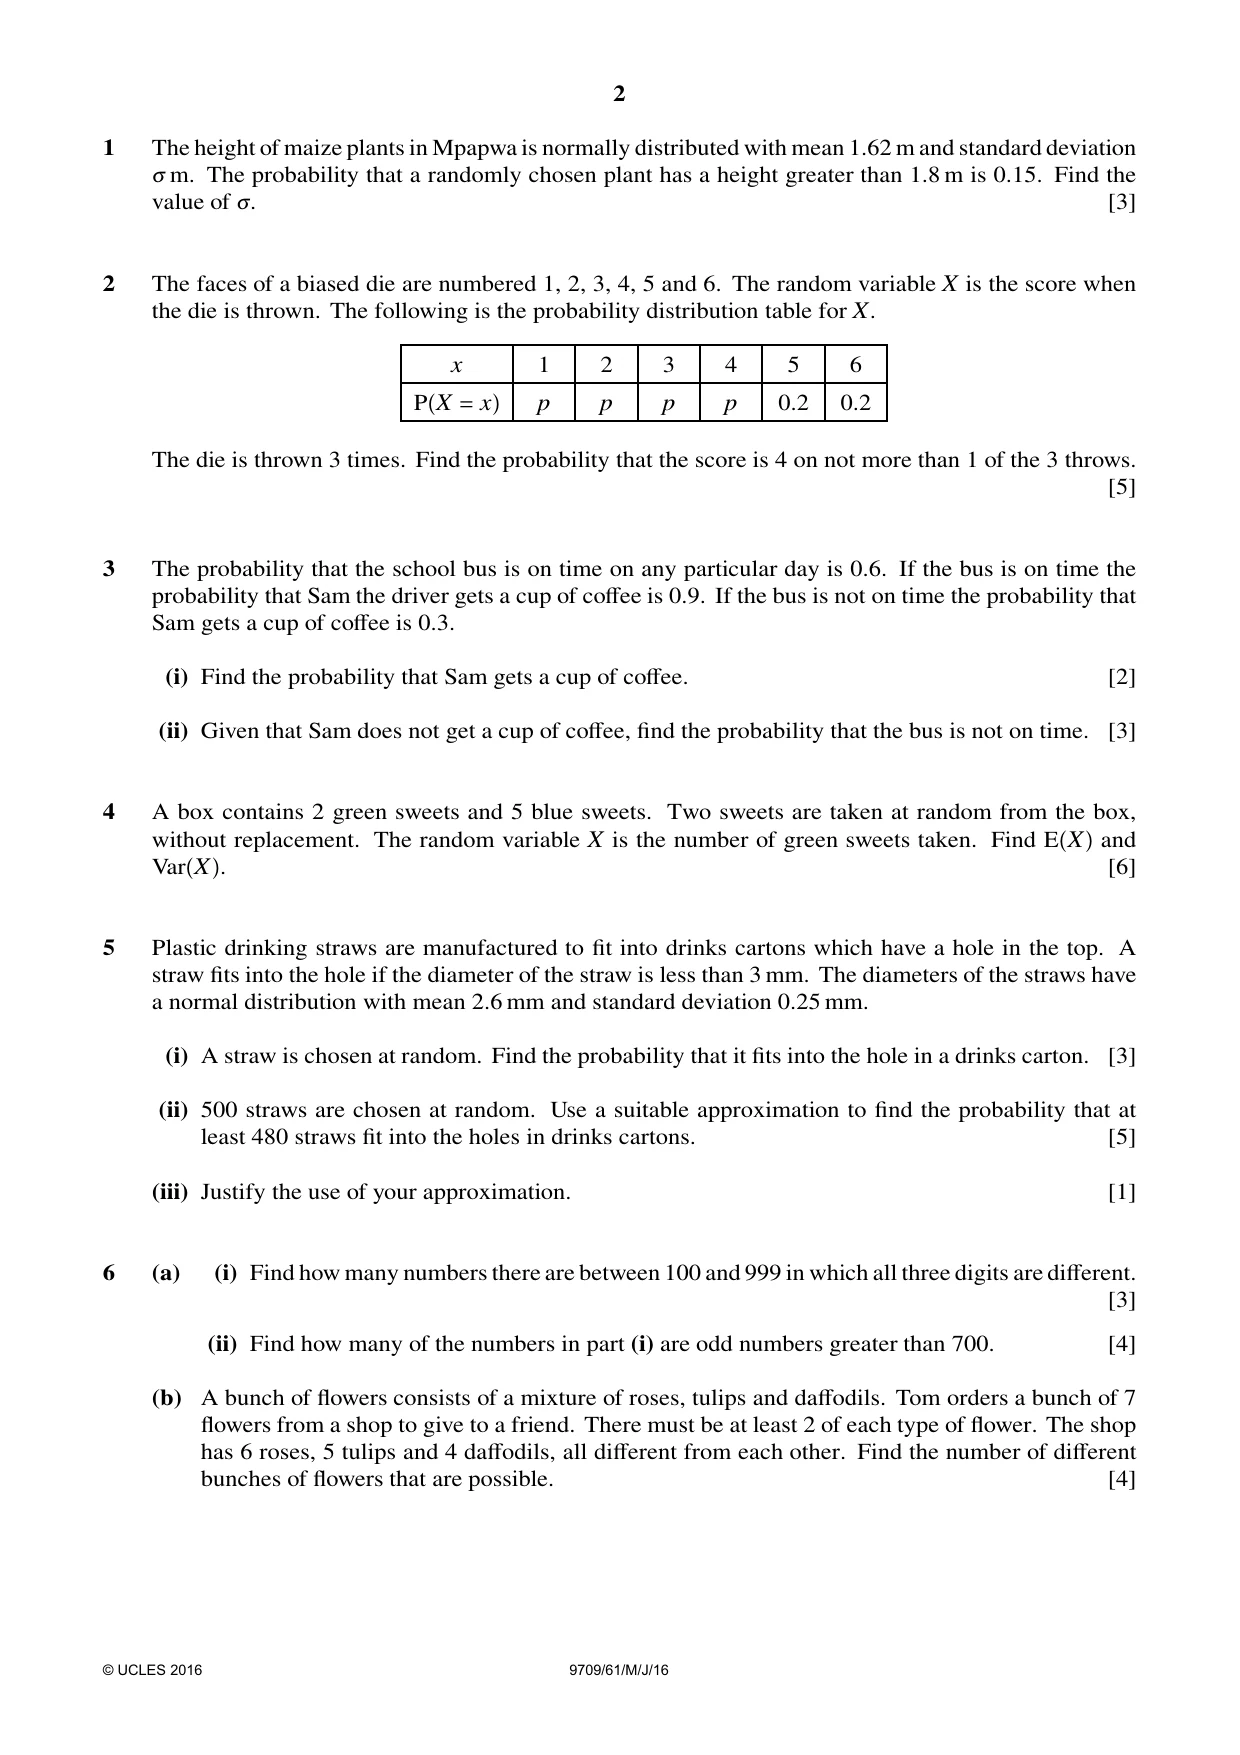
1 The height of maize plants in Mpapwa is normally distributed with mean 1.62 m and standard deviation 3 m. The probability that a randomly chosen plant has a height greater than 1.8 m is 0.15. Find the value of 3. [3]
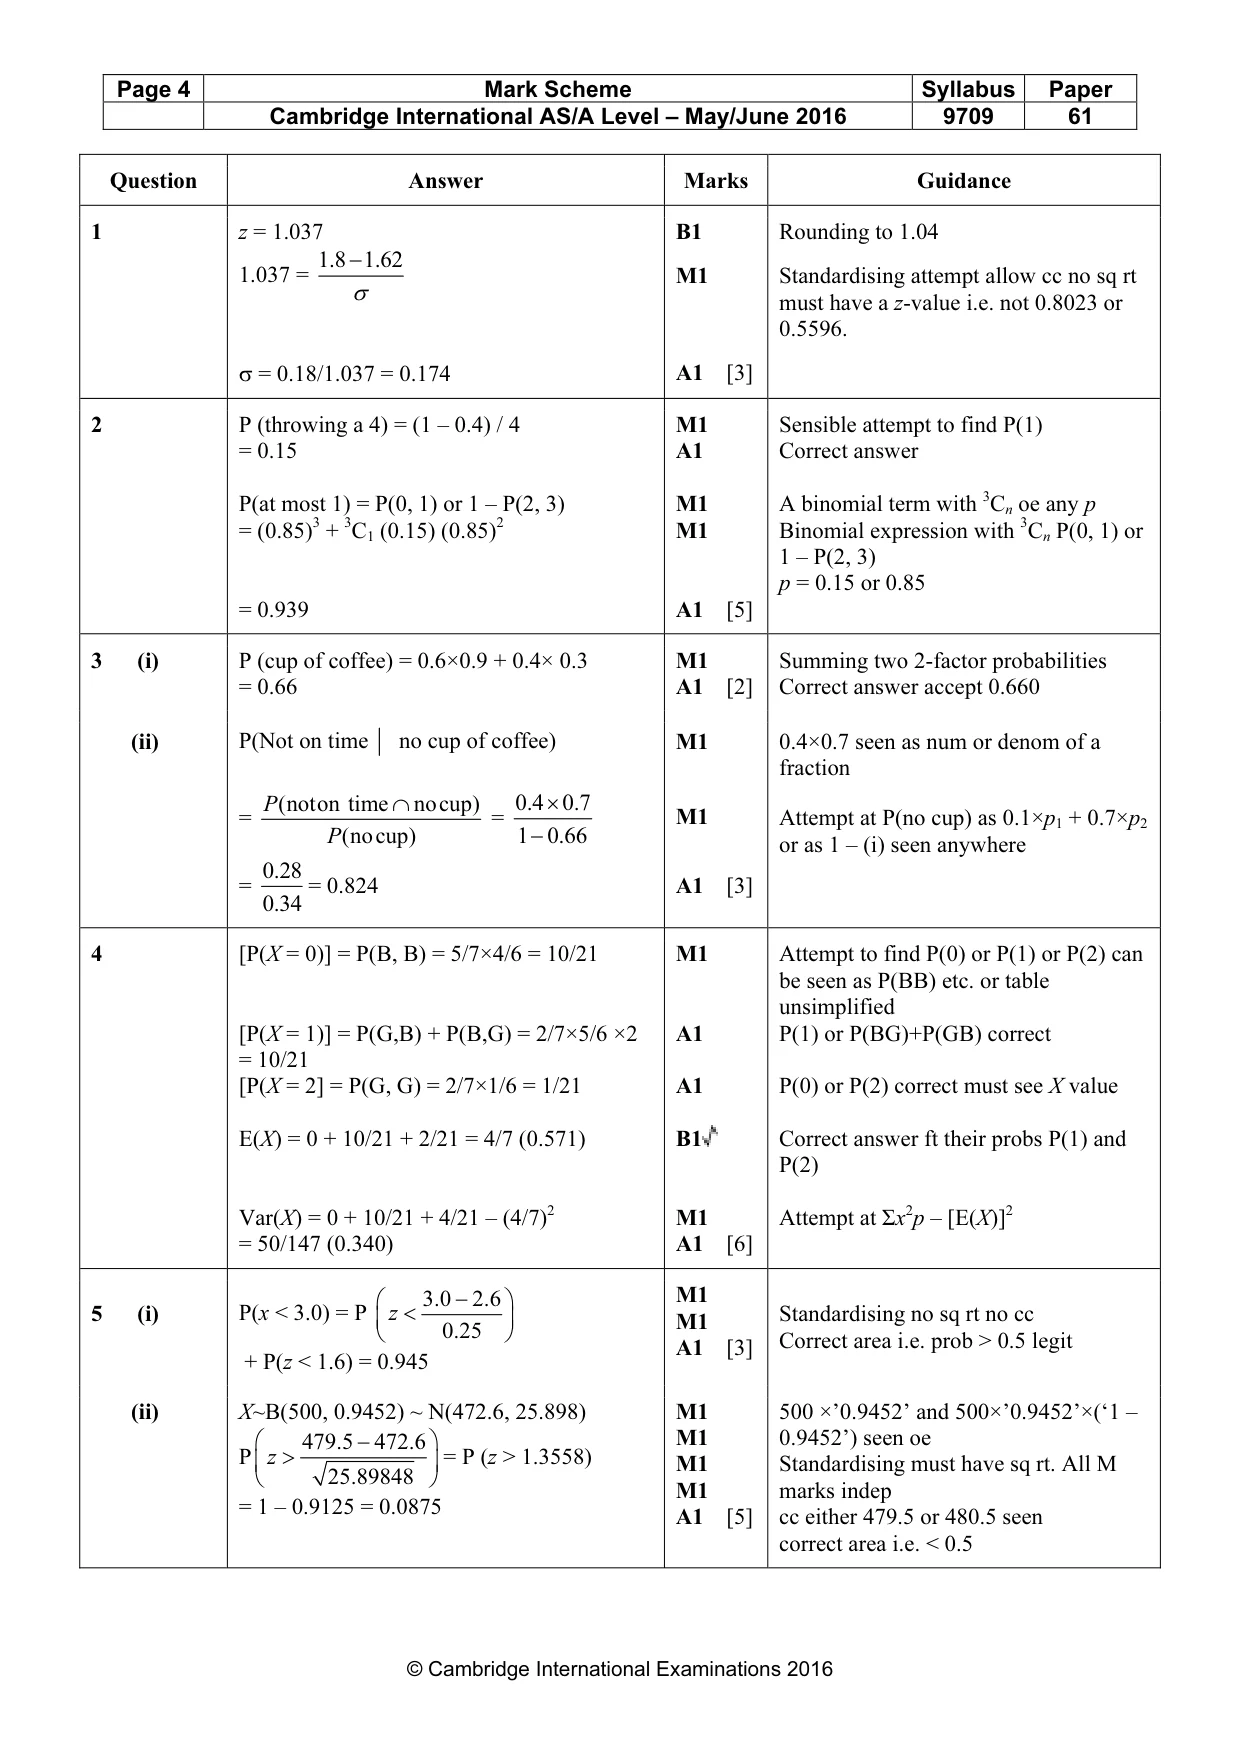
Mark scheme: Question Answer Marks Guidance 1 z = 1.037 B1 Rounding to 1.04 1.8 − 1.62 1.037 = M1 Standardising attempt allow cc no sq rt σ must have a z-value i.e. not 0.8023 or 0.5596. σ = 0.18/1.037 = 0.174 A1 [3]
Q3 · The probability that the school bus is on time on any particular day is 0.6
3 The probability that the school bus is on time on any particular day is 0.6. If the bus is on time the probability that Sam the driver gets a cup of coffee is 0.9. If the bus is not on time the probability that Sam gets a cup of coffee is 0.3. (i) Find the probability that Sam gets a cup of coffee. [2] (ii) Given that Sam does not get a cup of coffee, find the probability that the bus is not on time. [3]
Mark scheme: 3 (i) P (cup of coffee) = 0.6×0.9 + 0.4× 0.3 M1 Summing two 2-factor probabilities = 0.66 A1 [2] Correct answer accept 0.660 (ii) P(Not on time no cup of coffee) M1 0.4×0.7 seen as num or denom of a fraction P (noton time ∩ nocup) 0.4 × 0.7 = = M1 Attempt at P(no cup) as 0.1×p1 + 0.7×p2 P (nocup) 1 − 0.66 or as 1 – (i) seen anywhere 0.28 = = 0.824 A1 [3] 0.34
Q6 · Find how many numbers there are between 100 and 999 in which all three digits are different
6 (a) (i) Find how many numbers there are between 100 and 999 in which all three digits are different. [3] (ii) Find how many of the numbers in part (i) are odd numbers greater than 700. [4] (b) A bunch of flowers consists of a mixture of roses, tulips and daffodils. Tom orders a bunch of 7 flowers from a shop to give to a friend. There must be at least 2 of each type of flower. The shop has 6 roses, 5 tulips and 4 daffodils, all different from each other. Find the number of different bunches of flowers that are possible. [4]
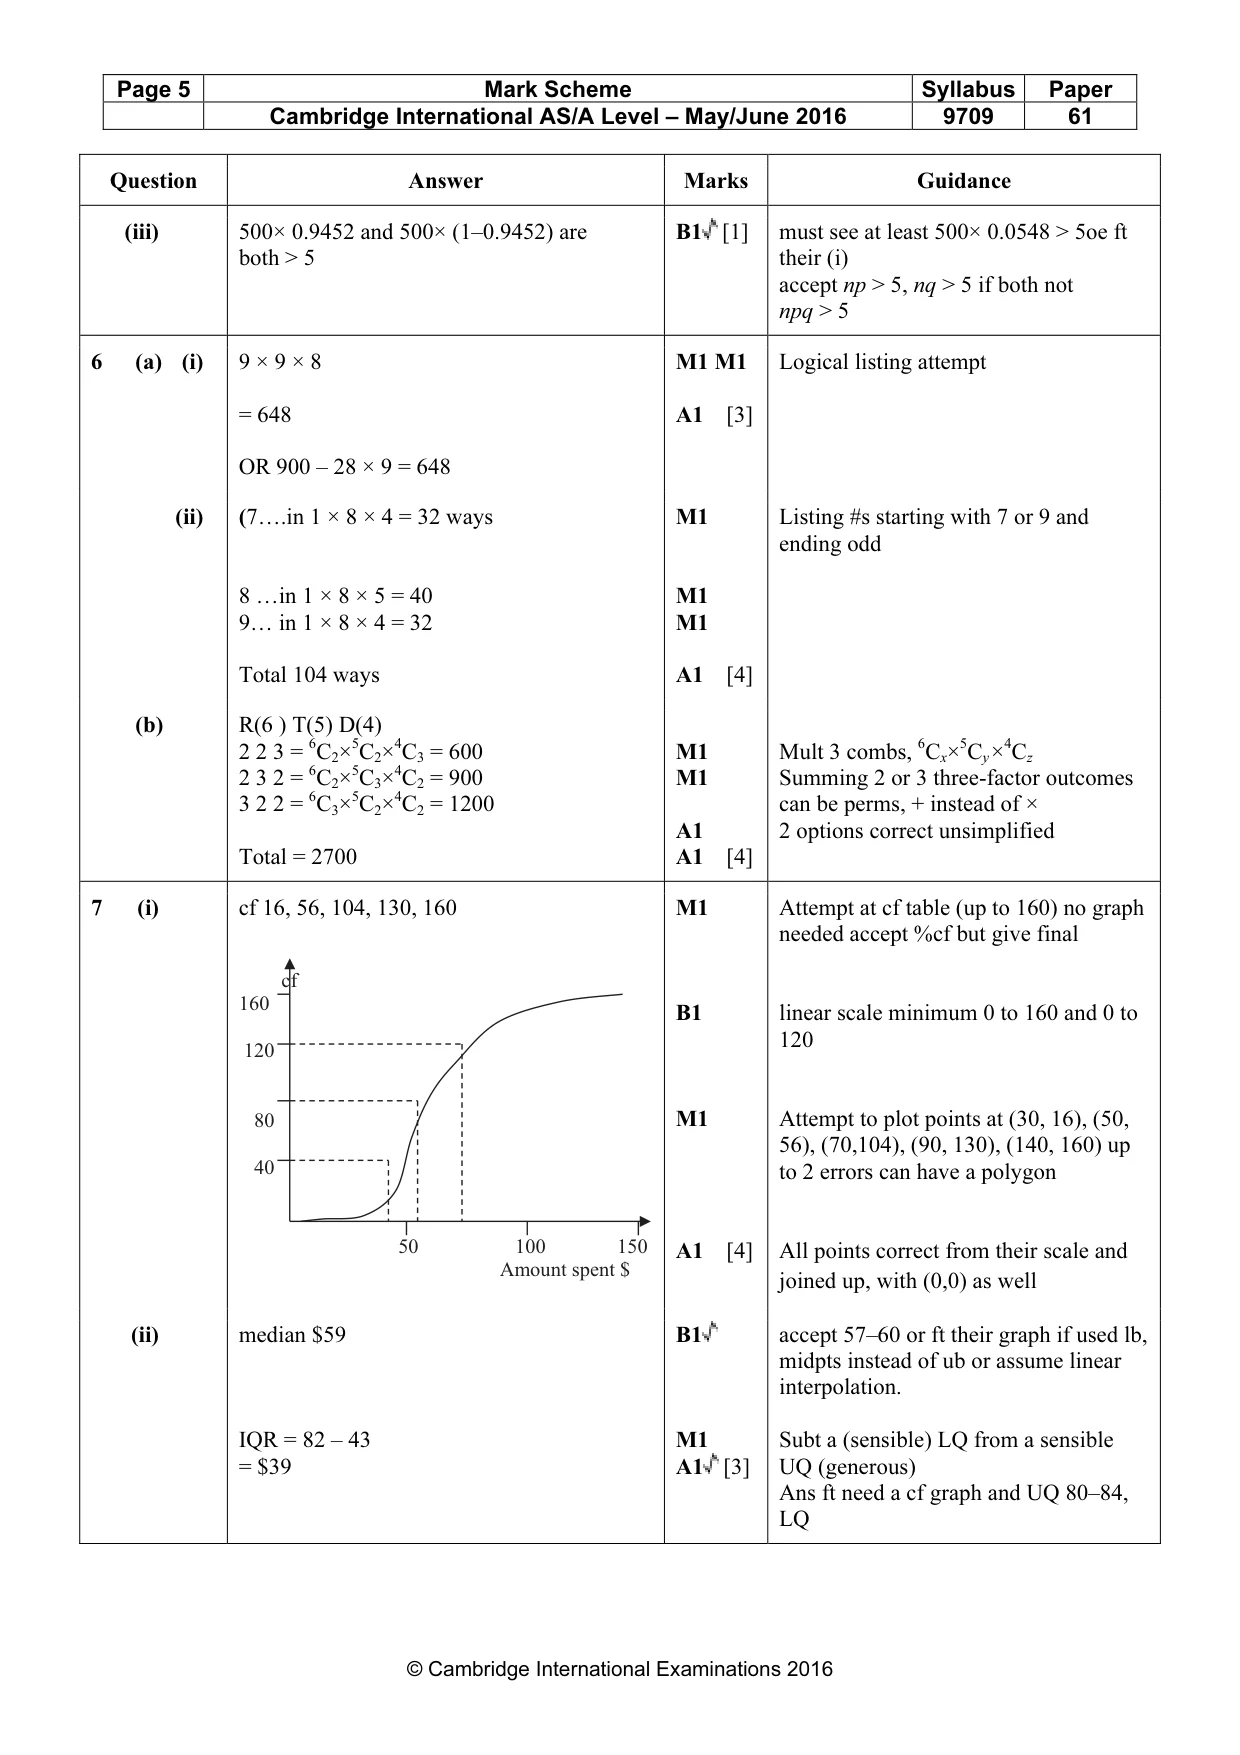
Mark scheme: 6 (a) (i) 9 × 9 × 8 M1 M1 Logical listing attempt = 648 A1 [3] OR 900 – 28 × 9 = 648 (ii) (7….in 1 × 8 × 4 = 32 ways M1 Listing #s starting with 7 or 9 and ending odd 8 …in 1 × 8 × 5 = 40 M1 9… in 1 × 8 × 4 = 32 M1 Total 104 ways A1 [4] (b) R(6 ) T(5) D(4) 2 2 3 = 6C2×5C2×4C3 = 600 M1 Mult 3 combs, 6Cx×5Cy×4Cz 2 3 2 = 6C2×5C3×4C2 = 900 M1 Summing 2 or 3 three-factor outcomes 3 2 2 = 6C3×5C2×4C2 = 1200 can be perms, + instead of × A1 2 options correct unsimplified Total = 2700 A1 [4]
Q7 · The amounts spent by 160 shoppers at a supermarket are summarised in the following table
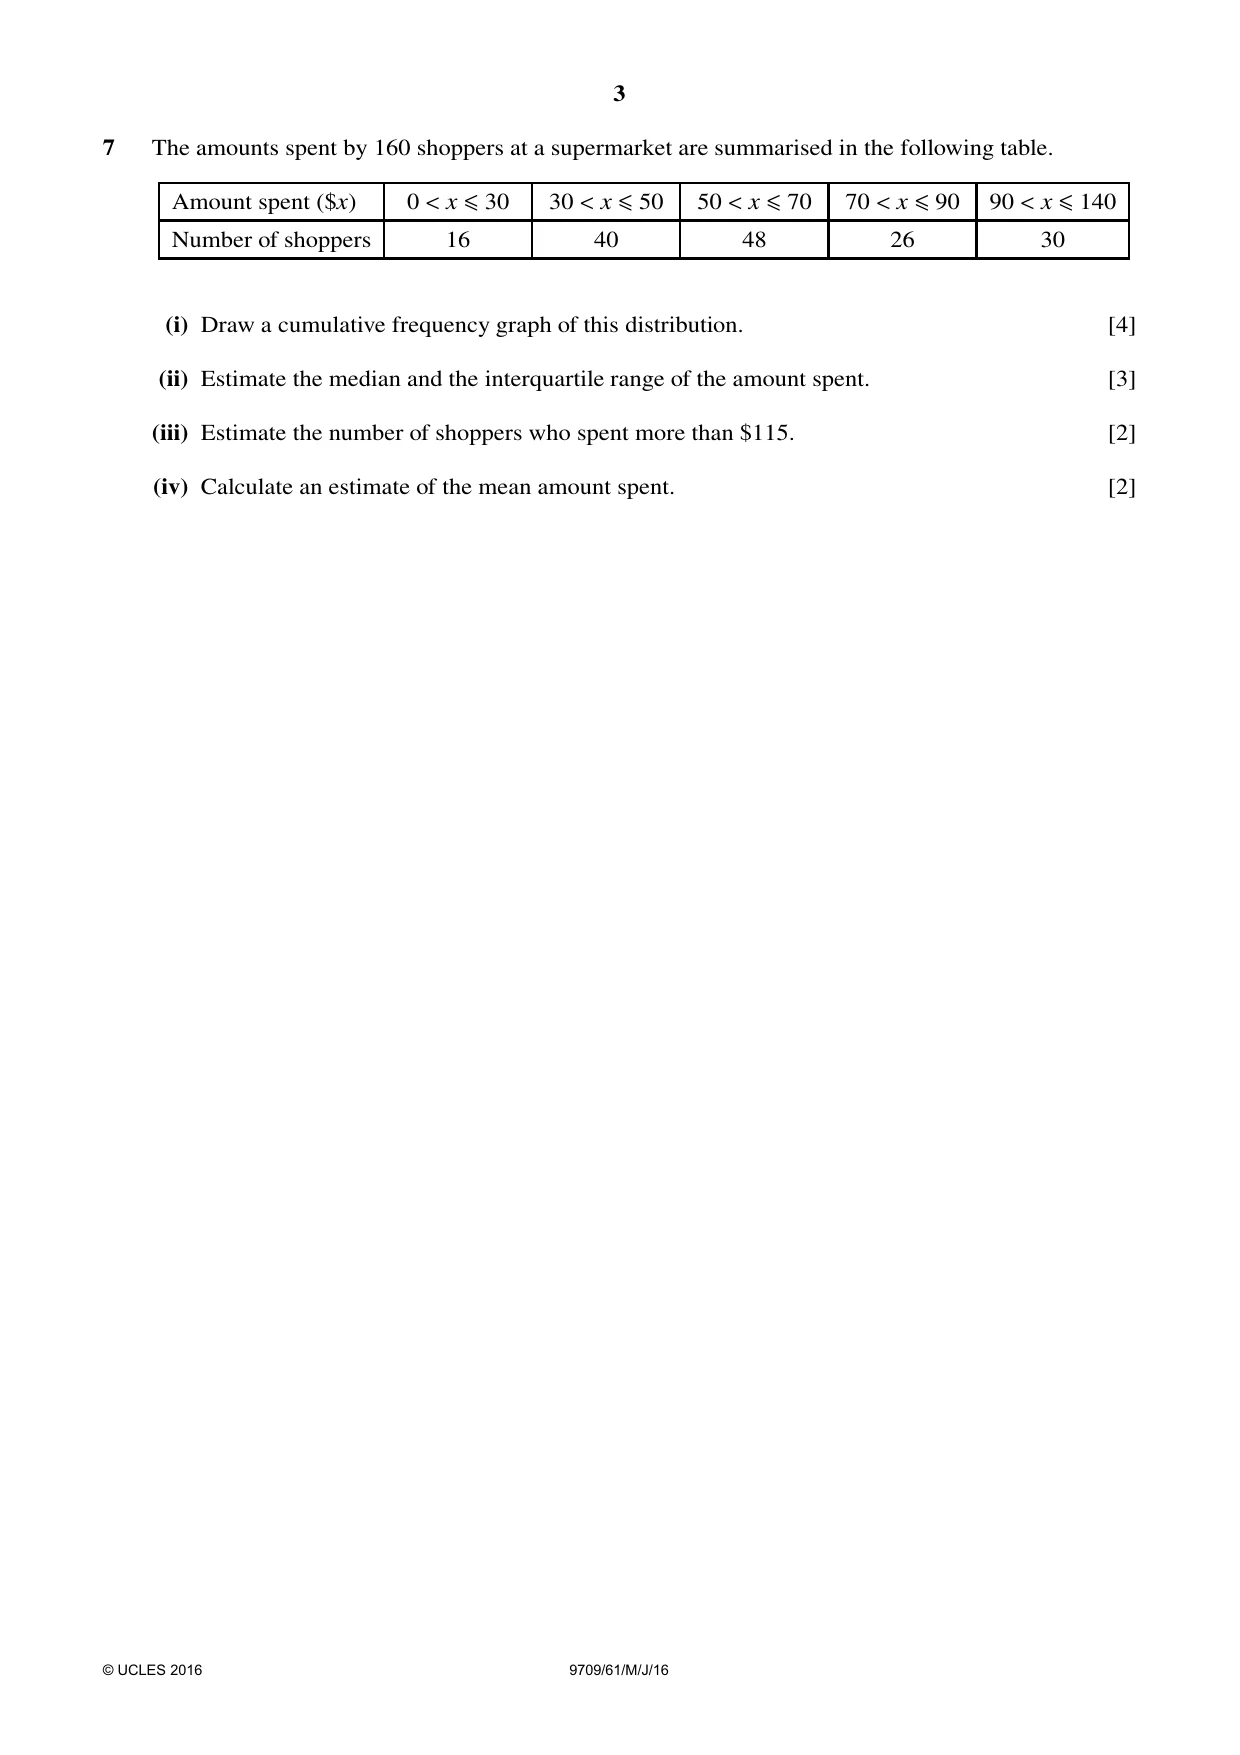
7 The amounts spent by 160 shoppers at a supermarket are summarised in the following table. Amount spent ($x) 0 < x ≤30 30 < x ≤50 50 < x ≤70 70 < x ≤90 90 < x ≤140 Number of shoppers 16 40 48 26 30 (i) Draw a cumulative frequency graph of this distribution. [4] (ii) Estimate the median and the interquartile range of the amount spent. [3] (iii) Estimate the number of shoppers who spent more than $115. [2] (iv) Calculate an estimate of the mean amount spent. [2]
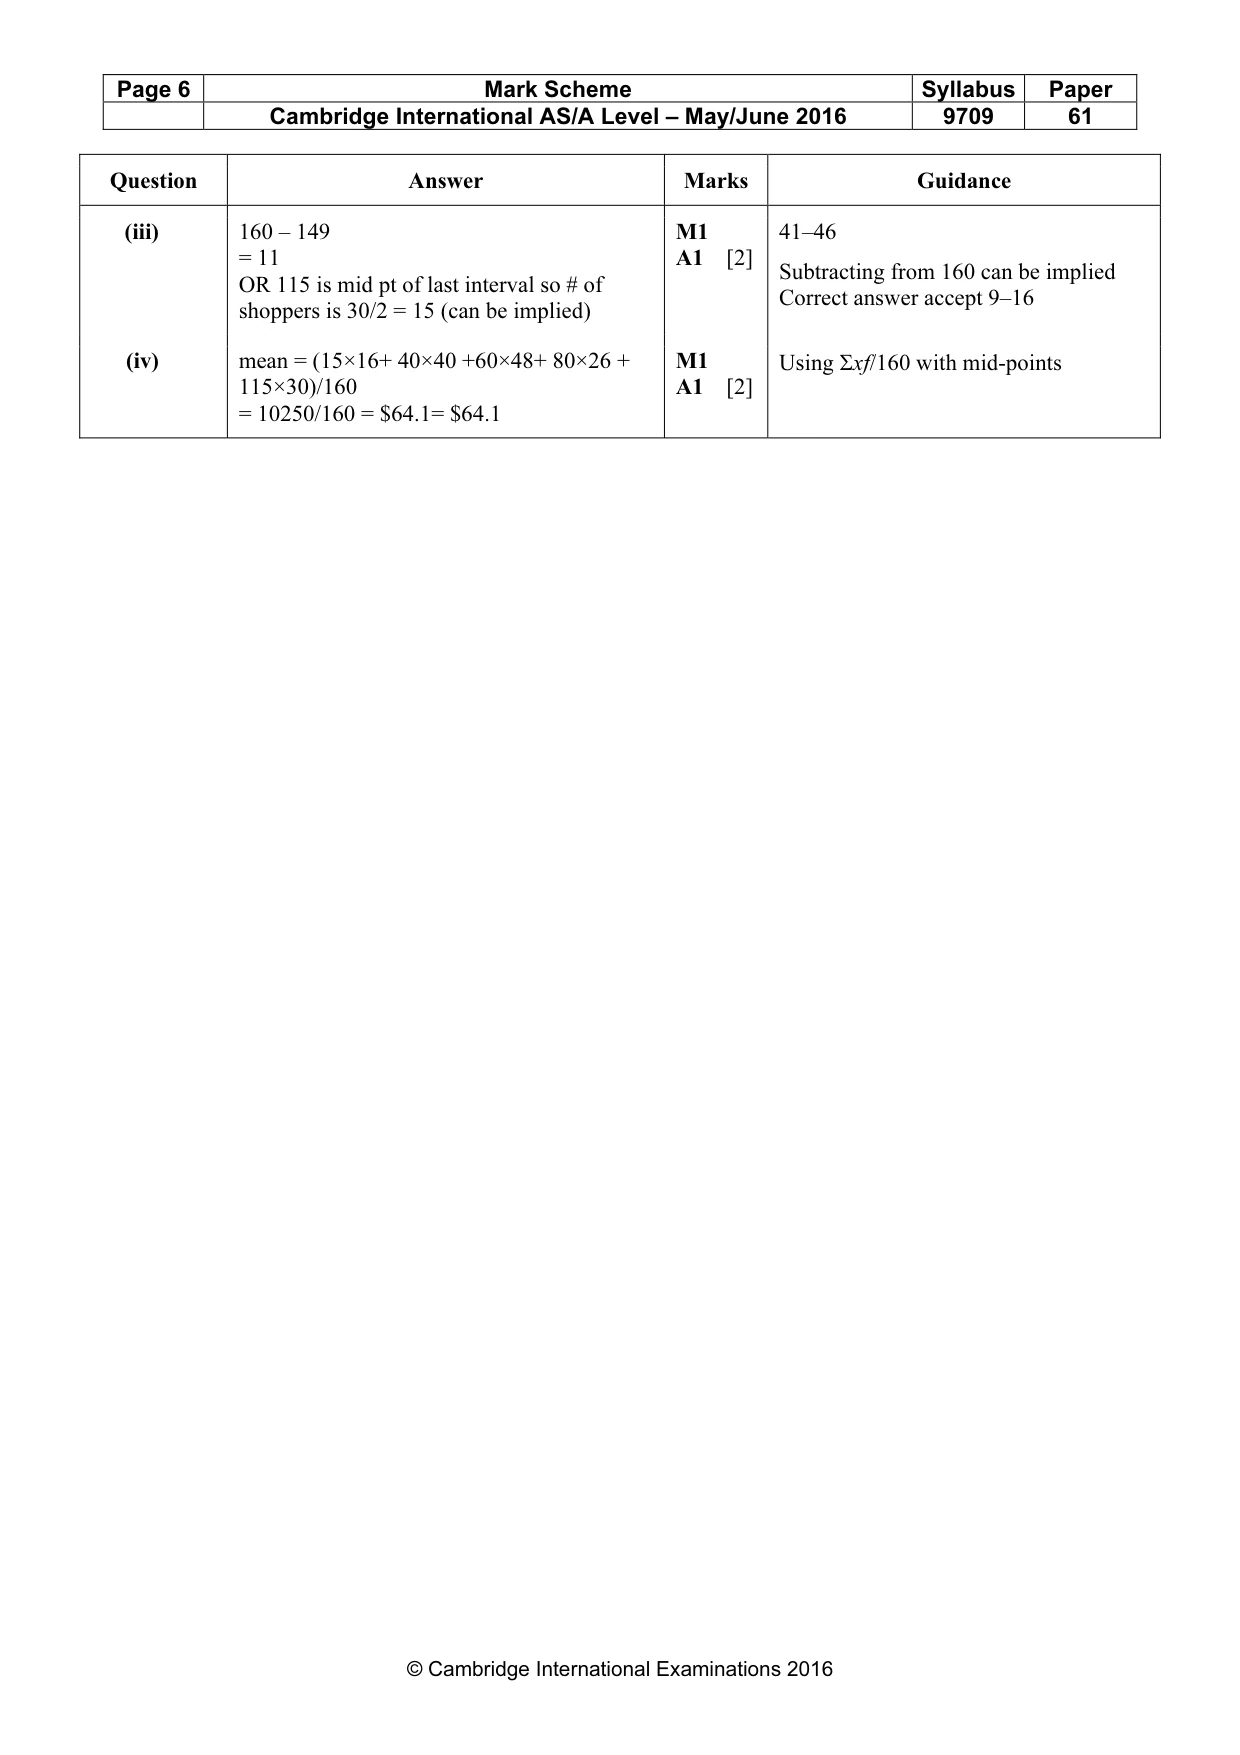
Mark scheme: 7 (i) cf 16, 56, 104, 130, 160 M1 Attempt at cf table (up to 160) no graph needed accept %cf but give final cf 160 B1 linear scale minimum 0 to 160 and 0 to 120 120 80 M1 Attempt to plot points at (30, 16), (50, 56), (70,104), (90, 130), (140, 160) up 40 to 2 errors can have a polygon 50 100 150 A1 [4] All points correct from their scale and Amount spent $ joined up, with (0,0) as well (ii) median $59 B1 accept 57–60 or ft their graph if used lb, midpts instead of ub or assume linear interpolation. IQR = 82 – 43 M1 Subt a (sensible) LQ from a sensible = $39 A1 [3] UQ (generous) Ans ft need a cf graph and UQ 80–84, LQ (iii) 160 – 149 M1 41–46 = 11 A1 [2] Subtracting from 160 can be implied OR 115 is mid pt of last interval so # of Correct answer accept 9–16 shoppers is 30/2 = 15 (can be implied) (iv) mean = (15×16+ 40×40 +60×48+ 80×26 + M1 Using Σxf/160 with mid-points 115×30)/160 A1 [2] = 10250/160 = $64.1= $64.1
What was in this paper
The subtopics covered by these 4 questions, and how many questions each got. Open one in a new tab to see every Cambridge question on it.
What you needed in this session
Cambridge’s own grade thresholds for 2016 May/June, Paper 6 · Variant 1. A higher threshold means an easier paper — the bar moves with how the cohort did.