Cambridge A Level Mathematics 9709 — 2015 May/June Paper 6 · Variant 3
9709/63/M/J/15 · 4 questions · 50 marks · ≈56 min
The question paper and its mark scheme, free to read here and free to download. This is Cambridge’s own paper, exactly as it was sat.
Question paper4 pages
Mark scheme6 pages
Answers below. Sit the paper first if you are practising.
Questions as text
Q1 · The weights, in grams, of onions in a supermarket have a normal distribution with mean…
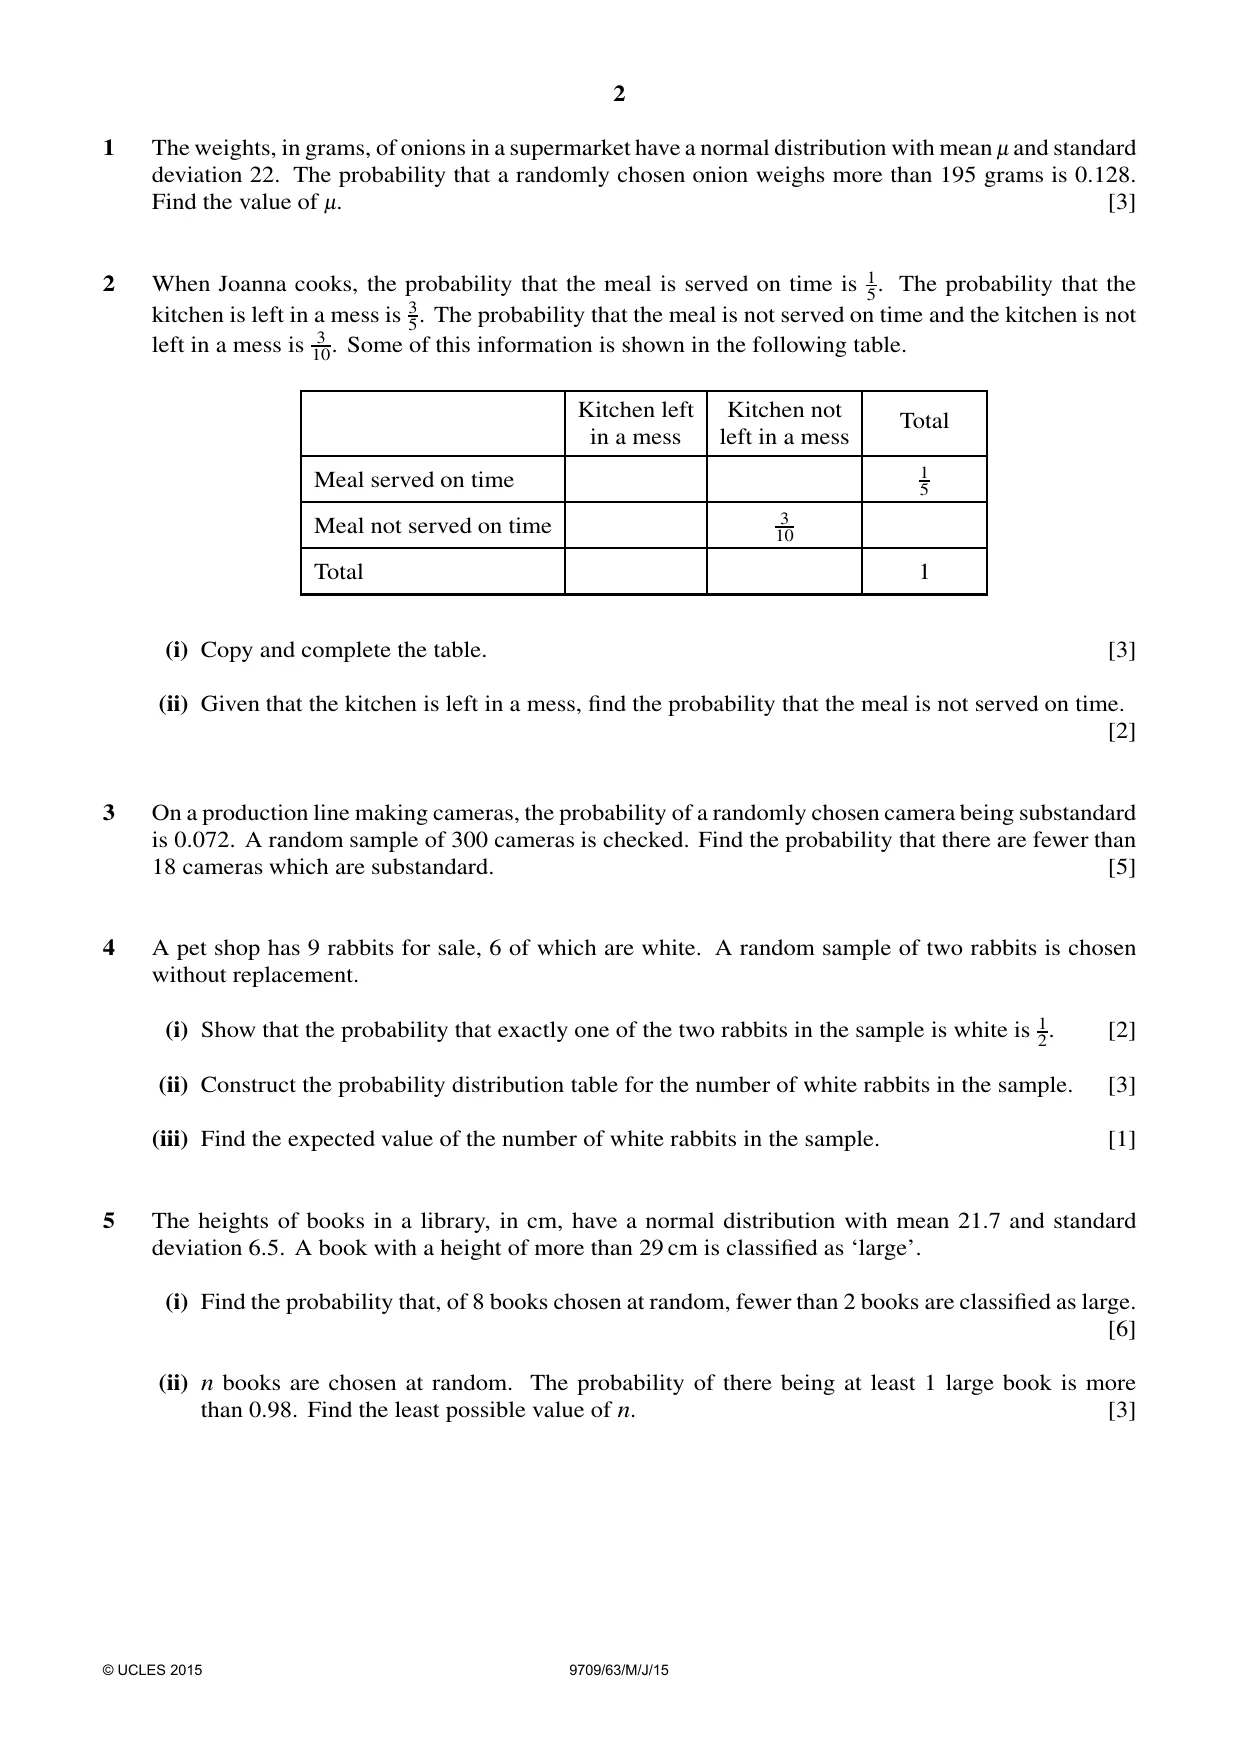
1 The weights, in grams, of onions in a supermarket have a normal distribution with mean - and standard deviation 22. The probability that a randomly chosen onion weighs more than 195 grams is 0.128. Find the value of -. [3]
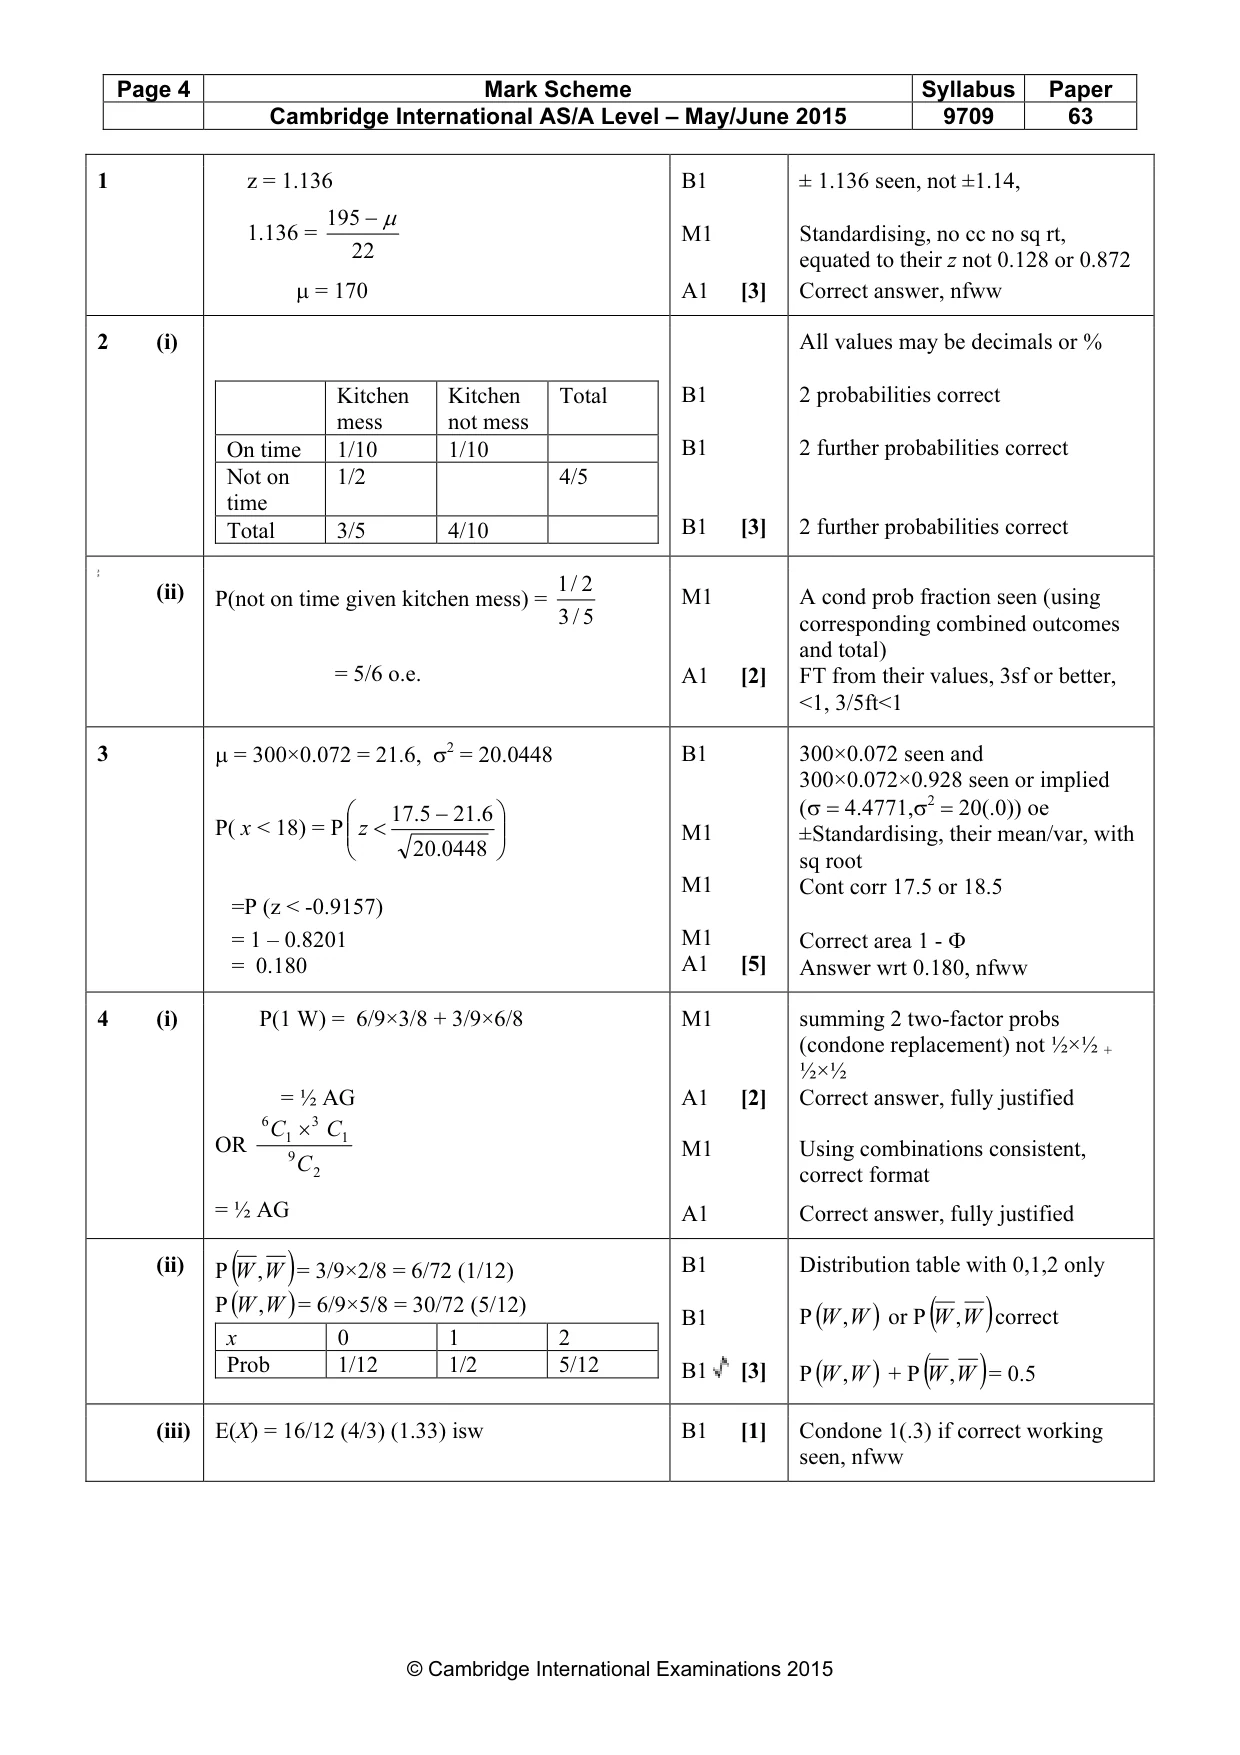
Mark scheme: 1 z = 1.136 B1 ± 1.136 seen, not ±1.14, 195 − µ 1.136 = M1 Standardising, no cc no sq rt, 22 equated to their z not 0.128 or 0.872 µ = 170 A1 [3] Correct answer, nfww
Q2 · When Joanna cooks, the probability that the meal is served on time is 15
2 When Joanna cooks, the probability that the meal is served on time is 15. The probability that the kitchen is left in a mess is 35. The probability that the meal is not served on time and the kitchen is not left in a mess is 10.3 Some of this information is shown in the following table. Kitchen left Kitchen not Total in a mess left in a mess Meal served on time 1 5 Meal not served on time 3 10 Total 1 (i) Copy and complete the table. [3] (ii) Given that the kitchen is left in a mess, find the probability that the meal is not served on time. [2]
Mark scheme: 2 (i) All values may be decimals or % Kitchen Kitchen Total B1 2 probabilities correct mess not mess On time 1/10 1/10 B1 2 further probabilities correct Not on 1/2 4/5 time Total 3/5 4/10 B1 [3] 2 further probabilities correct
Q3 · On a production line making cameras, the probability of a randomly chosen camera being…
3 On a production line making cameras, the probability of a randomly chosen camera being substandard is 0.072. A random sample of 300 cameras is checked. Find the probability that there are fewer than 18 cameras which are substandard. [5]
Mark scheme: 3
Q6 · Seventy samples of fertiliser were collected and the nitrogen content was measured for…
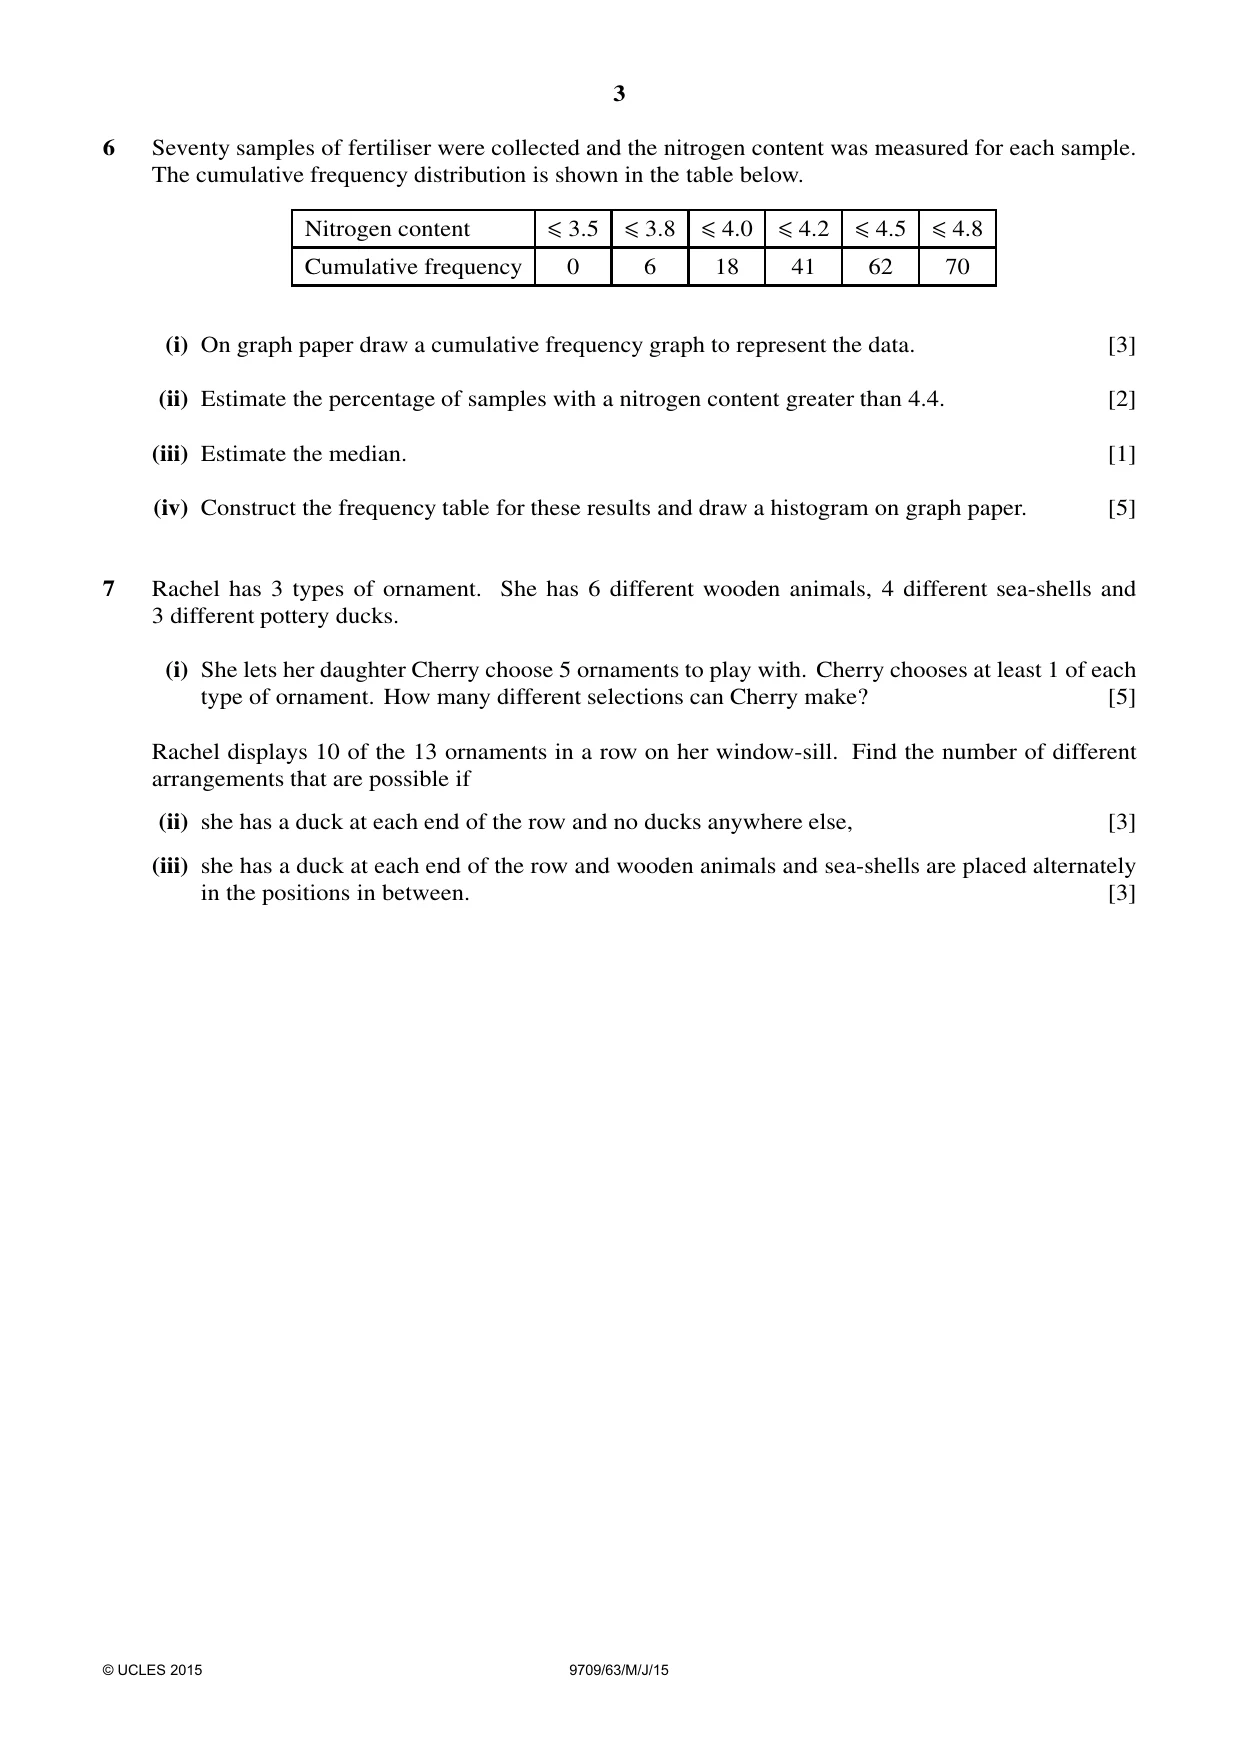
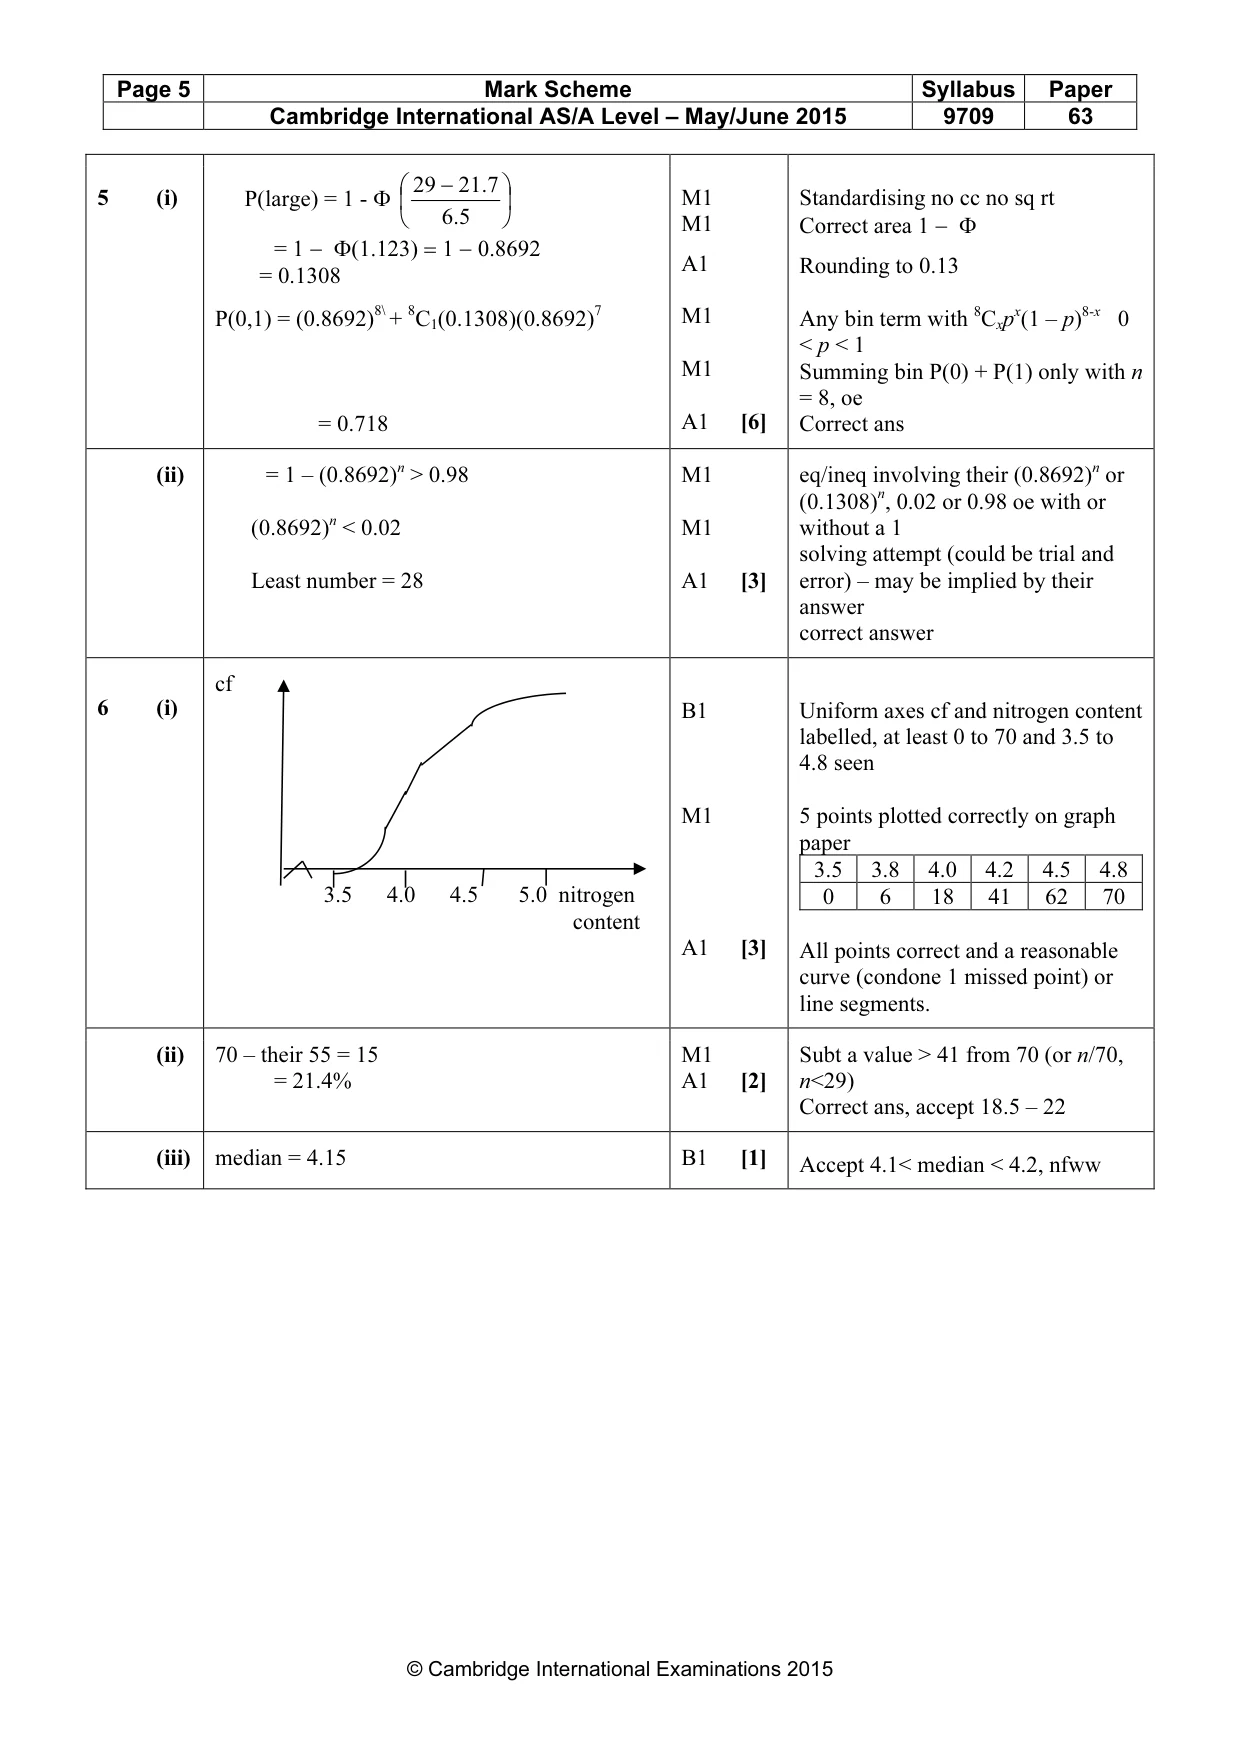
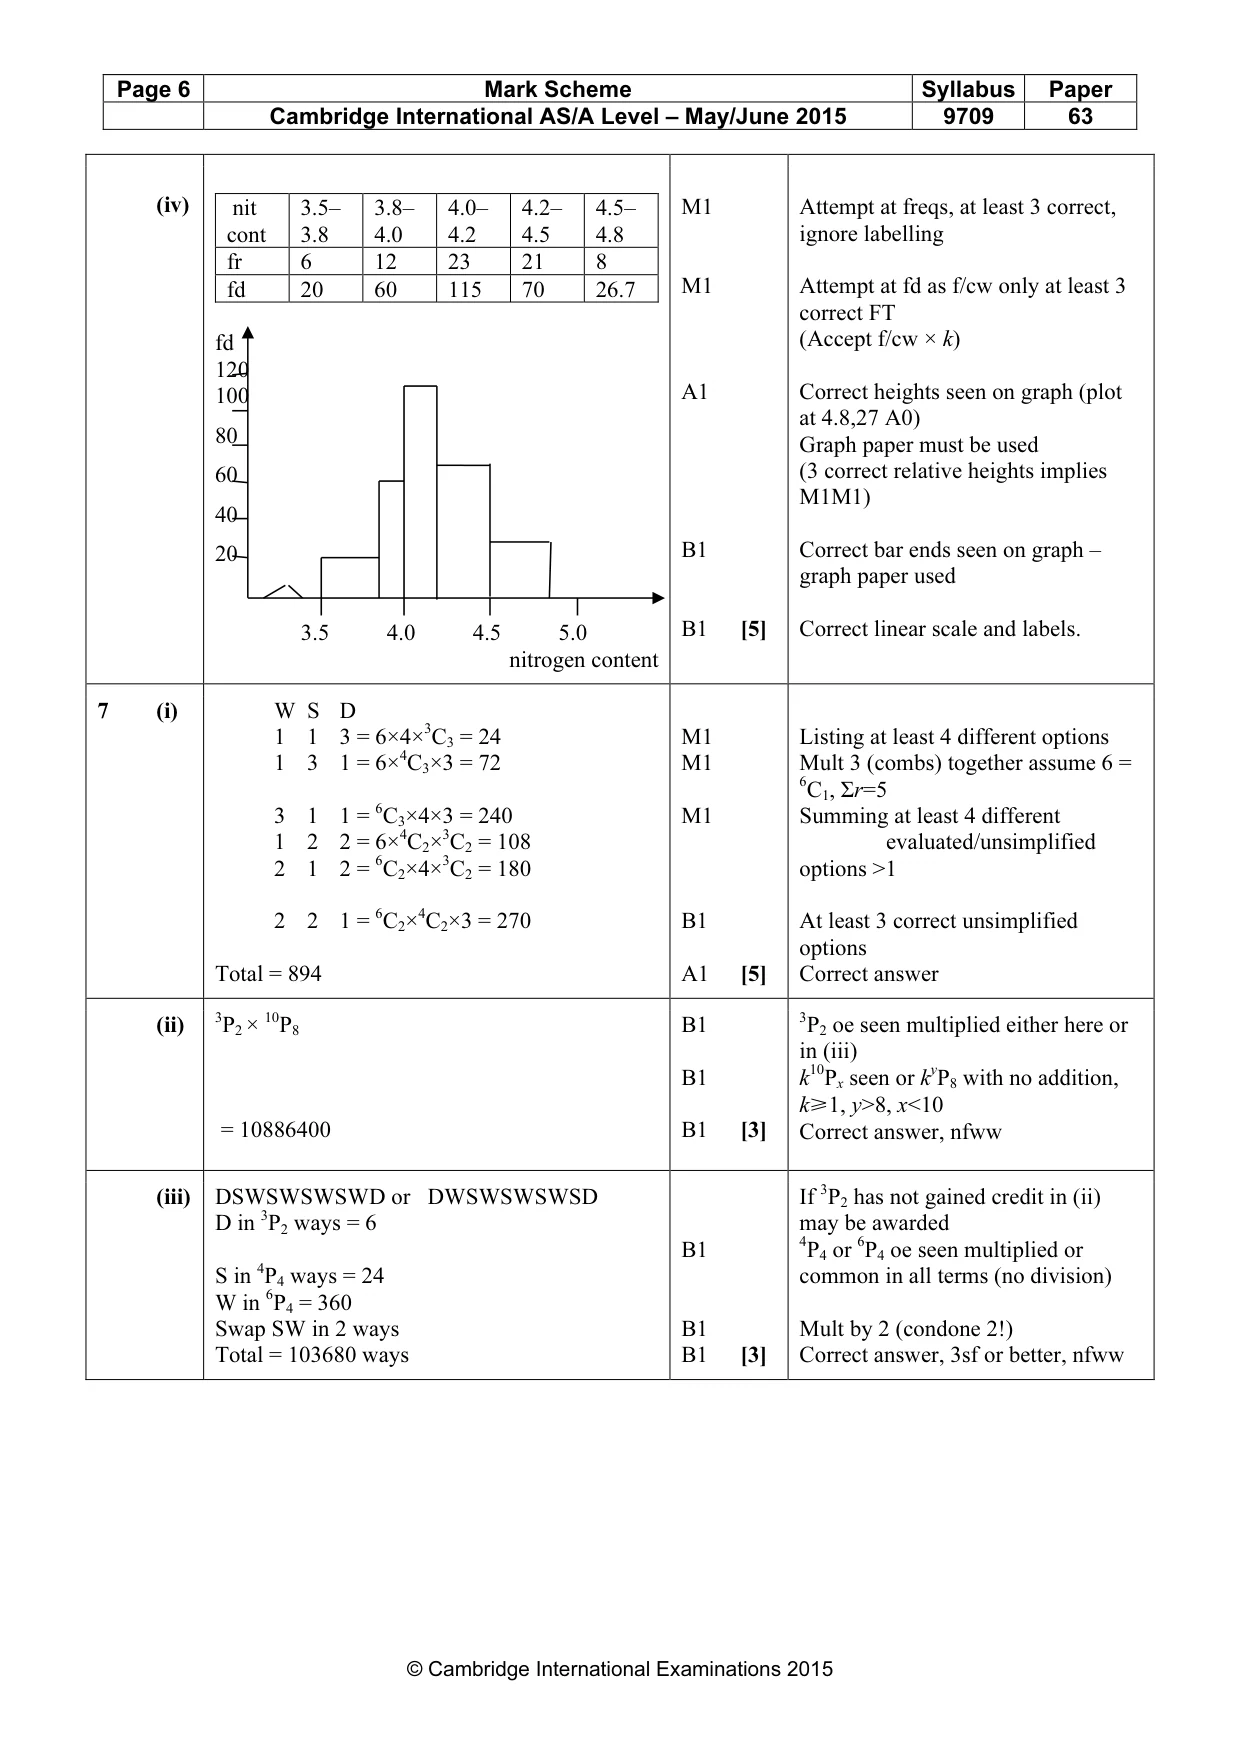
6 Seventy samples of fertiliser were collected and the nitrogen content was measured for each sample. The cumulative frequency distribution is shown in the table below. Nitrogen content ≤3.5 ≤3.8 ≤4.0 ≤4.2 ≤4.5 ≤4.8 Cumulative frequency 0 6 18 41 62 70 (i) On graph paper draw a cumulative frequency graph to represent the data. [3] (ii) Estimate the percentage of samples with a nitrogen content greater than 4.4. [2] (iii) Estimate the median. [1] (iv) Construct the frequency table for these results and draw a histogram on graph paper. [5]
Mark scheme: 6 (i) B1 Uniform axes cf and nitrogen content labelled, at least 0 to 70 and 3.5 to 4.8 seen M1 5 points plotted correctly on graph paper 3.5 3.8 4.0 4.2 4.5 4.8 3.5 4.0 4.5 5.0 nitrogen 0 6 18 41 62 70 content A1 [3] All points correct and a reasonable curve (condone 1 missed point) or line segments. (ii) 70 – their 55 = 15 M1 Subt a value > 41 from 70 (or n/70, = 21.4% A1 [2] n<29) Correct ans, accept 18.5 – 22 (iii) median = 4.15 B1 [1] Accept 4.1< median < 4.2, nfww (iv) nit 3.5– 3.8– 4.0– 4.2– 4.5– M1 Attempt at freqs, at least 3 correct, cont 3.8 4.0 4.2 4.5 4.8 ignore labelling fr 6 12 23 21 8 fd 20 60 115 70 26.7 M1 Attempt at fd as f/cw only at least 3 correct FT fd (Accept f/cw × k) 120 100 A1 Correct heights seen on graph (plot at 4.8,27 A0)
What was in this paper
The subtopics covered by these 4 questions, and how many questions each got. Open one in a new tab to see every Cambridge question on it.
What you needed in this session
Cambridge’s own grade thresholds for 2015 May/June, Paper 6 · Variant 3. A higher threshold means an easier paper — the bar moves with how the cohort did.