Cambridge A Level Mathematics 9709 — 2010 May/June Paper 6 · Variant 3
9709/63/M/J/10 · 7 questions · 50 marks · ≈56 min
The question paper and its mark scheme, free to read here and free to download. This is Cambridge’s own paper, exactly as it was sat.
Question paper4 pages
Mark scheme6 pages
Answers below. Sit the paper first if you are practising.
Questions as text
Q1 · A bottle of sweets contains 13 red sweets, 13 blue sweets, 13 green sweets and 13 yellow…
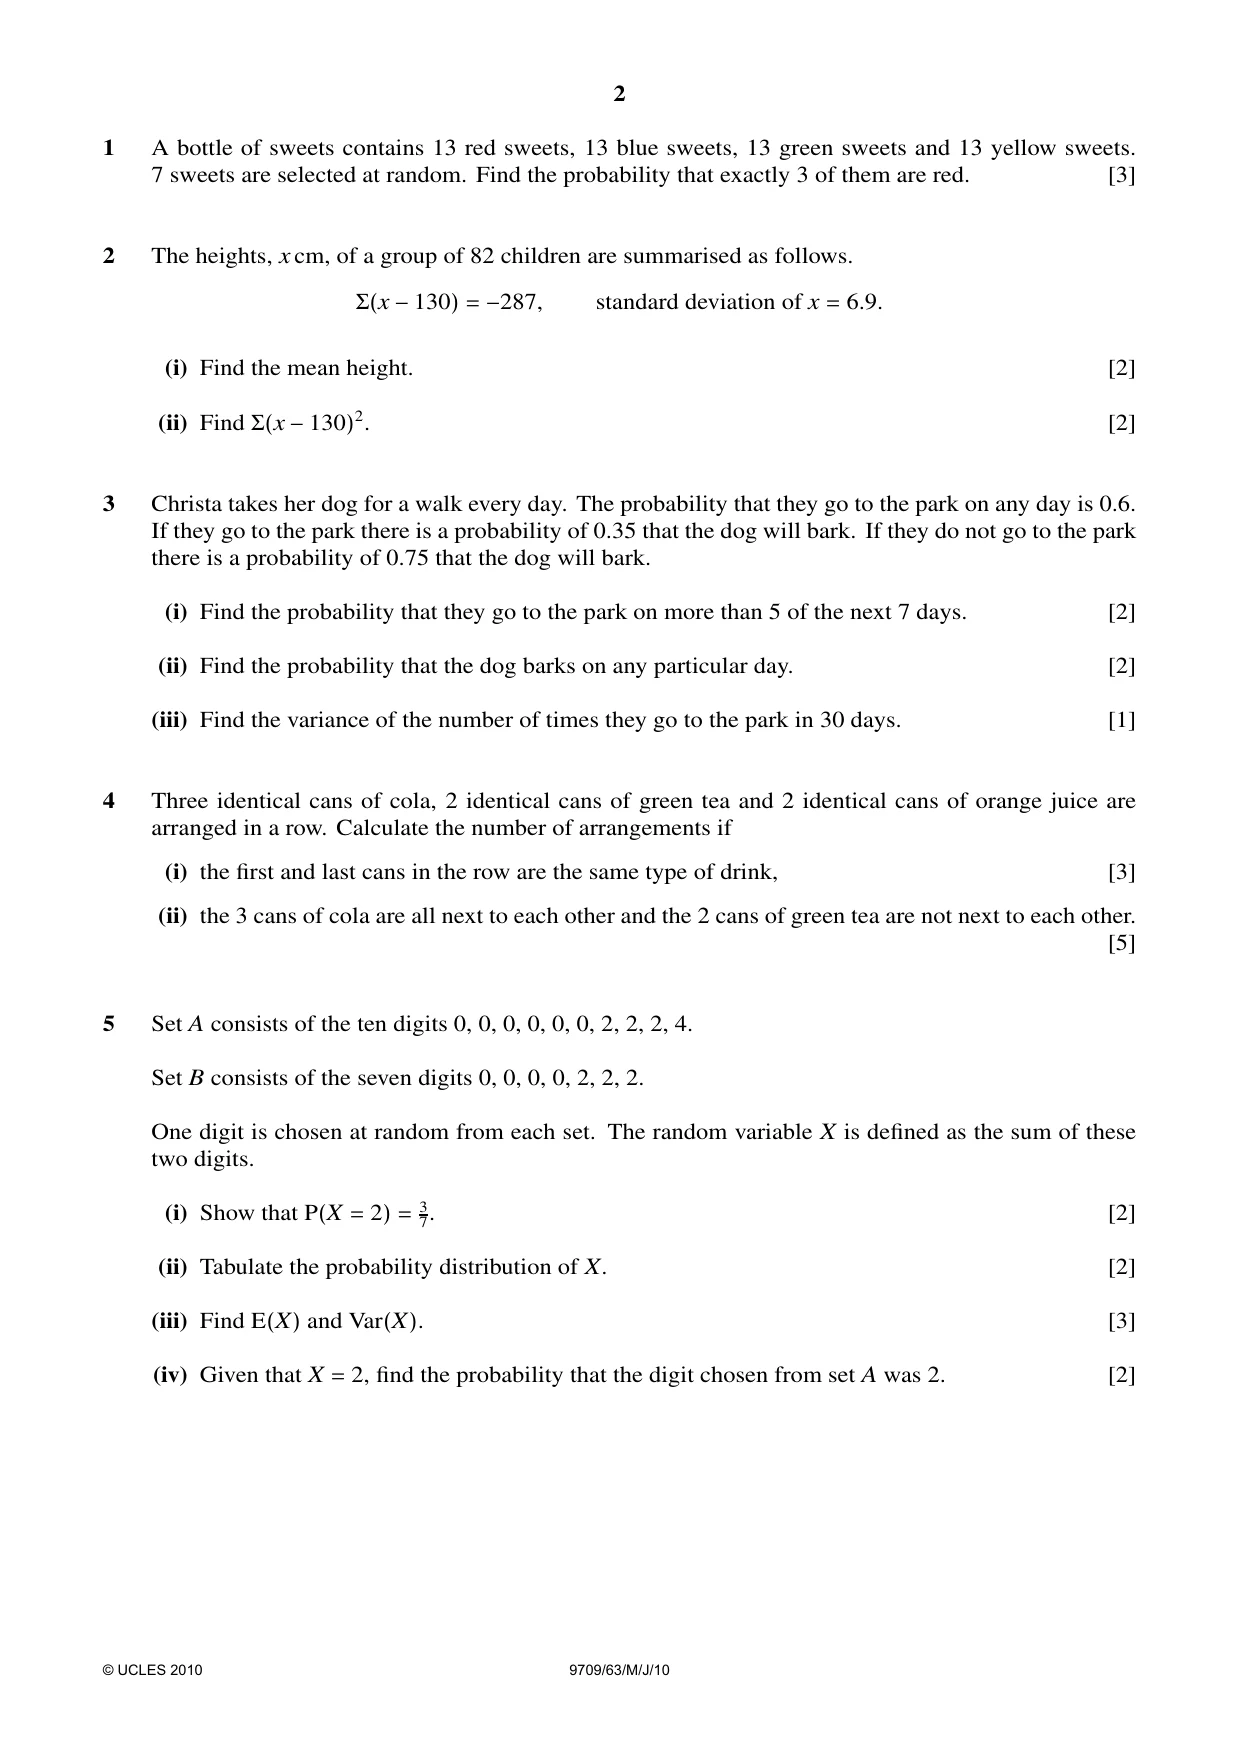
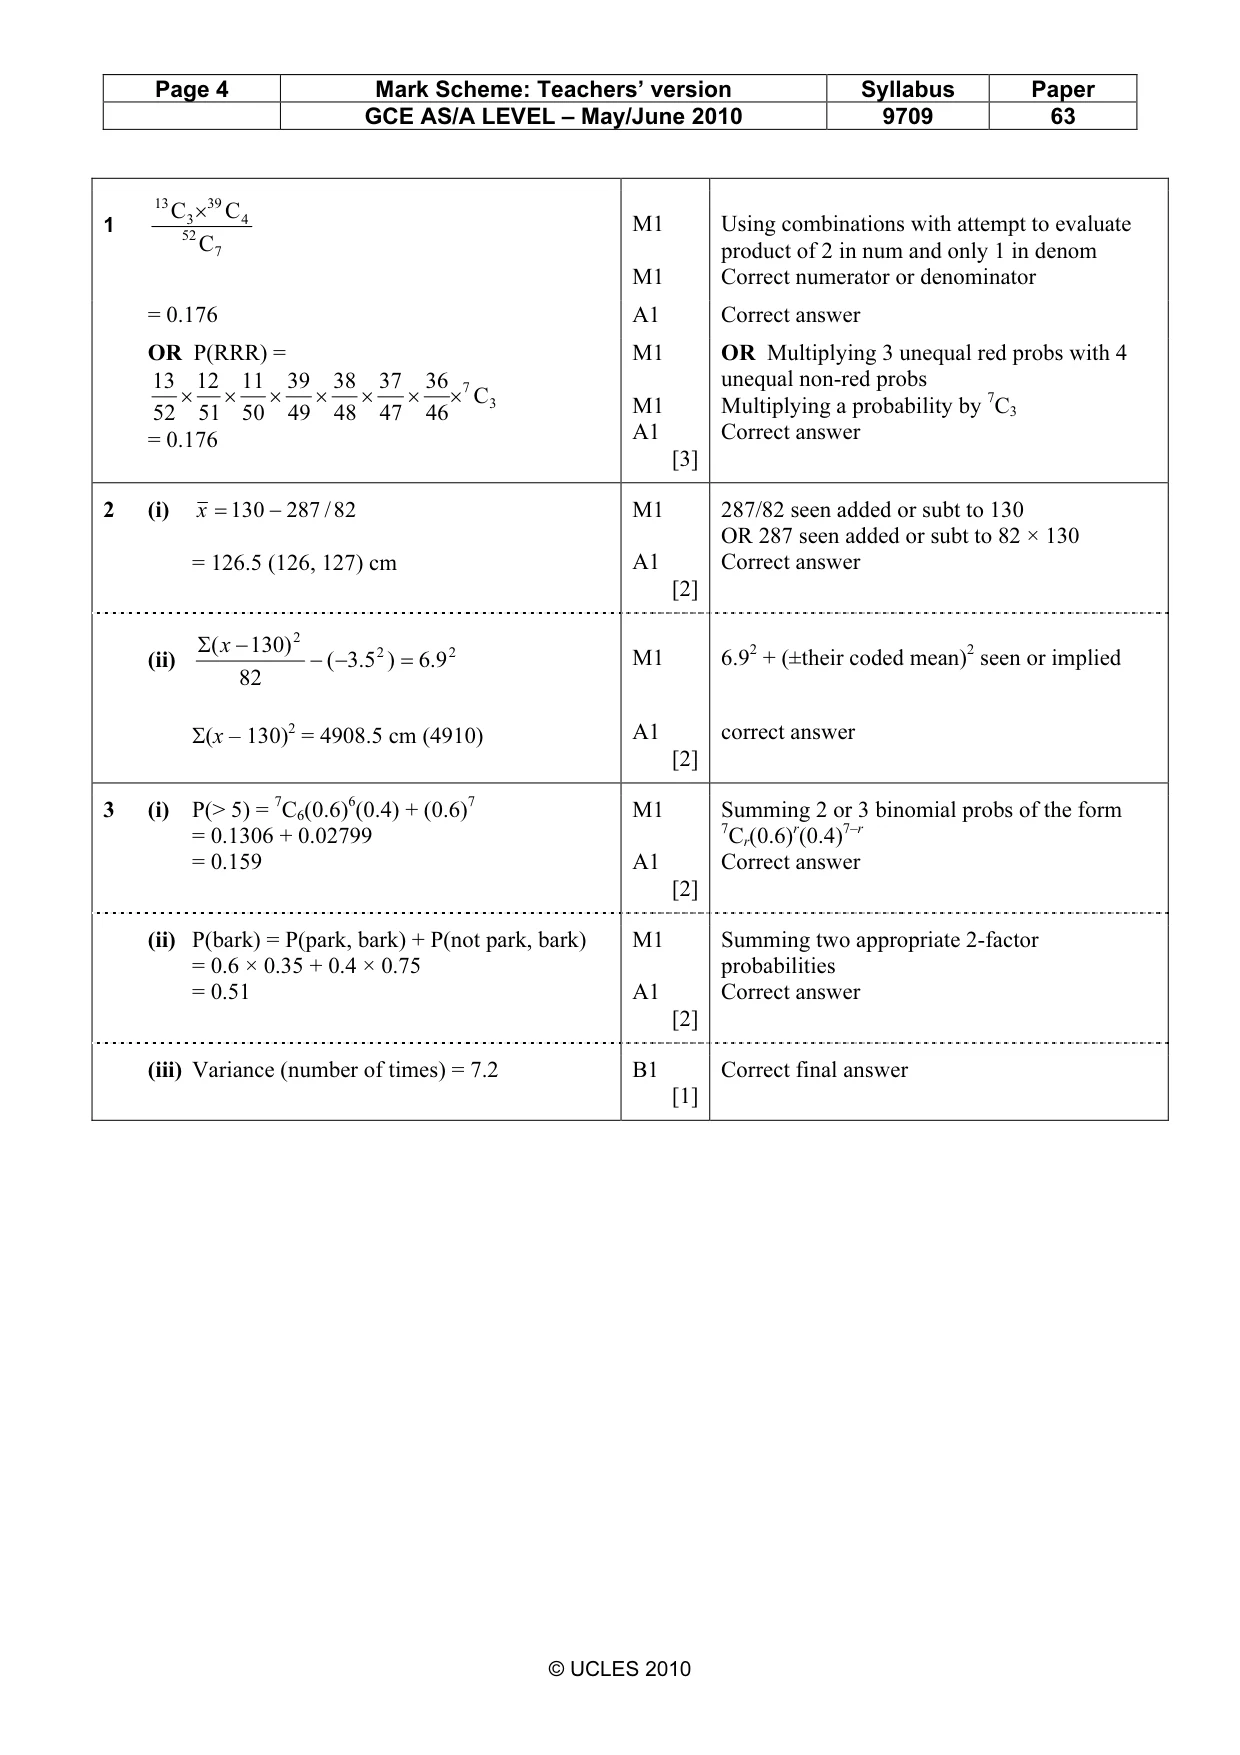
1 A bottle of sweets contains 13 red sweets, 13 blue sweets, 13 green sweets and 13 yellow sweets. 7 sweets are selected at random. Find the probability that exactly 3 of them are red. [3]
Mark scheme: C 3 × C 41 M1 Using combinations with attempt to evaluate 52 C 7 product of 2 in num and only 1 in denom M1 Correct numerator or denominator = 0.176 A1 Correct answer OR P(RRR) = M1 OR Multiplying 3 unequal red probs with 4 13 12 11 39 38 37 36 7 unequal non-red probs × × × × × × × C 3 M1 Multiplying a probability by 7C3 52 51 50 49 48 47 46 A1 Correct answer = 0.176 [3]
Q2 · The heights, x cm, of a group of 82 children are summarised as follows
2 The heights, x cm, of a group of 82 children are summarised as follows. Σ(x −130) = −287, standard deviation of x = 6.9. (i) Find the mean height. [2] (ii) Find Σ(x −130)2. [2]
Mark scheme: 2 (i) x = 130 − 287 / 82 M1 287/82 seen added or subt to 130 OR 287 seen added or subt to 82 × 130 = 126.5 (126, 127) cm A1 Correct answer [2] Σ ( x − 130) 2 2 2 (ii) − ( −5.3 ) = 9.6 M1 6.92 + (±their coded mean)2 seen or implied 82 Σ(x – 130)2 = 4908.5 cm (4910) A1 correct answer [2] 7 6 7
Q3 · Christa takes her dog for a walk every day
3 Christa takes her dog for a walk every day. The probability that they go to the park on any day is 0.6. If they go to the park there is a probability of 0.35 that the dog will bark. If they do not go to the park there is a probability of 0.75 that the dog will bark. (i) Find the probability that they go to the park on more than 5 of the next 7 days. [2] (ii) Find the probability that the dog barks on any particular day. [2] (iii) Find the variance of the number of times they go to the park in 30 days. [1]
Mark scheme: 3 (i) P(> 5) = 7C6(0.6)6(0.4) + (0.6)7 M1 Summing 2 or 3 binomial probs of the form = 0.1306 + 0.02799 7Cr(0.6)r(0.4)7–r = 0.159 A1 Correct answer [2] (ii) P(bark) = P(park, bark) + P(not park, bark) M1 Summing two appropriate 2-factor = 0.6 × 0.35 + 0.4 × 0.75 probabilities = 0.51 A1 Correct answer [2] (iii) Variance (number of times) = 7.2 B1 Correct final answer [1] GCE AS/A LEVEL – May/June 2010 9709 63
Q4 · Three identical cans of cola, 2 identical cans of green tea and 2 identical cans of…
4 Three identical cans of cola, 2 identical cans of green tea and 2 identical cans of orange juice are arranged in a row. Calculate the number of arrangements if (i) the first and last cans in the row are the same type of drink, [3] (ii) the 3 cans of cola are all next to each other and the 2 cans of green tea are not next to each other. [5]
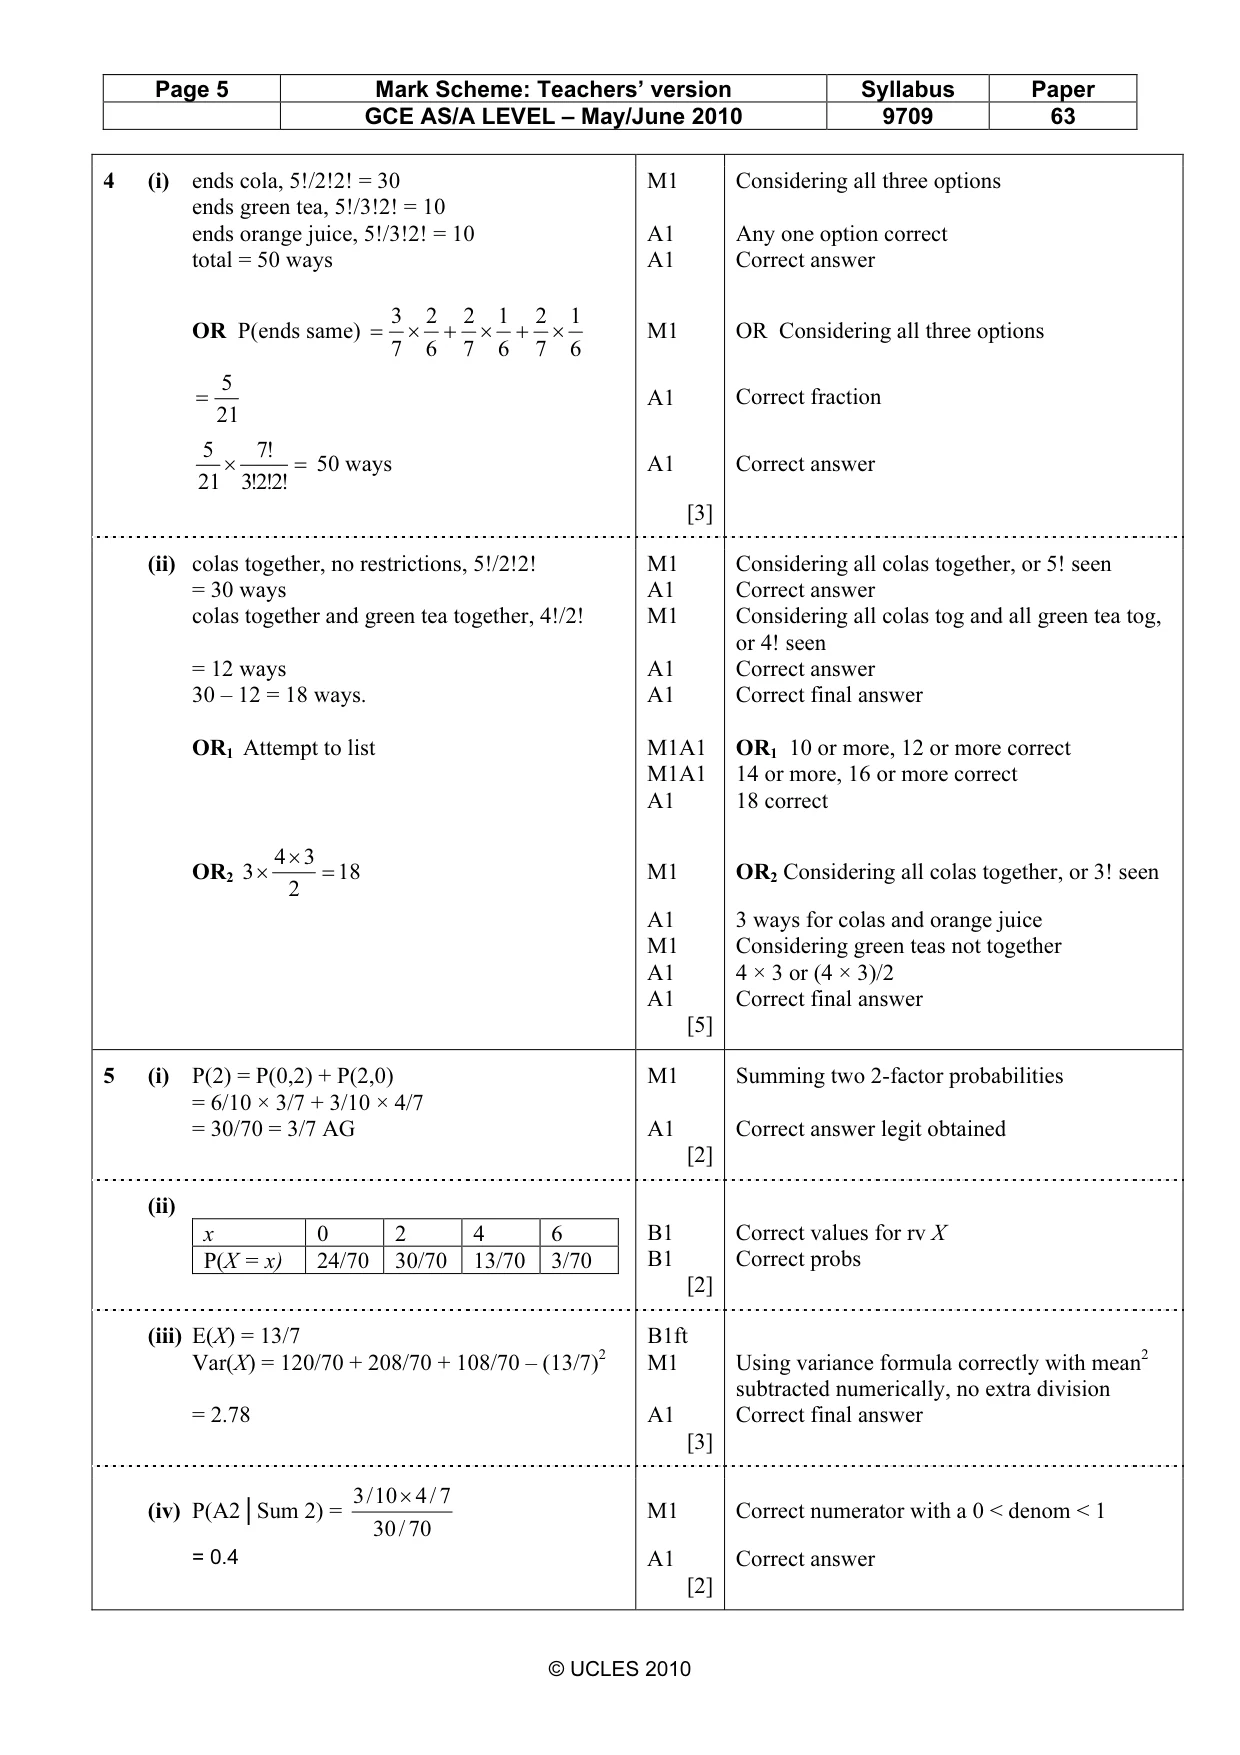
Mark scheme: 4 (i) ends cola, 5!/2!2! = 30 M1 Considering all three options ends green tea, 5!/3!2! = 10 ends orange juice, 5!/3!2! = 10 A1 Any one option correct total = 50 ways A1 Correct answer 3 2 2 1 2 1 OR P(ends same) = × + × + × M1 OR Considering all three options 7 6 7 6 7 6 5 = A1 Correct fraction 21 5 !7 × = 50 ways A1 Correct answer 21 !2!2!3 [3] (ii) colas together, no restrictions, 5!/2!2! M1 Considering all colas together, or 5! seen = 30 ways A1 Correct answer colas together and green tea together, 4!/2! M1 Considering all colas tog and all green tea tog, or 4! seen = 12 ways A1 Correct answer 30 – 12 = 18 ways. A1 Correct final answer OR1 Attempt to list M1A1 OR1 10 or more, 12 or more correct M1A1 14 or more, 16 or more correct A1 18 correct 4 × 3 OR2 3 × = 18 M1 OR2 Considering all colas together, or 3! seen 2 A1 3 ways for colas and orange juice M1 Considering green teas not together A1 4 × 3 or (4 × 3)/2 A1 Correct final answer [5]
Q5 · Set A consists of the ten digits 0, 0, 0, 0, 0, 0, 2, 2, 2, 4
5 Set A consists of the ten digits 0, 0, 0, 0, 0, 0, 2, 2, 2, 4. Set B consists of the seven digits 0, 0, 0, 0, 2, 2, 2. One digit is chosen at random from each set. The random variable X is defined as the sum of these two digits. (i) Show that P(X = 2) = 37. [2] (ii) Tabulate the probability distribution of X. [2] (iii) Find E(X) and Var(X). [3] (iv) Given that X = 2, find the probability that the digit chosen from set A was 2. [2]
Mark scheme: 5 (i) P(2) = P(0,2) + P(2,0) M1 Summing two 2-factor probabilities = 6/10 × 3/7 + 3/10 × 4/7 = 30/70 = 3/7 AG A1 Correct answer legit obtained [2] (ii) x 0 2 4 6 B1 Correct values for rv X P(X = x) 24/70 30/70 13/70 3/70 B1 Correct probs [2] (iii) E(X) = 13/7 B1ft Var(X) = 120/70 + 208/70 + 108/70 – (13/7)2 M1 Using variance formula correctly with mean2 subtracted numerically, no extra division = 2.78 A1 Correct final answer [3] 3 / 10 × 4 / 7 (iv) P(A2│Sum 2) = M1 Correct numerator with a 0 < denom < 1 30 / 70 = 0.4 A1 Correct answer [2] GCE AS/A LEVEL – May/June 2010 9709 63
Q6 · The lengths of some insects of the same type from two countries, X and Y, were measured
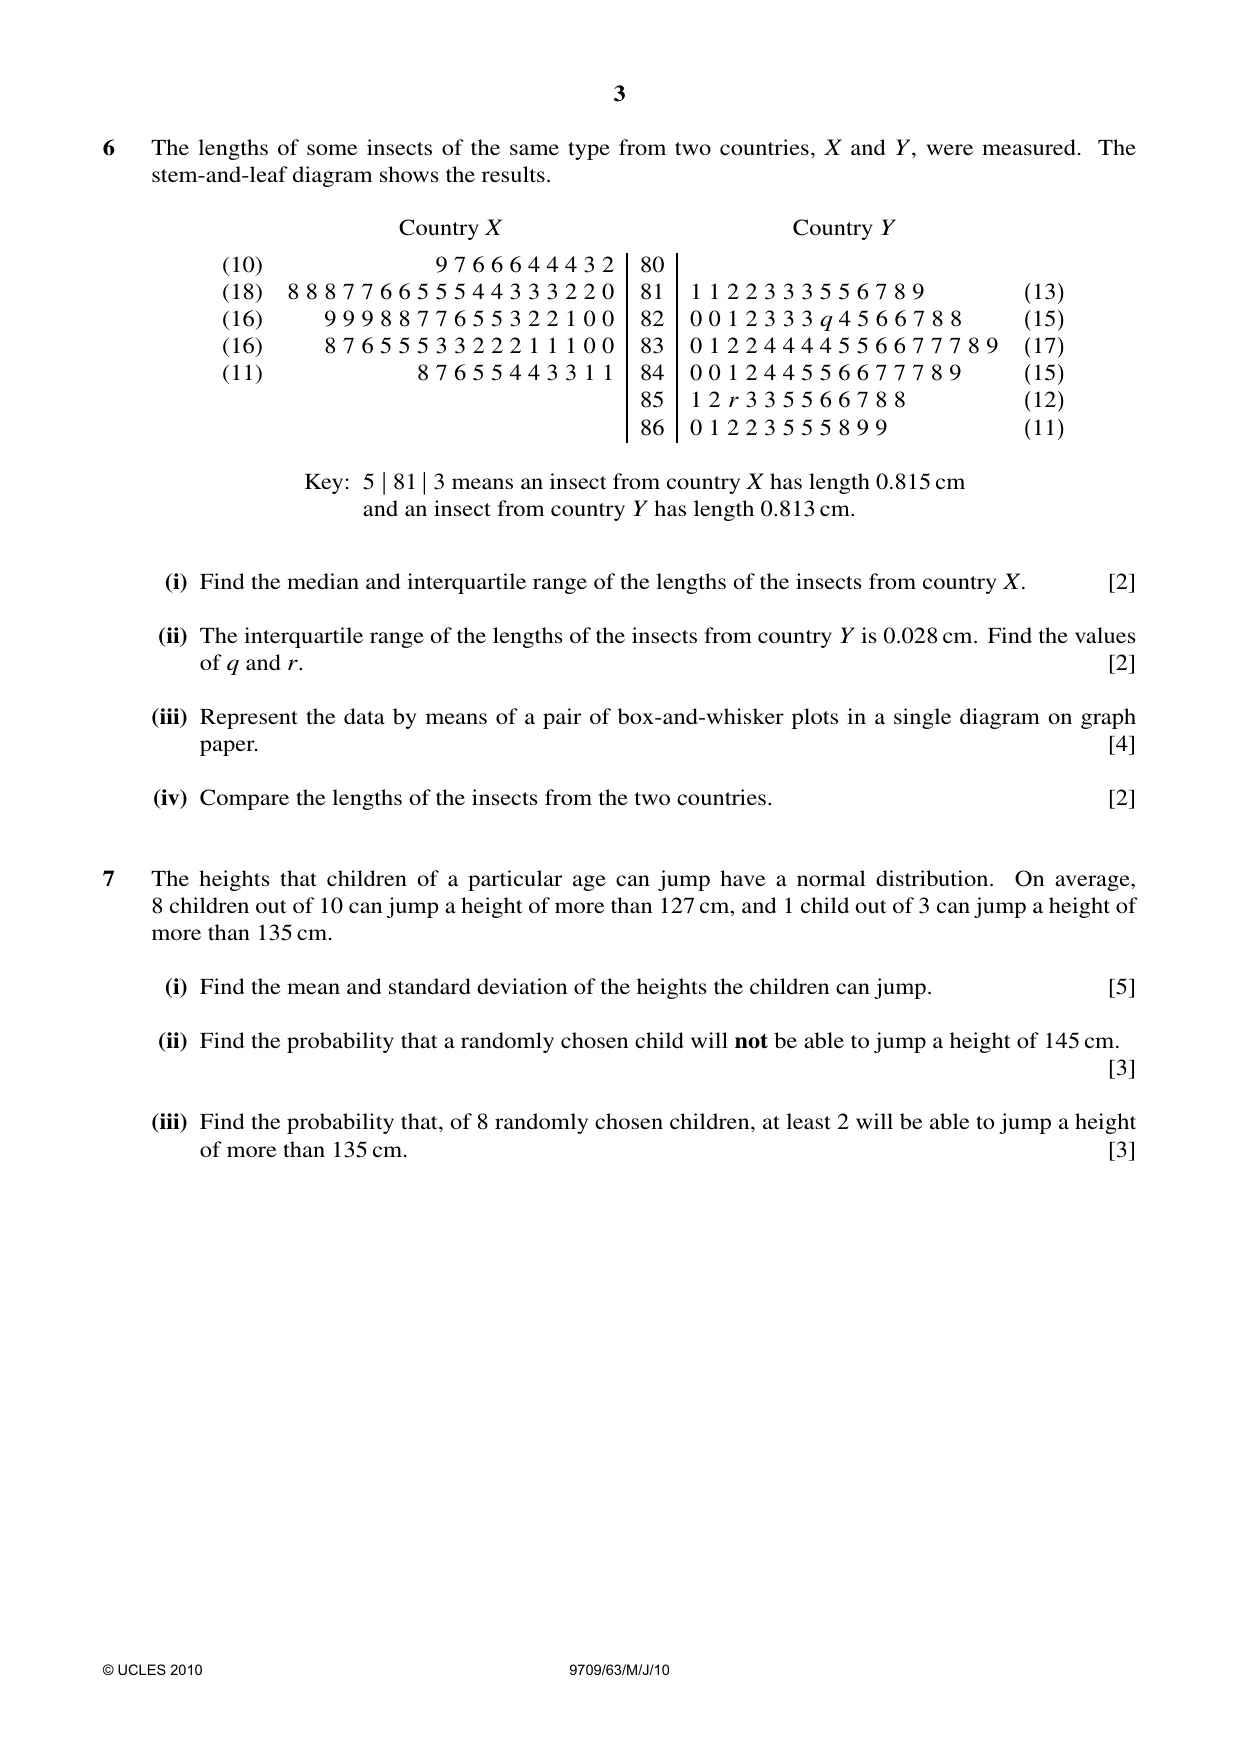
6 The lengths of some insects of the same type from two countries, X and Y, were measured. The stem-and-leaf diagram shows the results. Country X Country Y (10) 9 7 6 6 6 4 4 4 3 2 80 (18) 8 8 8 7 7 6 6 5 5 5 4 4 3 3 3 2 2 0 81 1 1 2 2 3 3 3 5 5 6 7 8 9 (13) (16) 9 9 9 8 8 7 7 6 5 5 3 2 2 1 0 0 82 0 0 1 2 3 3 3 q 4 5 6 6 7 8 8 (15) (16) 8 7 6 5 5 5 3 3 2 2 2 1 1 1 0 0 83 0 1 2 2 4 4 4 4 5 5 6 6 7 7 7 8 9 (17) (11) 8 7 6 5 5 4 4 3 3 1 1 84 0 0 1 2 4 4 5 5 6 6 7 7 7 8 9 (15) 85 1 2 r 3 3 5 5 6 6 7 8 8 (12) 86 0 1 2 2 3 5 5 5 8 9 9 (11) Key: 5 | 81 | 3 means an insect from country X has length 0.815 cm and an insect from country Y has length 0.813 cm. (i) Find the median and interquartile range of the lengths of the insects from country X. [2] (ii) The interquartile range of the lengths of the insects from country Y is 0.028 cm. Find the values of q and r. [2] (iii) Represent the data by means of a pair of box-and-whisker plots in a single diagram on graph paper. [4] (iv) Compare the lengths of the insects from the two countries. [2]
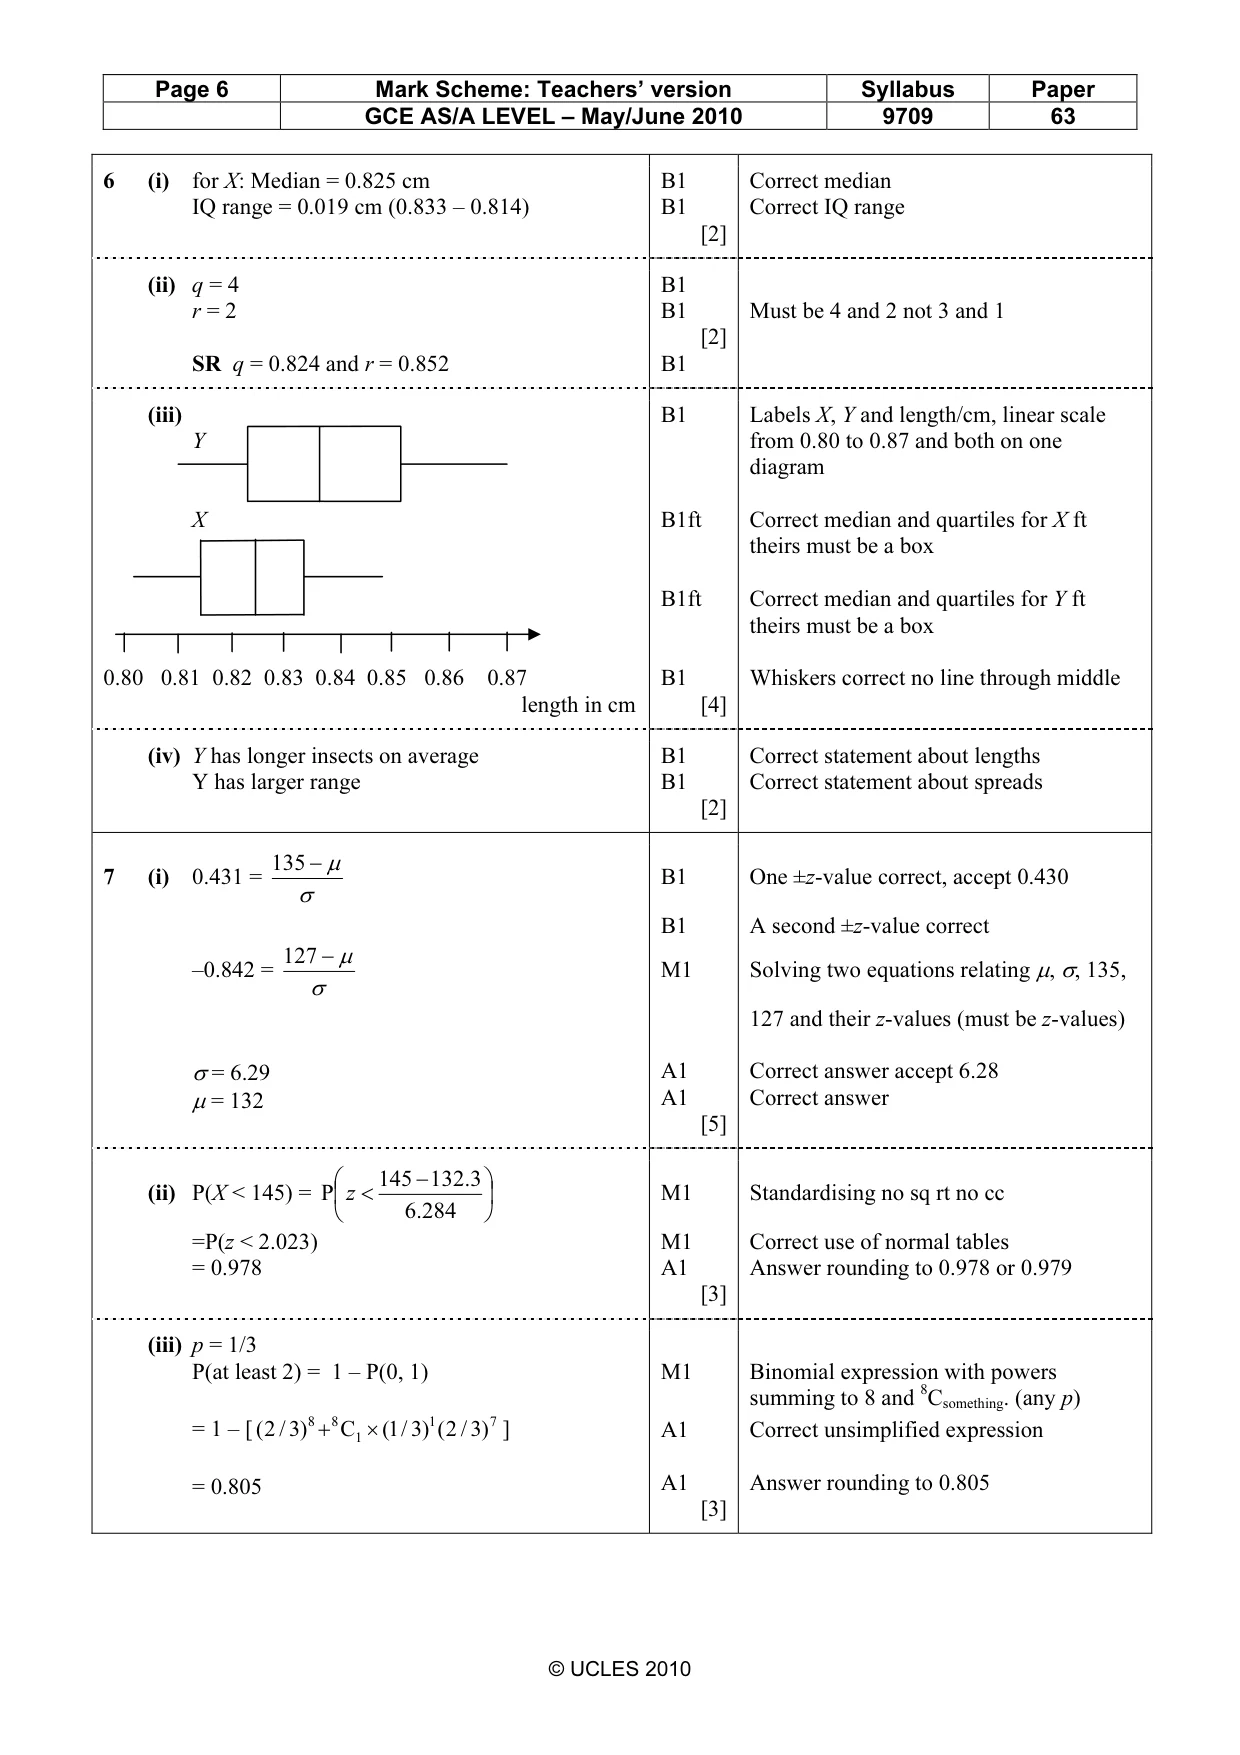
Mark scheme: 6 (i) for X: Median = 0.825 cm B1 Correct median IQ range = 0.019 cm (0.833 – 0.814) B1 Correct IQ range [2] (ii) q = 4 B1 r = 2 B1 Must be 4 and 2 not 3 and 1 [2] SR q = 0.824 and r = 0.852 B1 (iii) B1 Labels X, Y and length/cm, linear scale Y from 0.80 to 0.87 and both on one diagram X B1ft Correct median and quartiles for X ft theirs must be a box B1ft Correct median and quartiles for Y ft theirs must be a box 0.80 0.81 0.82 0.83 0.84 0.85 0.86 0.87 B1 Whiskers correct no line through middle length in cm [4] (iv) Y has longer insects on average B1 Correct statement about lengths Y has larger range B1 Correct statement about spreads [2] 135 − µ
Q7 · The heights that children of a particular age can jump have a normal distribution
7 The heights that children of a particular age can jump have a normal distribution. On average, 8 children out of 10 can jump a height of more than 127 cm, and 1 child out of 3 can jump a height of more than 135 cm. (i) Find the mean and standard deviation of the heights the children can jump. [5] (ii) Find the probability that a randomly chosen child will not be able to jump a height of 145 cm. [3] (iii) Find the probability that, of 8 randomly chosen children, at least 2 will be able to jump a height of more than 135 cm. [3]
Mark scheme: 135 µ 7 (i) 0.431 = B1 One ±z-value correct, accept 0.430 σ B1 A second ±z-value correct 127 − µ –0.842 = M1 Solving two equations relating µ, σ, 135, σ 127 and their z-values (must be z-values) σ = 6.29 A1 Correct answer accept 6.28 µ = 132 A1 Correct answer [5] 145 − 1323. (ii) P(X < 145) = P z < M1 Standardising no sq rt no cc .6 284 =P(z < 2.023) M1 Correct use of normal tables = 0.978 A1 Answer rounding to 0.978 or 0.979 [3] (iii) p = 1/3 P(at least 2) = 1 – P(0, 1) M1 Binomial expression with powers summing to 8 and 8Csomething. (any p) = 1 – [ ( 2 / 3) 8 + 8 C1 × 1( / 3)1 ( 2 / 3) 7 ] A1 Correct unsimplified expression = 0.805 A1 Answer rounding to 0.805 [3]
What was in this paper
The subtopics covered by these 7 questions, and how many questions each got. Open one in a new tab to see every Cambridge question on it.
What you needed in this session
Cambridge’s own grade thresholds for 2010 May/June, Paper 6 · Variant 3. A higher threshold means an easier paper — the bar moves with how the cohort did.