Cambridge A Level Mathematics 9709 — 2008 Oct/Nov Paper 6 · Variant 1
9709/61/O/N/08 · 7 questions · 50 marks · ≈56 min
The question paper and its mark scheme, free to read here and free to download. This is Cambridge’s own paper, exactly as it was sat.
Question paper4 pages

Mark scheme7 pages
Answers below. Sit the paper first if you are practising.
Questions as text
Q1 · Rachel measured the lengths in millimetres of some of the leaves on a tree
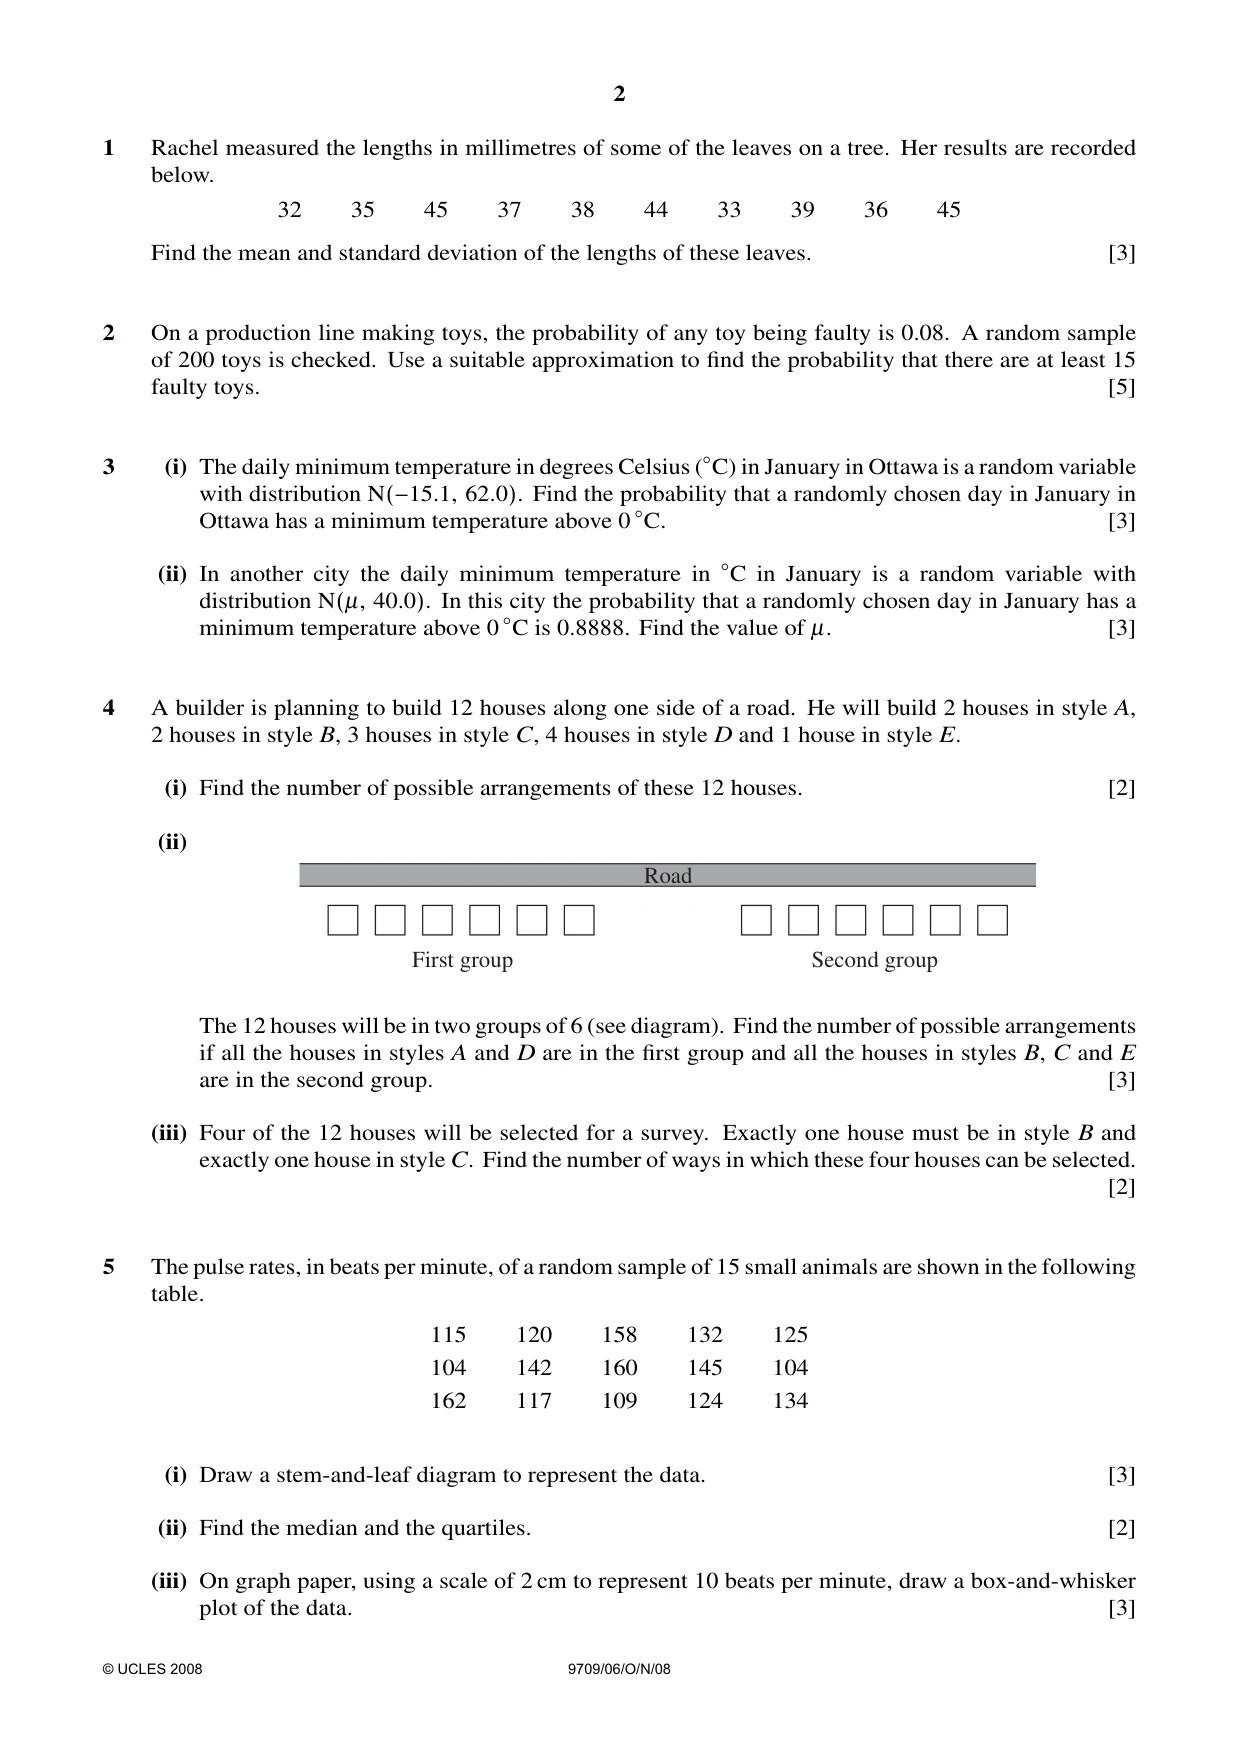
1 Rachel measured the lengths in millimetres of some of the leaves on a tree. Her results are recorded below. 32 35 45 37 38 44 33 39 36 45 Find the mean and standard deviation of the lengths of these leaves. [3]
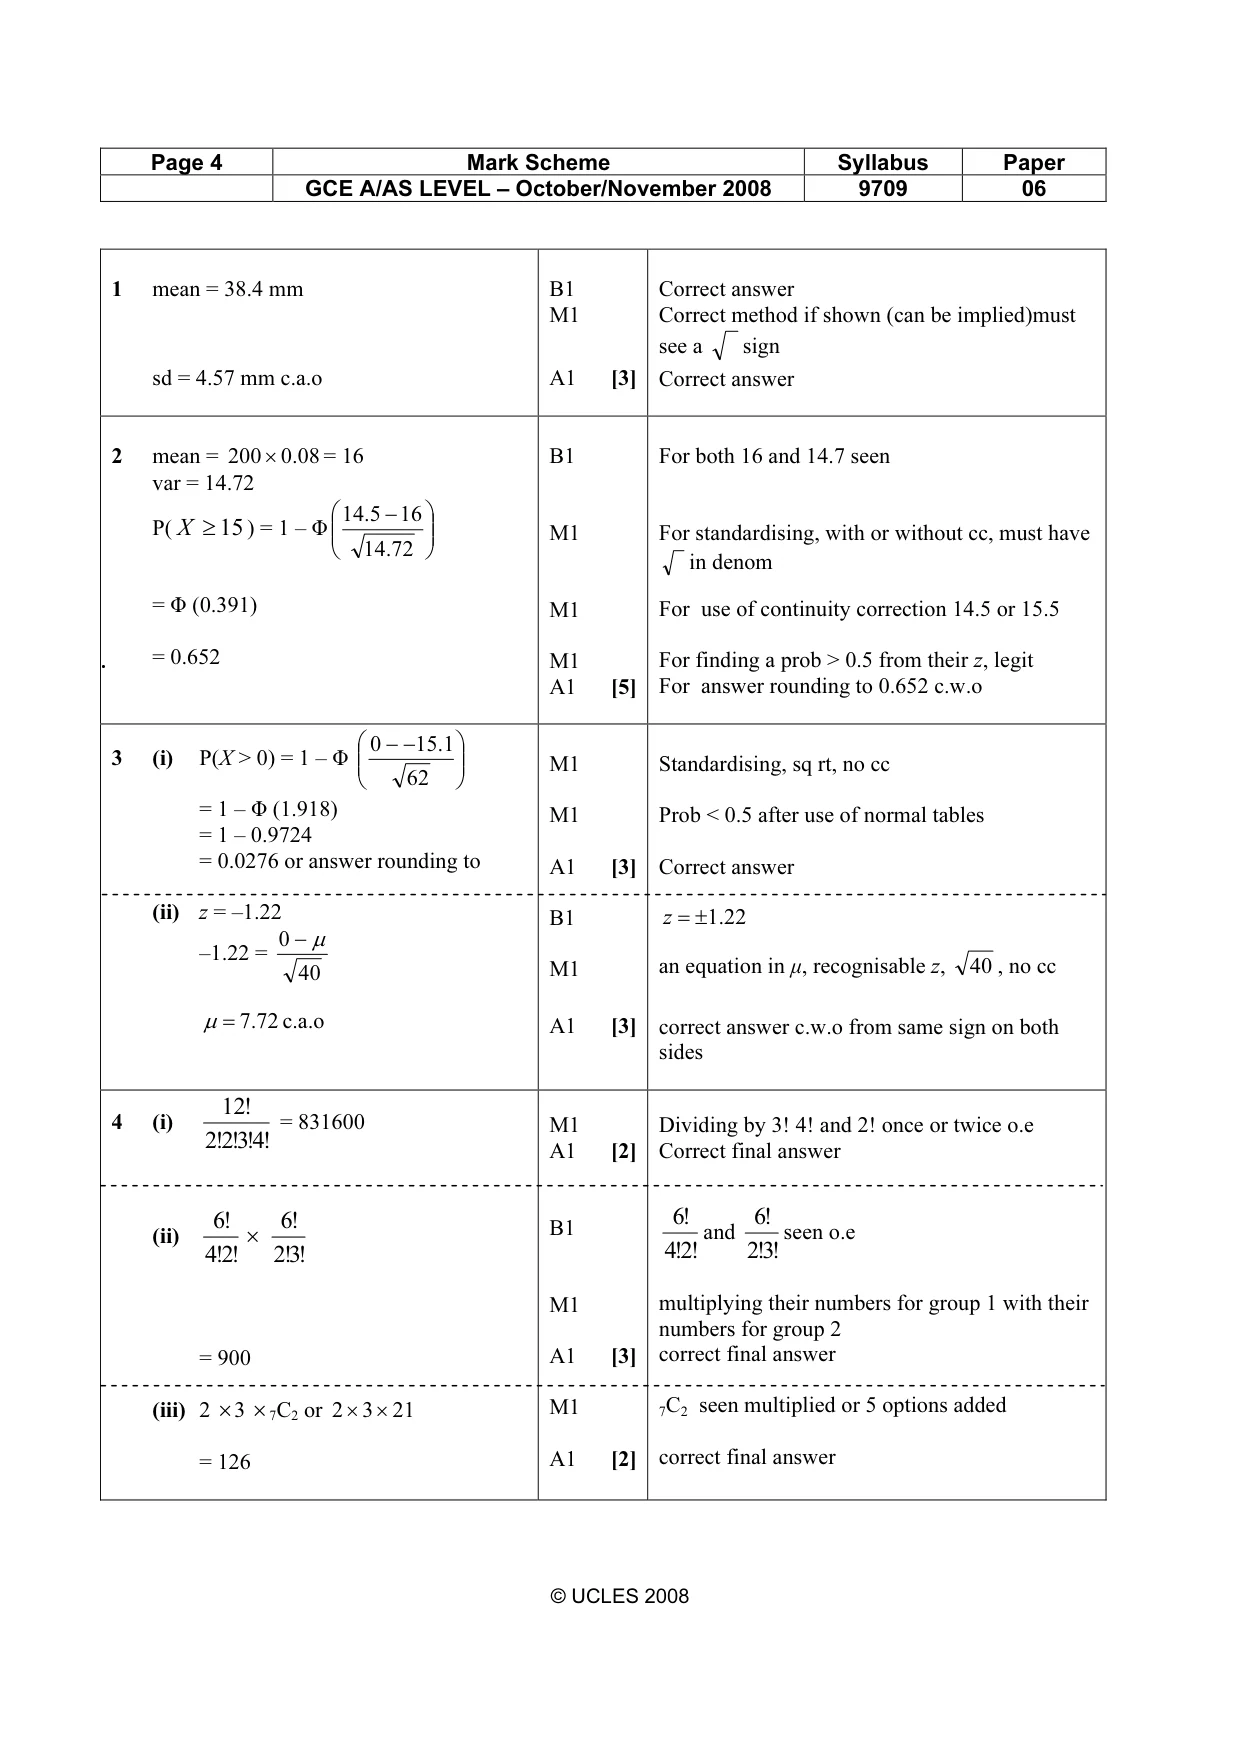
Mark scheme: 1 mean = 38.4 mm B1 Correct answer M1 Correct method if shown (can be implied)must see a sign sd = 4.57 mm c.a.o A1 [3] Correct answer
Q2 · On a production line making toys, the probability of any toy being faulty is 0.08
2 On a production line making toys, the probability of any toy being faulty is 0.08. A random sample of 200 toys is checked. Use a suitable approximation to find the probability that there are at least 15 faulty toys. [5]
Mark scheme: 2 mean = 200× .0 08 = 16 B1 For both 16 and 14.7 seen var = 14.72 145. − 16 P( X ≥ 15 ) = 1 – Φ M1 For standardising, with or without cc, must have 14 .72 in denom = Φ (0.391) M1 For use of continuity correction 14.5 or 15.5 = 0.652 M1 For finding a prob > 0.5 from their z, legit A1 [5] For answer rounding to 0.652 c.w.o 0 − −15 1
Q3 · The daily minimum temperature in degrees Celsius (◦C) in January in Ottawa is a random…
3 (i) The daily minimum temperature in degrees Celsius (◦C) in January in Ottawa is a random variable with distribution N(−15.1, 62.0). Find the probability that a randomly chosen day in January in Ottawa has a minimum temperature above 0 ◦C. [3] (ii) In another city the daily minimum temperature in ◦C in January is a random variable with distribution N(µ, 40.0). In this city the probability that a randomly chosen day in January has a minimum temperature above 0 ◦C is 0.8888. Find the value of µ. [3]
Mark scheme: 0 151. 3 (i) P(X > 0) = 1 – Φ M1 Standardising, sq rt, no cc 62 = 1 – Φ (1.918) M1 Prob < 0.5 after use of normal tables = 1 – 0.9724 = 0.0276 or answer rounding to A1 [3] Correct answer (ii) z = –1.22 B1 z = ±.1 22 0 − µ –1.22 = 40 M1 an equation in µ, recognisable z, 40 , no cc µ = .772 c.a.o A1 [3] correct answer c.w.o from same sign on both sides 12!
Q4 · A builder is planning to build 12 houses along one side of a road
4 A builder is planning to build 12 houses along one side of a road. He will build 2 houses in style A, 2 houses in style B, 3 houses in style C, 4 houses in style D and 1 house in style E. (i) Find the number of possible arrangements of these 12 houses. [2] (ii) Road First group Second group The 12 houses will be in two groups of 6 (see diagram). Find the number of possible arrangements if all the houses in styles A and D are in the first group and all the houses in styles B, C and E are in the second group. [3] (iii) Four of the 12 houses will be selected for a survey. Exactly one house must be in style B and exactly one house in style C. Find the number of ways in which these four houses can be selected. [2]
Mark scheme: 12! 4 (i) = 831600 M1 Dividing by 3! 4! and 2! once or twice o.e !4!3!2!2 A1 [2] Correct final answer !6 !6 !6 !6 (ii) × B1 and seen o.e !2!4 !3!2 !2!4 !3!2 M1 multiplying their numbers for group 1 with their numbers for group 2 = 900 A1 [3] correct final answer (iii) 2 ×3 × 7C2 or 2 × 3 × 21 M1 7C2 seen multiplied or 5 options added = 126 A1 [2] correct final answer GCE A/AS LEVEL – October/November 2008 9709 06
Q5 · The pulse rates, in beats per minute, of a random sample of 15 small animals are shown in…
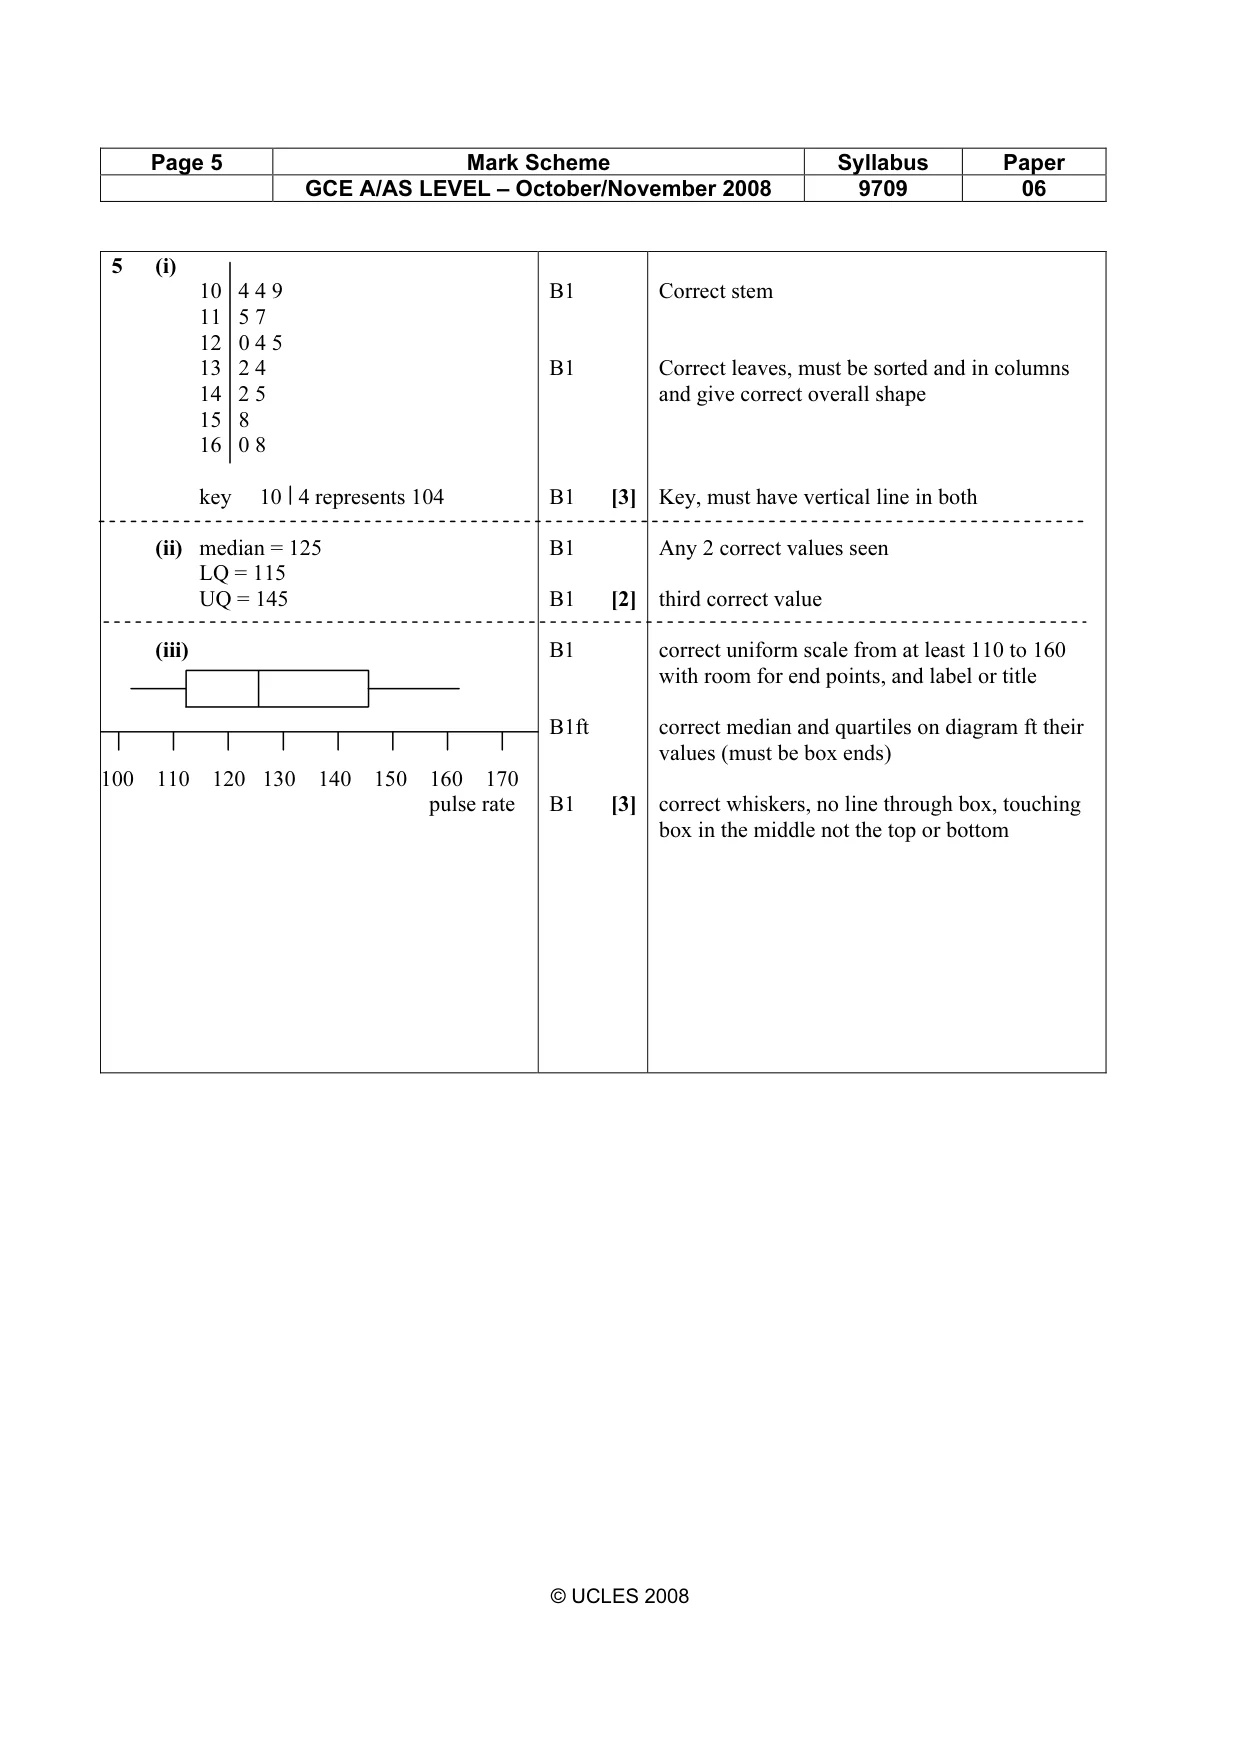
5 The pulse rates, in beats per minute, of a random sample of 15 small animals are shown in the following table. 115 120 158 132 125 104 142 160 145 104 162 117 109 124 134 (i) Draw a stem-and-leaf diagram to represent the data. [3] (ii) Find the median and the quartiles. [2] (iii) On graph paper, using a scale of 2 cm to represent 10 beats per minute, draw a box-and-whisker plot of the data. [3]
Mark scheme: 5 (i) 10 4 4 9 B1 Correct stem 11 5 7 12 0 4 5 13 2 4 B1 Correct leaves, must be sorted and in columns 14 2 5 and give correct overall shape 15 8 16 0 8 key 10 4 represents 104 B1 [3] Key, must have vertical line in both (ii) median = 125 B1 Any 2 correct values seen LQ = 115 UQ = 145 B1 [2] third correct value (iii) B1 correct uniform scale from at least 110 to 160 with room for end points, and label or title B1ft correct median and quartiles on diagram ft their values (must be box ends) 100 110 120 130 140 150 160 170 pulse rate B1 [3] correct whiskers, no line through box, touching box in the middle not the top or bottom GCE A/AS LEVEL – October/November 2008 9709 06
Q6 · There are three sets of traffic lights on Karinne’s journey to work
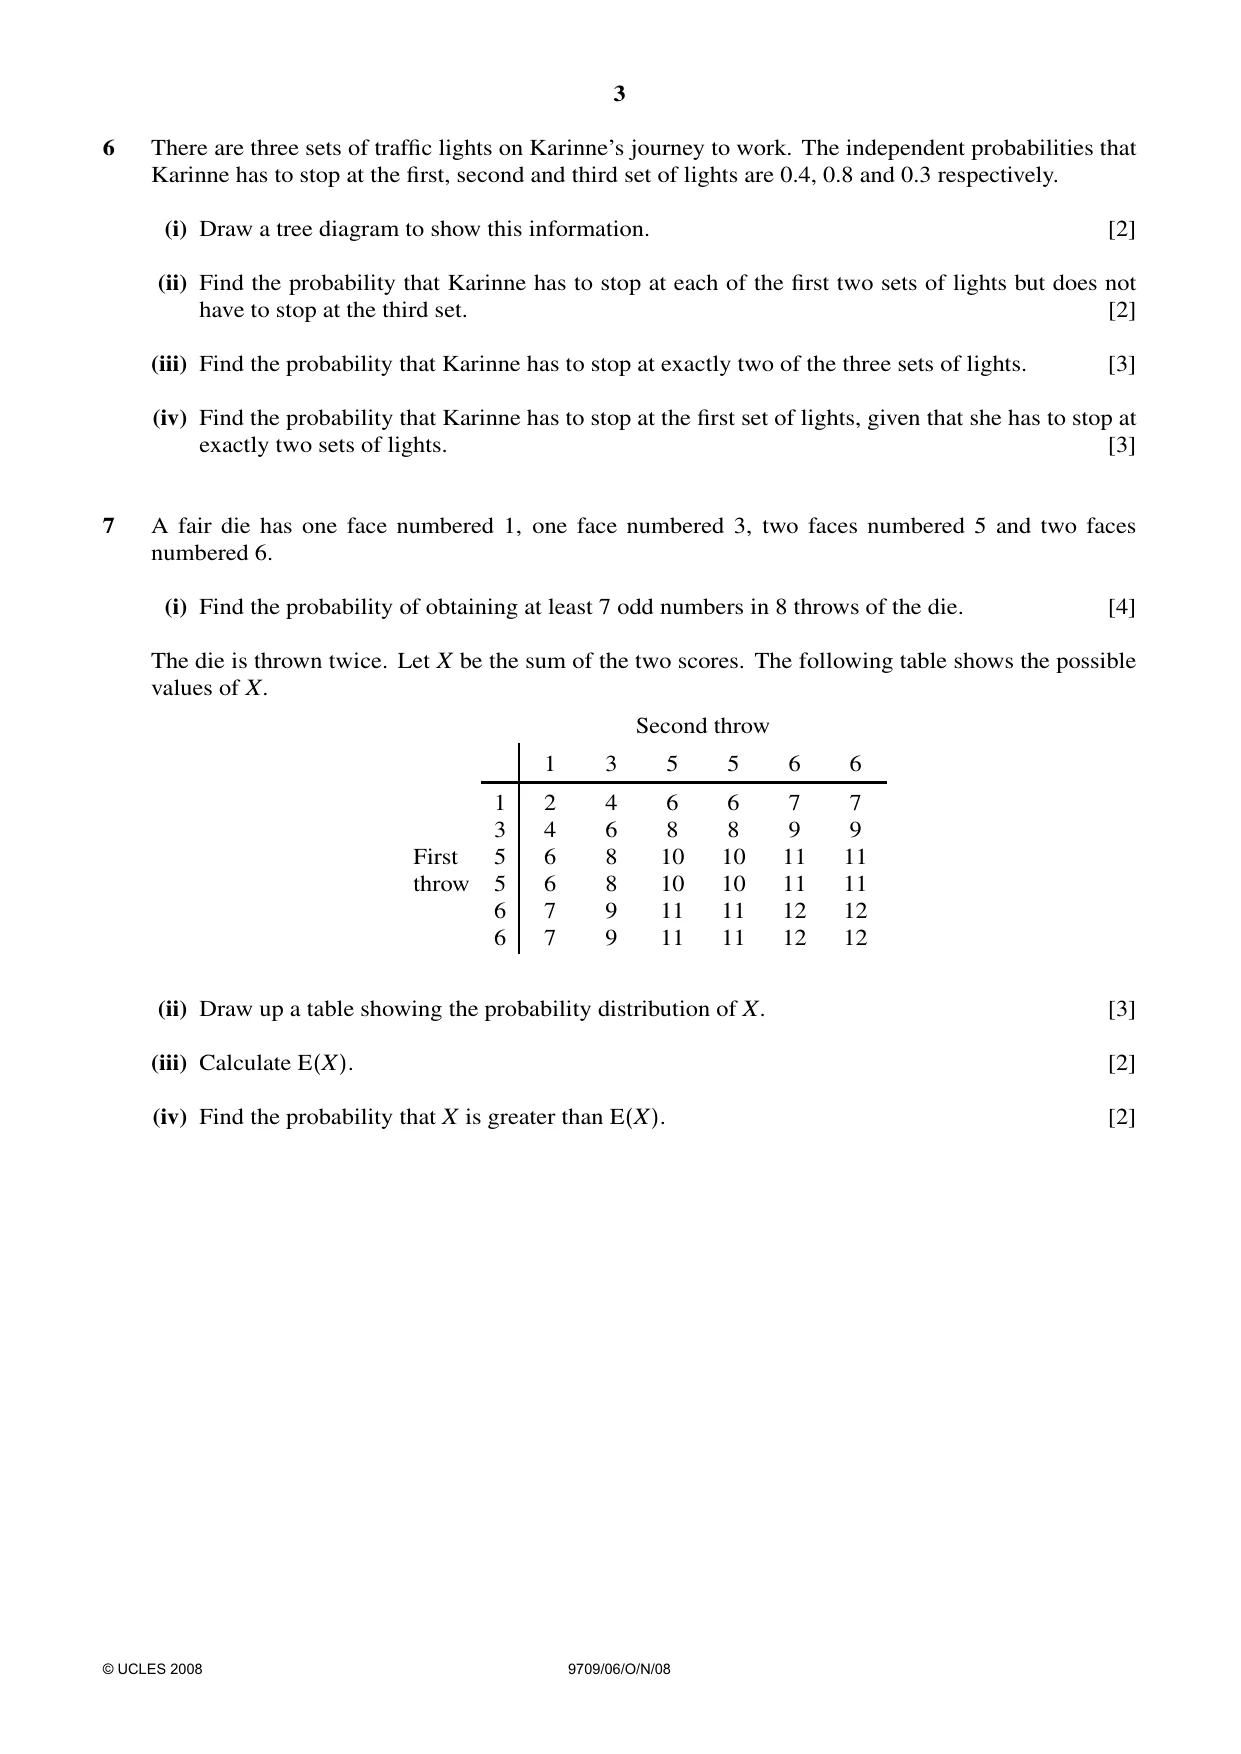
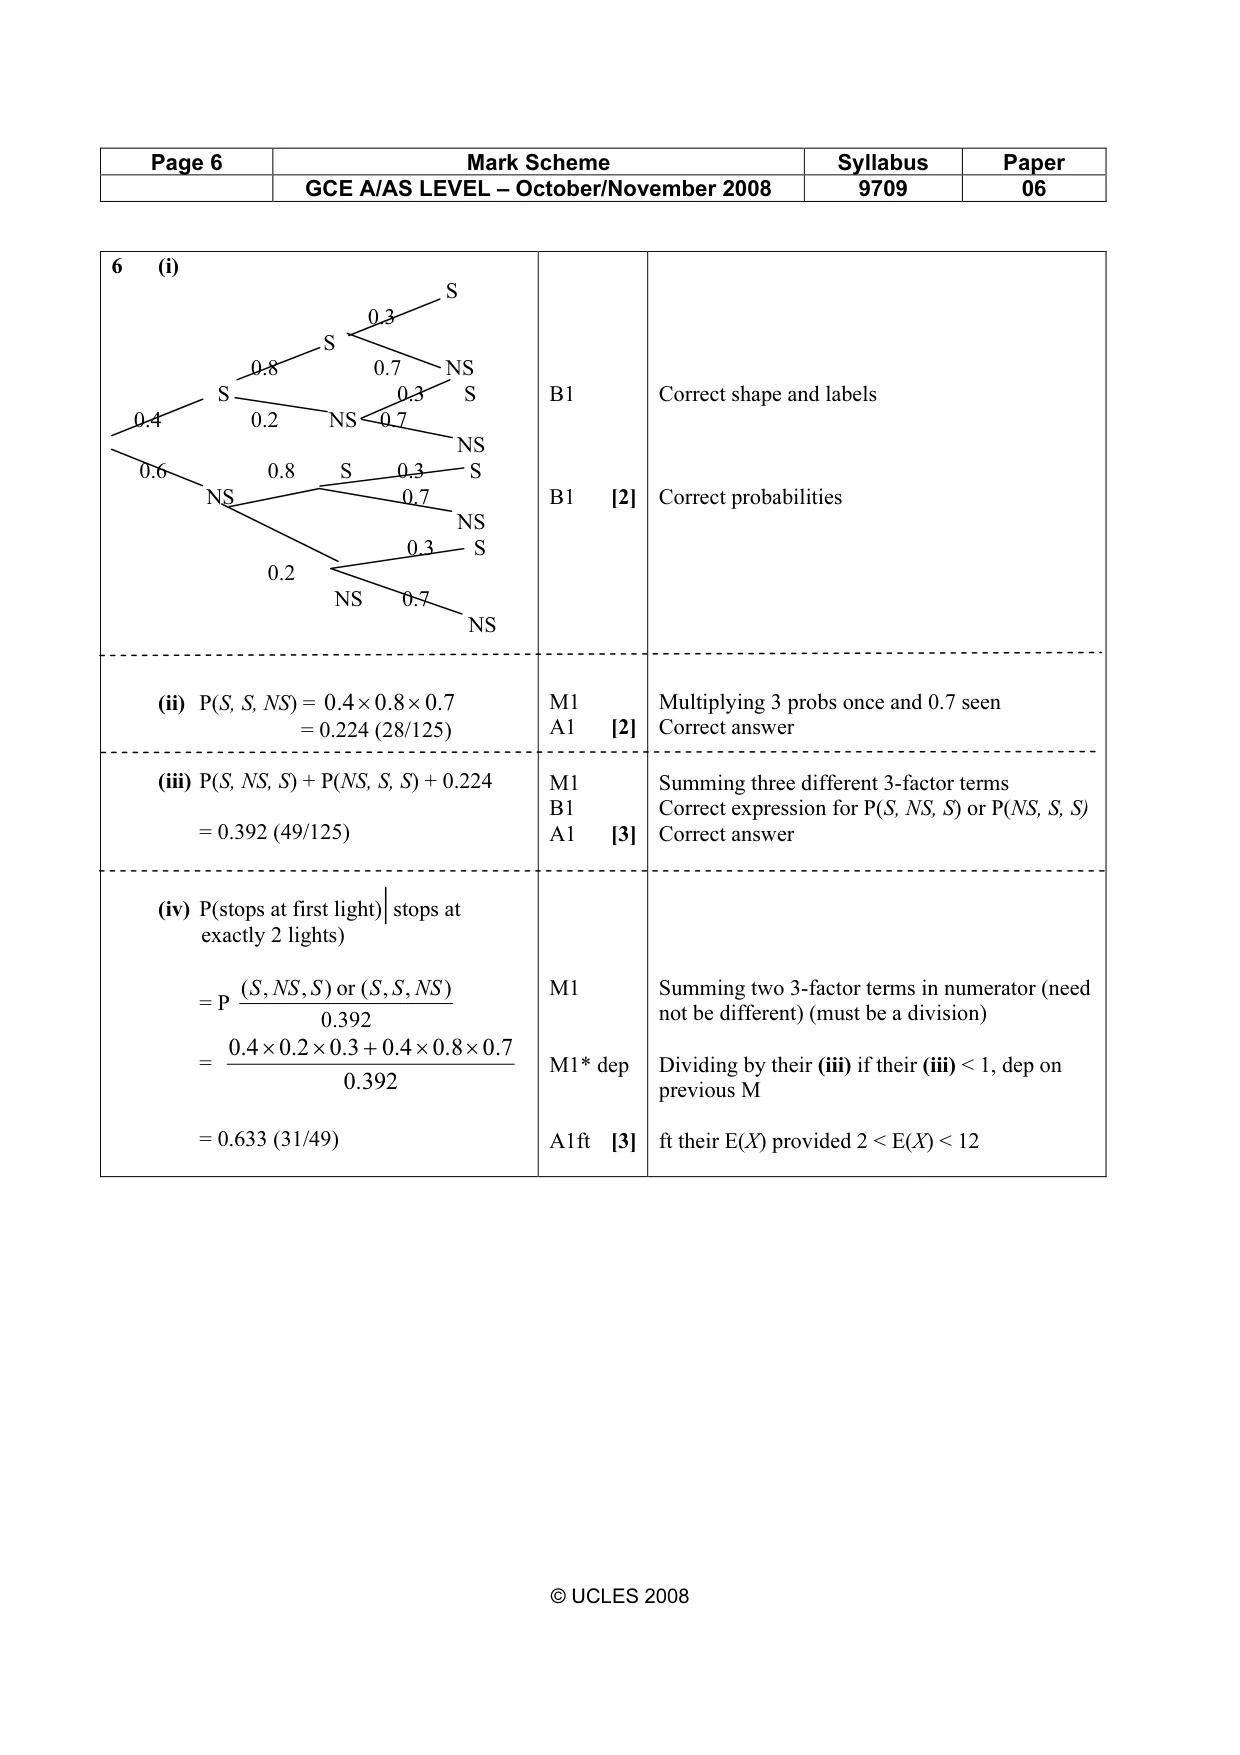
6 There are three sets of traffic lights on Karinne’s journey to work. The independent probabilities that Karinne has to stop at the first, second and third set of lights are 0.4, 0.8 and 0.3 respectively. (i) Draw a tree diagram to show this information. [2] (ii) Find the probability that Karinne has to stop at each of the first two sets of lights but does not have to stop at the third set. [2] (iii) Find the probability that Karinne has to stop at exactly two of the three sets of lights. [3] (iv) Find the probability that Karinne has to stop at the first set of lights, given that she has to stop at exactly two sets of lights. [3]
Mark scheme: 6 (i) S 0.3 S 0.8 0.7 NS S 0.3 S B1 Correct shape and labels 0.4 0.2 NS 0.7 NS 0.6 0.8 S 0.3 S NS 0.7 B1 [2] Correct probabilities NS 0.3 S 0.2 NS 0.7 NS (ii) P(S, S, NS) = 4.0 × 8.0 × 7.0 M1 Multiplying 3 probs once and 0.7 seen = 0.224 (28/125) A1 [2] Correct answer (iii) P(S, NS, S) + P(NS, S, S) + 0.224 M1 Summing three different 3-factor terms B1 Correct expression for P(S, NS, S) or P(NS, S, S) = 0.392 (49/125) A1 [3] Correct answer (iv) P(stops at first light) stops at exactly 2 lights) ( S , NS , S ) or ( S , S , NS ) M1 Summing two 3-factor terms in numerator (need = P .0 392 not be different) (must be a division) 4.0 × 2.0 × 3.0 + 4.0 × 8.0 × 7.0 = M1* dep Dividing by their (iii) if their (iii) < 1, dep on .0392 previous M = 0.633 (31/49) A1ft [3] ft their E(X) provided 2 < E(X) < 12 GCE A/AS LEVEL – October/November 2008 9709 06
Q7 · A fair die has one face numbered 1, one face numbered 3, two faces numbered 5 and two…
7 A fair die has one face numbered 1, one face numbered 3, two faces numbered 5 and two faces numbered 6. (i) Find the probability of obtaining at least 7 odd numbers in 8 throws of the die. [4] The die is thrown twice. Let X be the sum of the two scores. The following table shows the possible values of X. Second throw 1 3 5 5 6 6 1 2 4 6 6 7 7 3 4 6 8 8 9 9 First 5 6 8 10 10 11 11 throw 5 6 8 10 10 11 11 6 7 9 11 11 12 12 6 7 9 11 11 12 12 (ii) Draw up a table showing the probability distribution of X. [3] (iii) Calculate E(X). [2] (iv) Find the probability that X is greater than E(X). [2]
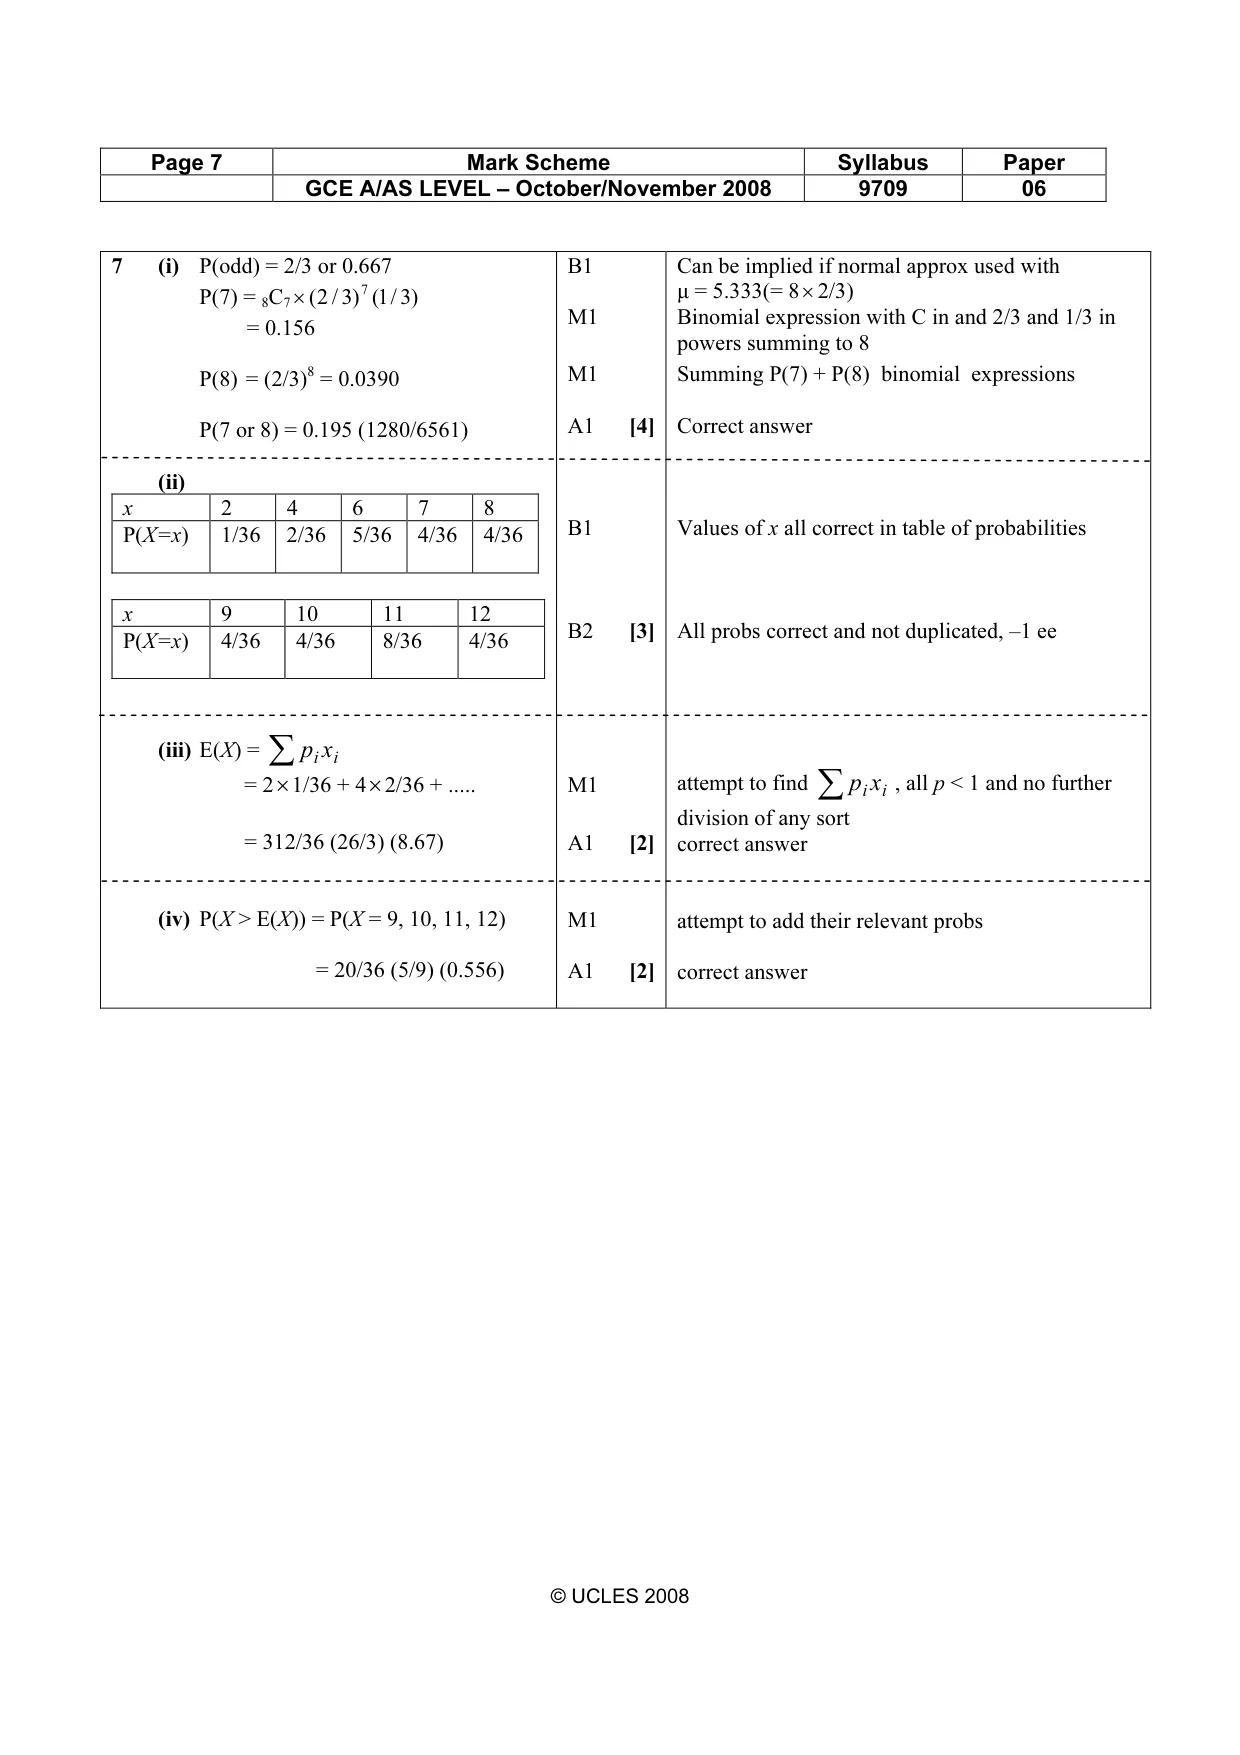
Mark scheme: 7 (i) P(odd) = 2/3 or 0.667 B1 Can be implied if normal approx used with P(7) = 8C7 × ( 2 / 3) 7 1( / 3) µ = 5.333(= 8× 2/3) M1 Binomial expression with C in and 2/3 and 1/3 in = 0.156 powers summing to 8 P(8) = (2/3)8 = 0.0390 M1 Summing P(7) + P(8) binomial expressions P(7 or 8) = 0.195 (1280/6561) A1 [4] Correct answer (ii) x 2 4 6 7 8 B1 Values of x all correct in table of probabilities P(X=x) 1/36 2/36 5/36 4/36 4/36 x 9 10 11 12 B2 [3] All probs correct and not duplicated, –1 ee P(X=x) 4/36 4/36 8/36 4/36 (iii) E(X) = ∑ p ix i , all p < 1 and no further = 2×1/36 + 4×2/36 + ..... M1 attempt to find ∑ p ix i division of any sort = 312/36 (26/3) (8.67) A1 [2] correct answer (iv) P(X > E(X)) = P(X = 9, 10, 11, 12) M1 attempt to add their relevant probs = 20/36 (5/9) (0.556) A1 [2] correct answer
What was in this paper
The subtopics covered by these 7 questions, and how many questions each got. Open one in a new tab to see every Cambridge question on it.
What you needed in this session
Cambridge’s own grade thresholds for 2008 Oct/Nov, Paper 6 · Variant 1. A higher threshold means an easier paper — the bar moves with how the cohort did.