Cambridge A Level Marine Science 9693 — 2025 Oct/Nov Paper 4 · Variant 2
9693/42/O/N/25 · 5 questions · 75 marks · 105 min
The question paper and its mark scheme, free to read here and free to download. This is Cambridge’s own paper, exactly as it was sat.
Question paper20 pages




Mark scheme20 pages
Answers below. Sit the paper first if you are practising.
Questions as text
Q1 · Artificial reefs are often created by sinking old ships
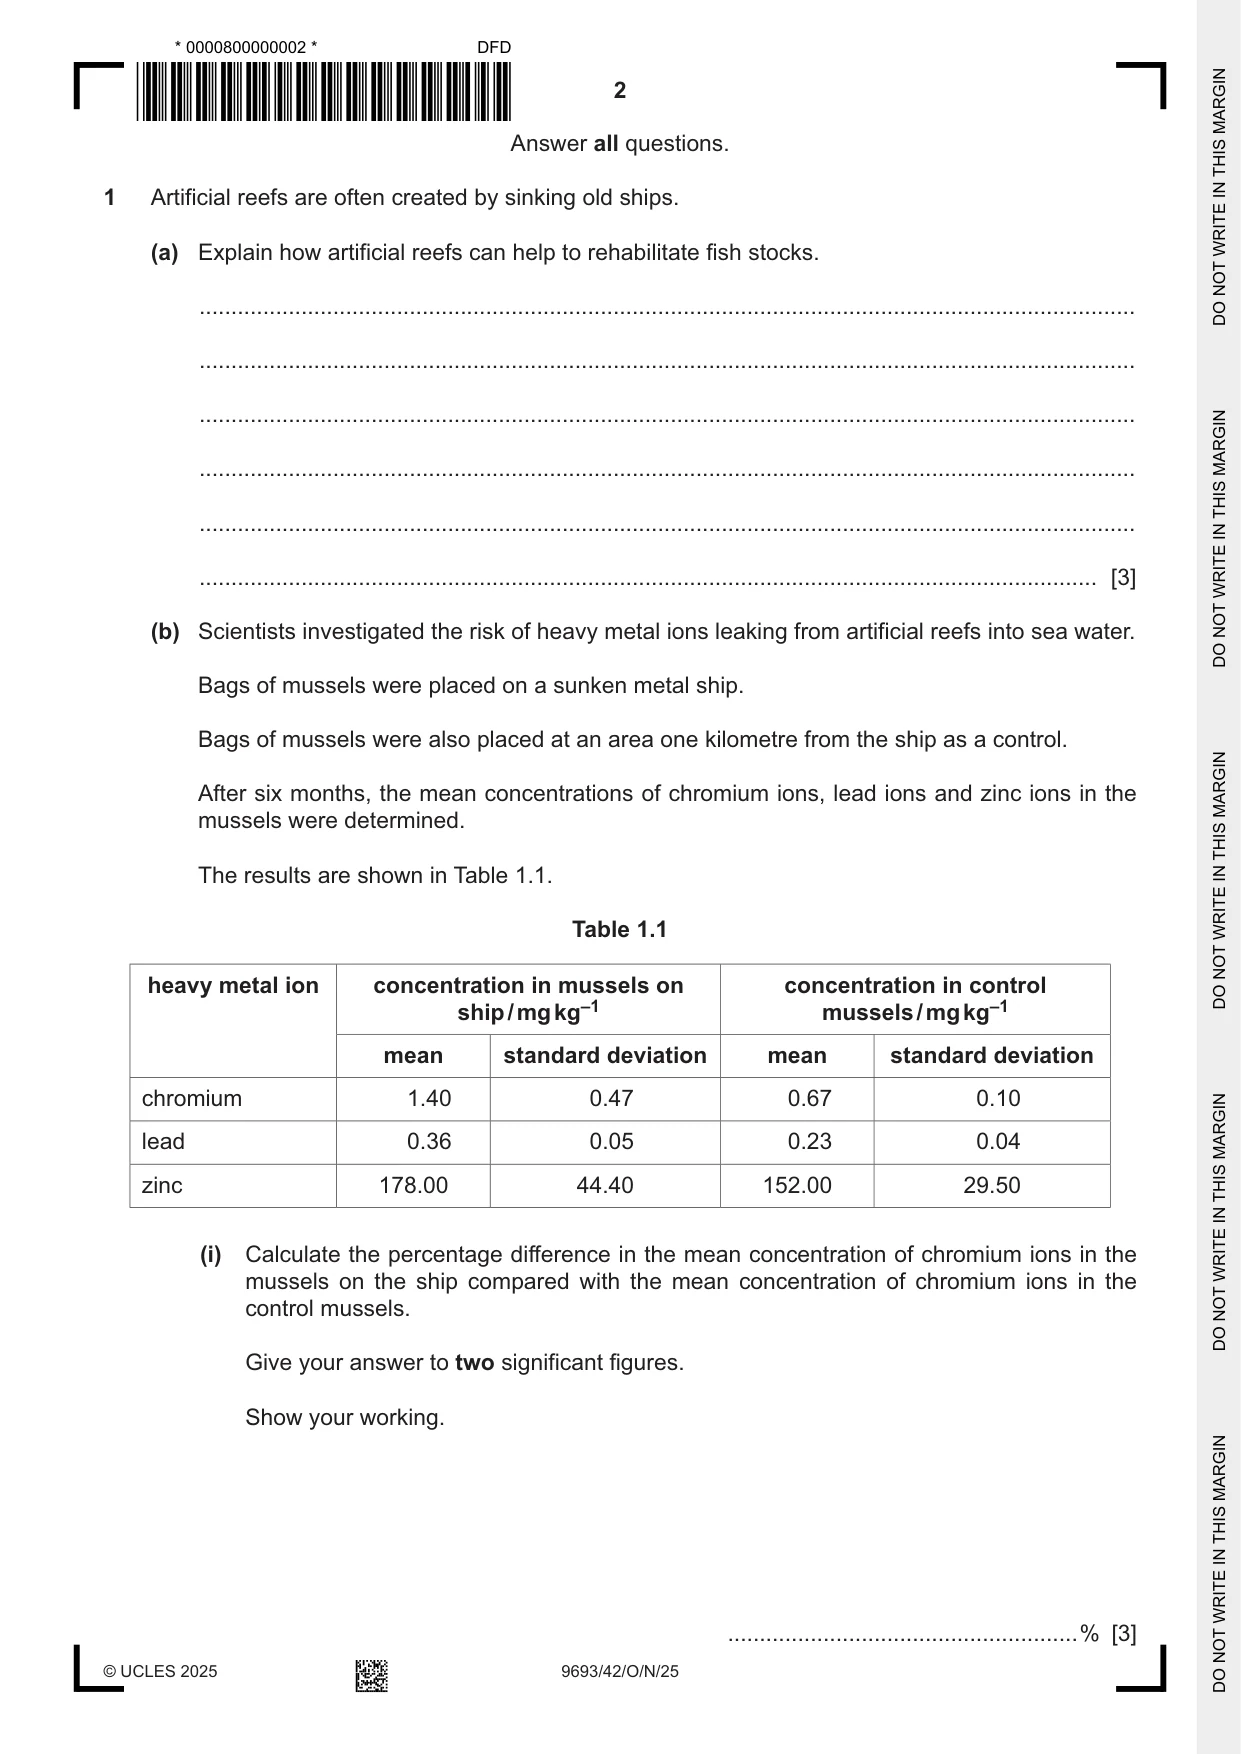
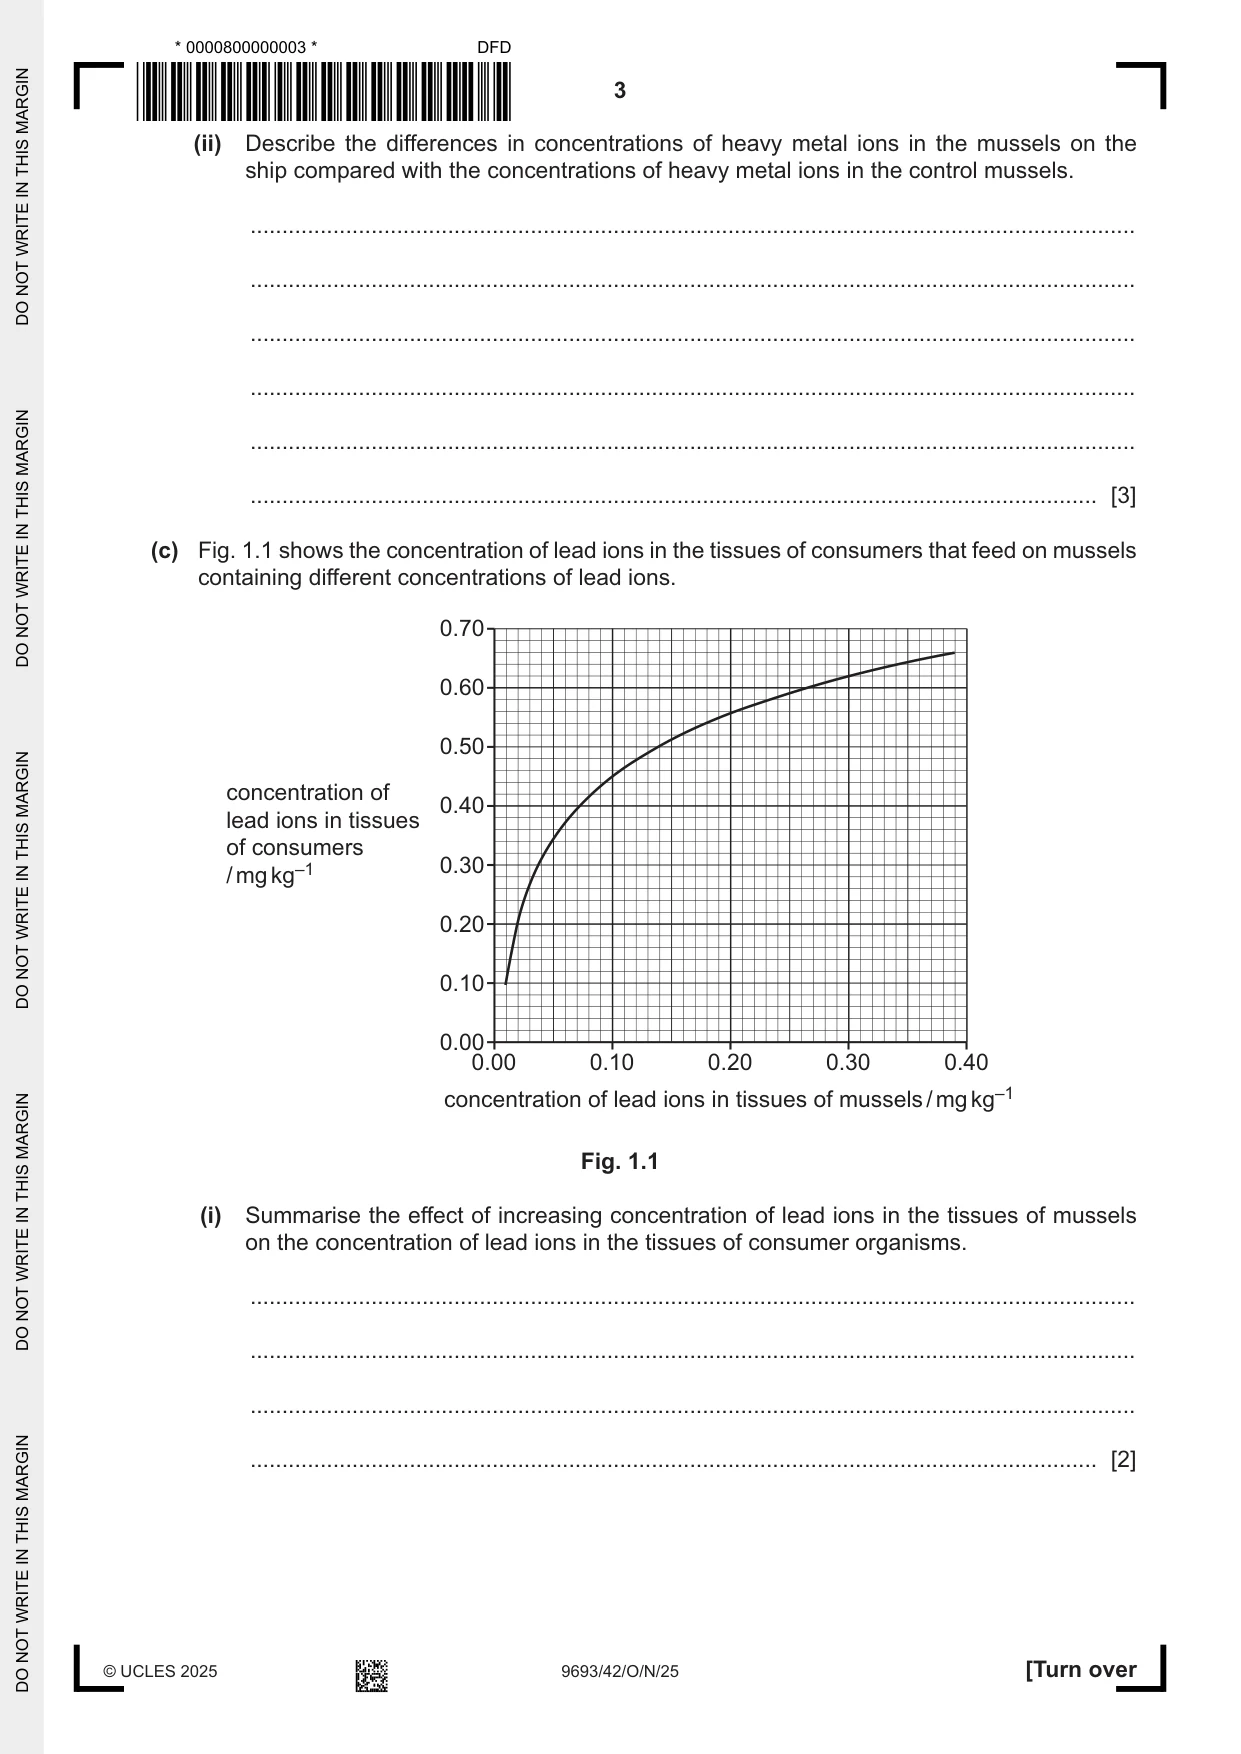
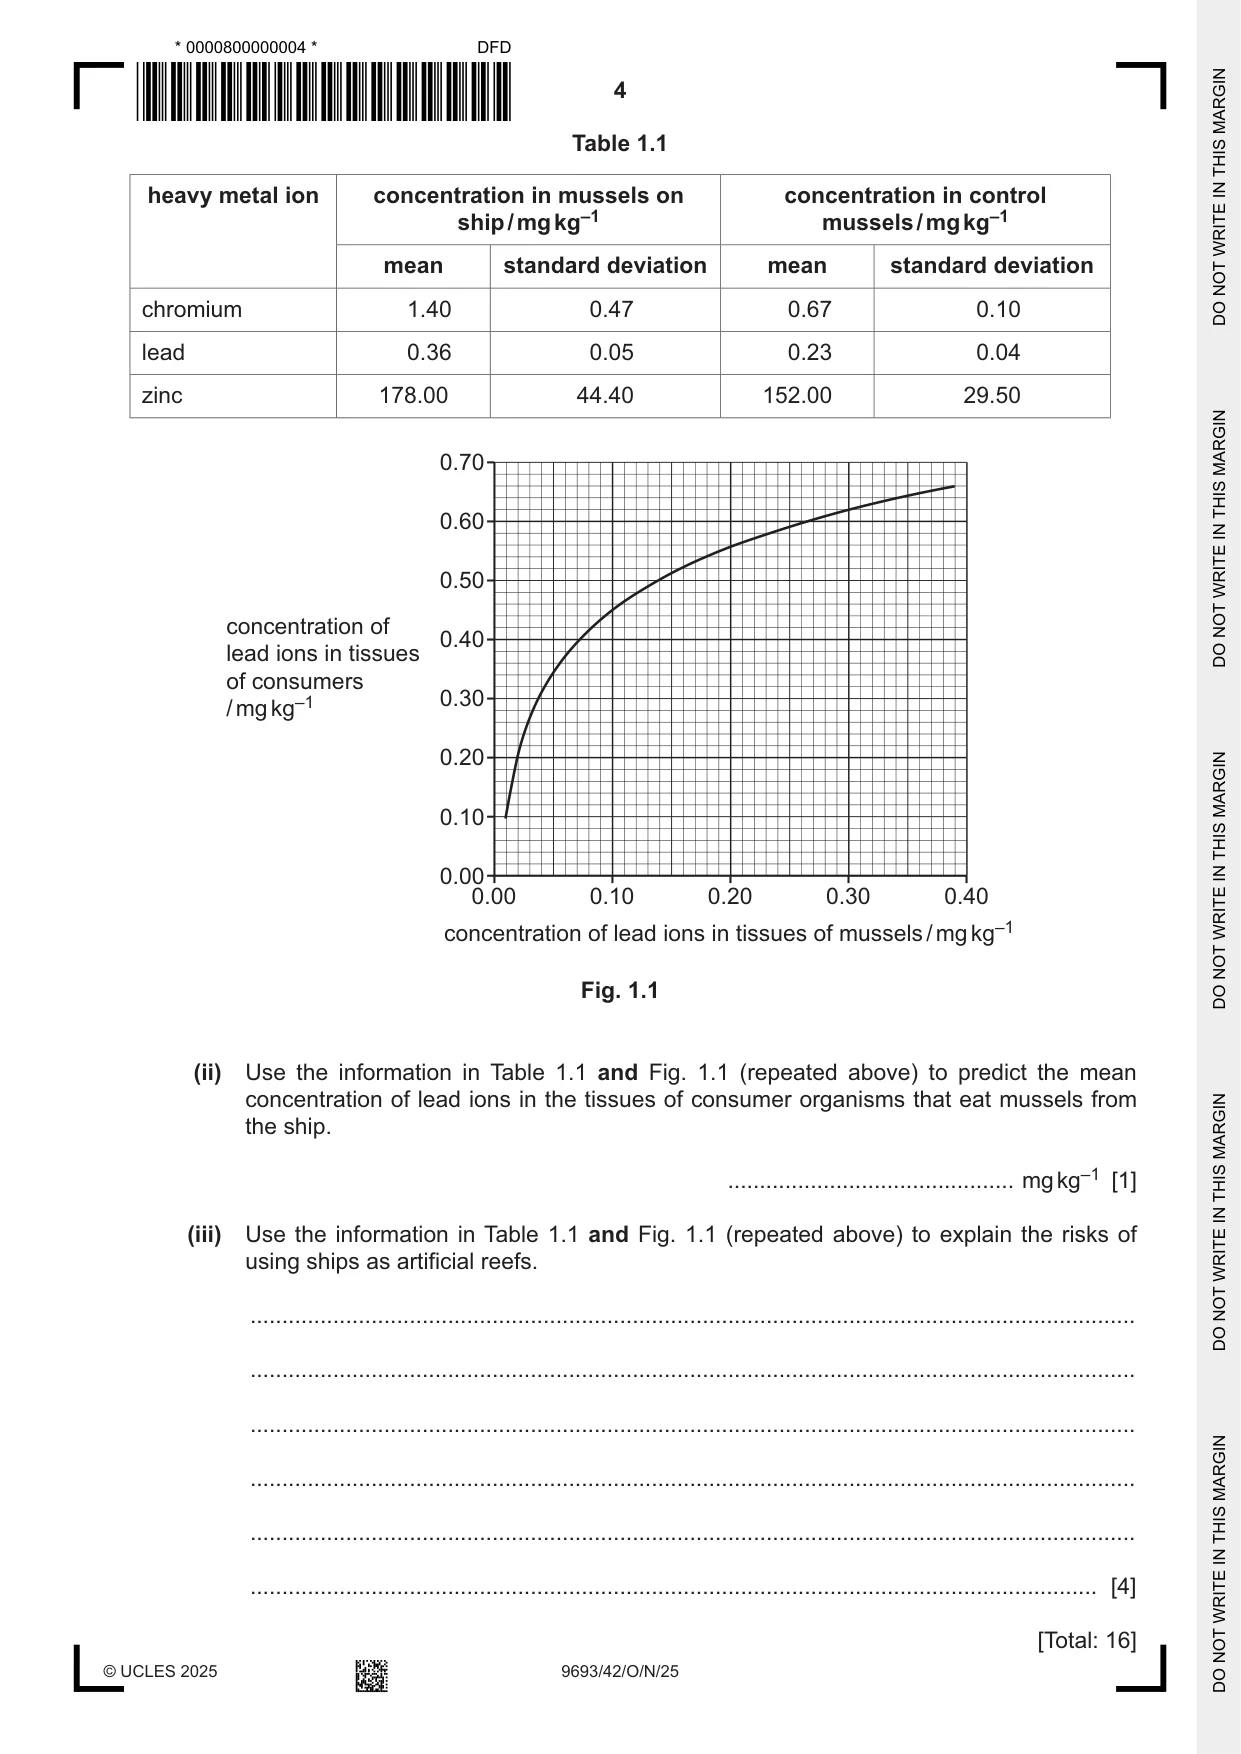
1 Artificial reefs are often created by sinking old ships. (a) Explain how artificial reefs can help to rehabilitate fish stocks. ................................................................................................................................................... ................................................................................................................................................... ................................................................................................................................................... ................................................................................................................................................... ................................................................................................................................................... ............................................................................................................................................. [3] (b) Scientists investigated the risk of heavy metal ions leaking from artificial reefs into sea water. Bags of mussels were placed on a sunken metal ship. Bags of mussels were also placed at an area one kilometre from the ship as a control. After six months, the mean concentrations of chromium ions, lead ions and zinc ions in the mussels were determined. The results are shown in Table 1.1. Table 1.1 heavy metal ion concentration in mussels on concentration in control ship / mg kg–1 mussels / mg kg–1 mean standard deviation mean standard deviation chromium 1.40 0.47 0.67 0.10 lead 0.36 0.05 0.23 0.04 zinc 178.00 44.40 152.00 29.50 (i) Calculate the percentage difference in the mean concentration of chromium ions in the mussels on the ship compared with the mean concentration of chromium ions in the control mussels. Give your answer to two significant figures. Show your working. .......................................................% [3] (ii) Describe the differences in concentrations of heavy metal ions in the mussels on the ship compared with the concentrations of heavy metal ions in the control mussels. ........................................................................................................................................... ........................................................................................................................................... ........................................................................................................................................... ........................................................................................................................................... ........................................................................................................................................... ..................................................................................................................................... [3] (c) Fig. 1.1 shows the concentration of lead ions in the tissues of consumers that feed on mussels containing different concentrations of lead ions. 0.70 0.60 0.50 concentration of 0.40 lead ions in tissues of consumers 0.30 / mg kg–1 0.20 0.10 0.00 0.00 0.10 0.20 0.30 0.40 concentration of lead ions in tissues of mussels / mg kg–1 Fig. 1.1 (i) Summarise the effect of increasing concentration of lead ions in the tissues of mussels on the concentration of lead ions in the tissues of consumer organisms. ........................................................................................................................................... ........................................................................................................................................... ........................................................................................................................................... ..................................................................................................................................... [2] Table 1.1 heavy metal ion concentration in mussels on concentration in control ship / mg kg–1 mussels / mg kg–1 mean standard deviation mean standard deviation chromium 1.40 0.47 0.67 0.10 lead 0.36 0.05 0.23 0.04 zinc 178.00 44.40 152.00 29.50 0.70 0.60 0.50 concentration of 0.40 lead ions in tissues of consumers 0.30 / mg kg–1 0.20 0.10 0.00 0.00 0.10 0.20 0.30 0.40 concentration of lead ions in tissues of mussels / mg kg–1 Fig. 1.1 (ii) Use the information in Table 1.1 and Fig. 1.1 (repeated above) to predict the mean concentration of lead ions in the tissues of consumer organisms that eat mussels from the ship. ............................................. mg kg–1 [1] (iii) Use the information in Table 1.1 and Fig. 1.1 (repeated above) to explain the risks of using ships as artificial reefs. ........................................................................................................................................... ........................................................................................................................................... ........................................................................................................................................... ........................................................................................................................................... ........................................................................................................................................... ..................................................................................................................................... [4] [Total: 16]
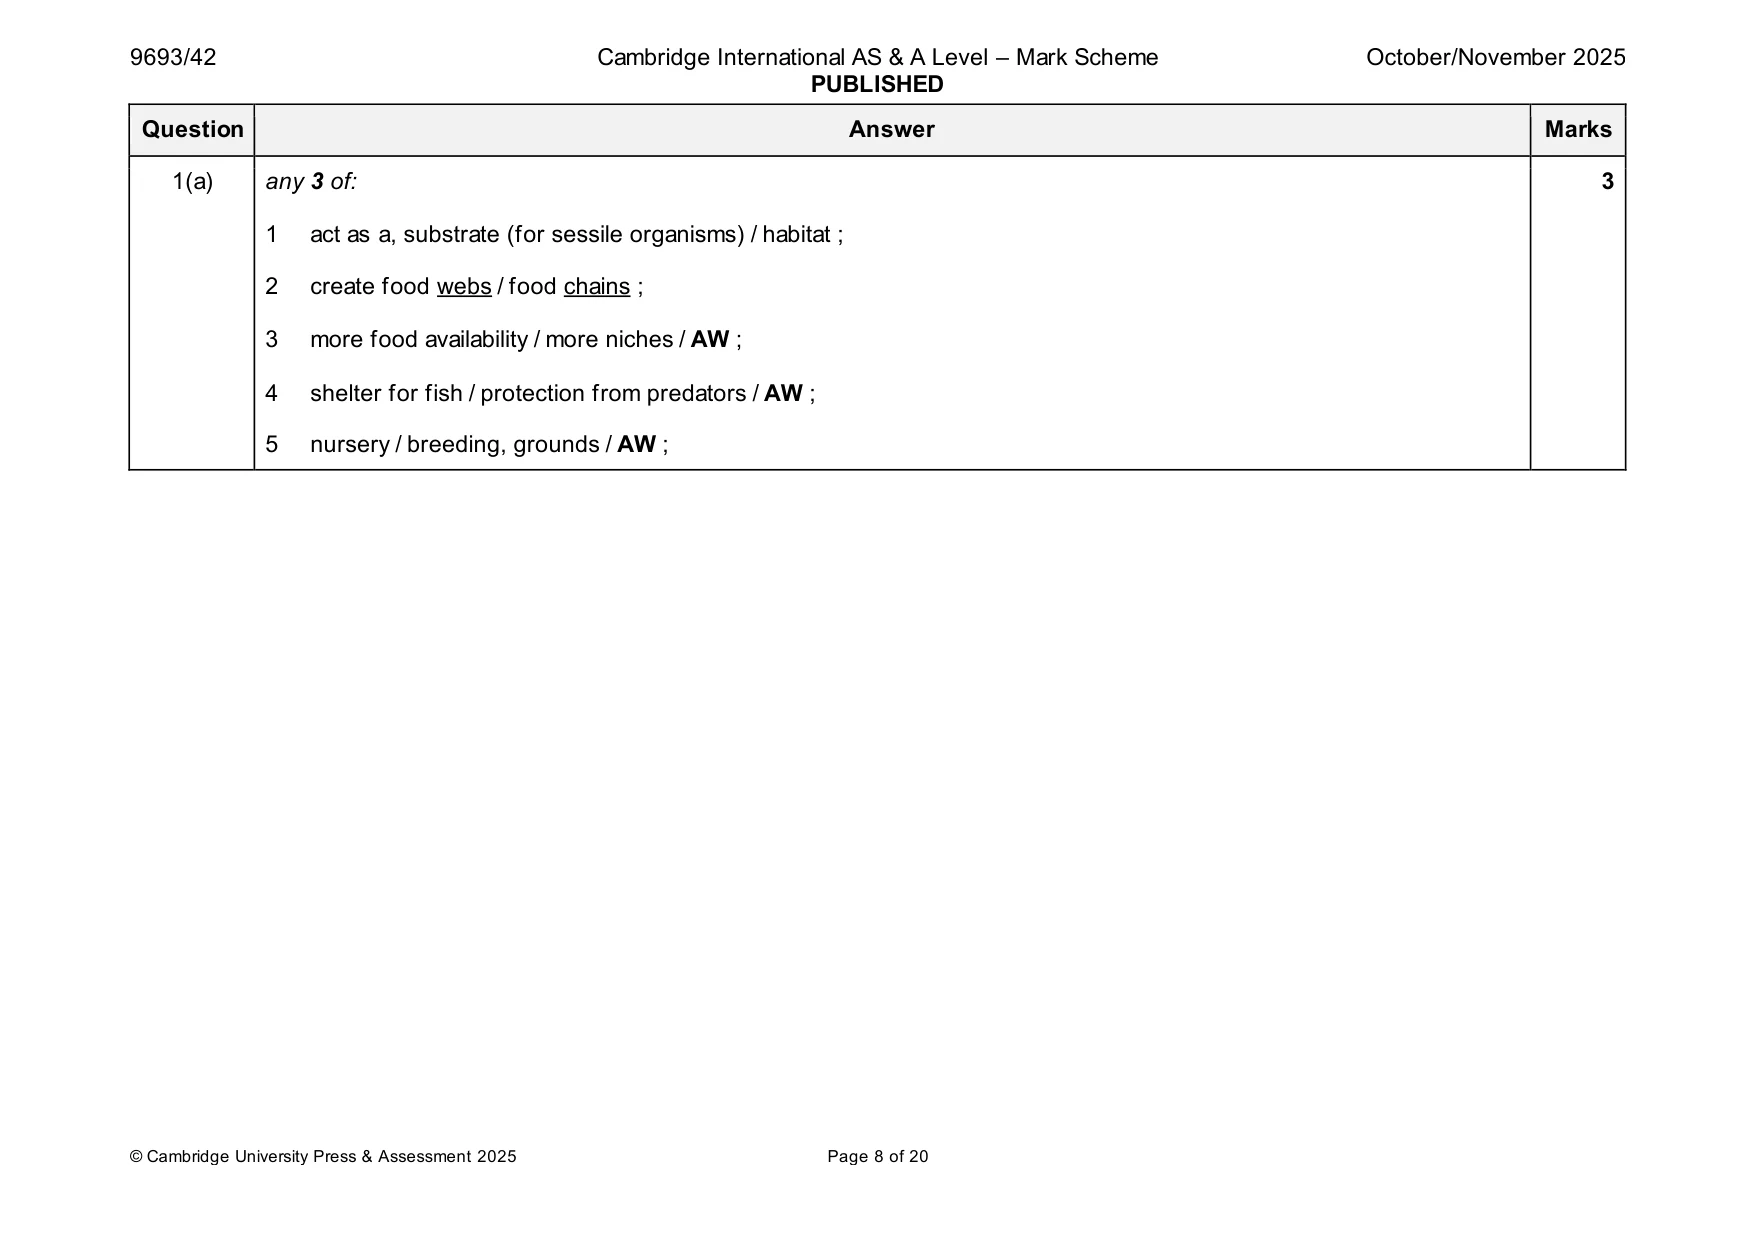
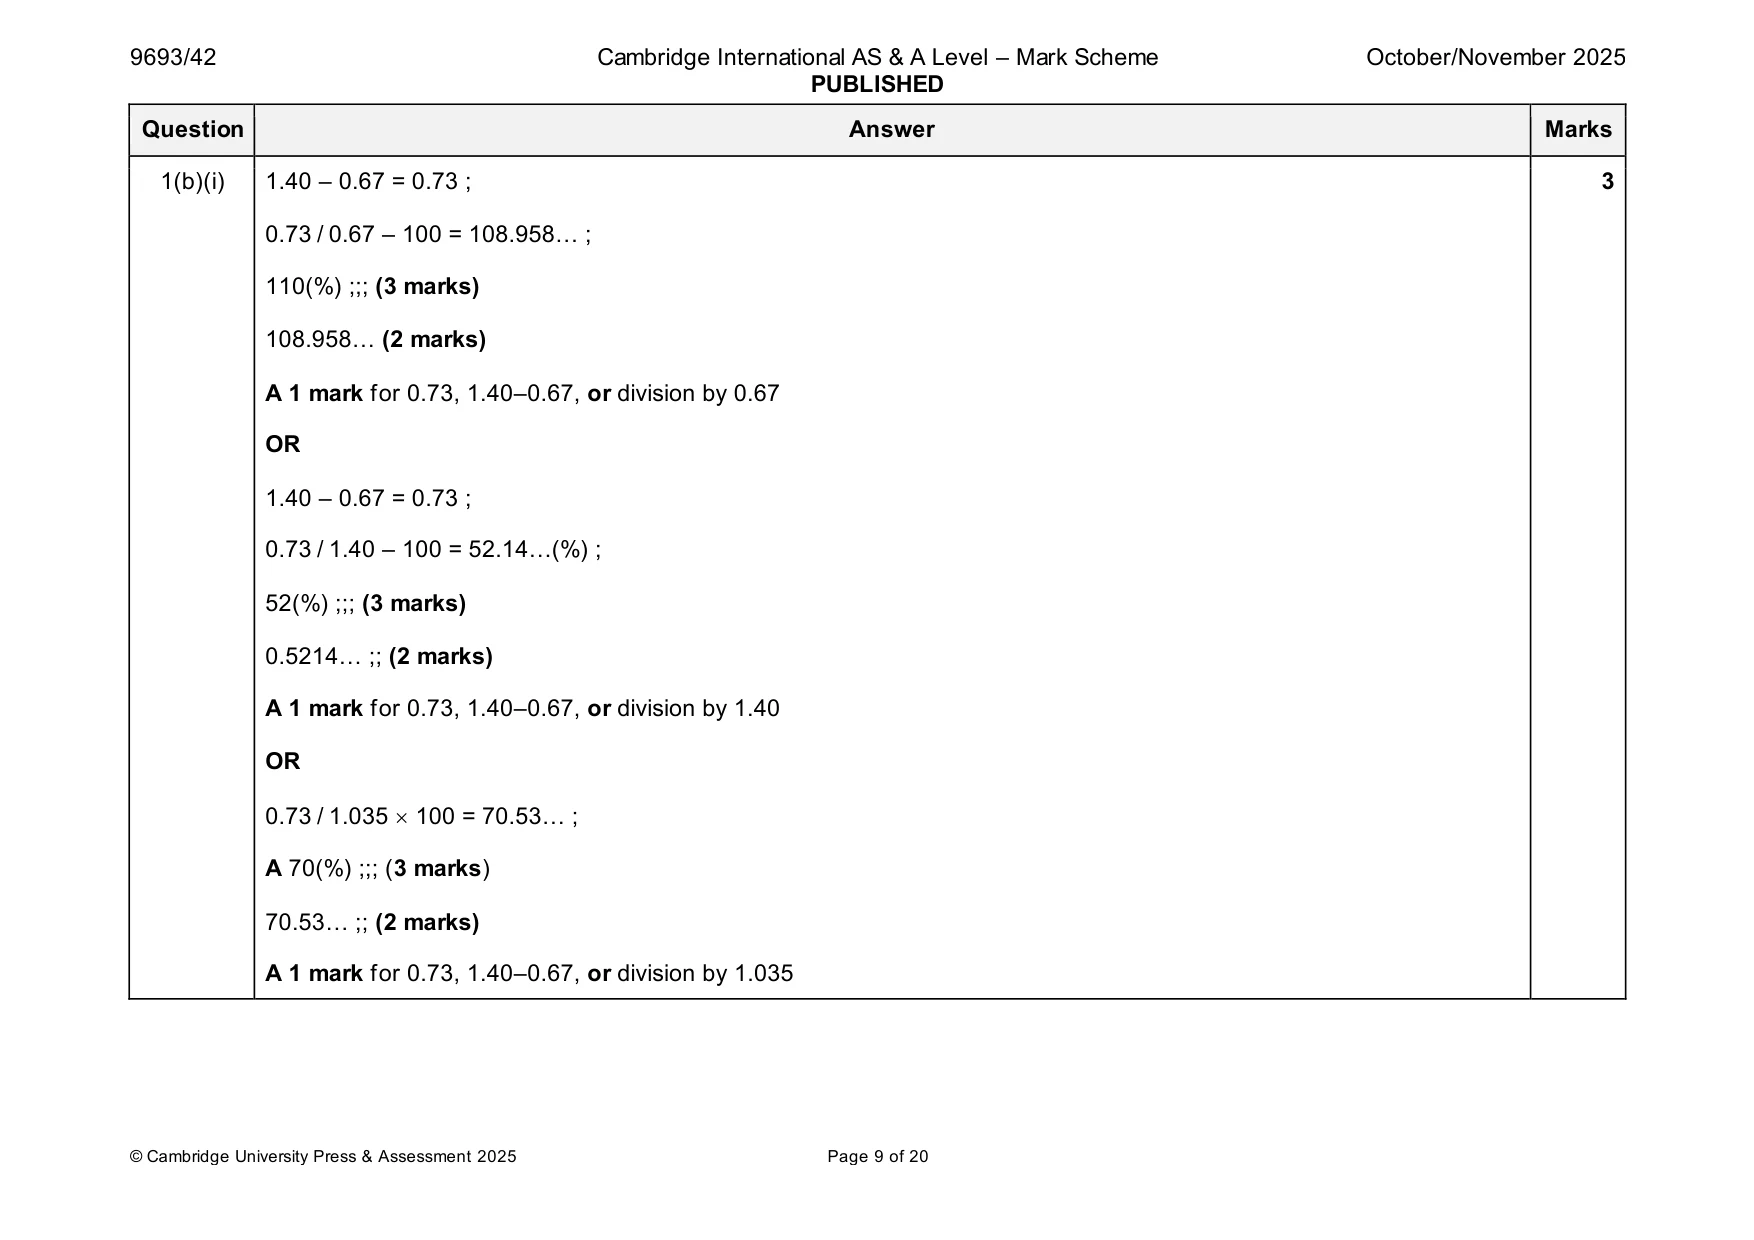
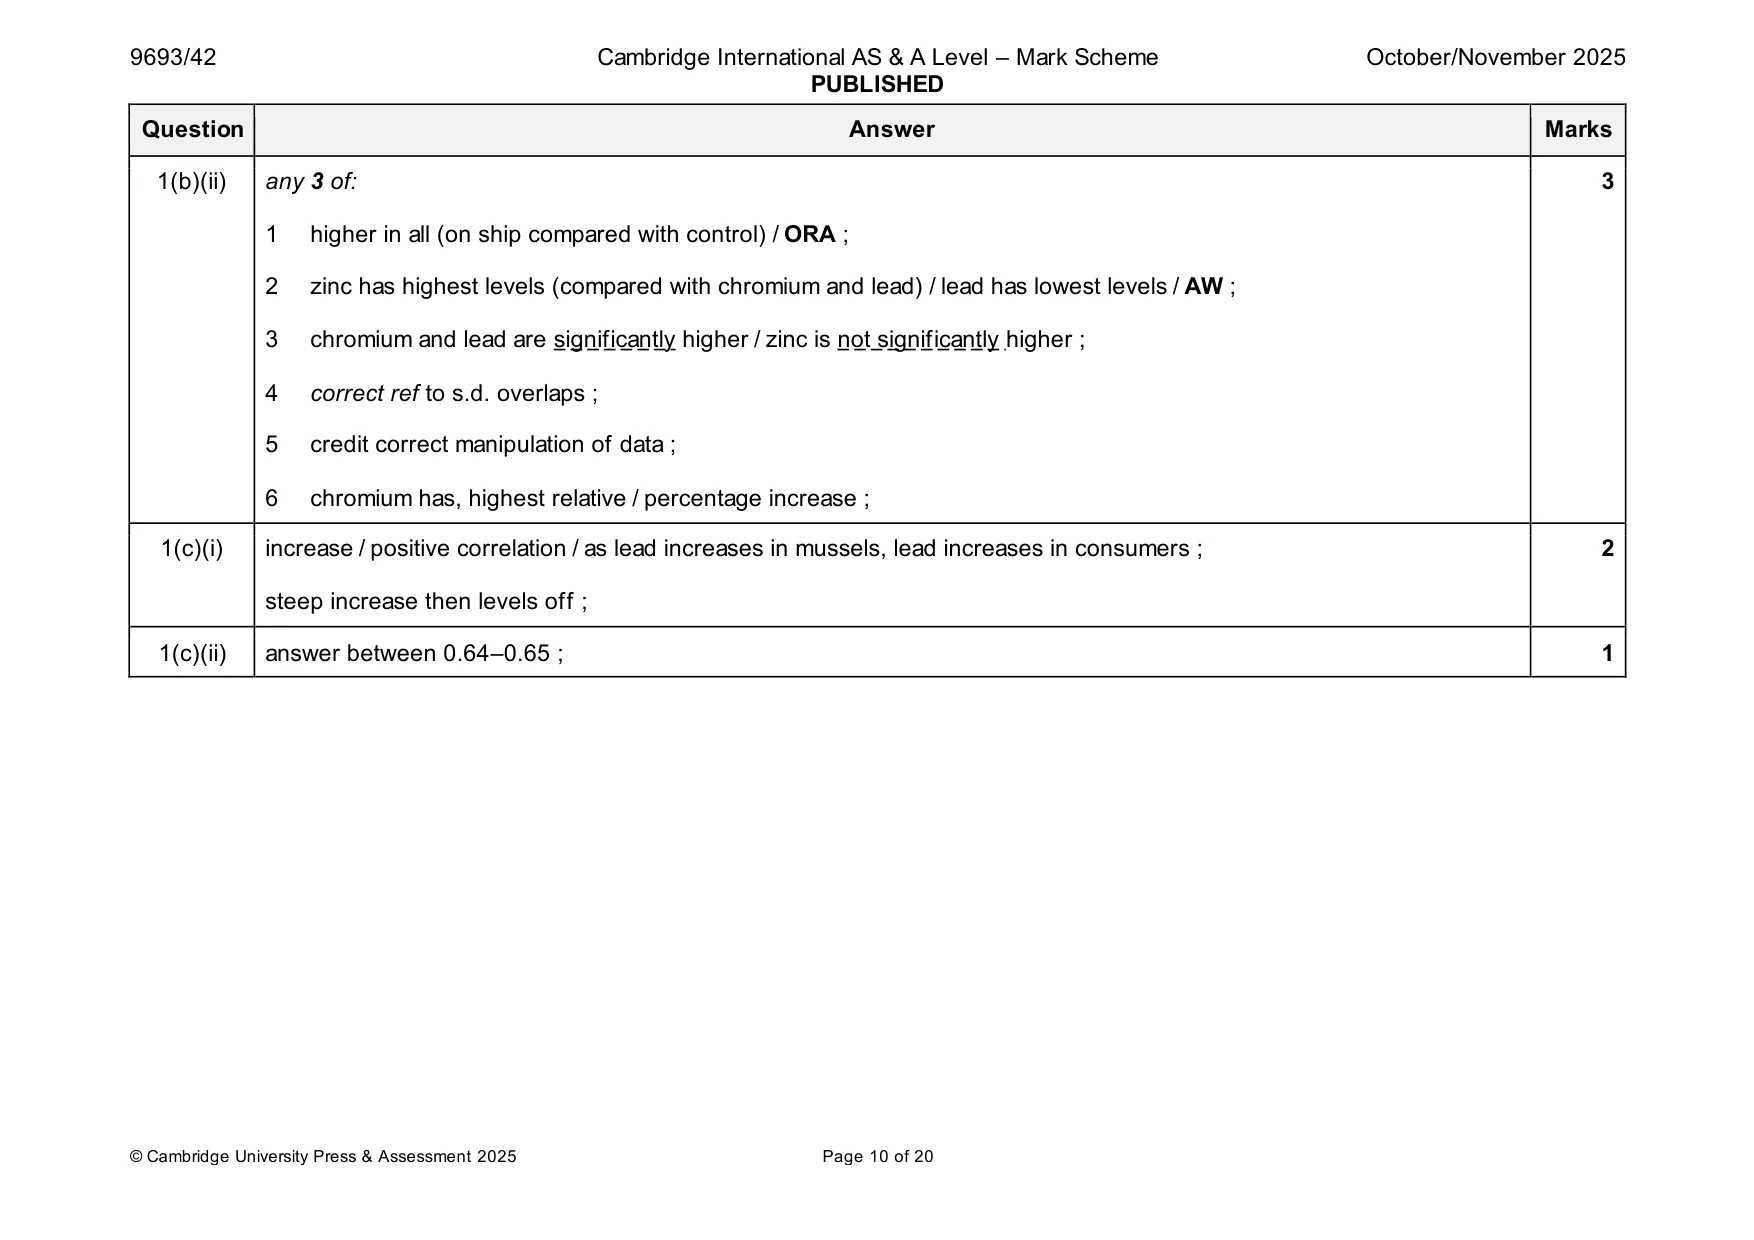
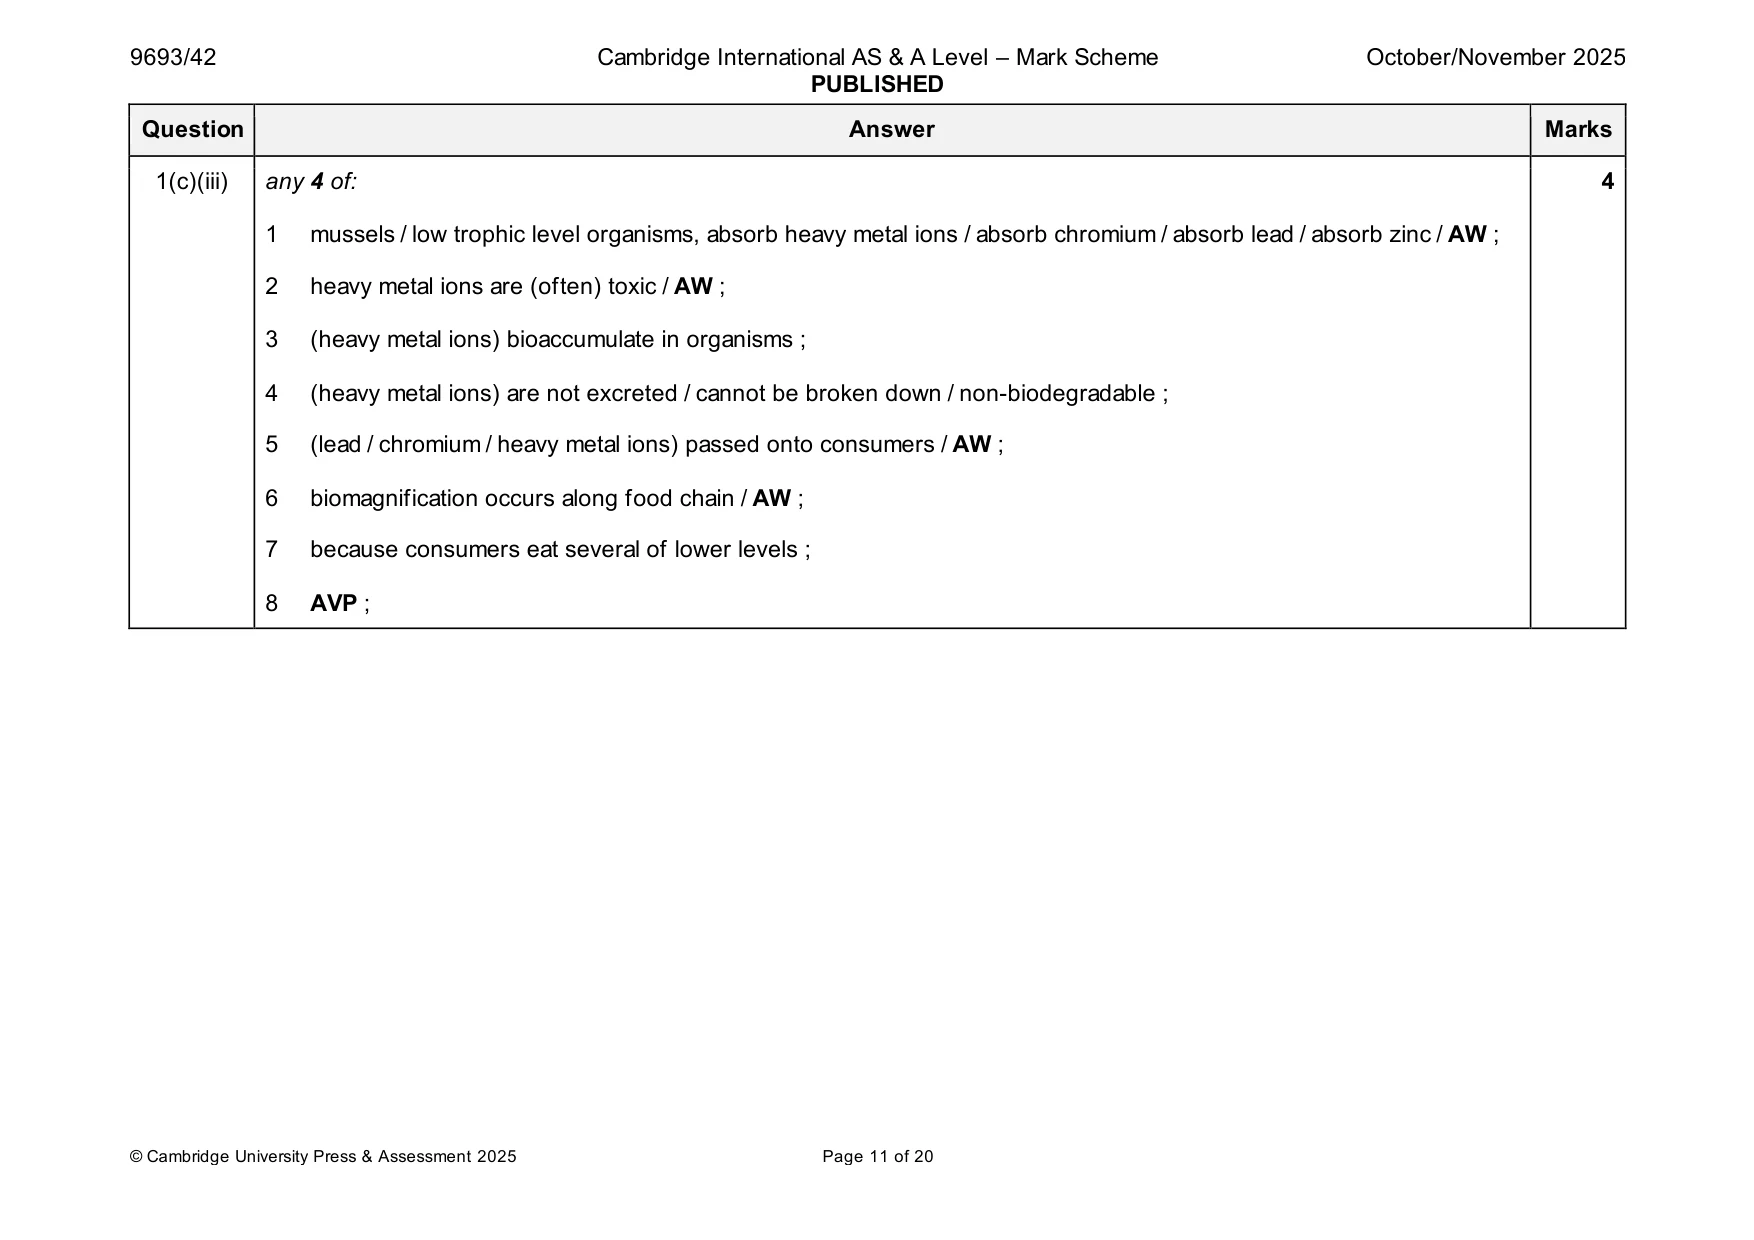
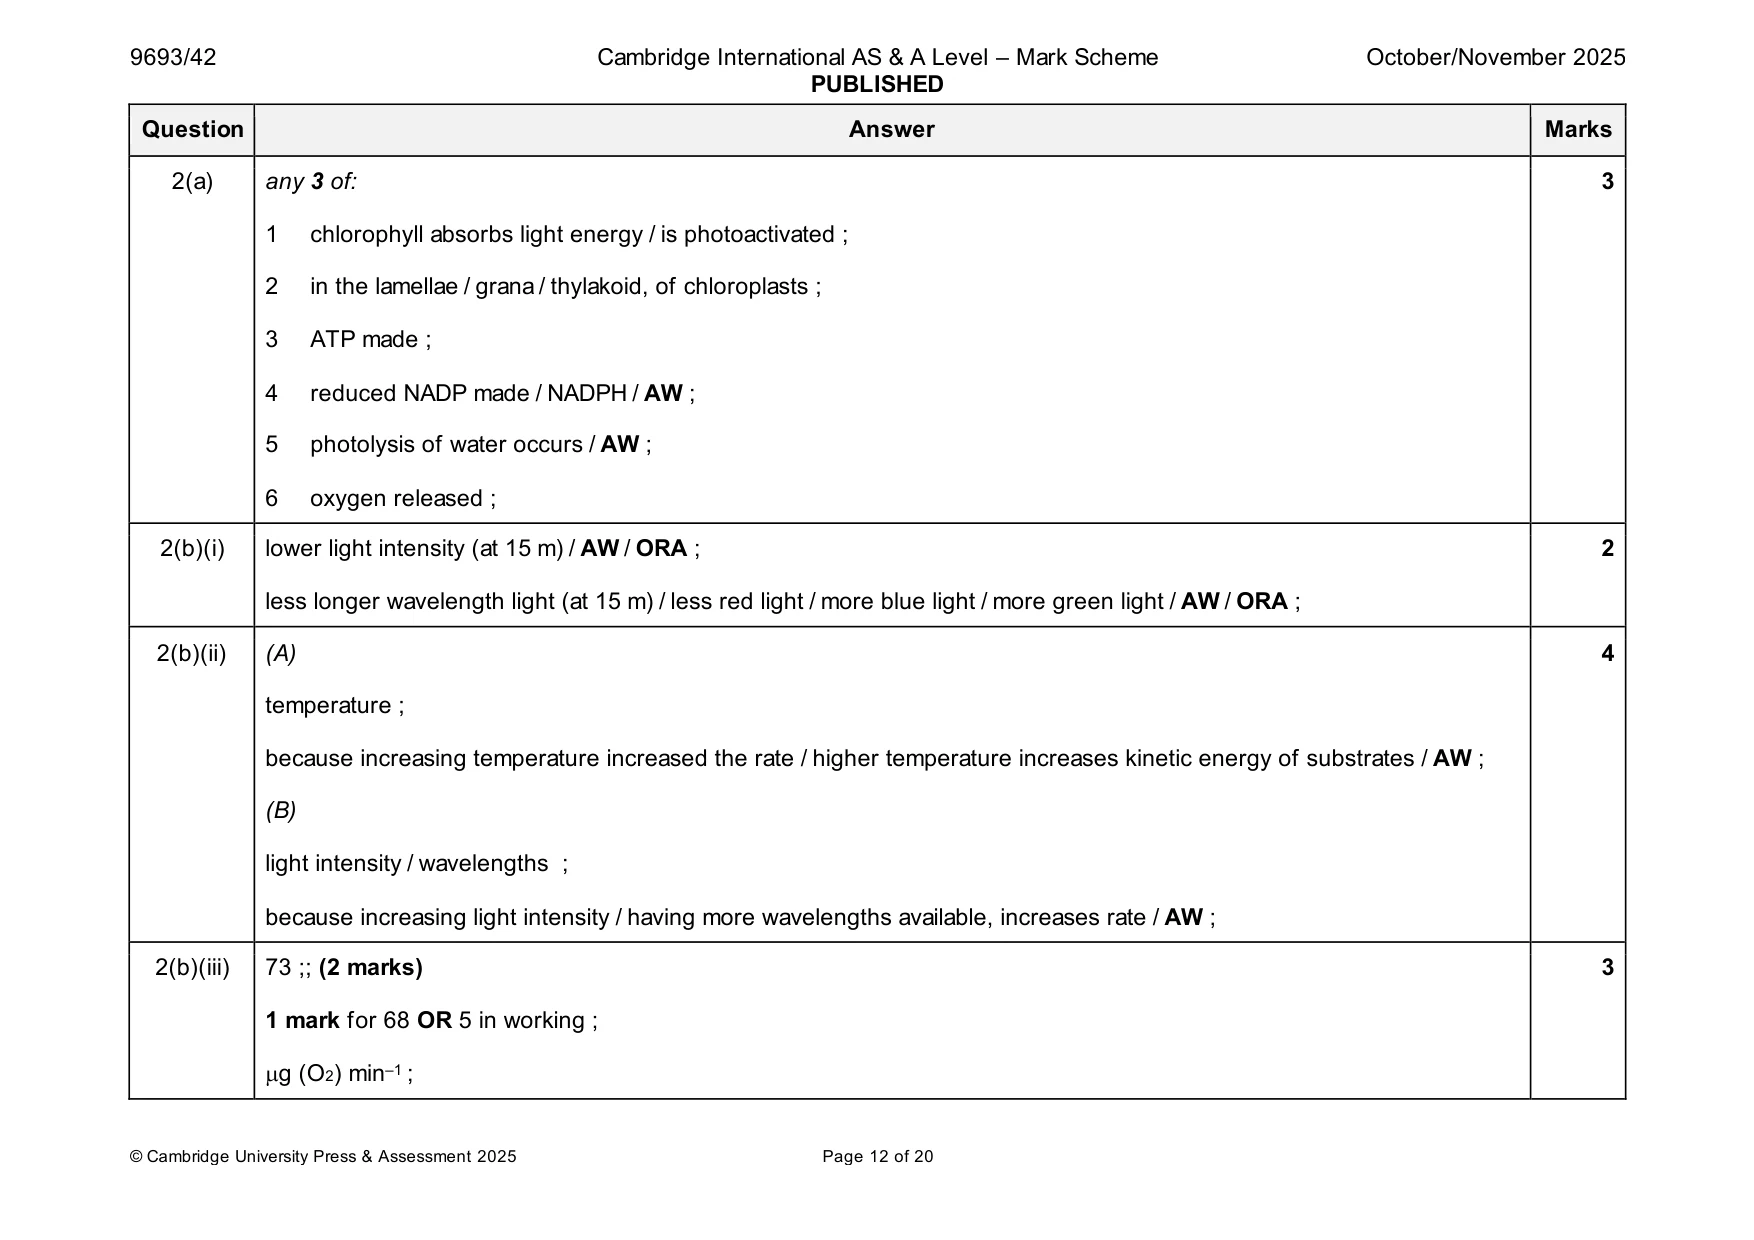
Mark scheme: Question Answer Marks 1(a) any 3 of: 3 1 act as a, substrate (for sessile organisms) / habitat ; 2 create food webs / food chains ; 3 more food availability / more niches / AW ; 4 shelter for fish / protection from predators / AW ; 5 nursery / breeding, grounds / AW ; 1(b)(i) 1.40 – 0.67 = 0.73 ; 3 0.73 / 0.67 – 100 = 108.958… ; 110(%) ;;; (3 marks) 108.958… (2 marks) A 1 mark for 0.73, 1.40–0.67, or division by 0.67 OR 1.40 – 0.67 = 0.73 ; 0.73 / 1.40 – 100 = 52.14…(%) ; 52(%) ;;; (3 marks) 0.5214… ;; (2 marks) A 1 mark for 0.73, 1.40–0.67, or division by 1.40 OR 0.73 / 1.035 100 = 70.53… ; A 70(%) ;;; (3 marks) 70.53… ;; (2 marks) A 1 mark for 0.73, 1.40–0.67, or division by 1.035 1(b)(ii) any 3 of: 3 1 higher in all (on ship compared with control) / ORA ; 2 zinc has highest levels (compared with chromium and lead) / lead has lowest levels / AW ; 3 chromium and lead are significantly higher / zinc is not significantly higher ; 4 correct ref to s.d. overlaps ; 5 credit correct manipulation of data ; 6 chromium has, highest relative / percentage increase ; 1(c)(i) increase / positive correlation / as lead increases in mussels, lead increases in consumers ; 2 steep increase then levels off ; 1(c)(ii) answer between 0.64–0.65 ; 1 1(c)(iii) any 4 of: 4 1 mussels / low trophic level organisms, absorb heavy metal ions / absorb chromium / absorb lead / absorb zinc / AW ; 2 heavy metal ions are (often) toxic / AW ; 3 (heavy metal ions) bioaccumulate in organisms ; 4 (heavy metal ions) are not excreted / cannot be broken down / non-biodegradable ; 5 (lead / chromium / heavy metal ions) passed onto consumers / AW ; 6 biomagnification occurs along food chain / AW ; 7 because consumers eat several of lower levels ; 8 AVP ;
Q2 · Scientists investigated the effect of temperature on the rate of photosynthesis and the…
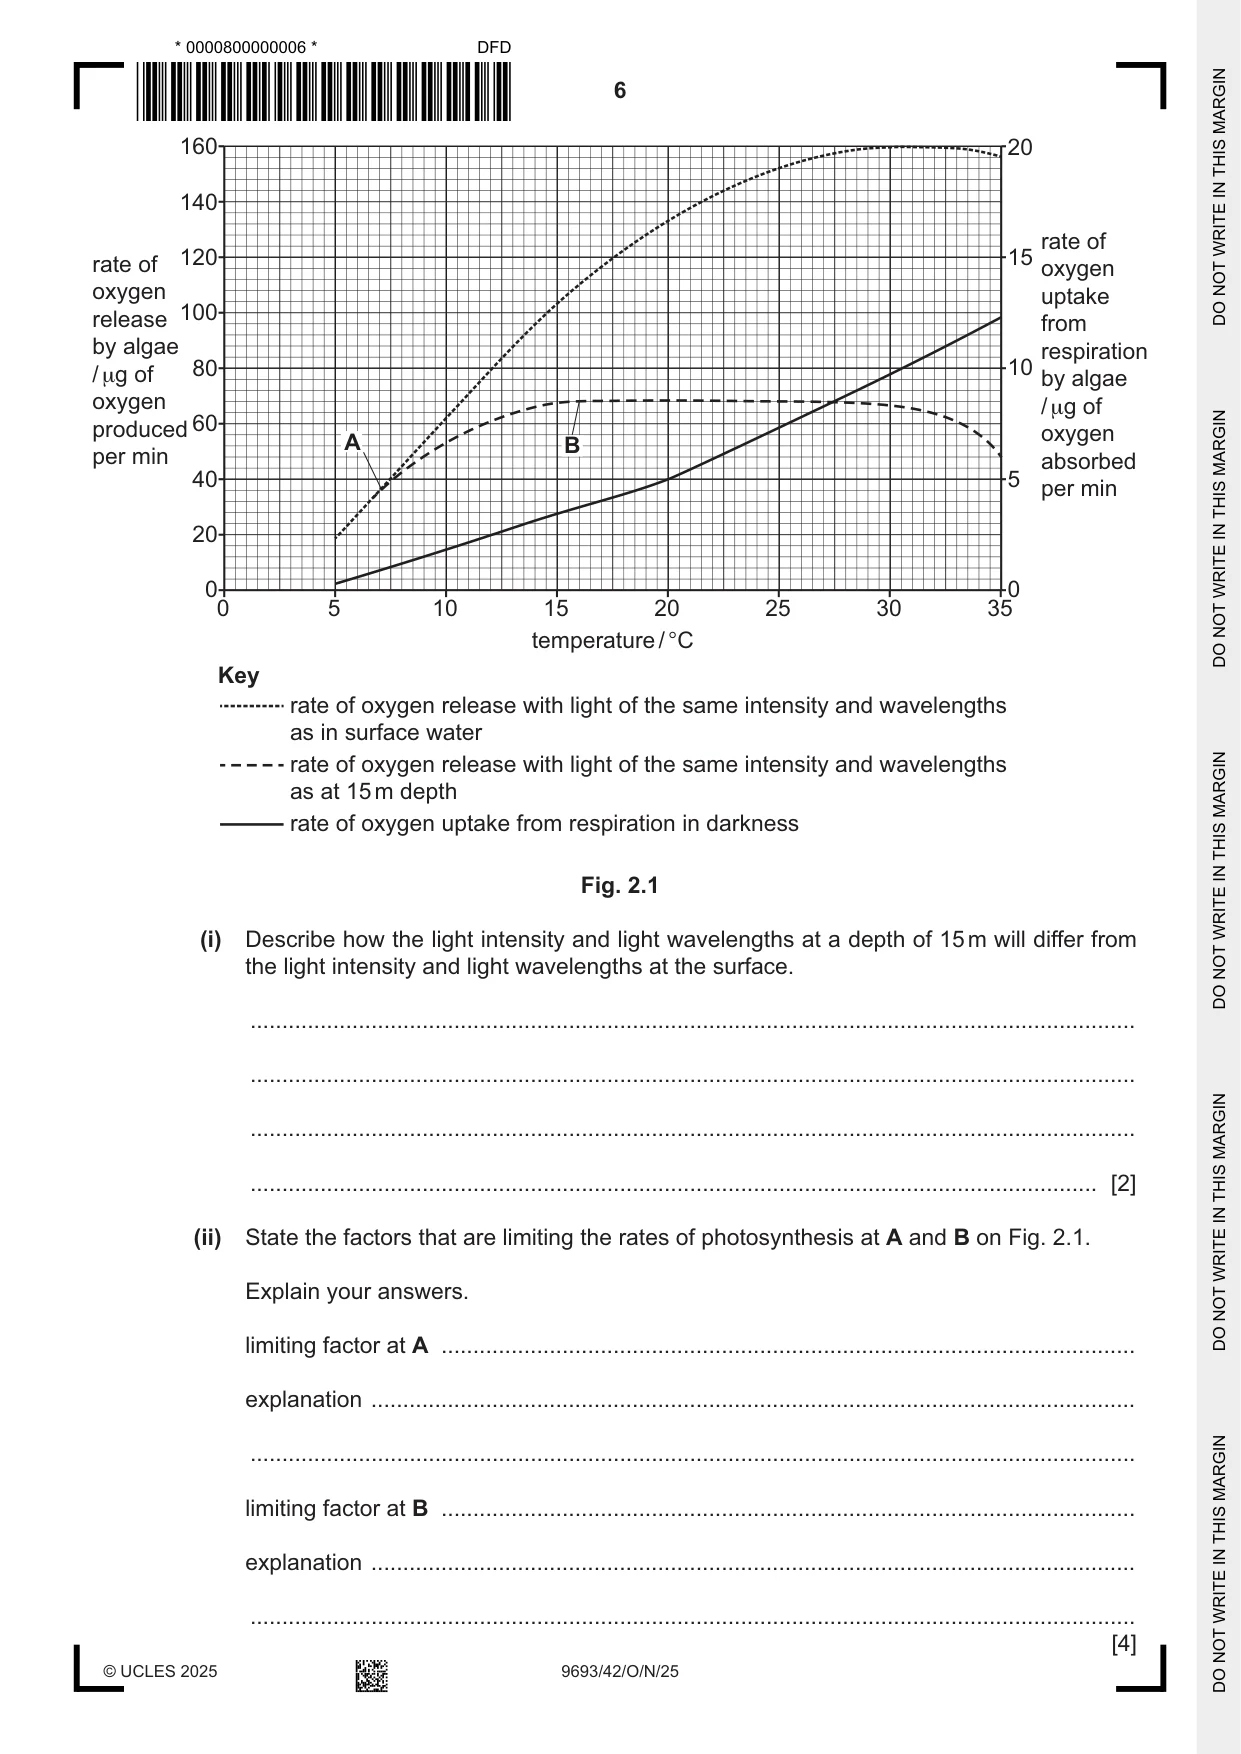
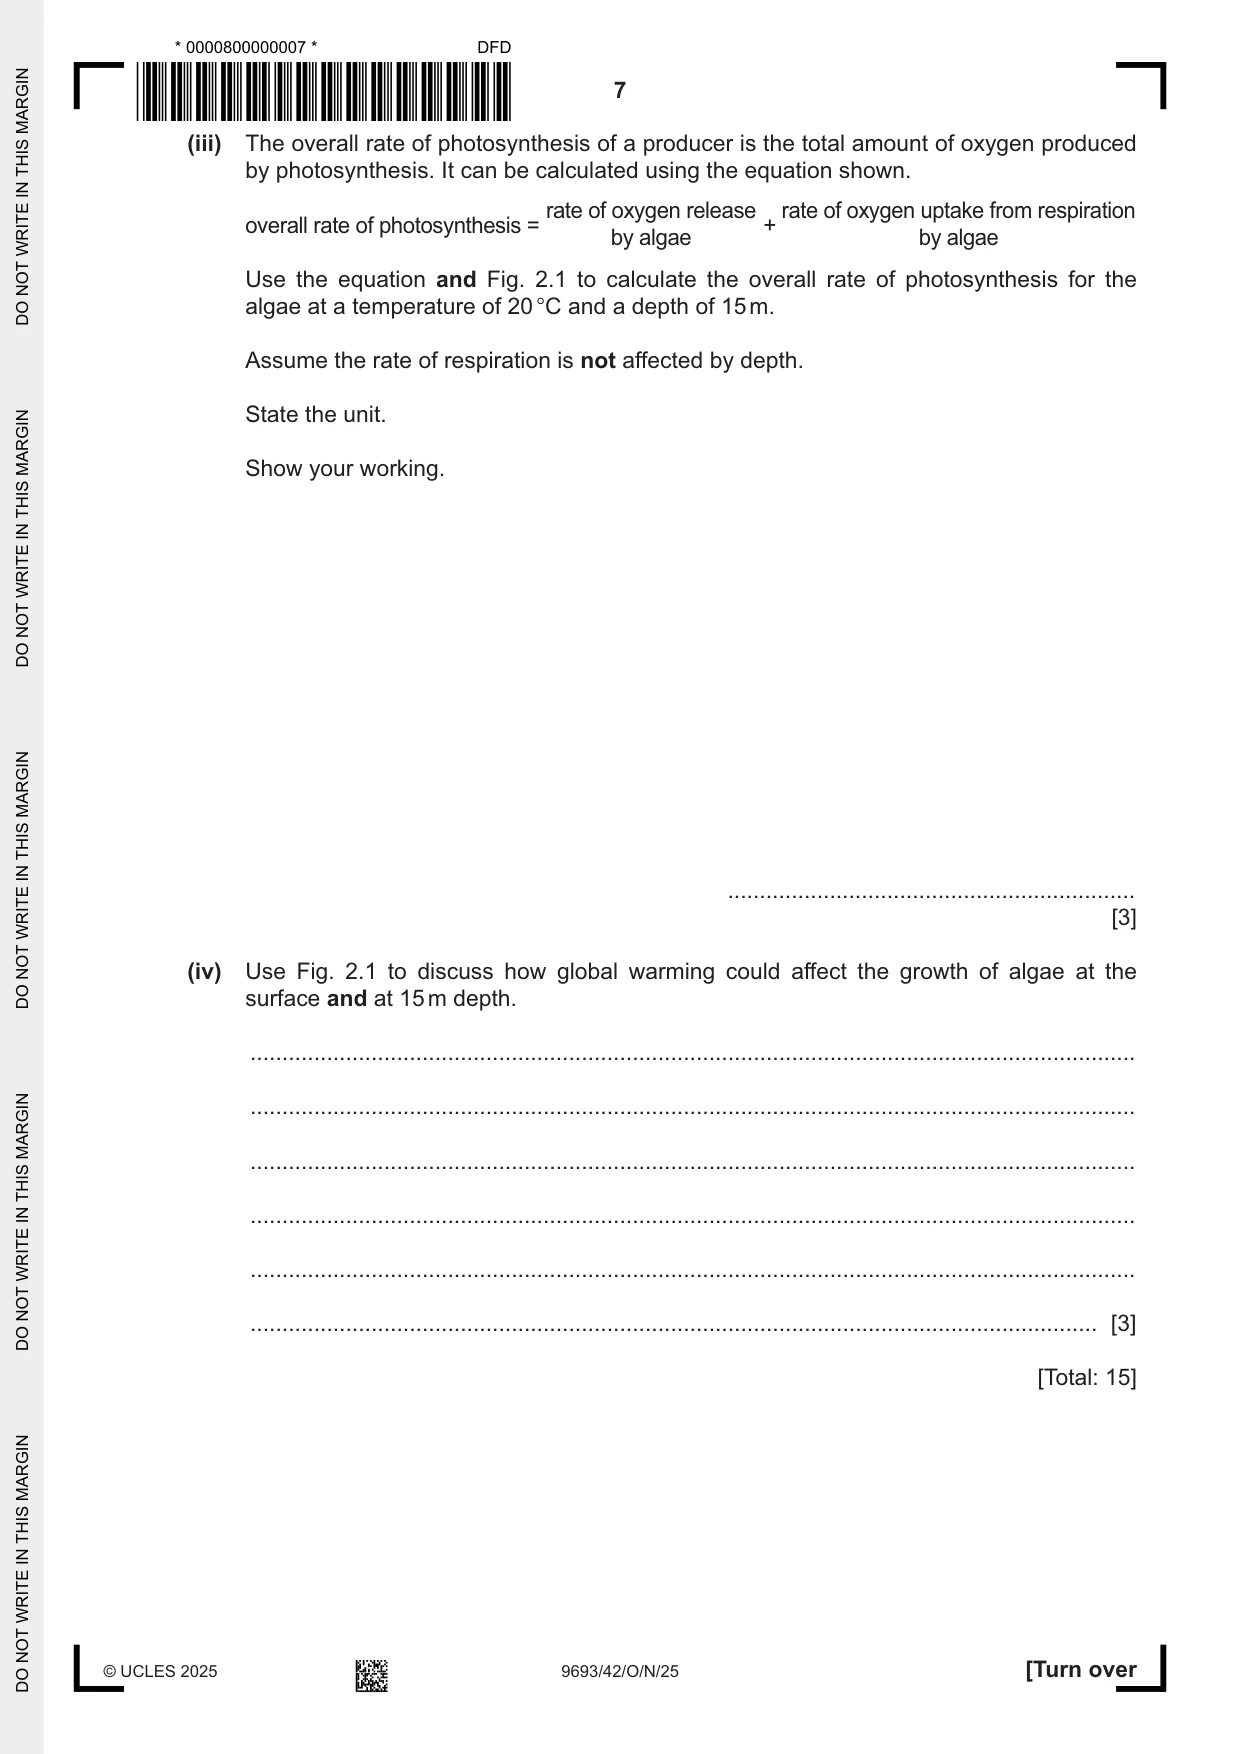
2 Scientists investigated the effect of temperature on the rate of photosynthesis and the rate of respiration of phytoplankton. (a) Outline the light-dependent stage of photosynthesis. ................................................................................................................................................... ................................................................................................................................................... ................................................................................................................................................... ................................................................................................................................................... ................................................................................................................................................... ............................................................................................................................................. [3] (b) A species of green alga that normally grows in surface water was grown in a tank. The rate of oxygen release from algae is a measure of the rate of photosynthesis. The algae were illuminated with light of the same intensity and wavelengths (colours) as in the surface water. The rate of oxygen release by the algae was measured at temperatures between 5 °C and 35 °C. The experiment was repeated with light of the same intensity and wavelengths as in water at a depth of 15 m. The effect of temperature on the rate of respiration was also determined by measuring the rate of oxygen uptake when the algae were in the dark. The results are shown in Fig. 2.1. 160 20 140 rate of 120 15rate of oxygen oxygen uptake 100release from by algae respiration / μg of 80 10 by algae oxygen / μg of produced 60 oxygen A B per min absorbed 40 5 per min 20 0 0 0 5 10 15 20 25 30 35 temperature / °C Key rate of oxygen release with light of the same intensity and wavelengths as in surface water rate of oxygen release with light of the same intensity and wavelengths as at 15 m depth rate of oxygen uptake from respiration in darkness Fig. 2.1 (i) Describe how the light intensity and light wavelengths at a depth of 15 m will differ from the light intensity and light wavelengths at the surface. ........................................................................................................................................... ........................................................................................................................................... ........................................................................................................................................... ..................................................................................................................................... [2] (ii) State the factors that are limiting the rates of photosynthesis at A and B on Fig. 2.1. Explain your answers. limiting factor at A ............................................................................................................. explanation ........................................................................................................................ ........................................................................................................................................... limiting factor at B ............................................................................................................. explanation ........................................................................................................................ ........................................................................................................................................... [4] (iii) The overall rate of photosynthesis of a producer is the total amount of oxygen produced by photosynthesis. It can be calculated using the equation shown. rate of oxygen release rate of oxygen uptake from respiration overall rate of photosynthesis = + by algae by algae Use the equation and Fig. 2.1 to calculate the overall rate of photosynthesis for the algae at a temperature of 20 °C and a depth of 15 m. Assume the rate of respiration is not affected by depth. State the unit. Show your working. ................................................................ [3] (iv) Use Fig. 2.1 to discuss how global warming could affect the growth of algae at the surface and at 15 m depth. ........................................................................................................................................... ........................................................................................................................................... ........................................................................................................................................... ........................................................................................................................................... ........................................................................................................................................... ..................................................................................................................................... [3] [Total: 15]
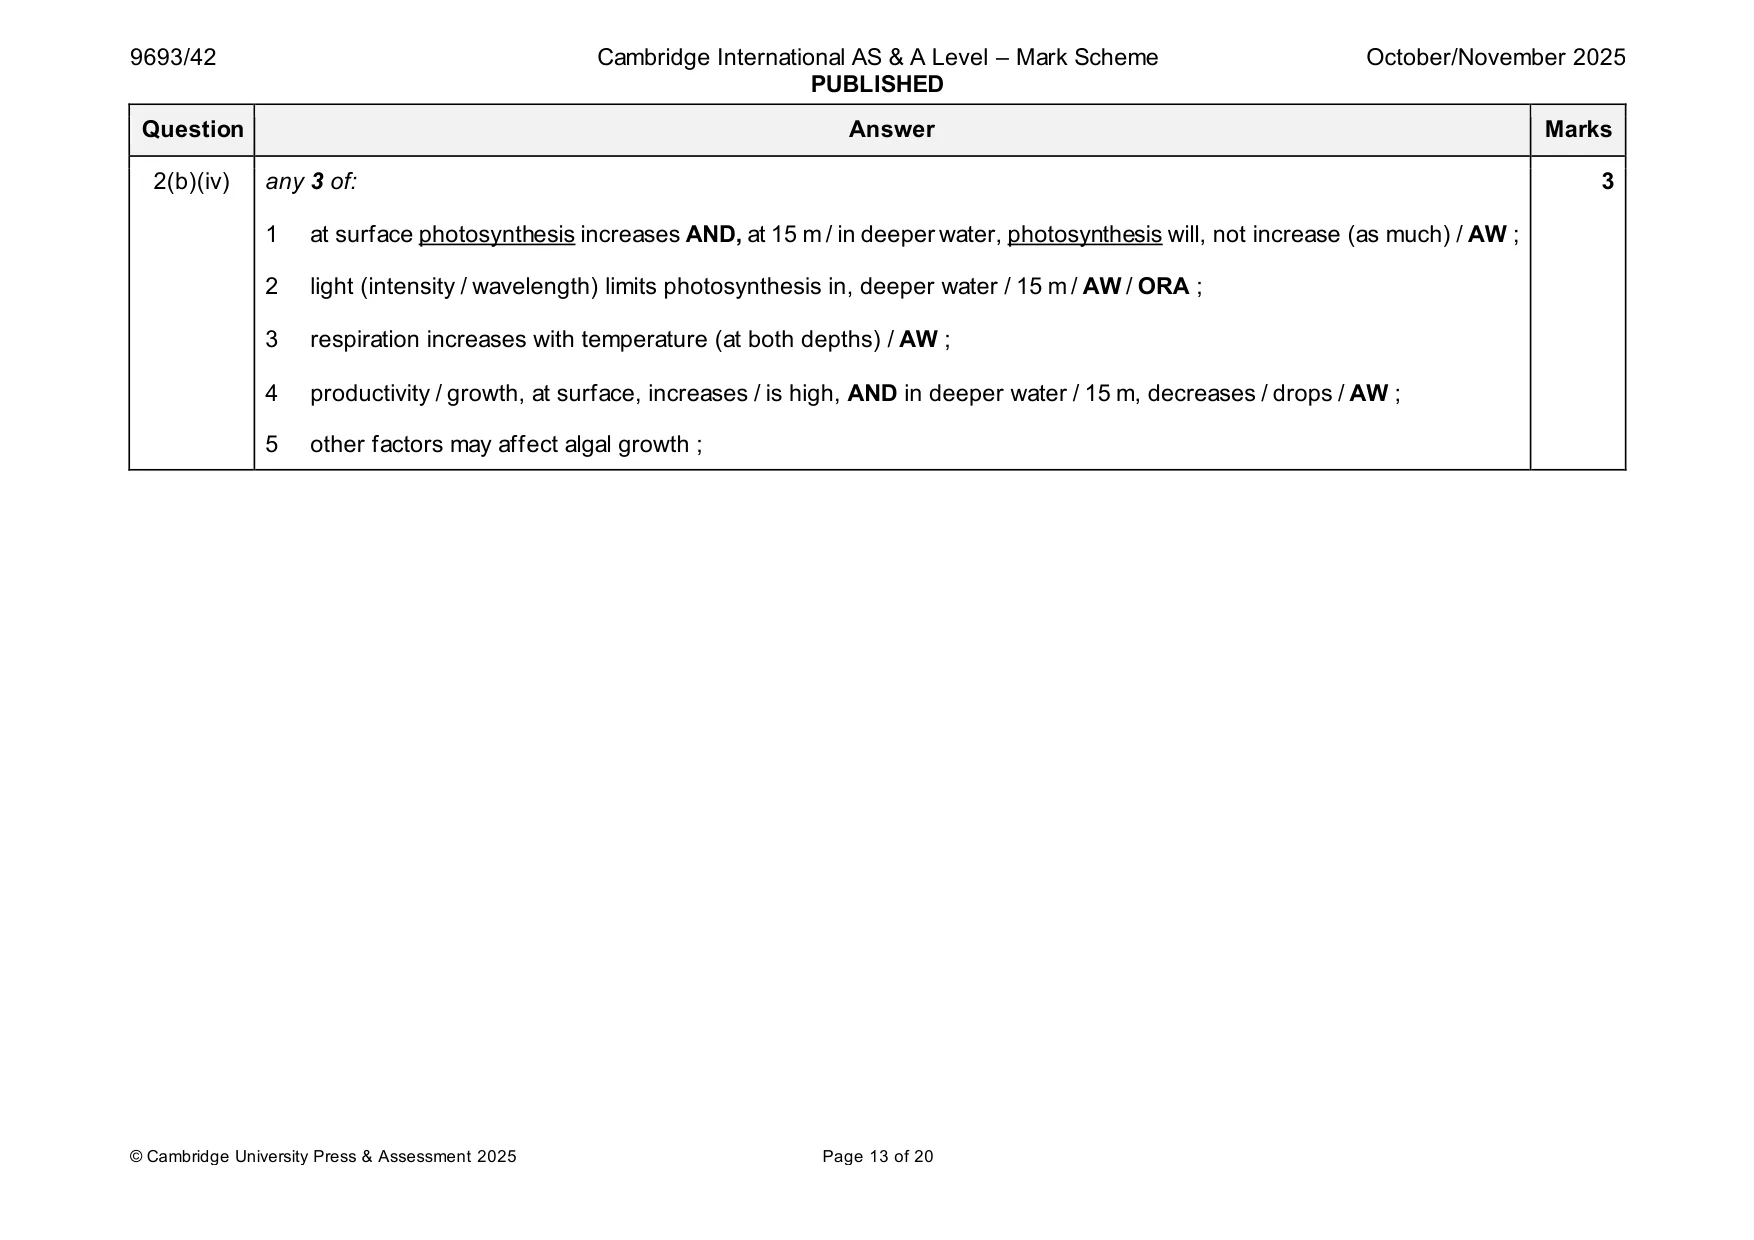
Mark scheme: 2(a) any 3 of: 3 1 chlorophyll absorbs light energy / is photoactivated ; 2 in the lamellae / grana / thylakoid, of chloroplasts ; 3 ATP made ; 4 reduced NADP made / NADPH / AW ; 5 photolysis of water occurs / AW ; 6 oxygen released ; 2(b)(i) lower light intensity (at 15 m) / AW / ORA ; 2 less longer wavelength light (at 15 m) / less red light / more blue light / more green light / AW / ORA ; 2(b)(ii) (A) 4 temperature ; because increasing temperature increased the rate / higher temperature increases kinetic energy of substrates / AW ; (B) light intensity / wavelengths ; because increasing light intensity / having more wavelengths available, increases rate / AW ; 2(b)(iii) 73 ;; (2 marks) 3 1 mark for 68 OR 5 in working ; g (O2) min–1 ; 2(b)(iv) any 3 of: 3 1 at surface photosynthesis increases AND, at 15 m / in deeper water, photosynthesis will, not increase (as much) / AW ; 2 light (intensity / wavelength) limits photosynthesis in, deeper water / 15 m / AW / ORA ; 3 respiration increases with temperature (at both depths) / AW ; 4 productivity / growth, at surface, increases / is high, AND in deeper water / 15 m, decreases / drops / AW ; 5 other factors may affect algal growth ;
Q3 · In 2004, purse seine fishing was banned in an Indian Ocean fishery
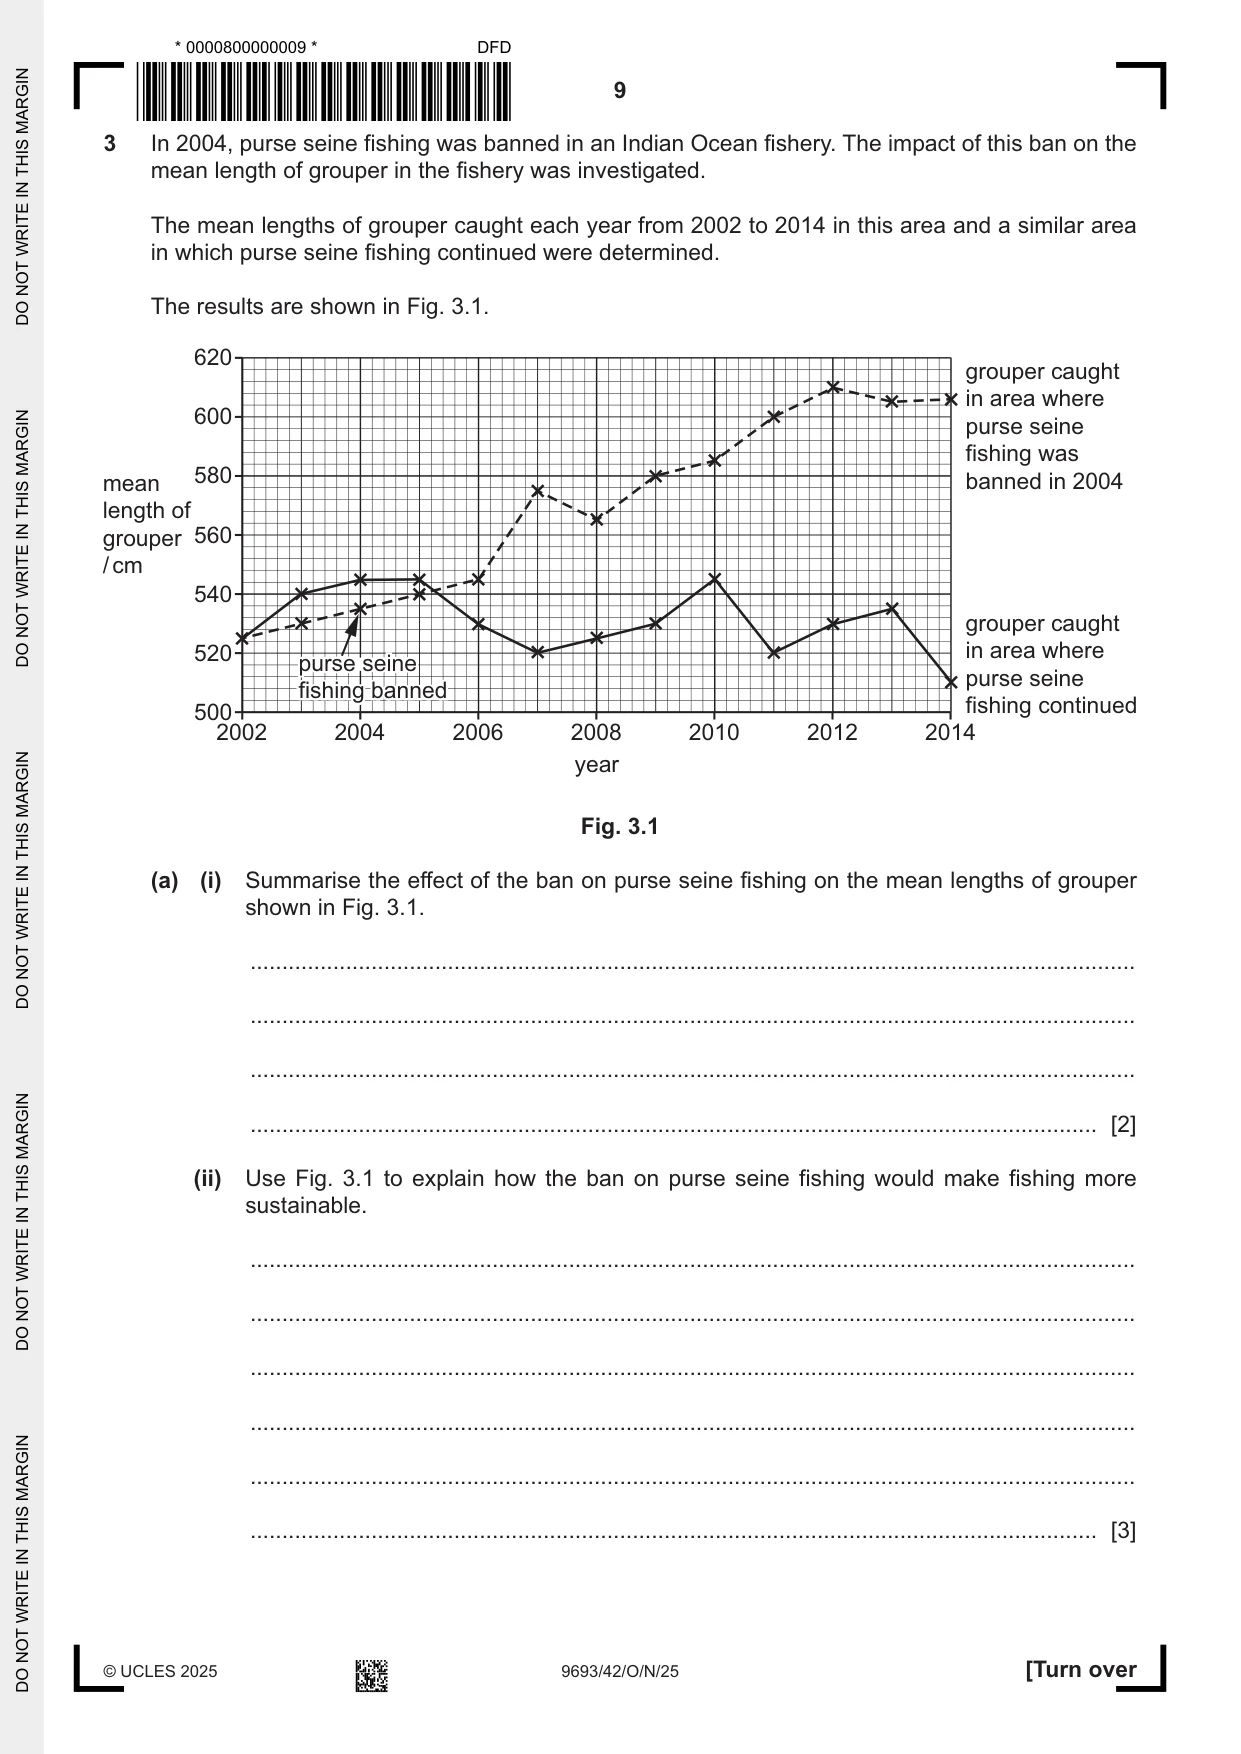
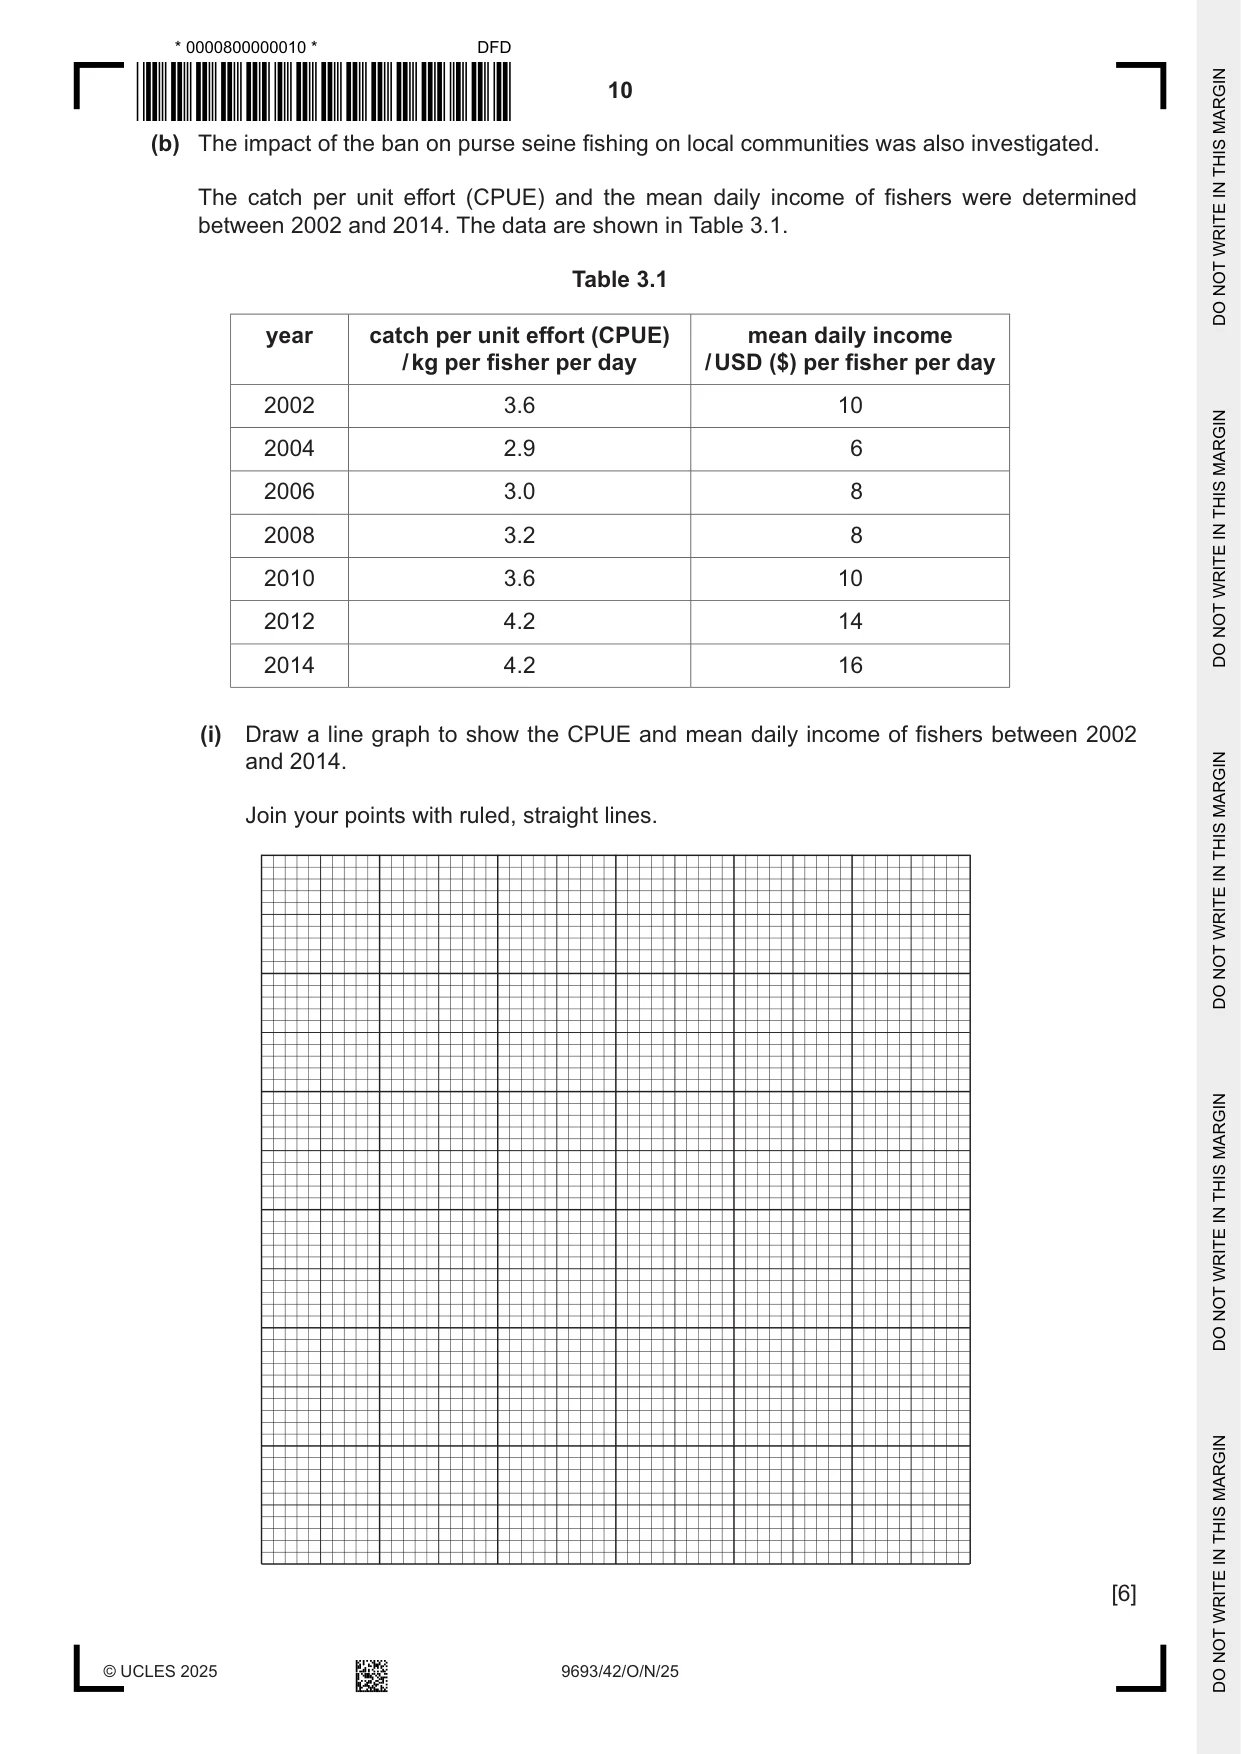
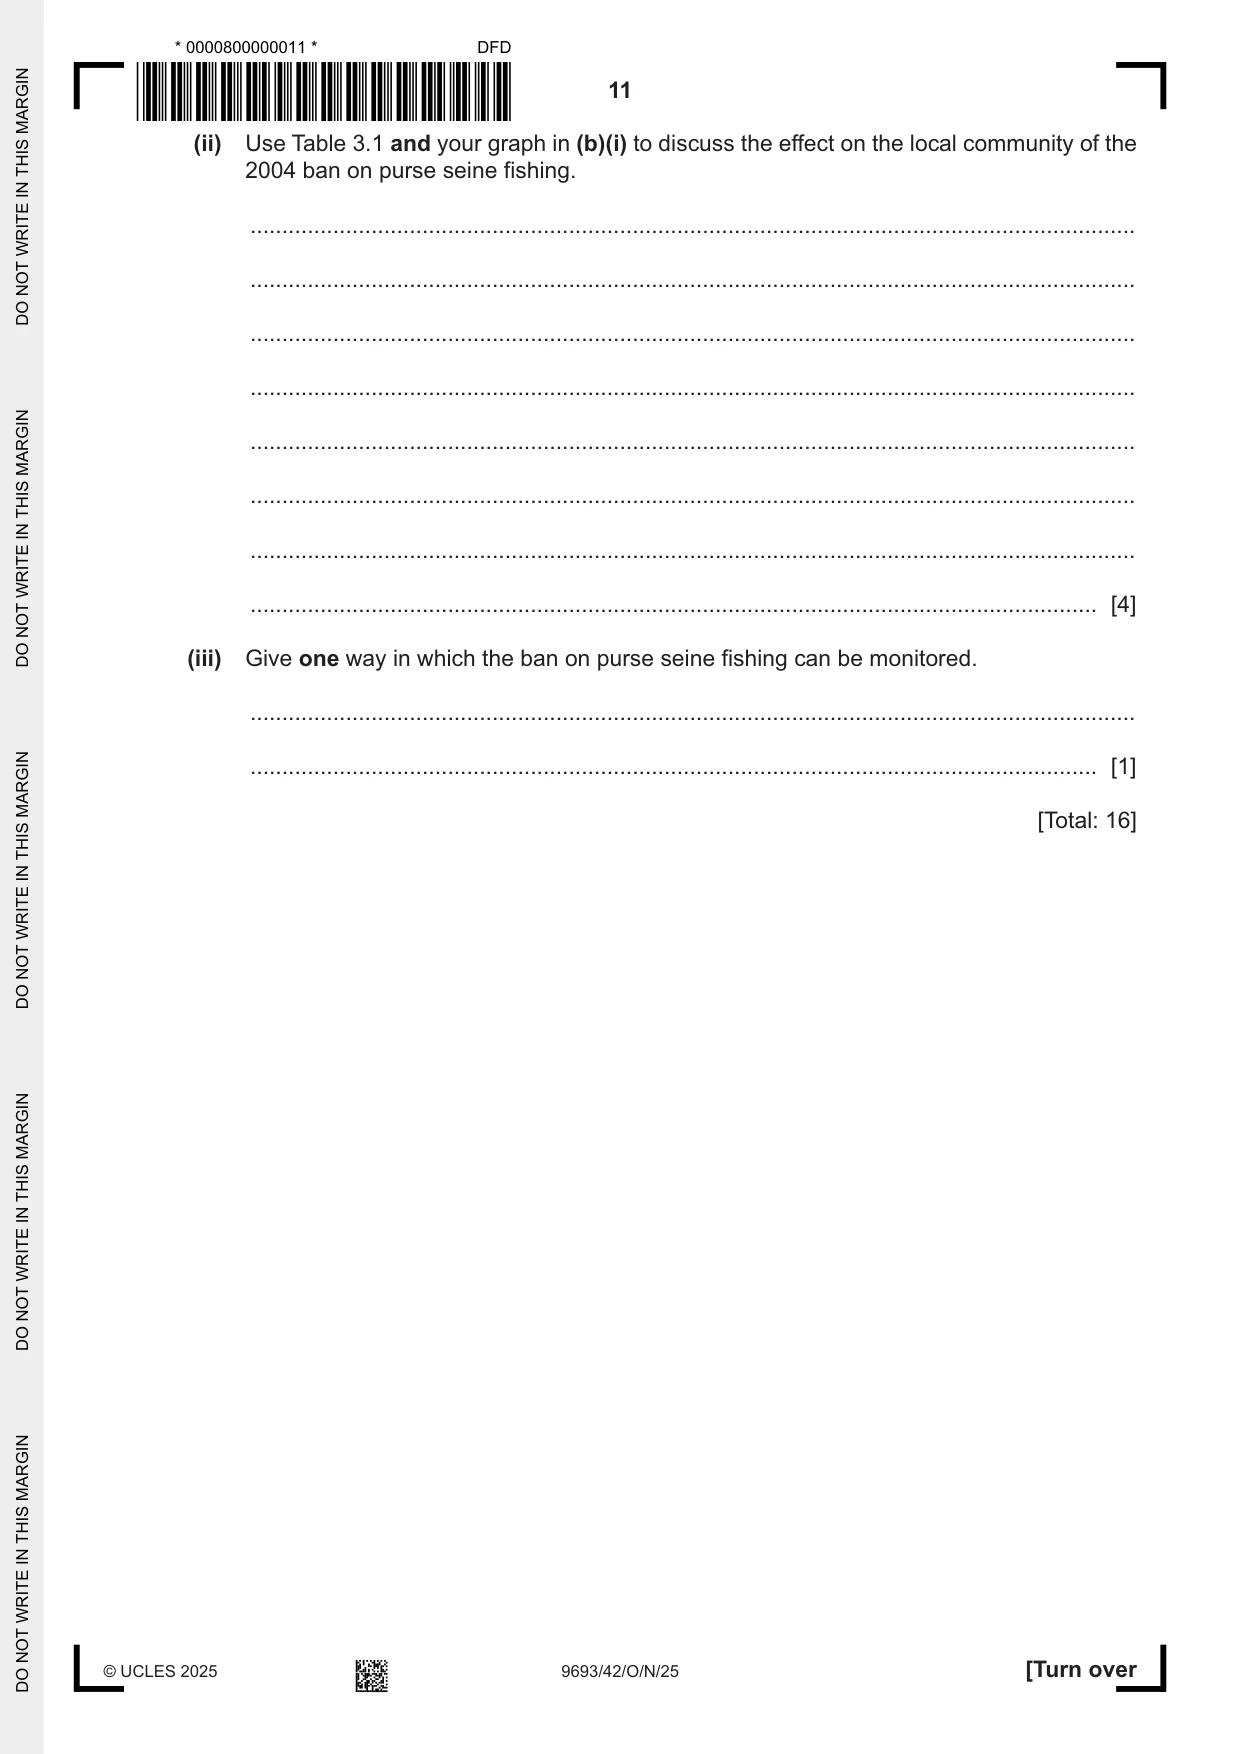
3 In 2004, purse seine fishing was banned in an Indian Ocean fishery. The impact of this ban on the mean length of grouper in the fishery was investigated. The mean lengths of grouper caught each year from 2002 to 2014 in this area and a similar area in which purse seine fishing continued were determined. The results are shown in Fig. 3.1. 620 grouper caught in area where 600 purse seine fishing was 580 banned in 2004mean length of grouper 560 / cm 540 grouper caught 520 in area where pursepurse seineseine purse seine fishingfishing bannedbanned fishing continued 500 2002 2004 2006 2008 2010 2012 2014 year Fig. 3.1 (a) (i) Summarise the effect of the ban on purse seine fishing on the mean lengths of grouper shown in Fig. 3.1. ........................................................................................................................................... ........................................................................................................................................... ........................................................................................................................................... ..................................................................................................................................... [2] (ii) Use Fig. 3.1 to explain how the ban on purse seine fishing would make fishing more sustainable. ........................................................................................................................................... ........................................................................................................................................... ........................................................................................................................................... ........................................................................................................................................... ........................................................................................................................................... ..................................................................................................................................... [3] (b) The impact of the ban on purse seine fishing on local communities was also investigated. The catch per unit effort (CPUE) and the mean daily income of fishers were determined between 2002 and 2014. The data are shown in Table 3.1. Table 3.1 year catch per unit effort (CPUE) mean daily income / kg per fisher per day / USD ($) per fisher per day 2002 3.6 10 2004 2.9 6 2006 3.0 8 2008 3.2 8 2010 3.6 10 2012 4.2 14 2014 4.2 16 (i) Draw a line graph to show the CPUE and mean daily income of fishers between 2002 and 2014. Join your points with ruled, straight lines. [6] (ii) Use Table 3.1 and your graph in (b)(i) to discuss the effect on the local community of the 2004 ban on purse seine fishing. ........................................................................................................................................... ........................................................................................................................................... ........................................................................................................................................... ........................................................................................................................................... ........................................................................................................................................... ........................................................................................................................................... ........................................................................................................................................... ..................................................................................................................................... [4] (iii) Give one way in which the ban on purse seine fishing can be monitored. ........................................................................................................................................... ..................................................................................................................................... [1] [Total: 16]
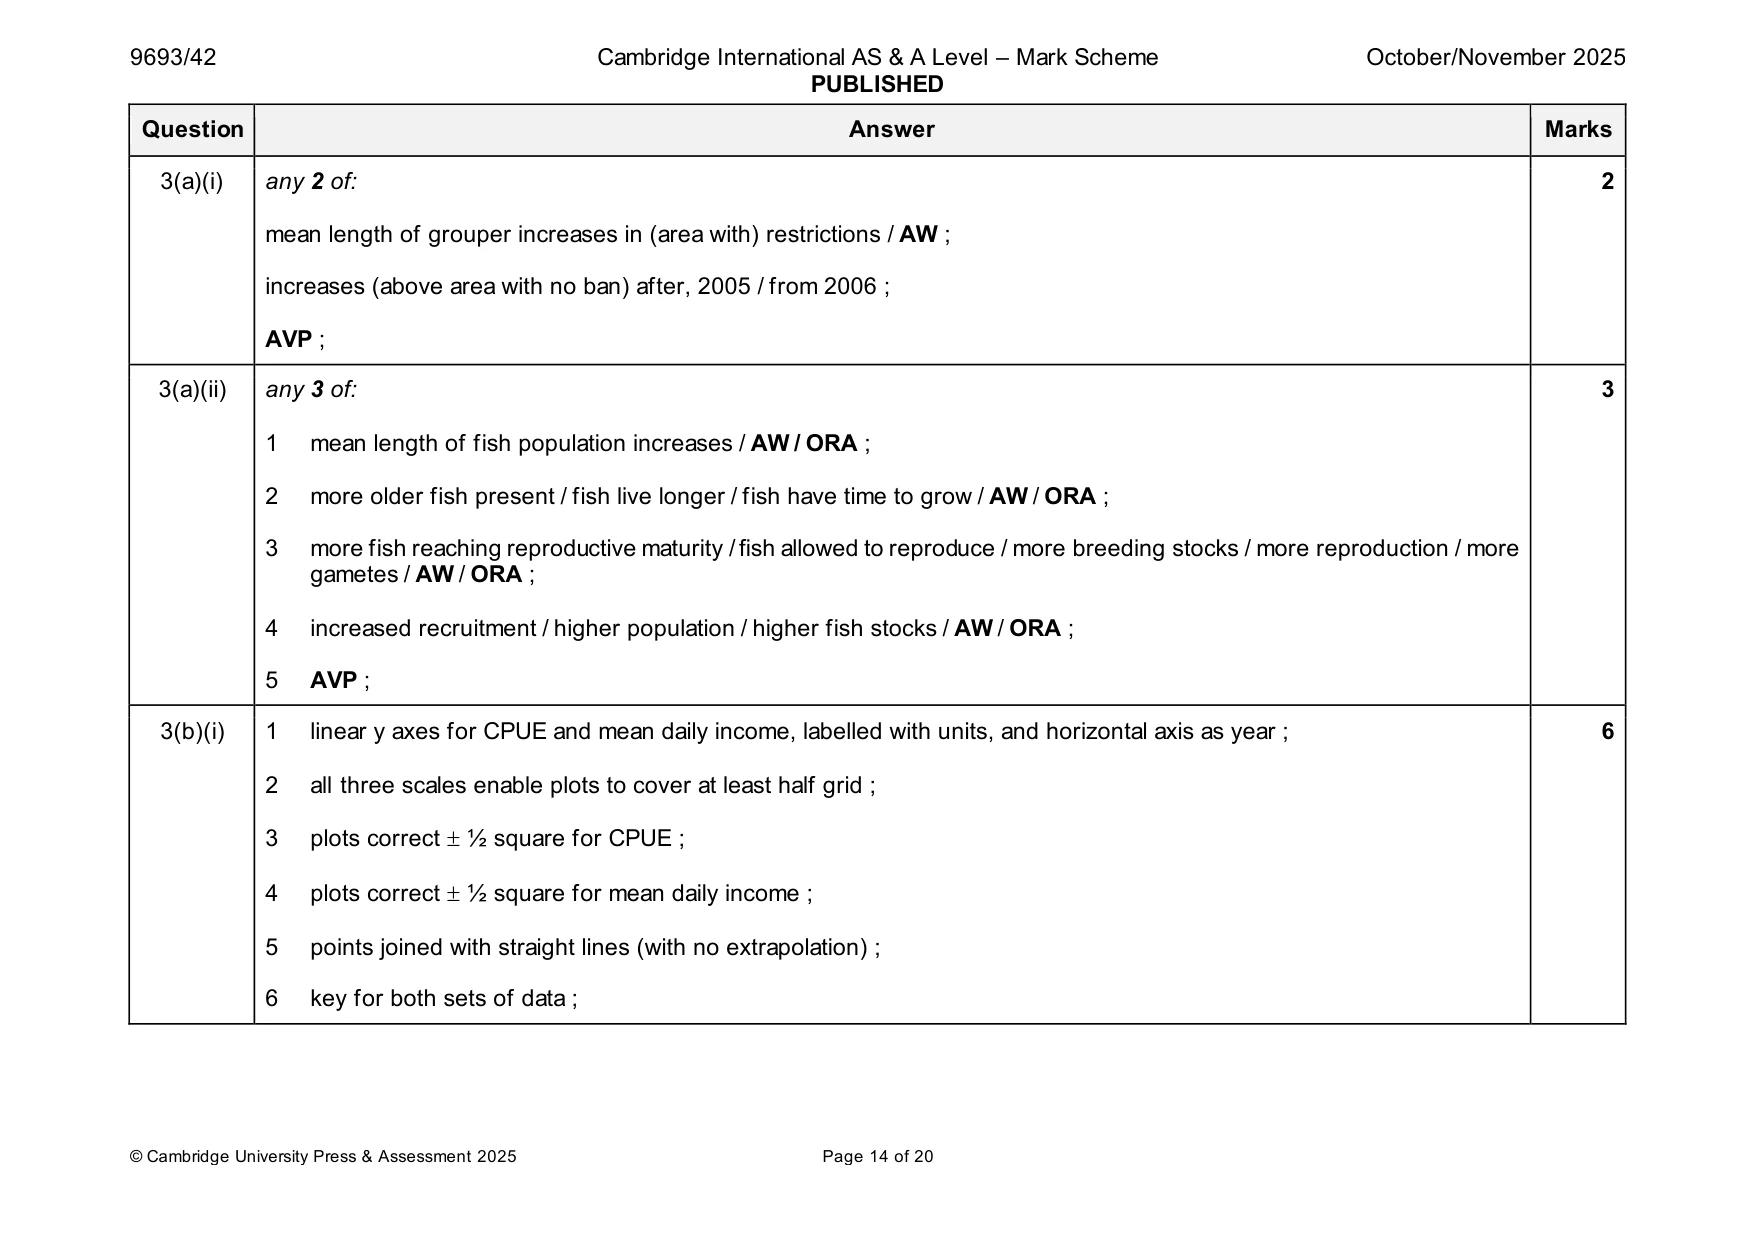
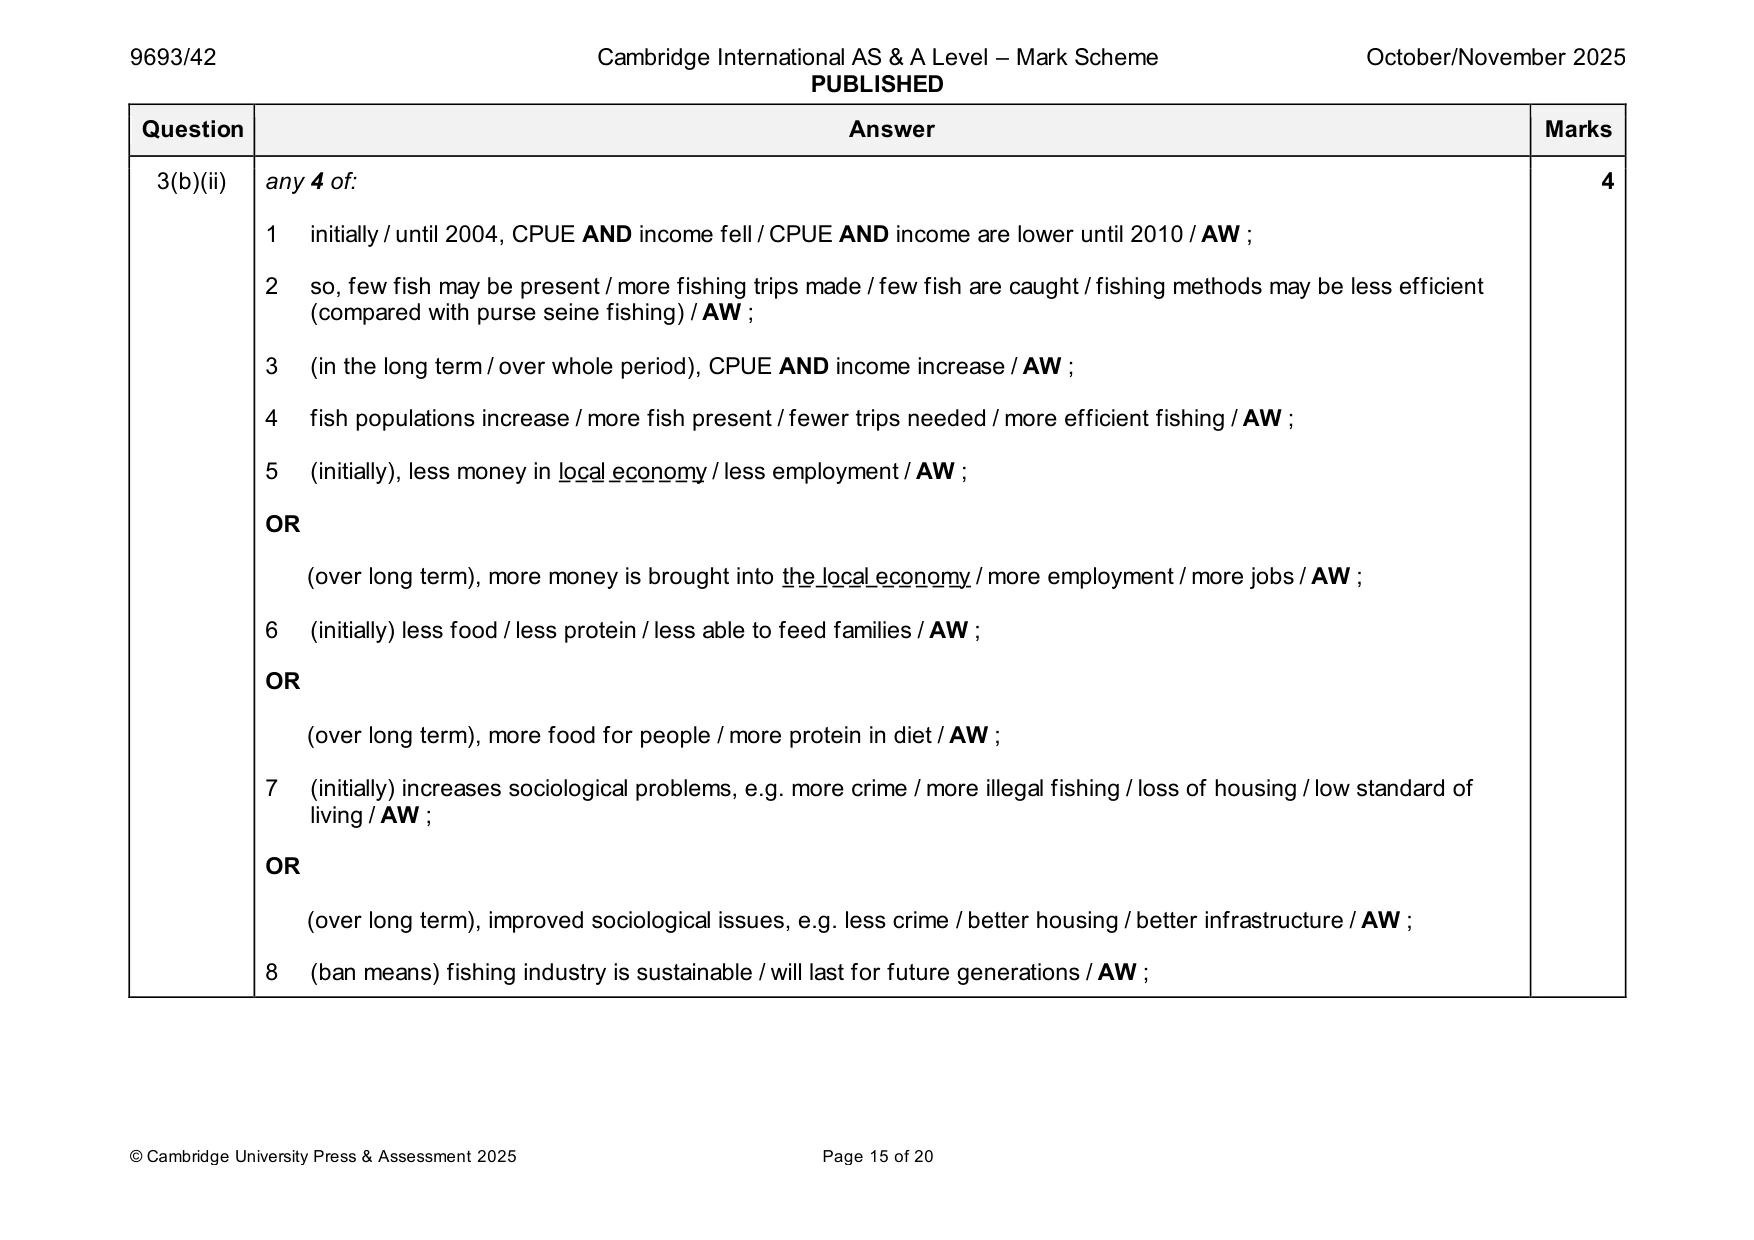
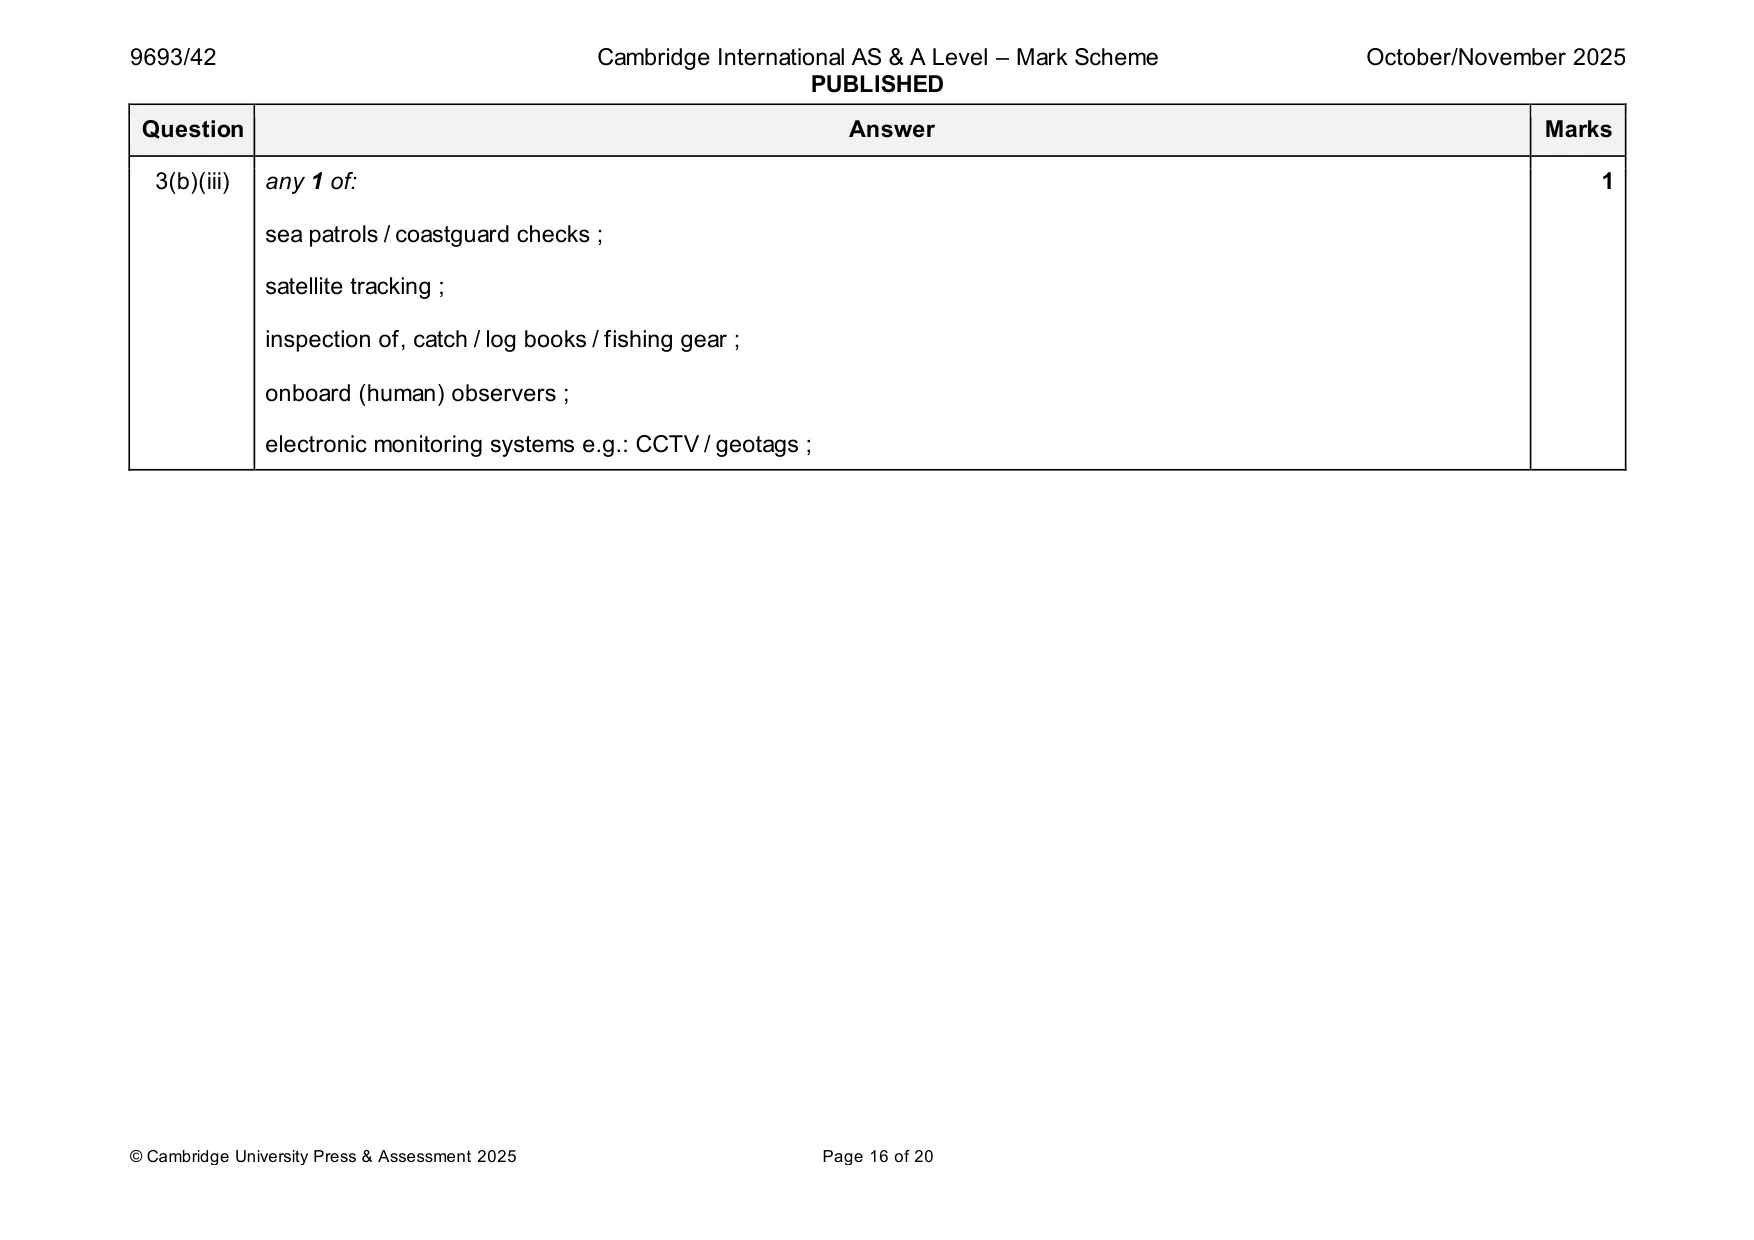
Mark scheme: 3(a)(i) any 2 of: 2 mean length of grouper increases in (area with) restrictions / AW ; increases (above area with no ban) after, 2005 / from 2006 ; AVP ; 3(a)(ii) any 3 of: 3 1 mean length of fish population increases / AW / ORA ; 2 more older fish present / fish live longer / fish have time to grow / AW / ORA ; 3 more fish reaching reproductive maturity / fish allowed to reproduce / more breeding stocks / more reproduction / more gametes / AW / ORA ; 4 increased recruitment / higher population / higher fish stocks / AW / ORA ; 5 AVP ; 3(b)(i) 1 linear y axes for CPUE and mean daily income, labelled with units, and horizontal axis as year ; 6 2 all three scales enable plots to cover at least half grid ; 3 plots correct ½ square for CPUE ; 4 plots correct ½ square for mean daily income ; 5 points joined with straight lines (with no extrapolation) ; 6 key for both sets of data ; 3(b)(ii) any 4 of: 4 1 initially / until 2004, CPUE AND income fell / CPUE AND income are lower until 2010 / AW ; 2 so, few fish may be present / more fishing trips made / few fish are caught / fishing methods may be less efficient (compared with purse seine fishing) / AW ; 3 (in the long term / over whole period), CPUE AND income increase / AW ; 4 fish populations increase / more fish present / fewer trips needed / more efficient fishing / AW ; 5 (initially), less money in local economy / less employment / AW ; OR (over long term), more money is brought into the local economy / more employment / more jobs / AW ; 6 (initially) less food / less protein / less able to feed families / AW ; OR (over long term), more food for people / more protein in diet / AW ; 7 (initially) increases sociological problems, e.g. more crime / more illegal fishing / loss of housing / low standard of living / AW ; OR (over long term), improved sociological issues, e.g. less crime / better housing / better infrastructure / AW ; 8 (ban means) fishing industry is sustainable / will last for future generations / AW ; 3(b)(iii) any 1 of: 1 sea patrols / coastguard checks ; satellite tracking ; inspection of, catch / log books / fishing gear ; onboard (human) observers ; electronic monitoring systems e.g.: CCTV / geotags ;
Q4 · Environmental groups have warned that increasing ocean acidification is causing the…
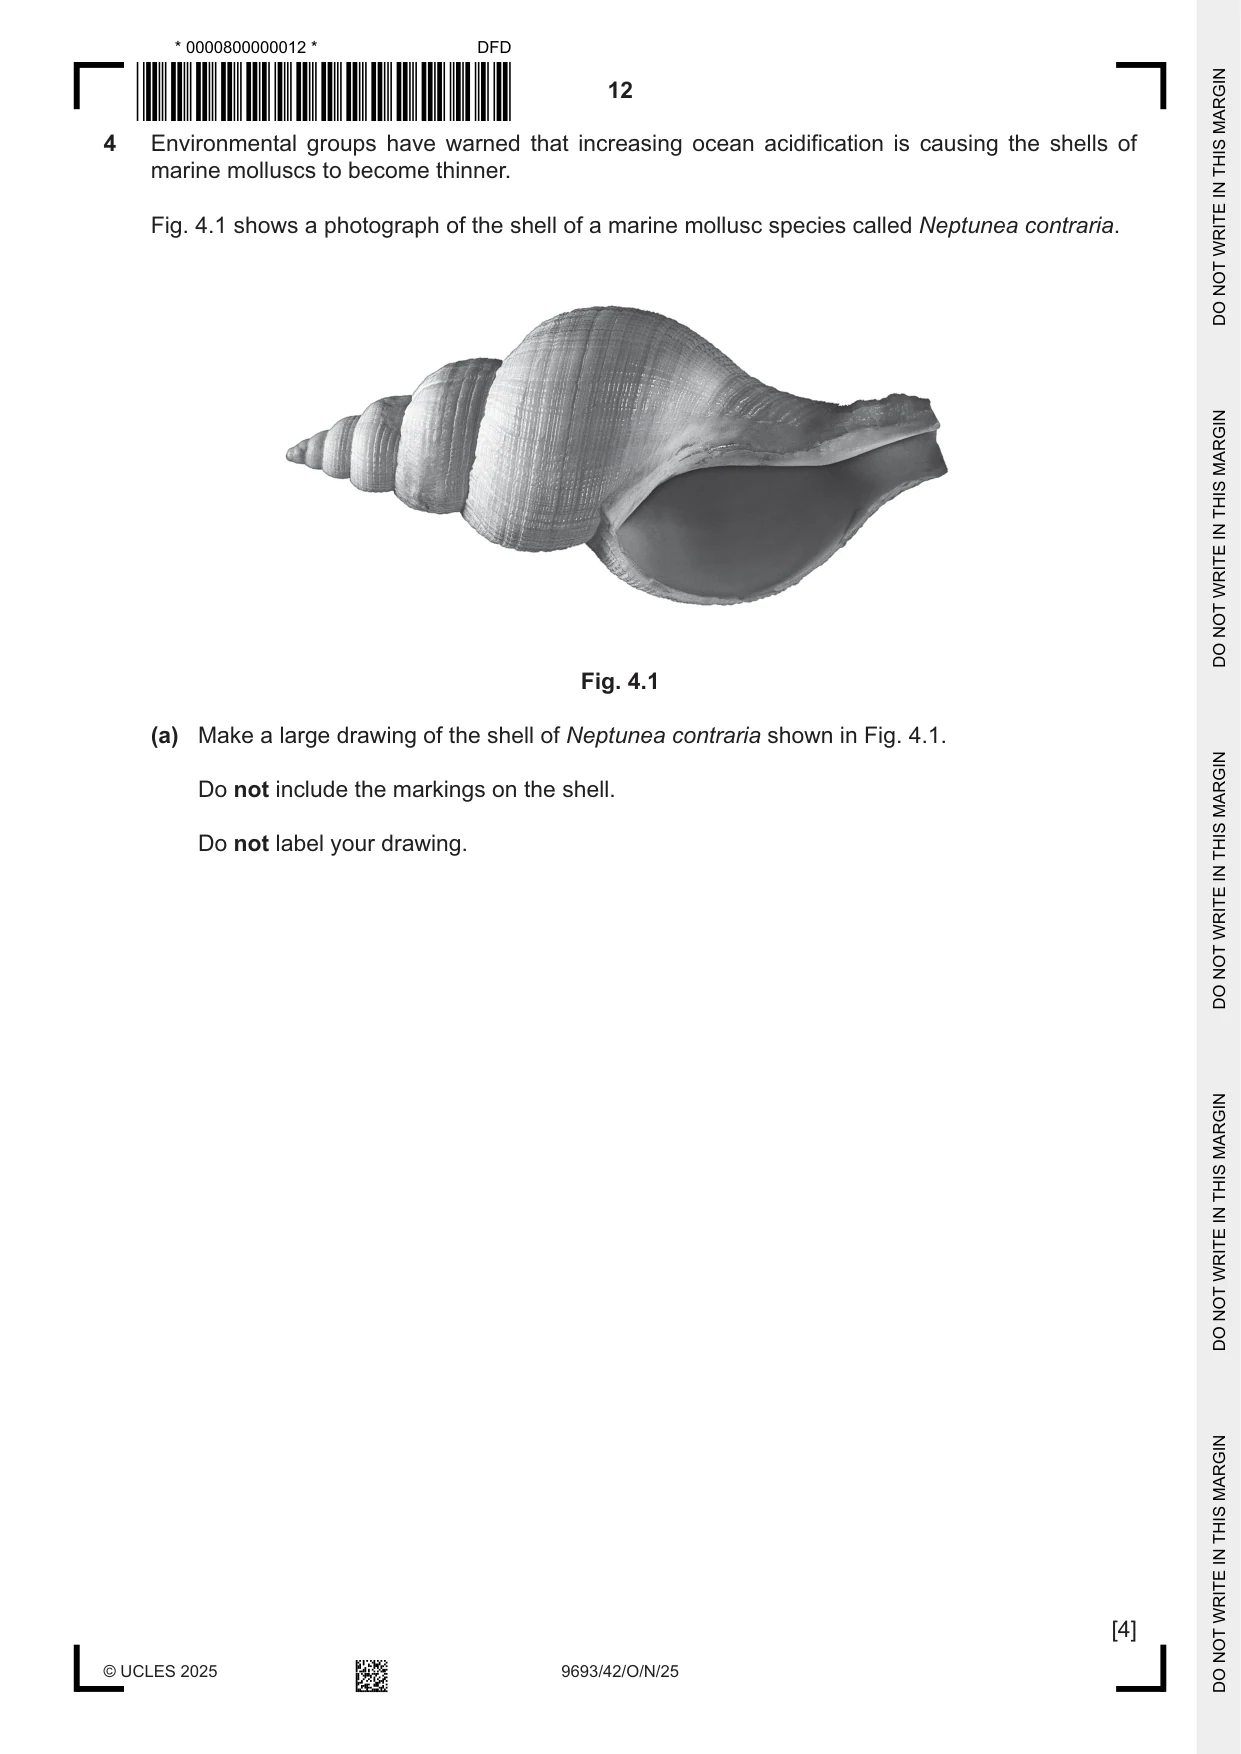
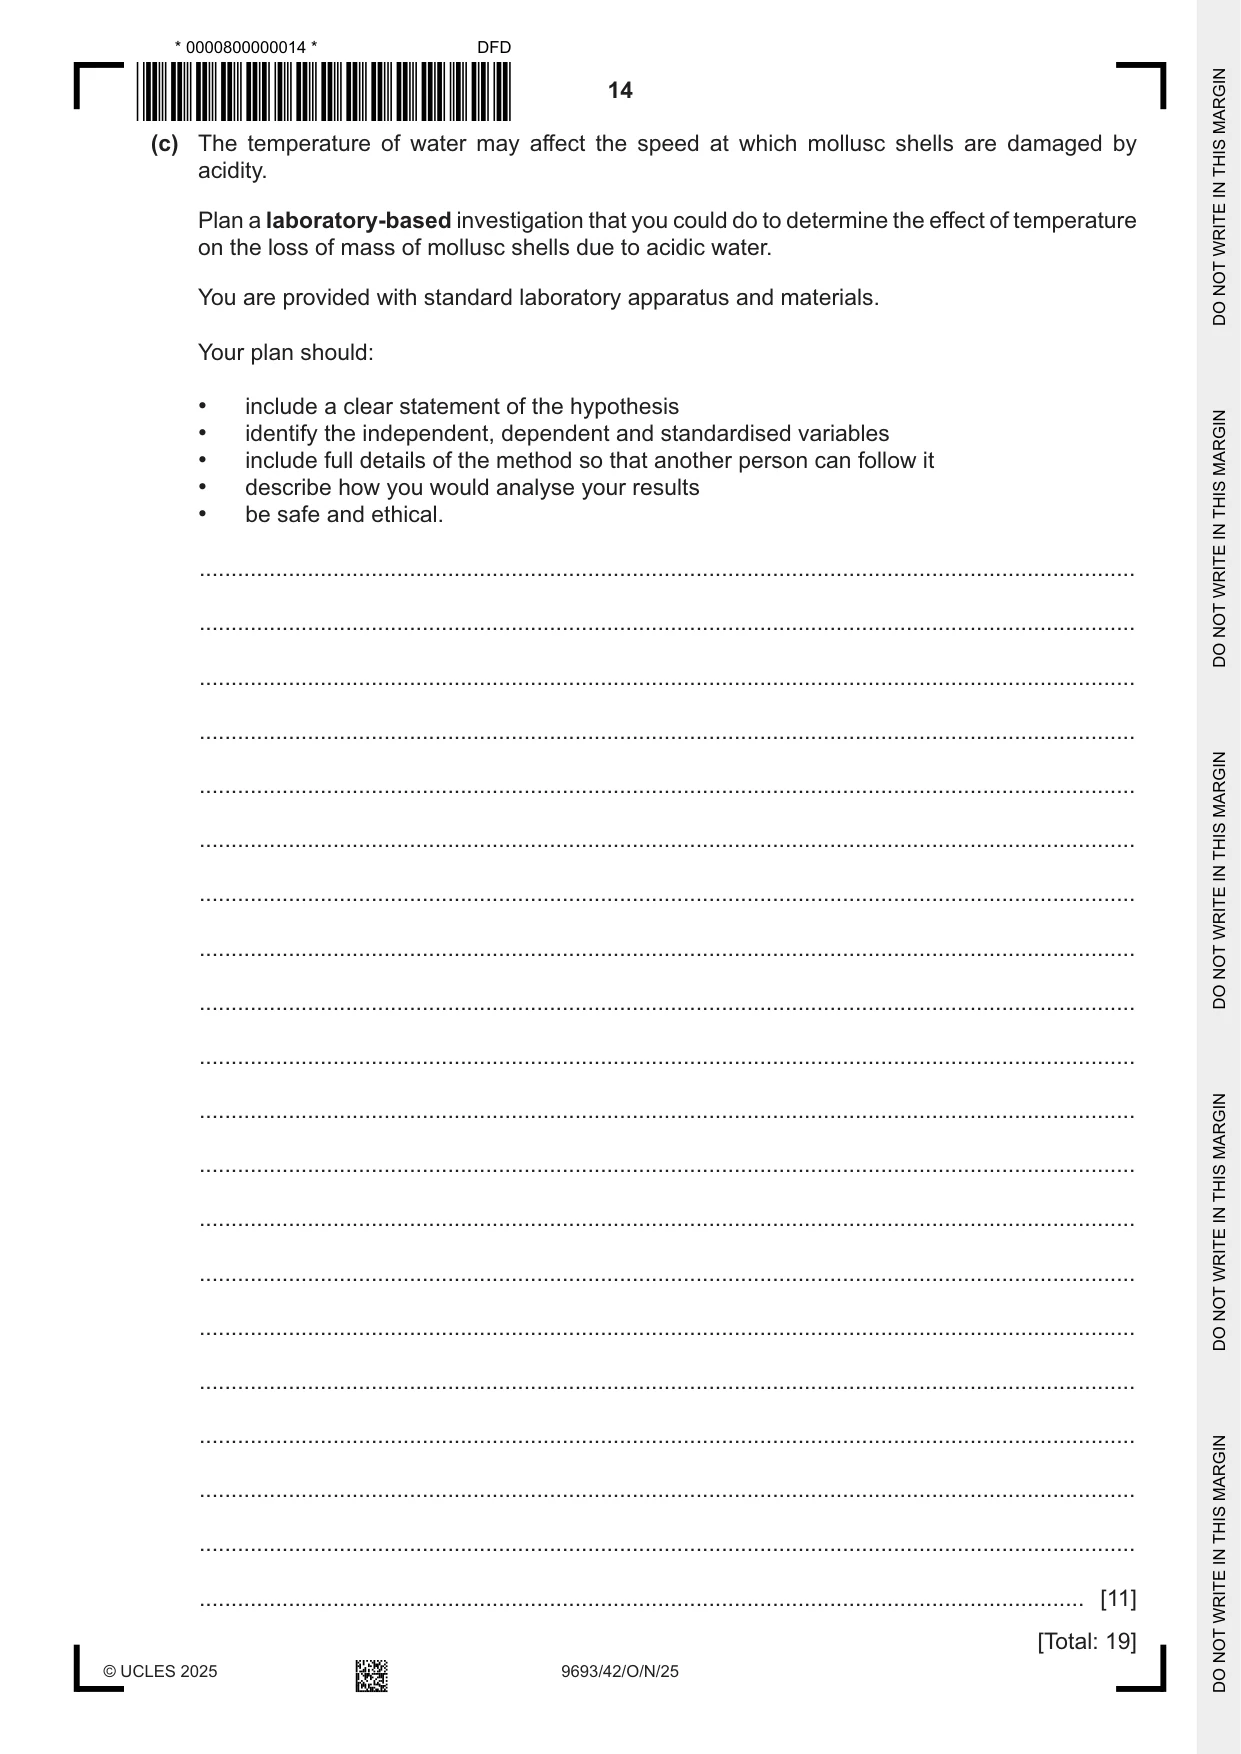
4 Environmental groups have warned that increasing ocean acidification is causing the shells of marine molluscs to become thinner. Fig. 4.1 shows a photograph of the shell of a marine mollusc species called Neptunea contraria. Fig. 4.1 (a) Make a large drawing of the shell of Neptunea contraria shown in Fig. 4.1. Do not include the markings on the shell. Do not label your drawing. [4] (b) (i) Describe how carbon dioxide reacts with water to affect the pH. ........................................................................................................................................... ........................................................................................................................................... ........................................................................................................................................... ..................................................................................................................................... [2] (ii) Explain why excess atmospheric carbon dioxide can cause the shells of marine molluscs to become thinner. ........................................................................................................................................... ........................................................................................................................................... ........................................................................................................................................... ..................................................................................................................................... [2] (c) The temperature of water may affect the speed at which mollusc shells are damaged by acidity. Plan a laboratory-based investigation that you could do to determine the effect of temperature on the loss of mass of mollusc shells due to acidic water. You are provided with standard laboratory apparatus and materials. Your plan should: • include a clear statement of the hypothesis • identify the independent, dependent and standardised variables • include full details of the method so that another person can follow it • describe how you would analyse your results • be safe and ethical. ................................................................................................................................................... ................................................................................................................................................... ................................................................................................................................................... ................................................................................................................................................... ................................................................................................................................................... ................................................................................................................................................... ................................................................................................................................................... ................................................................................................................................................... ................................................................................................................................................... ................................................................................................................................................... ................................................................................................................................................... ................................................................................................................................................... ................................................................................................................................................... ................................................................................................................................................... ................................................................................................................................................... ................................................................................................................................................... ................................................................................................................................................... ................................................................................................................................................... ................................................................................................................................................... ........................................................................................................................................... [11] [Total: 19]
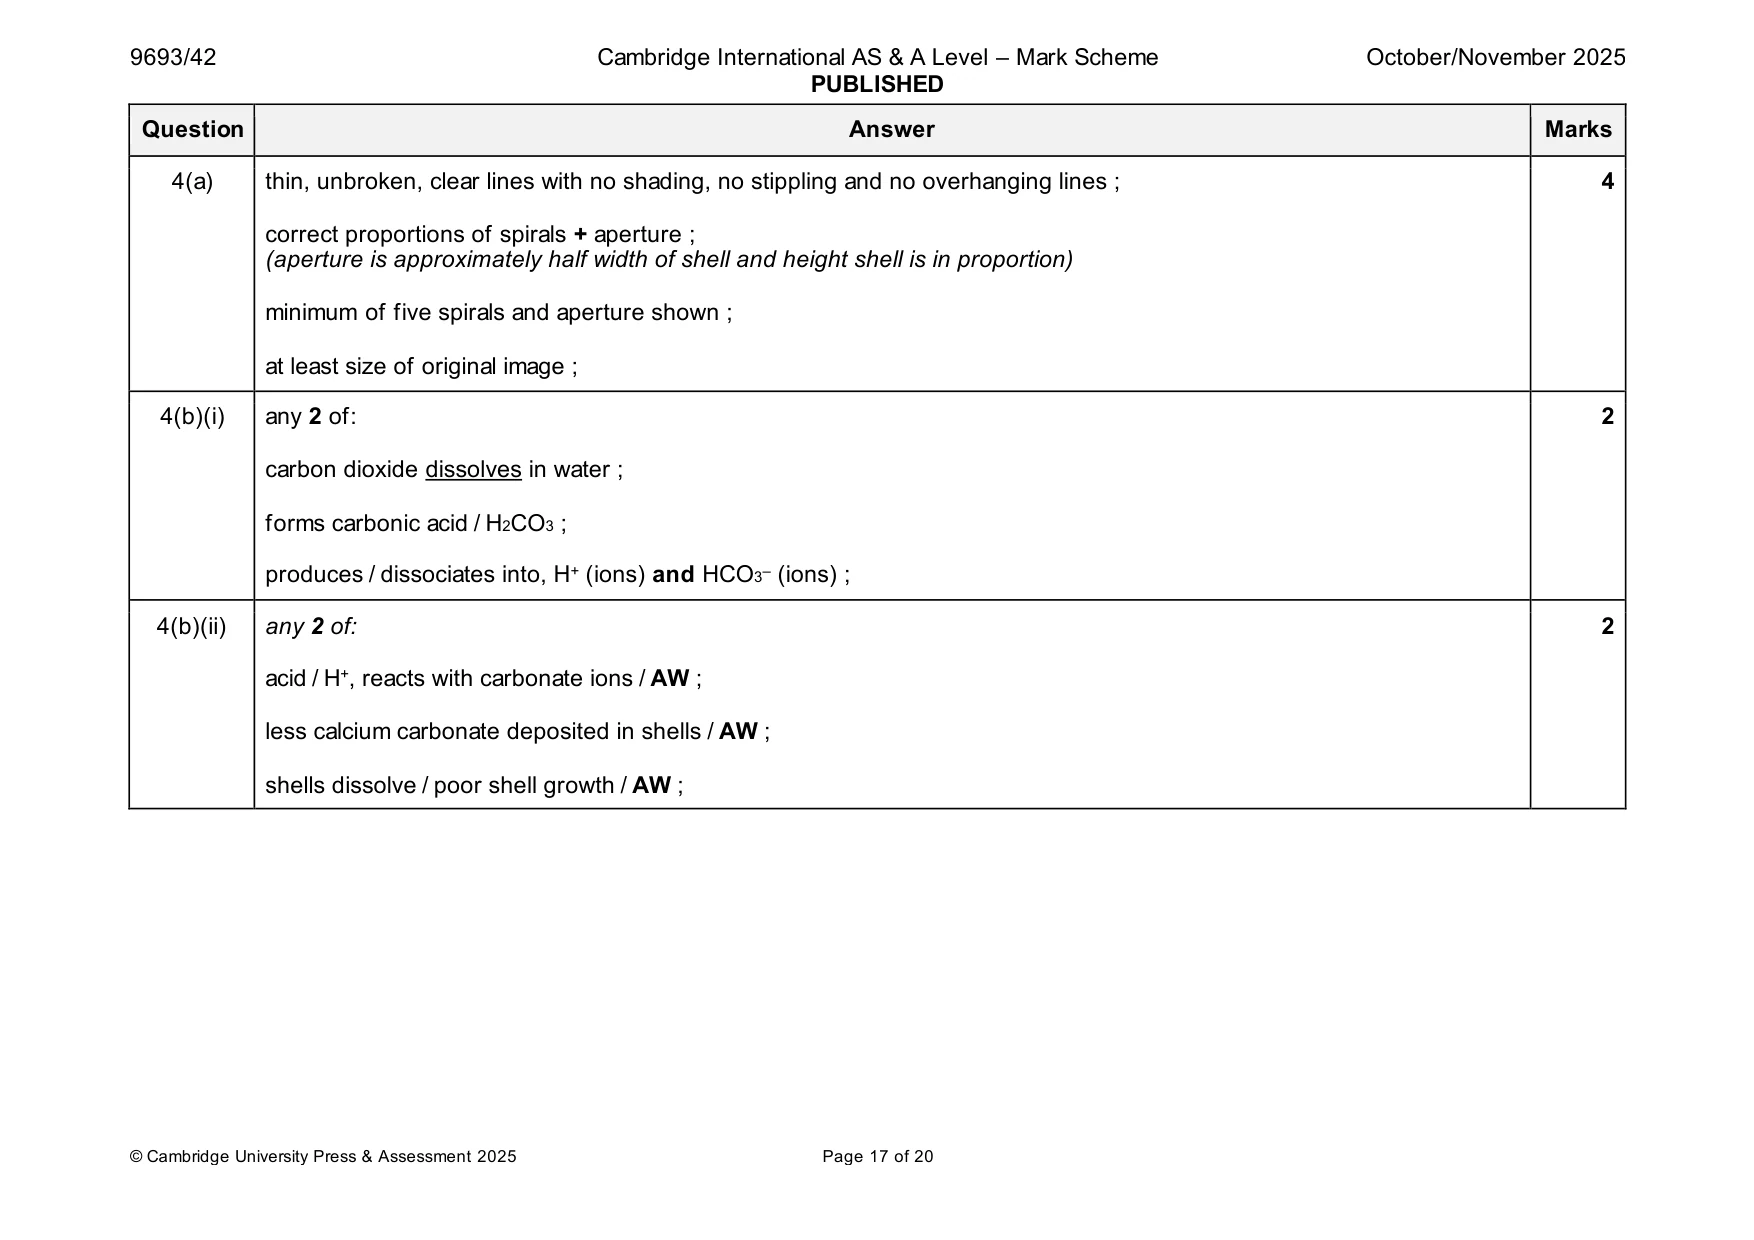
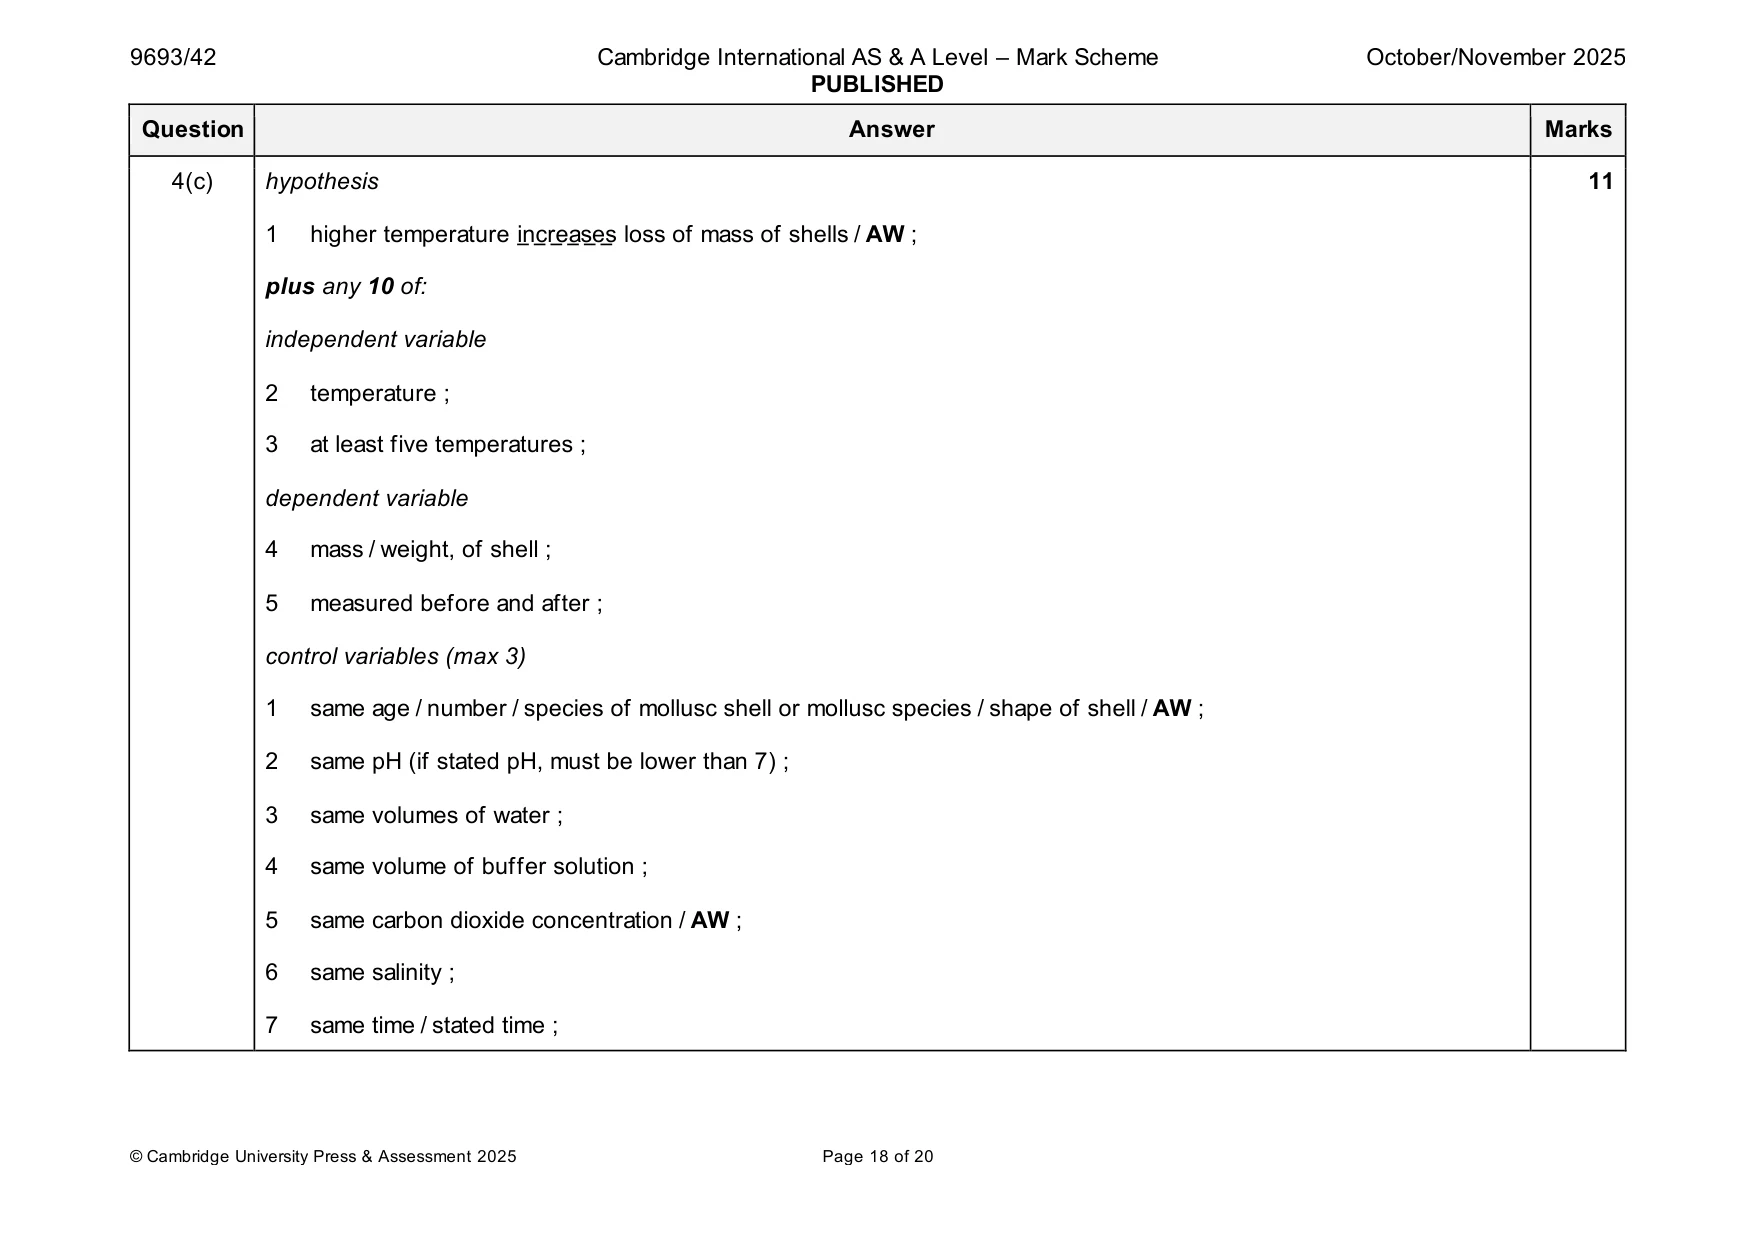
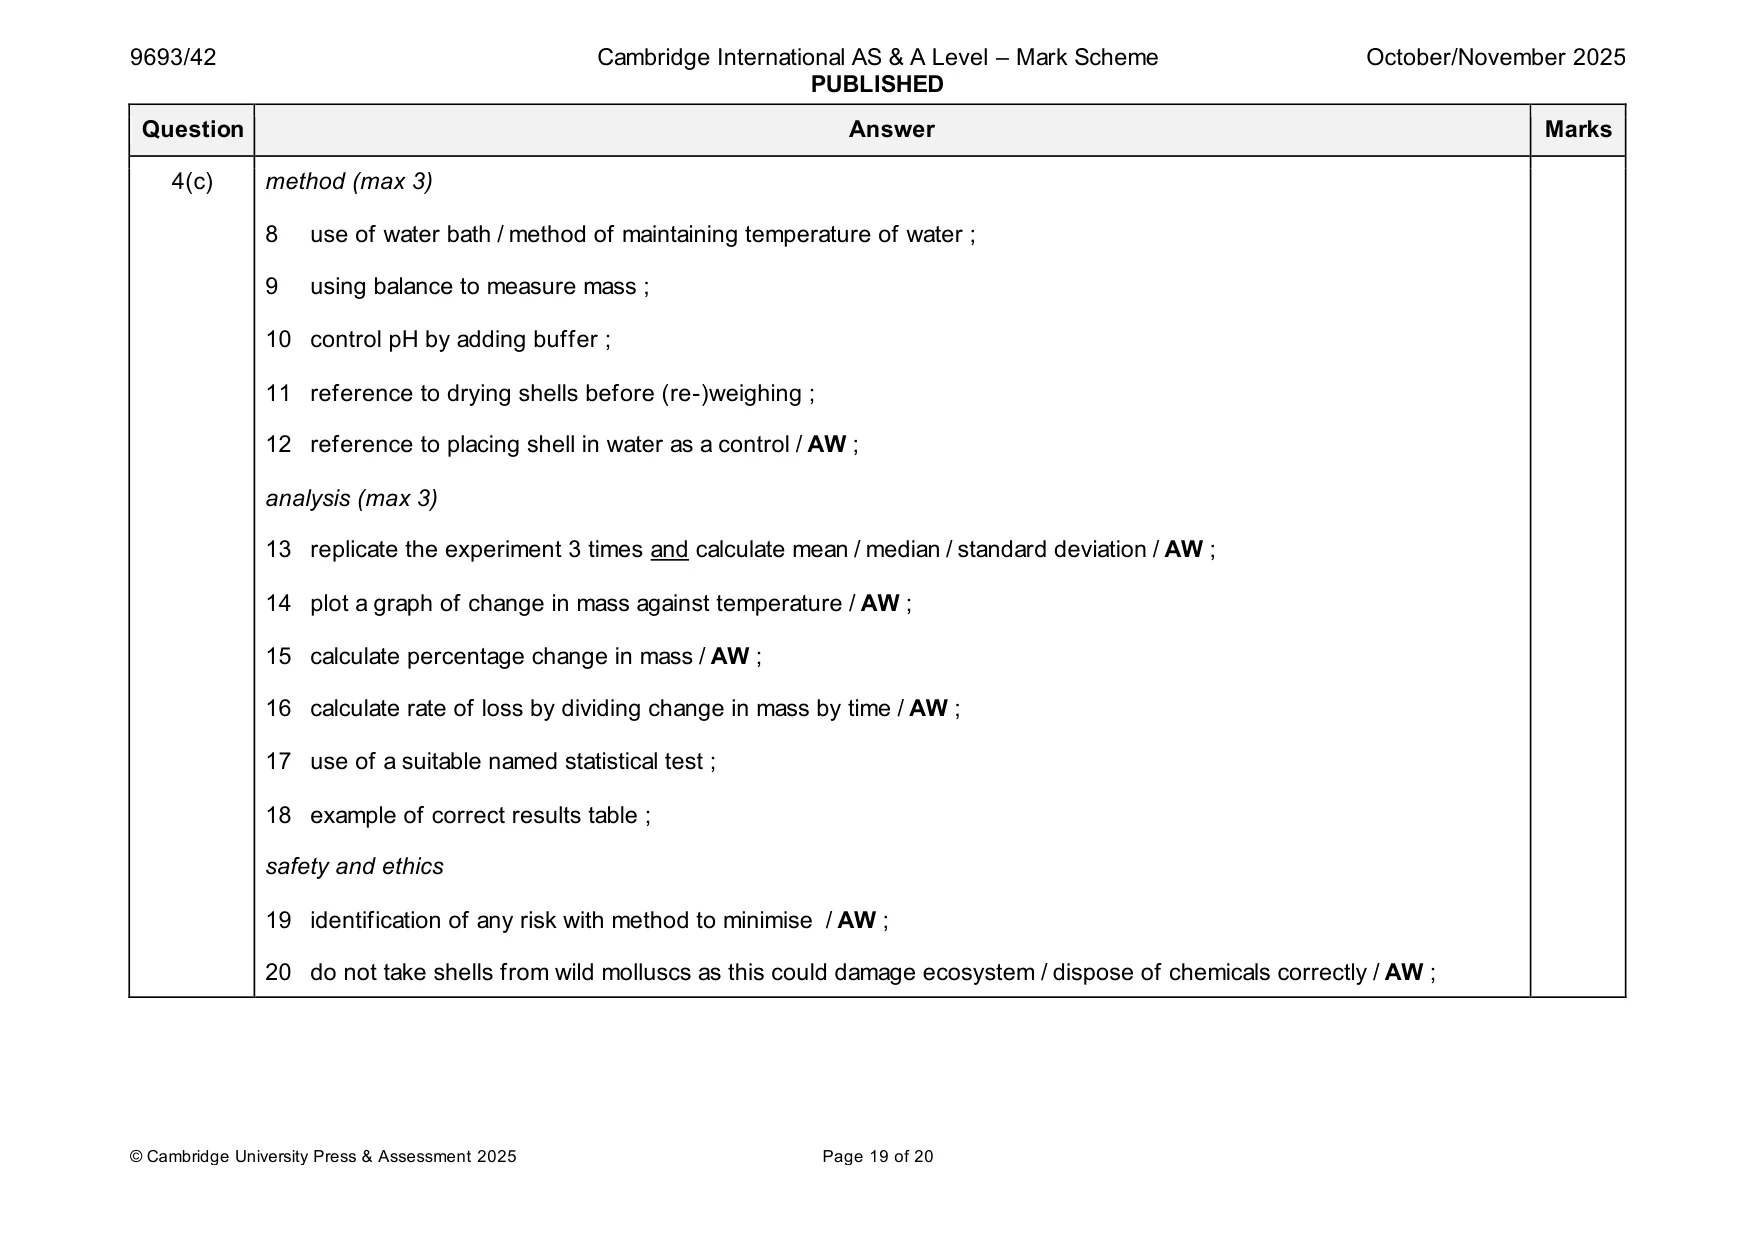
Mark scheme: 4(a) thin, unbroken, clear lines with no shading, no stippling and no overhanging lines ; 4 correct proportions of spirals + aperture ; (aperture is approximately half width of shell and height shell is in proportion) minimum of five spirals and aperture shown ; at least size of original image ; 4(b)(i) any 2 of: 2 carbon dioxide dissolves in water ; forms carbonic acid / H2CO3 ; produces / dissociates into, H+ (ions) and HCO3– (ions) ; 4(b)(ii) any 2 of: 2 acid / H+, reacts with carbonate ions / AW ; less calcium carbonate deposited in shells / AW ; shells dissolve / poor shell growth / AW ; 4(c) hypothesis 11 1 higher temperature increases loss of mass of shells / AW ; plus any 10 of: independent variable 2 temperature ; 3 at least five temperatures ; dependent variable 4 mass / weight, of shell ; 5 measured before and after ; control variables (max 3) 1 same age / number / species of mollusc shell or mollusc species / shape of shell / AW ; 2 same pH (if stated pH, must be lower than 7) ; 3 same volumes of water ; 4 same volume of buffer solution ; 5 same carbon dioxide concentration / AW ; 6 same salinity ; 7 same time / stated time ; 4(c) method (max 3) 8 use of water bath / method of maintaining temperature of water ; 9 using balance to measure mass ; 10 control pH by adding buffer ; 11 reference to drying shells before (re-)weighing ; 12 reference to placing shell in water as a control / AW ; analysis (max 3) 13 replicate the experiment 3 times and calculate mean / median / standard deviation / AW ; 14 plot a graph of change in mass against temperature / AW ; 15 calculate percentage change in mass / AW ; 16 calculate rate of loss by dividing change in mass by time / AW ; 17 use of a suitable named statistical test ; 18 example of correct results table ; safety and ethics 19 identification of any risk with method to minimise / AW ; 20 do not take shells from wild molluscs as this could damage ecosystem / dispose of chemicals correctly / AW ;
Q5 · Pacific salmon are euryhaline fish that spend part of their life cycle in the sea and…
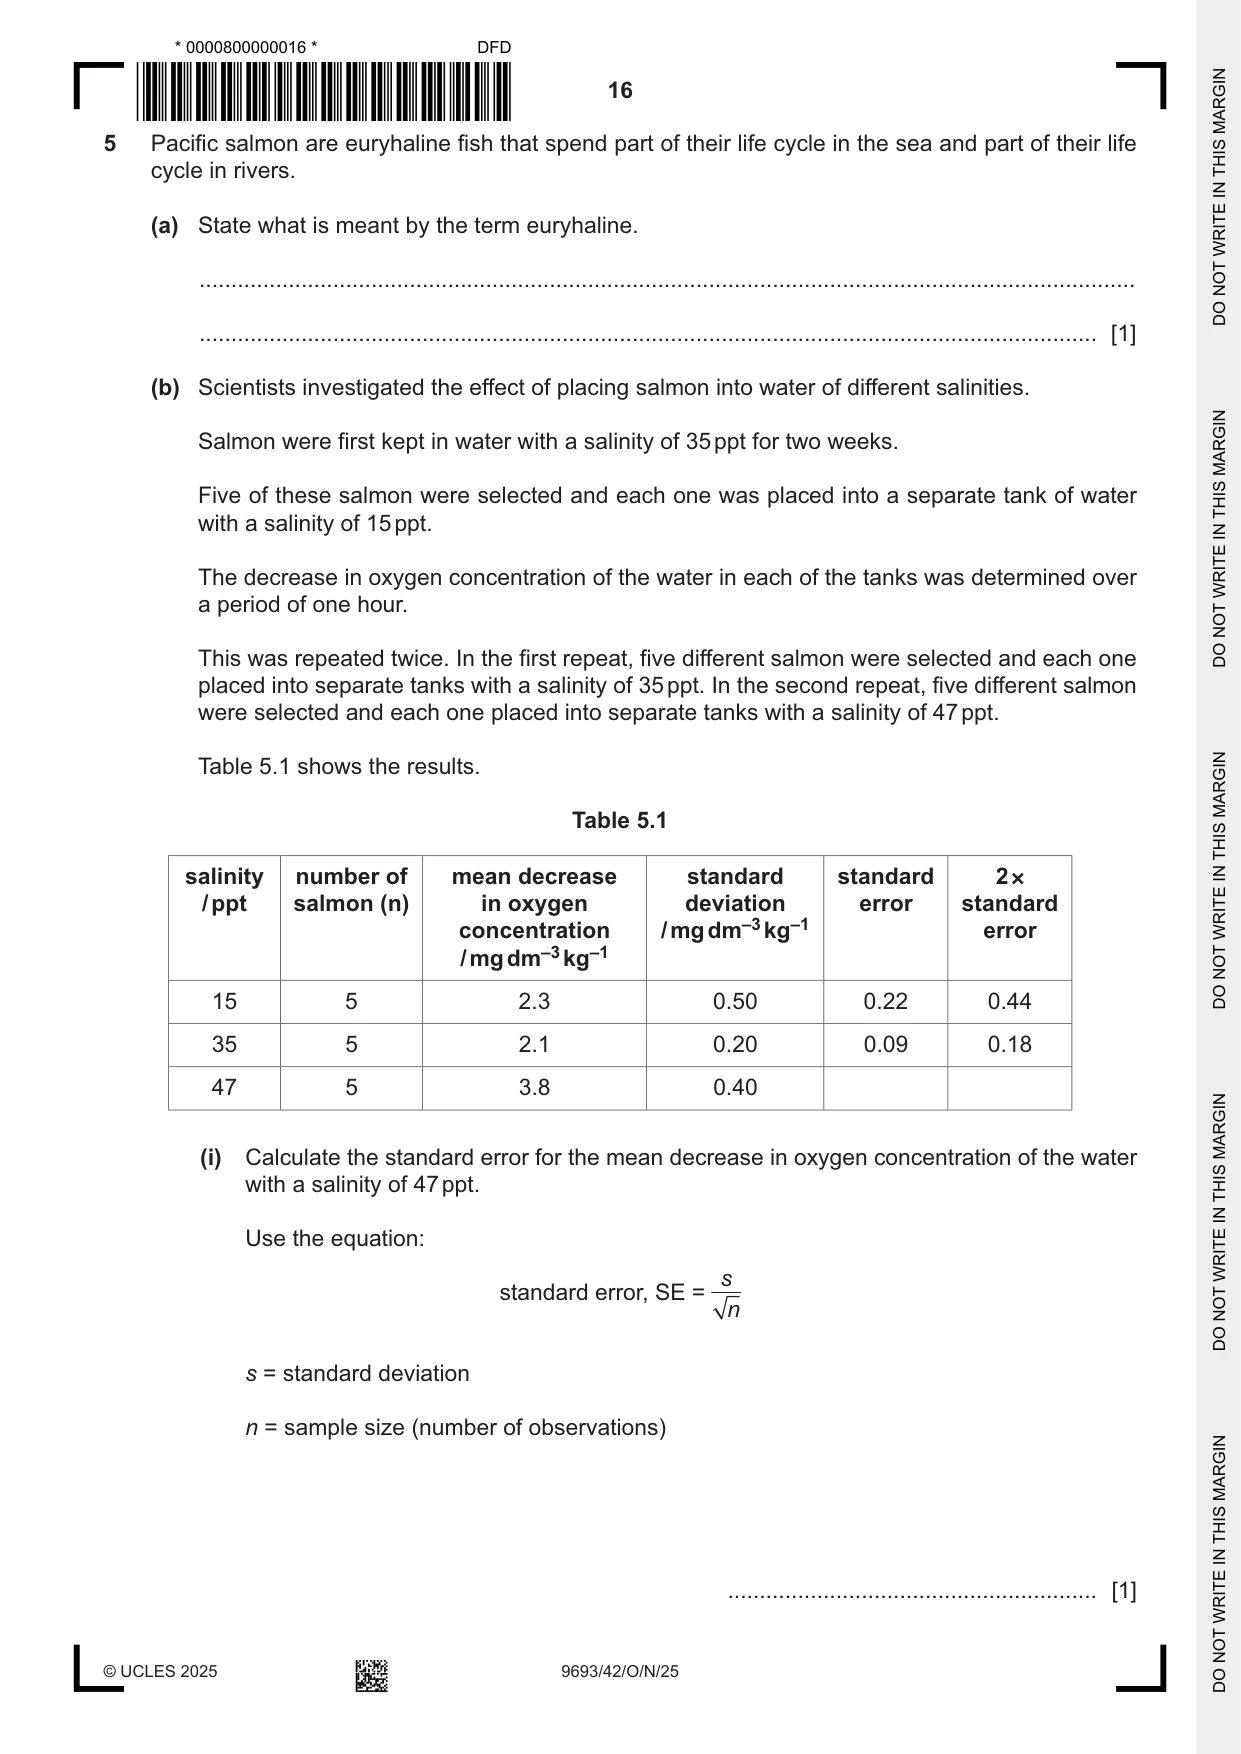
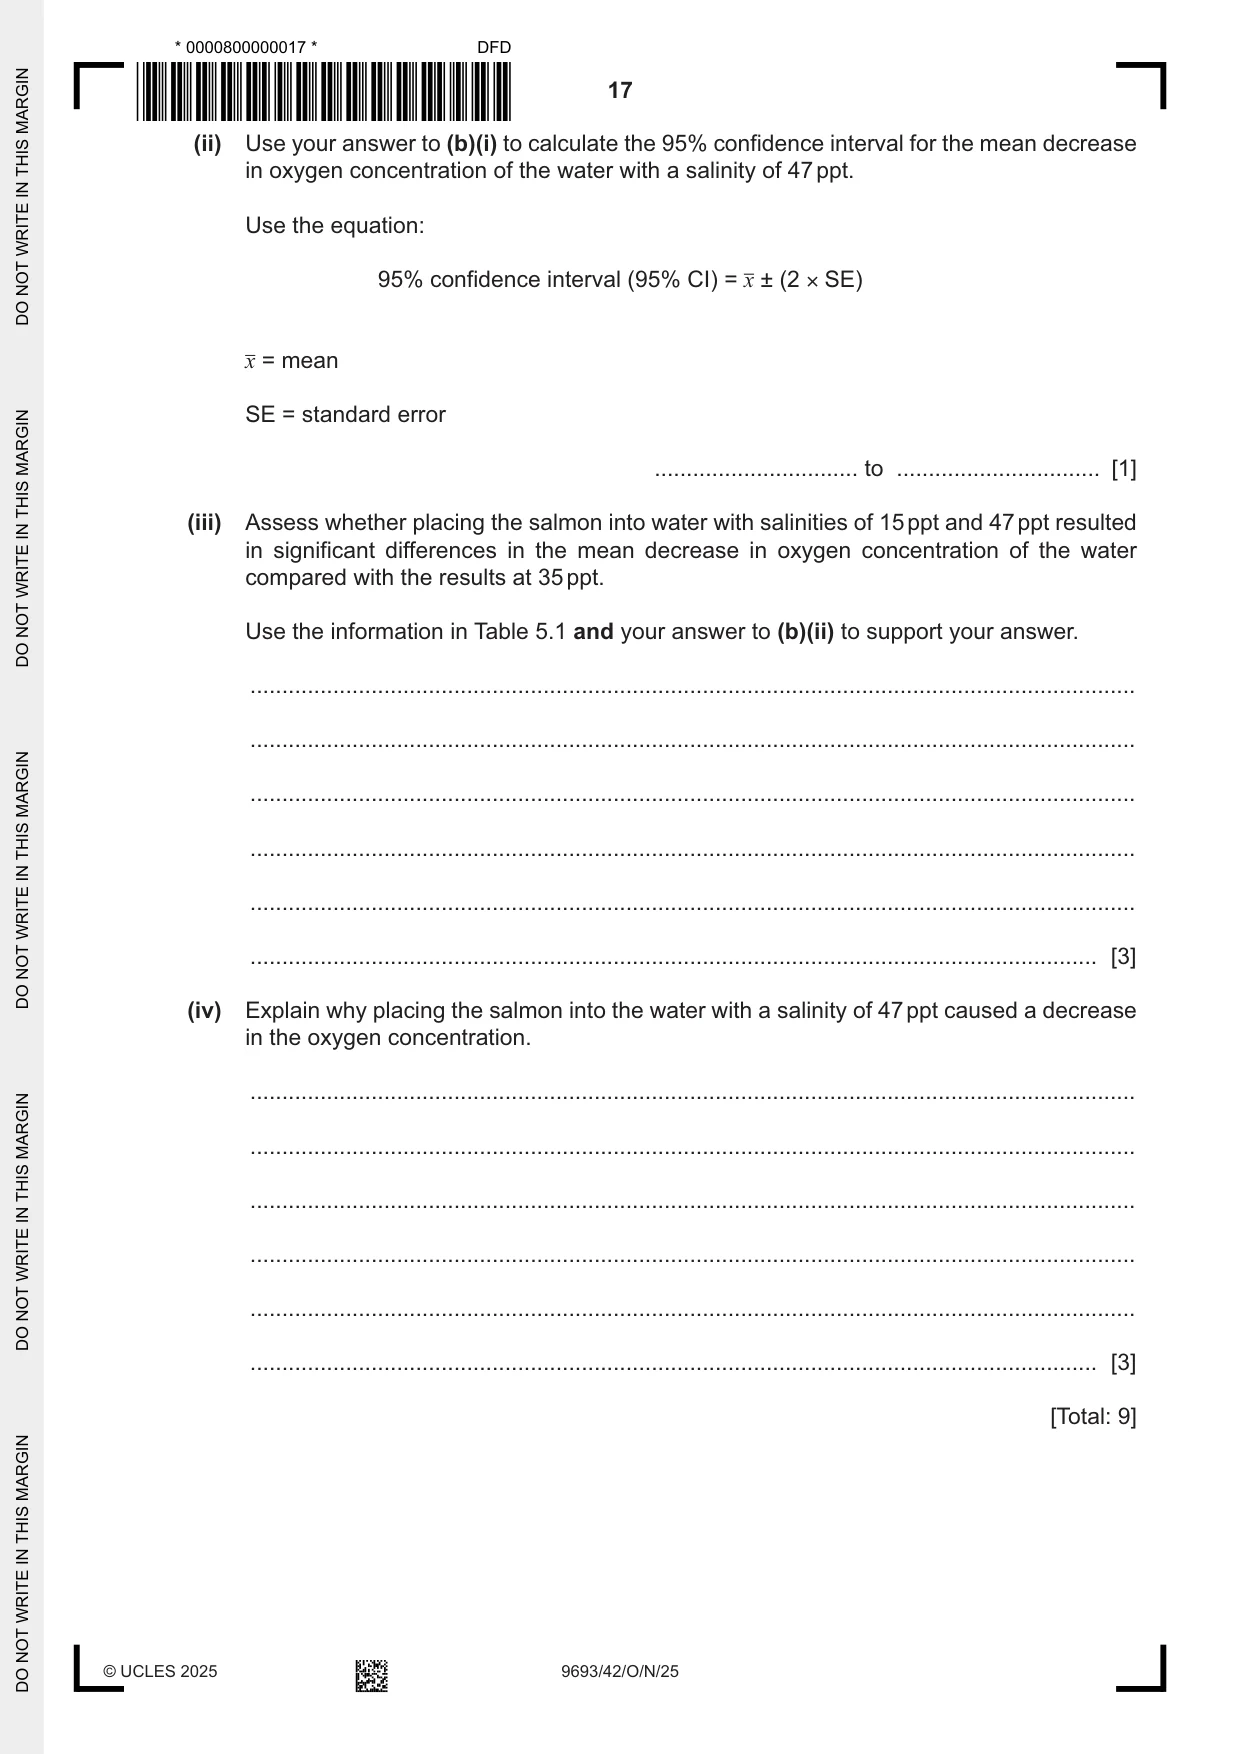
5 Pacific salmon are euryhaline fish that spend part of their life cycle in the sea and part of their life cycle in rivers. (a) State what is meant by the term euryhaline. ................................................................................................................................................... ............................................................................................................................................. [1] (b) Scientists investigated the effect of placing salmon into water of different salinities. Salmon were first kept in water with a salinity of 35 ppt for two weeks. Five of these salmon were selected and each one was placed into a separate tank of water with a salinity of 15 ppt. The decrease in oxygen concentration of the water in each of the tanks was determined over a period of one hour. This was repeated twice. In the first repeat, five different salmon were selected and each one placed into separate tanks with a salinity of 35 ppt. In the second repeat, five different salmon were selected and each one placed into separate tanks with a salinity of 47 ppt. Table 5.1 shows the results. Table 5.1 salinity number of mean decrease standard standard 2 × / ppt salmon (n) in oxygen deviation error standard concentration / mg dm–3 kg–1 error / mg dm–3 kg–1 15 5 2.3 0.50 0.22 0.44 35 5 2.1 0.20 0.09 0.18 47 5 3.8 0.40 (i) Calculate the standard error for the mean decrease in oxygen concentration of the water with a salinity of 47 ppt. Use the equation: s standard error, SE = n s = standard deviation n = sample size (number of observations) .......................................................... [1] (ii) Use your answer to (b)(i) to calculate the 95% confidence interval for the mean decrease in oxygen concentration of the water with a salinity of 47 ppt. Use the equation: 95% confidence interval (95% CI) = x ± (2 × SE) x = mean SE = standard error ................................ to ................................ [1] (iii) Assess whether placing the salmon into water with salinities of 15 ppt and 47 ppt resulted in significant differences in the mean decrease in oxygen concentration of the water compared with the results at 35 ppt. Use the information in Table 5.1 and your answer to (b)(ii) to support your answer. ........................................................................................................................................... ........................................................................................................................................... ........................................................................................................................................... ........................................................................................................................................... ........................................................................................................................................... ..................................................................................................................................... [3] (iv) Explain why placing the salmon into the water with a salinity of 47 ppt caused a decrease in the oxygen concentration. ........................................................................................................................................... ........................................................................................................................................... ........................................................................................................................................... ........................................................................................................................................... ........................................................................................................................................... ..................................................................................................................................... [3] [Total: 9]
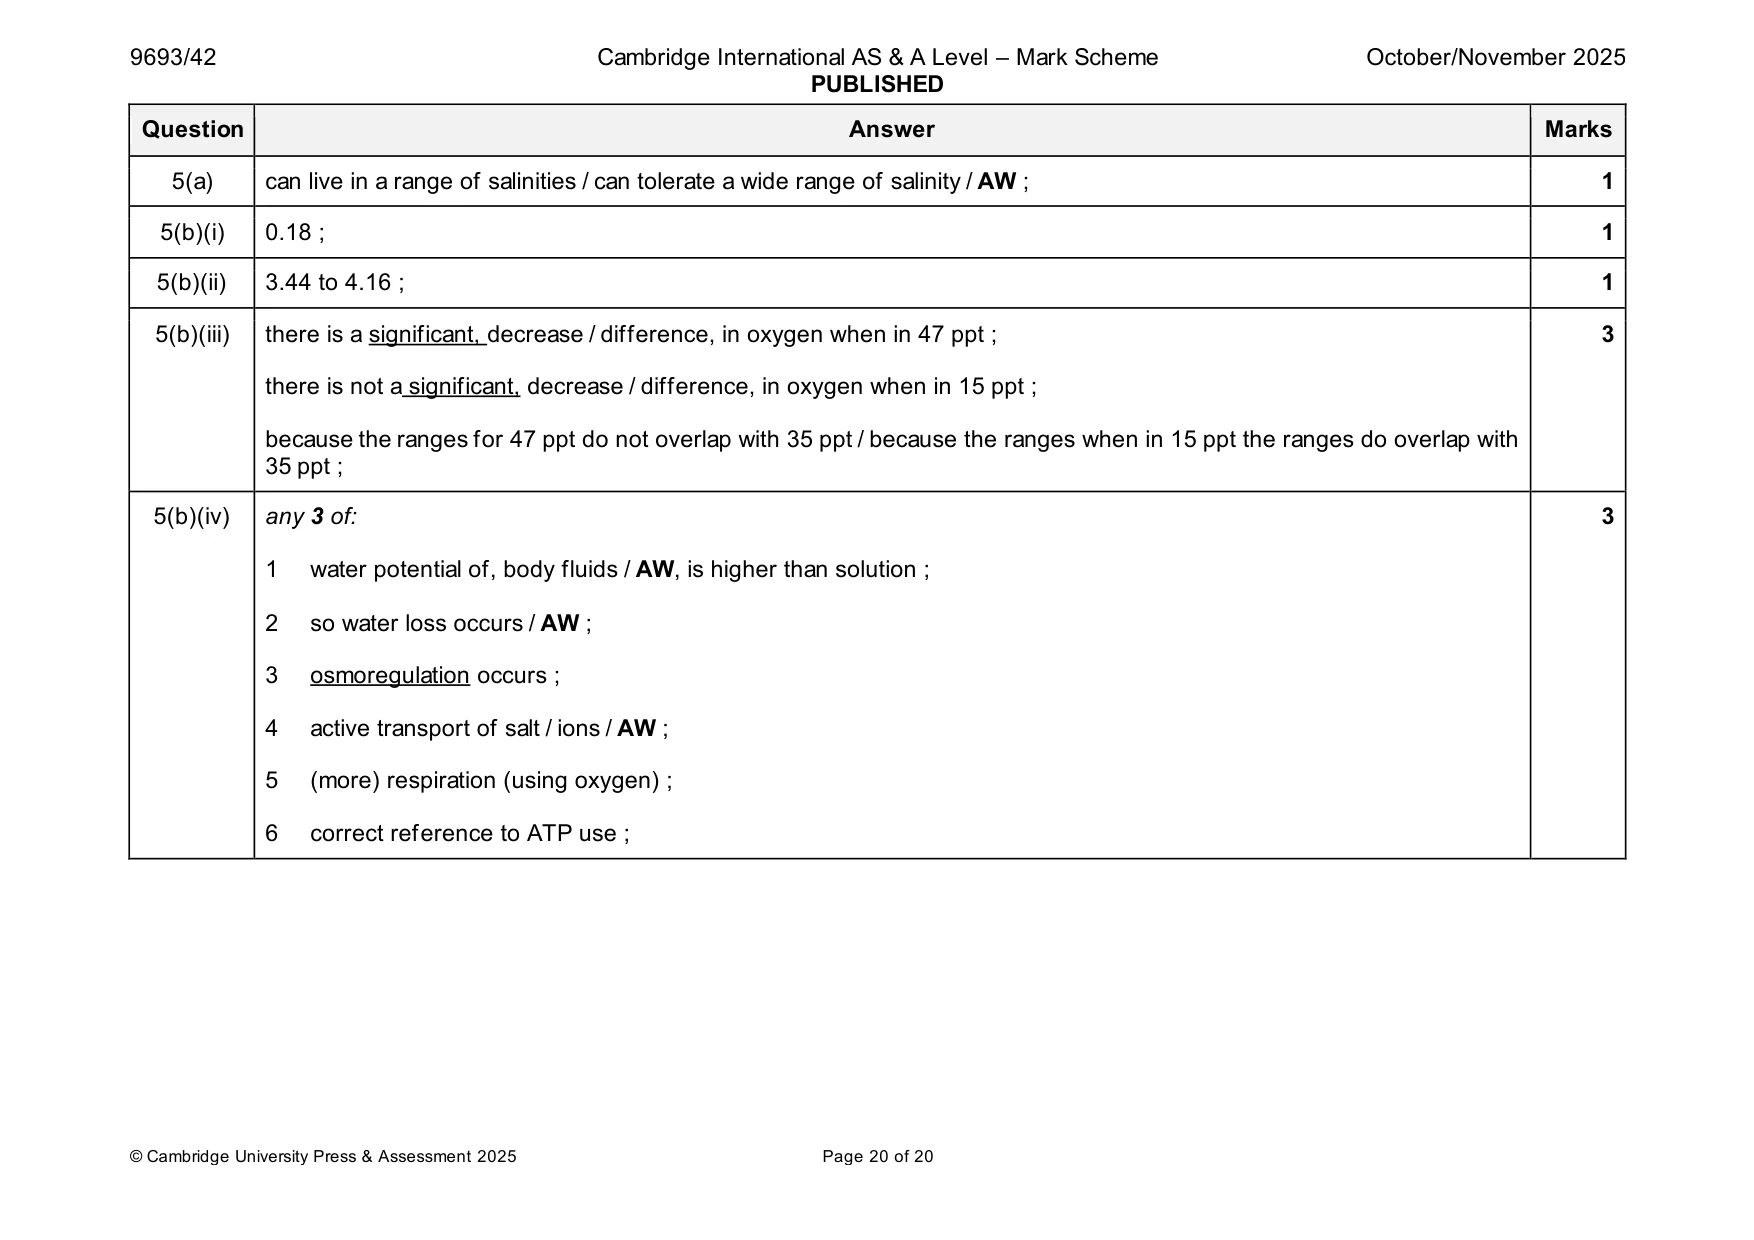
Mark scheme: 5(a) can live in a range of salinities / can tolerate a wide range of salinity / AW ; 1 5(b)(i) 0.18 ; 1 5(b)(ii) 3.44 to 4.16 ; 1 5(b)(iii) there is a significant, decrease / difference, in oxygen when in 47 ppt ; 3 there is not a significant, decrease / difference, in oxygen when in 15 ppt ; because the ranges for 47 ppt do not overlap with 35 ppt / because the ranges when in 15 ppt the ranges do overlap with 35 ppt ; 5(b)(iv) any 3 of: 3 1 water potential of, body fluids / AW, is higher than solution ; 2 so water loss occurs / AW ; 3 osmoregulation occurs ; 4 active transport of salt / ions / AW ; 5 (more) respiration (using oxygen) ; 6 correct reference to ATP use ;
What was in this paper
The subtopics covered by these 5 questions, and how many questions each got. Open one in a new tab to see every Cambridge question on it.
What you needed in this session
Cambridge’s own grade thresholds for 2025 Oct/Nov, Paper 4 · Variant 2. A higher threshold means an easier paper — the bar moves with how the cohort did.