Cambridge A Level Marine Science 9693 — 2017 May/June Paper 1 · Variant 1
9693/11/M/J/17 · 75 marks · ≈84 min
The question paper and its mark scheme, free to read here and free to download. This is Cambridge’s own paper, exactly as it was sat.
Question paper20 pages



Mark scheme13 pages
Answers below. Sit the paper first if you are practising.
Paper as text
Question paper, page 1
* 6 6 7 1 6 5 3 8 6 6 * This document consists of 17 printed pages and 3 blank pages. DC (ST/SG) 137778/4 © UCLES 2017 [Turn over Cambridge International Examinations Cambridge International Advanced Subsidiary and Advanced Level MARINE SCIENCE 9693/01 Paper 1 AS Structured Questions May/June 2017 1 hour 30 minutes Candidates answer on the Question Paper. No Additional Materials are required. READ THESE INSTRUCTIONS FIRST Write your Centre number, candidate number and name on all the work you hand in. Write in dark blue or black pen. You may use an HB pencil for any diagrams or graphs. Do not use staples, paper clips, glue or correction fluid. DO NOT WRITE IN ANY BARCODES. Answer all questions. Write your answers in the spaces provided on the Question Paper. Electronic calculators may be used. You may lose marks if you do not show your working or if you do not use appropriate units. At the end of the examination, fasten all your work securely together. The number of marks is given in brackets [ ] at the end of each question or part question.
Question paper, page 2
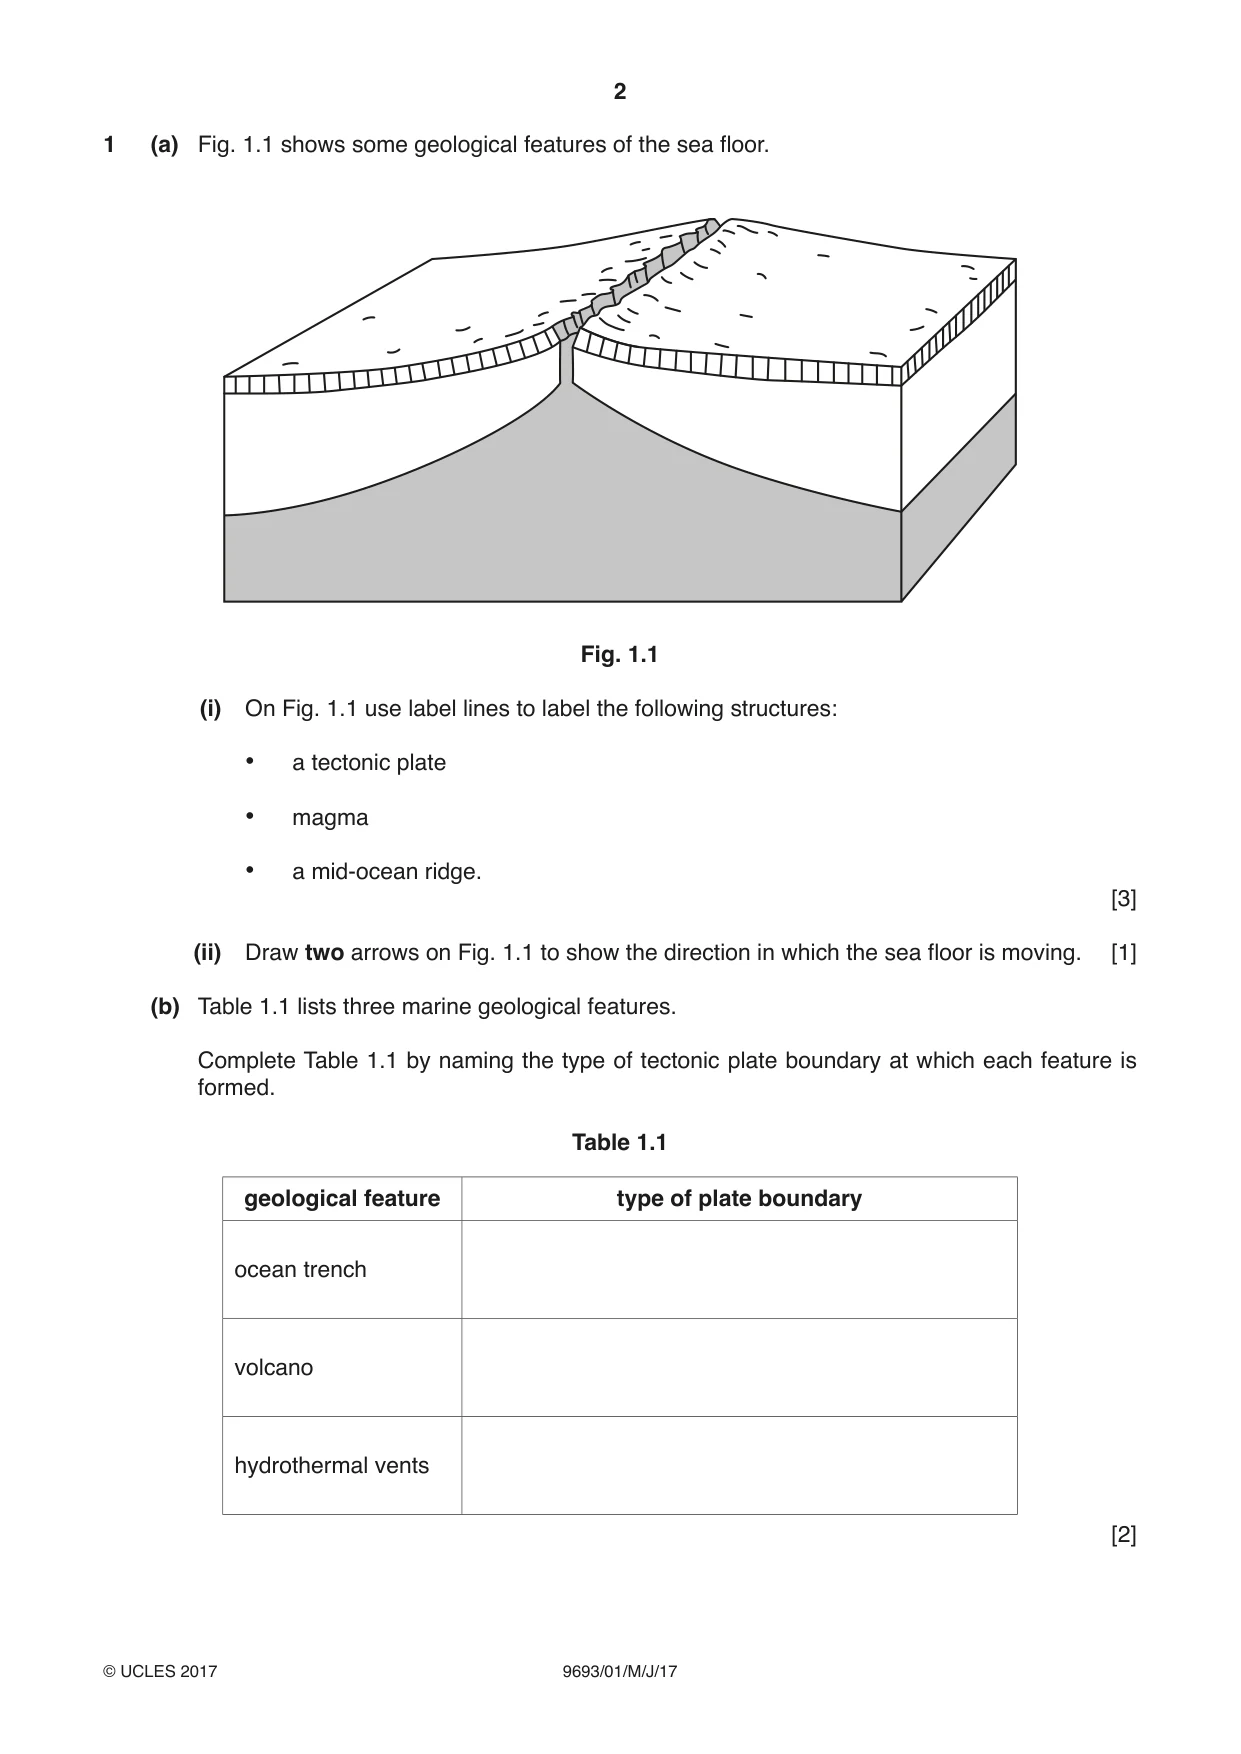
2 9693/01/M/J/17 © UCLES 2017 1 (a) Fig. 1.1 shows some geological features of the sea floor. Fig. 1.1 (i) On Fig. 1.1 use label lines to label the following structures: • a tectonic plate • magma • a mid-ocean ridge. [3] (ii) Draw two arrows on Fig. 1.1 to show the direction in which the sea floor is moving. [1] (b) Table 1.1 lists three marine geological features. Complete Table 1.1 by naming the type of tectonic plate boundary at which each feature is formed. Table 1.1 geological feature type of plate boundary ocean trench volcano hydrothermal vents [2]
Question paper, page 3
3 9693/01/M/J/17 © UCLES 2017 [Turn over (c) Explain how tectonic processes lead to the formation of each of the following. (i) a tsunami … … … … … … … …[4] (ii) an underwater volcano … … … … … … … …[4] [Total: 14]
Question paper, page 4
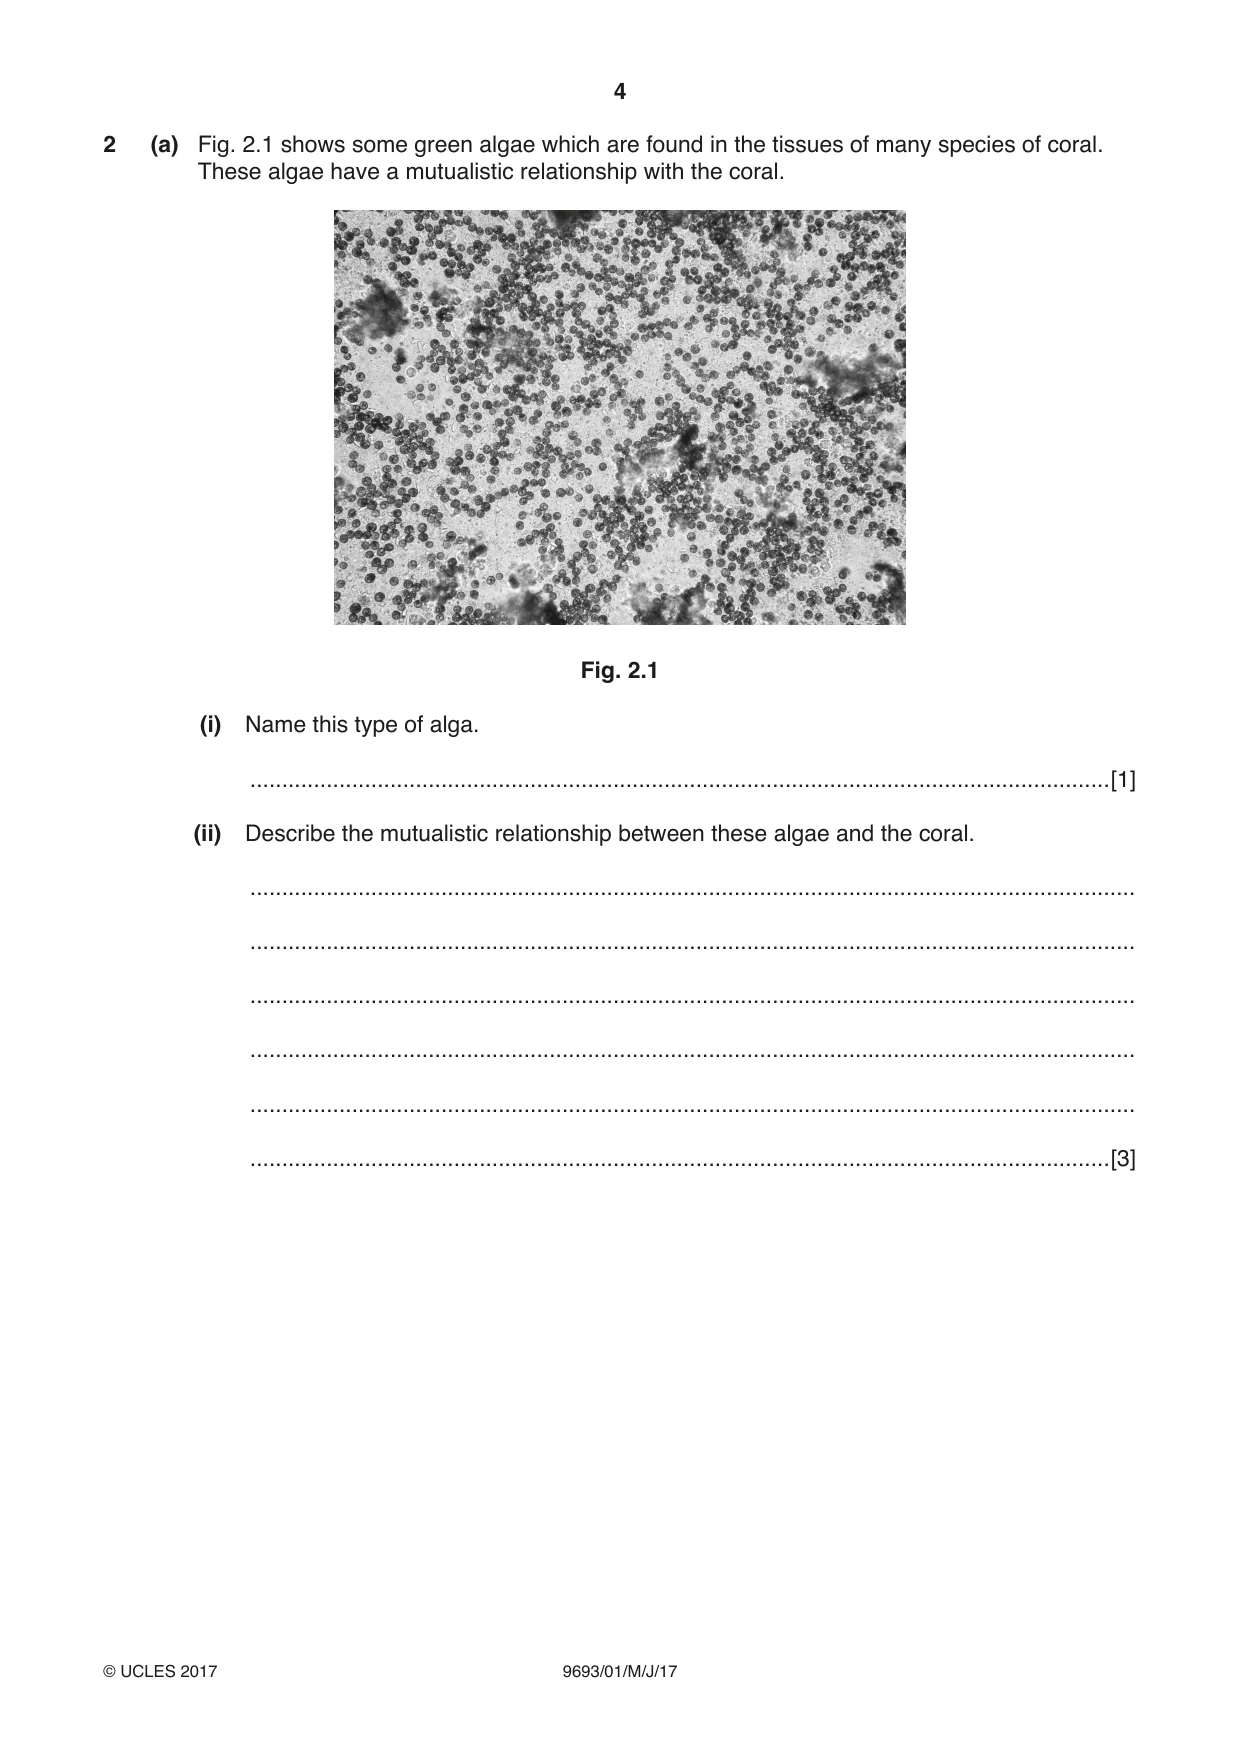
4 9693/01/M/J/17 © UCLES 2017 2 (a) Fig. 2.1 shows some green algae which are found in the tissues of many species of coral. These algae have a mutualistic relationship with the coral. Fig. 2.1 (i) Name this type of alga. …[1] (ii) Describe the mutualistic relationship between these algae and the coral. … … … … … …[3]
Question paper, page 5
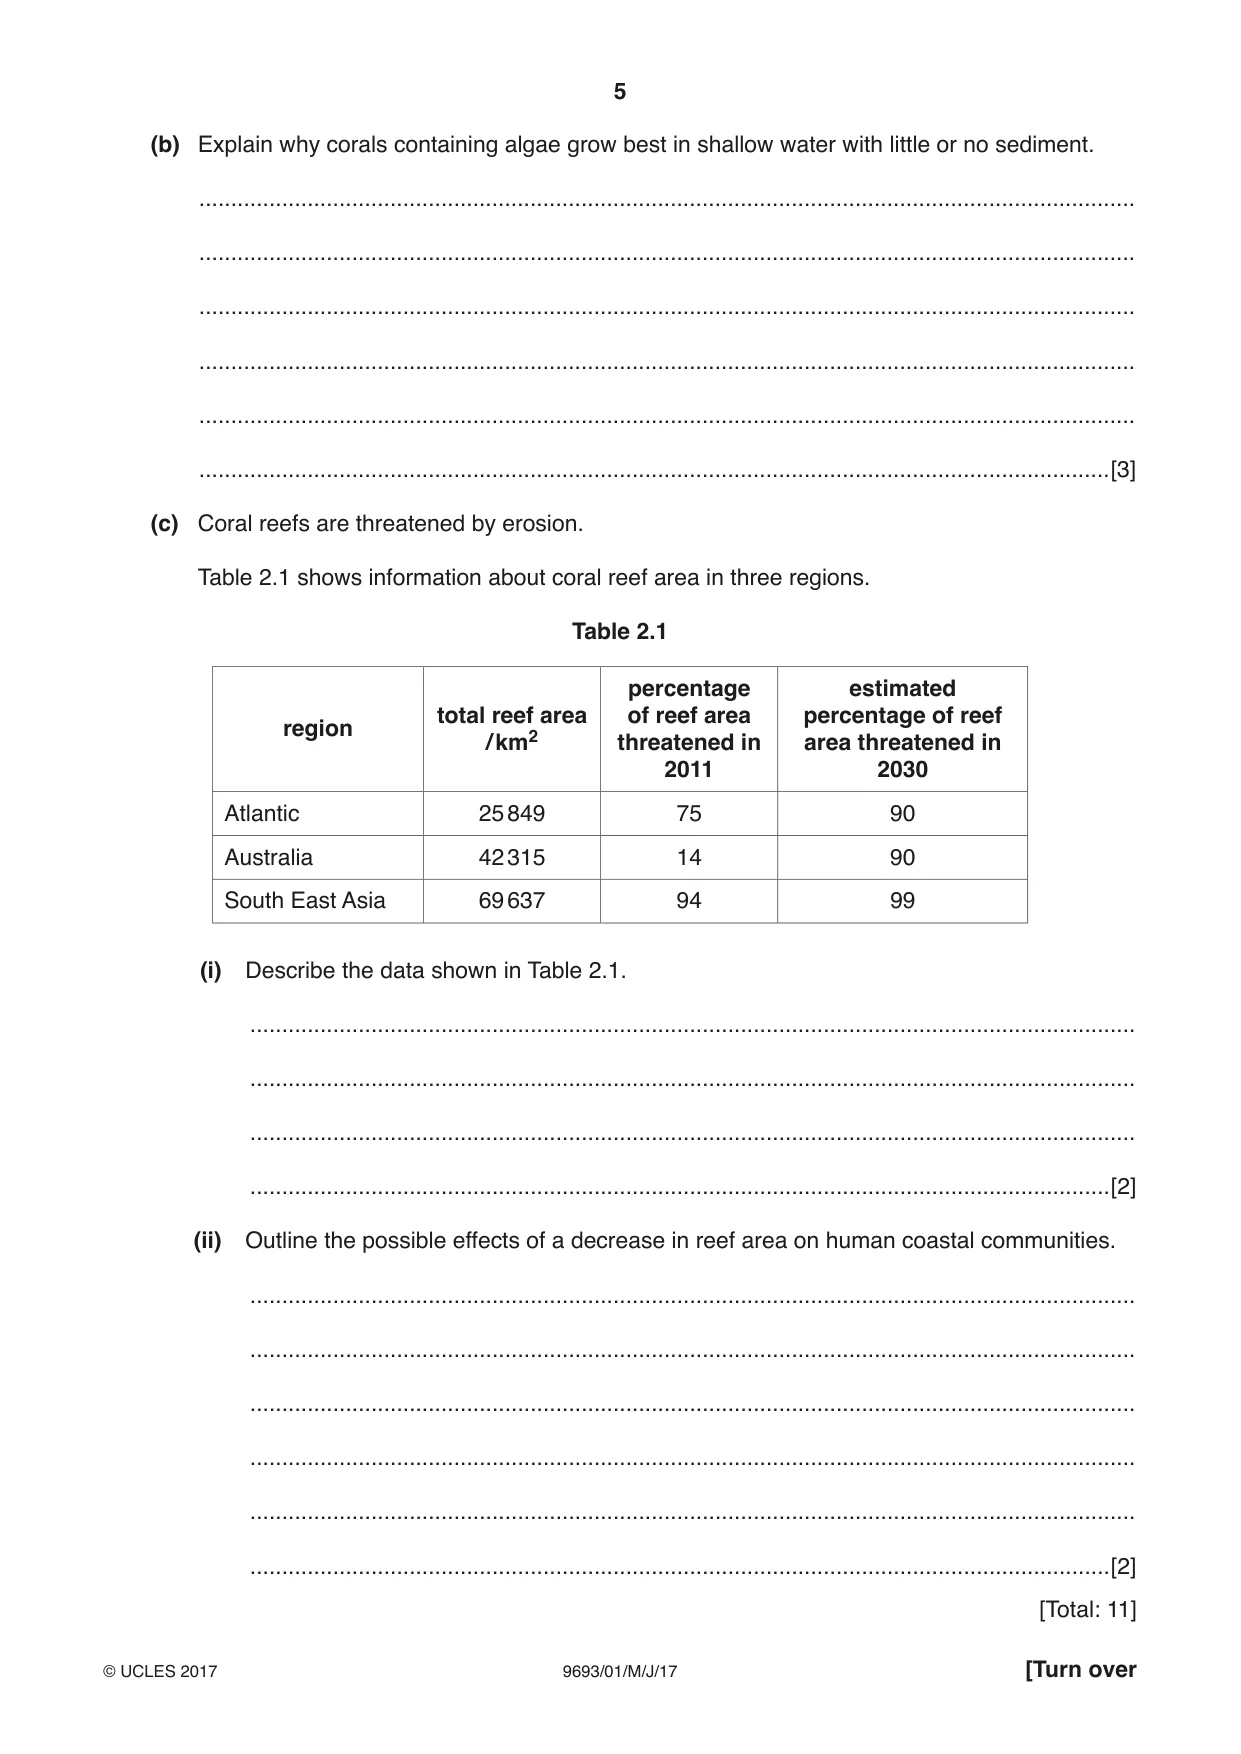
5 9693/01/M/J/17 © UCLES 2017 [Turn over (b) Explain why corals containing algae grow best in shallow water with little or no sediment. … … … … … …[3] (c) Coral reefs are threatened by erosion. Table 2.1 shows information about coral reef area in three regions. Table 2.1 region total reef area / km2 percentage of reef area threatened in 2011 estimated percentage of reef area threatened in 2030 Atlantic 25 849 75 90 Australia 42 315 14 90 South East Asia 69 637 94 99 (i) Describe the data shown in Table 2.1. … … … …[2] (ii) Outline the possible effects of a decrease in reef area on human coastal communities. … … … … … …[2] [Total: 11]
Question paper, page 6
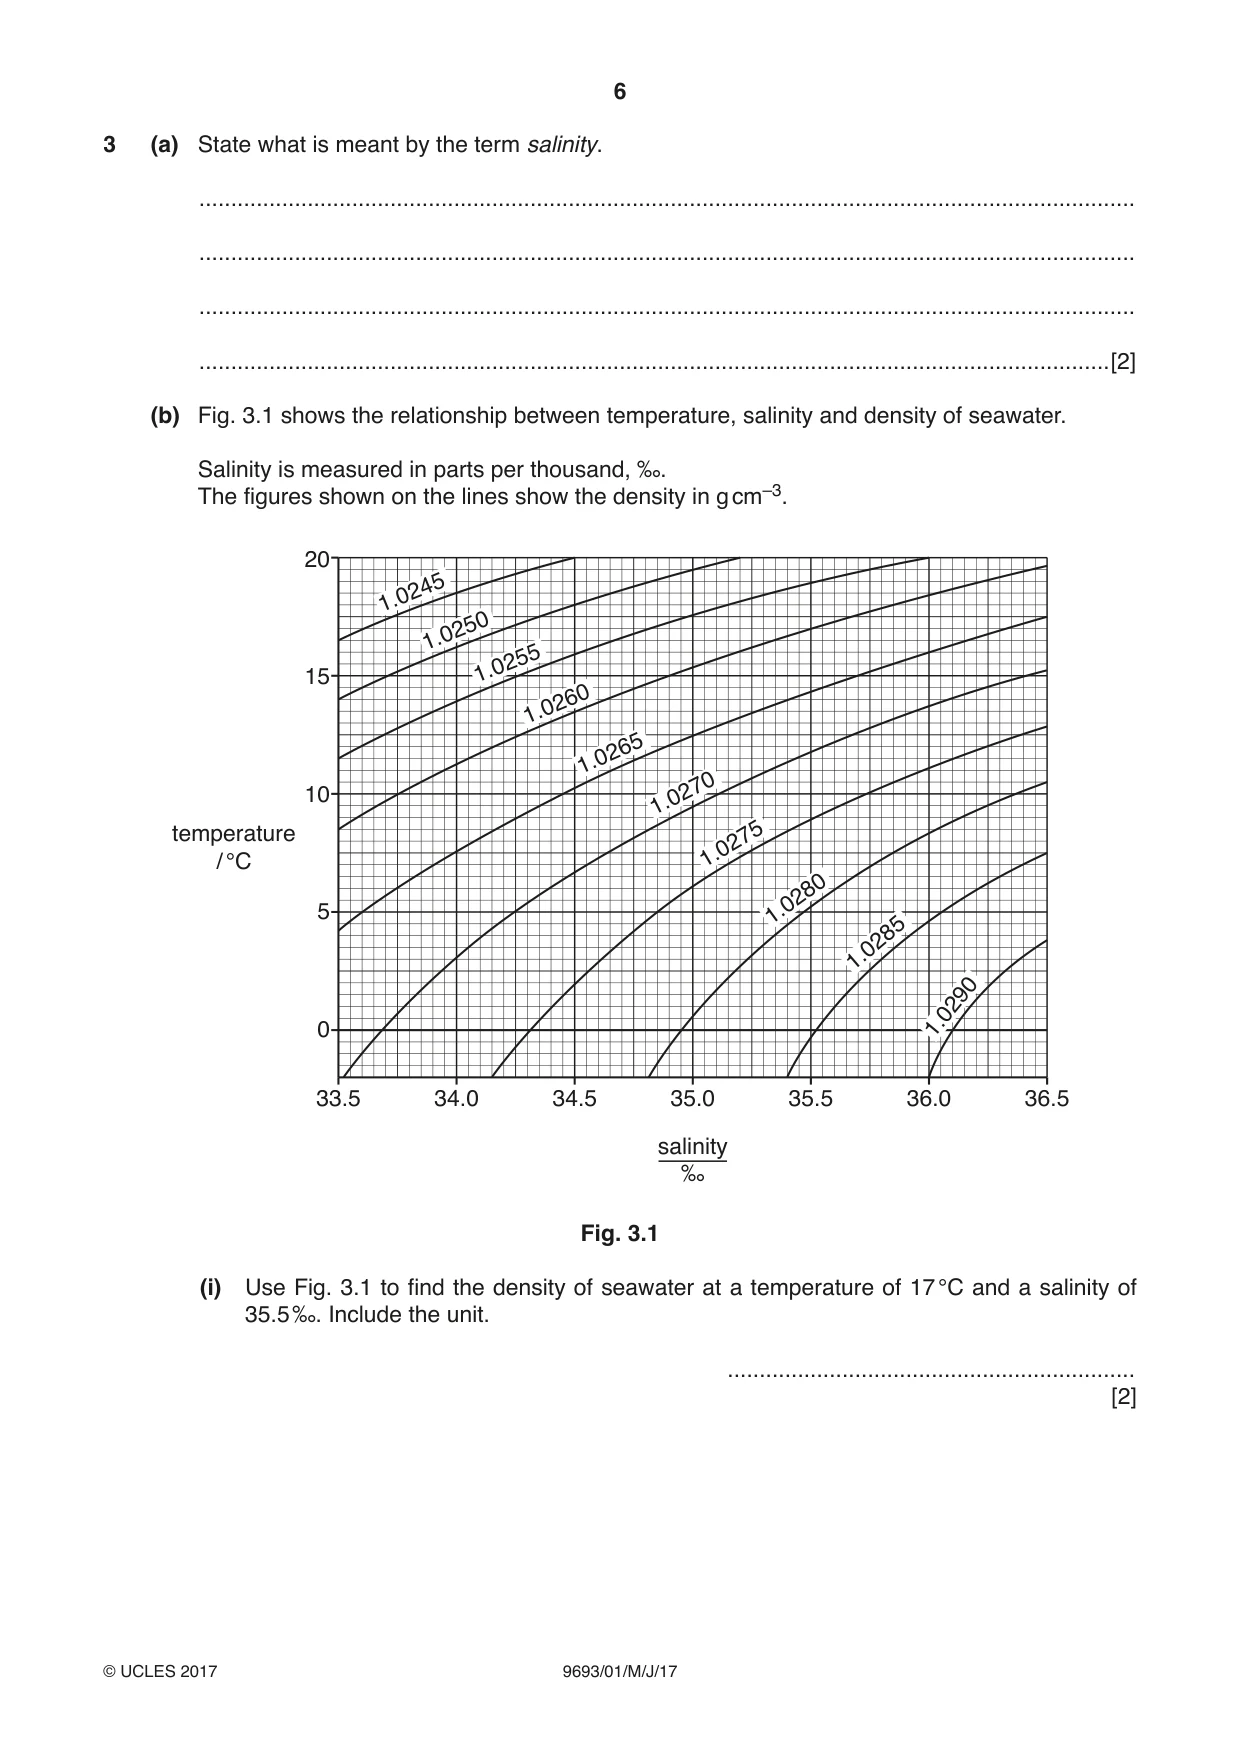
6 9693/01/M/J/17 © UCLES 2017 3 (a) State what is meant by the term salinity. … … … …[2] (b) Fig. 3.1 shows the relationship between temperature, salinity and density of seawater. Salinity is measured in parts per thousand, ‰. The figures shown on the lines show the density in g cm–3. 20 15 10 5 0 33.5 34.0 34.5 35.0 salinity ‰ 35.5 36.0 36.5 temperature / °C 1.0290 1.0285 1.0280 1.0275 1.0270 1.0265 1.0260 1.0255 1.0250 1.0245 Fig. 3.1 (i) Use Fig. 3.1 to find the density of seawater at a temperature of 17 °C and a salinity of 35.5 ‰. Include the unit. … [2]
Question paper, page 7
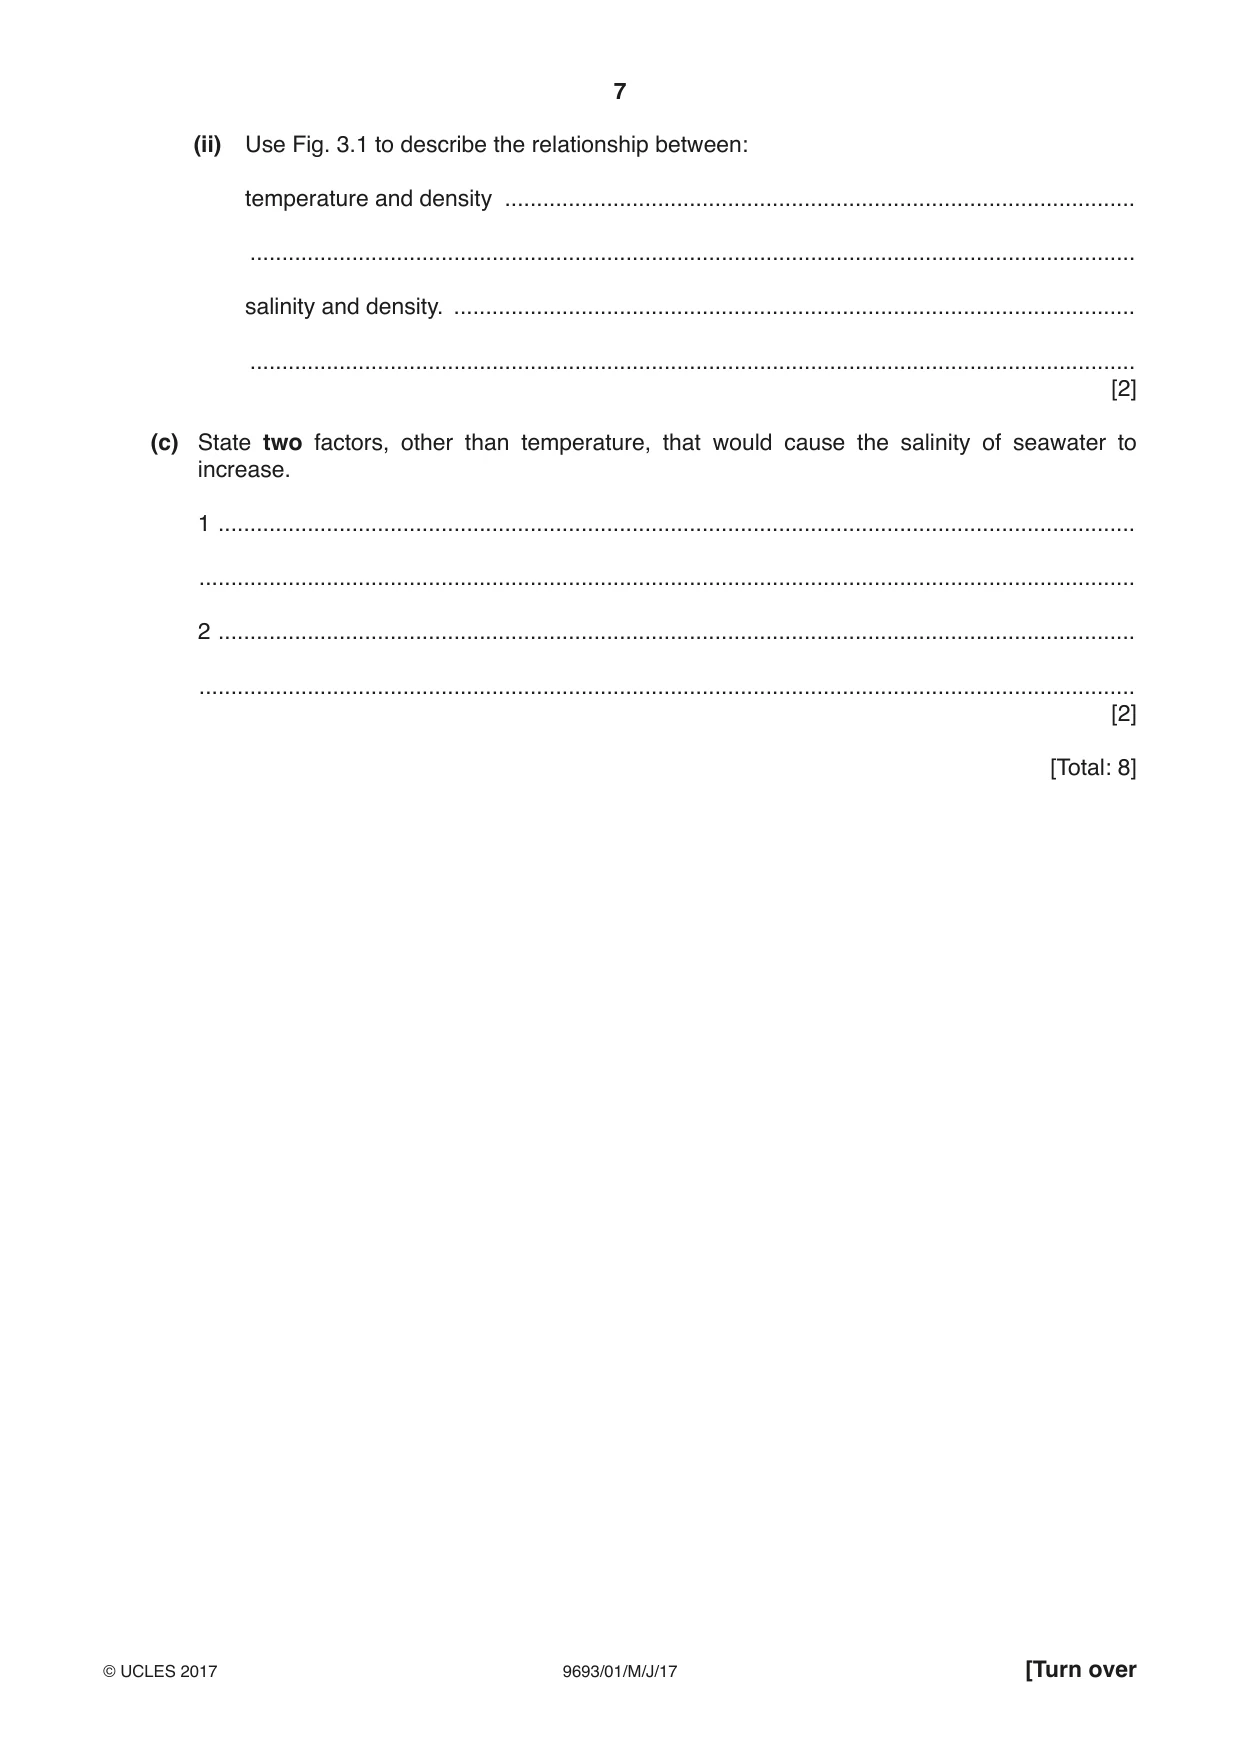
7 9693/01/M/J/17 © UCLES 2017 [Turn over (ii) Use Fig. 3.1 to describe the relationship between: temperature and density … … salinity and density. … … [2] (c) State two factors, other than temperature, that would cause the salinity of seawater to increase. 1 … … 2 … … [2] [Total: 8]
Question paper, page 8
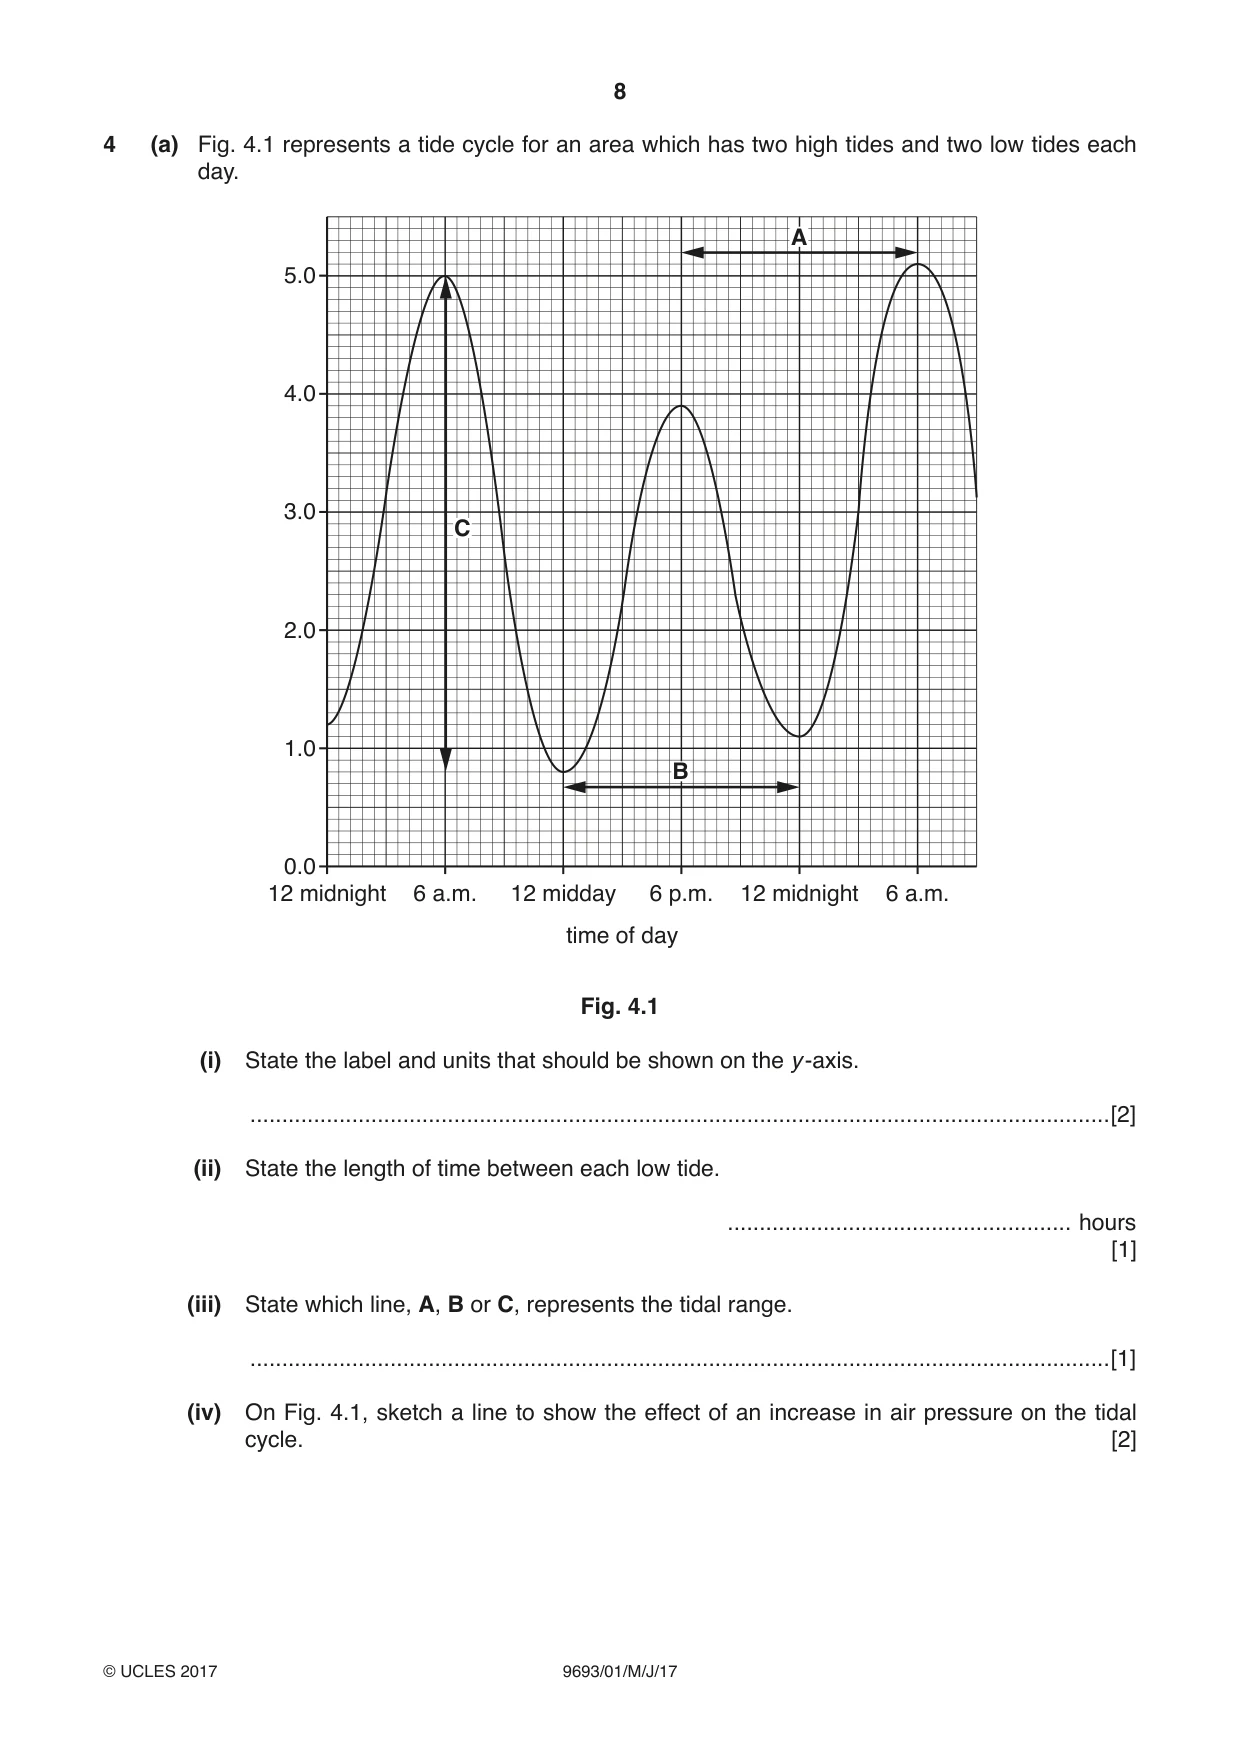
8 9693/01/M/J/17 © UCLES 2017 4 (a) Fig. 4.1 represents a tide cycle for an area which has two high tides and two low tides each day. A B C 2.0 3.0 4.0 5.0 1.0 0.0 12 midnight 6 a.m. 12 midday 6 p.m. 12 midnight 6 a.m. time of day Fig. 4.1 (i) State the label and units that should be shown on the y -axis. …[2] (ii) State the length of time between each low tide. … hours [1] (iii) State which line, A, B or C, represents the tidal range. …[1] (iv) On Fig. 4.1, sketch a line to show the effect of an increase in air pressure on the tidal cycle. [2]
Question paper, page 9
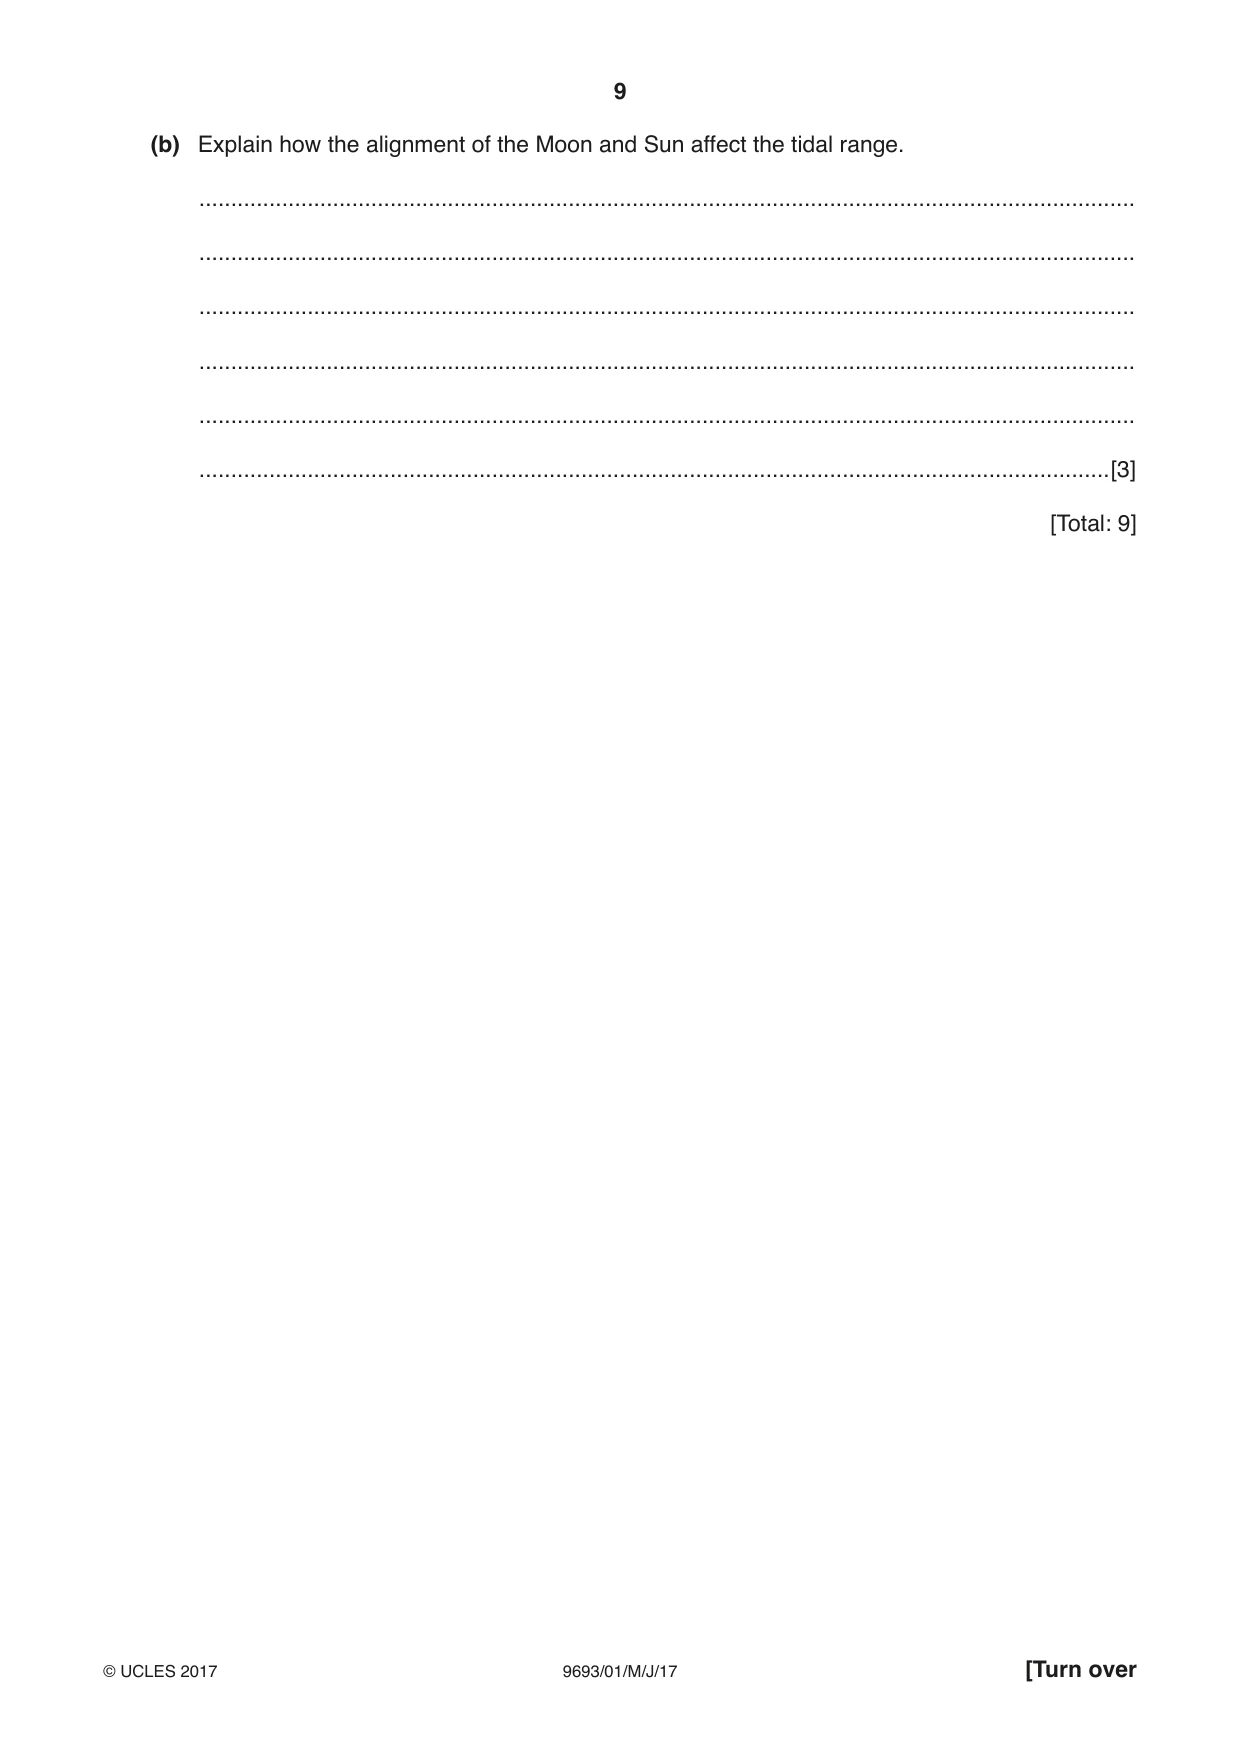
9 9693/01/M/J/17 © UCLES 2017 [Turn over (b) Explain how the alignment of the Moon and Sun affect the tidal range. … … … … … …[3] [Total: 9]
Question paper, page 10
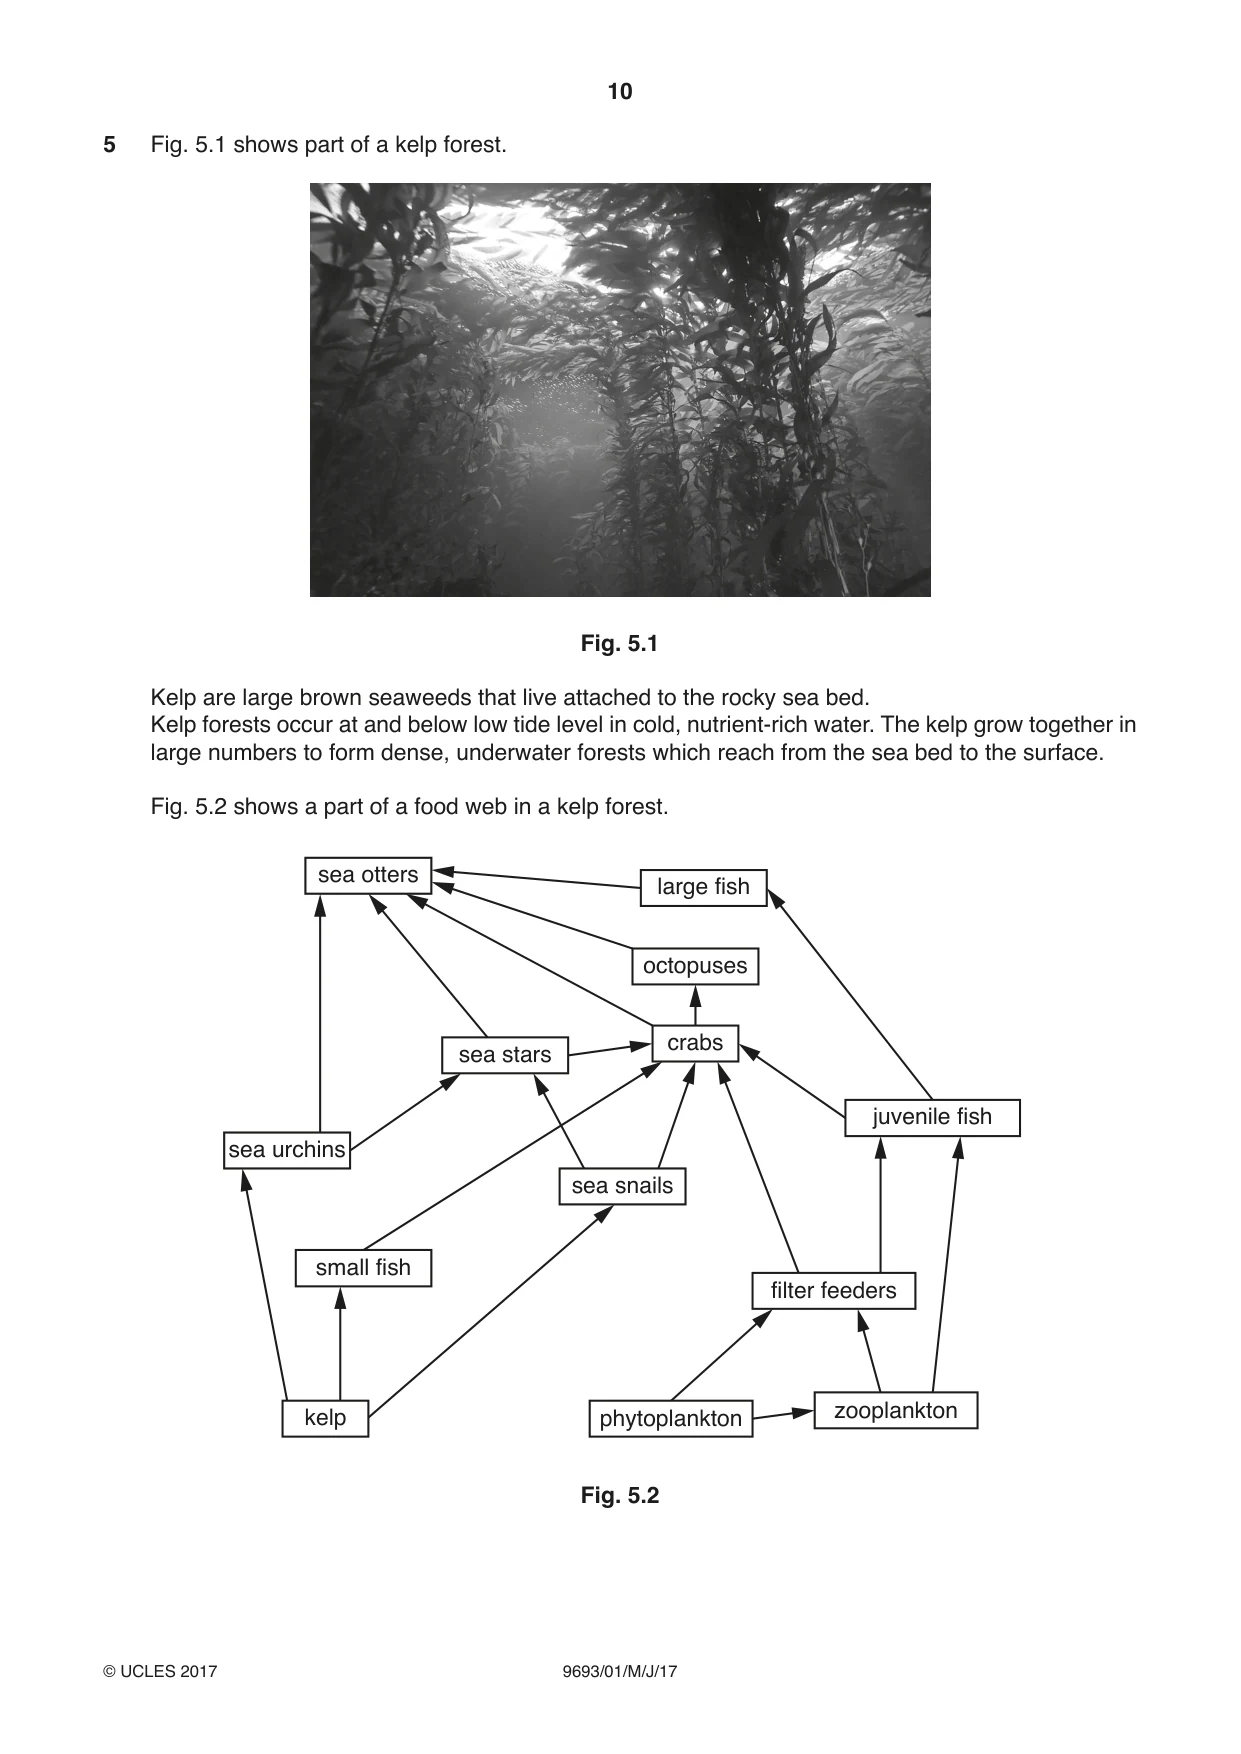
10 9693/01/M/J/17 © UCLES 2017 5 Fig. 5.1 shows part of a kelp forest. Fig. 5.1 Kelp are large brown seaweeds that live attached to the rocky sea bed. Kelp forests occur at and below low tide level in cold, nutrient-rich water. The kelp grow together in large numbers to form dense, underwater forests which reach from the sea bed to the surface. Fig. 5.2 shows a part of a food web in a kelp forest. sea otters sea urchins small fish juvenile fish phytoplankton sea stars sea snails zooplankton filter feeders large fish octopuses crabs kelp Fig. 5.2
Question paper, page 11
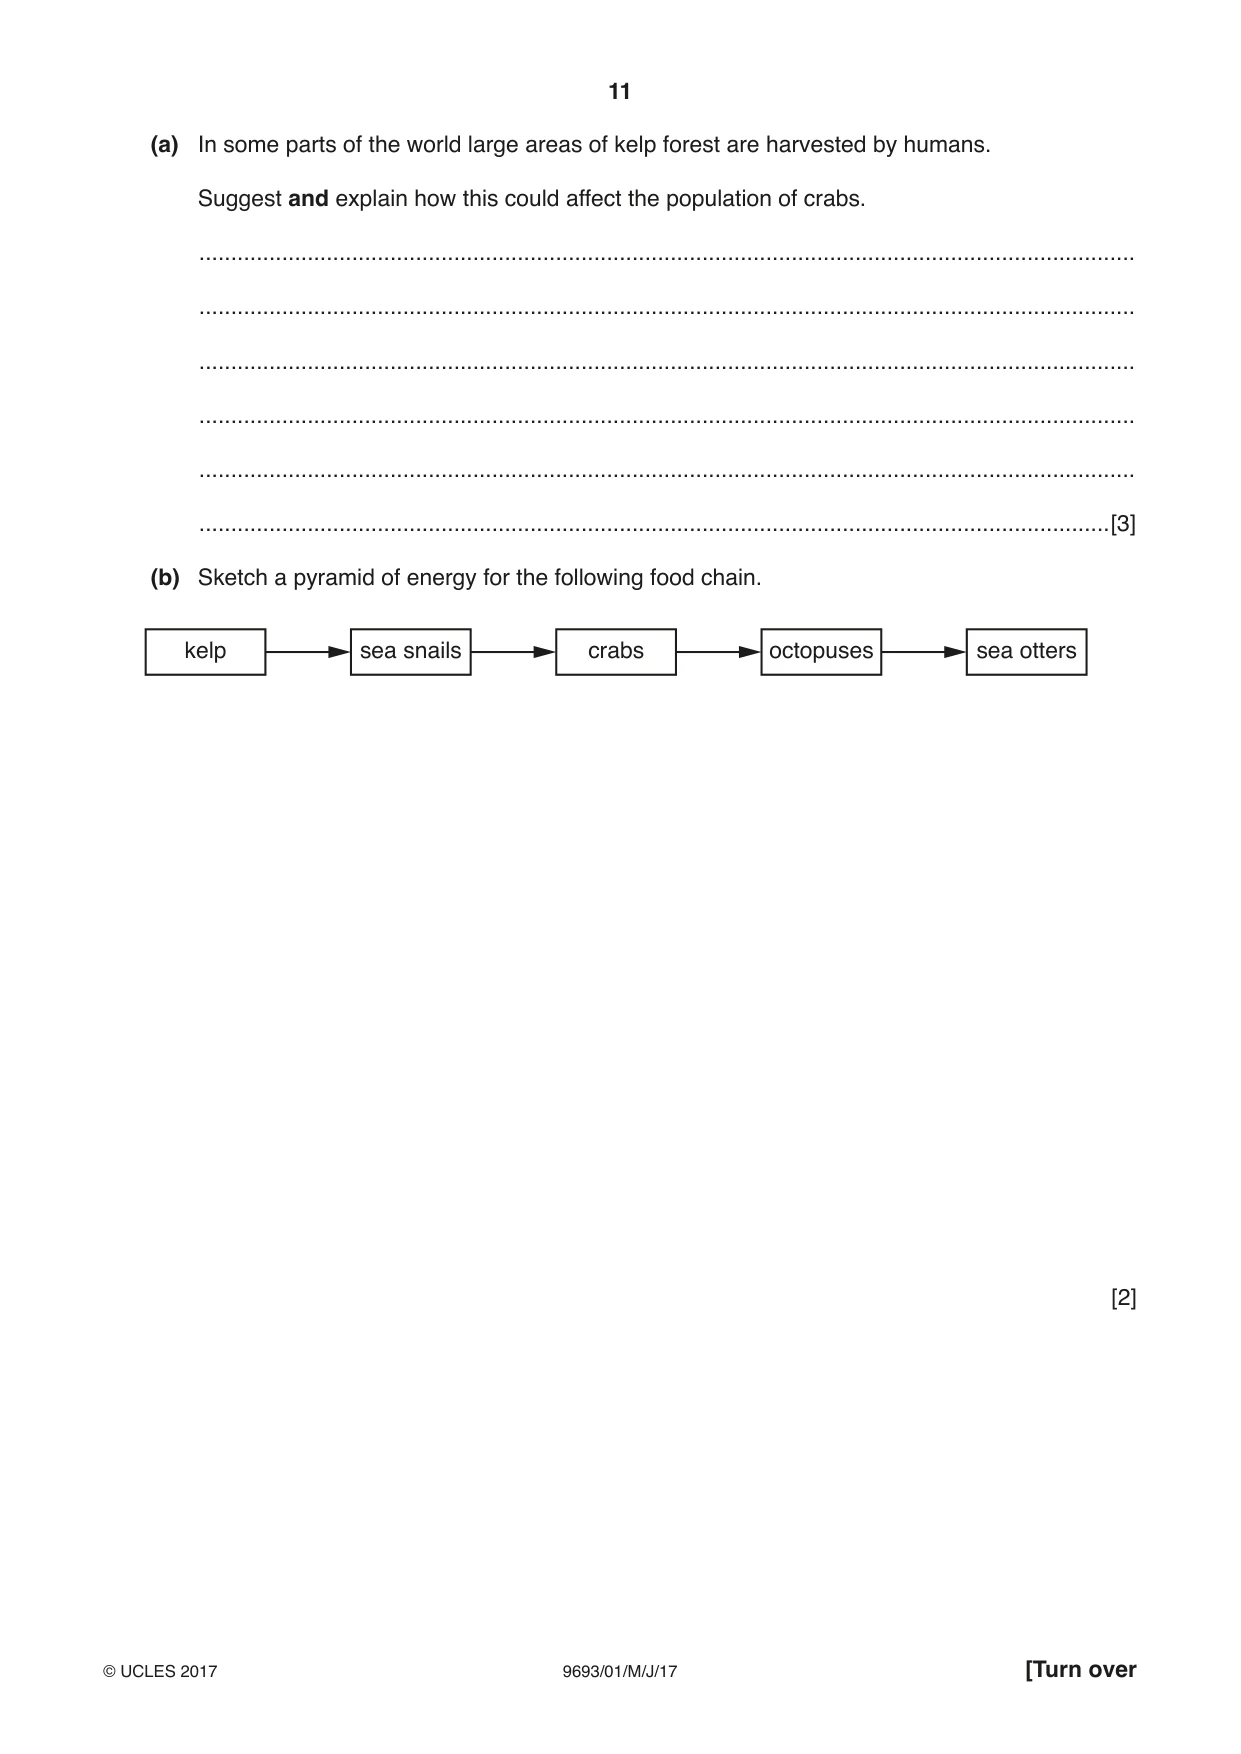
11 9693/01/M/J/17 © UCLES 2017 [Turn over (a) In some parts of the world large areas of kelp forest are harvested by humans. Suggest and explain how this could affect the population of crabs. … … … … … …[3] (b) Sketch a pyramid of energy for the following food chain. sea otters octopuses crabs sea snails kelp [2]
Question paper, page 12
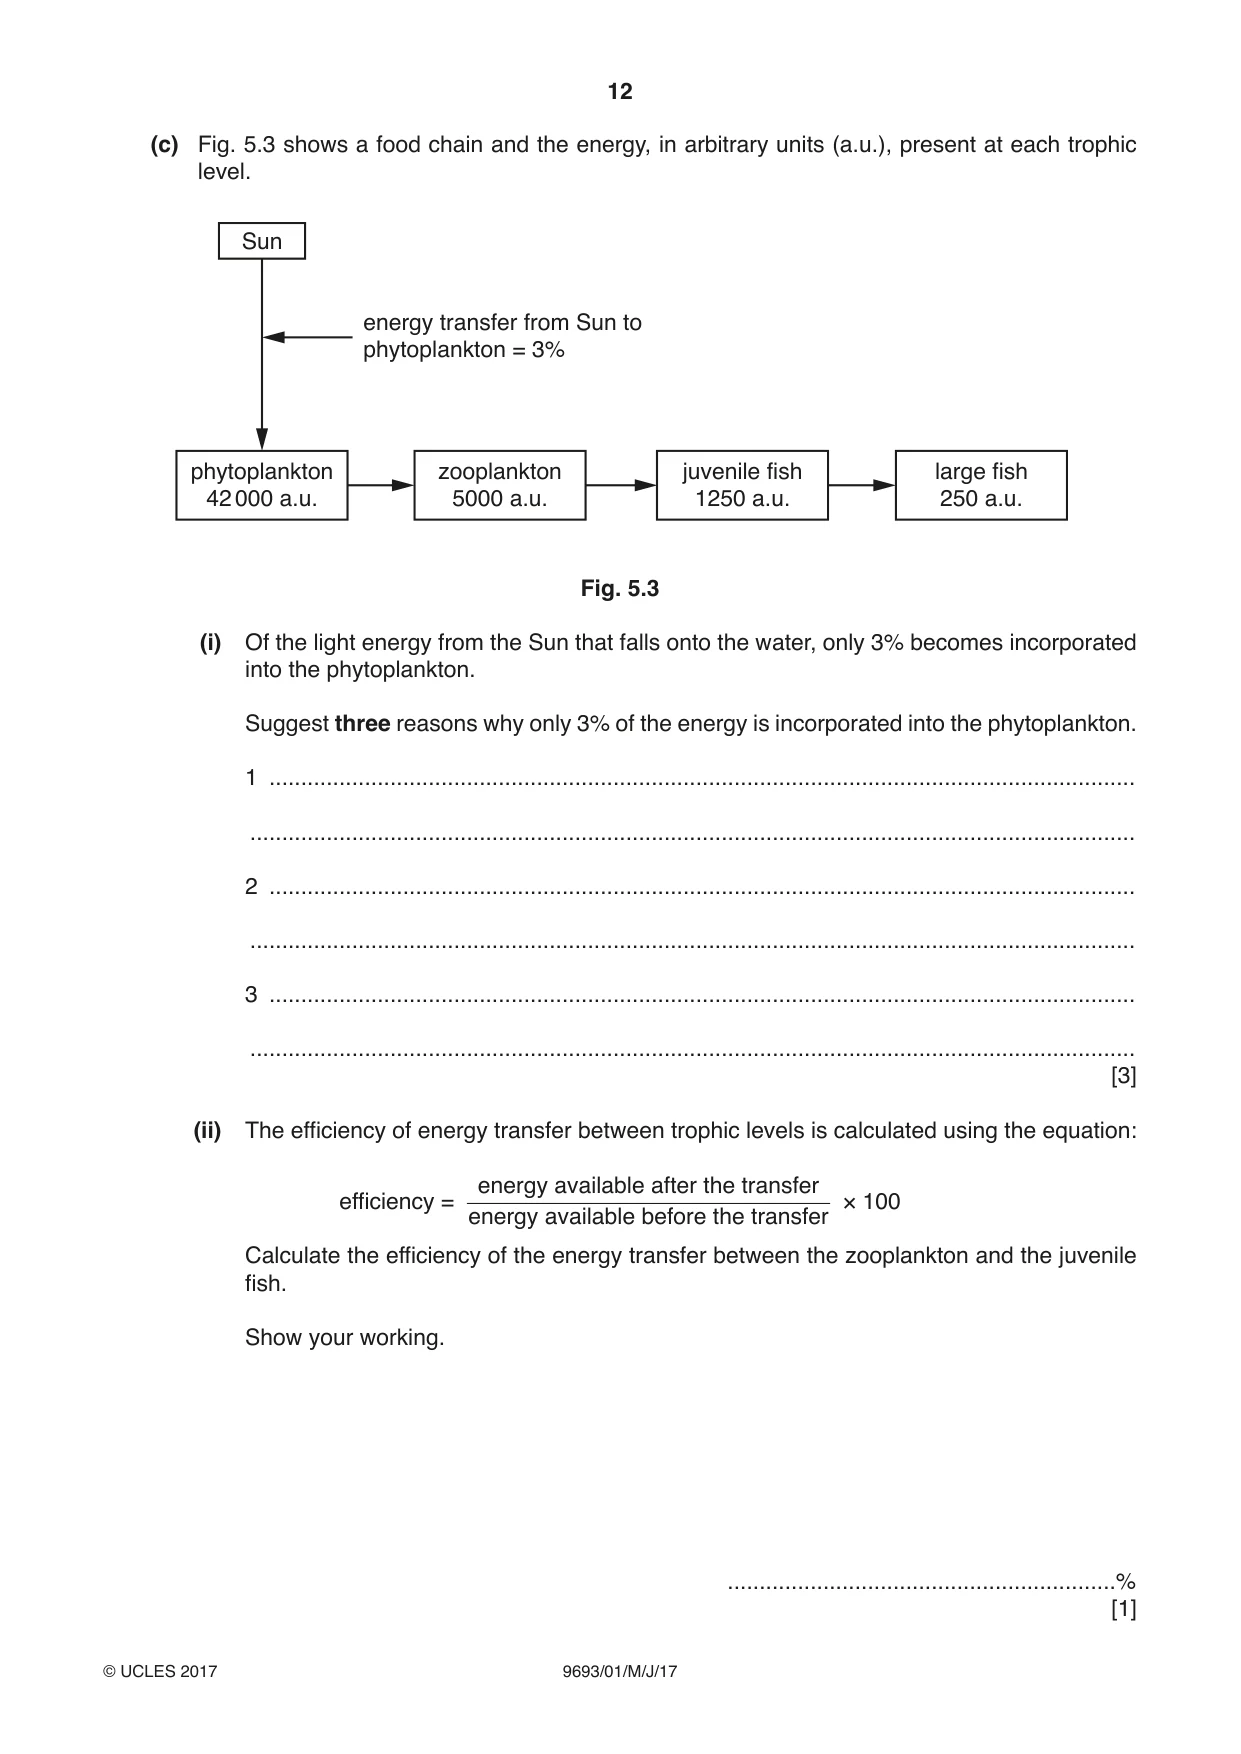
12 9693/01/M/J/17 © UCLES 2017 (c) Fig. 5.3 shows a food chain and the energy, in arbitrary units (a.u.), present at each trophic level. phytoplankton 42 000 a.u. Sun zooplankton 5000 a.u. energy transfer from Sun to phytoplankton = 3% large fish 250 a.u. juvenile fish 1250 a.u. Fig. 5.3 (i) Of the light energy from the Sun that falls onto the water, only 3% becomes incorporated into the phytoplankton. Suggest three reasons why only 3% of the energy is incorporated into the phytoplankton. 1 … … 2 … … 3 … … [3] (ii) The efficiency of energy transfer between trophic levels is calculated using the equation: efficiency = energy available after the transfer energy available before the transfer × 100 Calculate the efficiency of the energy transfer between the zooplankton and the juvenile fish. Show your working. …% [1]
Question paper, page 13
13 9693/01/M/J/17 © UCLES 2017 [Turn over (d) Suggest how upwelling could increase the productivity of the food web in Fig. 5.2. … … … … … … … … … …[4] [Total: 13]
Question paper, page 14
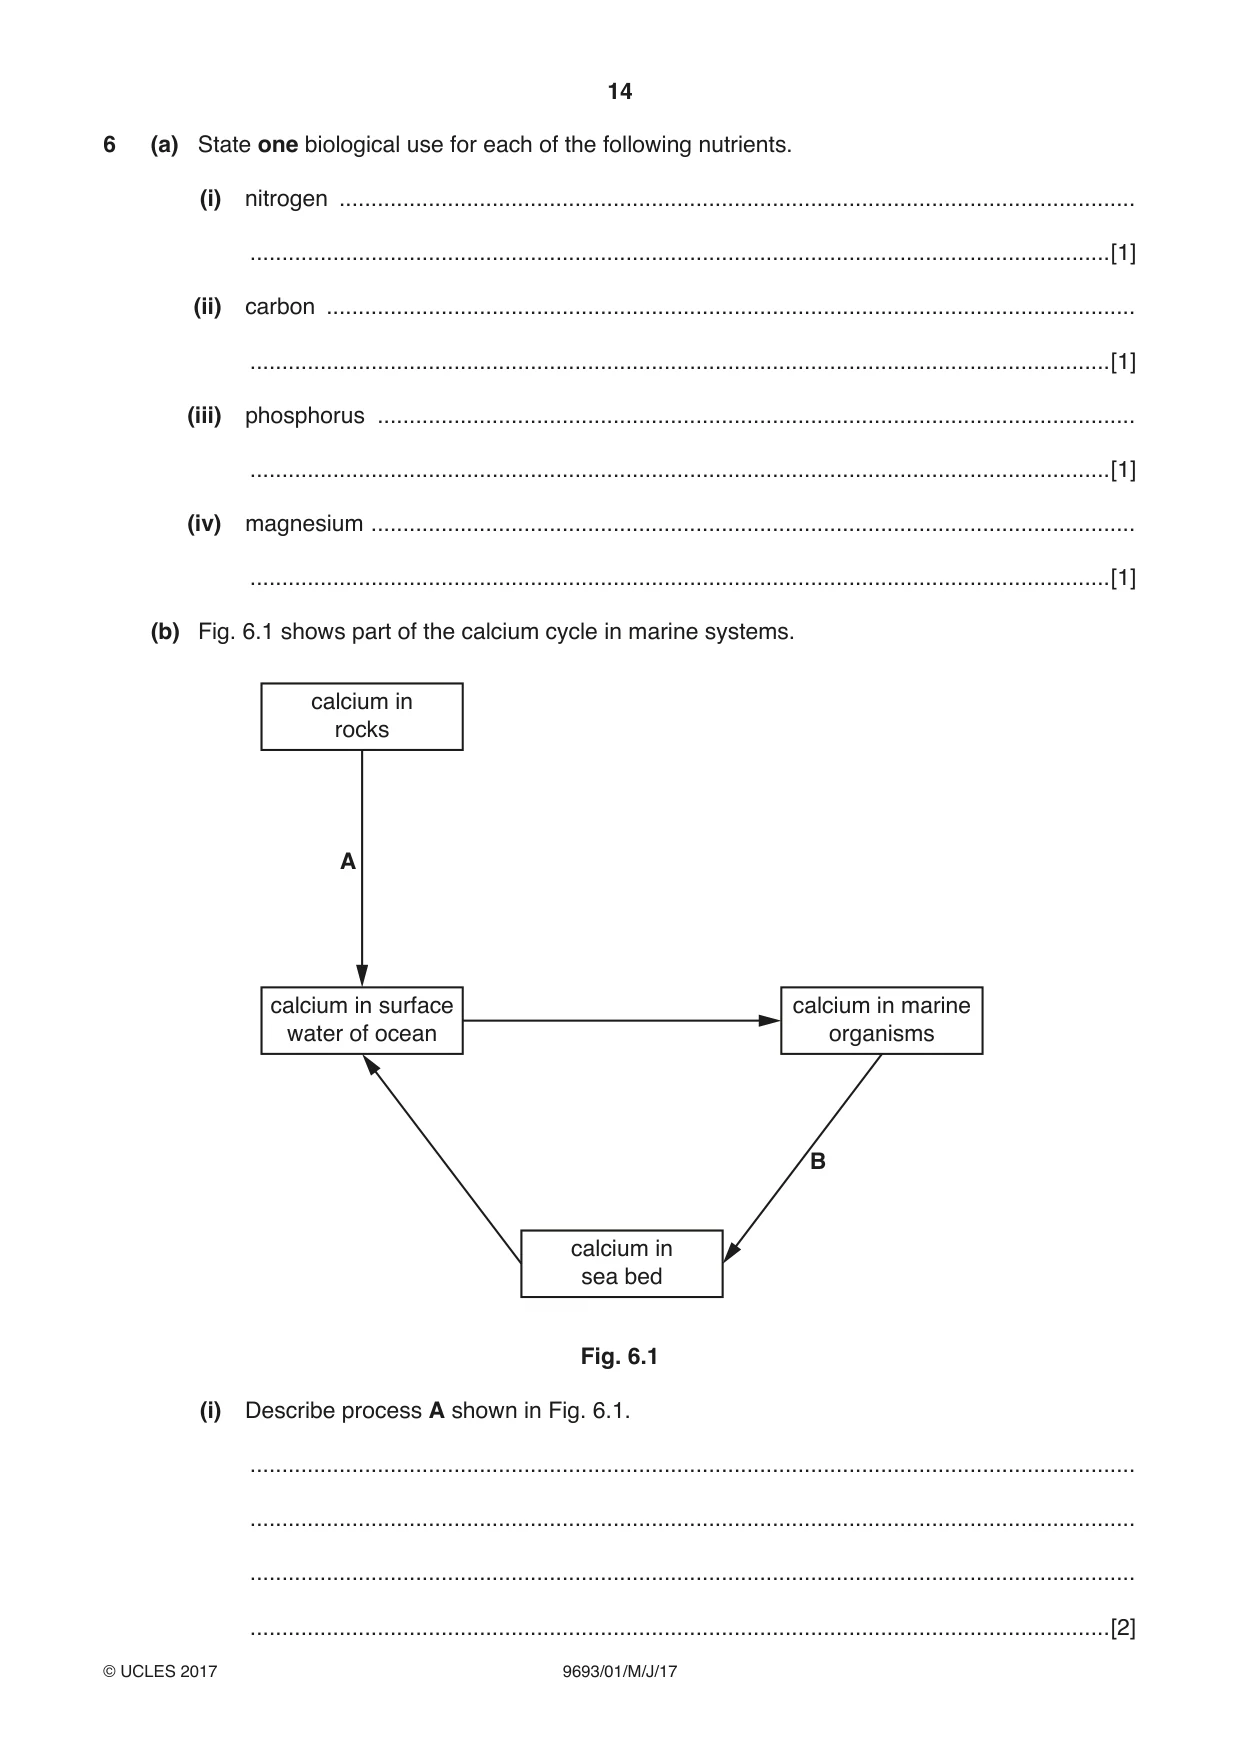
14 9693/01/M/J/17 © UCLES 2017 6 (a) State one biological use for each of the following nutrients. (i) nitrogen … …[1] (ii) carbon … …[1] (iii) phosphorus … …[1] (iv) magnesium … …[1] (b) Fig. 6.1 shows part of the calcium cycle in marine systems. calcium in rocks B A calcium in surface water of ocean calcium in marine organisms calcium in sea bed Fig. 6.1 (i) Describe process A shown in Fig. 6.1. … … … …[2]
Question paper, page 15
15 9693/01/M/J/17 © UCLES 2017 [Turn over (ii) Describe process B shown in Fig. 6.1. … … … …[2] (iii) Suggest how overharvesting of marine organisms could affect the calcium cycle. … … … …[2] [Total: 10]
Question paper, page 16
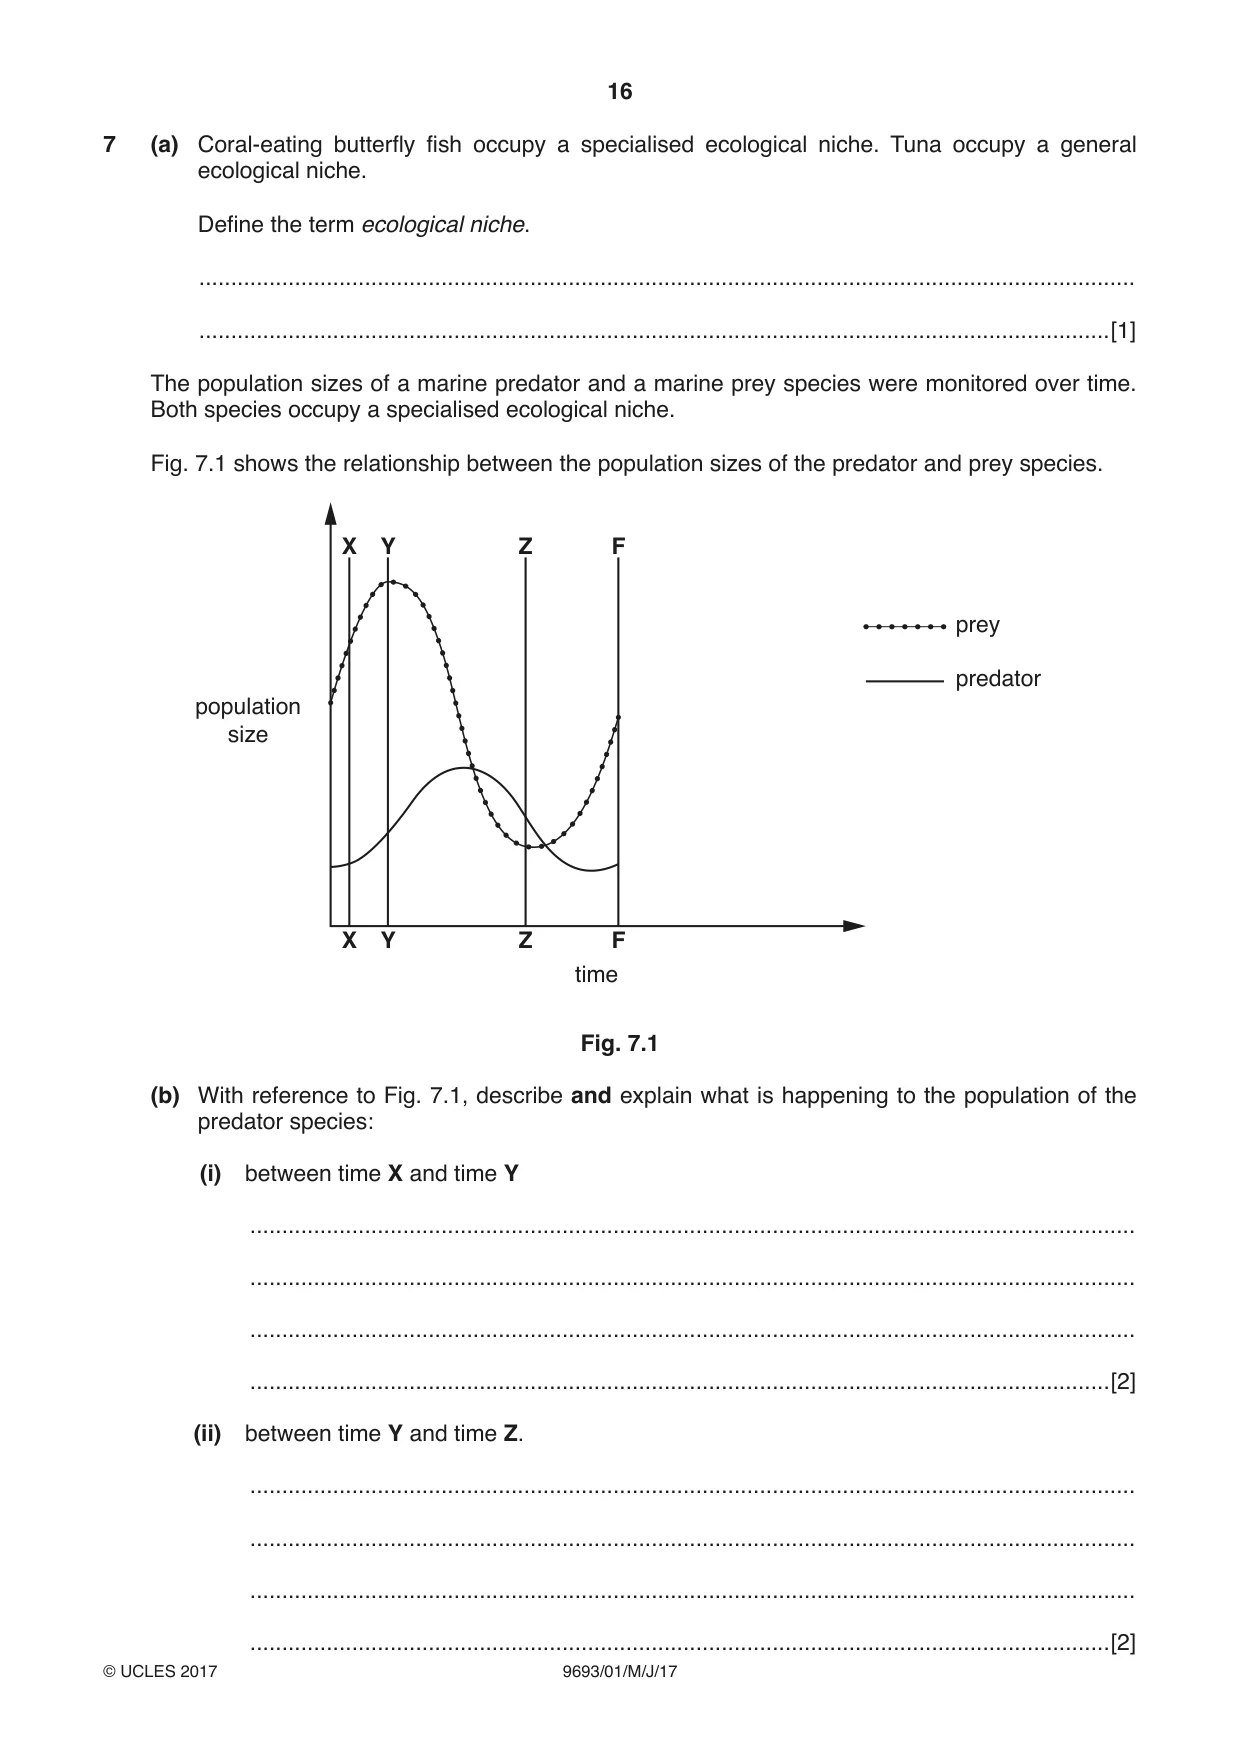
16 9693/01/M/J/17 © UCLES 2017 7 (a) Coral-eating butterfly fish occupy a specialised ecological niche. Tuna occupy a general ecological niche. Define the term ecological niche. … …[1] The population sizes of a marine predator and a marine prey species were monitored over time. Both species occupy a specialised ecological niche. Fig. 7.1 shows the relationship between the population sizes of the predator and prey species. prey predator X Y Z F X Y Z F population size time Fig. 7.1 (b) With reference to Fig. 7.1, describe and explain what is happening to the population of the predator species: (i) between time X and time Y … … … …[2] (ii) between time Y and time Z. … … … …[2]
Question paper, page 17
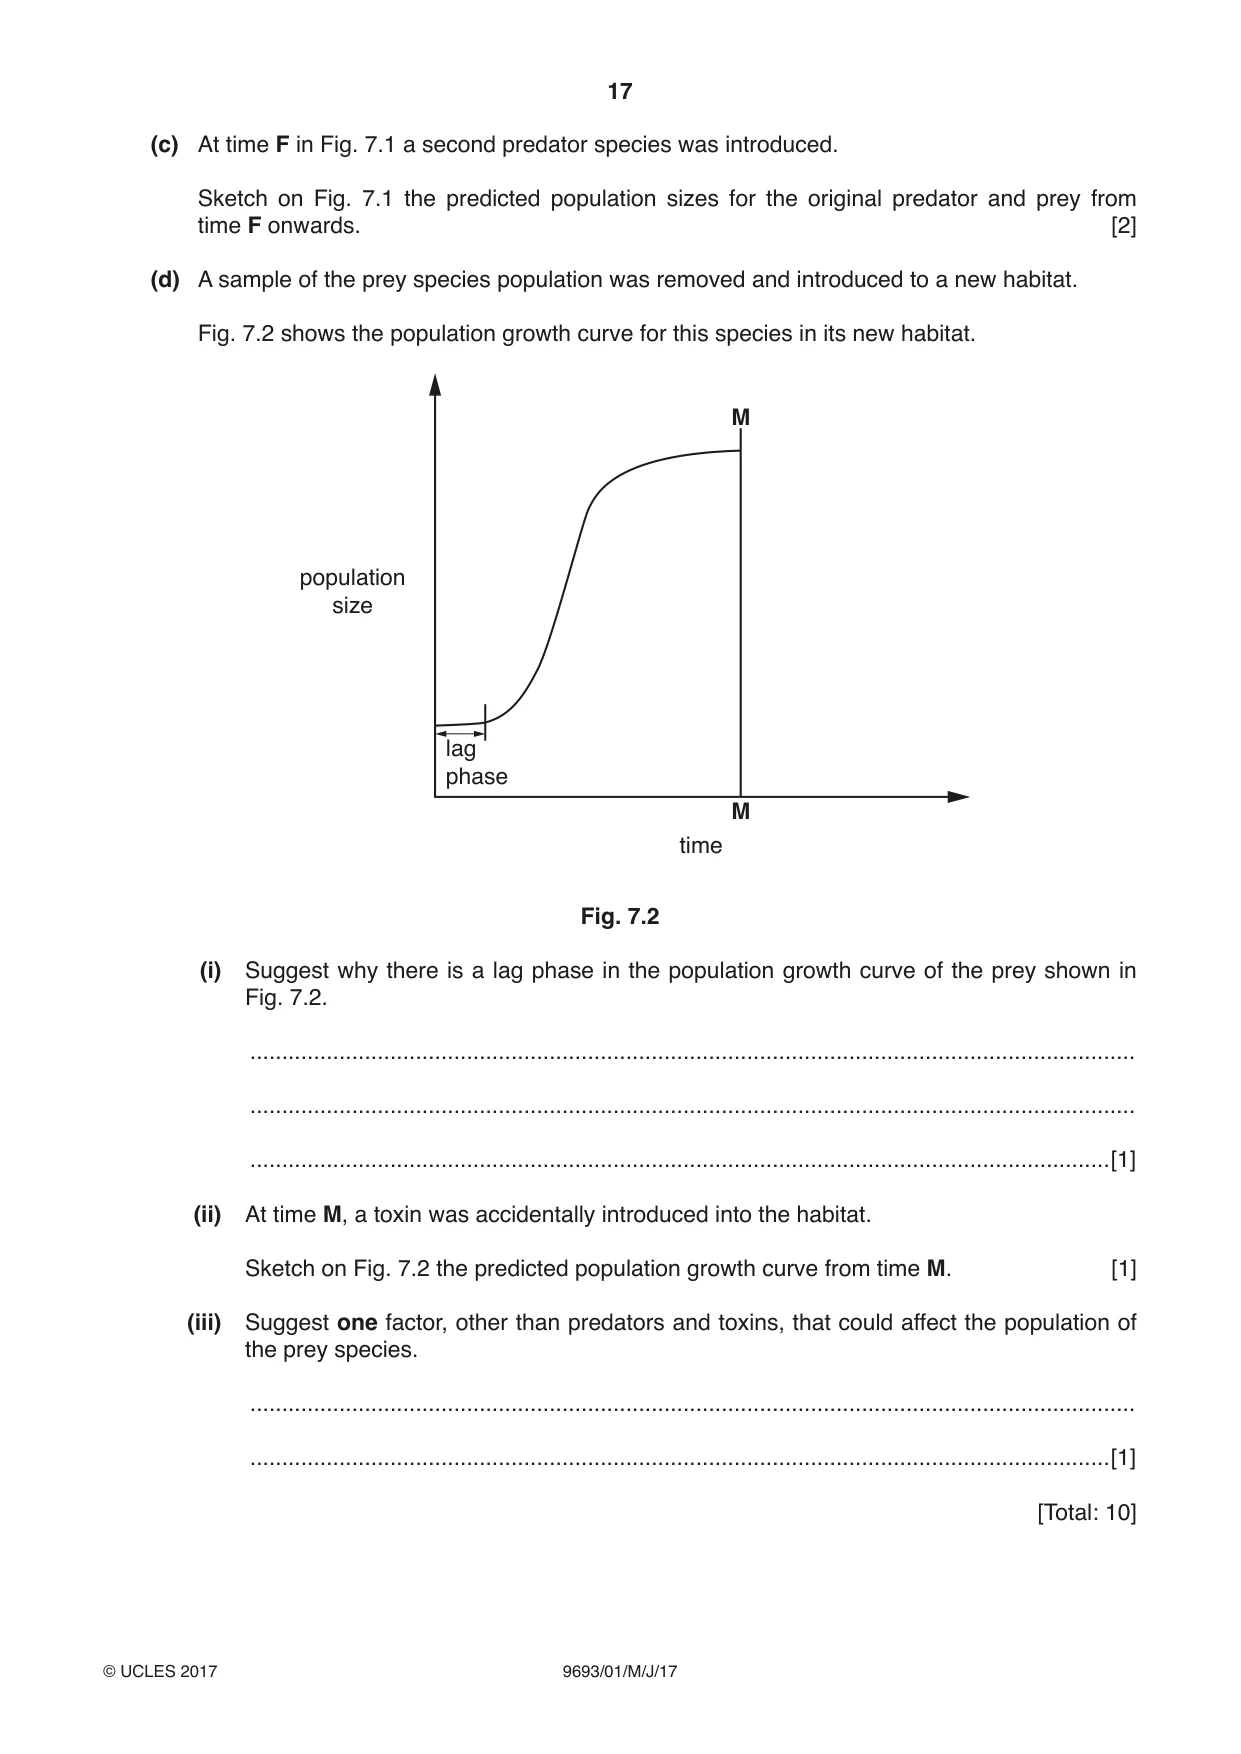
17 9693/01/M/J/17 © UCLES 2017 (c) At time F in Fig. 7.1 a second predator species was introduced. Sketch on Fig. 7.1 the predicted population sizes for the original predator and prey from time F onwards. [2] (d) A sample of the prey species population was removed and introduced to a new habitat. Fig. 7.2 shows the population growth curve for this species in its new habitat. M M population size time lag phase Fig. 7.2 (i) Suggest why there is a lag phase in the population growth curve of the prey shown in Fig. 7.2. … … …[1] (ii) At time M, a toxin was accidentally introduced into the habitat. Sketch on Fig. 7.2 the predicted population growth curve from time M. [1] (iii) Suggest one factor, other than predators and toxins, that could affect the population of the prey species. … …[1] [Total: 10]
Question paper, page 18
18 9693/01/M/J/17 © UCLES 2017 BLANK PAGE
Question paper, page 19
19 9693/01/M/J/17 © UCLES 2017 BLANK PAGE
Question paper, page 20
20 9693/01/M/J/17 © UCLES 2017 Permission to reproduce items where third-party owned material protected by copyright is included has been sought and cleared where possible. Every reasonable effort has been made by the publisher (UCLES) to trace copyright holders, but if any items requiring clearance have unwittingly been included, the publisher will be pleased to make amends at the earliest possible opportunity. To avoid the issue of disclosure of answer-related information to candidates, all copyright acknowledgements are reproduced online in the Cambridge International Examinations Copyright Acknowledgements Booklet. This is produced for each series of examinations and is freely available to download at www.cie.org.uk after the live examination series. Cambridge International Examinations is part of the Cambridge Assessment Group. Cambridge Assessment is the brand name of University of Cambridge Local Examinations Syndicate (UCLES), which is itself a department of the University of Cambridge. BLANK PAGE
Mark scheme, page 1
® IGCSE is a registered trademark. This document consists of 13 printed pages. © UCLES 2017 [Turn over Cambridge International Examinations Cambridge International Advanced Subsidiary and Advanced Level MARINE SCIENCE 9693/01 Paper 1 AS Structured Questions May/June 2017 MARK SCHEME Maximum Mark: 75 Published This mark scheme is published as an aid to teachers and candidates, to indicate the requirements of the examination. It shows the basis on which Examiners were instructed to award marks. It does not indicate the details of the discussions that took place at an Examiners’ meeting before marking began, which would have considered the acceptability of alternative answers. Mark schemes should be read in conjunction with the question paper and the Principal Examiner Report for Teachers. Cambridge will not enter into discussions about these mark schemes. Cambridge is publishing the mark schemes for the May/June 2017 series for most Cambridge IGCSE®, Cambridge International A and AS Level and Cambridge Pre-U components, and some Cambridge O Level components.
Mark scheme, page 2
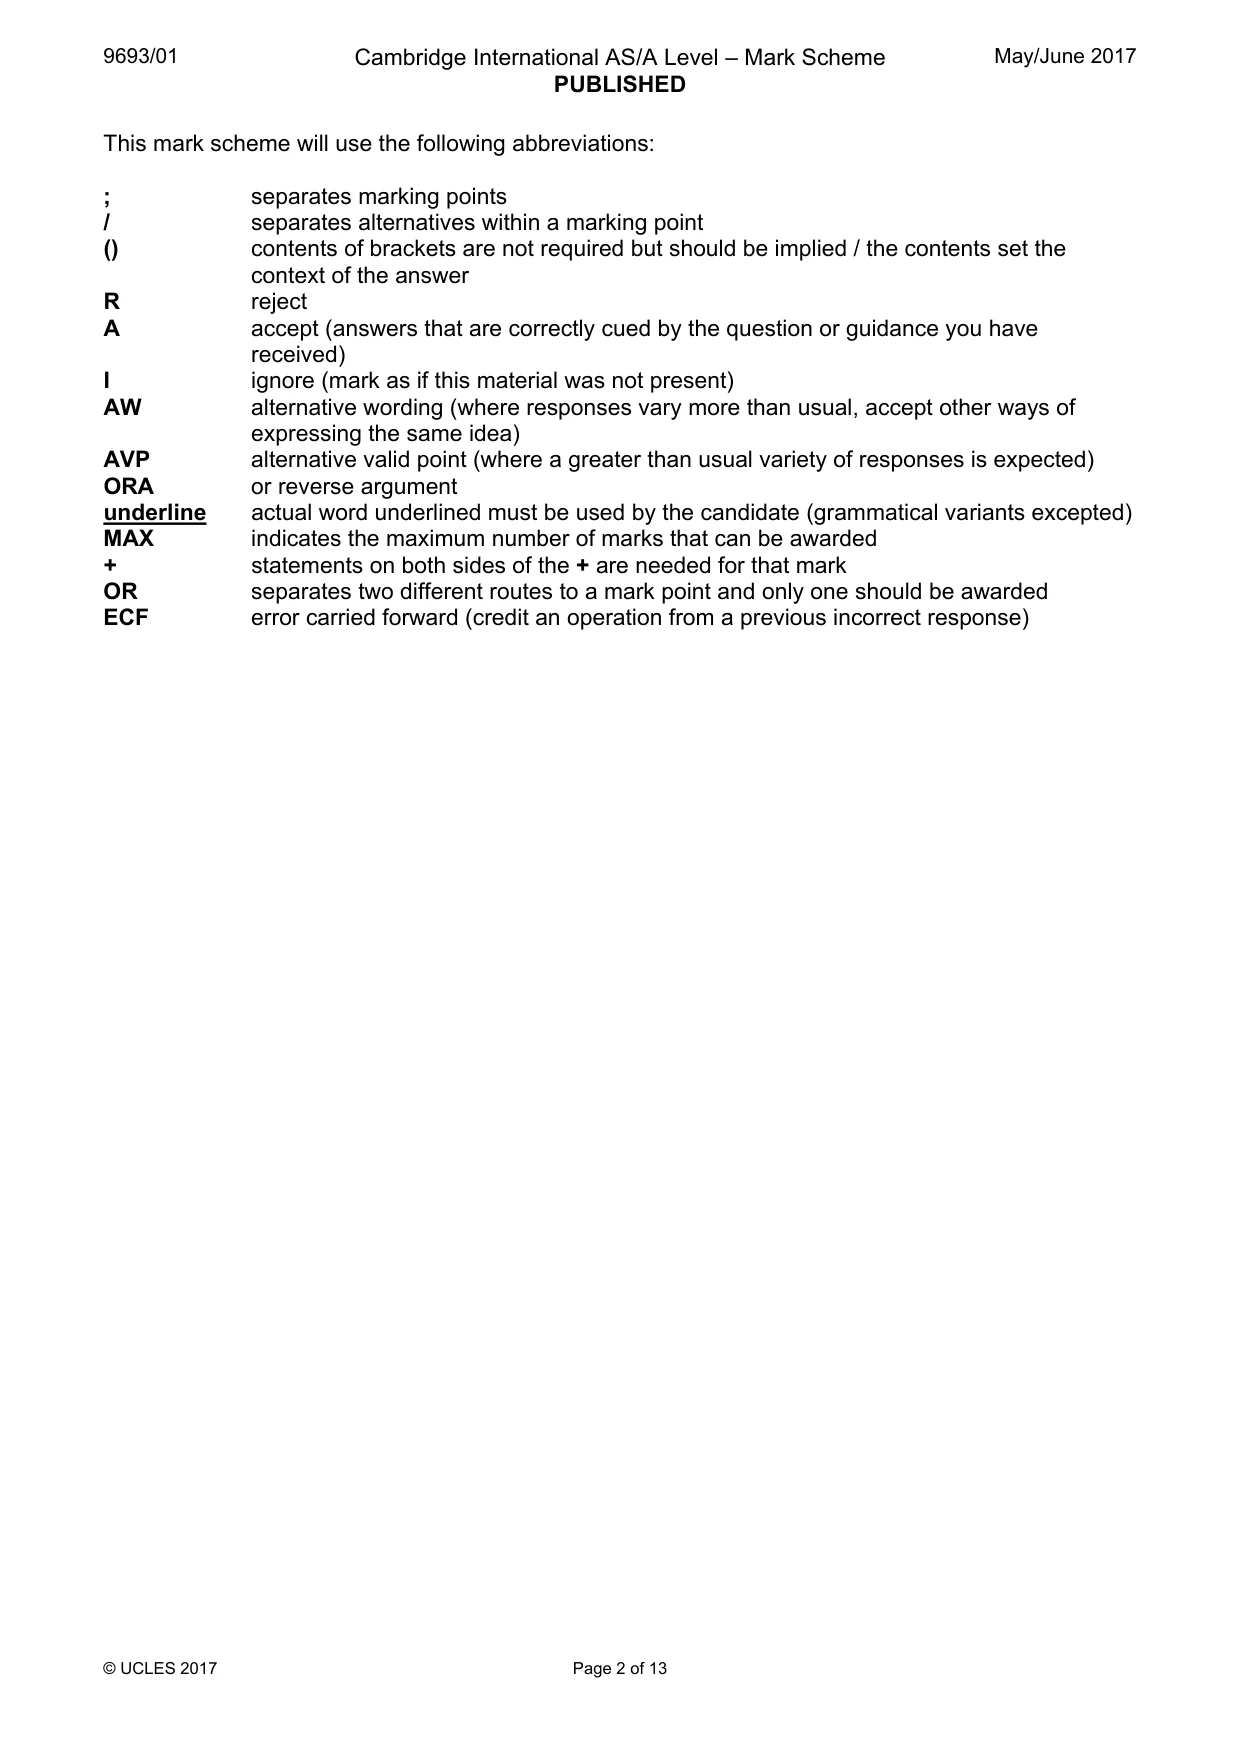
9693/01 Cambridge International AS/A Level – Mark Scheme PUBLISHED May/June 2017 © UCLES 2017 Page 2 of 13 This mark scheme will use the following abbreviations: ; separates marking points / separates alternatives within a marking point () contents of brackets are not required but should be implied / the contents set the context of the answer R reject A accept (answers that are correctly cued by the question or guidance you have received) I ignore (mark as if this material was not present) AW alternative wording (where responses vary more than usual, accept other ways of expressing the same idea) AVP alternative valid point (where a greater than usual variety of responses is expected) ORA or reverse argument underline actual word underlined must be used by the candidate (grammatical variants excepted) MAX indicates the maximum number of marks that can be awarded + statements on both sides of the + are needed for that mark OR separates two different routes to a mark point and only one should be awarded ECF error carried forward (credit an operation from a previous incorrect response)
Mark scheme, page 3
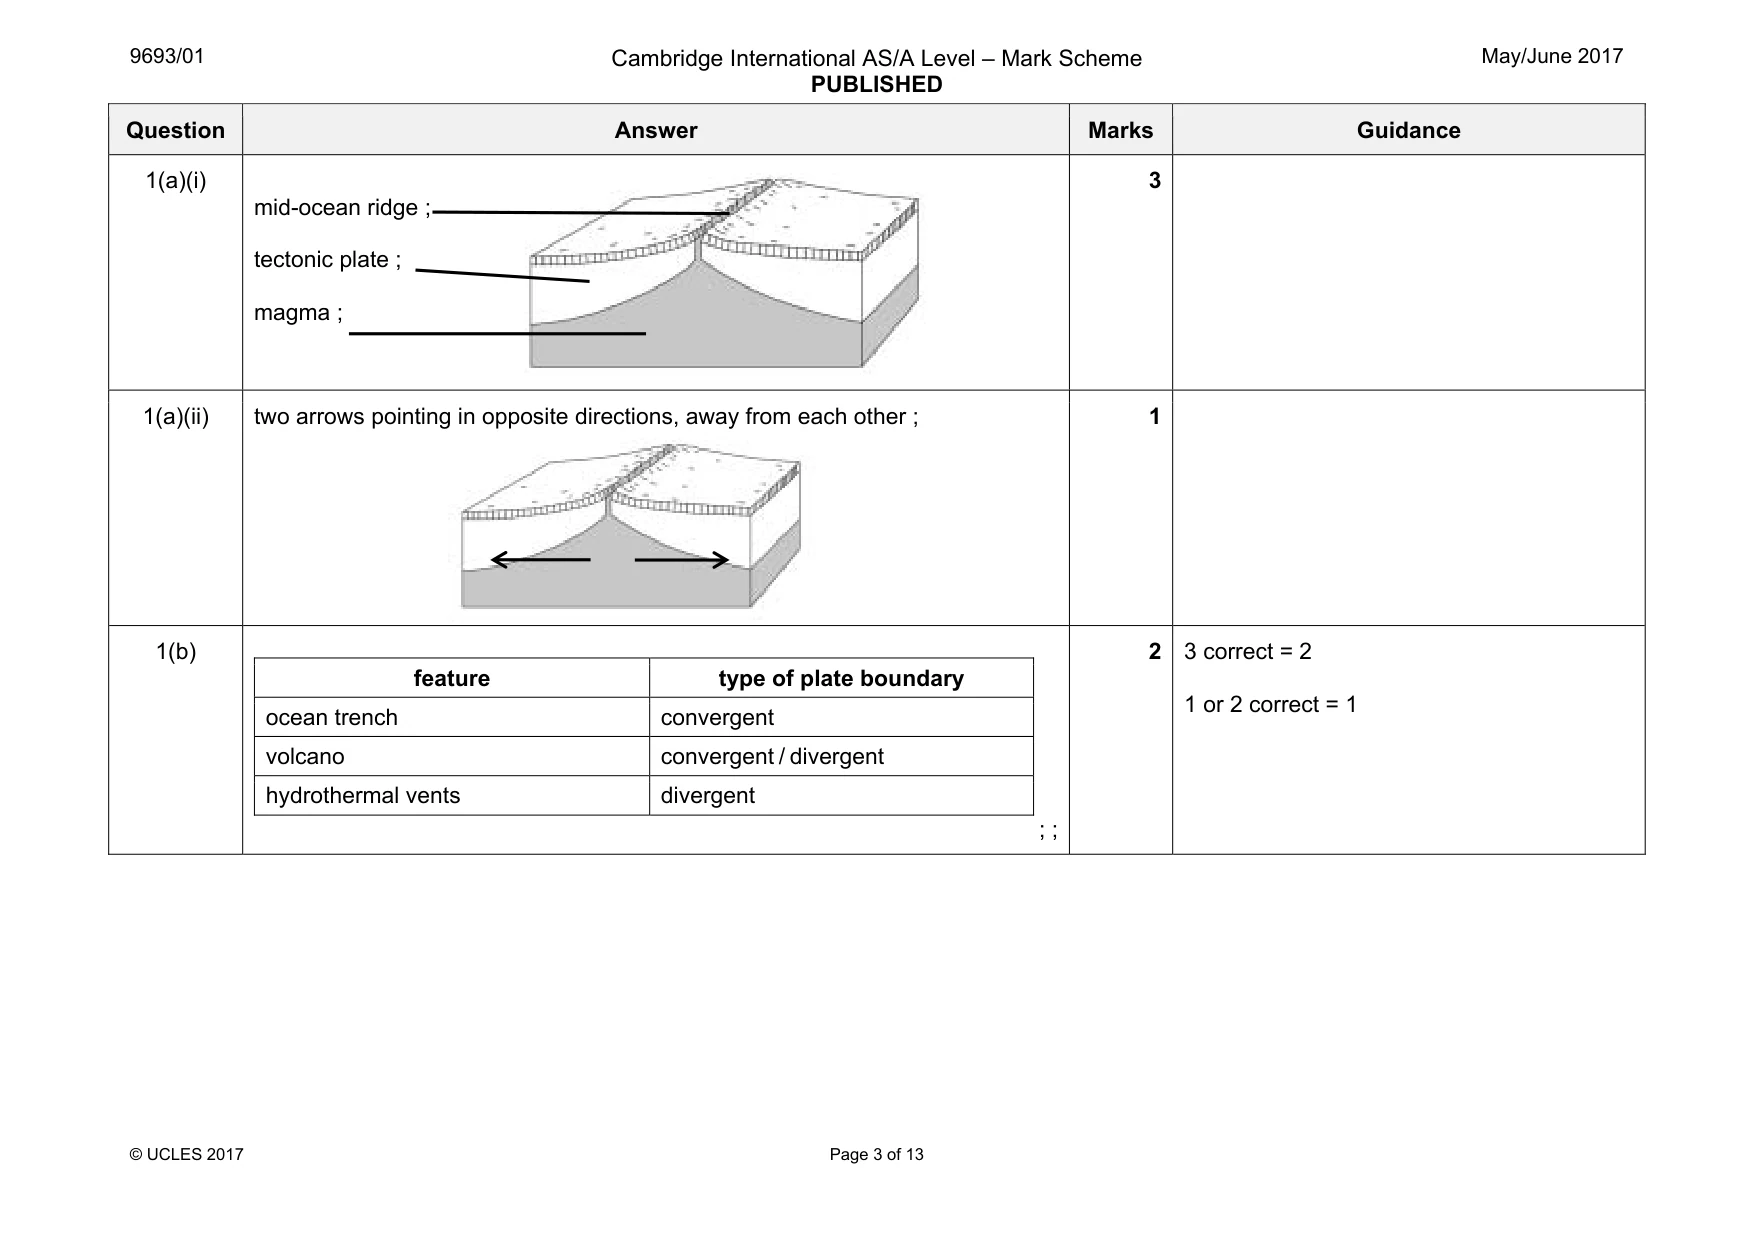
9693/01 Cambridge International AS/A Level – Mark Scheme PUBLISHED May/June 2017 © UCLES 2017 Page 3 of 13 Question Answer Marks Guidance 1(a)(i) mid-ocean ridge ; tectonic plate ; magma ; 3 1(a)(ii) two arrows pointing in opposite directions, away from each other ; 1 1(b) ; ; feature type of plate boundary ocean trench convergent volcano convergent / divergent hydrothermal vents divergent 2 3 correct = 2 1 or 2 correct = 1
Mark scheme, page 4
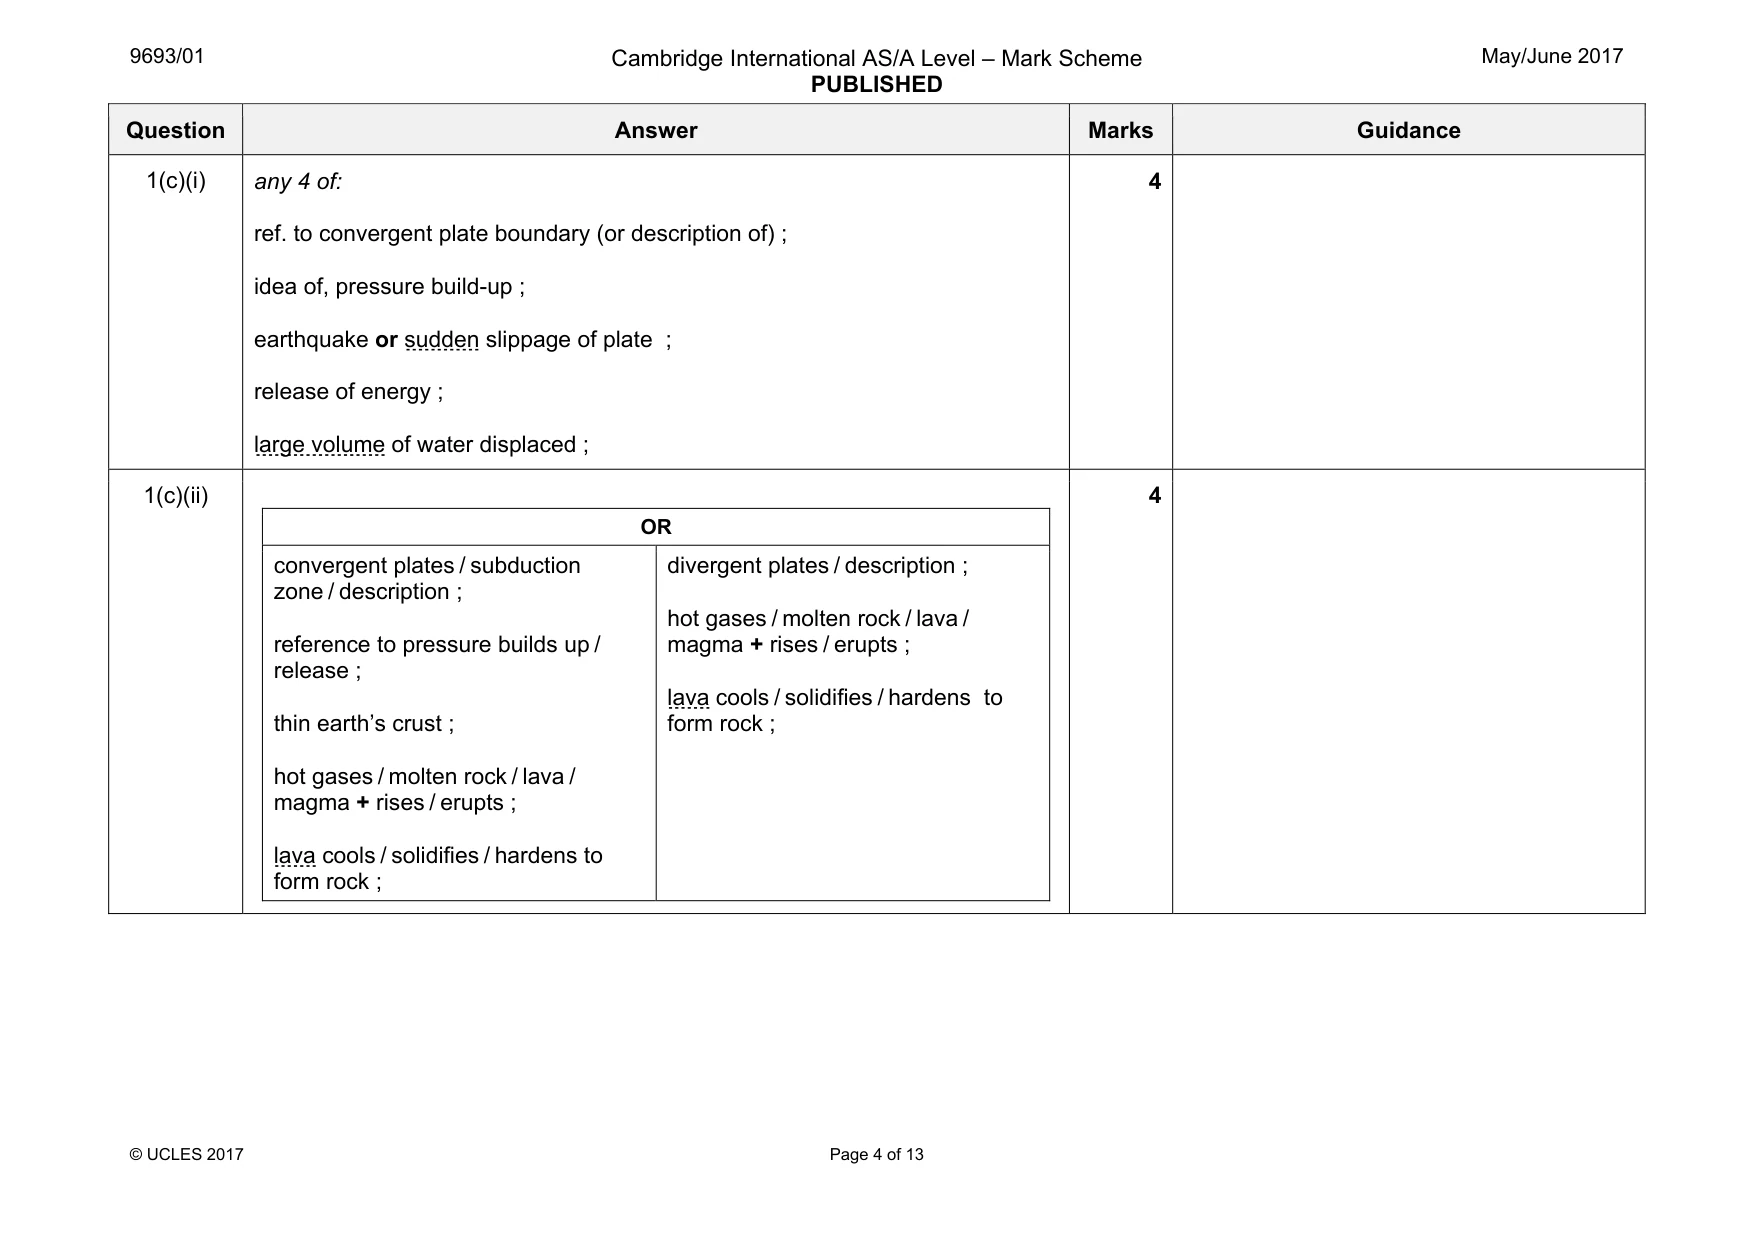
9693/01 Cambridge International AS/A Level – Mark Scheme PUBLISHED May/June 2017 © UCLES 2017 Page 4 of 13 Question Answer Marks Guidance 1(c)(i) any 4 of: ref. to convergent plate boundary (or description of) ; idea of, pressure build-up ; earthquake or sudden slippage of plate ; release of energy ; large volume of water displaced ; 4 1(c)(ii) OR convergent plates / subduction zone / description ; reference to pressure builds up / release ; thin earth’s crust ; hot gases / molten rock / lava / magma + rises / erupts ; lava cools / solidifies / hardens to form rock ; divergent plates / description ; hot gases / molten rock / lava / magma + rises / erupts ; lava cools / solidifies / hardens to form rock ; 4
Mark scheme, page 5
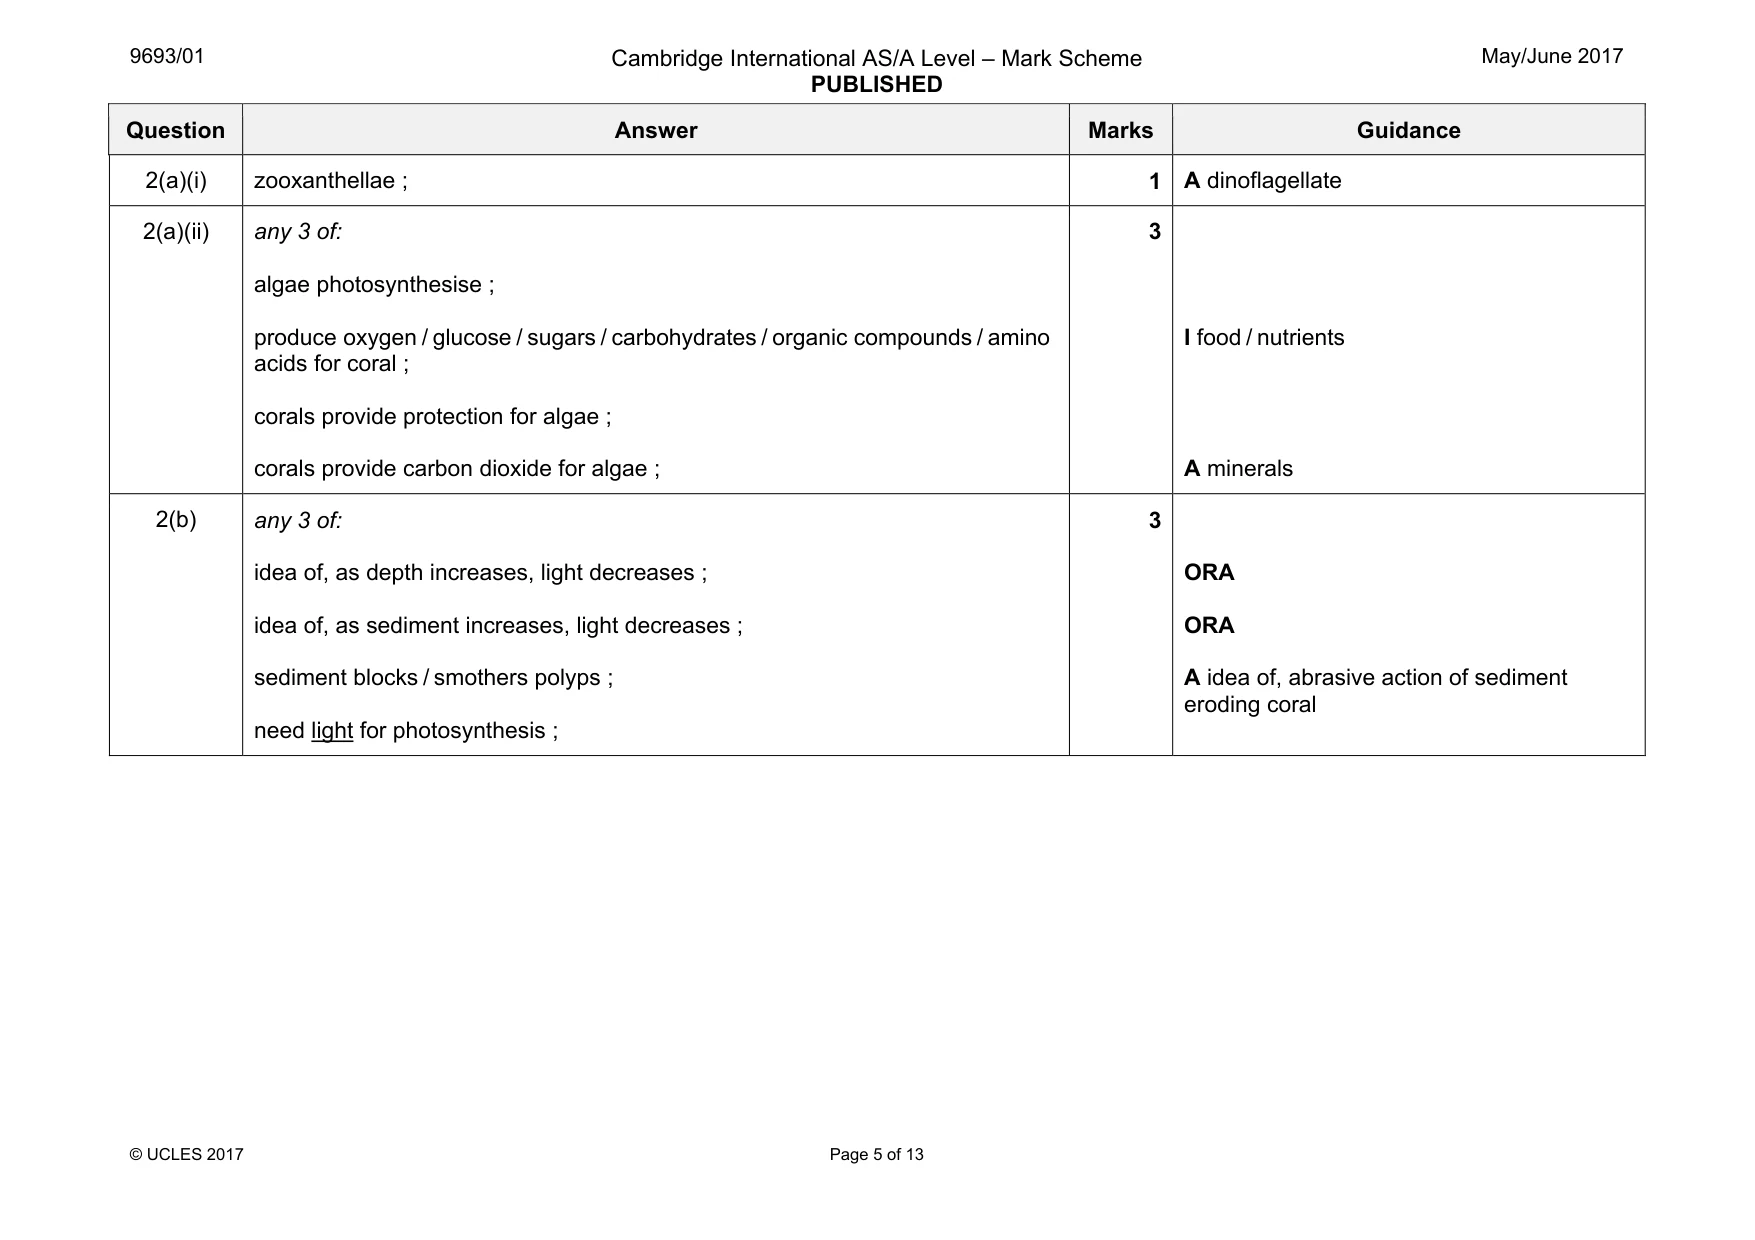
9693/01 Cambridge International AS/A Level – Mark Scheme PUBLISHED May/June 2017 © UCLES 2017 Page 5 of 13 Question Answer Marks Guidance 2(a)(i) zooxanthellae ; 1 A dinoflagellate 2(a)(ii) any 3 of: algae photosynthesise ; produce oxygen / glucose / sugars / carbohydrates / organic compounds / amino acids for coral ; corals provide protection for algae ; corals provide carbon dioxide for algae ; 3 I food / nutrients A minerals 2(b) any 3 of: idea of, as depth increases, light decreases ; idea of, as sediment increases, light decreases ; sediment blocks / smothers polyps ; need light for photosynthesis ; 3 ORA ORA A idea of, abrasive action of sediment eroding coral
Mark scheme, page 6
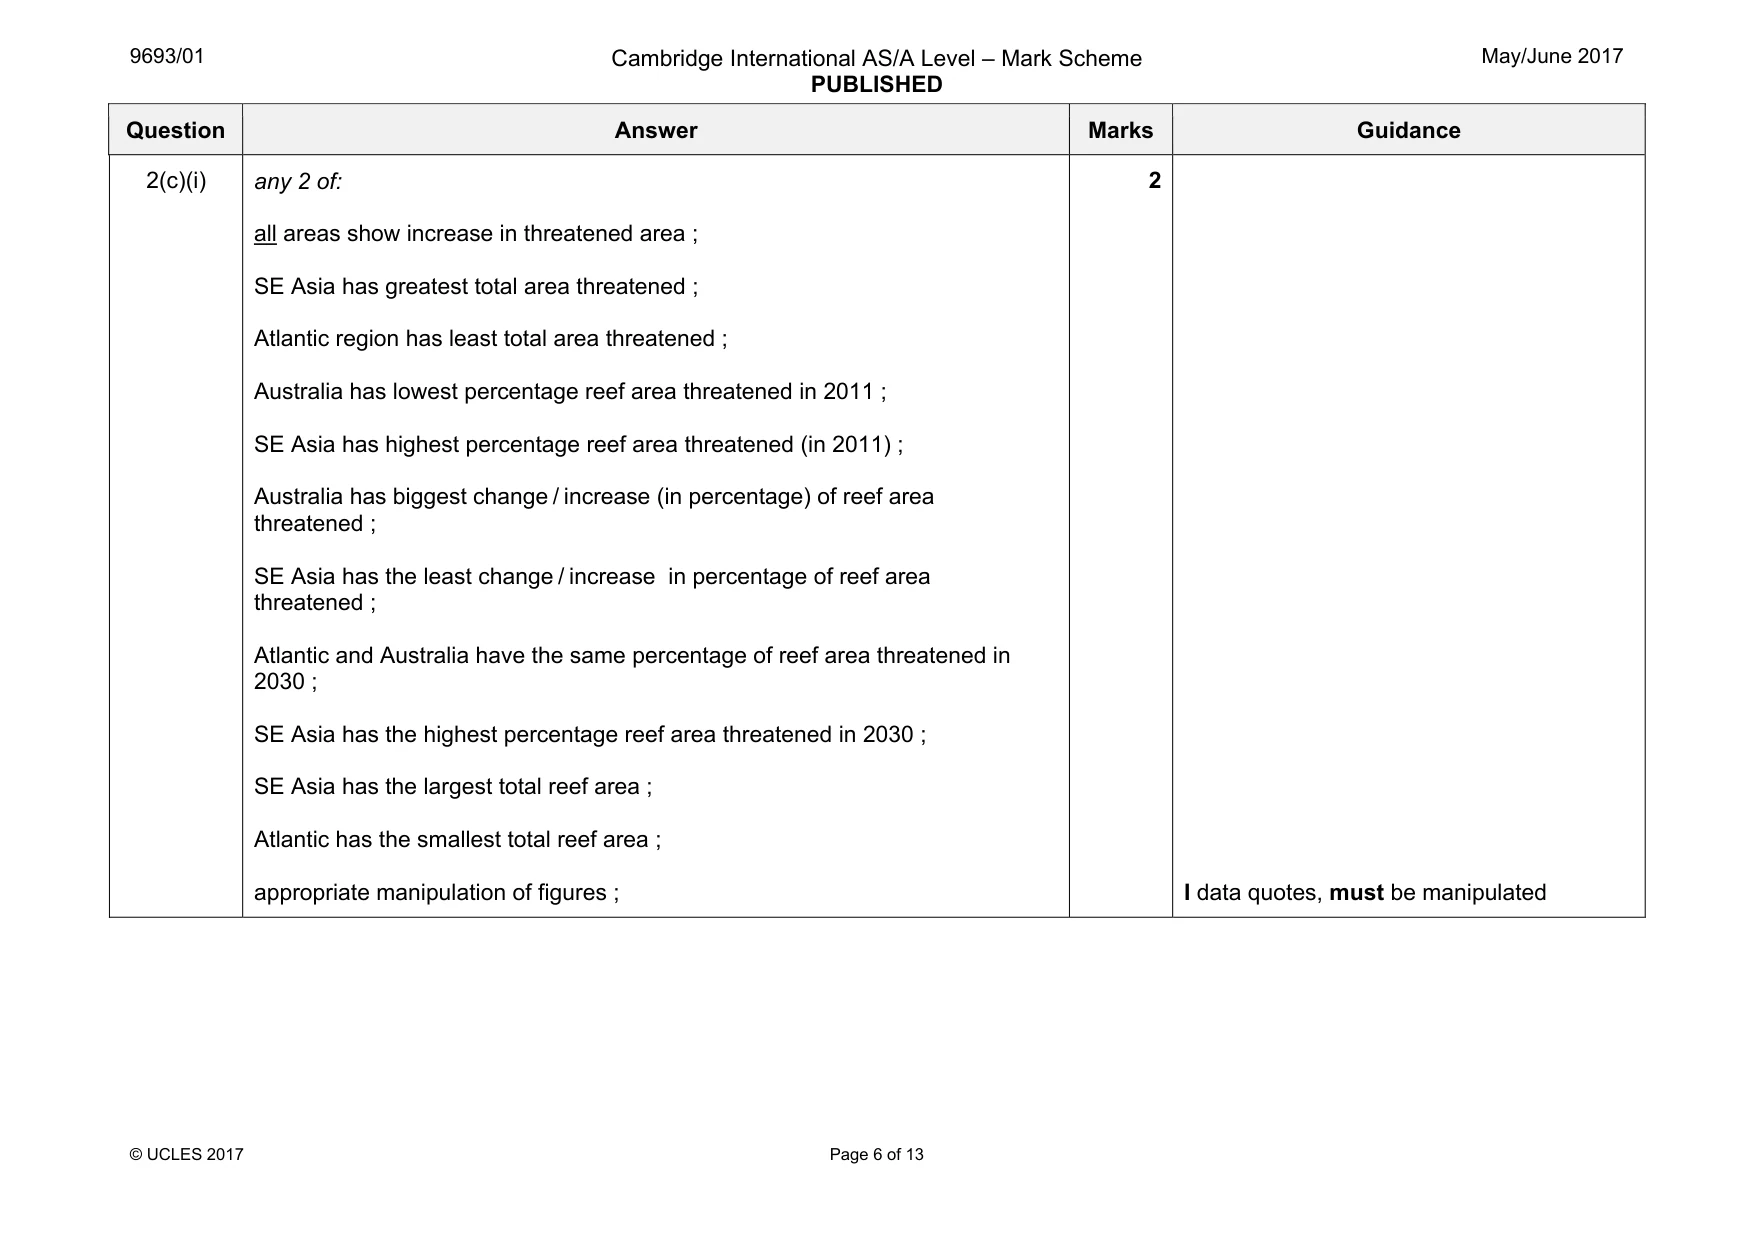
9693/01 Cambridge International AS/A Level – Mark Scheme PUBLISHED May/June 2017 © UCLES 2017 Page 6 of 13 Question Answer Marks Guidance 2(c)(i) any 2 of: all areas show increase in threatened area ; SE Asia has greatest total area threatened ; Atlantic region has least total area threatened ; Australia has lowest percentage reef area threatened in 2011 ; SE Asia has highest percentage reef area threatened (in 2011) ; Australia has biggest change / increase (in percentage) of reef area threatened ; SE Asia has the least change / increase in percentage of reef area threatened ; Atlantic and Australia have the same percentage of reef area threatened in 2030 ; SE Asia has the highest percentage reef area threatened in 2030 ; SE Asia has the largest total reef area ; Atlantic has the smallest total reef area ; appropriate manipulation of figures ; 2 I data quotes, must be manipulated
Mark scheme, page 7
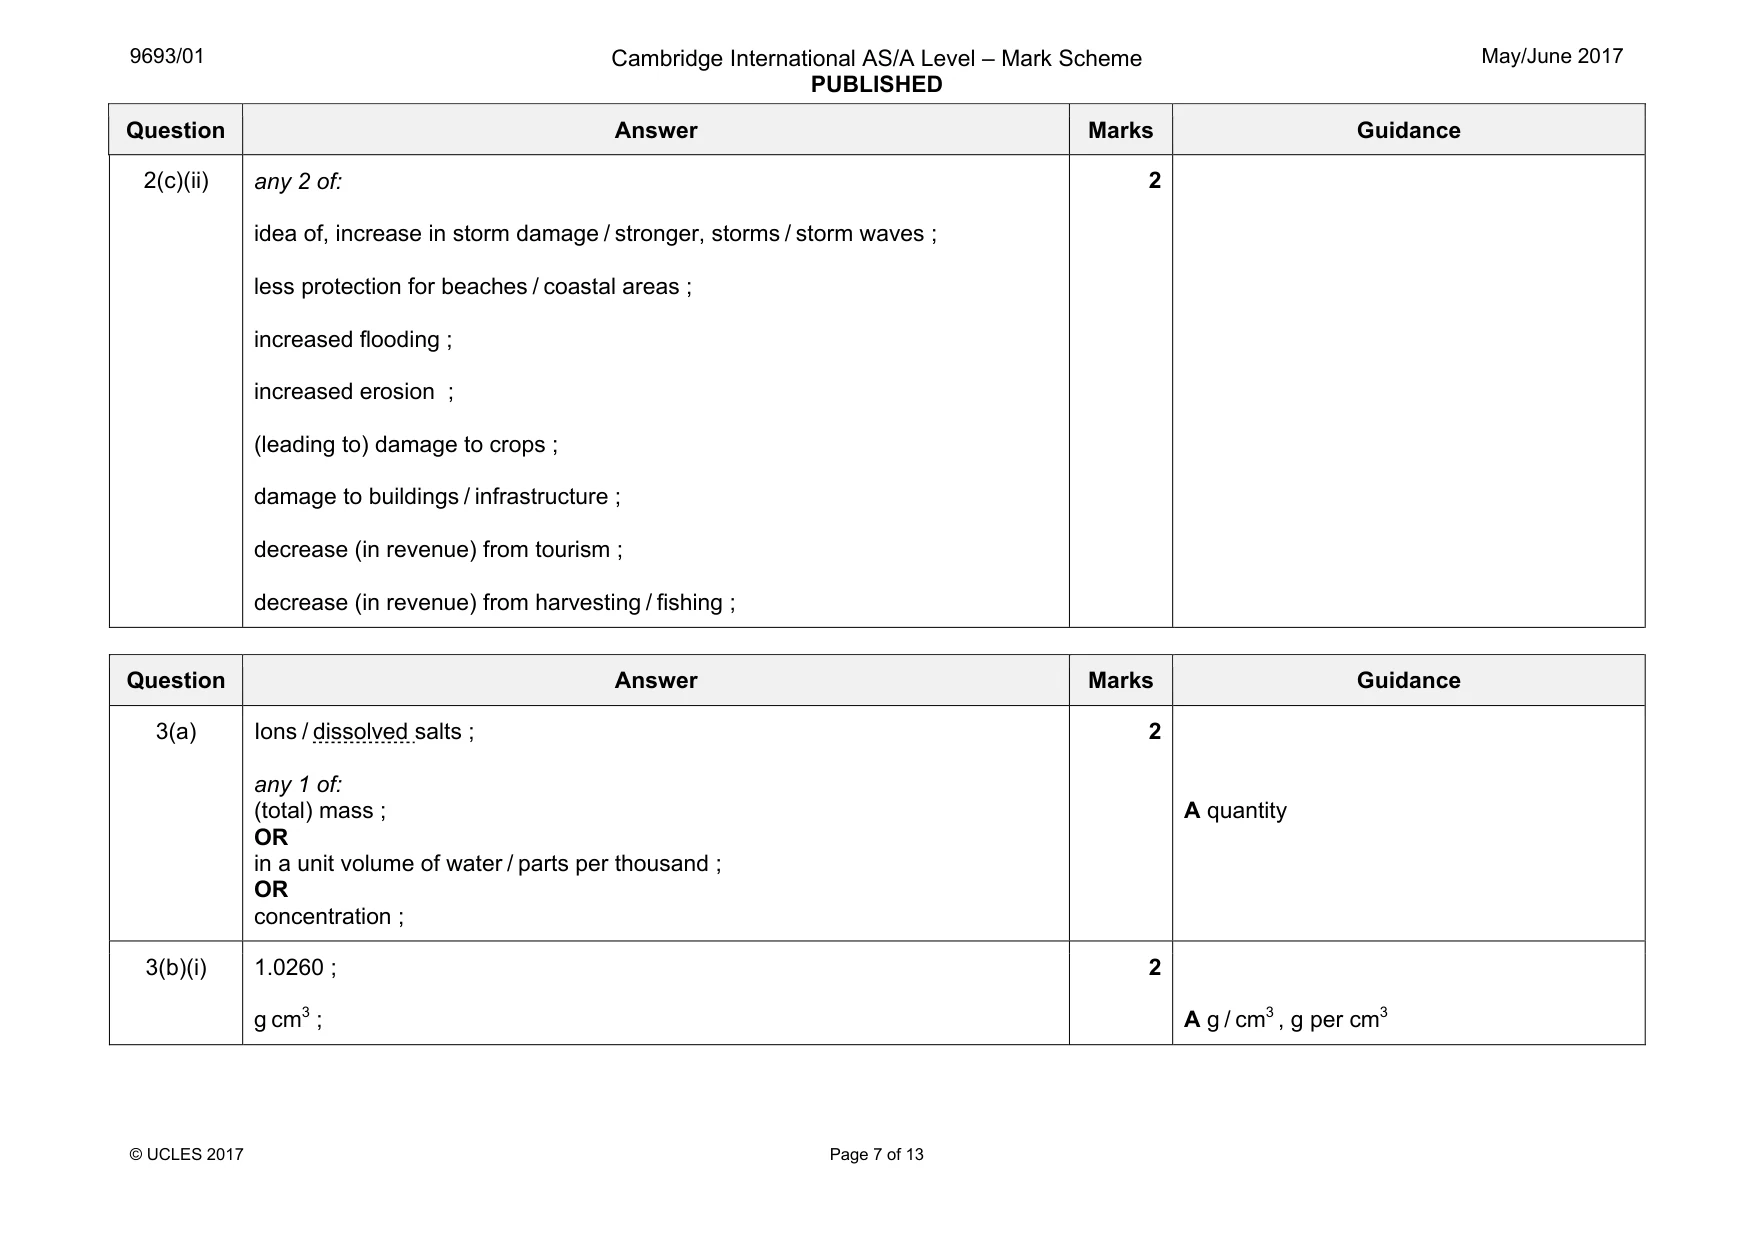
9693/01 Cambridge International AS/A Level – Mark Scheme PUBLISHED May/June 2017 © UCLES 2017 Page 7 of 13 Question Answer Marks Guidance 2(c)(ii) any 2 of: idea of, increase in storm damage / stronger, storms / storm waves ; less protection for beaches / coastal areas ; increased flooding ; increased erosion ; (leading to) damage to crops ; damage to buildings / infrastructure ; decrease (in revenue) from tourism ; decrease (in revenue) from harvesting / fishing ; 2 Question Answer Marks Guidance 3(a) Ions / dissolved salts ; any 1 of: (total) mass ; OR in a unit volume of water / parts per thousand ; OR concentration ; 2 A quantity 3(b)(i) 1.0260 ; g cm3 ; 2 A g / cm3 , g per cm3
Mark scheme, page 8
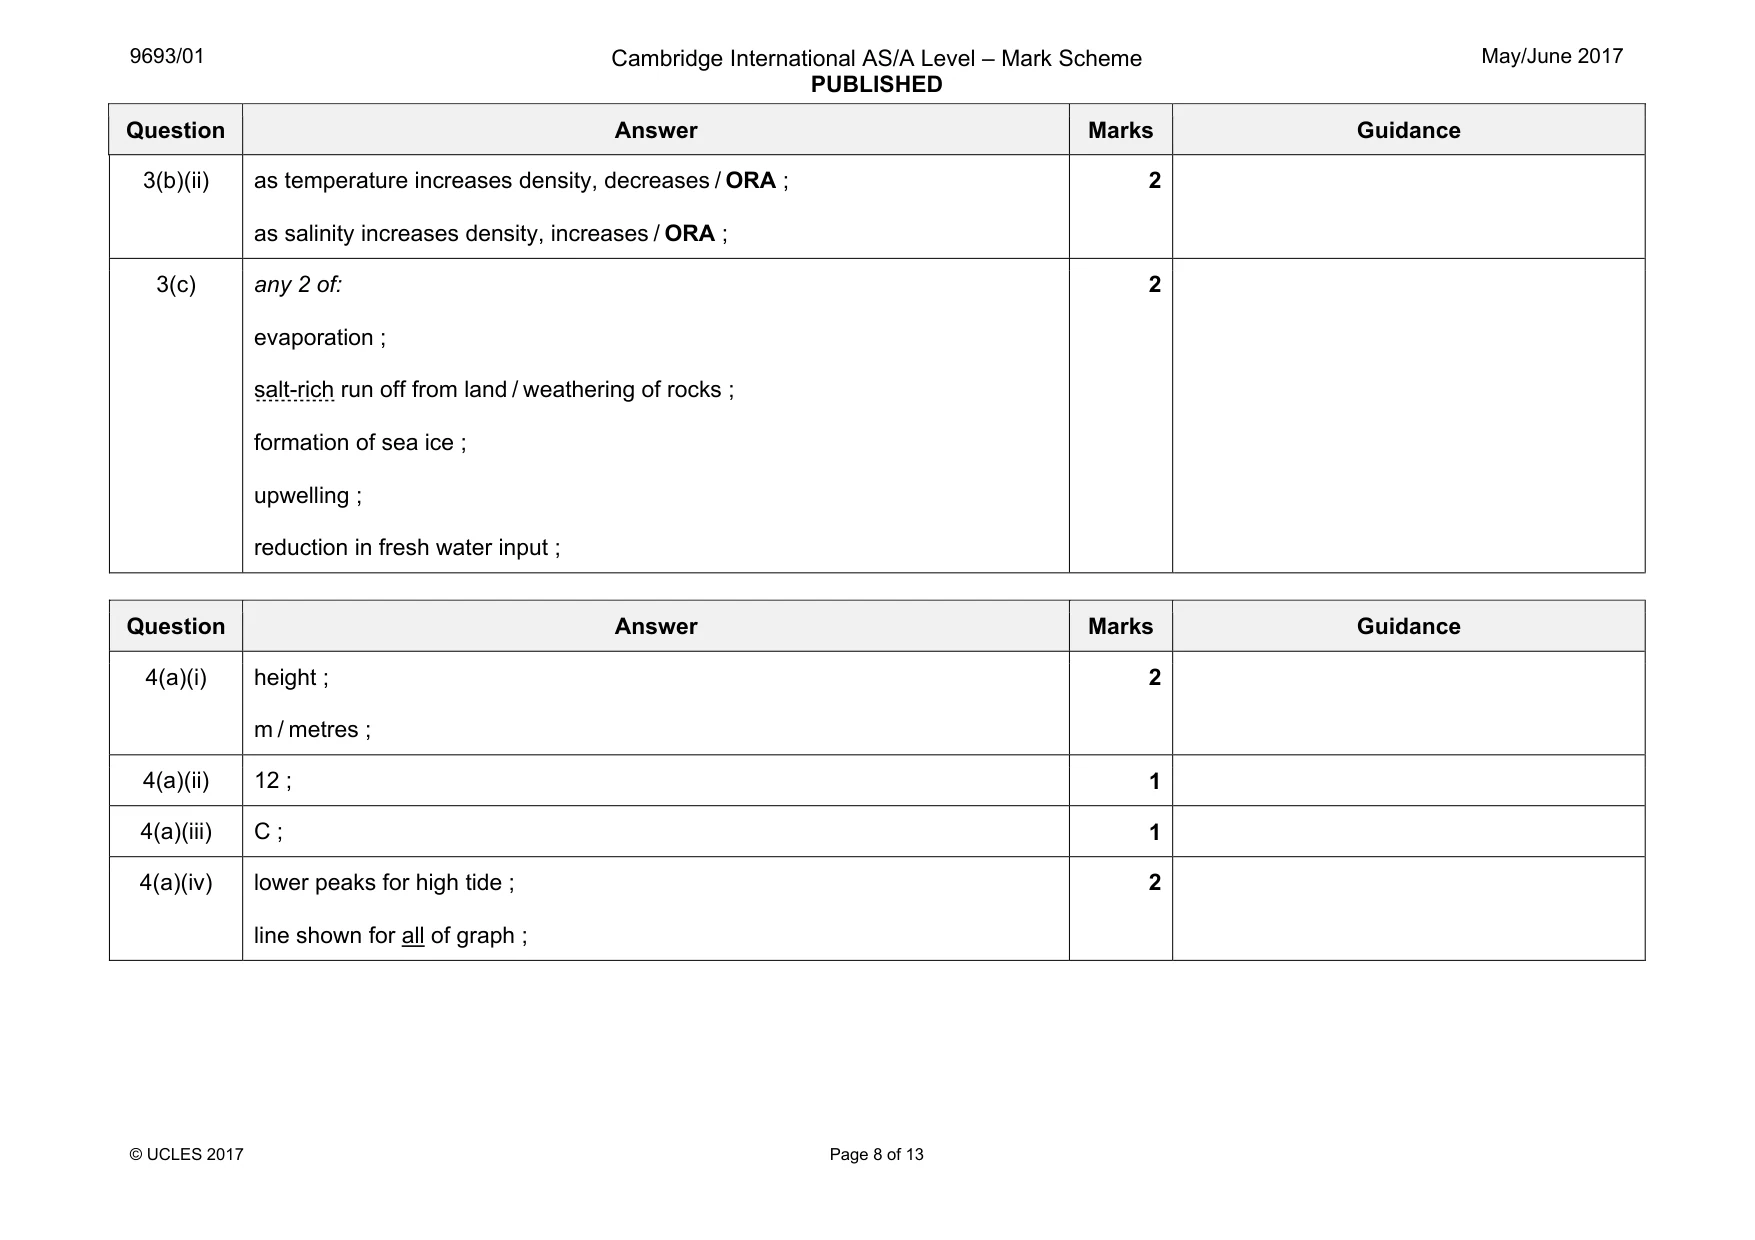
9693/01 Cambridge International AS/A Level – Mark Scheme PUBLISHED May/June 2017 © UCLES 2017 Page 8 of 13 Question Answer Marks Guidance 3(b)(ii) as temperature increases density, decreases / ORA ; as salinity increases density, increases / ORA ; 2 3(c) any 2 of: evaporation ; salt-rich run off from land / weathering of rocks ; formation of sea ice ; upwelling ; reduction in fresh water input ; 2 Question Answer Marks Guidance 4(a)(i) height ; m / metres ; 2 4(a)(ii) 12 ; 1 4(a)(iii) C ; 1 4(a)(iv) lower peaks for high tide ; line shown for all of graph ; 2
Mark scheme, page 9
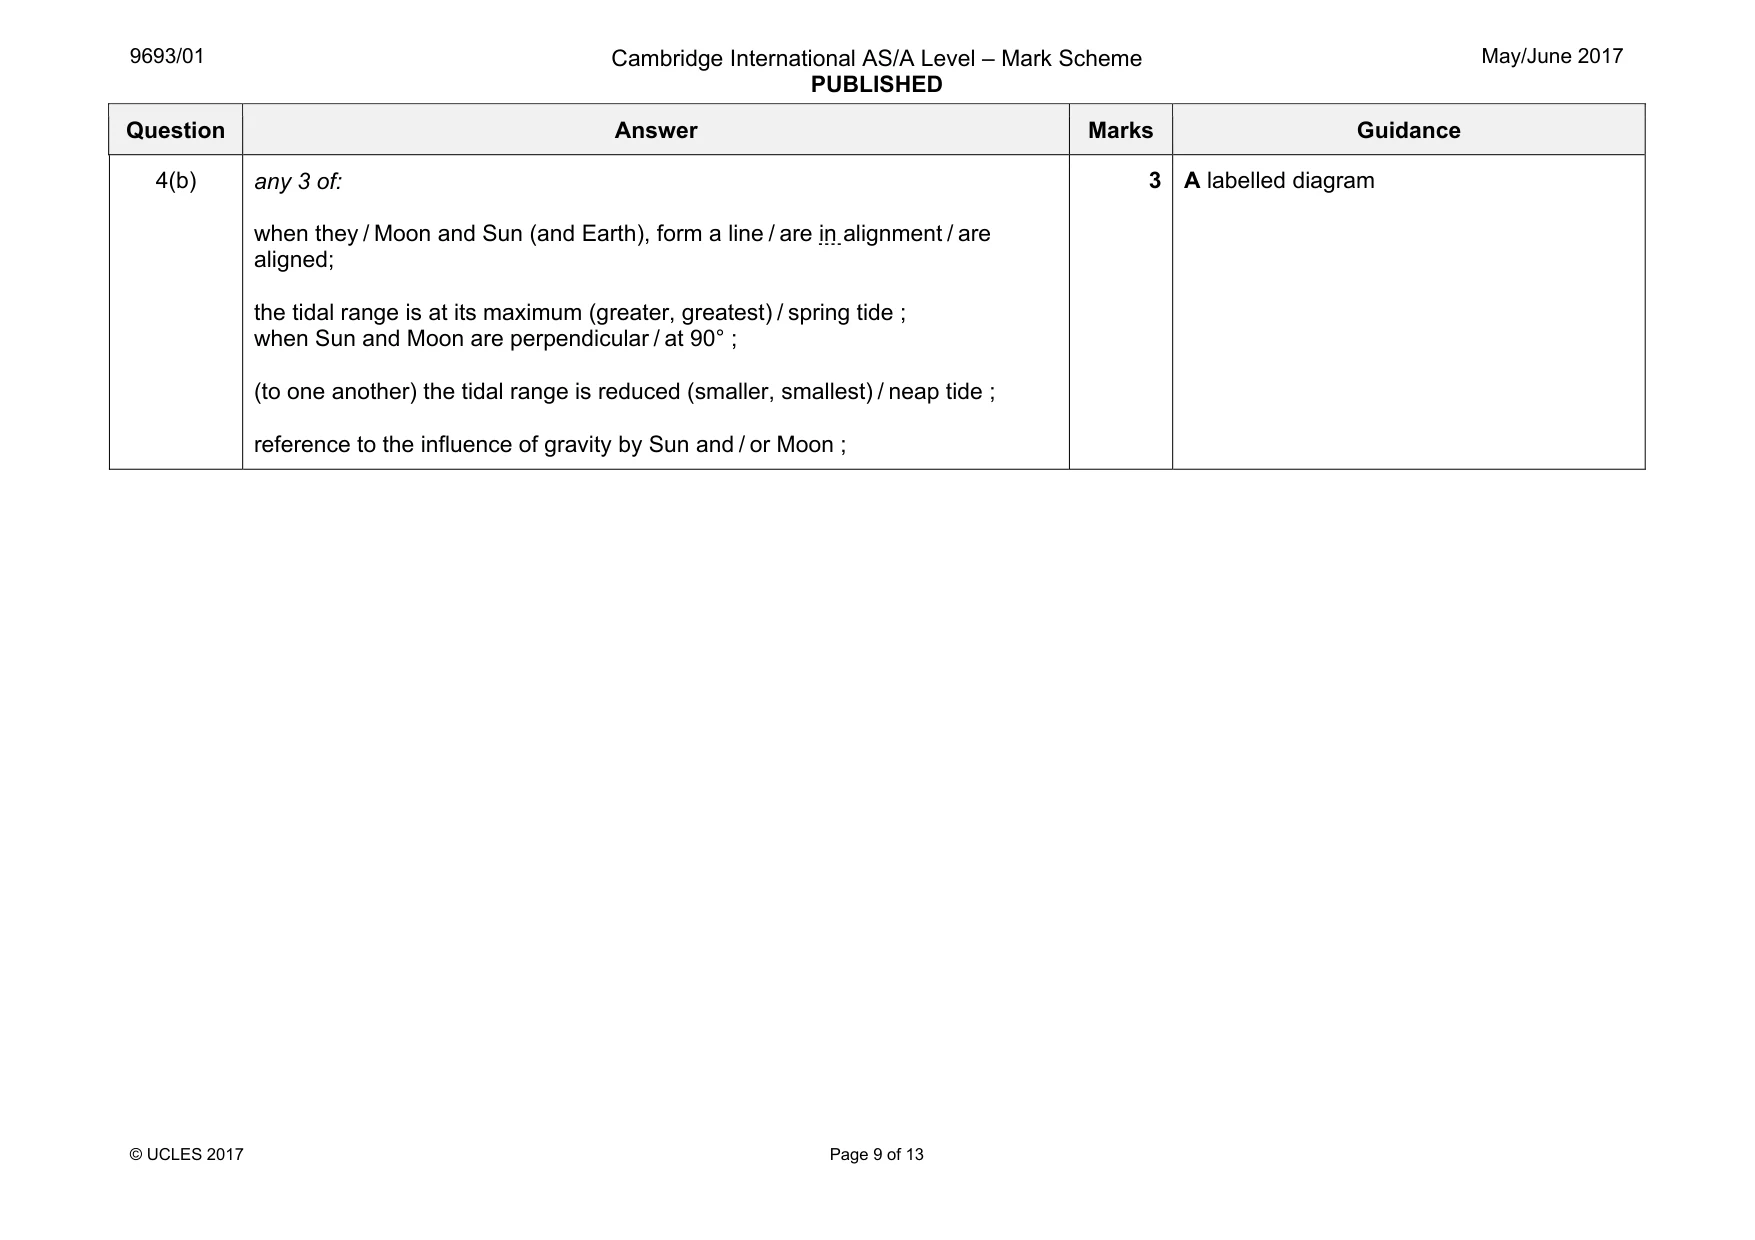
9693/01 Cambridge International AS/A Level – Mark Scheme PUBLISHED May/June 2017 © UCLES 2017 Page 9 of 13 Question Answer Marks Guidance 4(b) any 3 of: when they / Moon and Sun (and Earth), form a line / are in alignment / are aligned; the tidal range is at its maximum (greater, greatest) / spring tide ; when Sun and Moon are perpendicular / at 90° ; (to one another) the tidal range is reduced (smaller, smallest) / neap tide ; reference to the influence of gravity by Sun and / or Moon ; 3 A labelled diagram
Mark scheme, page 10
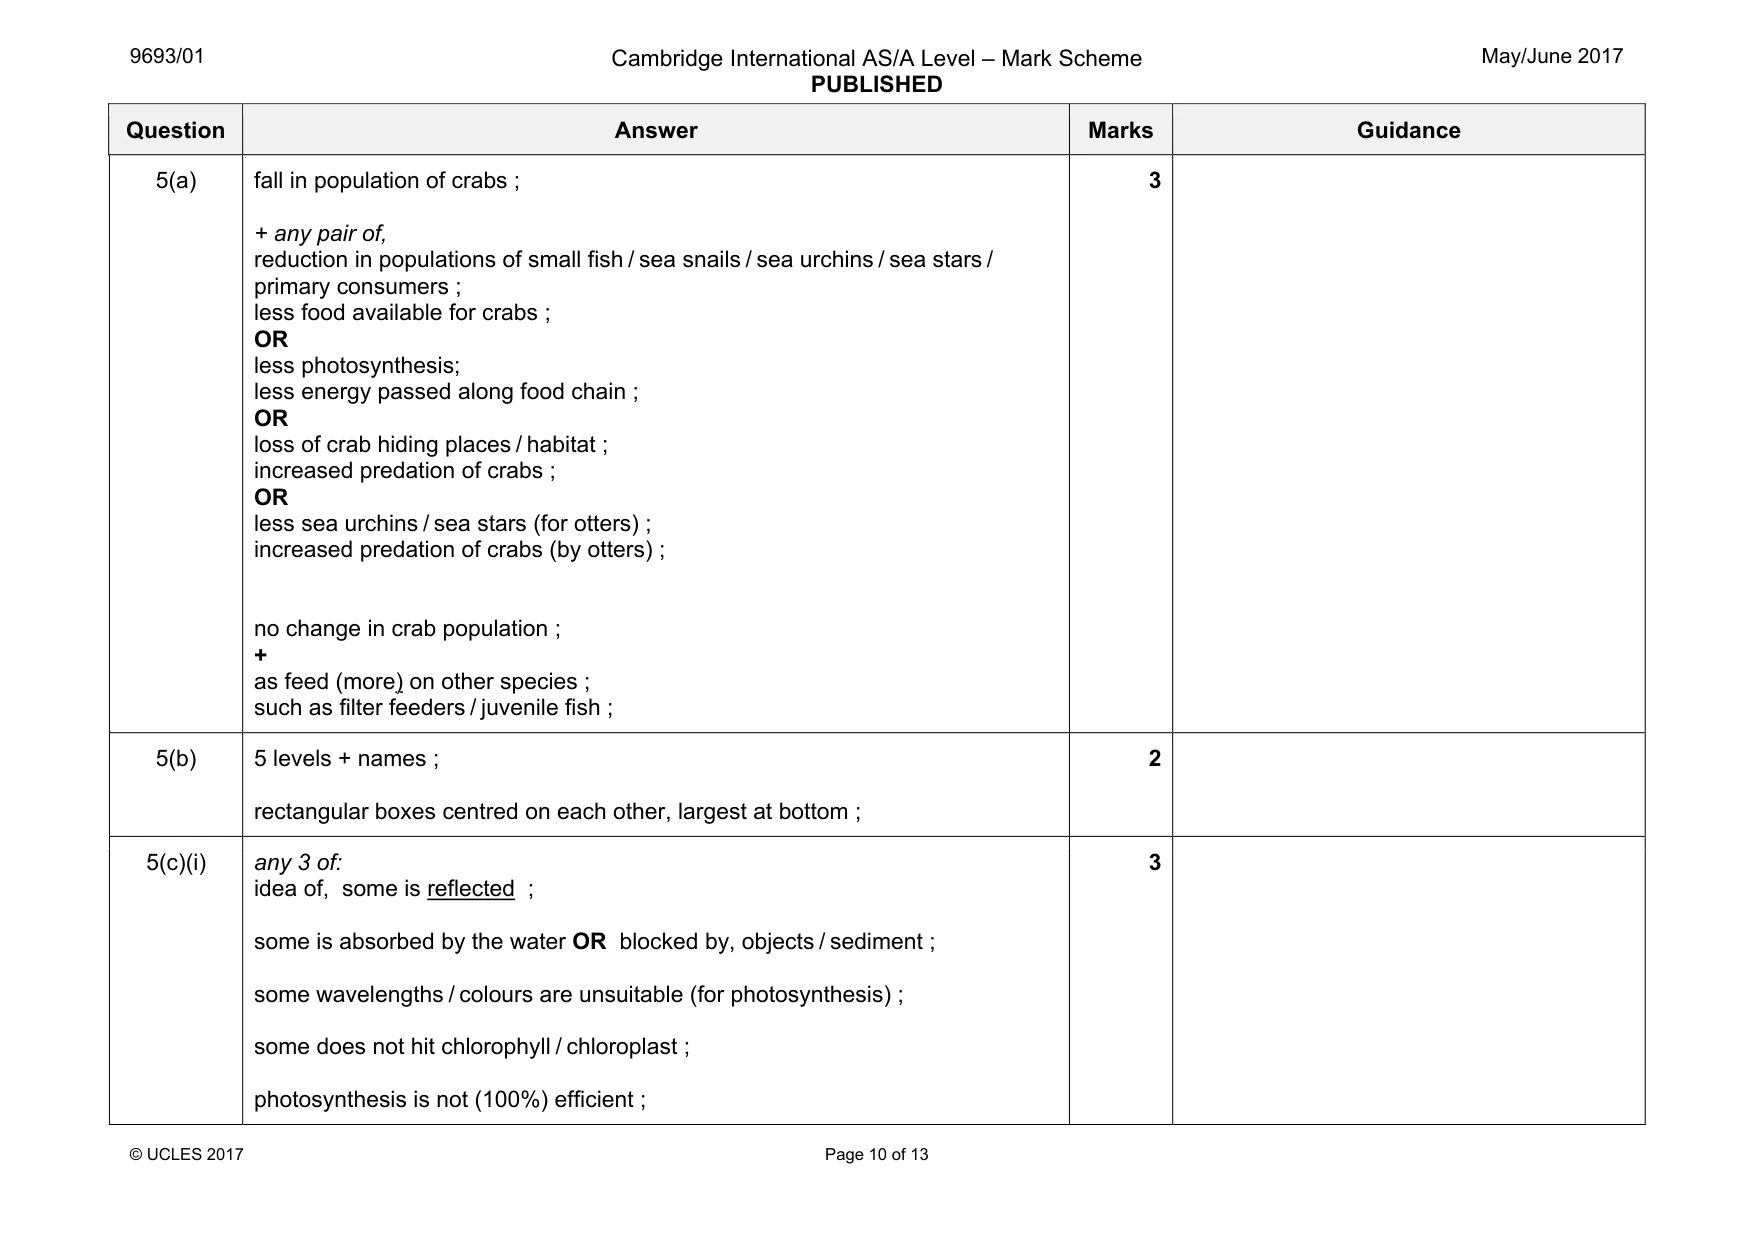
9693/01 Cambridge International AS/A Level – Mark Scheme PUBLISHED May/June 2017 © UCLES 2017 Page 10 of 13 Question Answer Marks Guidance 5(a) fall in population of crabs ; + any pair of, reduction in populations of small fish / sea snails / sea urchins / sea stars / primary consumers ; less food available for crabs ; OR less photosynthesis; less energy passed along food chain ; OR loss of crab hiding places / habitat ; increased predation of crabs ; OR less sea urchins / sea stars (for otters) ; increased predation of crabs (by otters) ; no change in crab population ; + as feed (more) on other species ; such as filter feeders / juvenile fish ; 3 5(b) 5 levels + names ; rectangular boxes centred on each other, largest at bottom ; 2 5(c)(i) any 3 of: idea of, some is reflected ; some is absorbed by the water OR blocked by, objects / sediment ; some wavelengths / colours are unsuitable (for photosynthesis) ; some does not hit chlorophyll / chloroplast ; photosynthesis is not (100%) efficient ; 3
Mark scheme, page 11
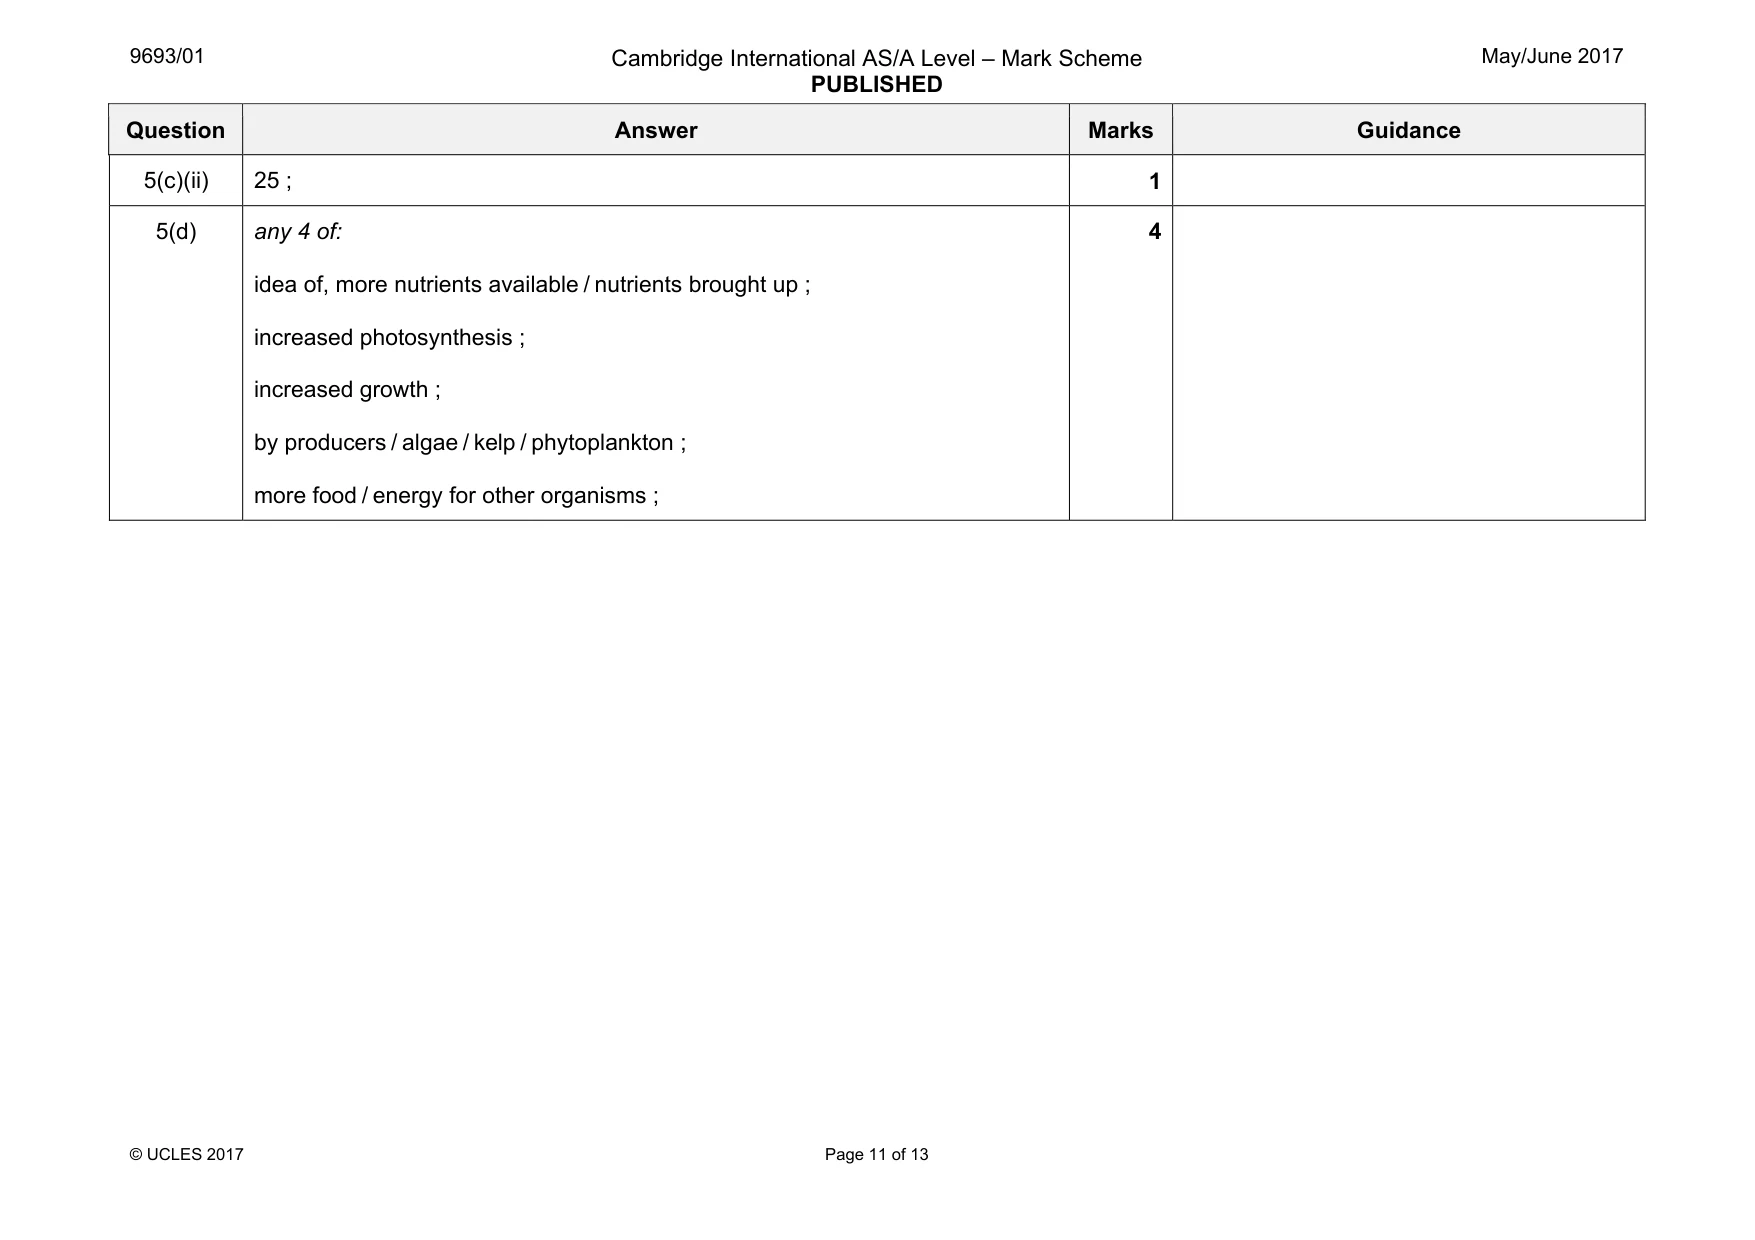
9693/01 Cambridge International AS/A Level – Mark Scheme PUBLISHED May/June 2017 © UCLES 2017 Page 11 of 13 Question Answer Marks Guidance 5(c)(ii) 25 ; 1 5(d) any 4 of: idea of, more nutrients available / nutrients brought up ; increased photosynthesis ; increased growth ; by producers / algae / kelp / phytoplankton ; more food / energy for other organisms ; 4
Mark scheme, page 12
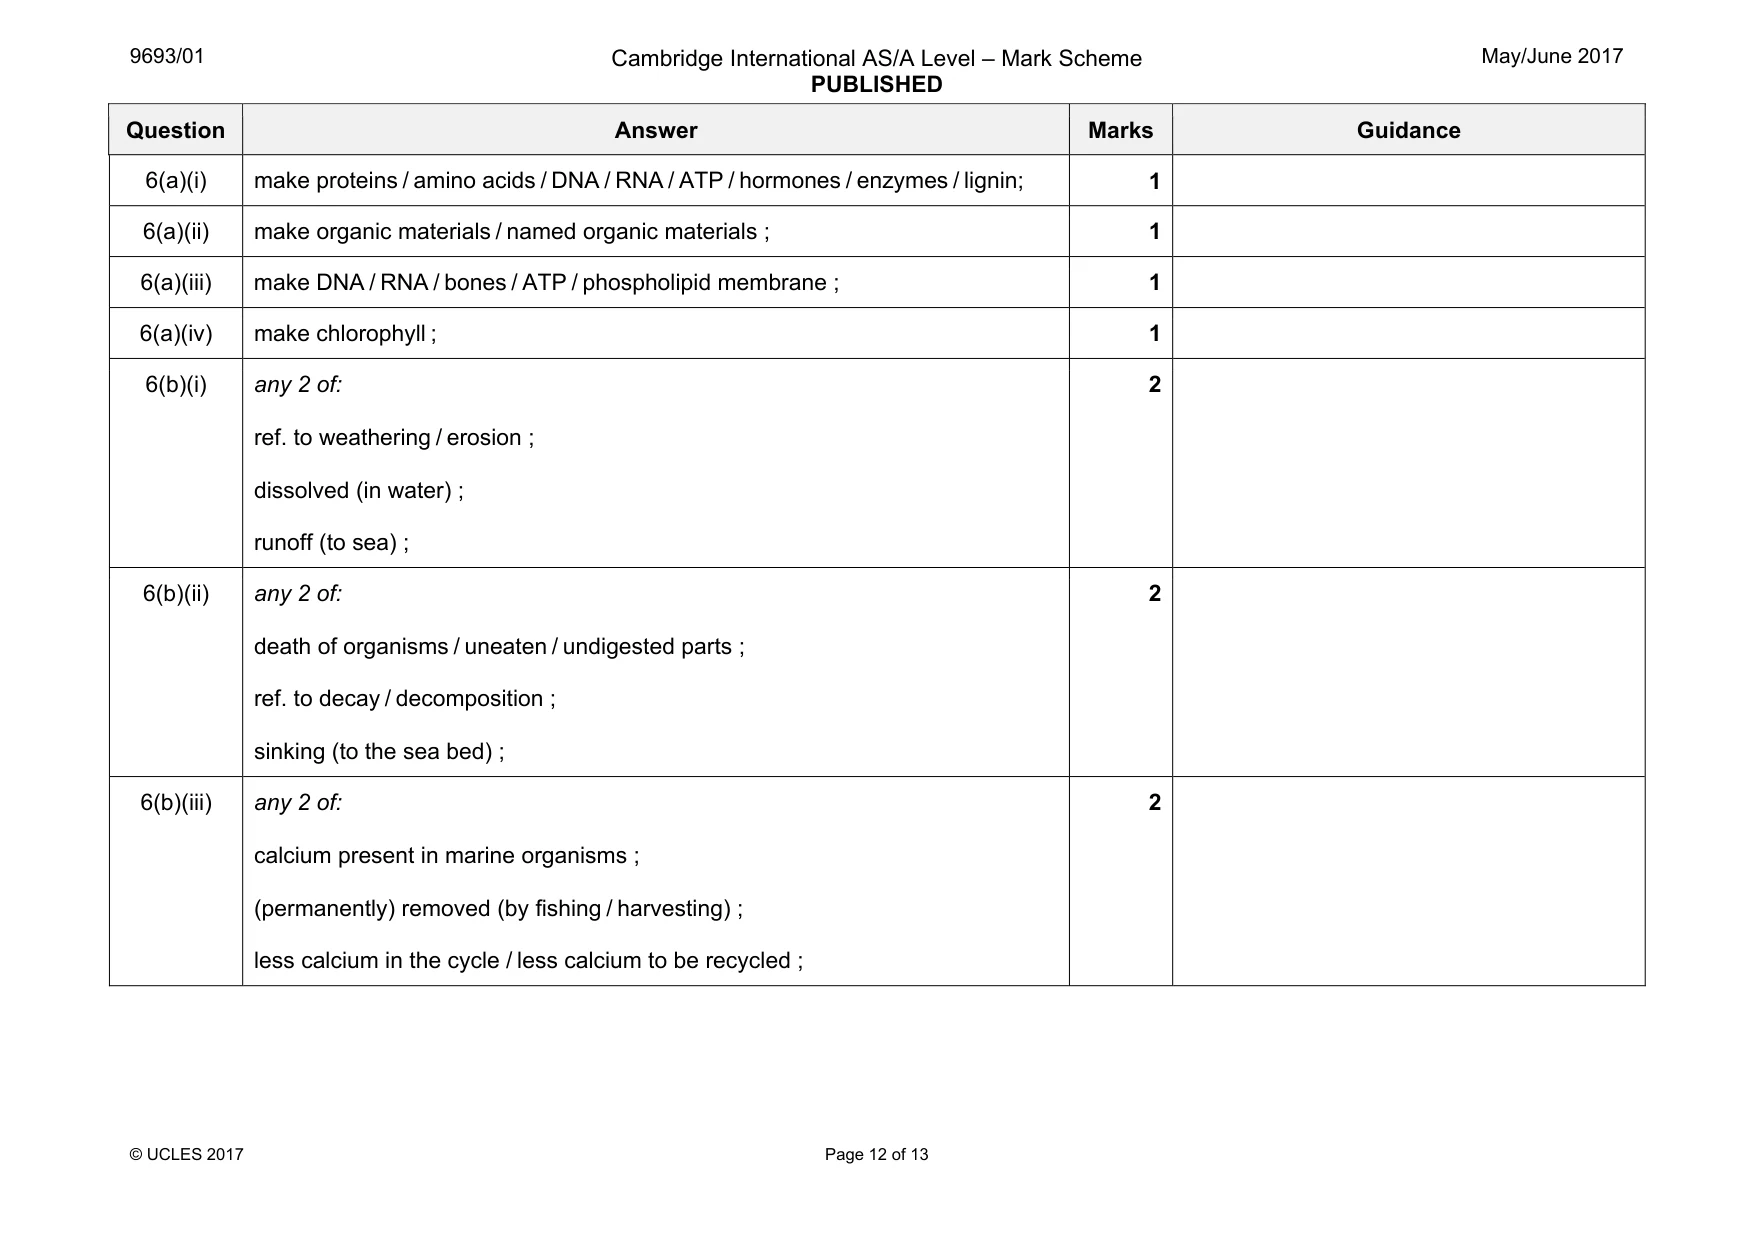
9693/01 Cambridge International AS/A Level – Mark Scheme PUBLISHED May/June 2017 © UCLES 2017 Page 12 of 13 Question Answer Marks Guidance 6(a)(i) make proteins / amino acids / DNA / RNA / ATP / hormones / enzymes / lignin; 1 6(a)(ii) make organic materials / named organic materials ; 1 6(a)(iii) make DNA / RNA / bones / ATP / phospholipid membrane ; 1 6(a)(iv) make chlorophyll ; 1 6(b)(i) any 2 of: ref. to weathering / erosion ; dissolved (in water) ; runoff (to sea) ; 2 6(b)(ii) any 2 of: death of organisms / uneaten / undigested parts ; ref. to decay / decomposition ; sinking (to the sea bed) ; 2 6(b)(iii) any 2 of: calcium present in marine organisms ; (permanently) removed (by fishing / harvesting) ; less calcium in the cycle / less calcium to be recycled ; 2
Mark scheme, page 13
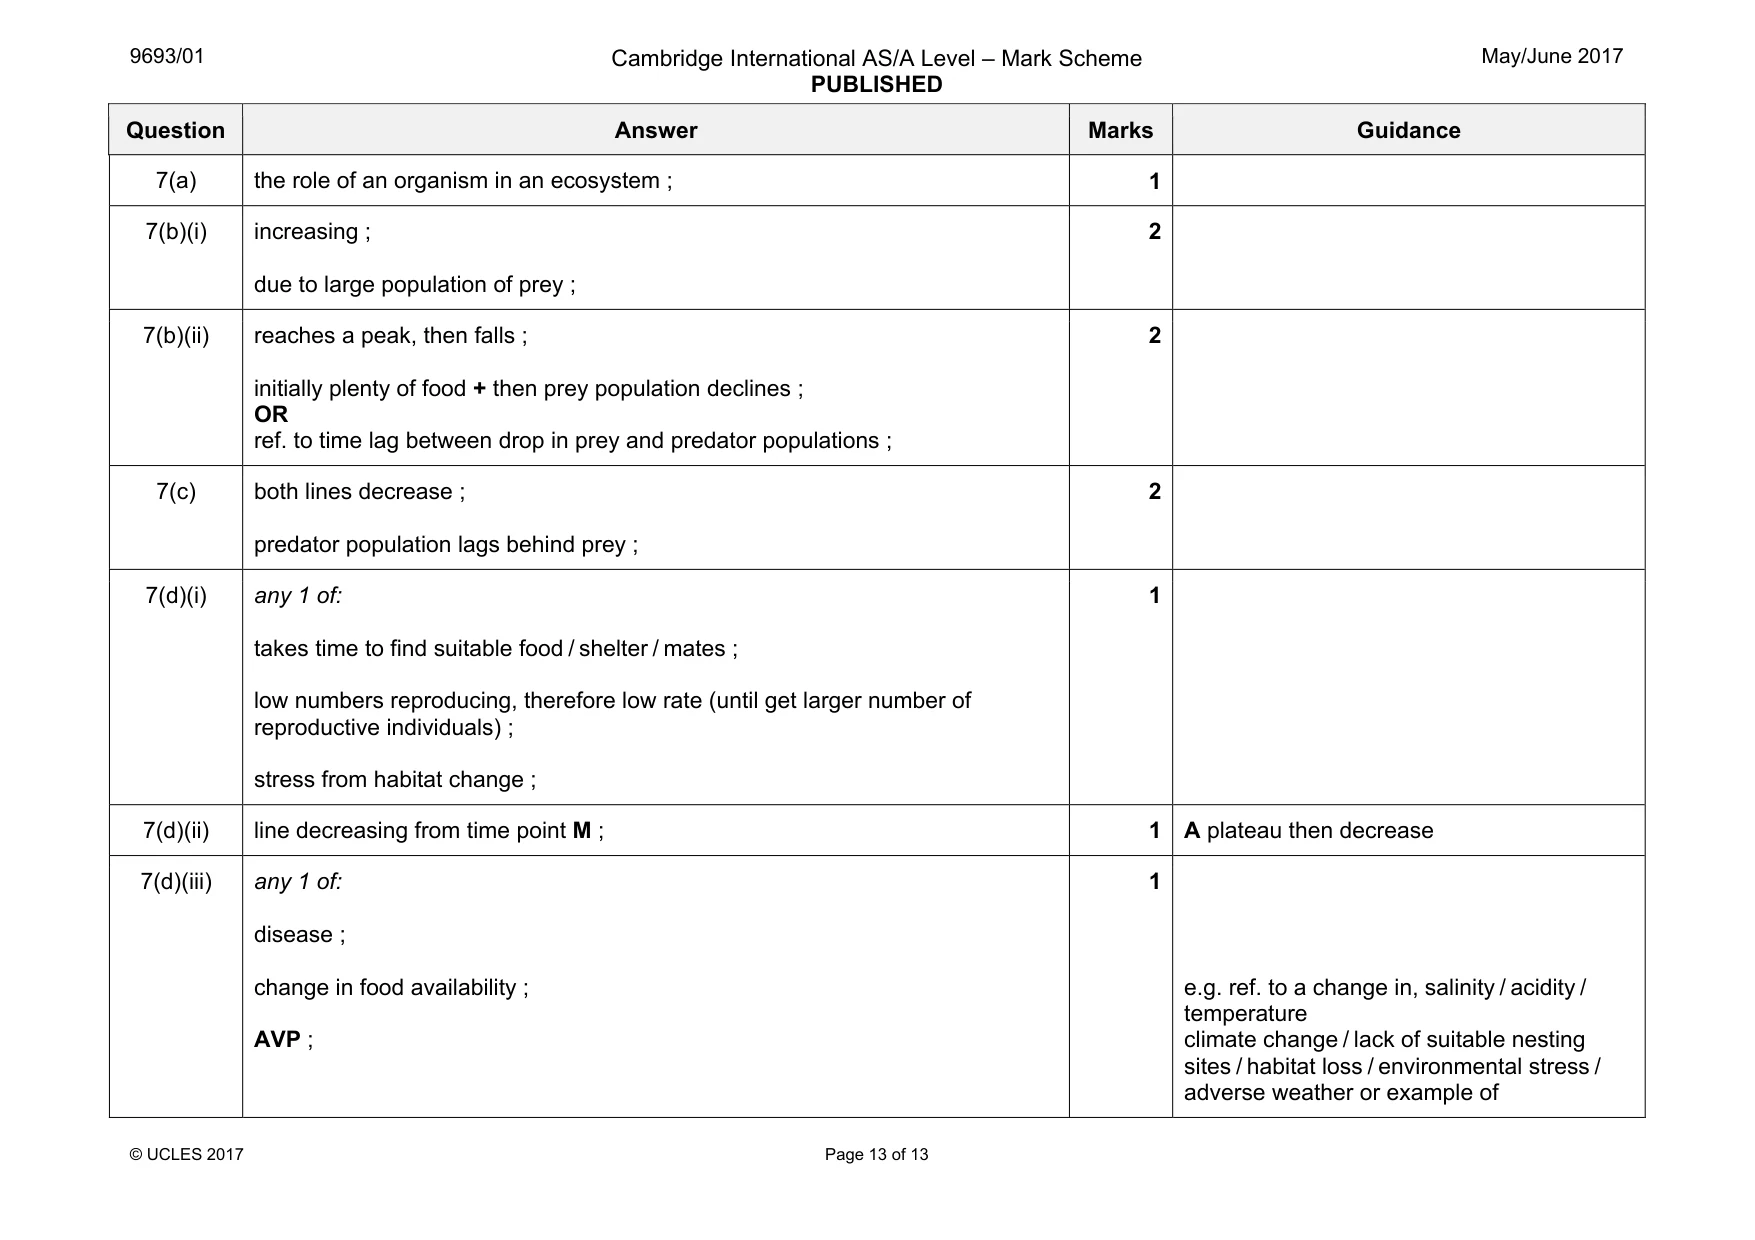
9693/01 Cambridge International AS/A Level – Mark Scheme PUBLISHED May/June 2017 © UCLES 2017 Page 13 of 13 Question Answer Marks Guidance 7(a) the role of an organism in an ecosystem ; 1 7(b)(i) increasing ; due to large population of prey ; 2 7(b)(ii) reaches a peak, then falls ; initially plenty of food + then prey population declines ; OR ref. to time lag between drop in prey and predator populations ; 2 7(c) both lines decrease ; predator population lags behind prey ; 2 7(d)(i) any 1 of: takes time to find suitable food / shelter / mates ; low numbers reproducing, therefore low rate (until get larger number of reproductive individuals) ; stress from habitat change ; 1 7(d)(ii) line decreasing from time point M ; 1 A plateau then decrease 7(d)(iii) any 1 of: disease ; change in food availability ; AVP ; 1 e.g. ref. to a change in, salinity / acidity / temperature climate change / lack of suitable nesting sites / habitat loss / environmental stress / adverse weather or example of
What you needed in this session
Cambridge’s own grade thresholds for 2017 May/June, Paper 1 · Variant 1. A higher threshold means an easier paper — the bar moves with how the cohort did.