Cambridge A Level Marine Science 9693 — 2014 Oct/Nov Paper 1 · Variant 1
9693/11/O/N/14 · 75 marks · ≈84 min
The question paper and its mark scheme, free to read here and free to download. This is Cambridge’s own paper, exactly as it was sat.
Question paper16 pages
Mark scheme9 pages
Answers below. Sit the paper first if you are practising.
Paper as text
Question paper, page 1
This document consists of 16 printed pages. DC (CW/SW) 84356/5 © UCLES 2014 [Turn over Cambridge International Examinations Cambridge International Advanced Subsidiary and Advanced Level * 0 8 9 5 9 6 8 7 0 8 * MARINE SCIENCE 9693/01 Paper 1 AS Structured Questions October/November 2014 1 hour 30 minutes Candidates answer on the Question Paper. No Additional Materials are required. READ THESE INSTRUCTIONS FIRST Write your Centre number, candidate number and name on all the work you hand in. Write in dark blue or black pen. You may use an HB pencil for any diagrams or graphs. Do not use staples, paper clips, glue or correction fluid. DO NOT WRITE IN ANY BARCODES. Answer all questions. At the end of the examination, fasten all your work securely together. The number of marks is given in brackets [ ] at the end of each question or part question. Electronic calculators may be used. You may lose marks if you do not show your working or if you do not use appropriate units.
Question paper, page 2
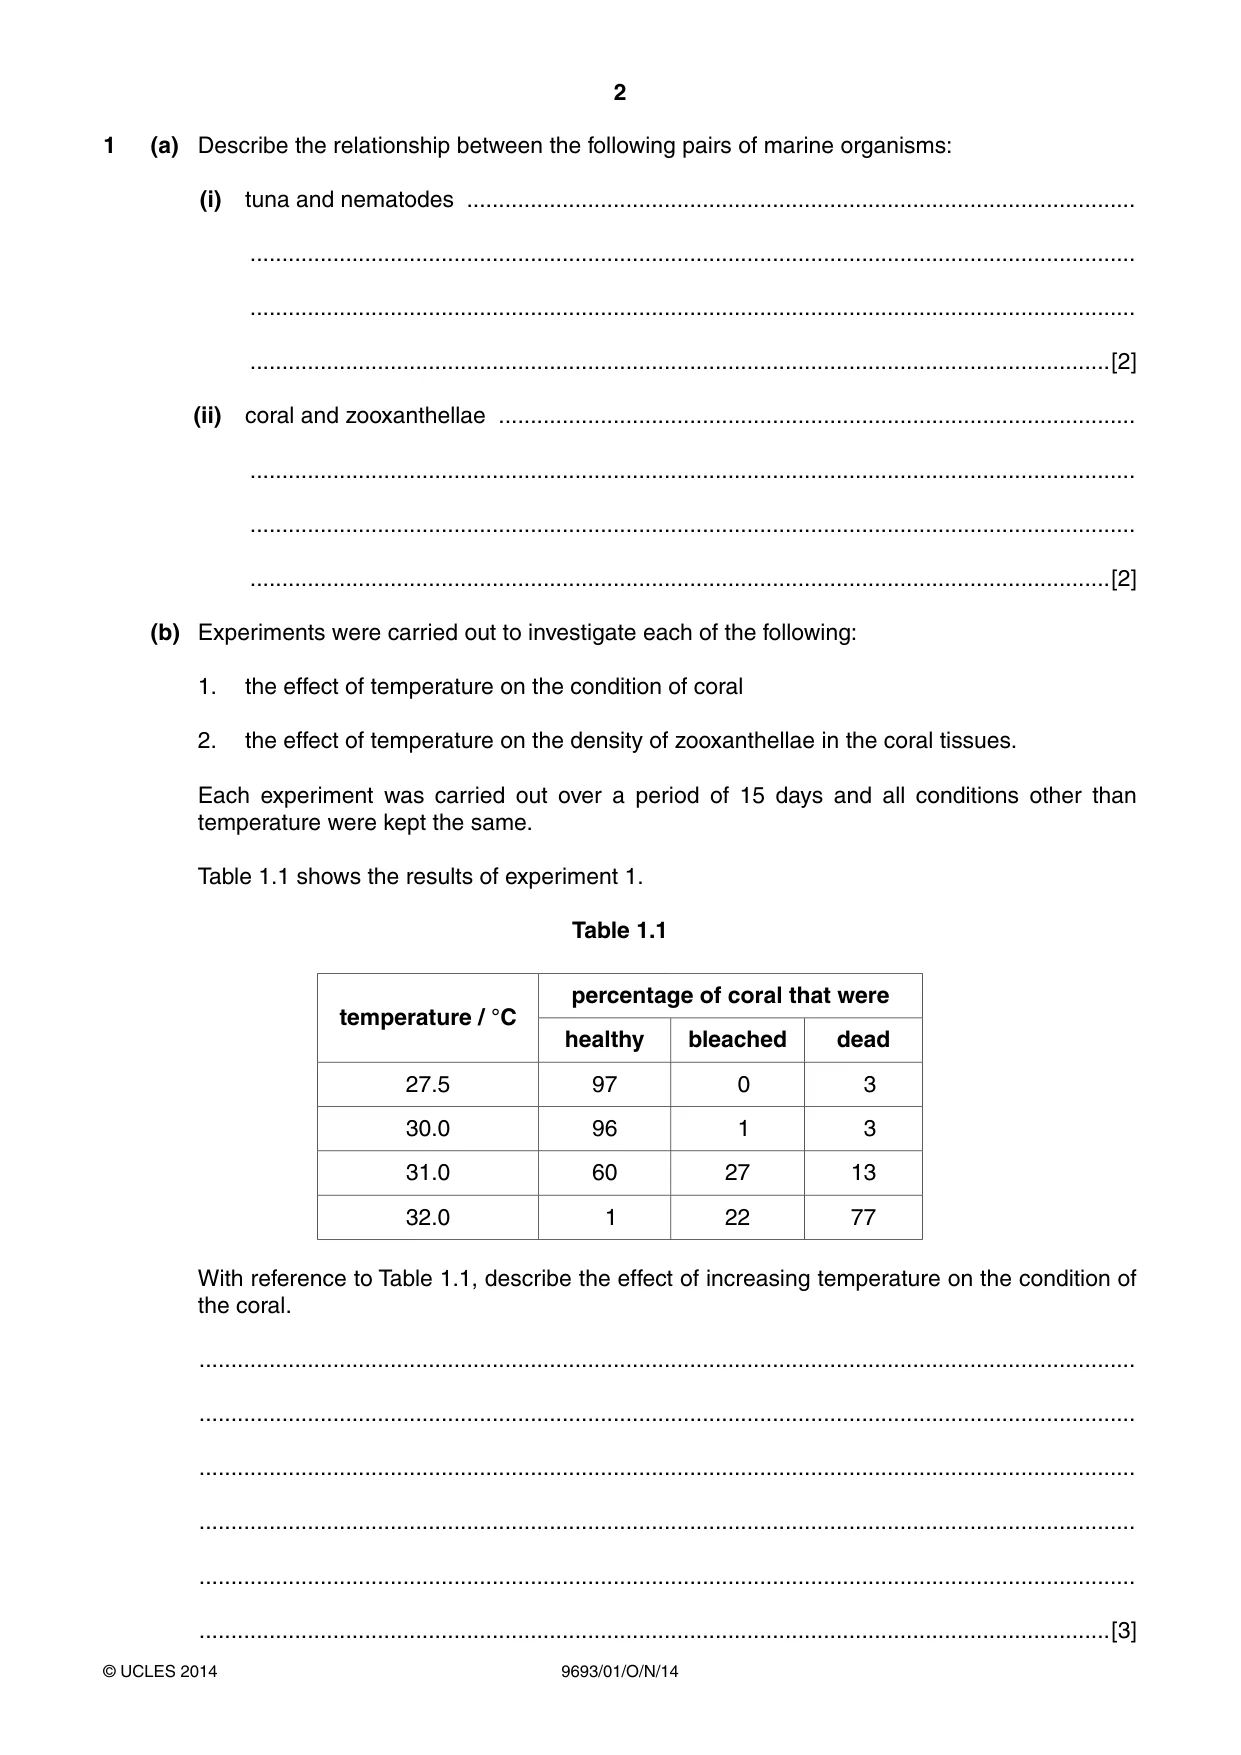
2 9693/01/O/N/14 © UCLES 2014 1 (a) Describe the relationship between the following pairs of marine organisms: (i) tuna and nematodes … … … …[2] (ii) coral and zooxanthellae … … … …[2] (b) Experiments were carried out to investigate each of the following: 1. the effect of temperature on the condition of coral 2. the effect of temperature on the density of zooxanthellae in the coral tissues. Each experiment was carried out over a period of 15 days and all conditions other than temperature were kept the same. Table 1.1 shows the results of experiment 1. Table 1.1 temperature / °C percentage of coral that were healthy bleached dead 27.5 97 0 3 30.0 96 1 3 31.0 60 27 13 32.0 1 22 77 With reference to Table 1.1, describe the effect of increasing temperature on the condition of the coral. … … … … … …[3]
Question paper, page 3
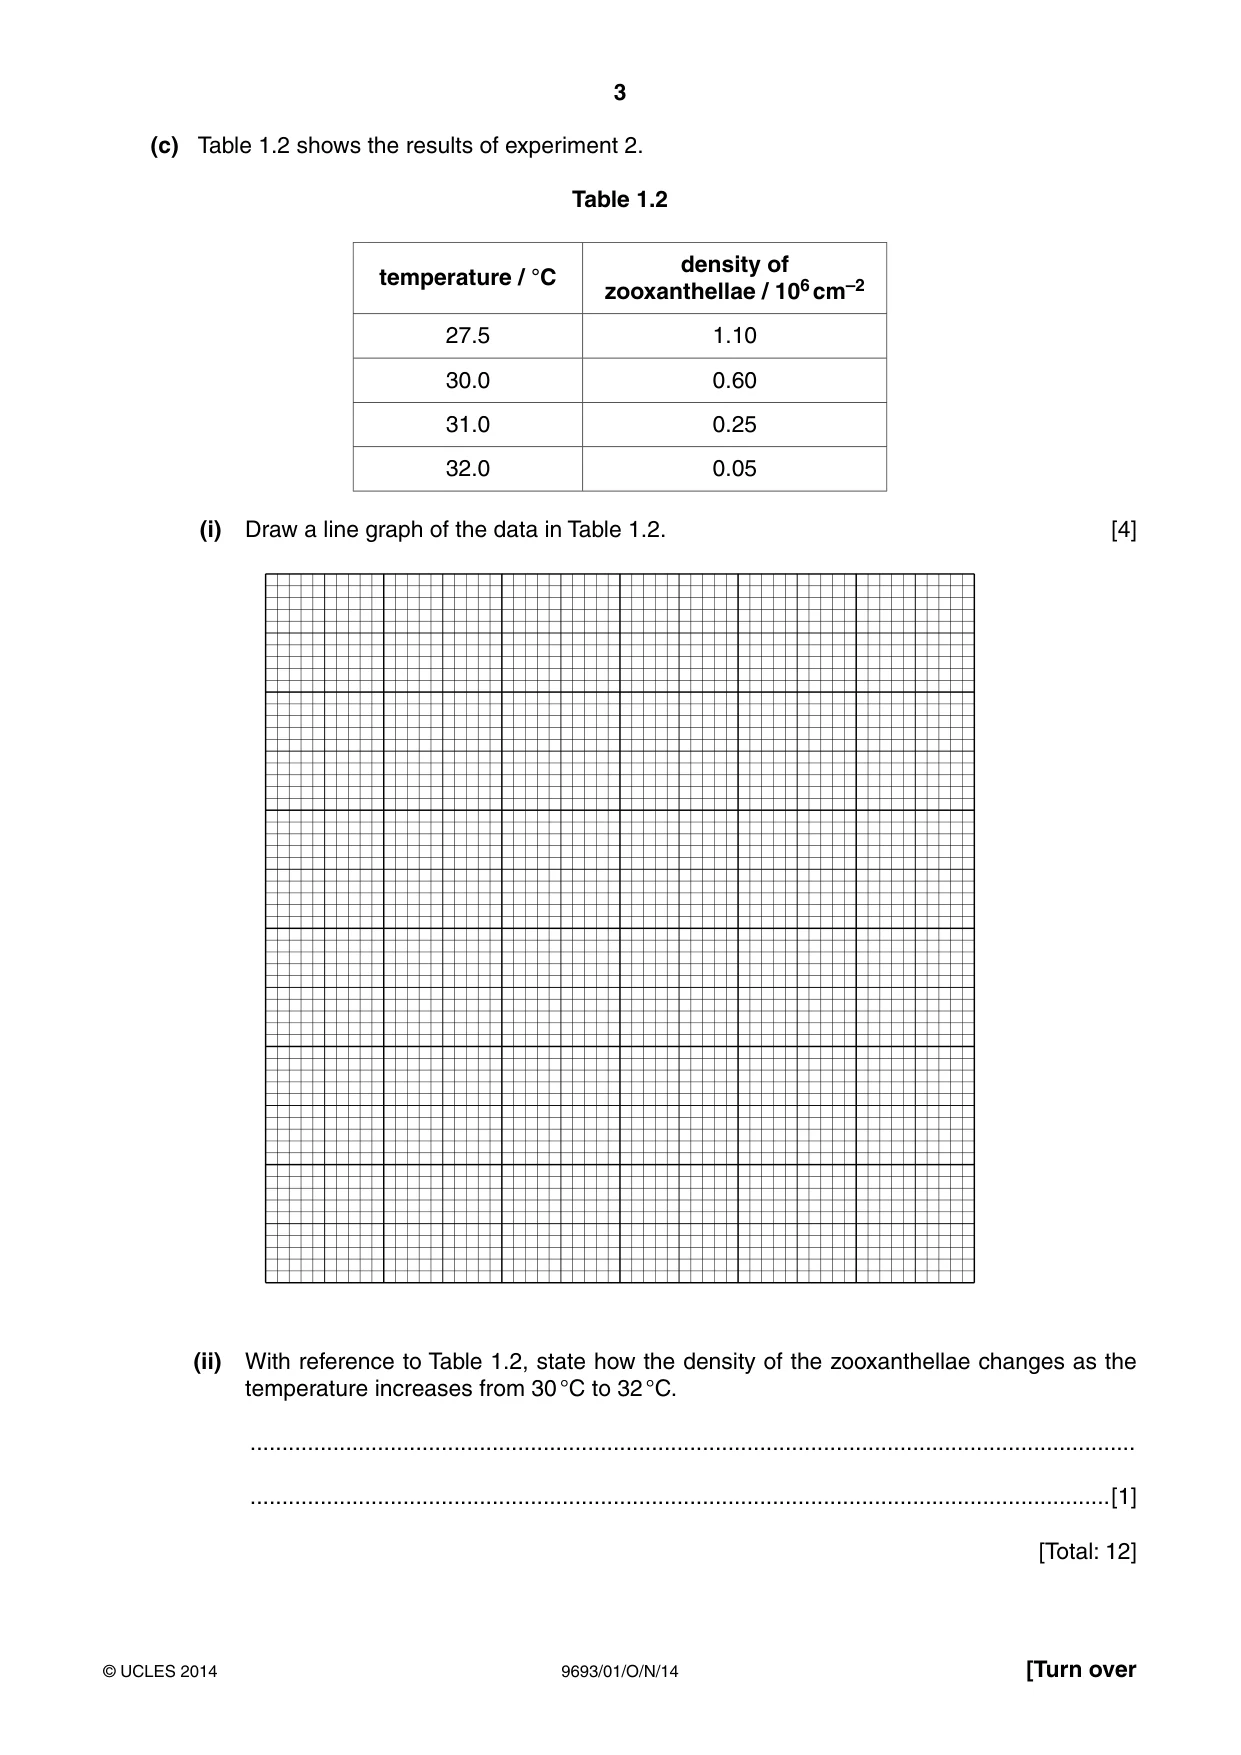
3 9693/01/O/N/14 © UCLES 2014 [Turn over (c) Table 1.2 shows the results of experiment 2. Table 1.2 temperature / °C density of zooxanthellae / 106 cm–2 27.5 1.10 30.0 0.60 31.0 0.25 32.0 0.05 (i) Draw a line graph of the data in Table 1.2. [4] (ii) With reference to Table 1.2, state how the density of the zooxanthellae changes as the temperature increases from 30 °C to 32 °C. … …[1] [Total: 12]
Question paper, page 4
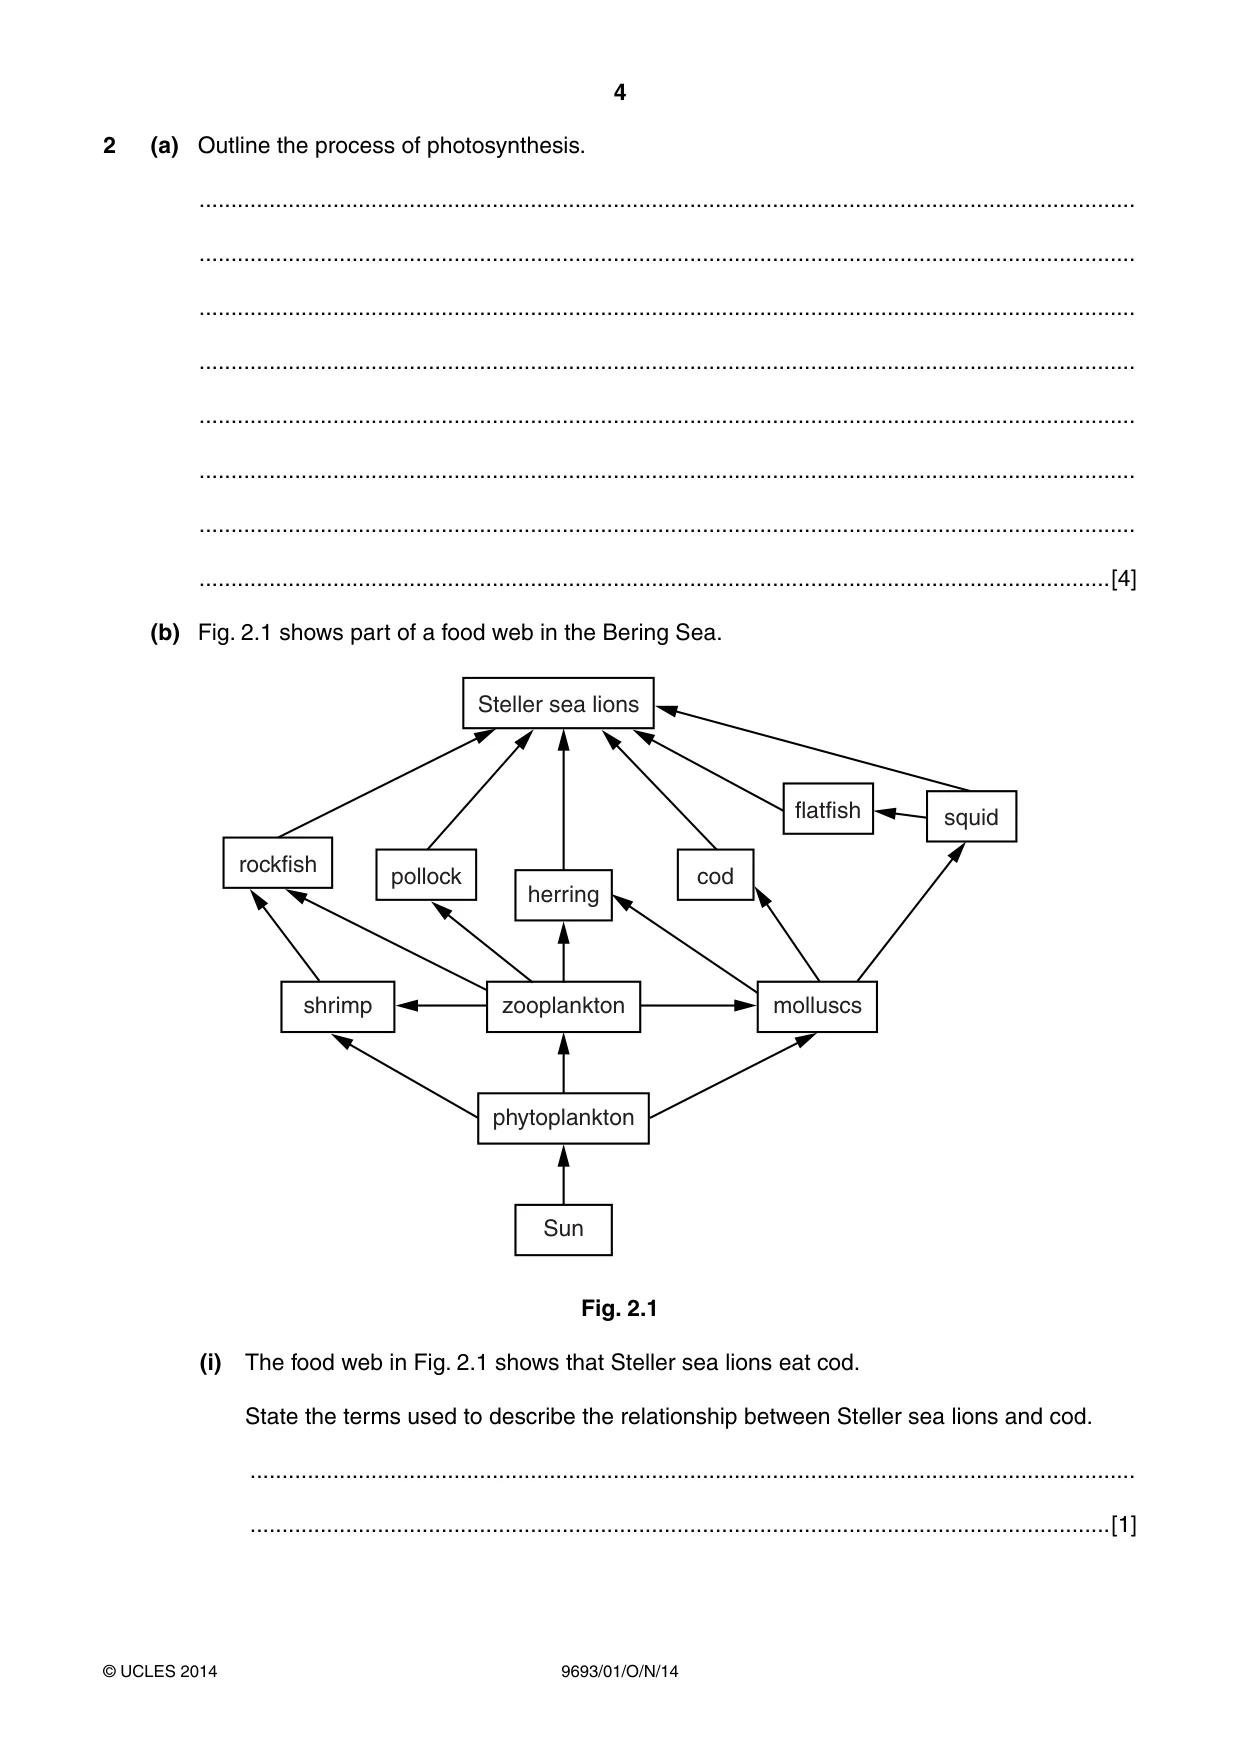
4 9693/01/O/N/14 © UCLES 2014 2 (a) Outline the process of photosynthesis. … … … … … … … …[4] (b) Fig. 2.1 shows part of a food web in the Bering Sea. Steller sea lions rockfish pollock cod flatfish squid herring zooplankton shrimp molluscs phytoplankton Sun Fig. 2.1 (i) The food web in Fig. 2.1 shows that Steller sea lions eat cod. State the terms used to describe the relationship between Steller sea lions and cod. … …[1]
Question paper, page 5
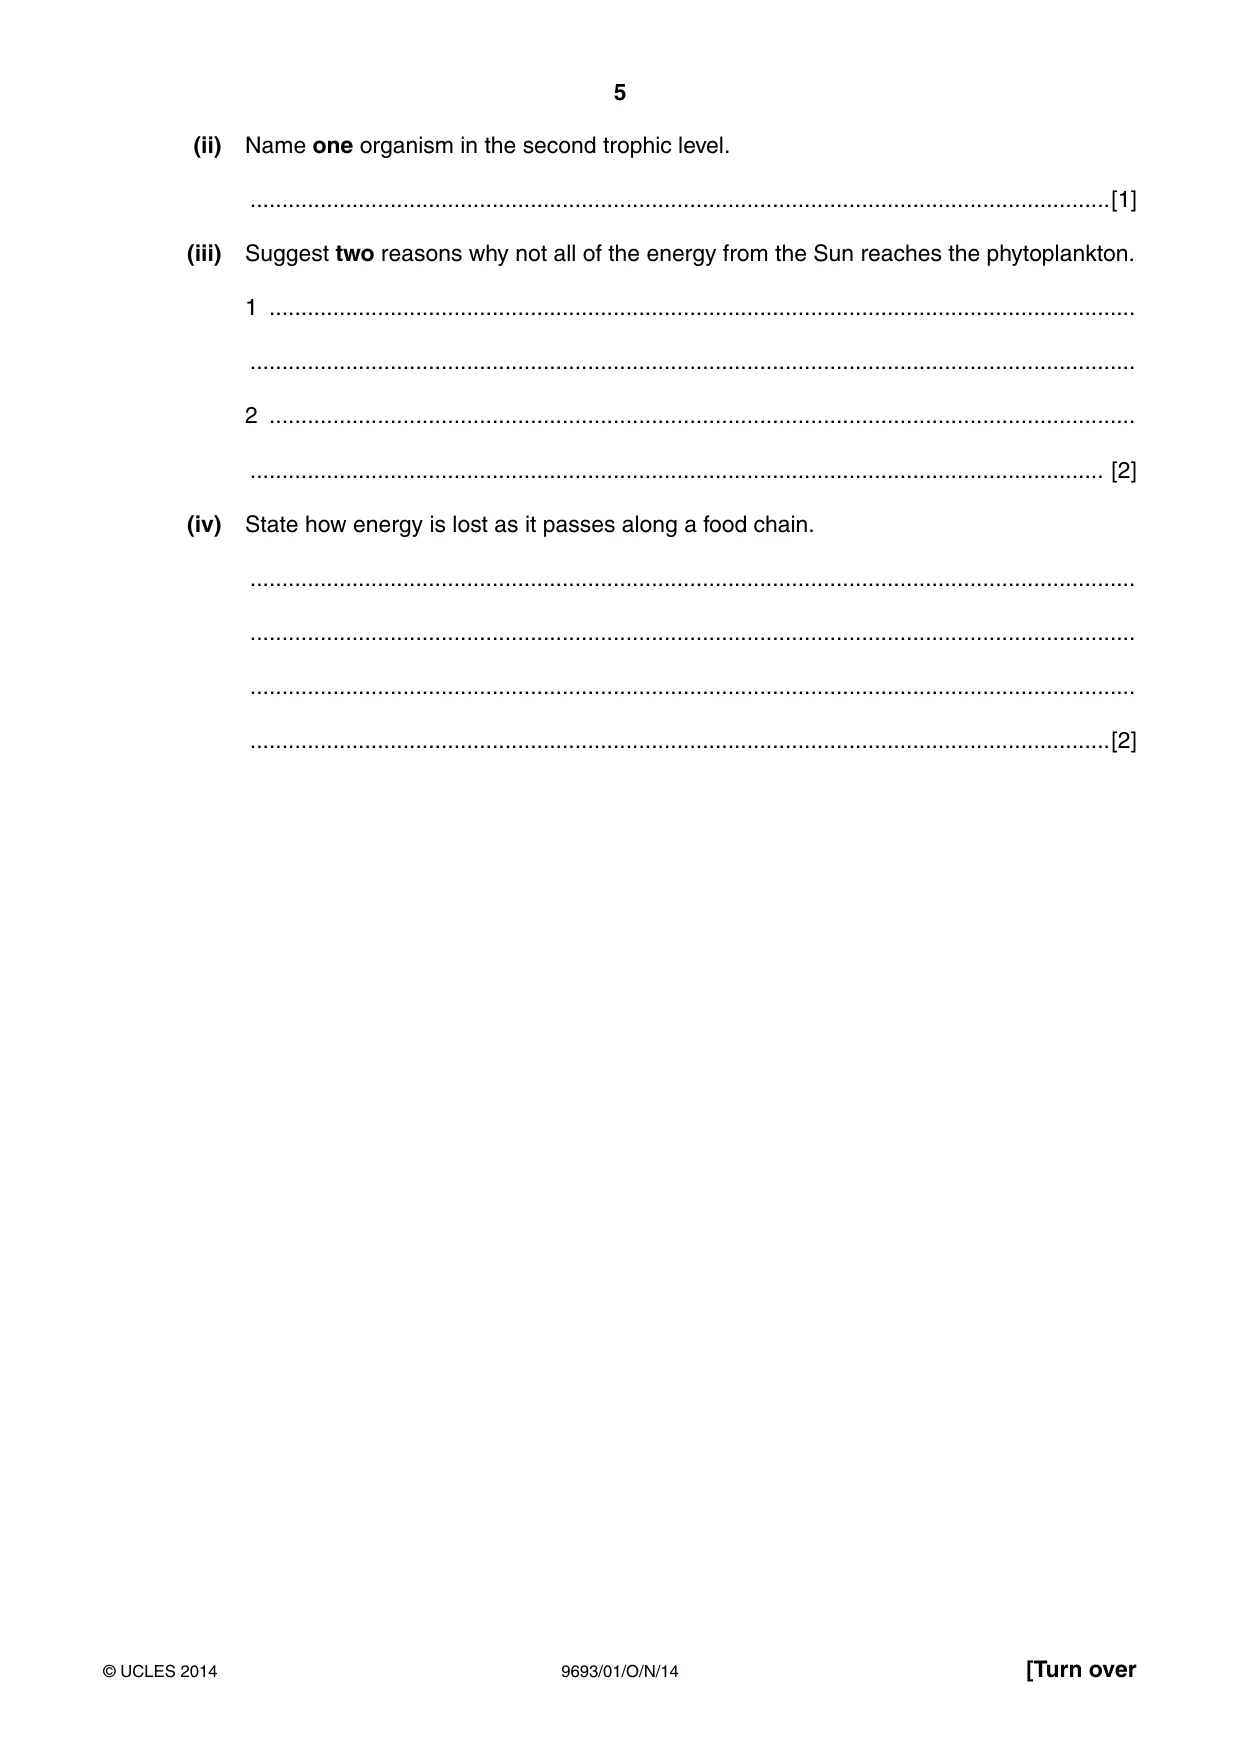
5 9693/01/O/N/14 © UCLES 2014 [Turn over (ii) Name one organism in the second trophic level. …[1] (iii) Suggest two reasons why not all of the energy from the Sun reaches the phytoplankton. 1 … … 2 … … [2] (iv) State how energy is lost as it passes along a food chain. … … … …[2]
Question paper, page 6
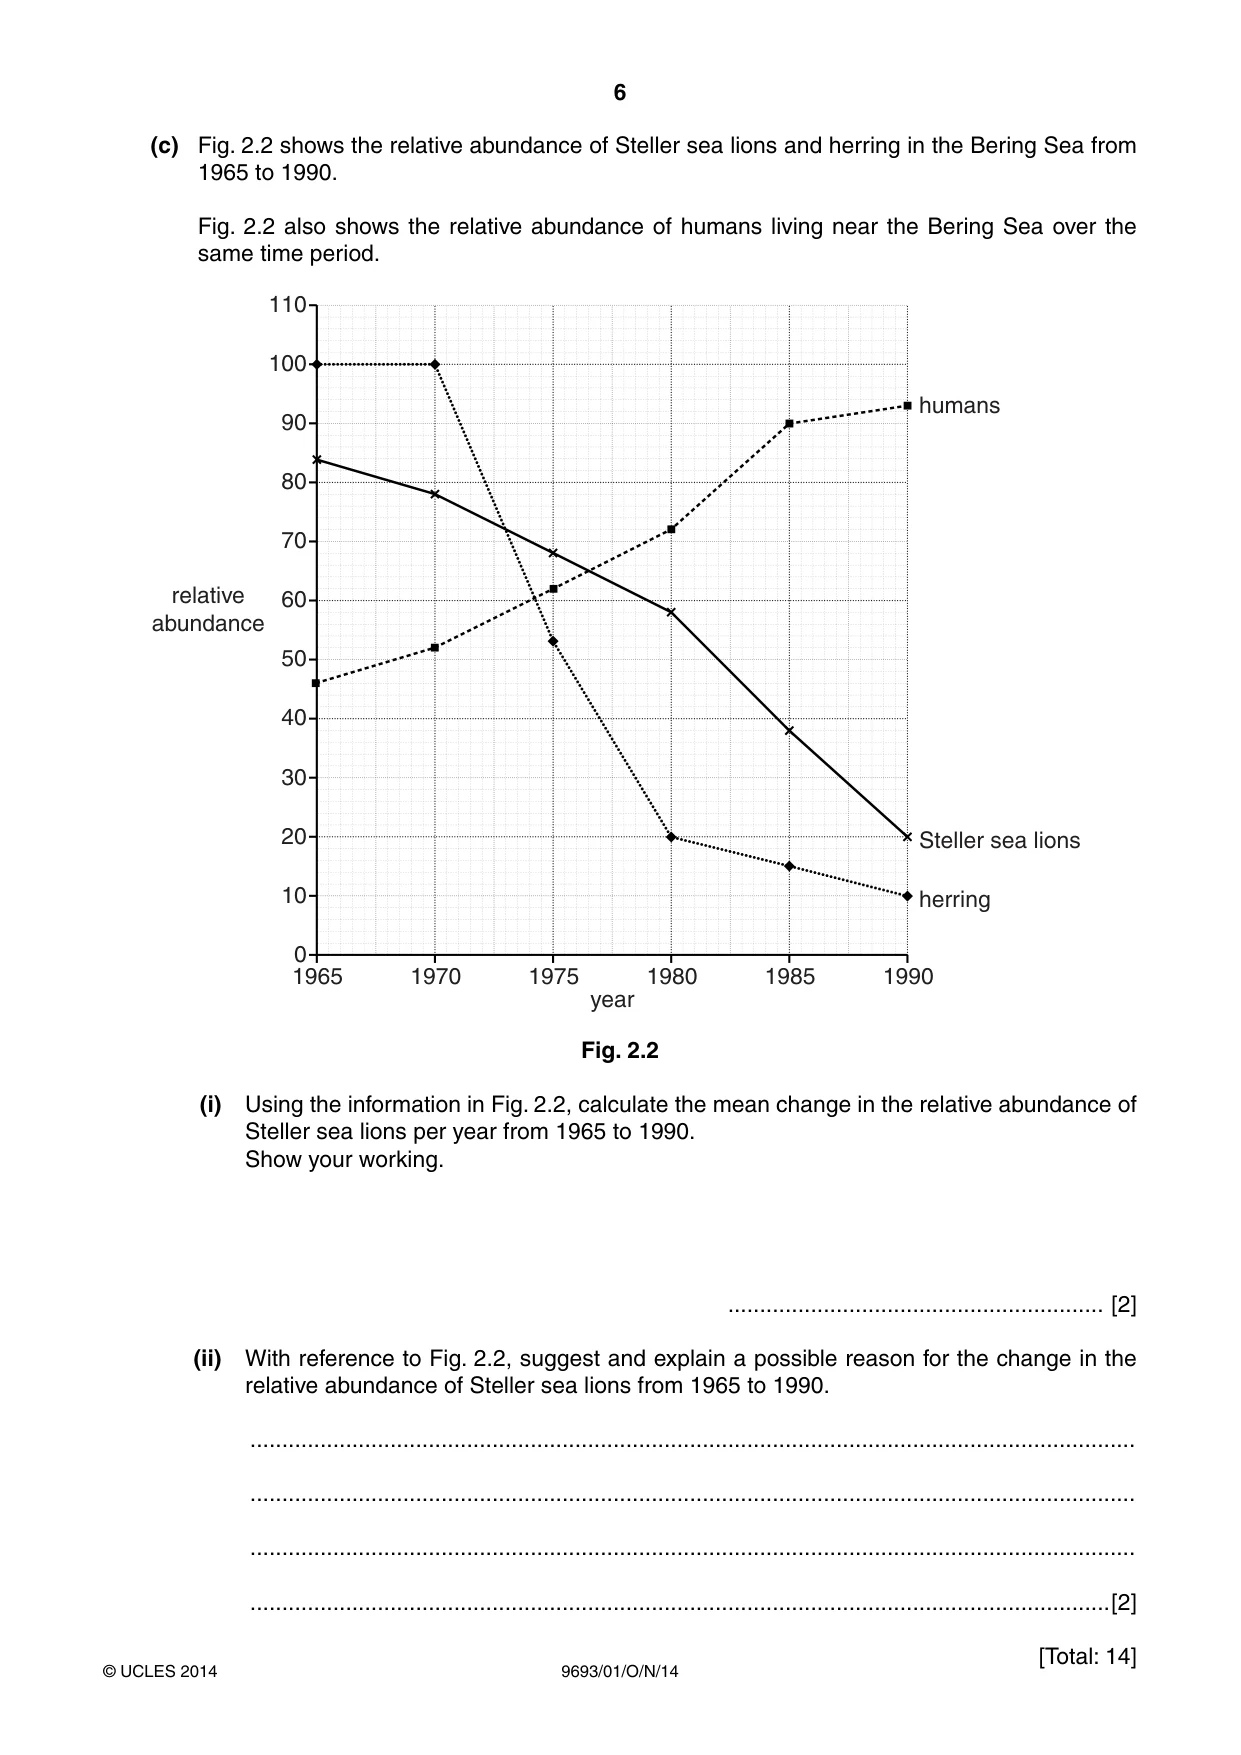
6 9693/01/O/N/14 © UCLES 2014 (c) Fig. 2.2 shows the relative abundance of Steller sea lions and herring in the Bering Sea from 1965 to 1990. Fig. 2.2 also shows the relative abundance of humans living near the Bering Sea over the same time period. 1965 0 10 20 30 40 50 60 70 80 90 100 110 1970 1975 1980 1985 1990 year relative abundance humans Steller sea lions herring Fig. 2.2 (i) Using the information in Fig. 2.2, calculate the mean change in the relative abundance of Steller sea lions per year from 1965 to 1990. Show your working. … [2] (ii) With reference to Fig. 2.2, suggest and explain a possible reason for the change in the relative abundance of Steller sea lions from 1965 to 1990. … … … …[2] [Total: 14]
Question paper, page 7
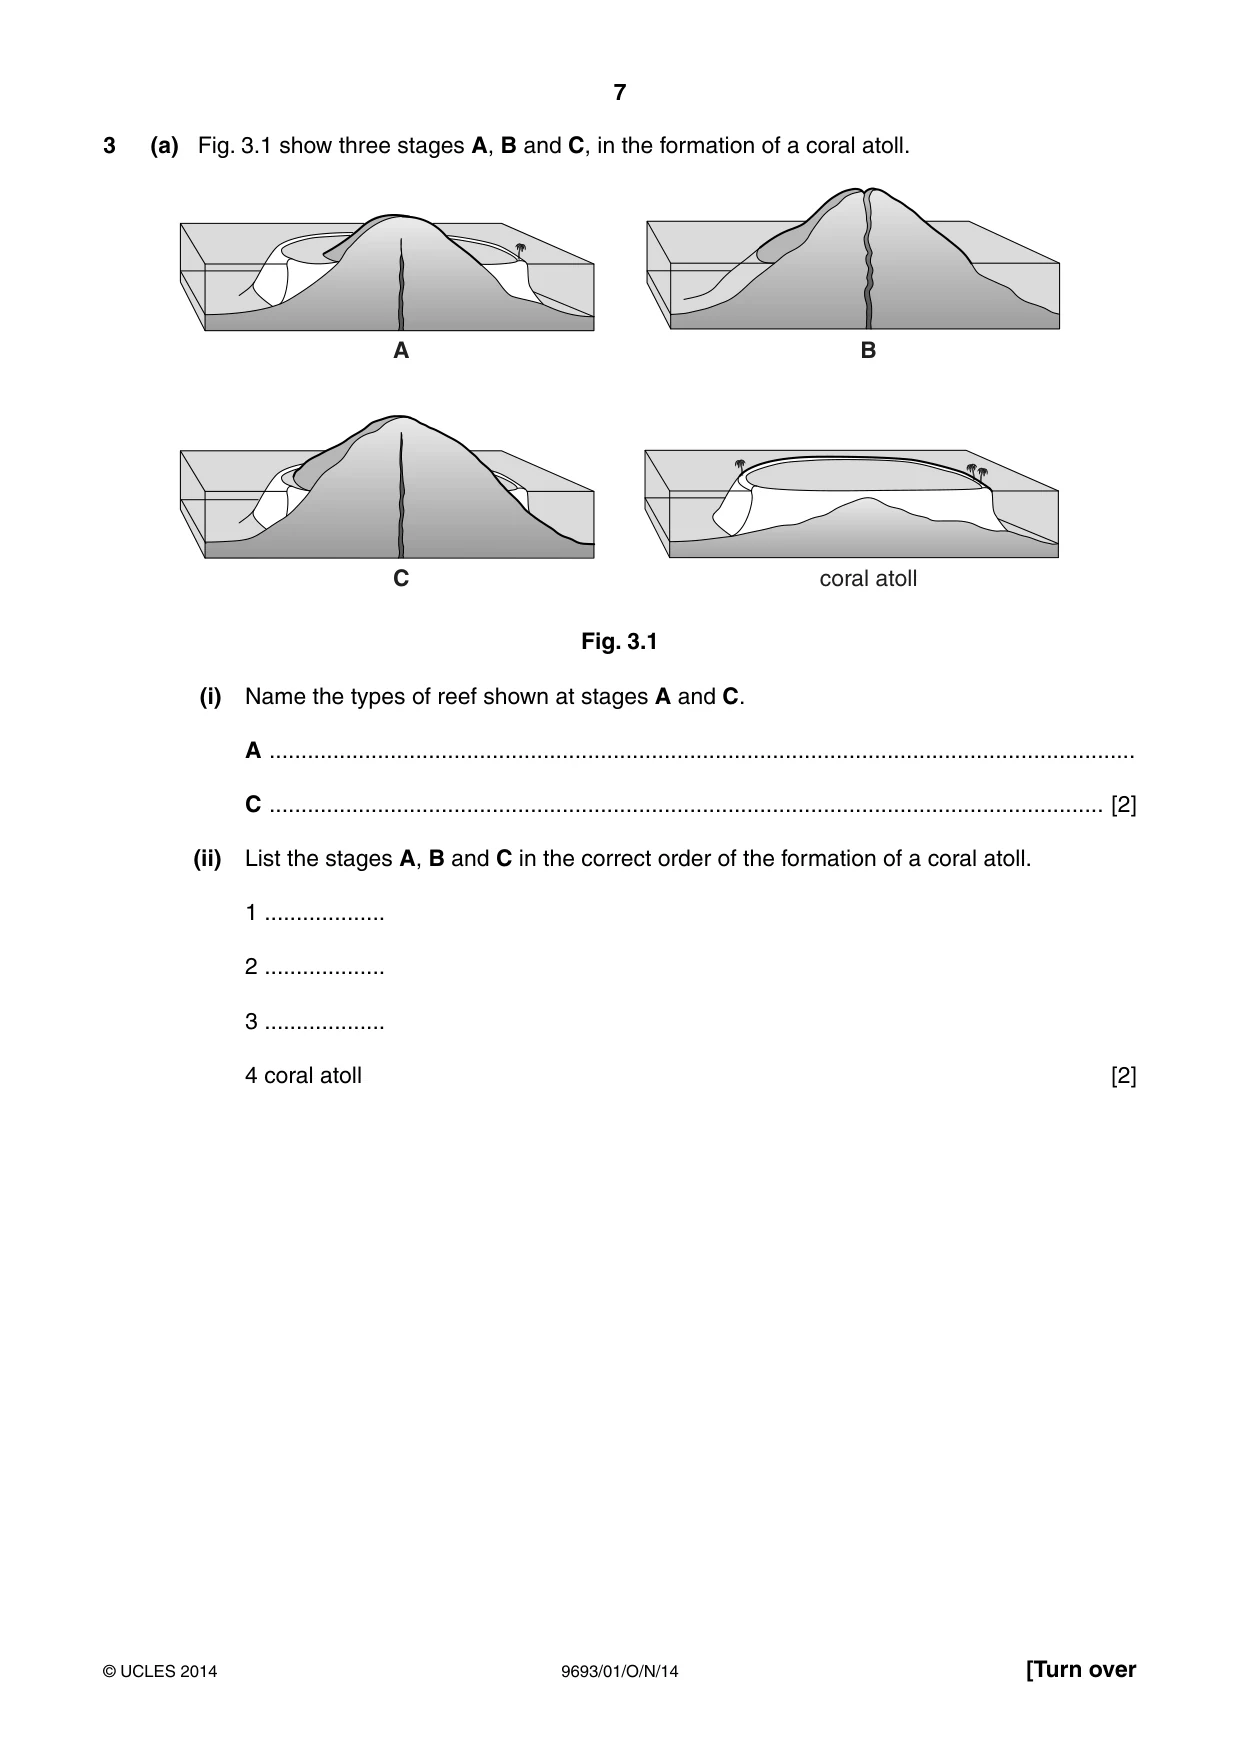
7 9693/01/O/N/14 © UCLES 2014 [Turn over 3 (a) Fig. 3.1 show three stages A, B and C, in the formation of a coral atoll. A B C coral atoll Fig. 3.1 (i) Name the types of reef shown at stages A and C. A … C … [2] (ii) List the stages A, B and C in the correct order of the formation of a coral atoll. 1 … 2 … 3 … 4 coral atoll [2]
Question paper, page 8
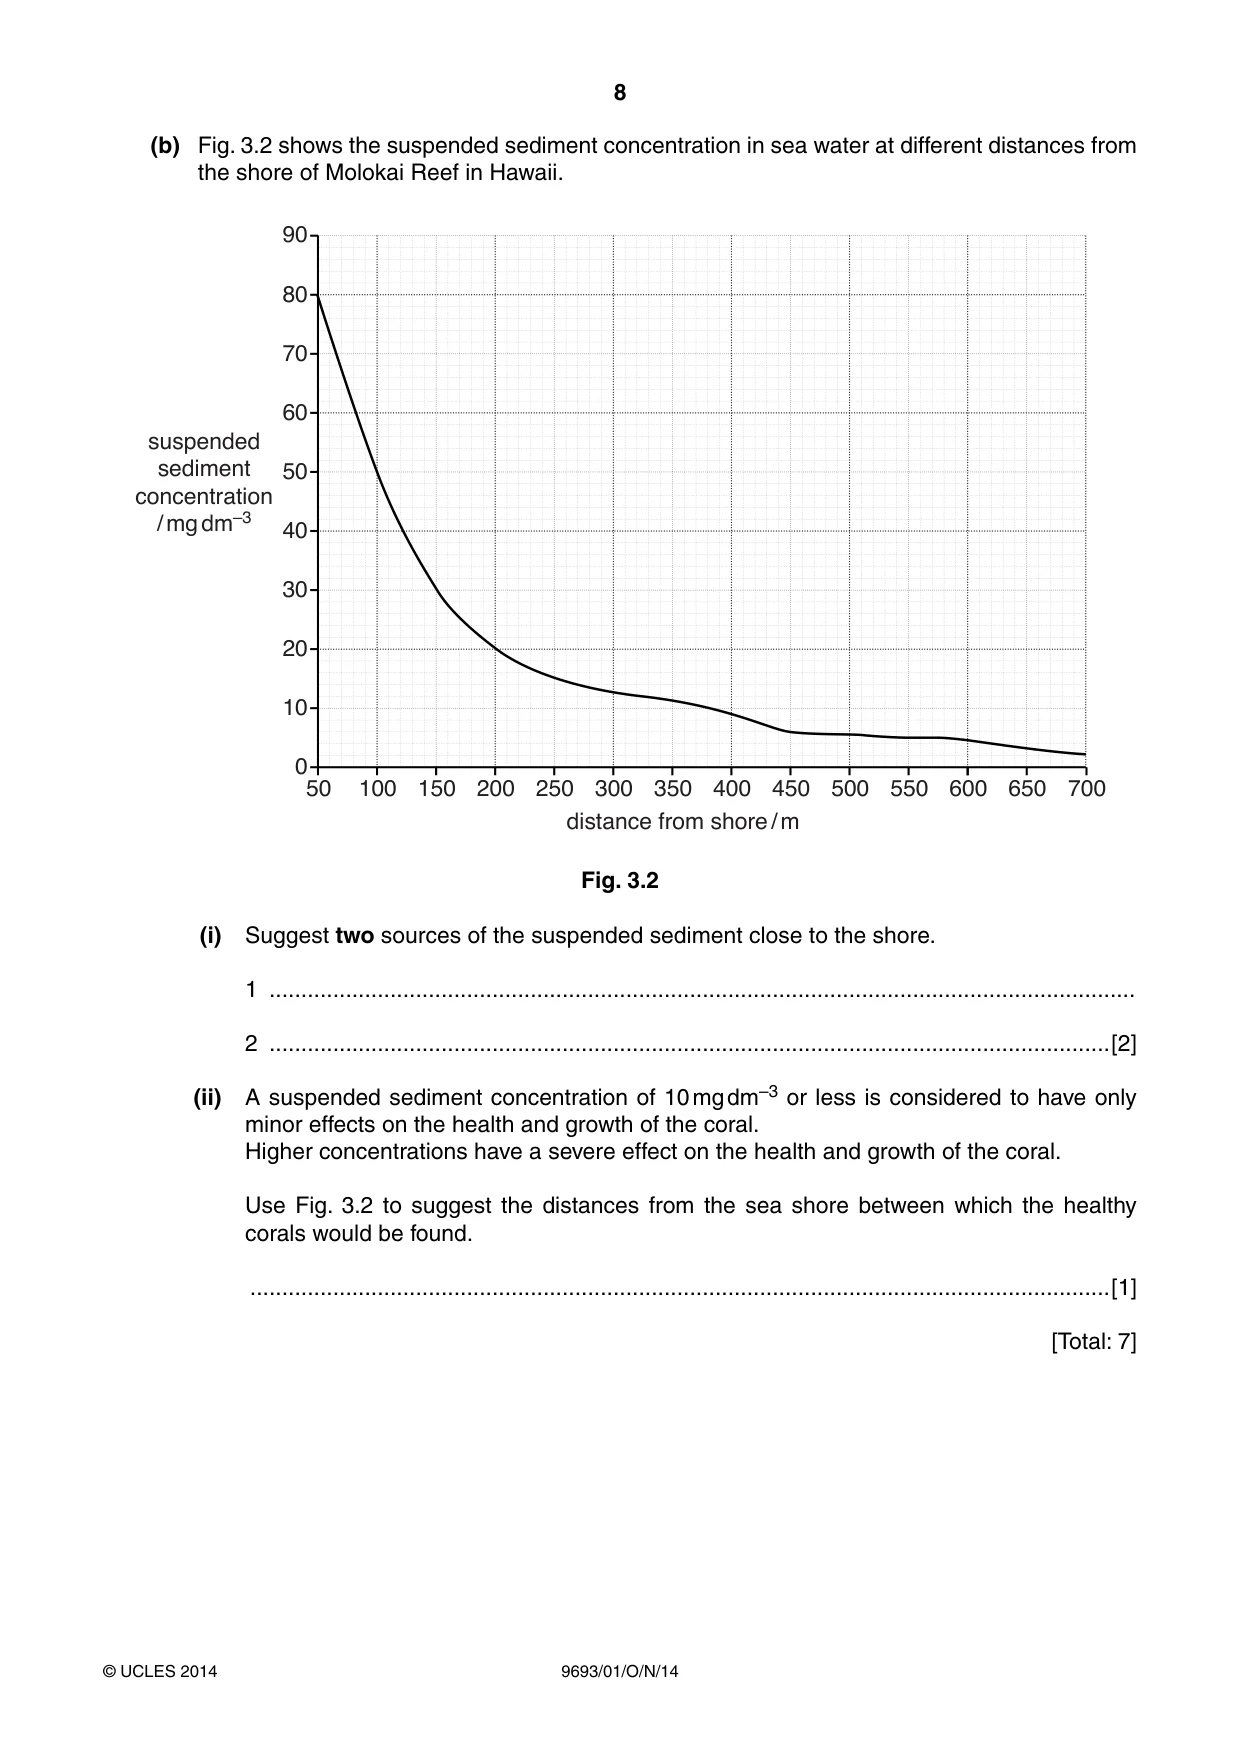
8 9693/01/O/N/14 © UCLES 2014 (b) Fig. 3.2 shows the suspended sediment concentration in sea water at different distances from the shore of Molokai Reef in Hawaii. 50 0 10 20 30 40 50 60 70 80 90 150 250 350 450 550 100 200 300 400 500 600 650 700 distance from shore / m suspended sediment concentration / mg dm–3 Fig. 3.2 (i) Suggest two sources of the suspended sediment close to the shore. 1 … 2 …[2] (ii) A suspended sediment concentration of 10 mg dm–3 or less is considered to have only minor effects on the health and growth of the coral. Higher concentrations have a severe effect on the health and growth of the coral. Use Fig. 3.2 to suggest the distances from the sea shore between which the healthy corals would be found. …[1] [Total: 7]
Question paper, page 9
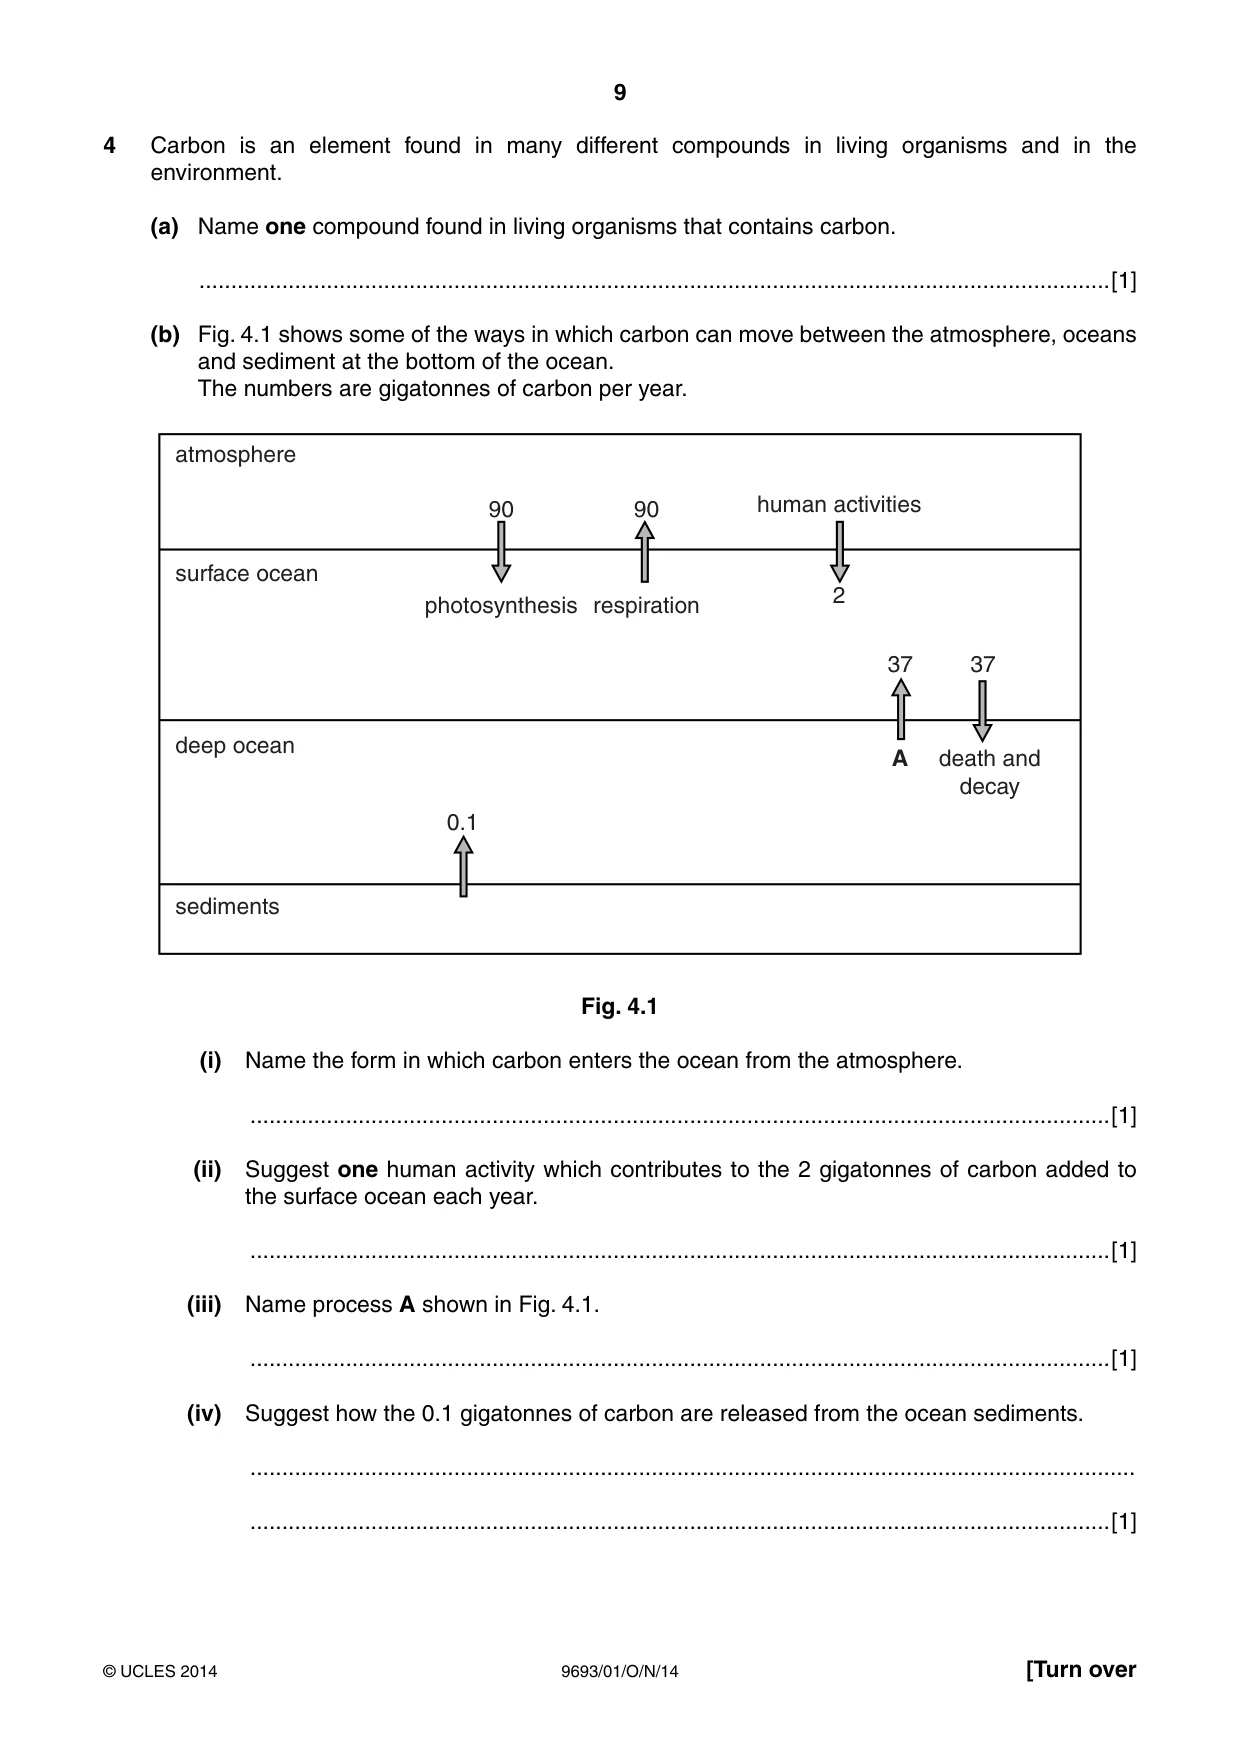
9 9693/01/O/N/14 © UCLES 2014 [Turn over 4 Carbon is an element found in many different compounds in living organisms and in the environment. (a) Name one compound found in living organisms that contains carbon. …[1] (b) Fig. 4.1 shows some of the ways in which carbon can move between the atmosphere, oceans and sediment at the bottom of the ocean. The numbers are gigatonnes of carbon per year. atmosphere surface ocean photosynthesis 90 respiration human activities 2 90 37 0.1 37 A death and decay deep ocean sediments Fig. 4.1 (i) Name the form in which carbon enters the ocean from the atmosphere. …[1] (ii) Suggest one human activity which contributes to the 2 gigatonnes of carbon added to the surface ocean each year. …[1] (iii) Name process A shown in Fig. 4.1. …[1] (iv) Suggest how the 0.1 gigatonnes of carbon are released from the ocean sediments. … …[1]
Question paper, page 10
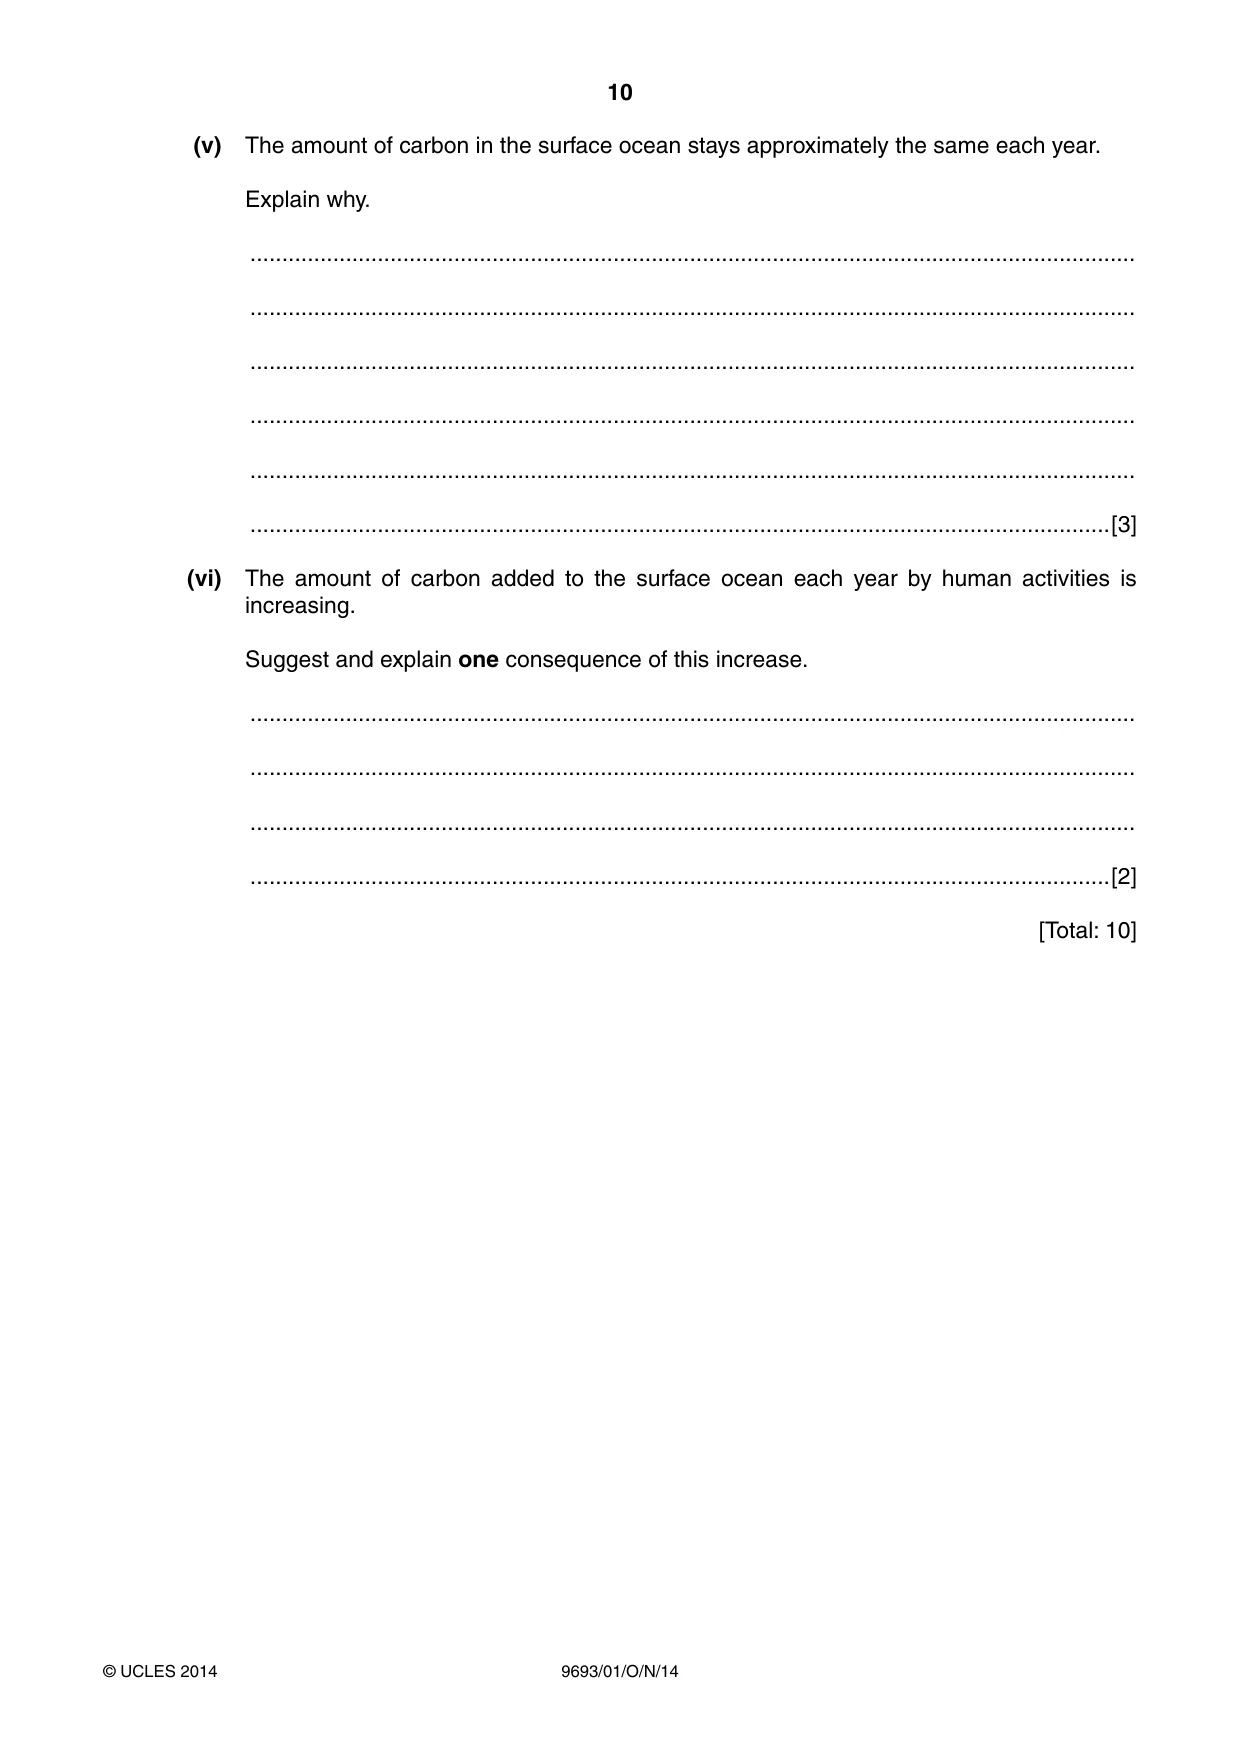
10 9693/01/O/N/14 © UCLES 2014 (v) The amount of carbon in the surface ocean stays approximately the same each year. Explain why. … … … … … …[3] (vi) The amount of carbon added to the surface ocean each year by human activities is increasing. Suggest and explain one consequence of this increase. … … … …[2] [Total: 10]
Question paper, page 11
11 9693/01/O/N/14 © UCLES 2014 [Turn over 5 (a) Outline the theory of plate tectonics. … … … … … … … … …[4] (b) State three pieces of evidence for the theory of plate tectonics. 1 … … … 2 … … … 3 … … …[3]
Question paper, page 12
12 9693/01/O/N/14 © UCLES 2014 (c) Explain how tectonic processes can result in the formation of each of the following: (i) underwater volcanoes … … … … … … … …[3] (ii) underwater earthquakes … … … … … … … …[3] [Total: 13]
Question paper, page 13
13 9693/01/O/N/14 © UCLES 2014 [Turn over 6 (a) Outline the effects of evaporation and precipitation on the salinity of sea water. … … … …[2] (b) Describe how salinity gradients form in water columns. … … … … … …[3]
Question paper, page 14
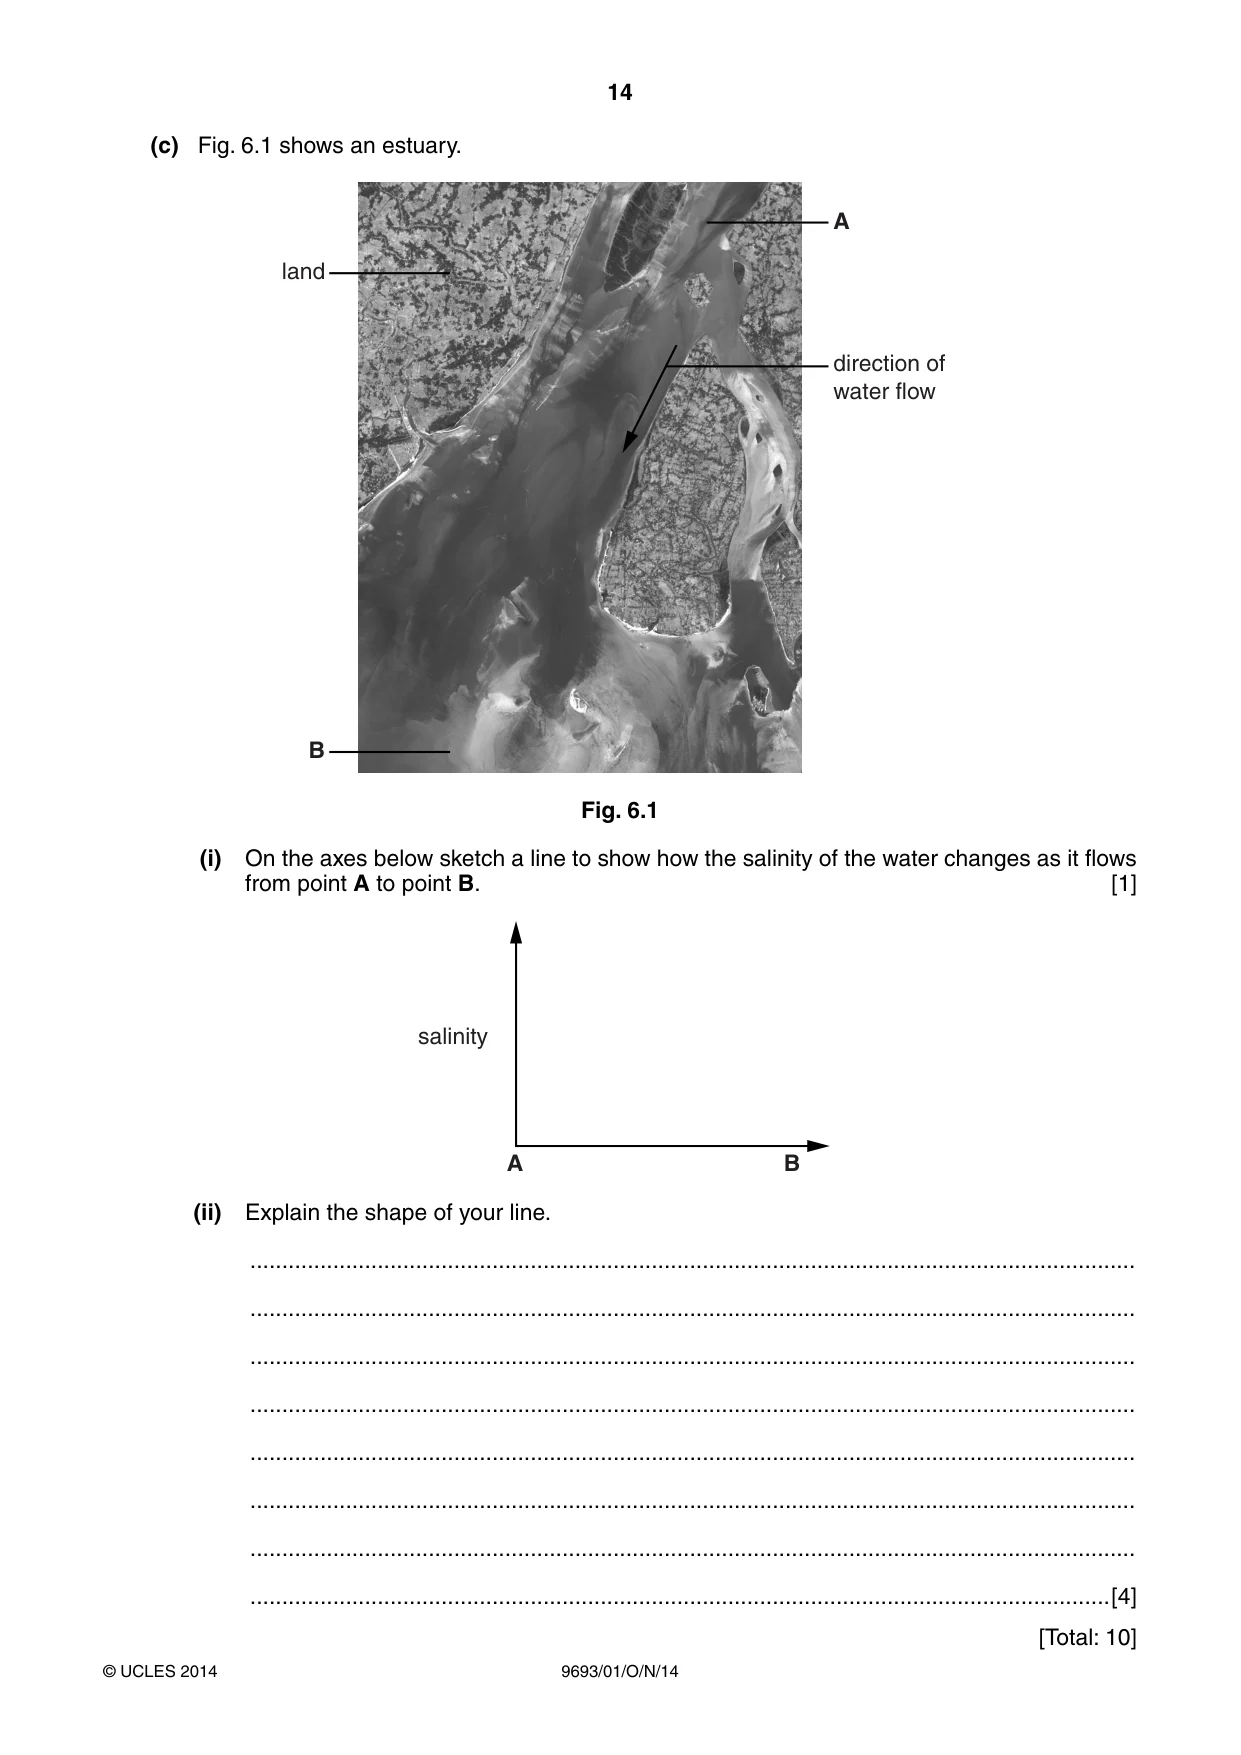
14 9693/01/O/N/14 © UCLES 2014 (c) Fig. 6.1 shows an estuary. land A direction of water flow B Fig. 6.1 (i) On the axes below sketch a line to show how the salinity of the water changes as it flows from point A to point B. [1] salinity A B (ii) Explain the shape of your line. … … … … … … … …[4] [Total: 10]
Question paper, page 15
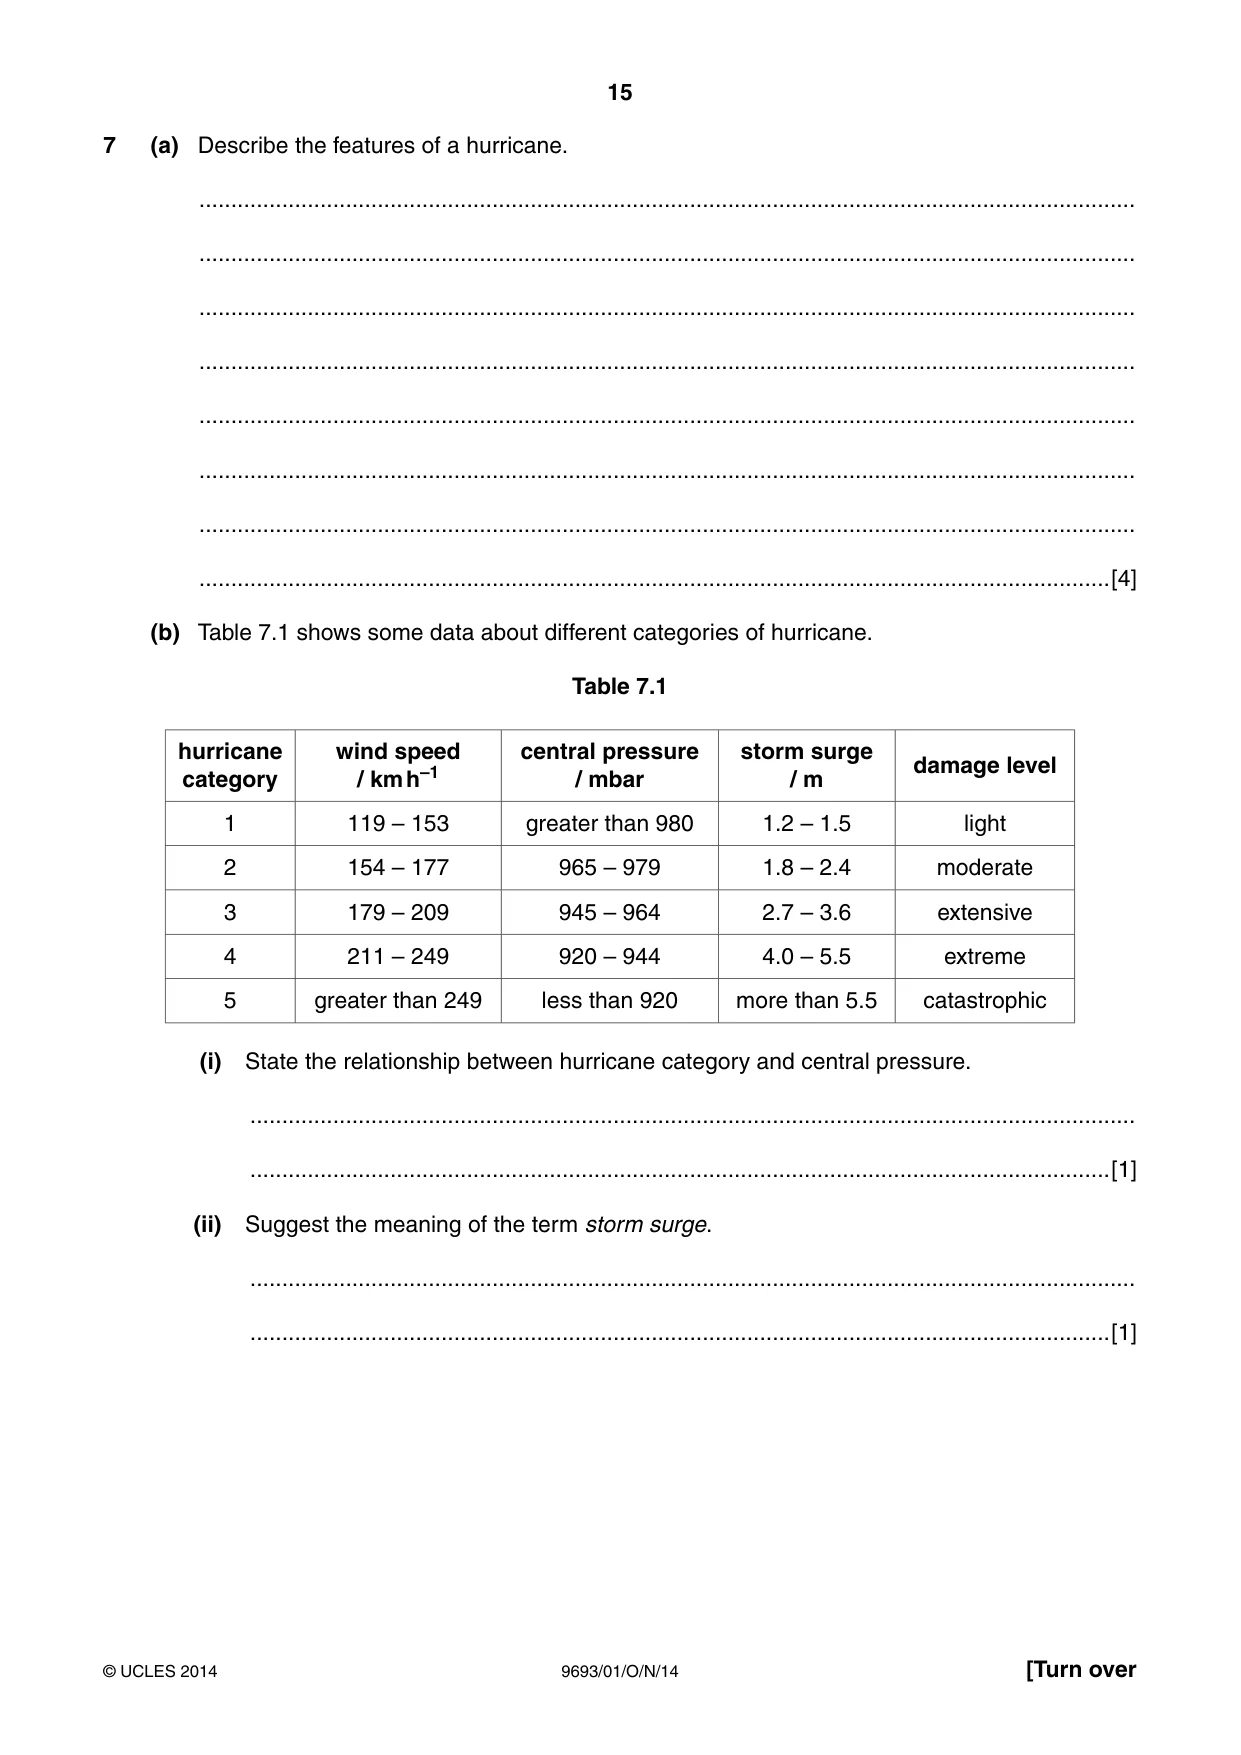
15 9693/01/O/N/14 © UCLES 2014 [Turn over 7 (a) Describe the features of a hurricane. … … … … … … … …[4] (b) Table 7.1 shows some data about different categories of hurricane. Table 7.1 hurricane category wind speed / km h–1 central pressure / mbar storm surge / m damage level 1 119 – 153 greater than 980 1.2 – 1.5 light 2 154 – 177 965 – 979 1.8 – 2.4 moderate 3 179 – 209 945 – 964 2.7 – 3.6 extensive 4 211 – 249 920 – 944 4.0 – 5.5 extreme 5 greater than 249 less than 920 more than 5.5 catastrophic (i) State the relationship between hurricane category and central pressure. … …[1] (ii) Suggest the meaning of the term storm surge. … …[1]
Question paper, page 16
16 9693/01/O/N/14 © UCLES 2014 (c) Suggest how hurricanes can be beneficial. … … … … … …[3] [Total: 9] Copyright Acknowledgements: Question 6c © Science Photo Library; coo6/2680. Permission to reproduce items where third-party owned material protected by copyright is included has been sought and cleared where possible. Every reasonable effort has been made by the publisher (UCLES) to trace copyright holders, but if any items requiring clearance have unwittingly been included, the publisher will be pleased to make amends at the earliest possible opportunity. Cambridge International Examinations is part of the Cambridge Assessment Group. Cambridge Assessment is the brand name of University of Cambridge Local Examinations Syndicate (UCLES), which is itself a department of the University of Cambridge.
Mark scheme, page 1
® IGCSE is the registered trademark of Cambridge International Examinations. CAMBRIDGE INTERNATIONAL EXAMINATIONS Cambridge International Advanced Subsidiary Level MARK SCHEME for the October/November 2014 series 9693 MARINE SCIENCE 9693/01 Paper 1 (AS Structured Questions), maximum raw mark 75 This mark scheme is published as an aid to teachers and candidates, to indicate the requirements of the examination. It shows the basis on which Examiners were instructed to award marks. It does not indicate the details of the discussions that took place at an Examiners’ meeting before marking began, which would have considered the acceptability of alternative answers. Mark schemes should be read in conjunction with the question paper and the Principal Examiner Report for Teachers. Cambridge will not enter into discussions about these mark schemes. Cambridge is publishing the mark schemes for the October/November 2014 series for most Cambridge IGCSE®, Cambridge International A and AS Level components and some Cambridge O Level components.
Mark scheme, page 2
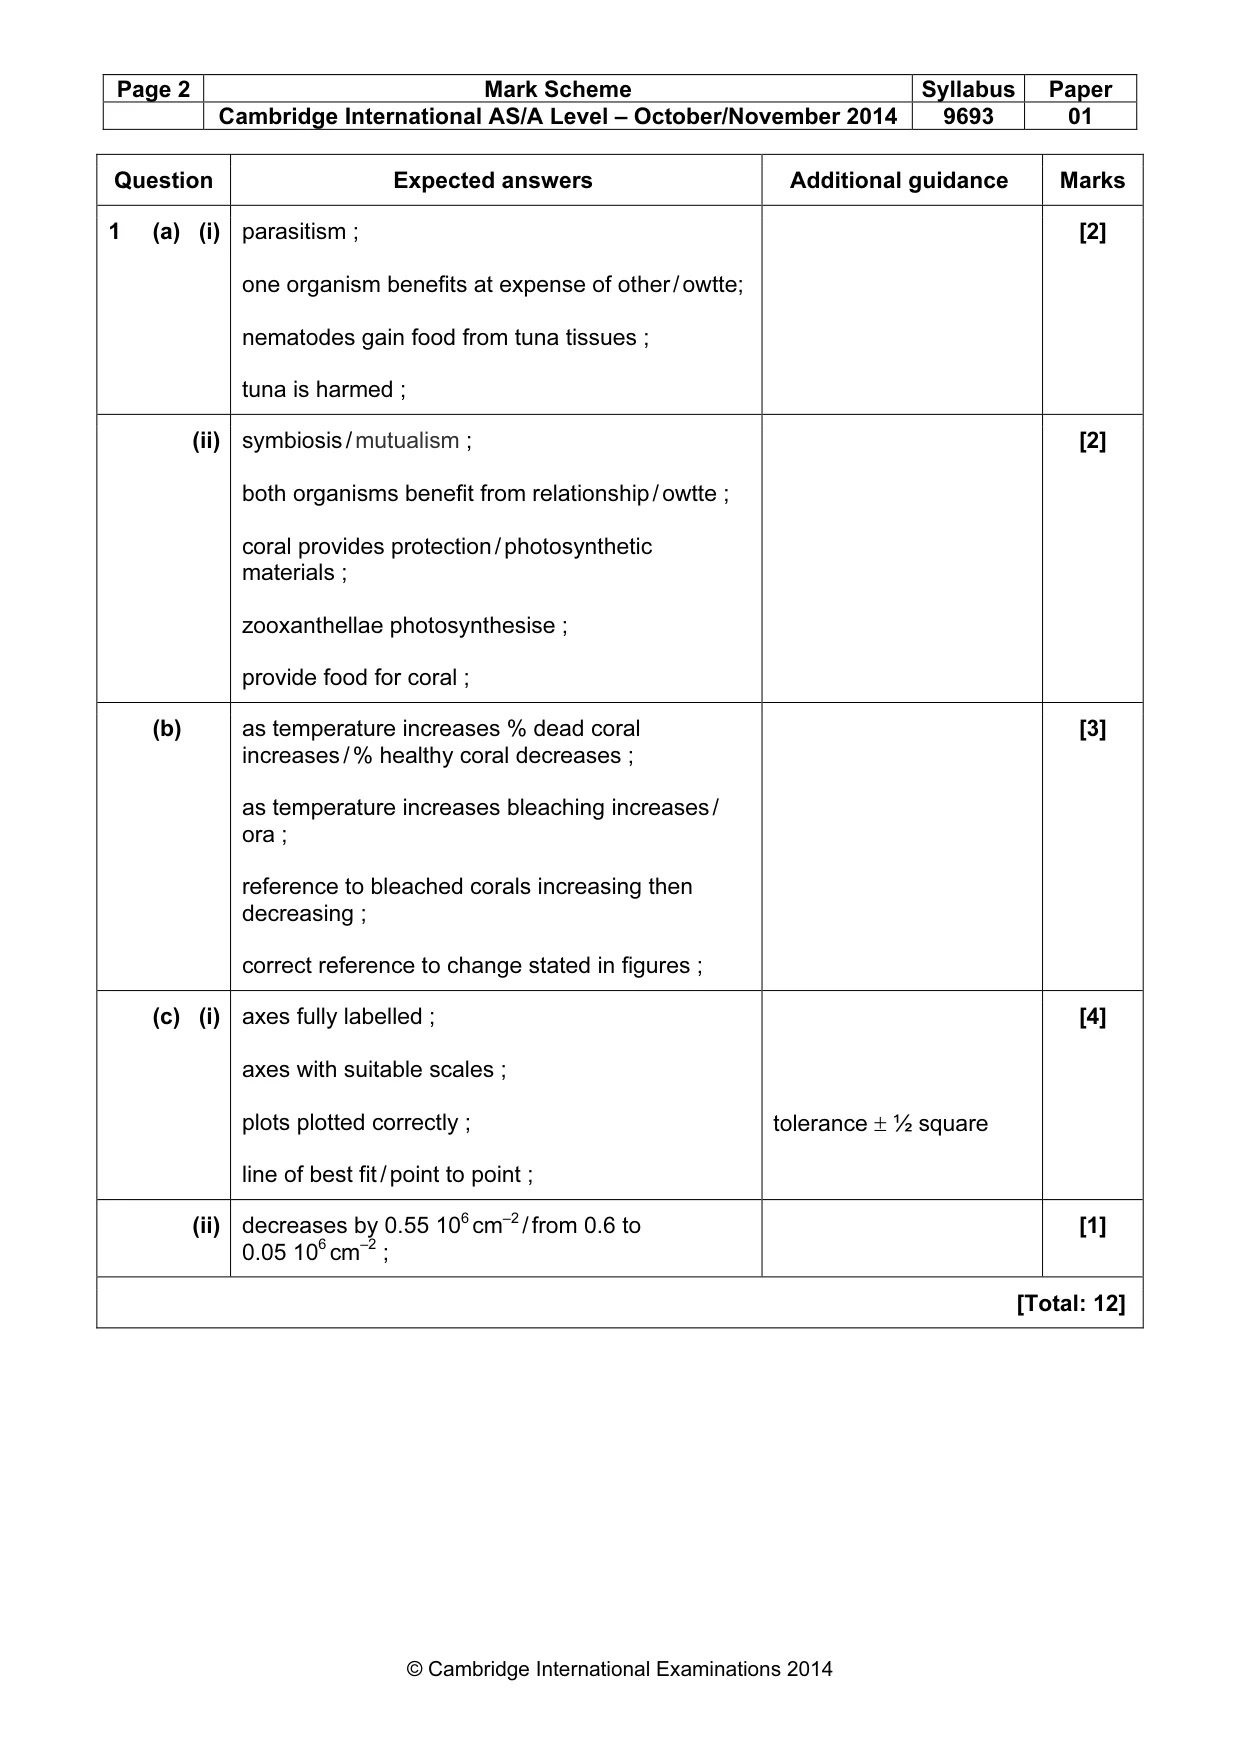
Page 2 Mark Scheme Syllabus Paper Cambridge International AS/A Level – October/November 2014 9693 01 © Cambridge International Examinations 2014 Question Expected answers Additional guidance Marks 1 (a) (i) parasitism ; one organism benefits at expense of other / owtte; nematodes gain food from tuna tissues ; tuna is harmed ; [2] (ii) symbiosis / mutualism ; both organisms benefit from relationship / owtte ; coral provides protection / photosynthetic materials ; zooxanthellae photosynthesise ; provide food for coral ; [2] (b) as temperature increases % dead coral increases / % healthy coral decreases ; as temperature increases bleaching increases / ora ; reference to bleached corals increasing then decreasing ; correct reference to change stated in figures ; [3] (c) (i) axes fully labelled ; axes with suitable scales ; plots plotted correctly ; line of best fit / point to point ; tolerance ± ½ square [4] (ii) decreases by 0.55 106 cm–2 / from 0.6 to 0.05 106 cm–2 ; [1] [Total: 12]
Mark scheme, page 3
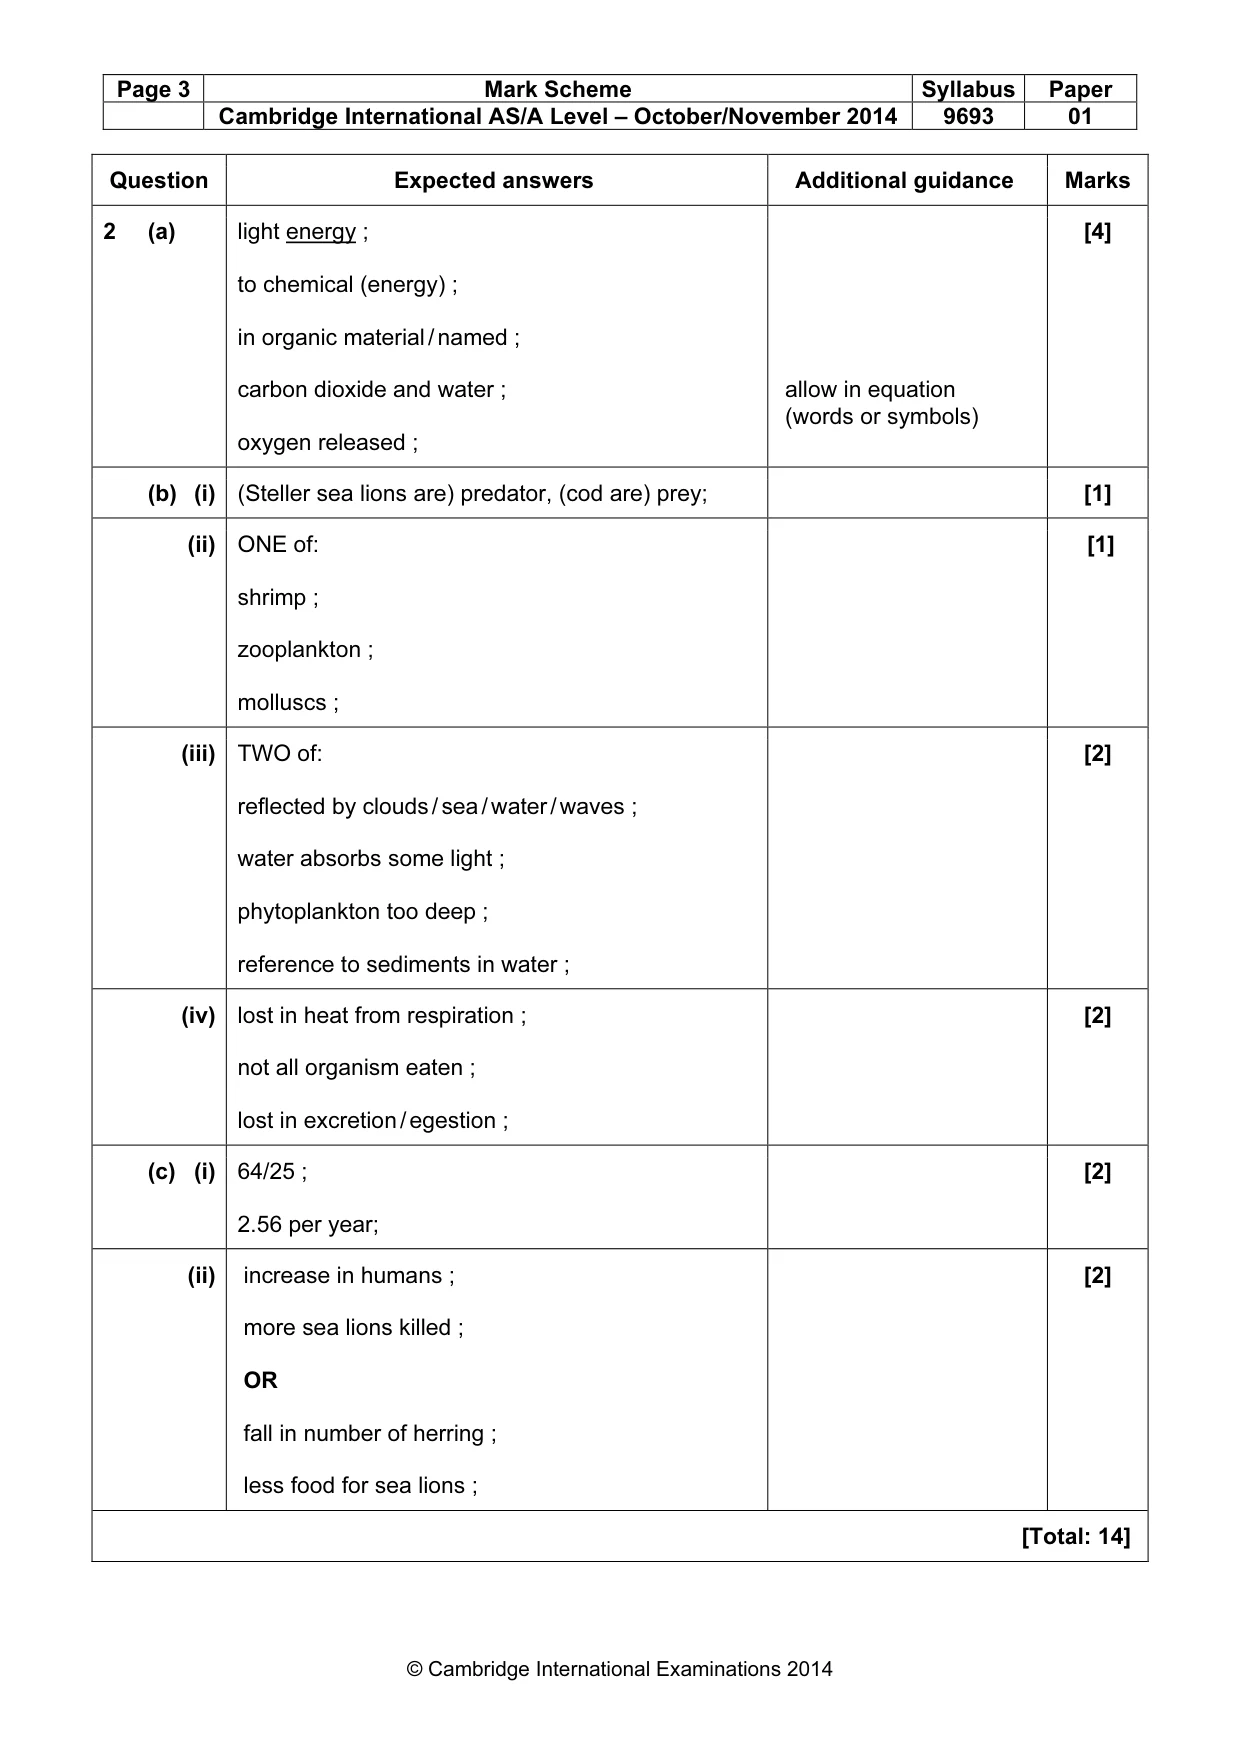
Page 3 Mark Scheme Syllabus Paper Cambridge International AS/A Level – October/November 2014 9693 01 © Cambridge International Examinations 2014 Question Expected answers Additional guidance Marks 2 (a) light energy ; to chemical (energy) ; in organic material / named ; carbon dioxide and water ; oxygen released ; allow in equation (words or symbols) [4] (b) (i) (Steller sea lions are) predator, (cod are) prey; [1] (ii) ONE of: shrimp ; zooplankton ; molluscs ; [1] (iii) TWO of: reflected by clouds / sea / water / waves ; water absorbs some light ; phytoplankton too deep ; reference to sediments in water ; [2] (iv) lost in heat from respiration ; not all organism eaten ; lost in excretion / egestion ; [2] (c) (i) 64/25 ; 2.56 per year; [2] (ii) increase in humans ; more sea lions killed ; OR fall in number of herring ; less food for sea lions ; [2] [Total: 14]
Mark scheme, page 4
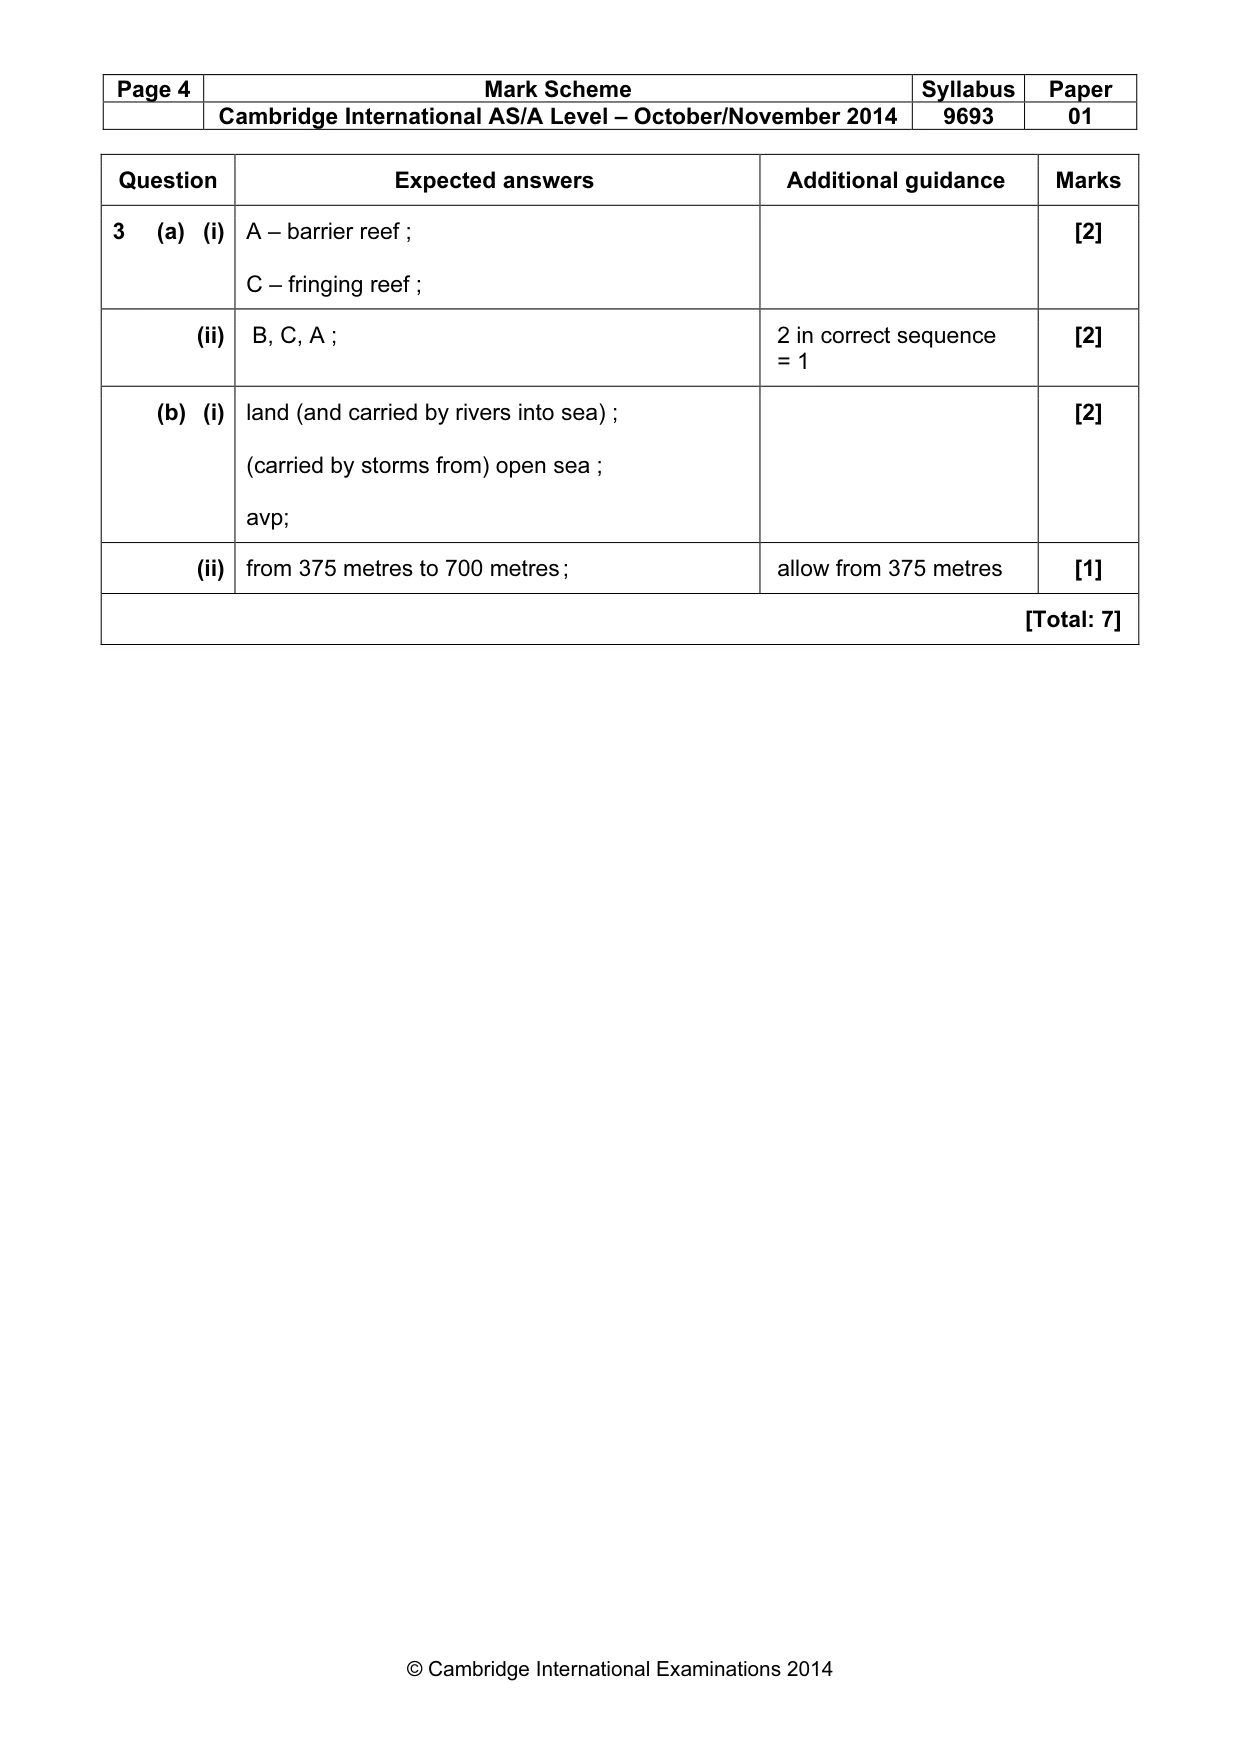
Page 4 Mark Scheme Syllabus Paper Cambridge International AS/A Level – October/November 2014 9693 01 © Cambridge International Examinations 2014 Question Expected answers Additional guidance Marks 3 (a) (i) A – barrier reef ; C – fringing reef ; [2] (ii) B, C, A ; 2 in correct sequence = 1 [2] (b) (i) land (and carried by rivers into sea) ; (carried by storms from) open sea ; avp; [2] (ii) from 375 metres to 700 metres ; allow from 375 metres [1] [Total: 7]
Mark scheme, page 5
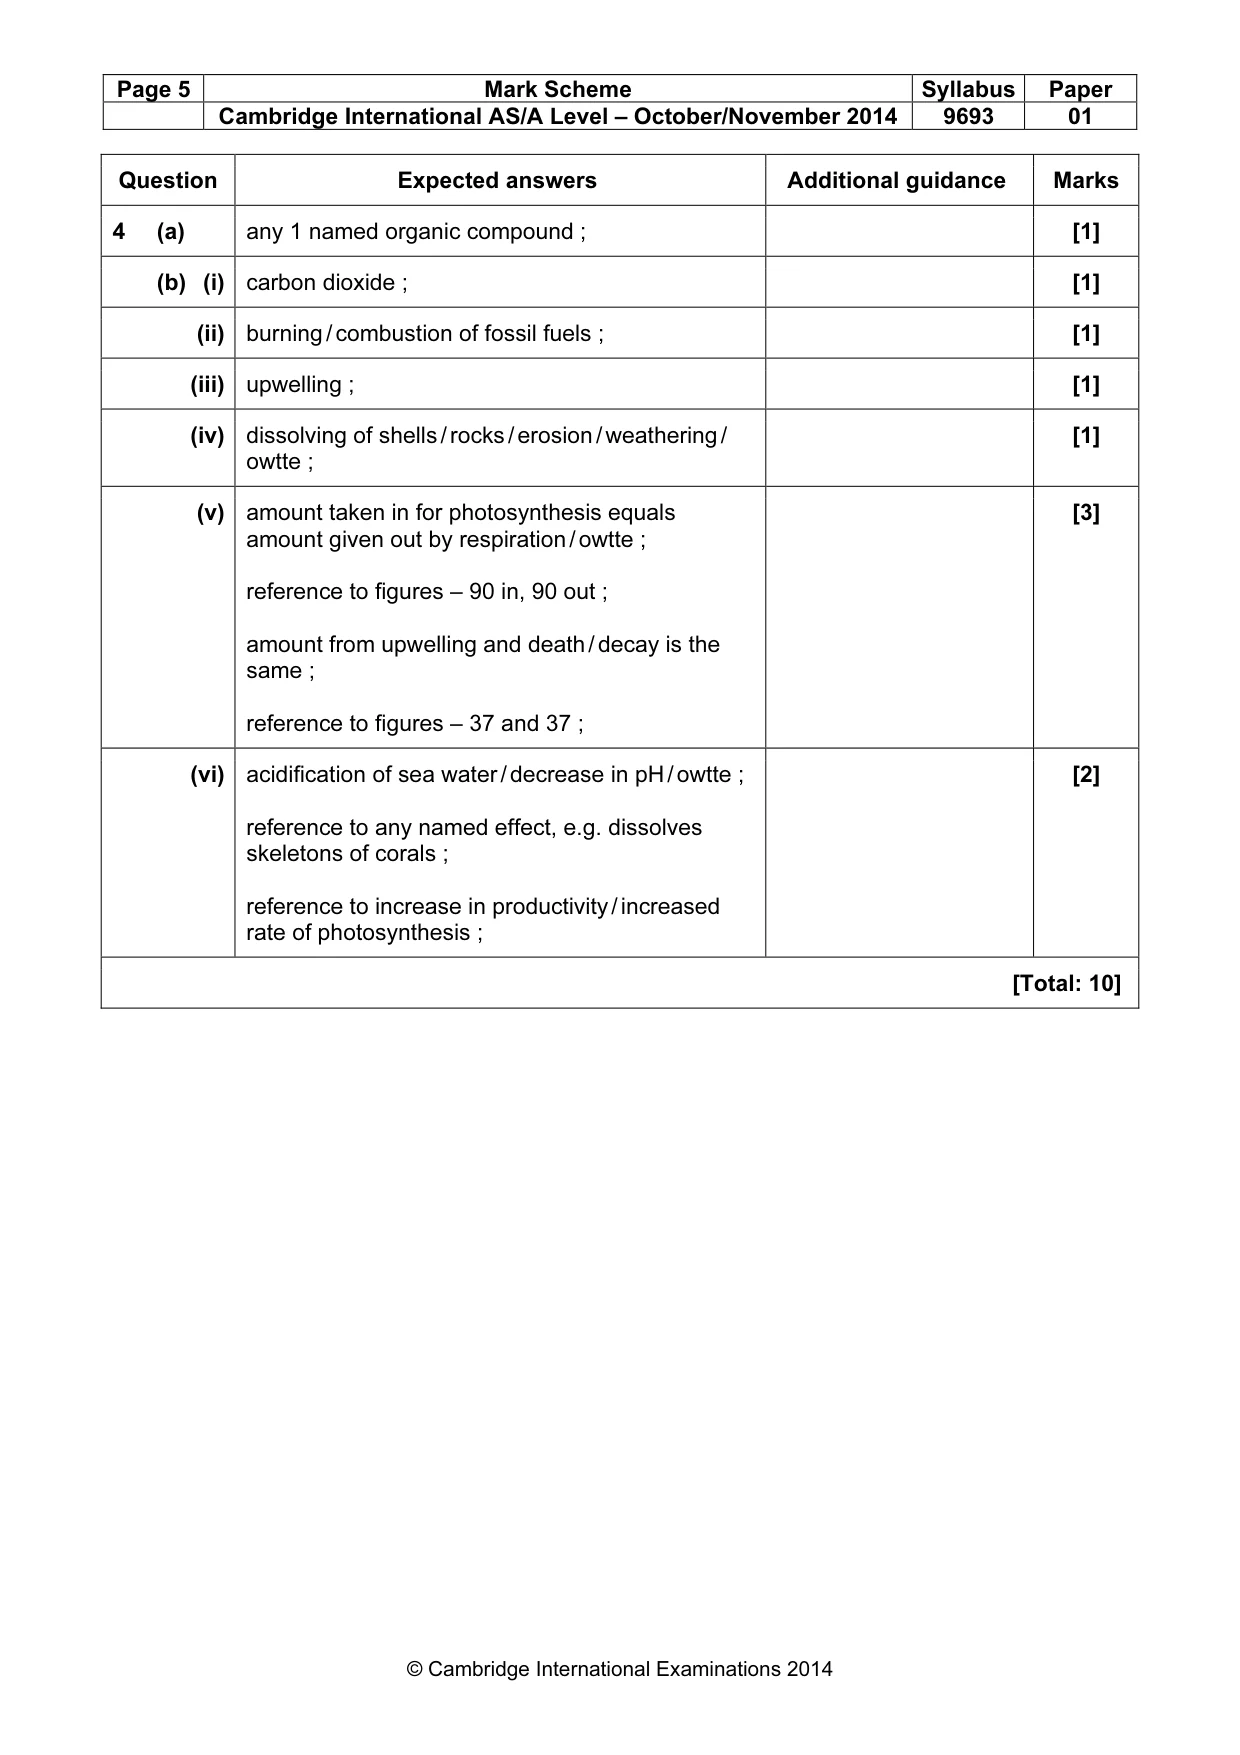
Page 5 Mark Scheme Syllabus Paper Cambridge International AS/A Level – October/November 2014 9693 01 © Cambridge International Examinations 2014 Question Expected answers Additional guidance Marks 4 (a) any 1 named organic compound ; [1] (b) (i) carbon dioxide ; [1] (ii) burning / combustion of fossil fuels ; [1] (iii) upwelling ; [1] (iv) dissolving of shells / rocks / erosion / weathering / owtte ; [1] (v) amount taken in for photosynthesis equals amount given out by respiration / owtte ; reference to figures – 90 in, 90 out ; amount from upwelling and death / decay is the same ; reference to figures – 37 and 37 ; [3] (vi) acidification of sea water / decrease in pH / owtte ; reference to any named effect, e.g. dissolves skeletons of corals ; reference to increase in productivity / increased rate of photosynthesis ; [2] [Total: 10]
Mark scheme, page 6
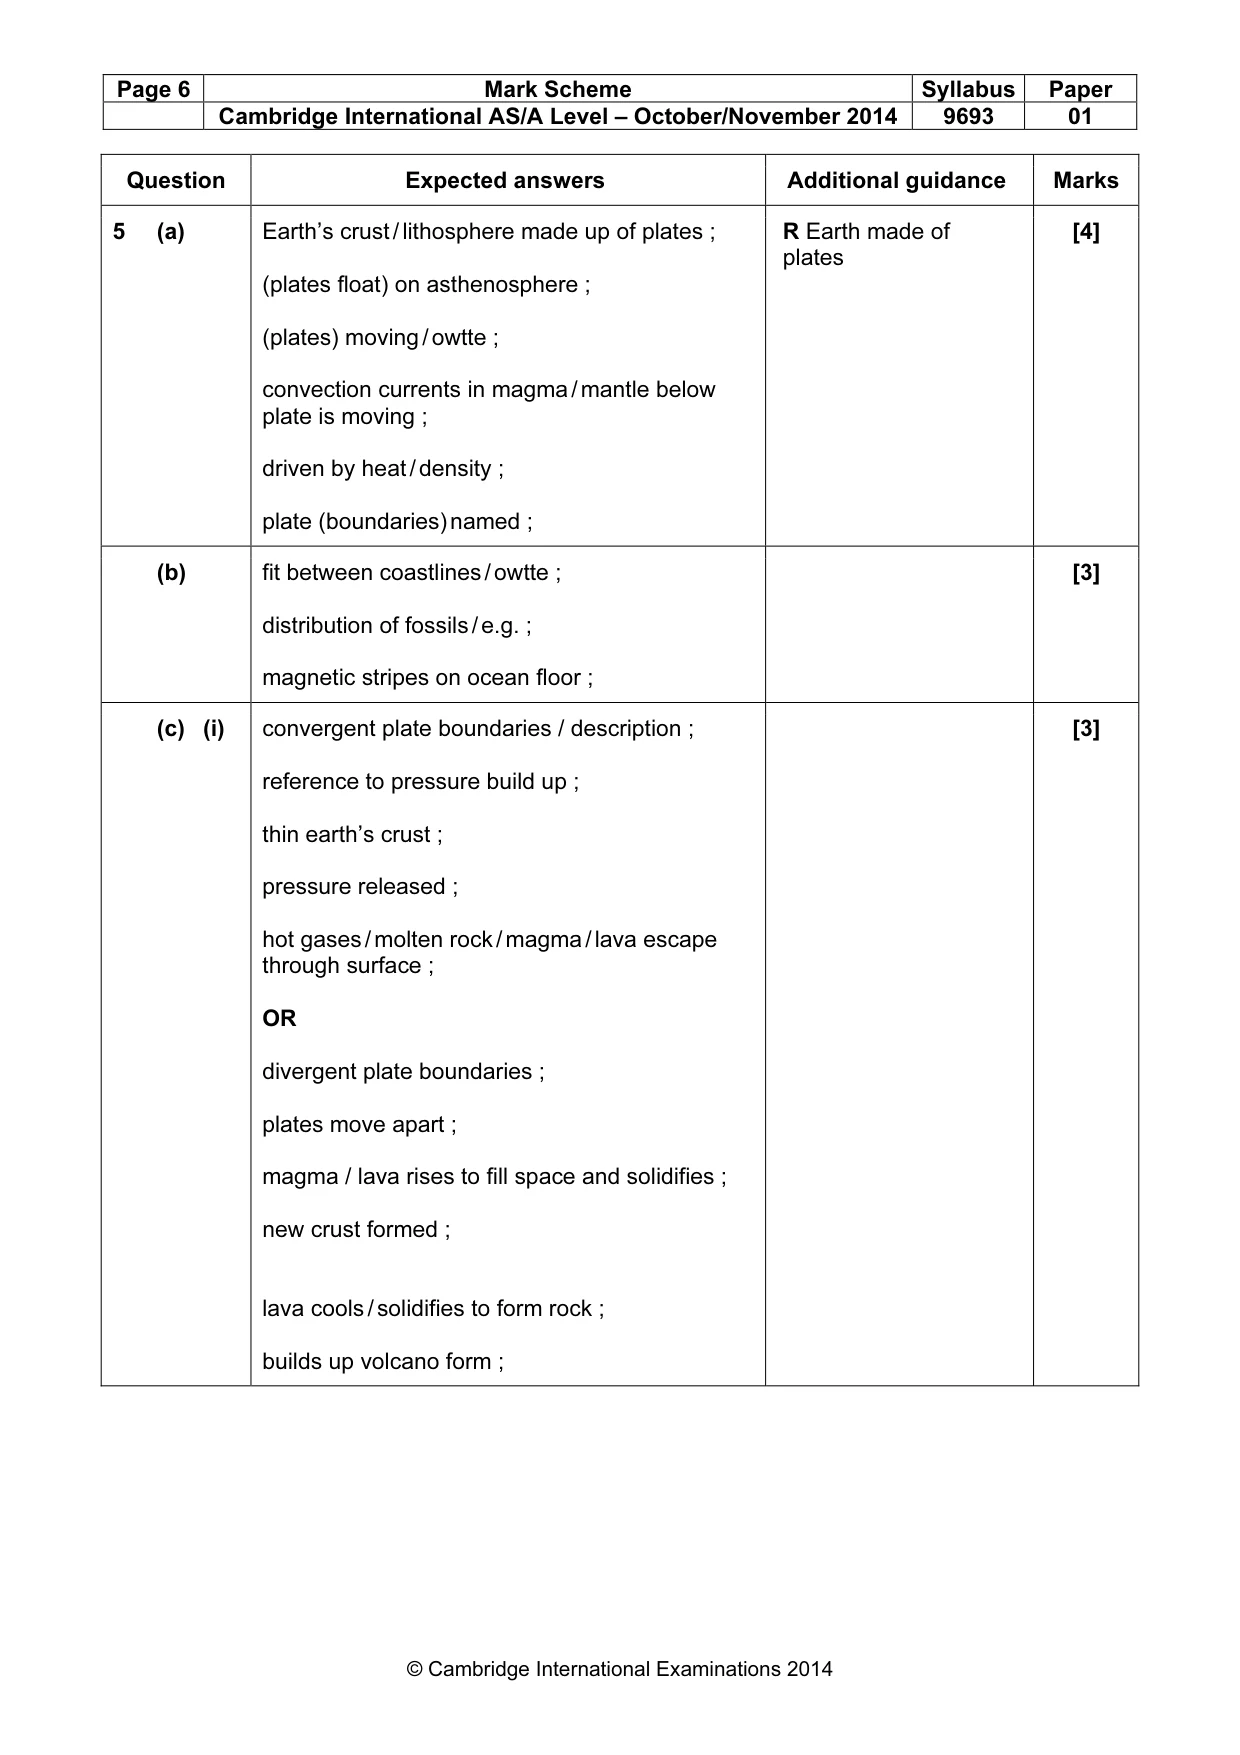
Page 6 Mark Scheme Syllabus Paper Cambridge International AS/A Level – October/November 2014 9693 01 © Cambridge International Examinations 2014 Question Expected answers Additional guidance Marks 5 (a) Earth’s crust / lithosphere made up of plates ; (plates float) on asthenosphere ; (plates) moving / owtte ; convection currents in magma / mantle below plate is moving ; driven by heat / density ; plate (boundaries) named ; R Earth made of plates [4] (b) fit between coastlines / owtte ; distribution of fossils / e.g. ; magnetic stripes on ocean floor ; [3] (c) (i) convergent plate boundaries / description ; reference to pressure build up ; thin earth’s crust ; pressure released ; hot gases / molten rock / magma / lava escape through surface ; OR divergent plate boundaries ; plates move apart ; magma / lava rises to fill space and solidifies ; new crust formed ; lava cools / solidifies to form rock ; builds up volcano form ; [3]
Mark scheme, page 7
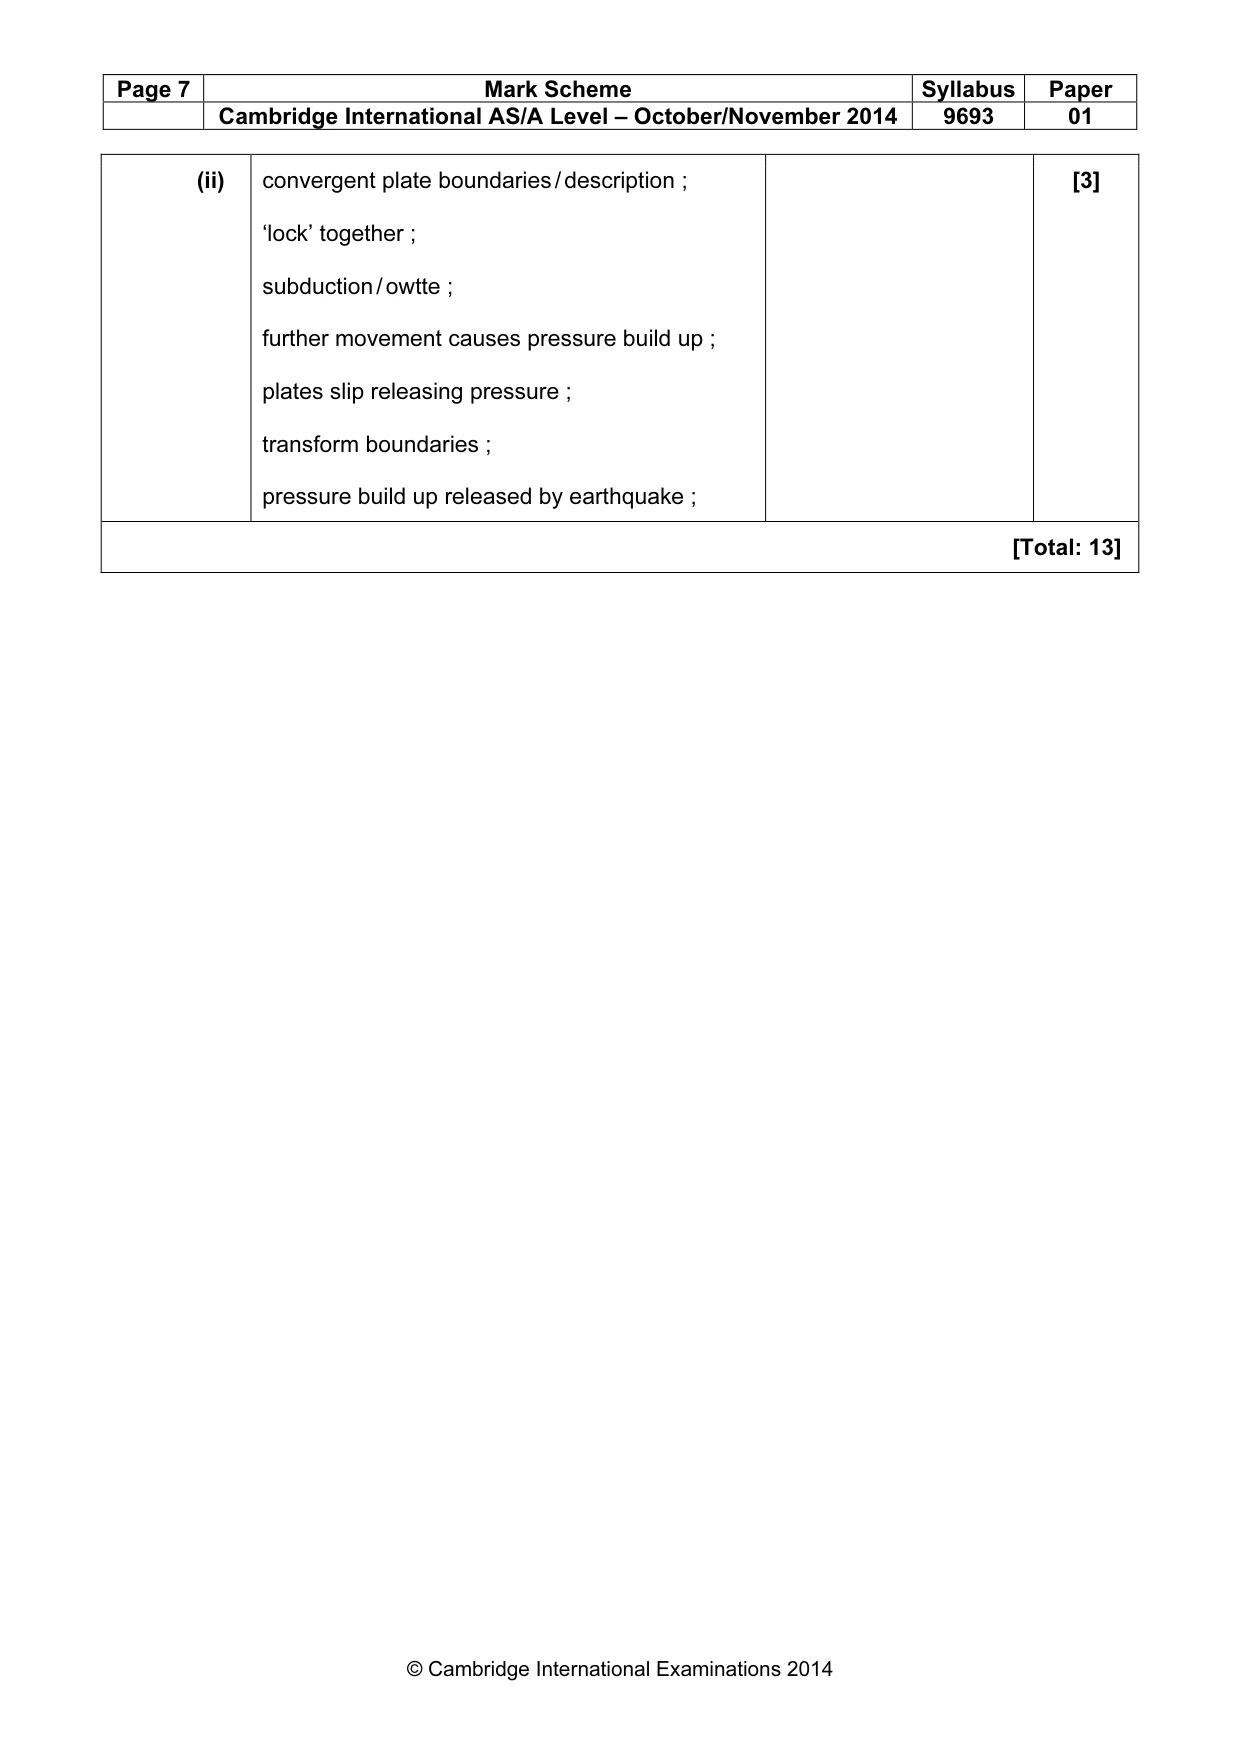
Page 7 Mark Scheme Syllabus Paper Cambridge International AS/A Level – October/November 2014 9693 01 © Cambridge International Examinations 2014 (ii) convergent plate boundaries / description ; ‘lock’ together ; subduction / owtte ; further movement causes pressure build up ; plates slip releasing pressure ; transform boundaries ; pressure build up released by earthquake ; [3] [Total: 13]
Mark scheme, page 8
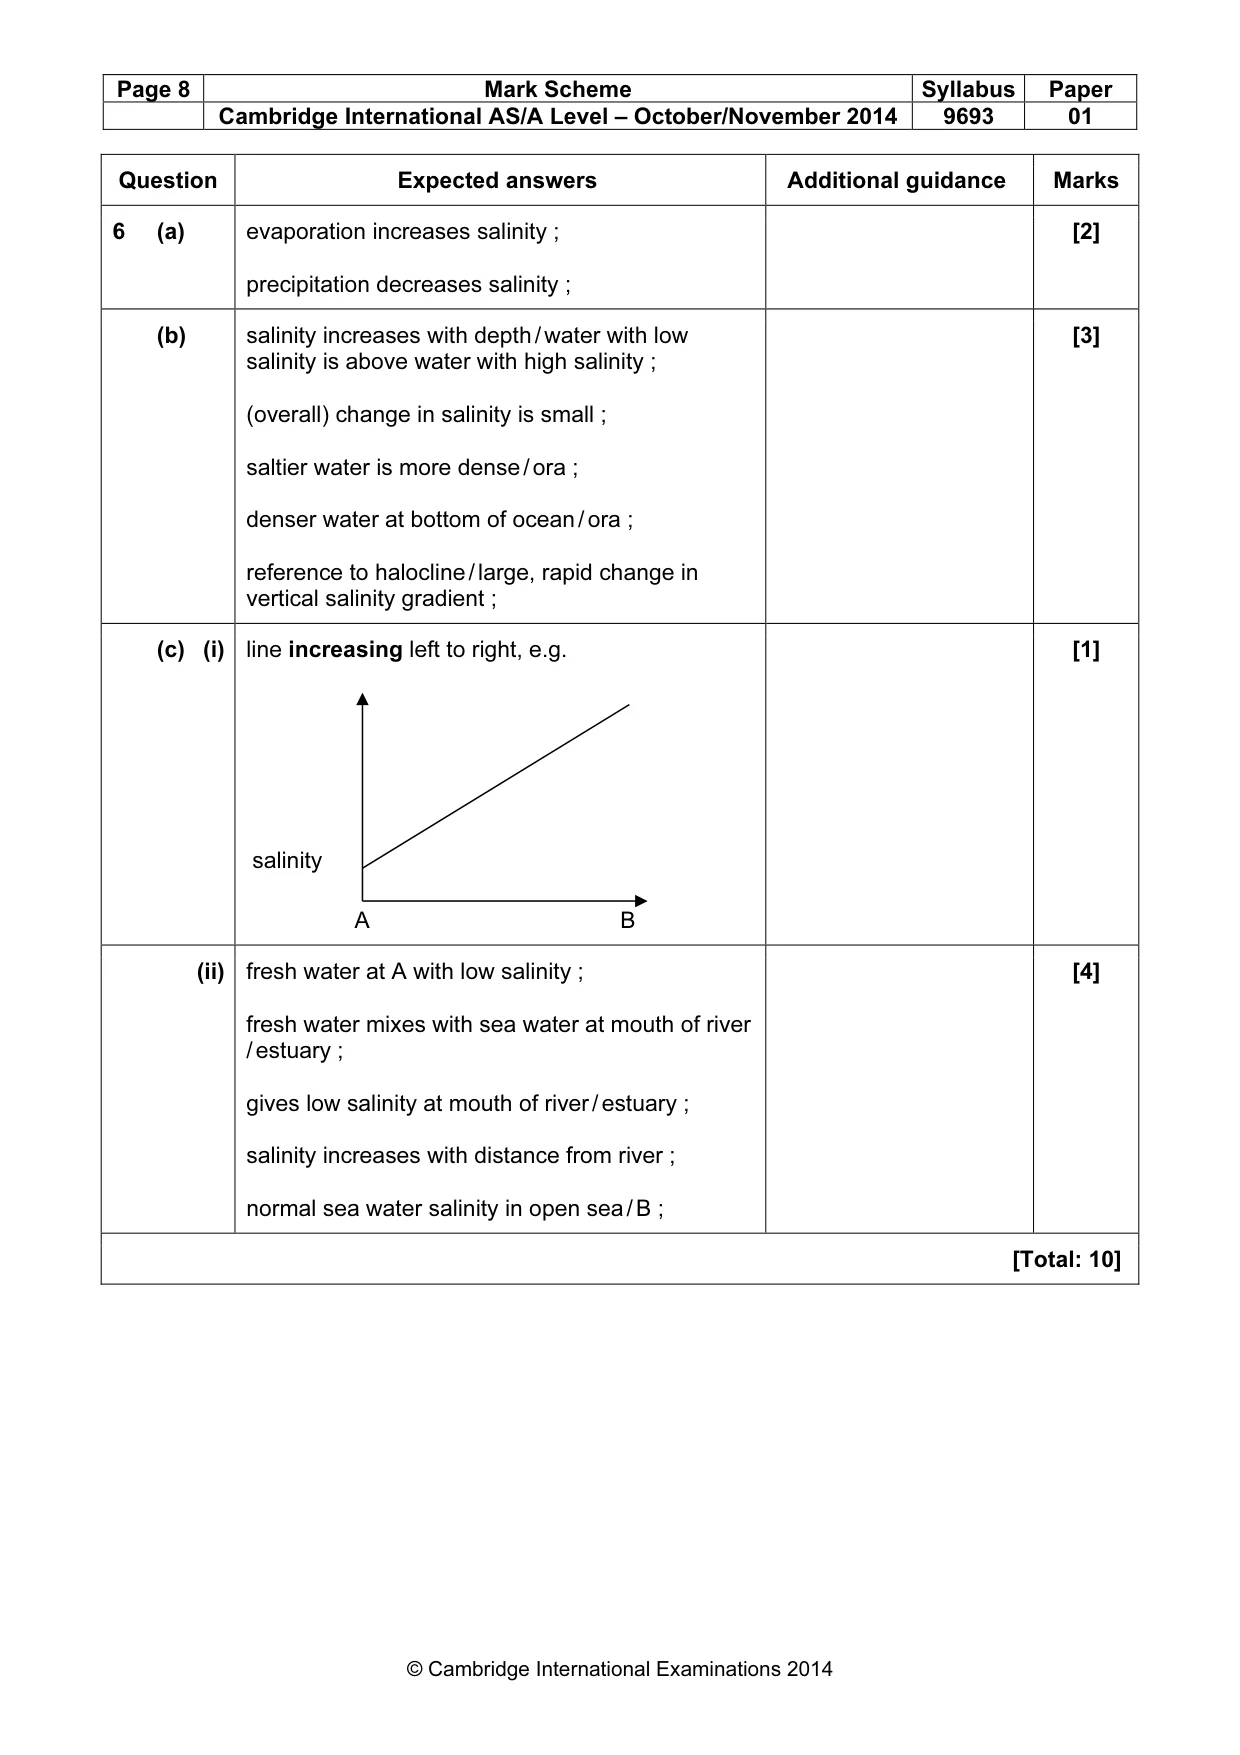
Page 8 Mark Scheme Syllabus Paper Cambridge International AS/A Level – October/November 2014 9693 01 © Cambridge International Examinations 2014 Question Expected answers Additional guidance Marks 6 (a) evaporation increases salinity ; precipitation decreases salinity ; [2] (b) salinity increases with depth / water with low salinity is above water with high salinity ; (overall) change in salinity is small ; saltier water is more dense / ora ; denser water at bottom of ocean / ora ; reference to halocline / large, rapid change in vertical salinity gradient ; [3] (c) (i) line increasing left to right, e.g. salinity A B [1] (ii) fresh water at A with low salinity ; fresh water mixes with sea water at mouth of river / estuary ; gives low salinity at mouth of river / estuary ; salinity increases with distance from river ; normal sea water salinity in open sea / B ; [4] [Total: 10]
Mark scheme, page 9
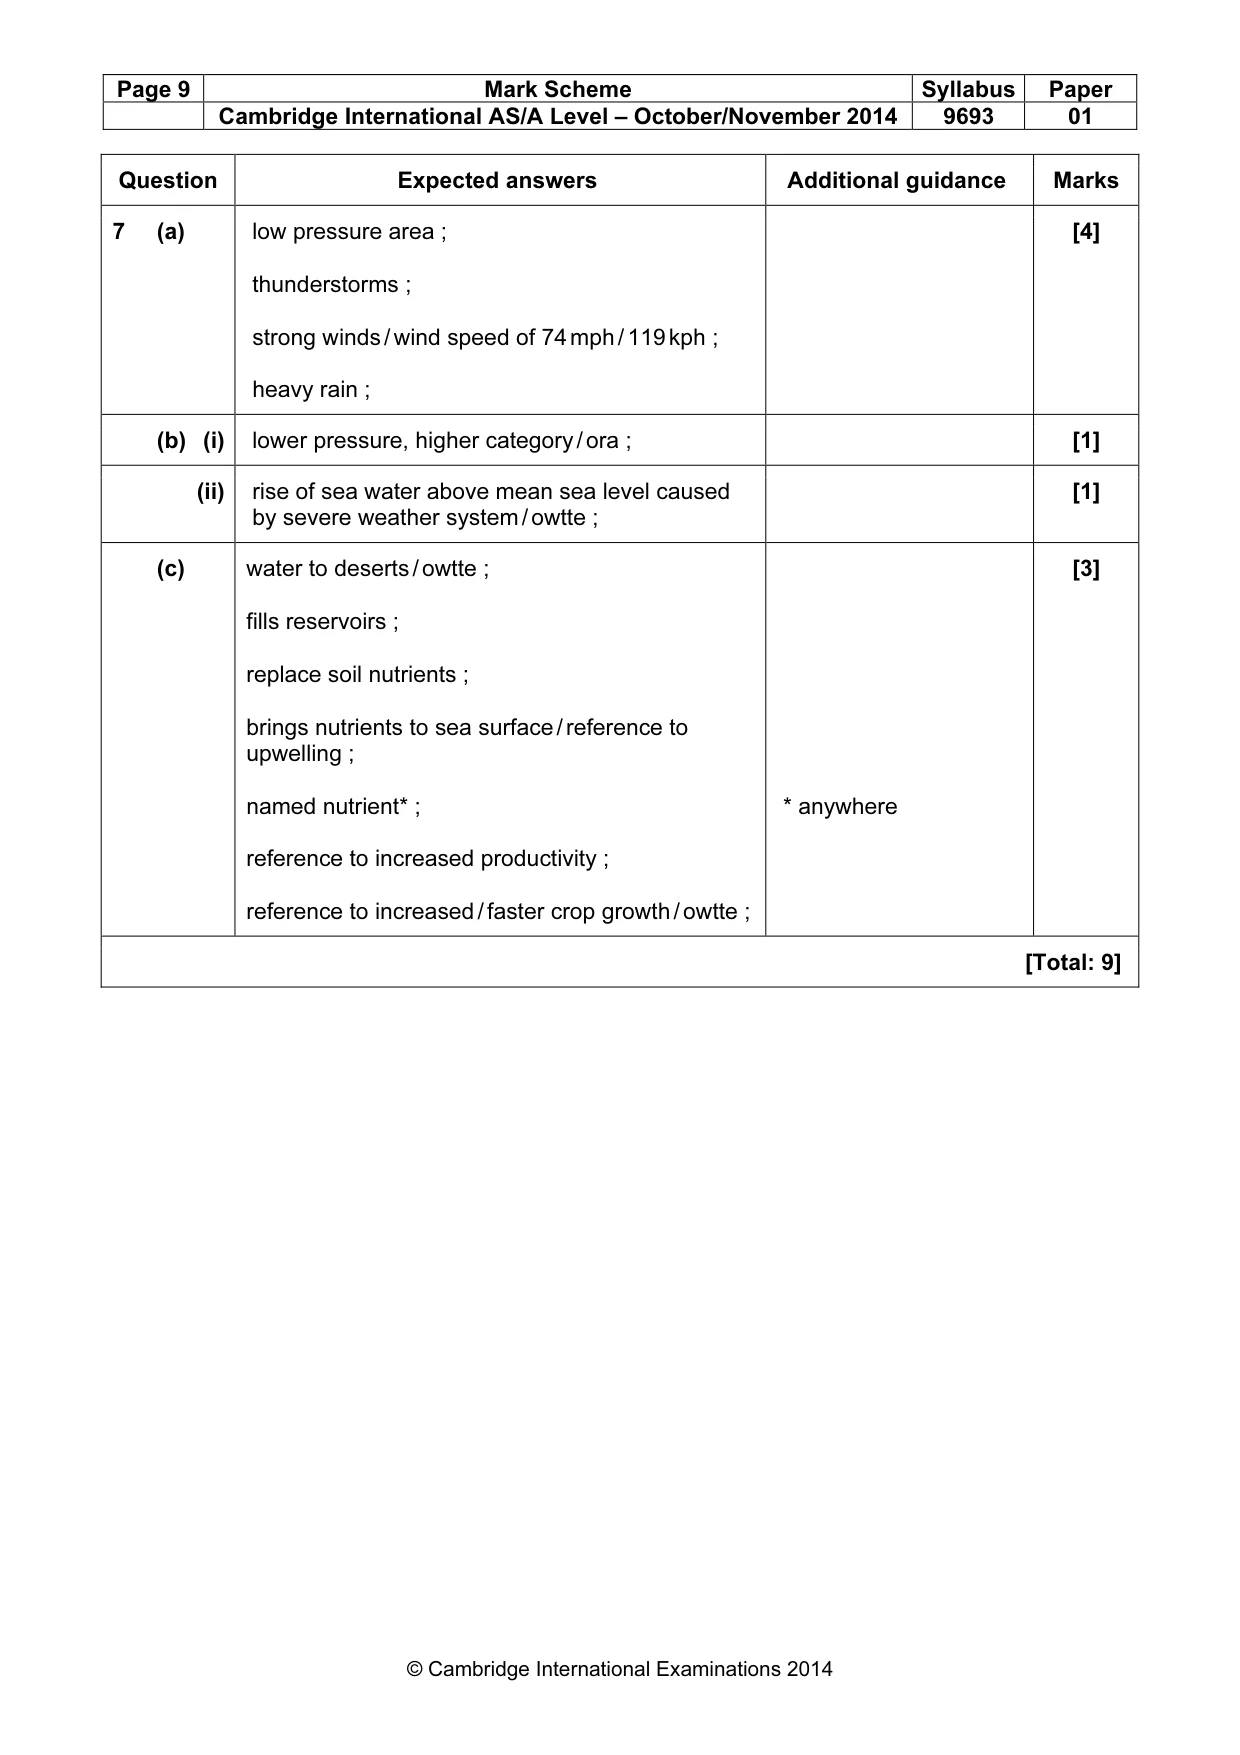
Page 9 Mark Scheme Syllabus Paper Cambridge International AS/A Level – October/November 2014 9693 01 © Cambridge International Examinations 2014 Question Expected answers Additional guidance Marks 7 (a) low pressure area ; thunderstorms ; strong winds / wind speed of 74 mph / 119 kph ; heavy rain ; [4] (b) (i) lower pressure, higher category / ora ; [1] (ii) rise of sea water above mean sea level caused by severe weather system / owtte ; [1] (c) water to deserts / owtte ; fills reservoirs ; replace soil nutrients ; brings nutrients to sea surface / reference to upwelling ; named nutrient* ; reference to increased productivity ; reference to increased / faster crop growth / owtte ; * anywhere [3] [Total: 9]
What you needed in this session
Cambridge’s own grade thresholds for 2014 Oct/Nov, Paper 1 · Variant 1. A higher threshold means an easier paper — the bar moves with how the cohort did.