Cambridge A Level Geography 9696 — 2019 Oct/Nov Paper 1 · Variant 2
9696/12/O/N/19 · 60 marks · ≈68 min
The question paper and its mark scheme, free to read here and free to download. This is Cambridge’s own paper, exactly as it was sat.
Question paper4 pages

Mark scheme14 pages
Answers below. Sit the paper first if you are practising.
Paper as text
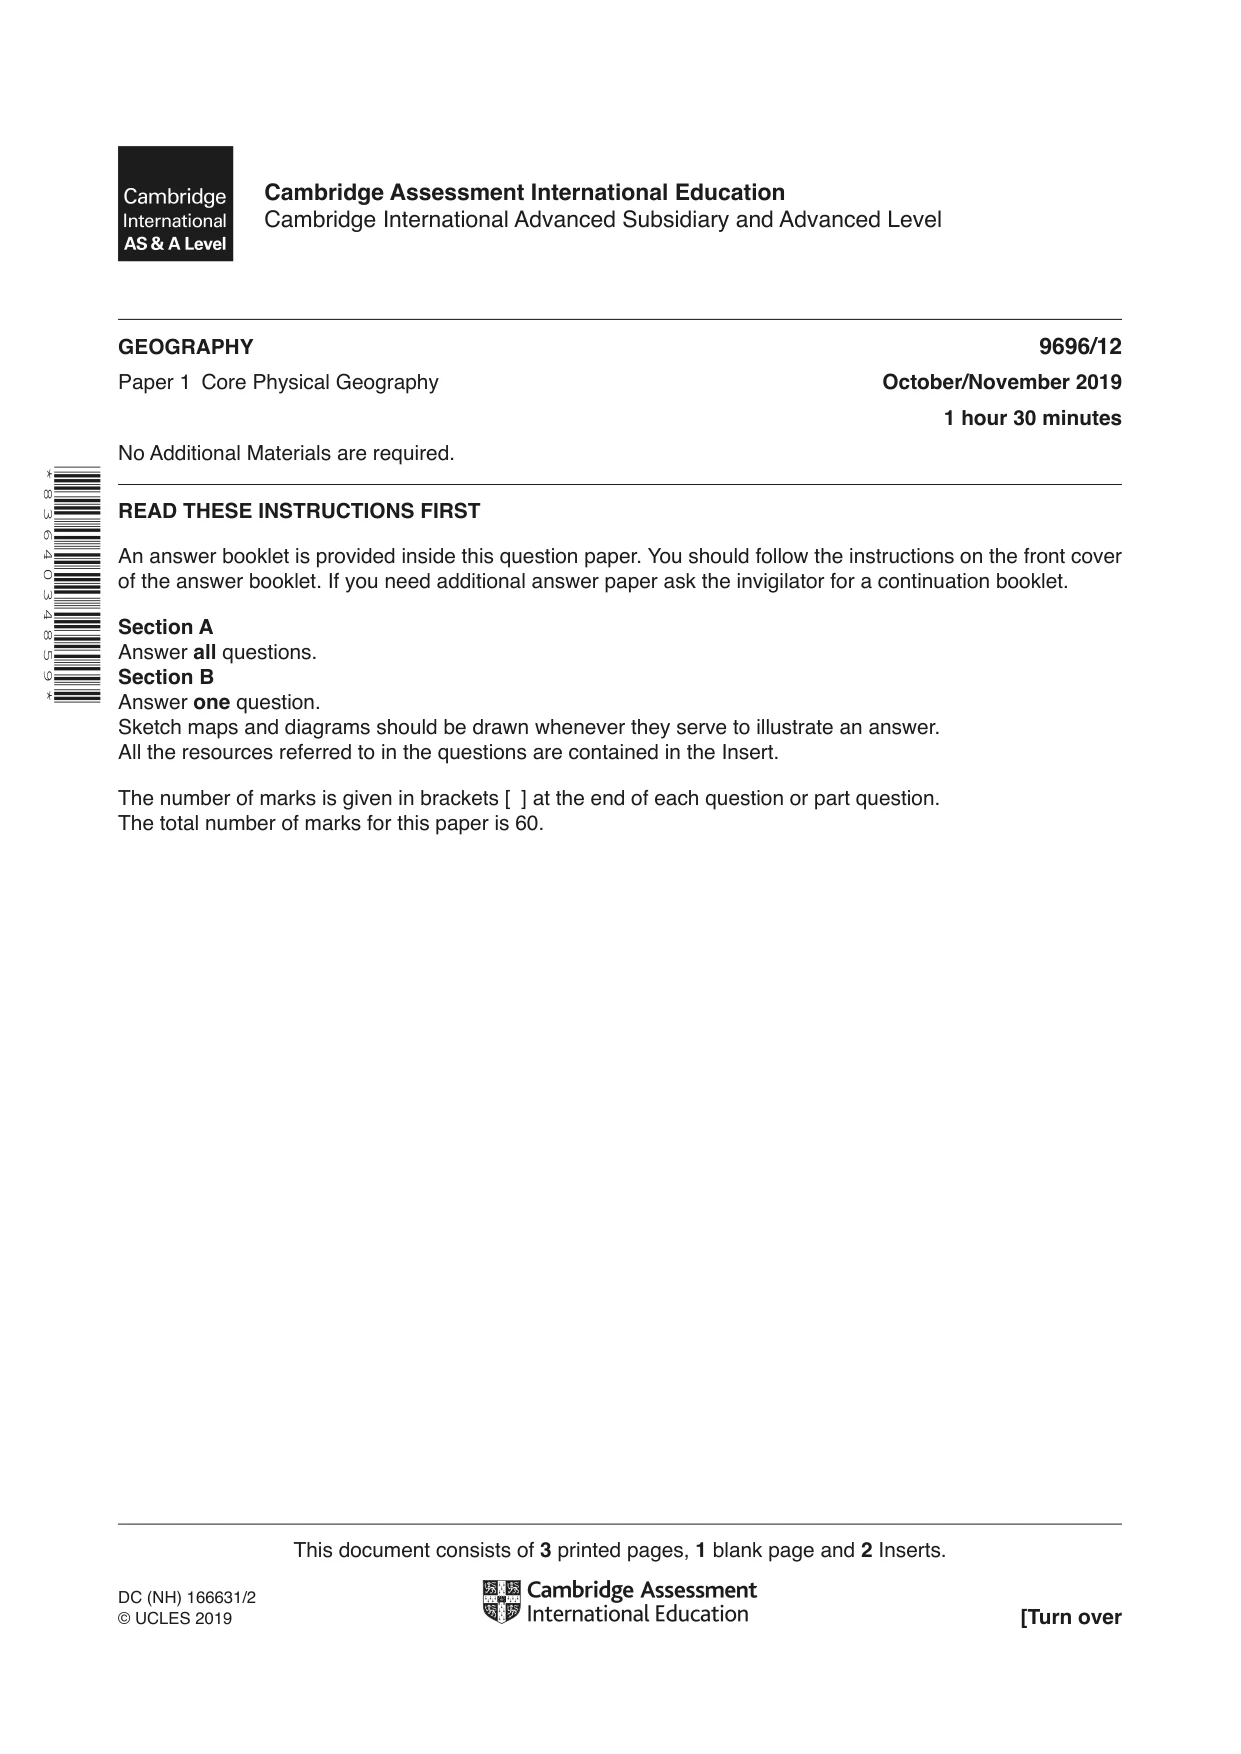
Question paper, page 1
This document consists of 3 printed pages, 1 blank page and 2 Inserts. DC (NH) 166631/2 © UCLES 2019 [Turn over Cambridge Assessment International Education Cambridge International Advanced Subsidiary and Advanced Level GEOGRAPHY 9696/12 Paper 1 Core Physical Geography October/November 2019 1 hour 30 minutes No Additional Materials are required. READ THESE INSTRUCTIONS FIRST An answer booklet is provided inside this question paper. You should follow the instructions on the front cover of the answer booklet. If you need additional answer paper ask the invigilator for a continuation booklet. Section A Answer all questions. Section B Answer one question. Sketch maps and diagrams should be drawn whenever they serve to illustrate an answer. All the resources referred to in the questions are contained in the Insert. The number of marks is given in brackets [ ] at the end of each question or part question. The total number of marks for this paper is 60. * 8 3 6 4 0 3 4 8 5 9 *
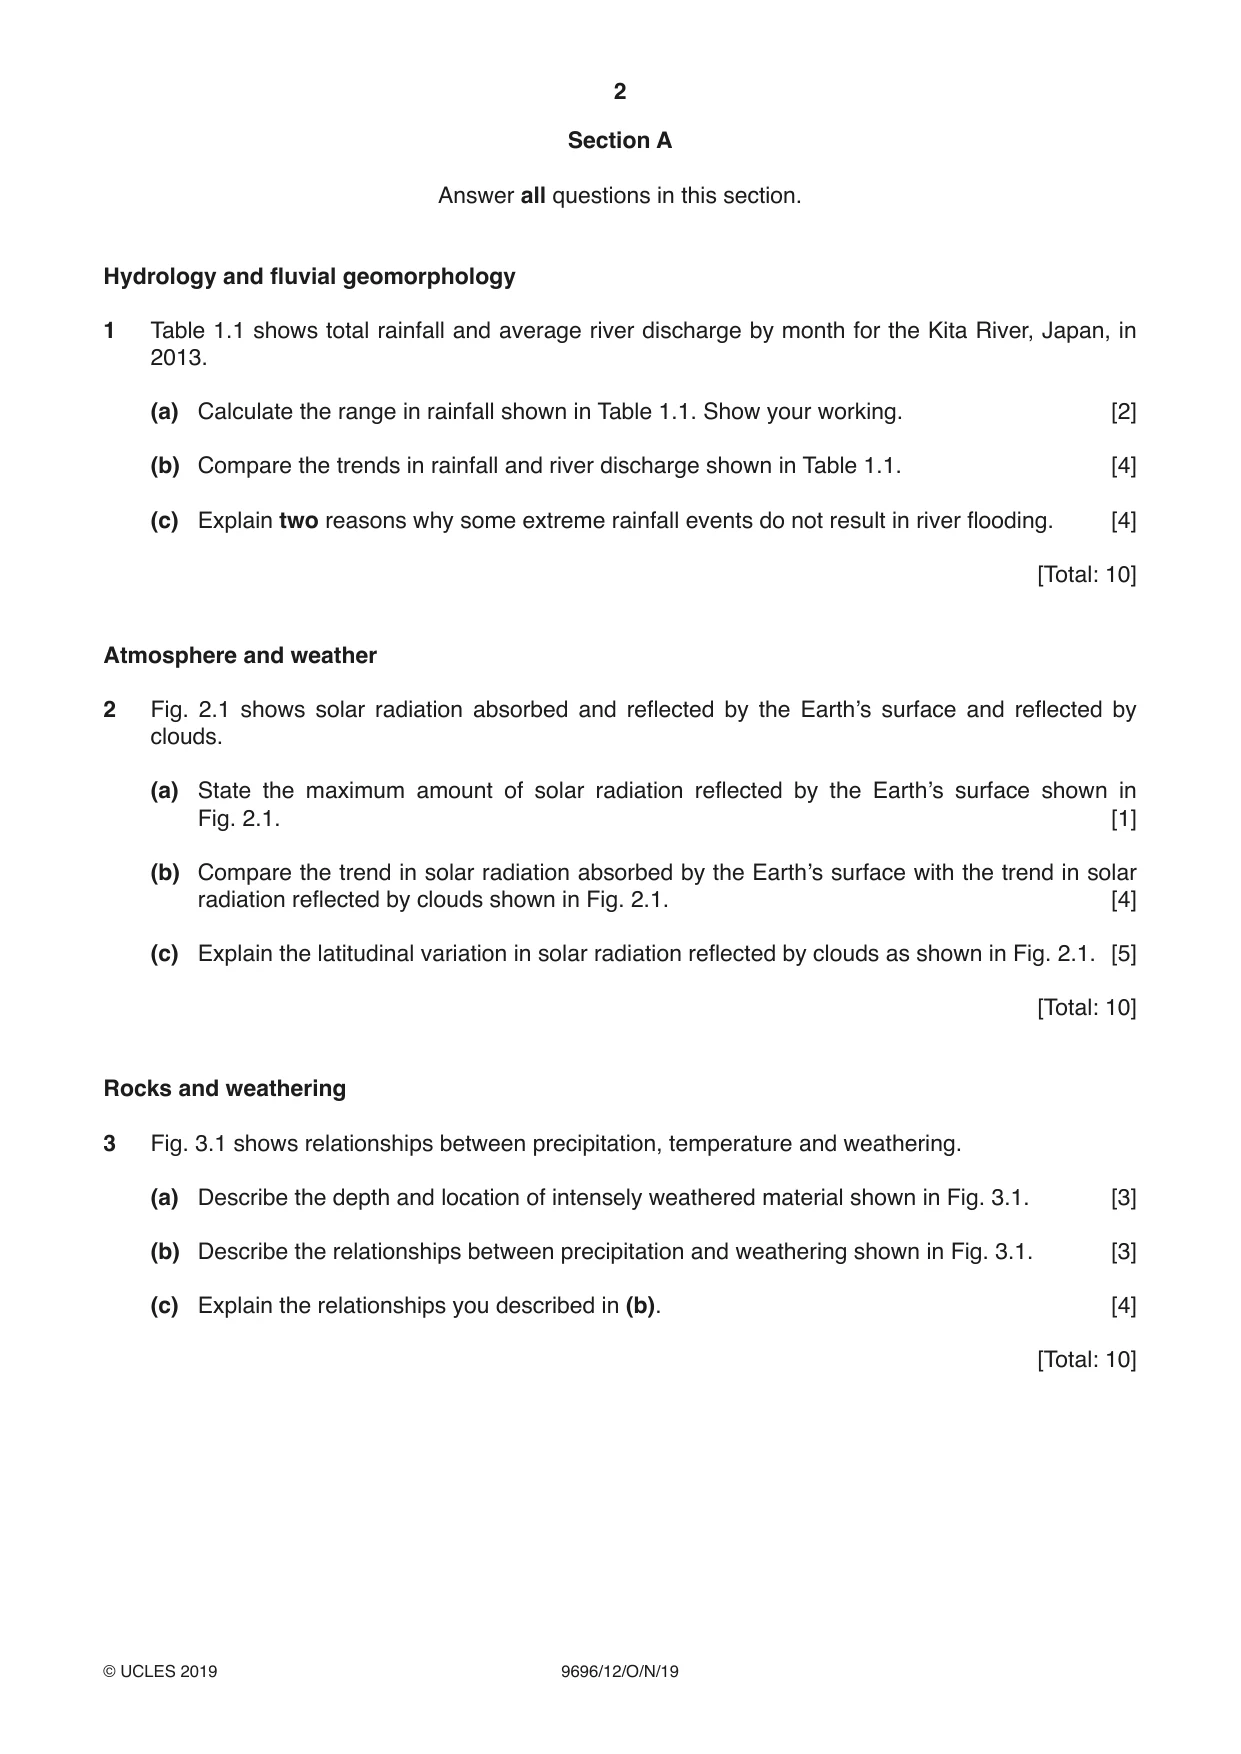
Question paper, page 2
2 9696/12/O/N/19 © UCLES 2019 Section A Answer all questions in this section. Hydrology and fluvial geomorphology 1 Table 1.1 shows total rainfall and average river discharge by month for the Kita River, Japan, in 2013. (a) Calculate the range in rainfall shown in Table 1.1. Show your working. [2] (b) Compare the trends in rainfall and river discharge shown in Table 1.1. [4] (c) Explain two reasons why some extreme rainfall events do not result in river flooding. [4] [Total: 10] Atmosphere and weather 2 Fig. 2.1 shows solar radiation absorbed and reflected by the Earth’s surface and reflected by clouds. (a) State the maximum amount of solar radiation reflected by the Earth’s surface shown in Fig. 2.1. [1] (b) Compare the trend in solar radiation absorbed by the Earth’s surface with the trend in solar radiation reflected by clouds shown in Fig. 2.1. [4] (c) Explain the latitudinal variation in solar radiation reflected by clouds as shown in Fig. 2.1. [5] [Total: 10] Rocks and weathering 3 Fig. 3.1 shows relationships between precipitation, temperature and weathering. (a) Describe the depth and location of intensely weathered material shown in Fig. 3.1. [3] (b) Describe the relationships between precipitation and weathering shown in Fig. 3.1. [3] (c) Explain the relationships you described in (b). [4] [Total: 10]
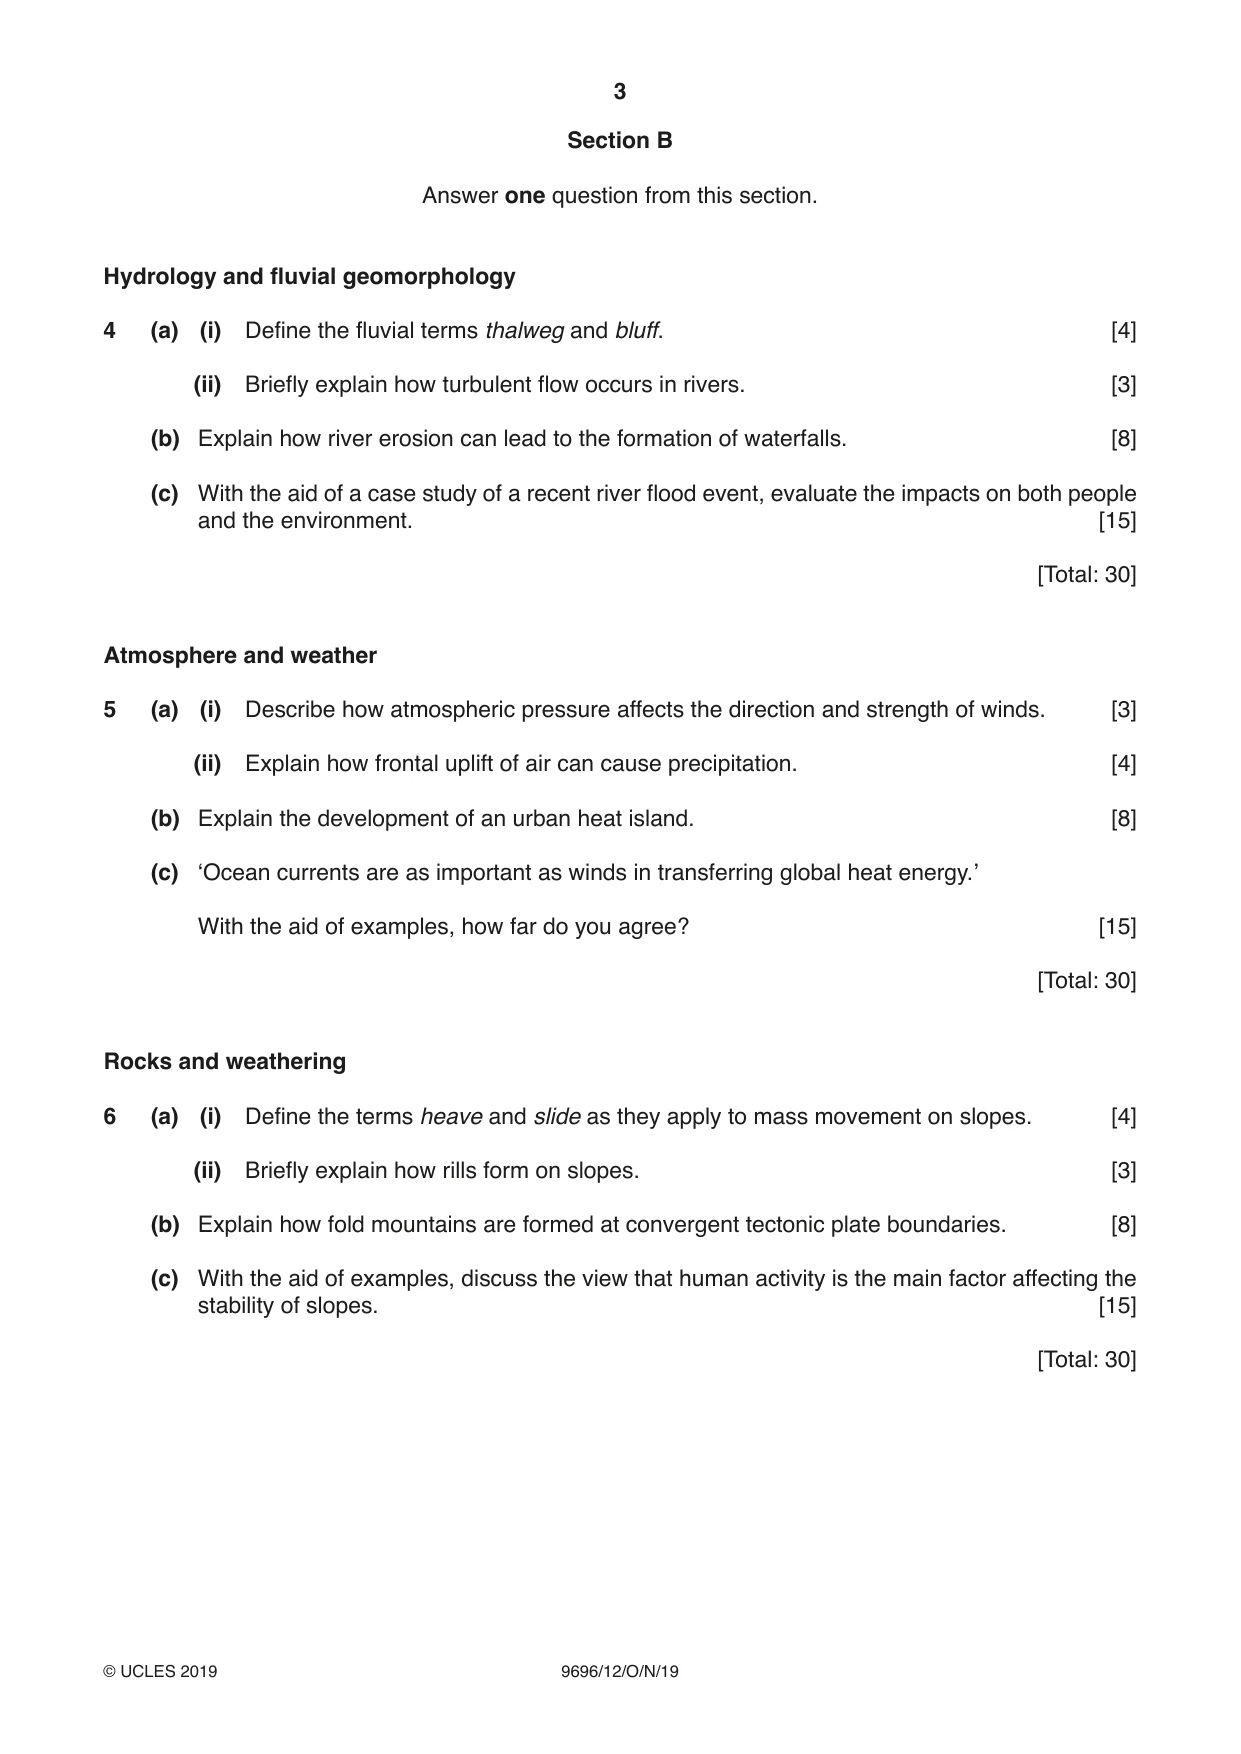
Question paper, page 3
3 9696/12/O/N/19 © UCLES 2019 Section B Answer one question from this section. Hydrology and fluvial geomorphology 4 (a) (i) Define the fluvial terms thalweg and bluff. [4] (ii) Briefly explain how turbulent flow occurs in rivers. [3] (b) Explain how river erosion can lead to the formation of waterfalls. [8] (c) With the aid of a case study of a recent river flood event, evaluate the impacts on both people and the environment. [15] [Total: 30] Atmosphere and weather 5 (a) (i) Describe how atmospheric pressure affects the direction and strength of winds. [3] (ii) Explain how frontal uplift of air can cause precipitation. [4] (b) Explain the development of an urban heat island. [8] (c) ‘Ocean currents are as important as winds in transferring global heat energy.’ With the aid of examples, how far do you agree? [15] [Total: 30] Rocks and weathering 6 (a) (i) Define the terms heave and slide as they apply to mass movement on slopes. [4] (ii) Briefly explain how rills form on slopes. [3] (b) Explain how fold mountains are formed at convergent tectonic plate boundaries. [8] (c) With the aid of examples, discuss the view that human activity is the main factor affecting the stability of slopes. [15] [Total: 30]
Question paper, page 4
4 9696/12/O/N/19 © UCLES 2019 BLANK PAGE Permission to reproduce items where third-party owned material protected by copyright is included has been sought and cleared where possible. Every reasonable effort has been made by the publisher (UCLES) to trace copyright holders, but if any items requiring clearance have unwittingly been included, the publisher will be pleased to make amends at the earliest possible opportunity. To avoid the issue of disclosure of answer-related information to candidates, all copyright acknowledgements are reproduced online in the Cambridge Assessment International Education Copyright Acknowledgements Booklet. This is produced for each series of examinations and is freely available to download at www.cambridgeinternational.org after the live examination series. Cambridge Assessment International Education is part of the Cambridge Assessment Group. Cambridge Assessment is the brand name of the University of Cambridge Local Examinations Syndicate (UCLES), which itself is a department of the University of Cambridge.
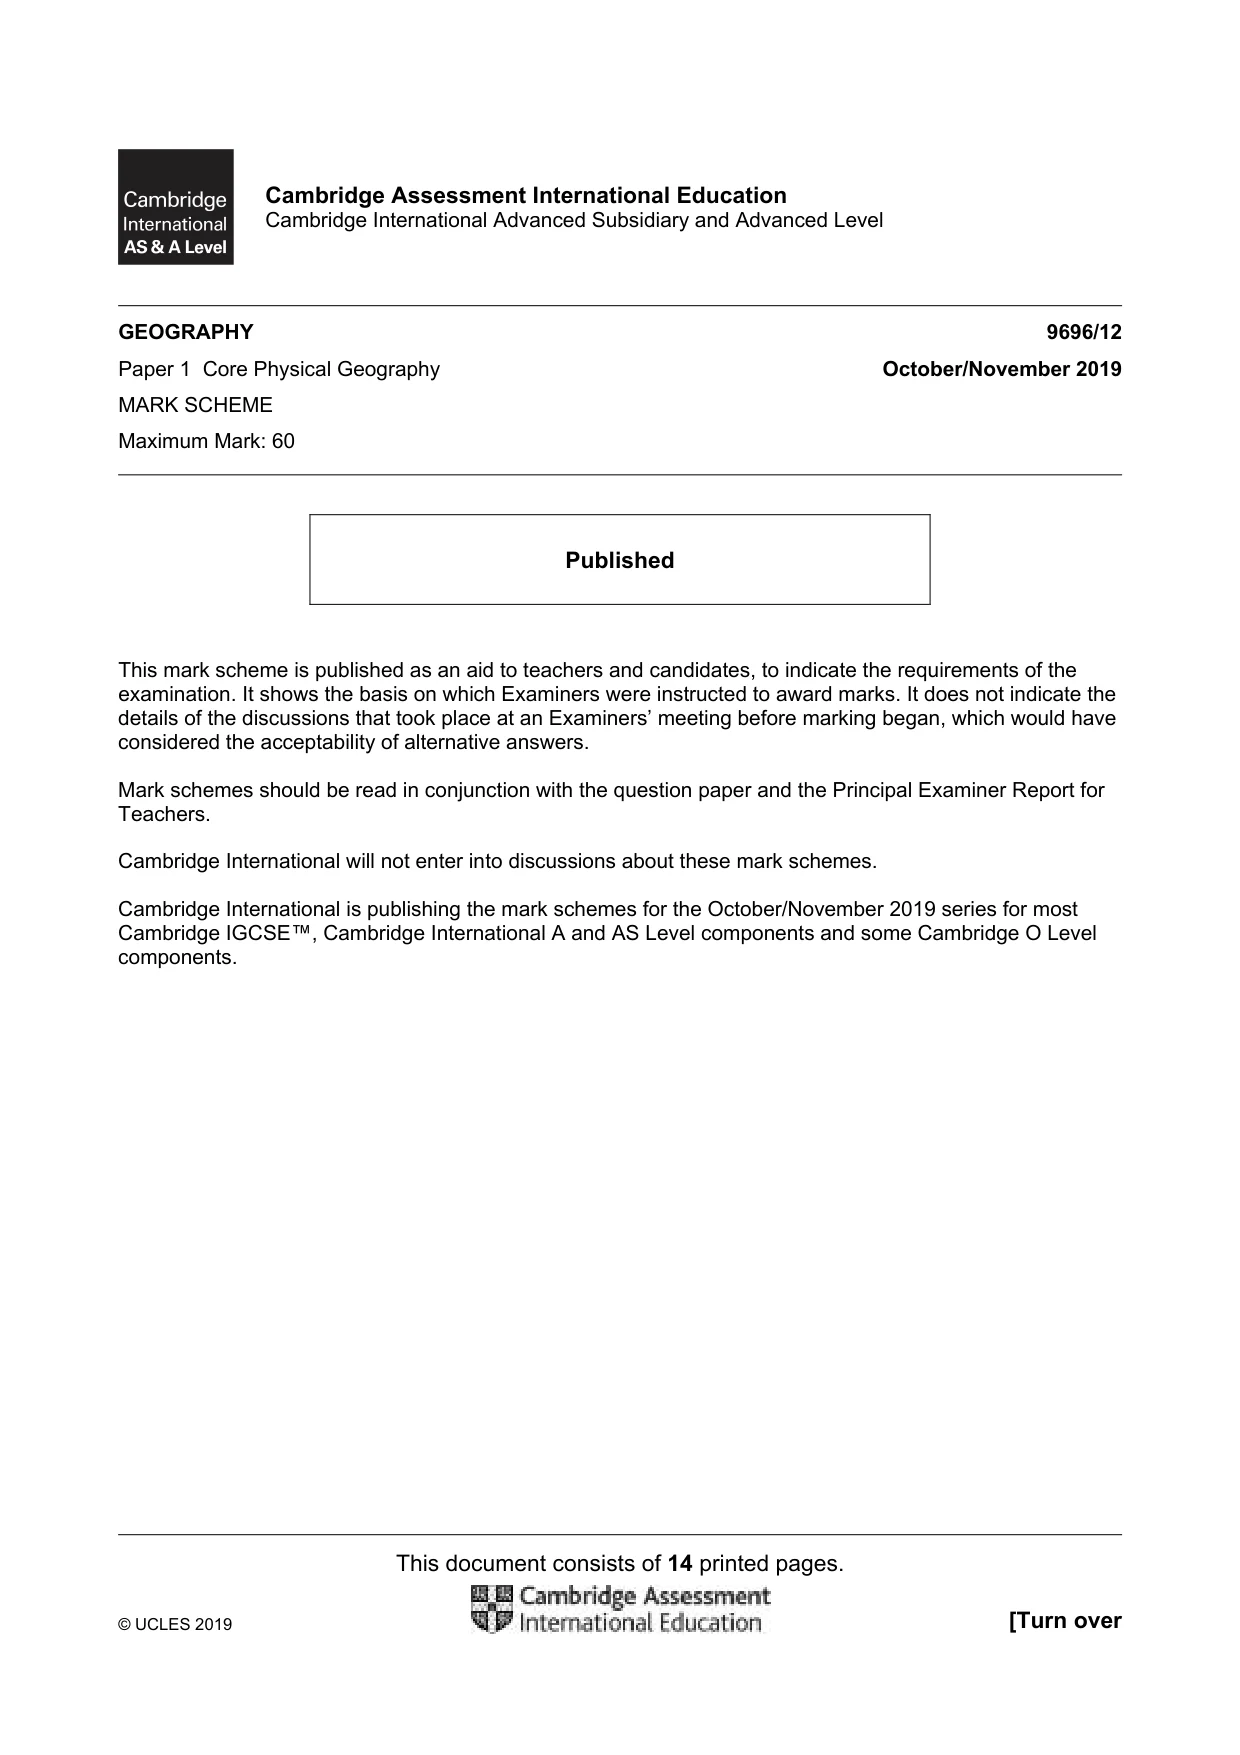
Mark scheme, page 1
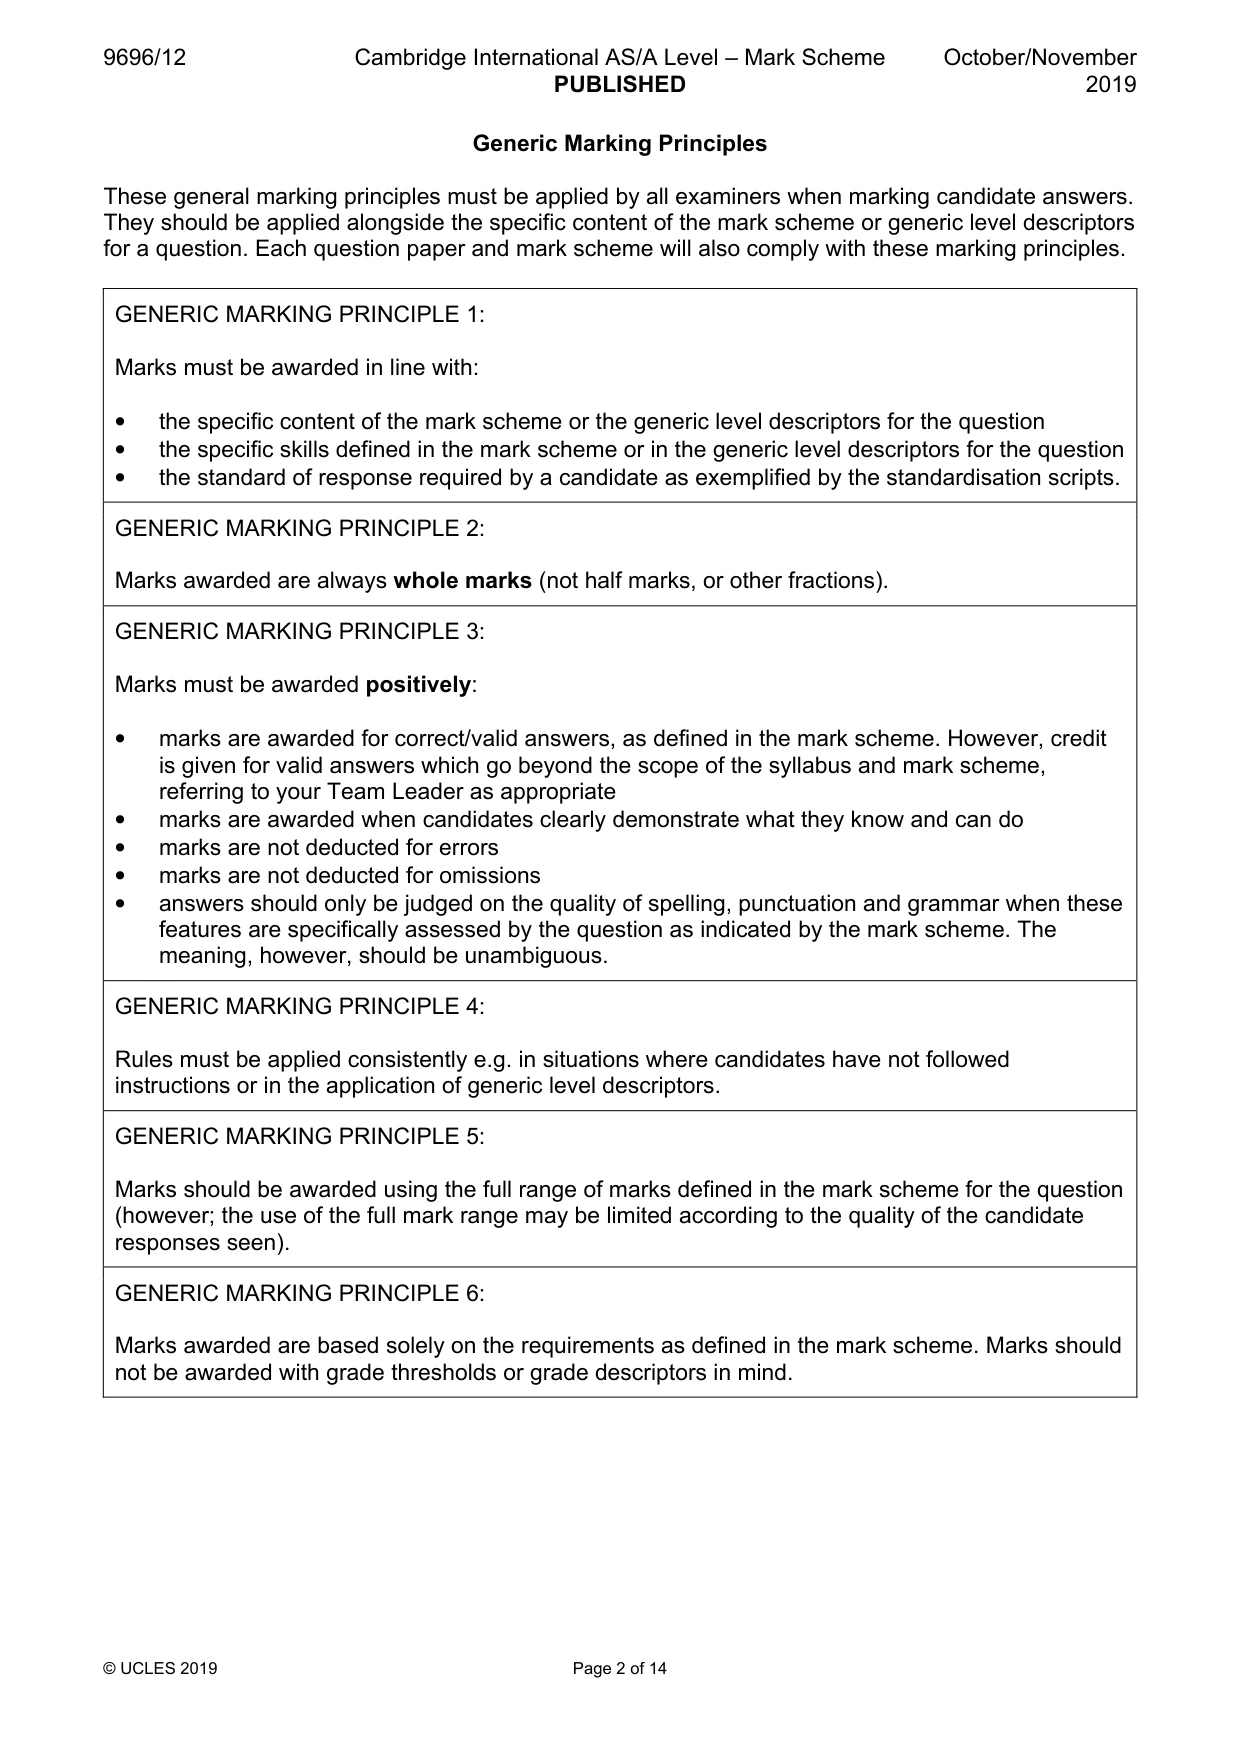
This document consists of 14 printed pages. © UCLES 2019 [Turn over Cambridge Assessment International Education Cambridge International Advanced Subsidiary and Advanced Level GEOGRAPHY 9696/12 Paper 1 Core Physical Geography October/November 2019 MARK SCHEME Maximum Mark: 60 Published This mark scheme is published as an aid to teachers and candidates, to indicate the requirements of the examination. It shows the basis on which Examiners were instructed to award marks. It does not indicate the details of the discussions that took place at an Examiners’ meeting before marking began, which would have considered the acceptability of alternative answers. Mark schemes should be read in conjunction with the question paper and the Principal Examiner Report for Teachers. Cambridge International will not enter into discussions about these mark schemes. Cambridge International is publishing the mark schemes for the October/November 2019 series for most Cambridge IGCSE™, Cambridge International A and AS Level components and some Cambridge O Level components.
Mark scheme, page 2
9696/12 Cambridge International AS/A Level – Mark Scheme PUBLISHED October/November 2019 © UCLES 2019 Page 2 of 14 Generic Marking Principles These general marking principles must be applied by all examiners when marking candidate answers. They should be applied alongside the specific content of the mark scheme or generic level descriptors for a question. Each question paper and mark scheme will also comply with these marking principles. GENERIC MARKING PRINCIPLE 1: Marks must be awarded in line with: • the specific content of the mark scheme or the generic level descriptors for the question • the specific skills defined in the mark scheme or in the generic level descriptors for the question • the standard of response required by a candidate as exemplified by the standardisation scripts. GENERIC MARKING PRINCIPLE 2: Marks awarded are always whole marks (not half marks, or other fractions). GENERIC MARKING PRINCIPLE 3: Marks must be awarded positively: • marks are awarded for correct/valid answers, as defined in the mark scheme. However, credit is given for valid answers which go beyond the scope of the syllabus and mark scheme, referring to your Team Leader as appropriate • marks are awarded when candidates clearly demonstrate what they know and can do • marks are not deducted for errors • marks are not deducted for omissions • answers should only be judged on the quality of spelling, punctuation and grammar when these features are specifically assessed by the question as indicated by the mark scheme. The meaning, however, should be unambiguous. GENERIC MARKING PRINCIPLE 4: Rules must be applied consistently e.g. in situations where candidates have not followed instructions or in the application of generic level descriptors. GENERIC MARKING PRINCIPLE 5: Marks should be awarded using the full range of marks defined in the mark scheme for the question (however; the use of the full mark range may be limited according to the quality of the candidate responses seen). GENERIC MARKING PRINCIPLE 6: Marks awarded are based solely on the requirements as defined in the mark scheme. Marks should not be awarded with grade thresholds or grade descriptors in mind.
Mark scheme, page 3
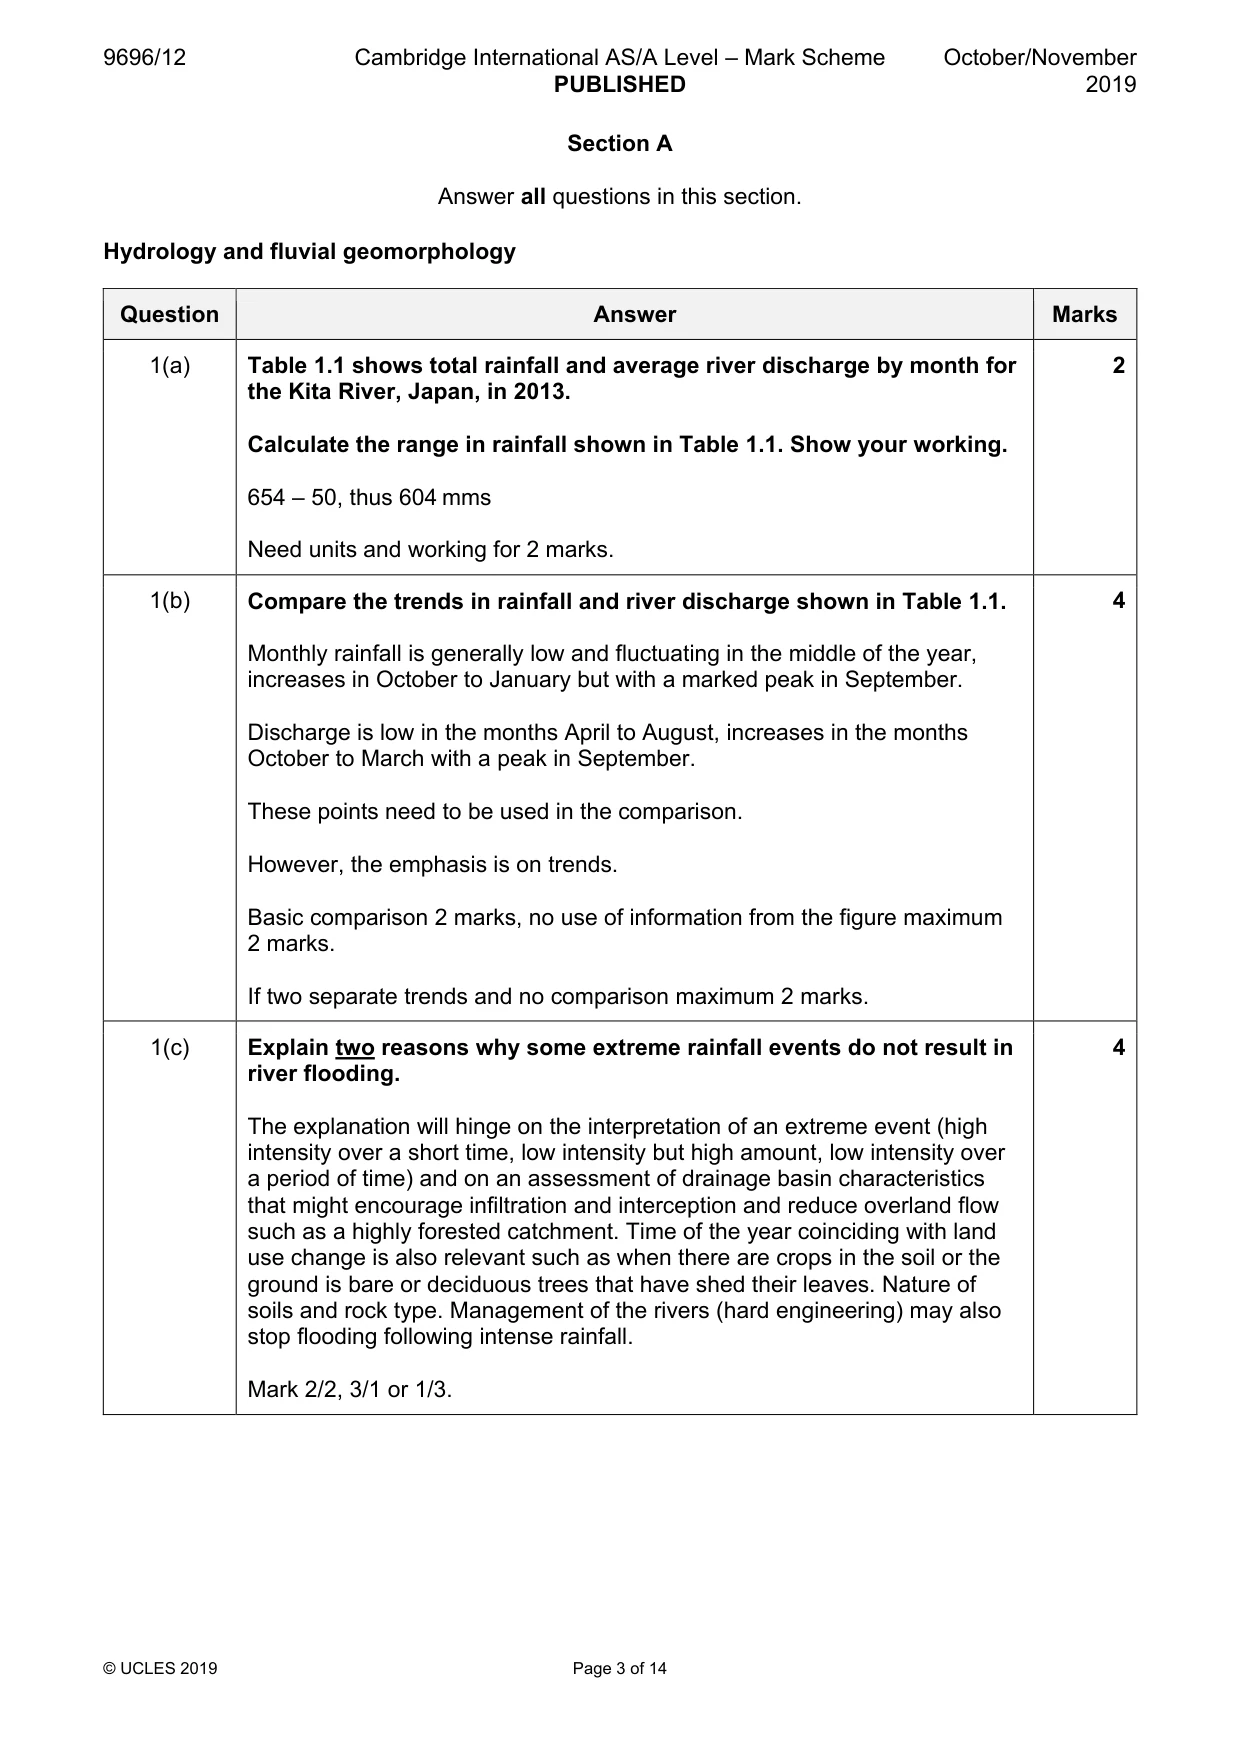
9696/12 Cambridge International AS/A Level – Mark Scheme PUBLISHED October/November 2019 © UCLES 2019 Page 3 of 14 Section A Answer all questions in this section. Hydrology and fluvial geomorphology Question Answer Marks 1(a) Table 1.1 shows total rainfall and average river discharge by month for the Kita River, Japan, in 2013. Calculate the range in rainfall shown in Table 1.1. Show your working. 654 – 50, thus 604 mms Need units and working for 2 marks. 2 1(b) Compare the trends in rainfall and river discharge shown in Table 1.1. Monthly rainfall is generally low and fluctuating in the middle of the year, increases in October to January but with a marked peak in September. Discharge is low in the months April to August, increases in the months October to March with a peak in September. These points need to be used in the comparison. However, the emphasis is on trends. Basic comparison 2 marks, no use of information from the figure maximum 2 marks. If two separate trends and no comparison maximum 2 marks. 4 1(c) Explain two reasons why some extreme rainfall events do not result in river flooding. The explanation will hinge on the interpretation of an extreme event (high intensity over a short time, low intensity but high amount, low intensity over a period of time) and on an assessment of drainage basin characteristics that might encourage infiltration and interception and reduce overland flow such as a highly forested catchment. Time of the year coinciding with land use change is also relevant such as when there are crops in the soil or the ground is bare or deciduous trees that have shed their leaves. Nature of soils and rock type. Management of the rivers (hard engineering) may also stop flooding following intense rainfall. Mark 2/2, 3/1 or 1/3. 4
Mark scheme, page 4
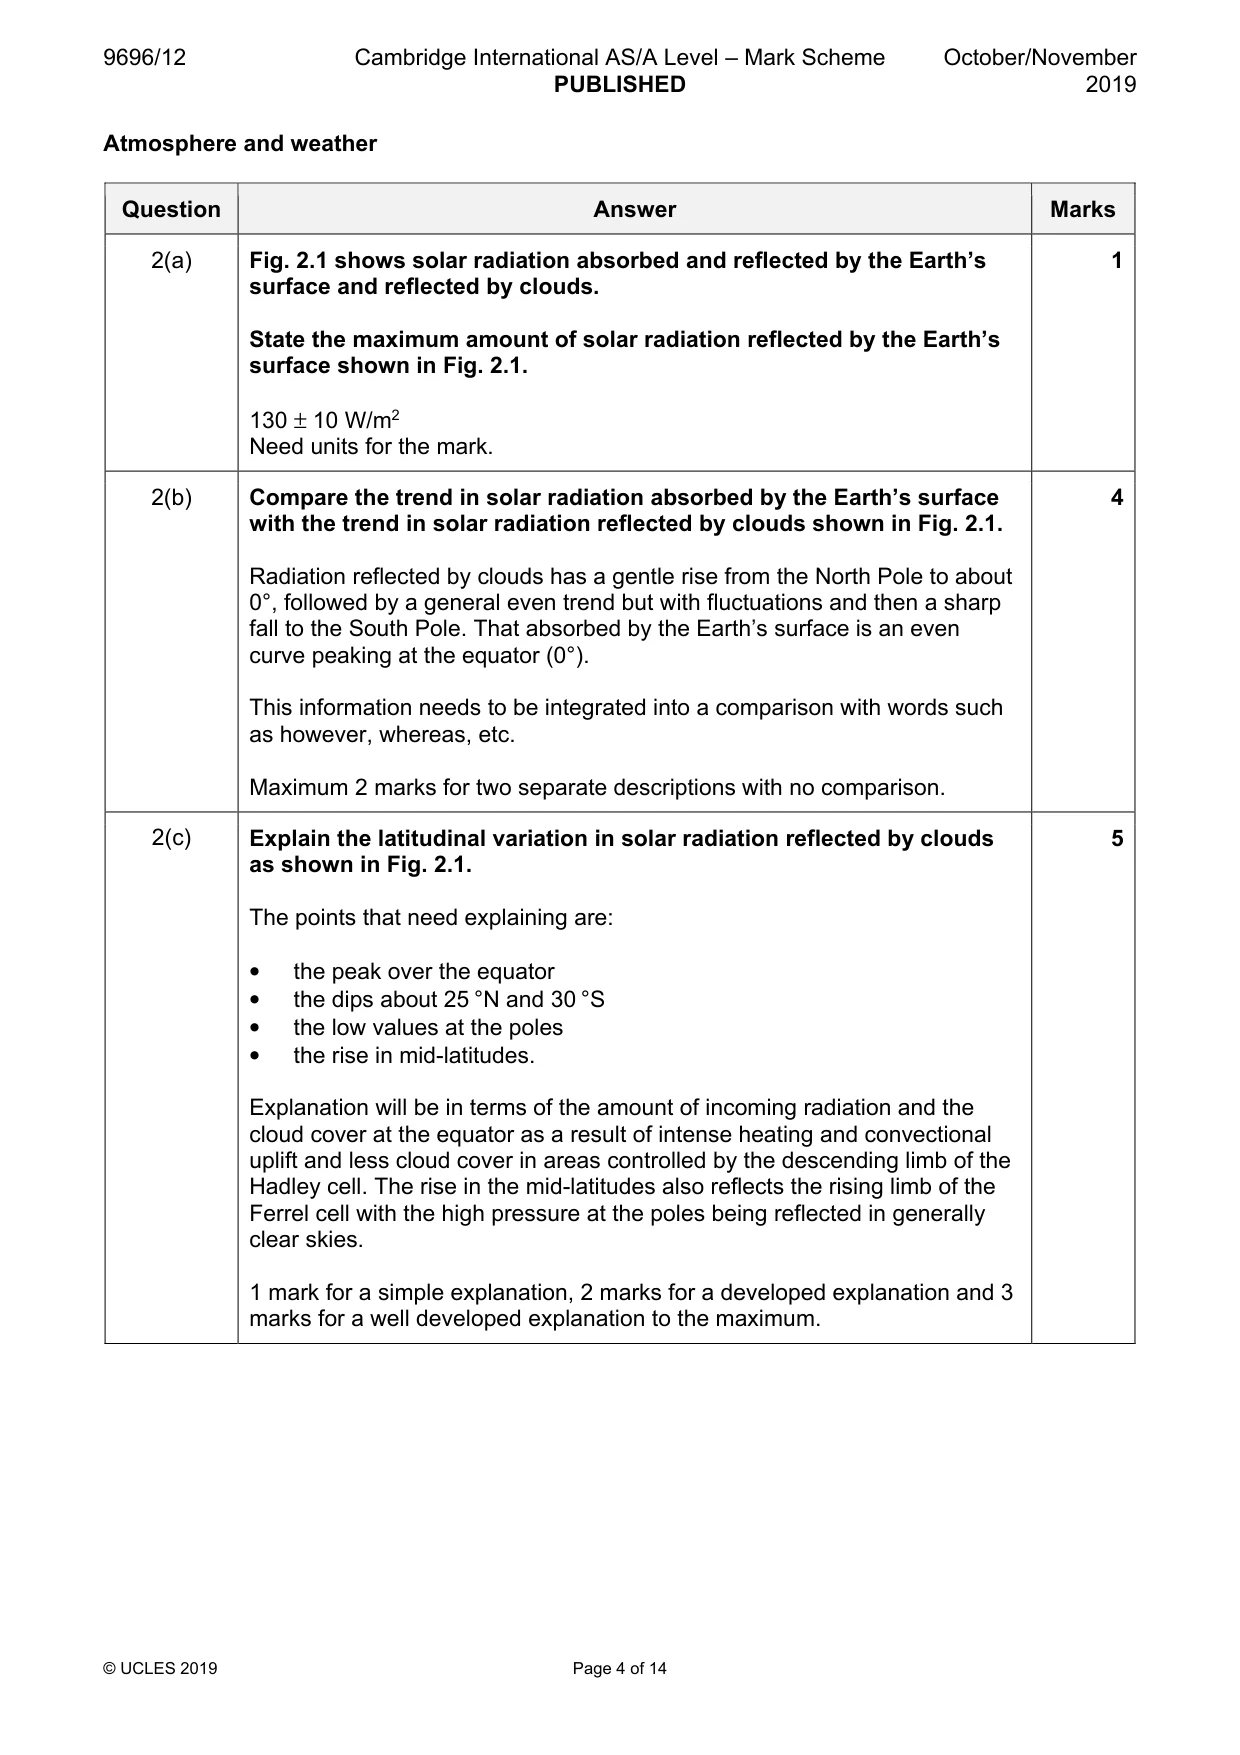
9696/12 Cambridge International AS/A Level – Mark Scheme PUBLISHED October/November 2019 © UCLES 2019 Page 4 of 14 Atmosphere and weather Question Answer Marks 2(a) Fig. 2.1 shows solar radiation absorbed and reflected by the Earth’s surface and reflected by clouds. State the maximum amount of solar radiation reflected by the Earth’s surface shown in Fig. 2.1. 130 ± 10 W/m2 Need units for the mark. 1 2(b) Compare the trend in solar radiation absorbed by the Earth’s surface with the trend in solar radiation reflected by clouds shown in Fig. 2.1. Radiation reflected by clouds has a gentle rise from the North Pole to about 0°, followed by a general even trend but with fluctuations and then a sharp fall to the South Pole. That absorbed by the Earth’s surface is an even curve peaking at the equator (0°). This information needs to be integrated into a comparison with words such as however, whereas, etc. Maximum 2 marks for two separate descriptions with no comparison. 4 2(c) Explain the latitudinal variation in solar radiation reflected by clouds as shown in Fig. 2.1. The points that need explaining are: • the peak over the equator • the dips about 25 °N and 30 °S • the low values at the poles • the rise in mid-latitudes. Explanation will be in terms of the amount of incoming radiation and the cloud cover at the equator as a result of intense heating and convectional uplift and less cloud cover in areas controlled by the descending limb of the Hadley cell. The rise in the mid-latitudes also reflects the rising limb of the Ferrel cell with the high pressure at the poles being reflected in generally clear skies. 1 mark for a simple explanation, 2 marks for a developed explanation and 3 marks for a well developed explanation to the maximum. 5
Mark scheme, page 5
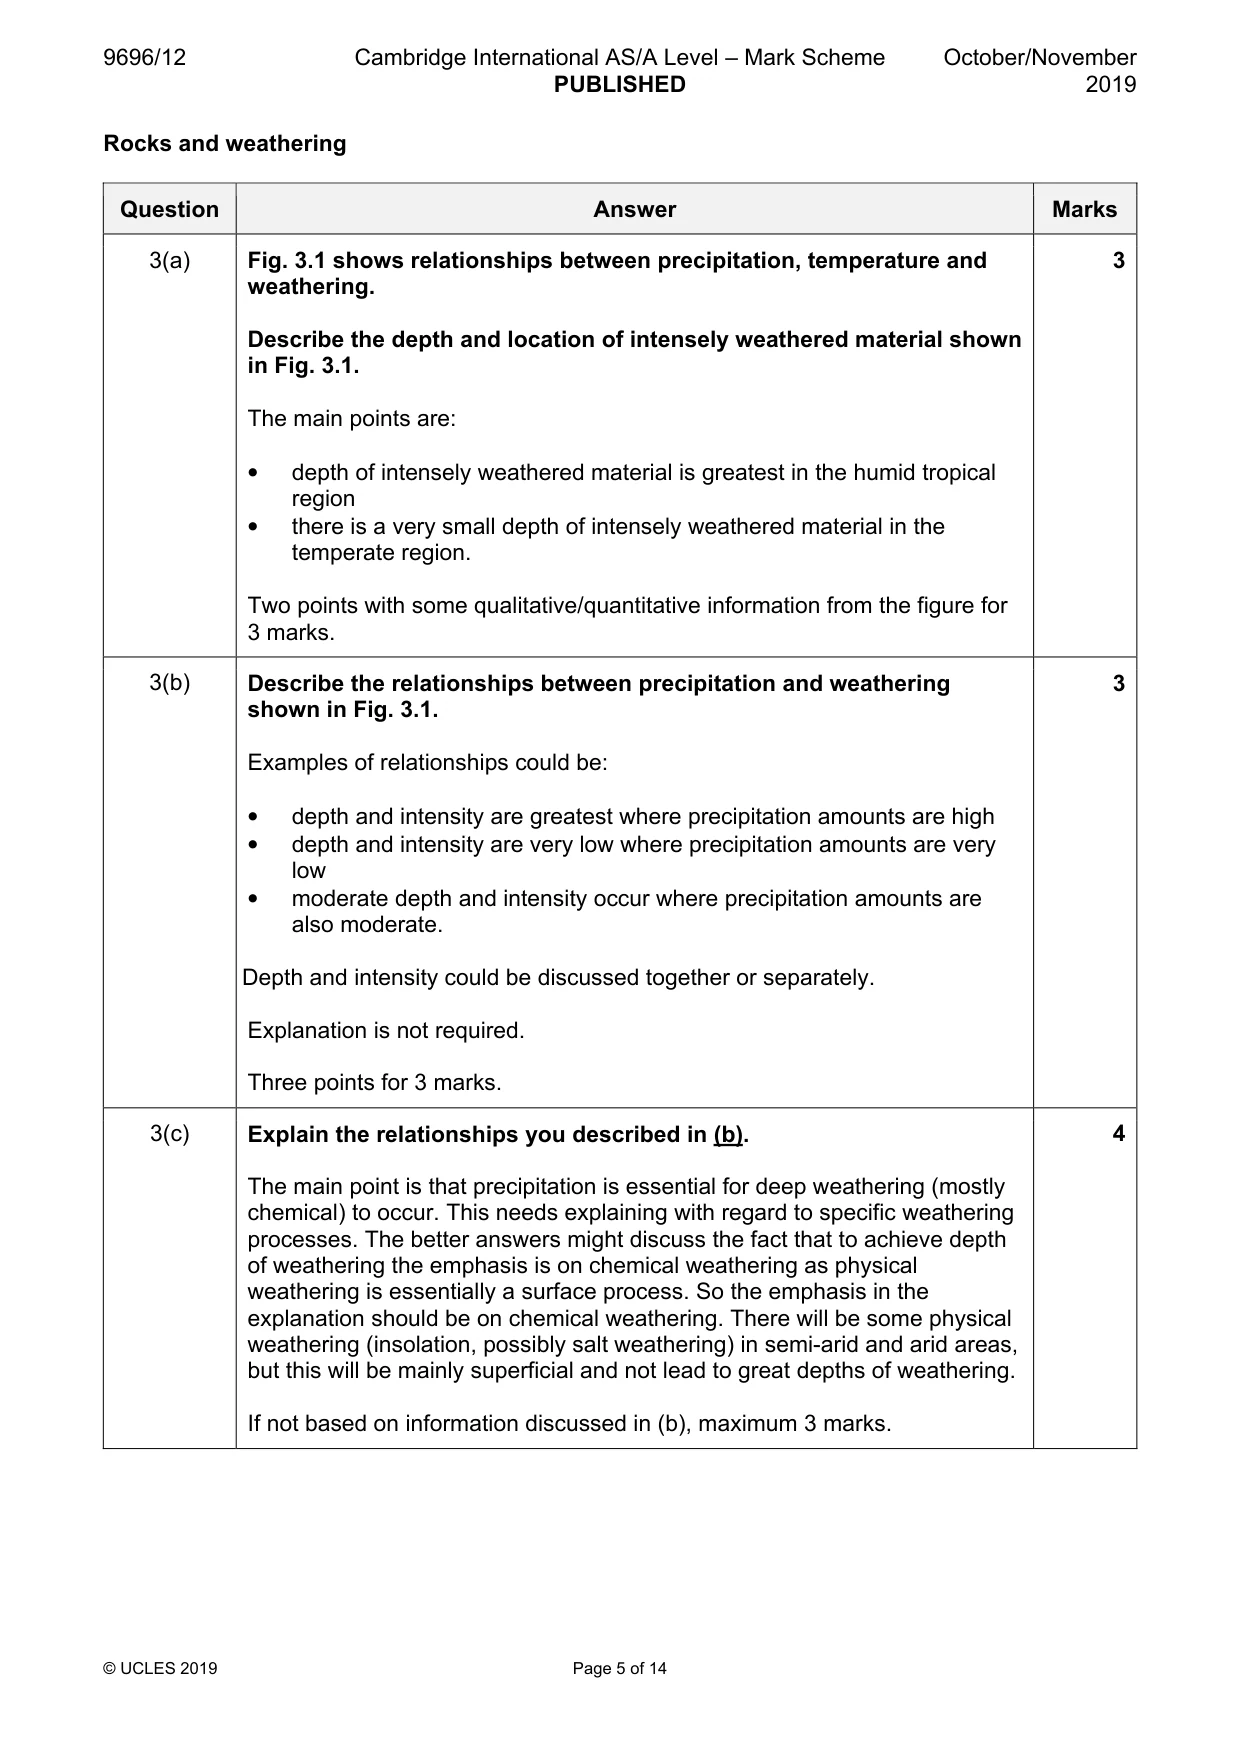
9696/12 Cambridge International AS/A Level – Mark Scheme PUBLISHED October/November 2019 © UCLES 2019 Page 5 of 14 Rocks and weathering Question Answer Marks 3(a) Fig. 3.1 shows relationships between precipitation, temperature and weathering. Describe the depth and location of intensely weathered material shown in Fig. 3.1. The main points are: • depth of intensely weathered material is greatest in the humid tropical region • there is a very small depth of intensely weathered material in the temperate region. Two points with some qualitative/quantitative information from the figure for 3 marks. 3 3(b) Describe the relationships between precipitation and weathering shown in Fig. 3.1. Examples of relationships could be: • depth and intensity are greatest where precipitation amounts are high • depth and intensity are very low where precipitation amounts are very low • moderate depth and intensity occur where precipitation amounts are also moderate. Depth and intensity could be discussed together or separately. Explanation is not required. Three points for 3 marks. 3 3(c) Explain the relationships you described in (b). The main point is that precipitation is essential for deep weathering (mostly chemical) to occur. This needs explaining with regard to specific weathering processes. The better answers might discuss the fact that to achieve depth of weathering the emphasis is on chemical weathering as physical weathering is essentially a surface process. So the emphasis in the explanation should be on chemical weathering. There will be some physical weathering (insolation, possibly salt weathering) in semi-arid and arid areas, but this will be mainly superficial and not lead to great depths of weathering. If not based on information discussed in (b), maximum 3 marks. 4
Mark scheme, page 6
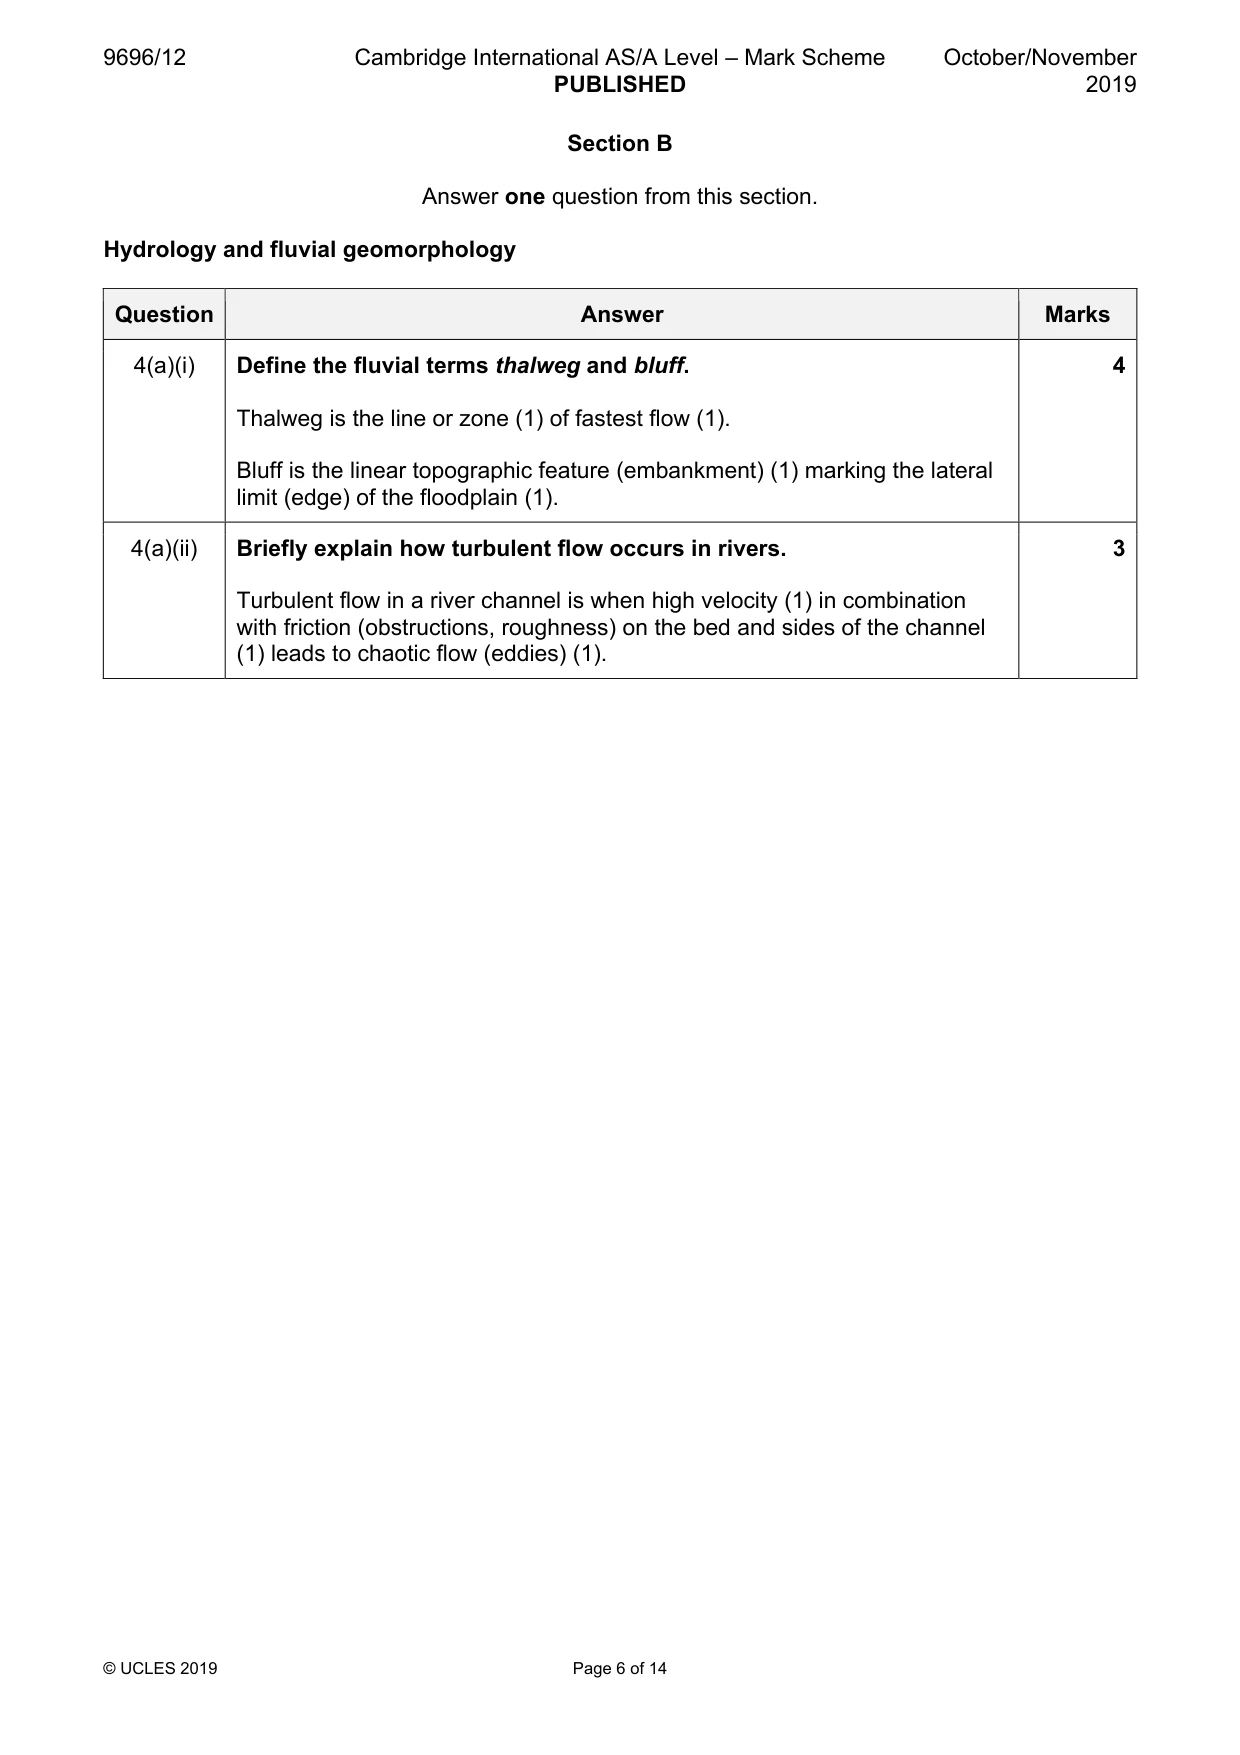
9696/12 Cambridge International AS/A Level – Mark Scheme PUBLISHED October/November 2019 © UCLES 2019 Page 6 of 14 Section B Answer one question from this section. Hydrology and fluvial geomorphology Question Answer Marks 4(a)(i) Define the fluvial terms thalweg and bluff. Thalweg is the line or zone (1) of fastest flow (1). Bluff is the linear topographic feature (embankment) (1) marking the lateral limit (edge) of the floodplain (1). 4 4(a)(ii) Briefly explain how turbulent flow occurs in rivers. Turbulent flow in a river channel is when high velocity (1) in combination with friction (obstructions, roughness) on the bed and sides of the channel (1) leads to chaotic flow (eddies) (1). 3
Mark scheme, page 7
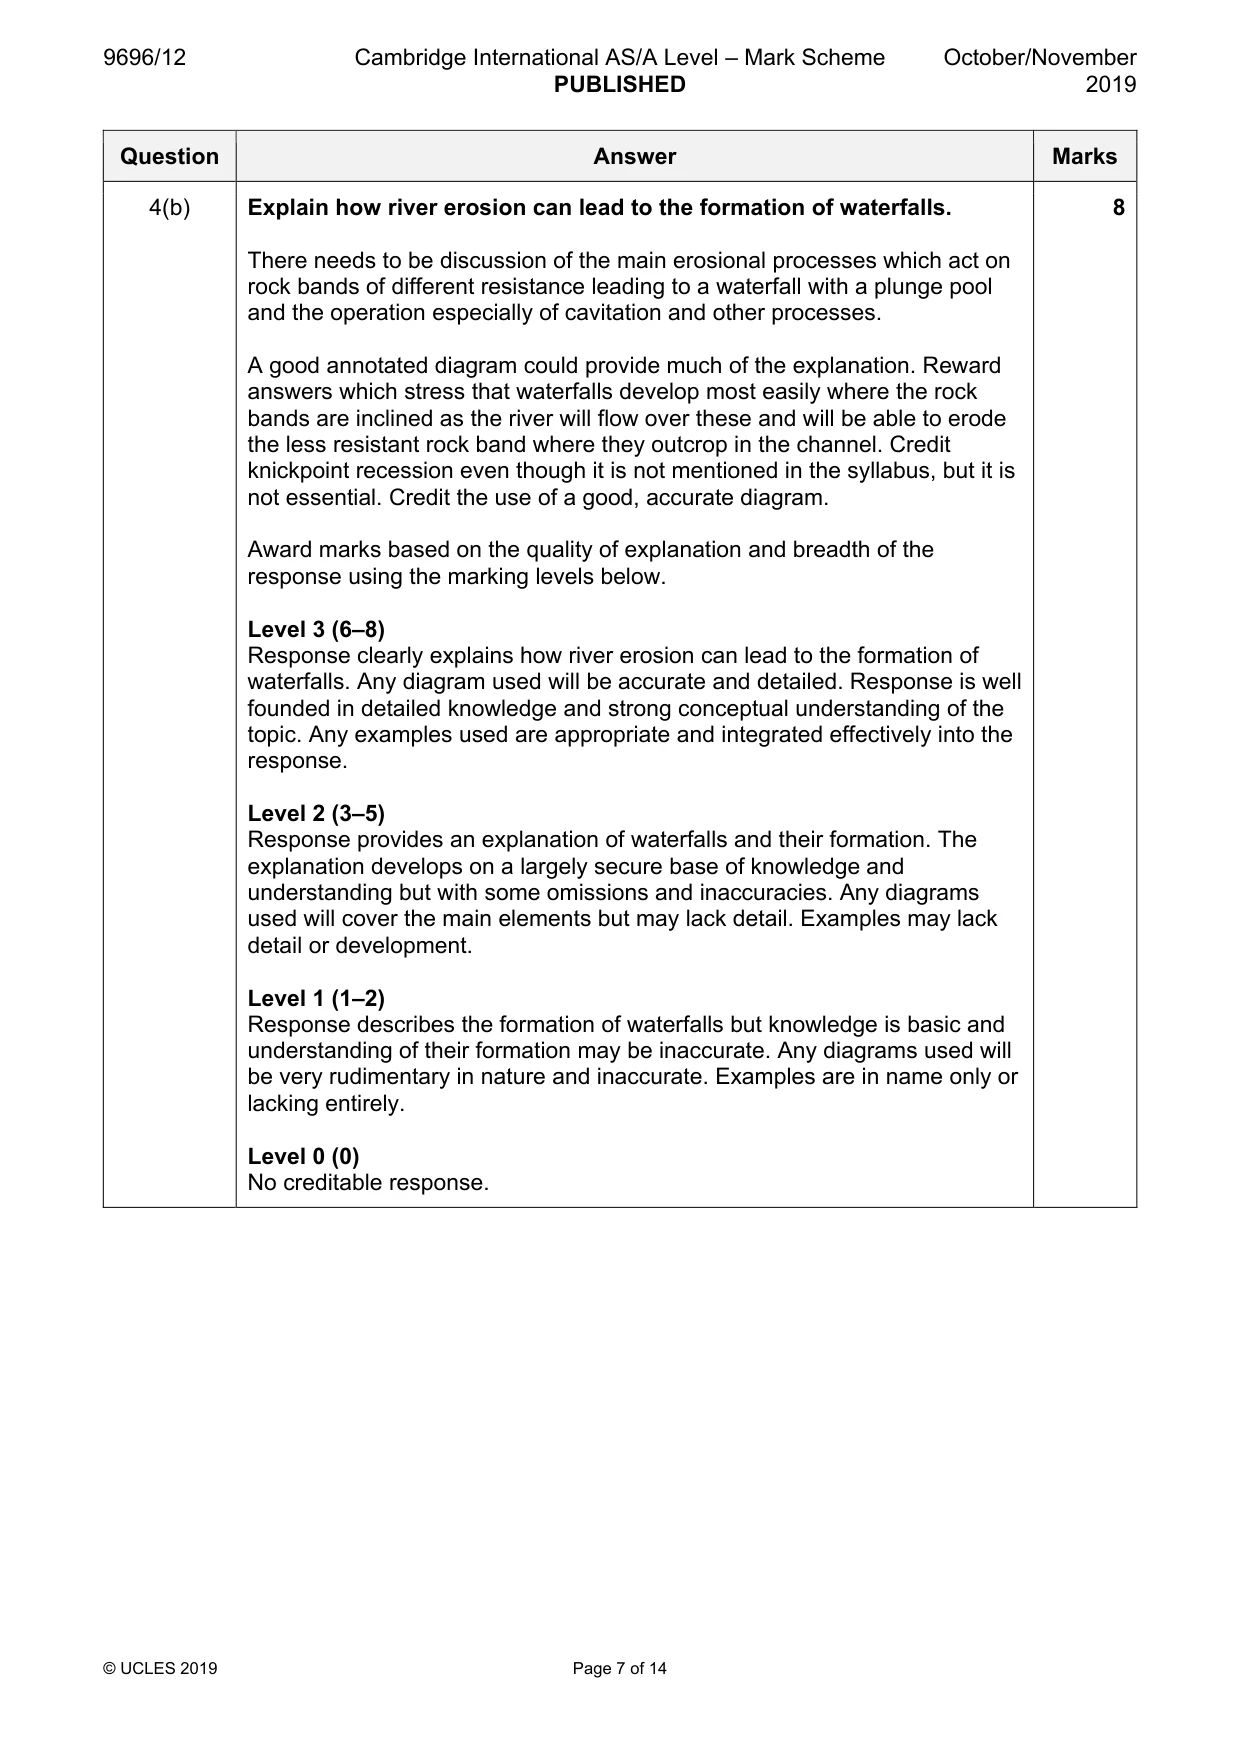
9696/12 Cambridge International AS/A Level – Mark Scheme PUBLISHED October/November 2019 © UCLES 2019 Page 7 of 14 Question Answer Marks 4(b) Explain how river erosion can lead to the formation of waterfalls. There needs to be discussion of the main erosional processes which act on rock bands of different resistance leading to a waterfall with a plunge pool and the operation especially of cavitation and other processes. A good annotated diagram could provide much of the explanation. Reward answers which stress that waterfalls develop most easily where the rock bands are inclined as the river will flow over these and will be able to erode the less resistant rock band where they outcrop in the channel. Credit knickpoint recession even though it is not mentioned in the syllabus, but it is not essential. Credit the use of a good, accurate diagram. Award marks based on the quality of explanation and breadth of the response using the marking levels below. Level 3 (6–8) Response clearly explains how river erosion can lead to the formation of waterfalls. Any diagram used will be accurate and detailed. Response is well founded in detailed knowledge and strong conceptual understanding of the topic. Any examples used are appropriate and integrated effectively into the response. Level 2 (3–5) Response provides an explanation of waterfalls and their formation. The explanation develops on a largely secure base of knowledge and understanding but with some omissions and inaccuracies. Any diagrams used will cover the main elements but may lack detail. Examples may lack detail or development. Level 1 (1–2) Response describes the formation of waterfalls but knowledge is basic and understanding of their formation may be inaccurate. Any diagrams used will be very rudimentary in nature and inaccurate. Examples are in name only or lacking entirely. Level 0 (0) No creditable response. 8
Mark scheme, page 8
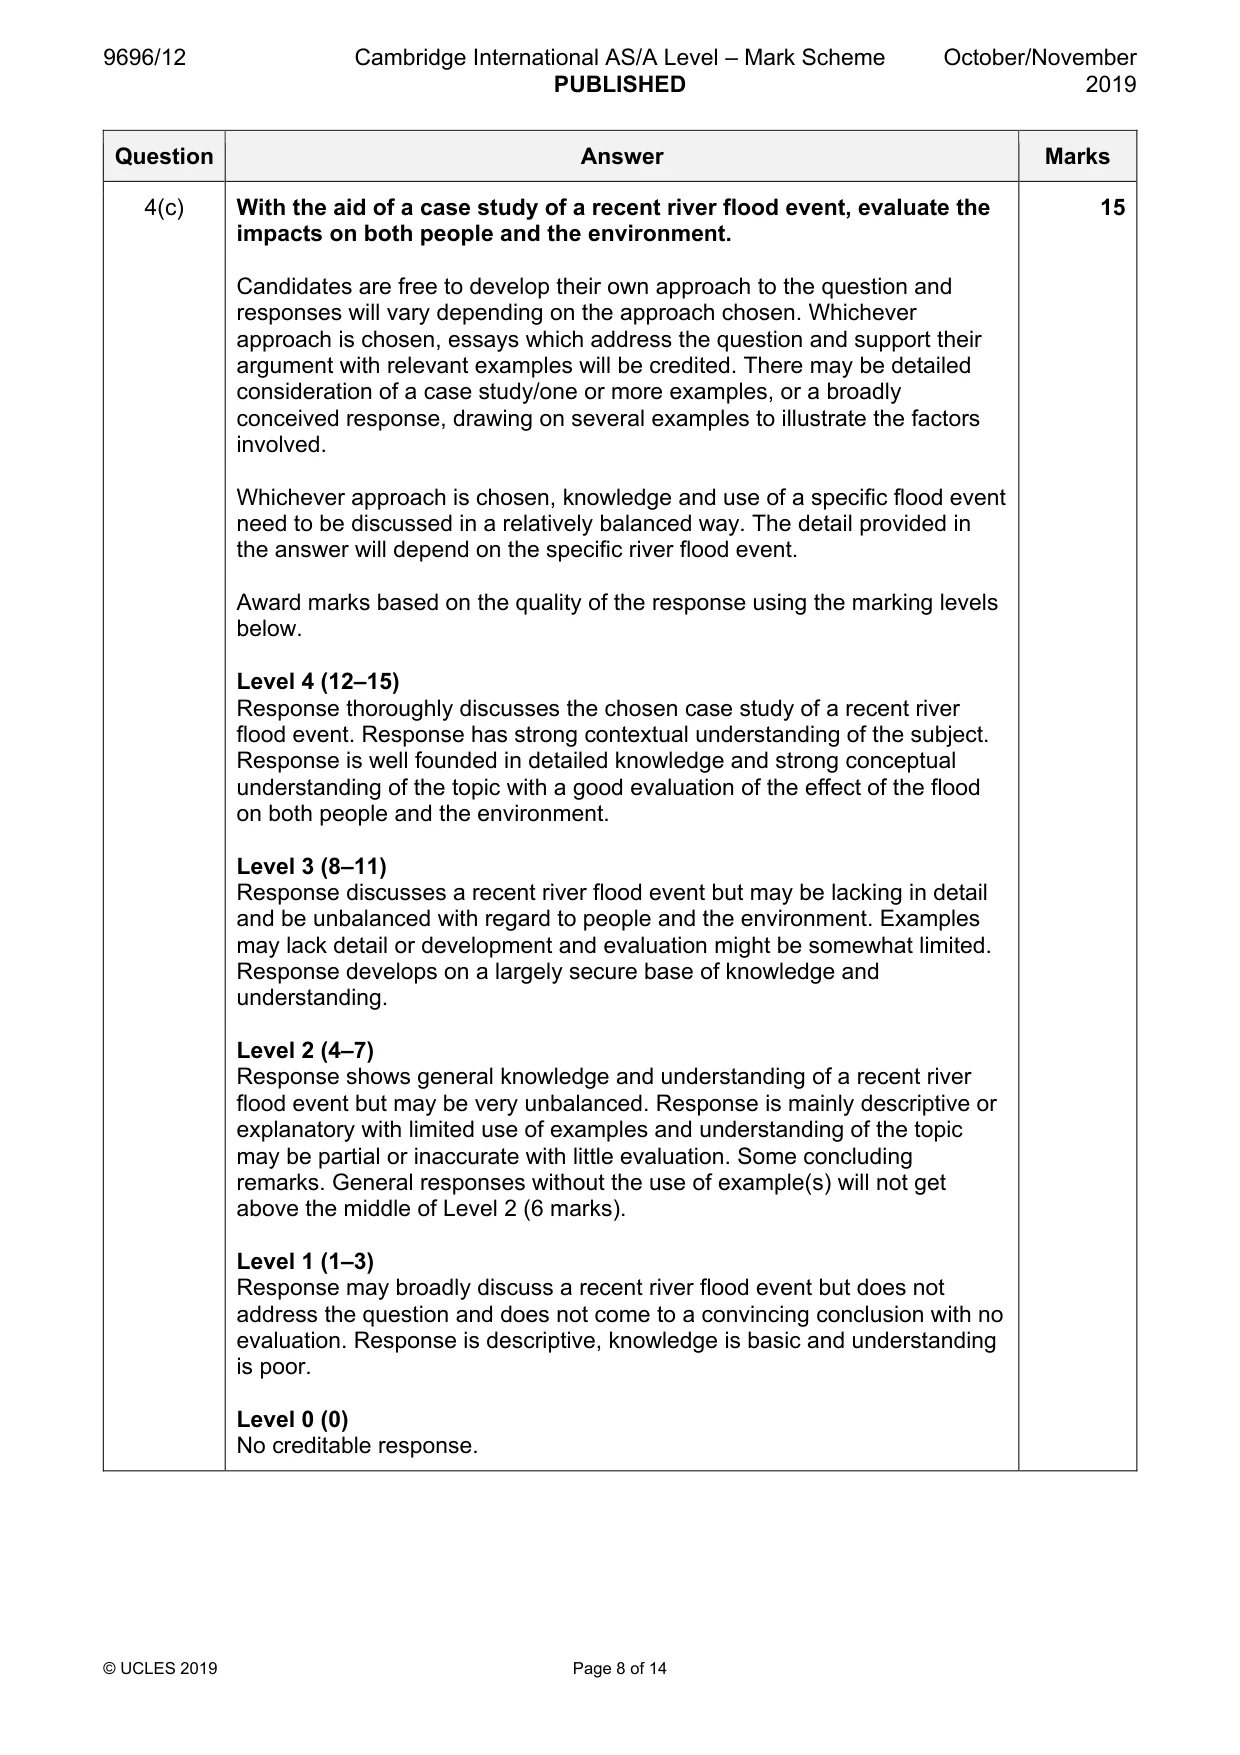
9696/12 Cambridge International AS/A Level – Mark Scheme PUBLISHED October/November 2019 © UCLES 2019 Page 8 of 14 Question Answer Marks 4(c) With the aid of a case study of a recent river flood event, evaluate the impacts on both people and the environment. Candidates are free to develop their own approach to the question and responses will vary depending on the approach chosen. Whichever approach is chosen, essays which address the question and support their argument with relevant examples will be credited. There may be detailed consideration of a case study/one or more examples, or a broadly conceived response, drawing on several examples to illustrate the factors involved. Whichever approach is chosen, knowledge and use of a specific flood event need to be discussed in a relatively balanced way. The detail provided in the answer will depend on the specific river flood event. Award marks based on the quality of the response using the marking levels below. Level 4 (12–15) Response thoroughly discusses the chosen case study of a recent river flood event. Response has strong contextual understanding of the subject. Response is well founded in detailed knowledge and strong conceptual understanding of the topic with a good evaluation of the effect of the flood on both people and the environment. Level 3 (8–11) Response discusses a recent river flood event but may be lacking in detail and be unbalanced with regard to people and the environment. Examples may lack detail or development and evaluation might be somewhat limited. Response develops on a largely secure base of knowledge and understanding. Level 2 (4–7) Response shows general knowledge and understanding of a recent river flood event but may be very unbalanced. Response is mainly descriptive or explanatory with limited use of examples and understanding of the topic may be partial or inaccurate with little evaluation. Some concluding remarks. General responses without the use of example(s) will not get above the middle of Level 2 (6 marks). Level 1 (1–3) Response may broadly discuss a recent river flood event but does not address the question and does not come to a convincing conclusion with no evaluation. Response is descriptive, knowledge is basic and understanding is poor. Level 0 (0) No creditable response. 15
Mark scheme, page 9
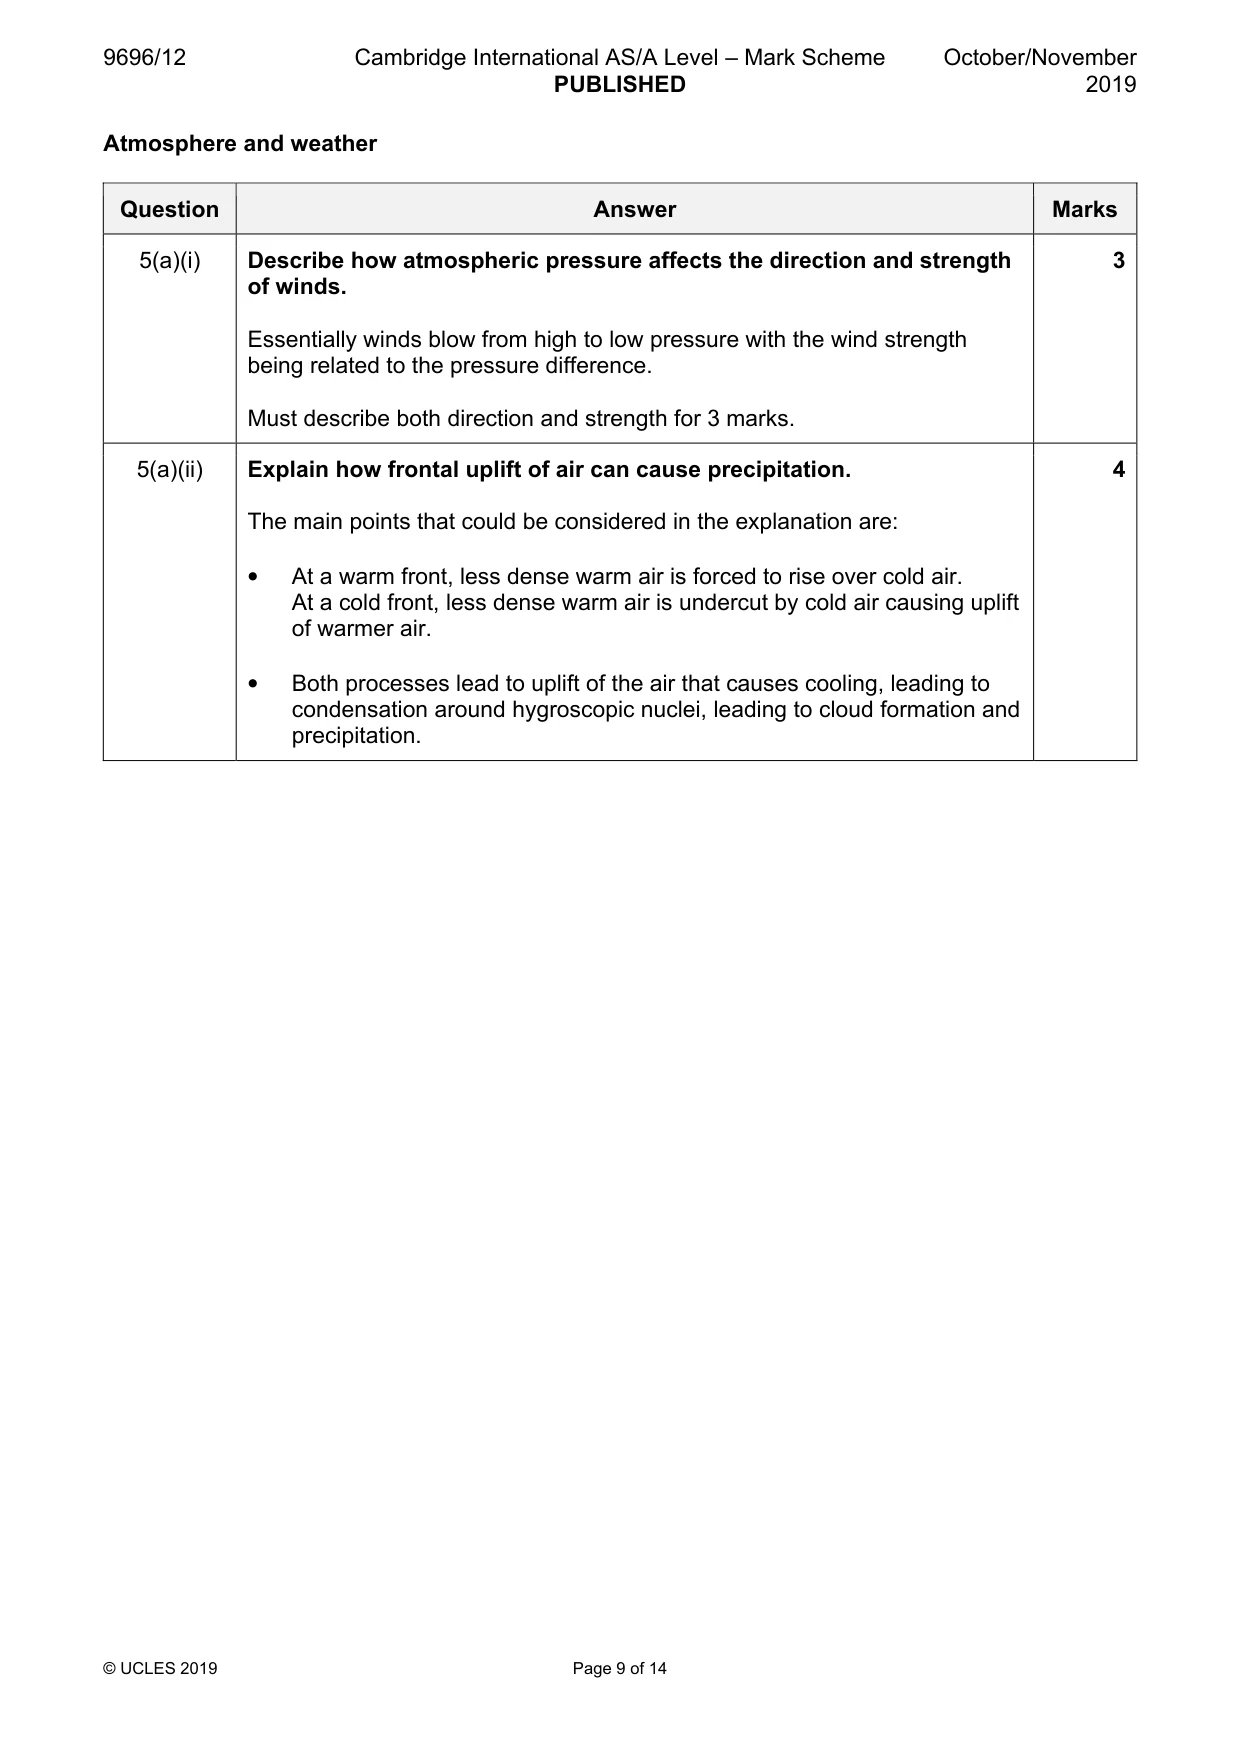
9696/12 Cambridge International AS/A Level – Mark Scheme PUBLISHED October/November 2019 © UCLES 2019 Page 9 of 14 Atmosphere and weather Question Answer Marks 5(a)(i) Describe how atmospheric pressure affects the direction and strength of winds. Essentially winds blow from high to low pressure with the wind strength being related to the pressure difference. Must describe both direction and strength for 3 marks. 3 5(a)(ii) Explain how frontal uplift of air can cause precipitation. The main points that could be considered in the explanation are: • At a warm front, less dense warm air is forced to rise over cold air. At a cold front, less dense warm air is undercut by cold air causing uplift of warmer air. • Both processes lead to uplift of the air that causes cooling, leading to condensation around hygroscopic nuclei, leading to cloud formation and precipitation. 4
Mark scheme, page 10
9696/12 Cambridge International AS/A Level – Mark Scheme PUBLISHED October/November 2019 © UCLES 2019 Page 10 of 14 Question Answer Marks 5(b) Explain the development of an urban heat island. Urban areas are hotter than surrounding areas because of the heat emitted by transport, industry and infrastructure in general. The albedo effect of the relatively dark surfaces in urban areas also leads to absorption of solar radiation and its release at night. There might be discussion of pollution domes which trap outgoing infrared radiation. Award marks based on the quality of explanation and breadth of the response using the marking levels below. Level 3 (6–8) Response describes the nature and explains the development of an urban heat island. Response is well founded in detailed knowledge and strong conceptual understanding of the topic. Any examples used are appropriate and integrated effectively into the response. Level 2 (3–5) Response describes the nature and explains the development of an urban heat island but will be unbalanced with omissions and inaccuracies. Response develops on a largely secure base of knowledge and understanding. Examples may lack detail or development. Level 1 (1–2) Response describes the nature and development of an urban heat island but will be unbalanced with omissions and inaccuracies. Knowledge is basic and understanding may be inaccurate. Examples are in name only or lacking entirely. Level 0 (0) No creditable response. 8
Mark scheme, page 11
9696/12 Cambridge International AS/A Level – Mark Scheme PUBLISHED October/November 2019 © UCLES 2019 Page 11 of 14 Question Answer Marks 5(c) ‘Ocean currents are as important as winds in transferring global heat energy.’ With the aid of examples, how far do you agree? Candidates are free to develop their own approach to the question and responses will vary depending on the approach chosen. Whichever approach is chosen, essays that address the question and support their argument with relevant examples will be credited. There may be detailed consideration of a case study/one or more examples, or a broadly conceived response, drawing on several examples to illustrate the factors involved. There needs to be a discussion of the way that heat energy is transferred globally with a comparison between the role of ocean currents and wind systems. Discussion of the tri-cellular model will probably feature with the effects of wind patterns, such as trade winds. Award marks based on the quality of the response using the marking levels below. Level 4 (12–15) Response thoroughly discusses the complex nature of the transference of global heat energy by ocean currents and winds. Response is well founded in detailed knowledge and strong conceptual understanding of the topic. There is a good evaluation of the statement. Level 3 (8–11) Response discusses the nature of global heat energy transfer by ocean currents and winds but discussion may be unbalanced with regard to either ocean currents or wind systems. Examples may lack detail or development and evaluation may be limited. Response develops on a largely secure base of knowledge and understanding. Level 2 (4–7) Response shows general knowledge and understanding of global heat energy transfer. Response is mainly descriptive or explanatory with limited use of examples and understanding of the topic may be partial or inaccurate. Some concluding remarks. General responses without the use of example(s) will not get above the middle of Level 2 (6 marks). Level 1 (1–3) Response may broadly discuss global heat energy transfer but does not address the question and does not come to a convincing conclusion. Response is descriptive, knowledge is basic and understanding is poor. Level 0 (0) No creditable response. 15
Mark scheme, page 12
9696/12 Cambridge International AS/A Level – Mark Scheme PUBLISHED October/November 2019 © UCLES 2019 Page 12 of 14 Rocks and weathering Question Answer Marks 6(a)(i) Define the terms heave and slide as they apply to mass movement on slopes. Heave is the lifting of soil particles out of the slope (1) followed by a drop to the surface (1). Slide is the movement of material downhill along a slide (shear) plane (1) en masse with no internal deformation (1). 4 6(a)(ii) Briefly explain how rills form on slopes. Rills are small networks of shallow channels (1) created by thin, concentrated flows of water (1), the result of infiltration capacity being exceeded (1). 3
Mark scheme, page 13
9696/12 Cambridge International AS/A Level – Mark Scheme PUBLISHED October/November 2019 © UCLES 2019 Page 13 of 14 Question Answer Marks 6(b) Explain how fold mountains are formed at convergent tectonic plate boundaries. Convergent plate boundaries include destructive and collision margins. The mechanism of mountain formation is different at each. At destructive margins, as the oceanic plate is subducted, marine sediments are scraped off (accretionary wedge) onto the continental plate and uplifted to form fold mountains. At collision margins there is no subduction but one continental plate is thrust under the other, causing uplift and the creation of mountains. The Himalaya will probably be used as an example, but it needs to be remembered that the Himalaya were mostly formed when the plates were separated by the Tethys Sea and subduction did occur. This created the folding now seen in the uplifted Himalayan mountains. The current folding that is occurring in the foothills of the Himalaya are the result of great depth of alluvial sediments on the Ganges floodplain being crushed against the main Himalayan mass. Credit the use of a relevant and accurate diagram. Award marks based on the quality of explanation and breadth of the response using the marking levels below. Level 3 (6–8) Response thoroughly explains how fold mountains are formed at convergent plate boundaries. Any diagrams are detailed and accurate. Response is well founded in detailed knowledge and strong conceptual understanding of the topic. Any examples used are appropriate and integrated effectively into the response. Level 2 (3–5) Response explains the formation of fold mountains at convergent plate boundaries. Response develops on a largely secure base of knowledge and understanding but may lack detail and contain some inaccuracies. Examples may lack detail or development. Level 1 (1–2) Response describes the formation of fold mountains at convergent plate boundaries. Knowledge is basic and understanding may be inaccurate. Examples are in name only or lacking entirely. Level 0 (0) No creditable response. 8
Mark scheme, page 14
9696/12 Cambridge International AS/A Level – Mark Scheme PUBLISHED October/November 2019 © UCLES 2019 Page 14 of 14 Question Answer Marks 6(c) With the aid of examples, discuss the view that human activity is the main factor affecting the stability of slopes. Candidates are free to develop their own approach to the question and responses will vary depending on the approach chosen. Whichever approach is chosen, essays which address the question and support their argument with relevant examples will be credited. There may be detailed consideration of a case study/one or more examples, or a broadly conceived response, drawing on several examples to illustrate the factors involved. This needs a discussion of the factors that affect the stability of slopes. Factors both natural and human affecting stability need to be assessed. There is a need for explanation rather than description. Thus simply mentioning buildings adding pressure to slopes without explaining why this affects stability will get little credit. Human activity can both increase and decrease slope stability. Award marks based on the quality of the response using the marking levels below. Level 4 (12–15) Response thoroughly discusses the complex nature of slope stability and the factors that affect it. Response is well founded in detailed knowledge and strong conceptual understanding of the topic. Level 3 (8–11) Response discusses the complex nature of slope stability but may be unbalanced. Examples may lack detail or development. Response develops on a largely secure base of knowledge and understanding. Level 2 (4–7) Response shows general knowledge and understanding of factors affecting slope stability. Response is mainly descriptive or explanatory with limited use of examples and understanding of the topic may be partial or inaccurate. Some concluding remarks. General responses without the use of example(s) will not get above the middle of Level 2 (6 marks). Level 1 (1–3) Response may broadly discuss slope stability but does not address the question and does not come to a convincing conclusion. Response is descriptive, knowledge is basic and understanding is poor. Level 0 (0) No creditable response. 15
What you needed in this session
Cambridge’s own grade thresholds for 2019 Oct/Nov, Paper 1 · Variant 2. A higher threshold means an easier paper — the bar moves with how the cohort did.