Cambridge A Level Environmental Management (AS only) 8291 — 2018 May/June Paper 1 · Variant 3
8291/13/M/J/18 · 80 marks · ≈90 min
The question paper and its mark scheme, free to read here and free to download. This is Cambridge’s own paper, exactly as it was sat.
Question paper12 pages
Mark scheme14 pages
Answers below. Sit the paper first if you are practising.
Paper as text
Question paper, page 1
* 5 4 5 0 6 9 4 3 3 0 * This document consists of 12 printed pages. DC (LEG) 163278 © UCLES 2018 [Turn over Cambridge International Examinations Cambridge International Advanced Subsidiary Level ENVIRONMENTAL MANAGEMENT 8291/13 Paper 1 Lithosphere and Atmosphere May/June 2018 1 hour 30 minutes Additional Materials: Answer Booklet/Paper READ THESE INSTRUCTIONS FIRST Write your Centre number, candidate number and name on all the work you hand in. Write in dark blue or black pen. You may use an HB pencil for any diagrams or graphs. Do not use staples, paper clips, glue or correction fluid. DO NOT WRITE IN ANY BARCODES. Electronic calculators may be used. You may lose marks if you do not show your working or if you do not use appropriate units. Section A Answer all questions in this section. Write your answers in the spaces provided on the question paper. Section B Answer one question from this section. Write your answers on the separate answer paper provided. At the end of the examination, 1. fasten all separate answer paper securely to the question paper; 2. enter the question number from Section B in the grid. For Examiner’s Use Section A 1 2 Section B Total
Question paper, page 2
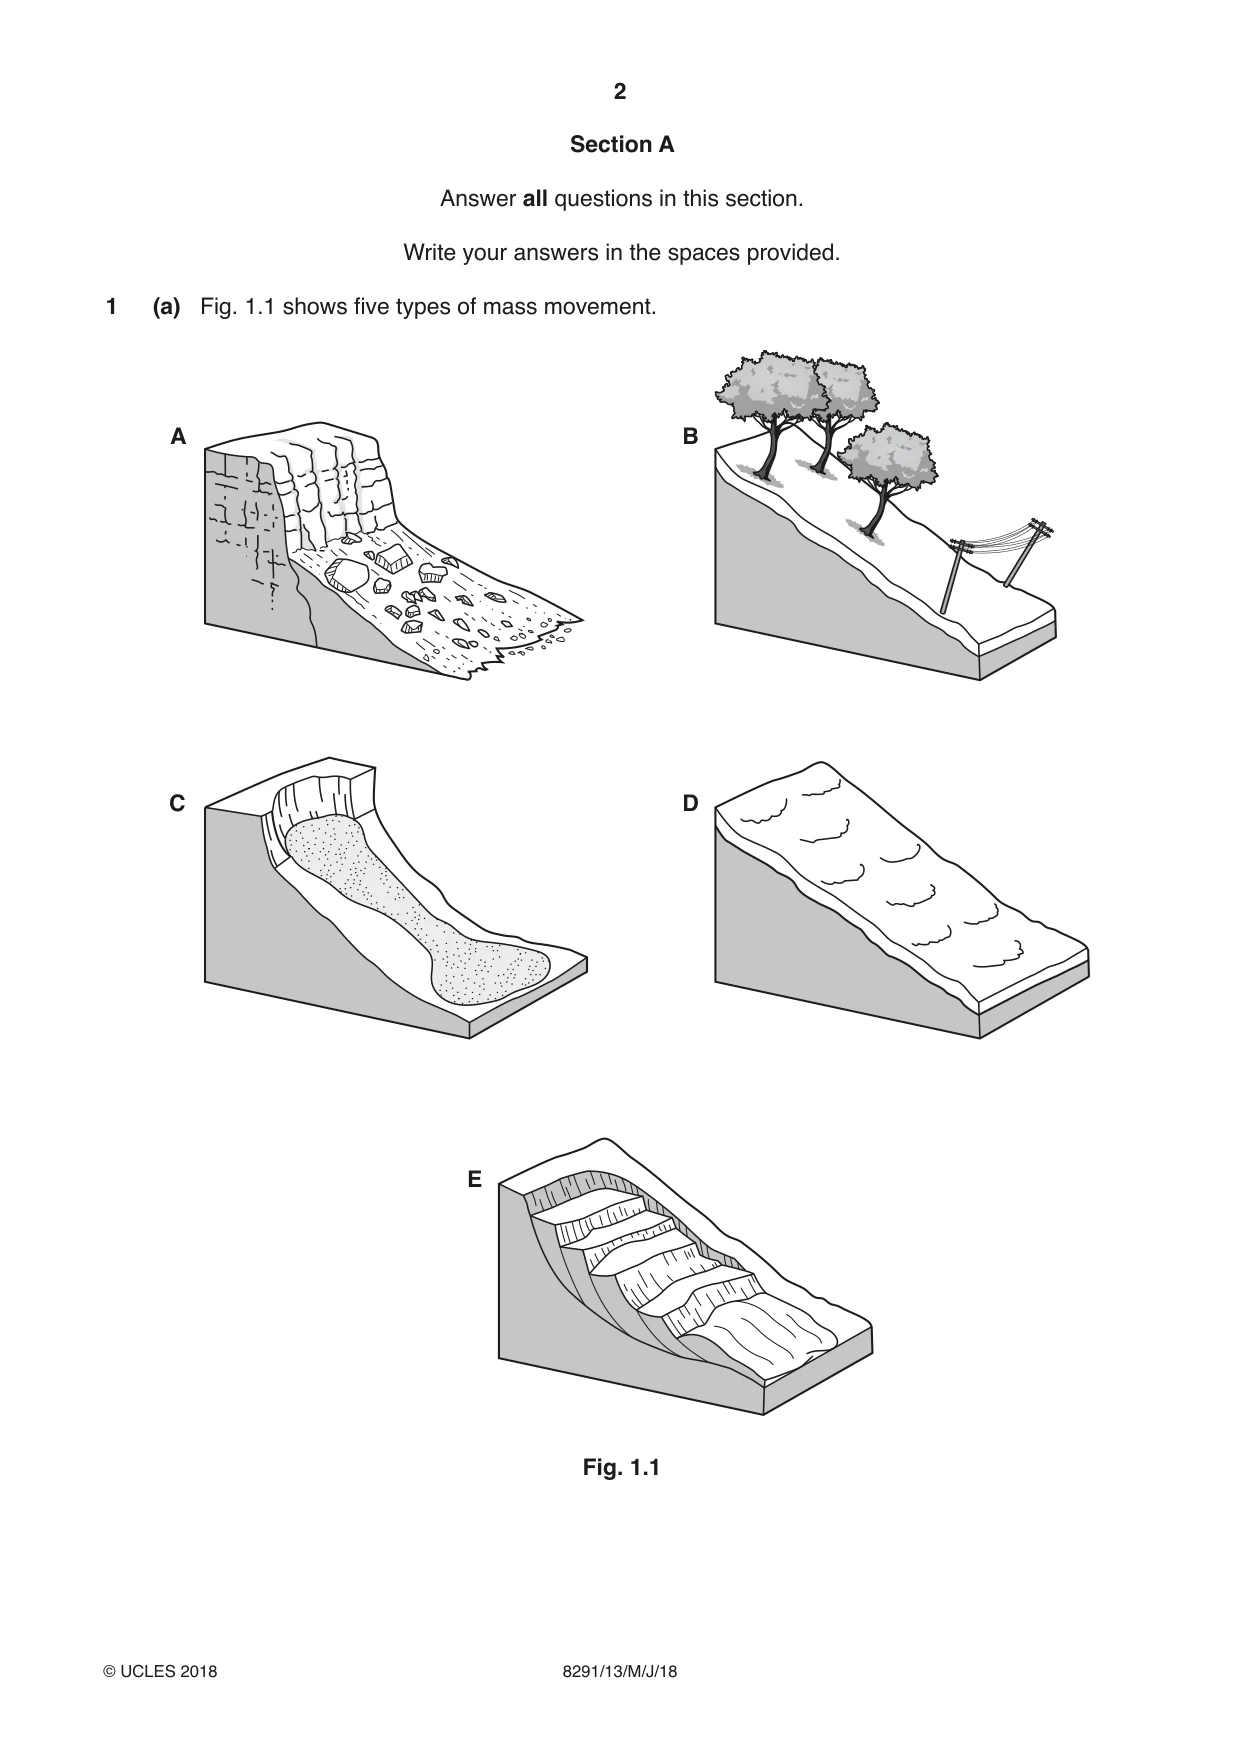
2 8291/13/M/J/18 © UCLES 2018 Section A Answer all questions in this section. Write your answers in the spaces provided. 1 (a) Fig. 1.1 shows five types of mass movement. A B C D E Fig. 1.1
Question paper, page 3
3 8291/13/M/J/18 © UCLES 2018 [Turn over (i) Complete Table 1.1 by matching each of the diagrams, labelled A to E, to one type of mass movement. Table 1.1 type of mass movement letter mudflow rock fall rotational slump soil creep solifluction [3] (ii) State which type of mass movement listed in Table 1.1 would not occur in a warm climate. …[1] (iii) With reference to Fig. 1.1, explain the role of water in mass movements. … … … … … …[3]
Question paper, page 4
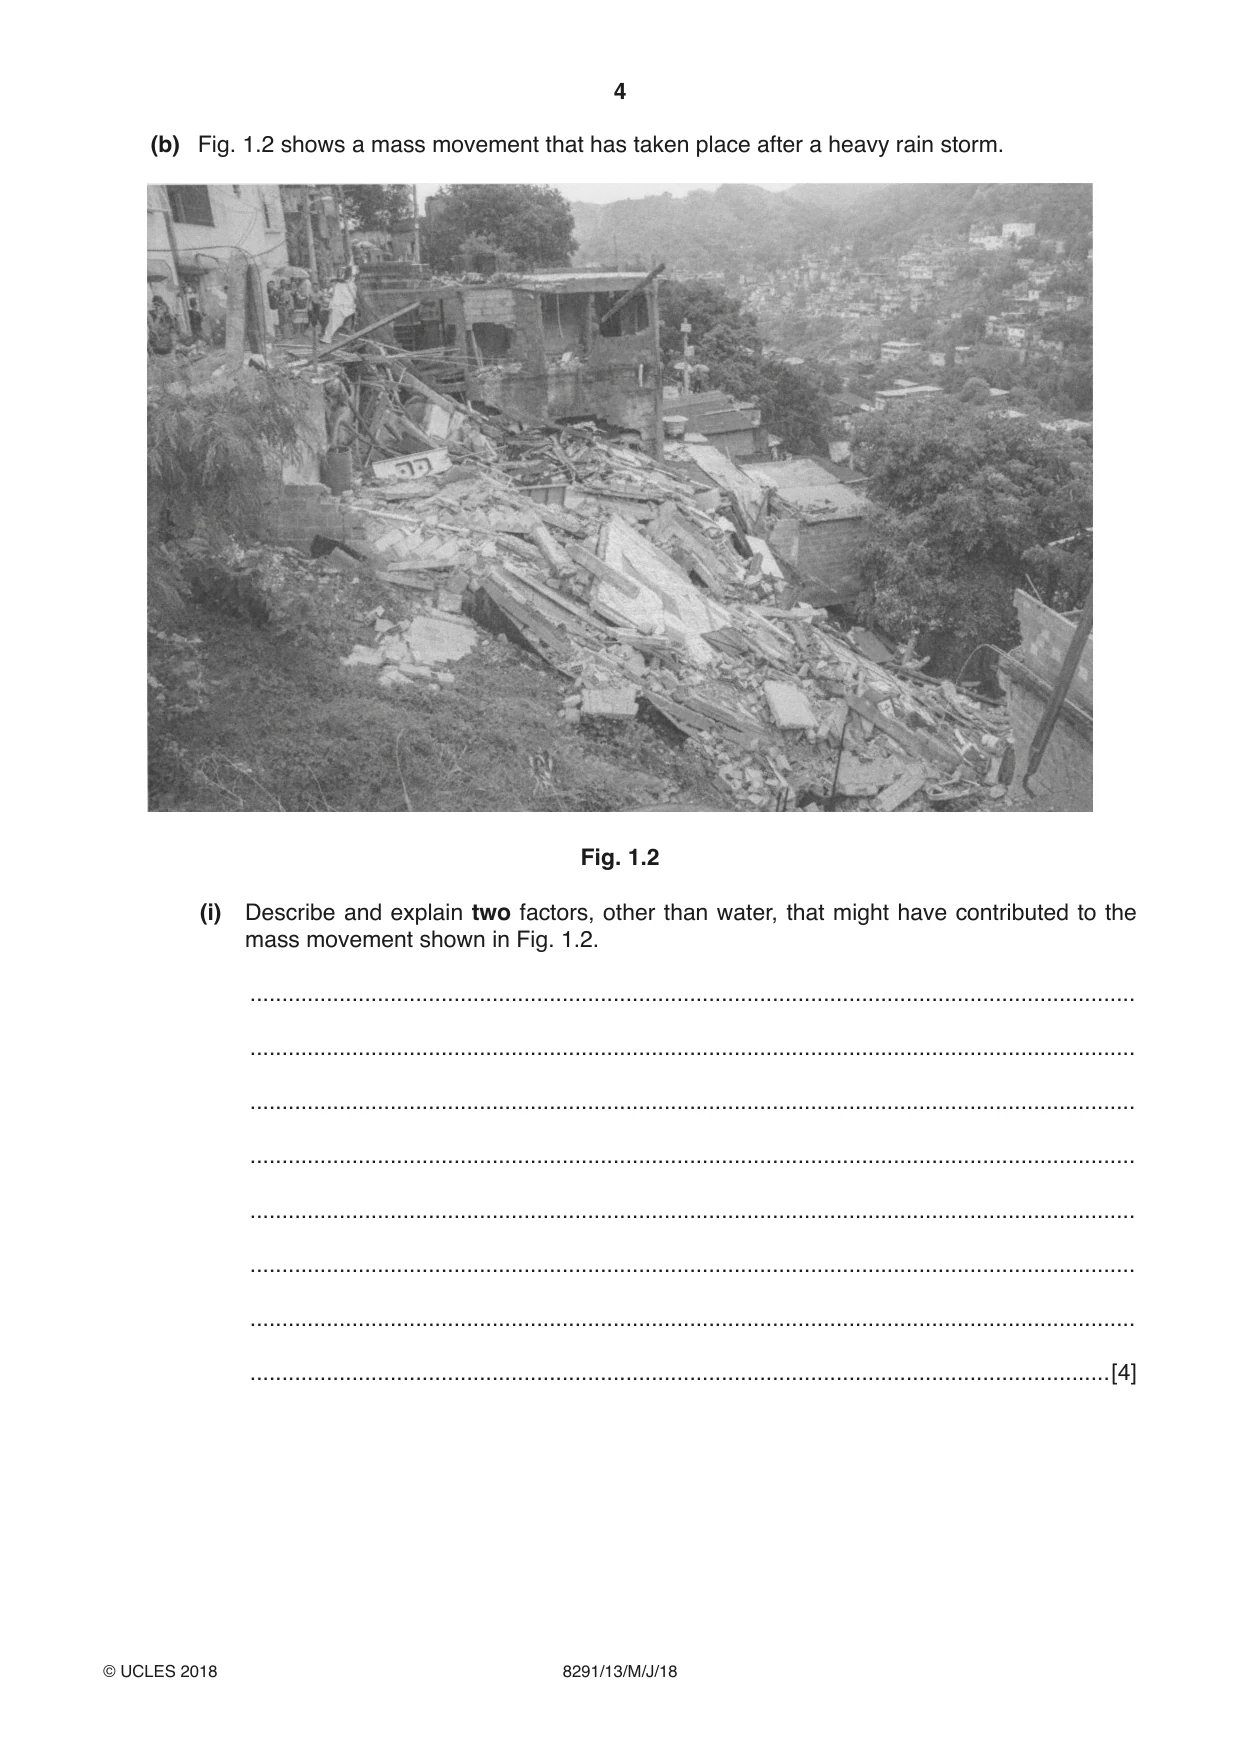
4 8291/13/M/J/18 © UCLES 2018 (b) Fig. 1.2 shows a mass movement that has taken place after a heavy rain storm. Fig. 1.2 (i) Describe and explain two factors, other than water, that might have contributed to the mass movement shown in Fig. 1.2. … … … … … … … …[4]
Question paper, page 5
5 8291/13/M/J/18 © UCLES 2018 [Turn over (ii) Suggest three reasons why people build in high-risk locations such as that shown in Fig. 1.2. … … … … … …[3] (iii) Describe and explain ways to manage slopes to prevent future mass movements such as that shown in Fig. 1.2. … … … … … … … … … … … …[6] [Total: 20]
Question paper, page 6
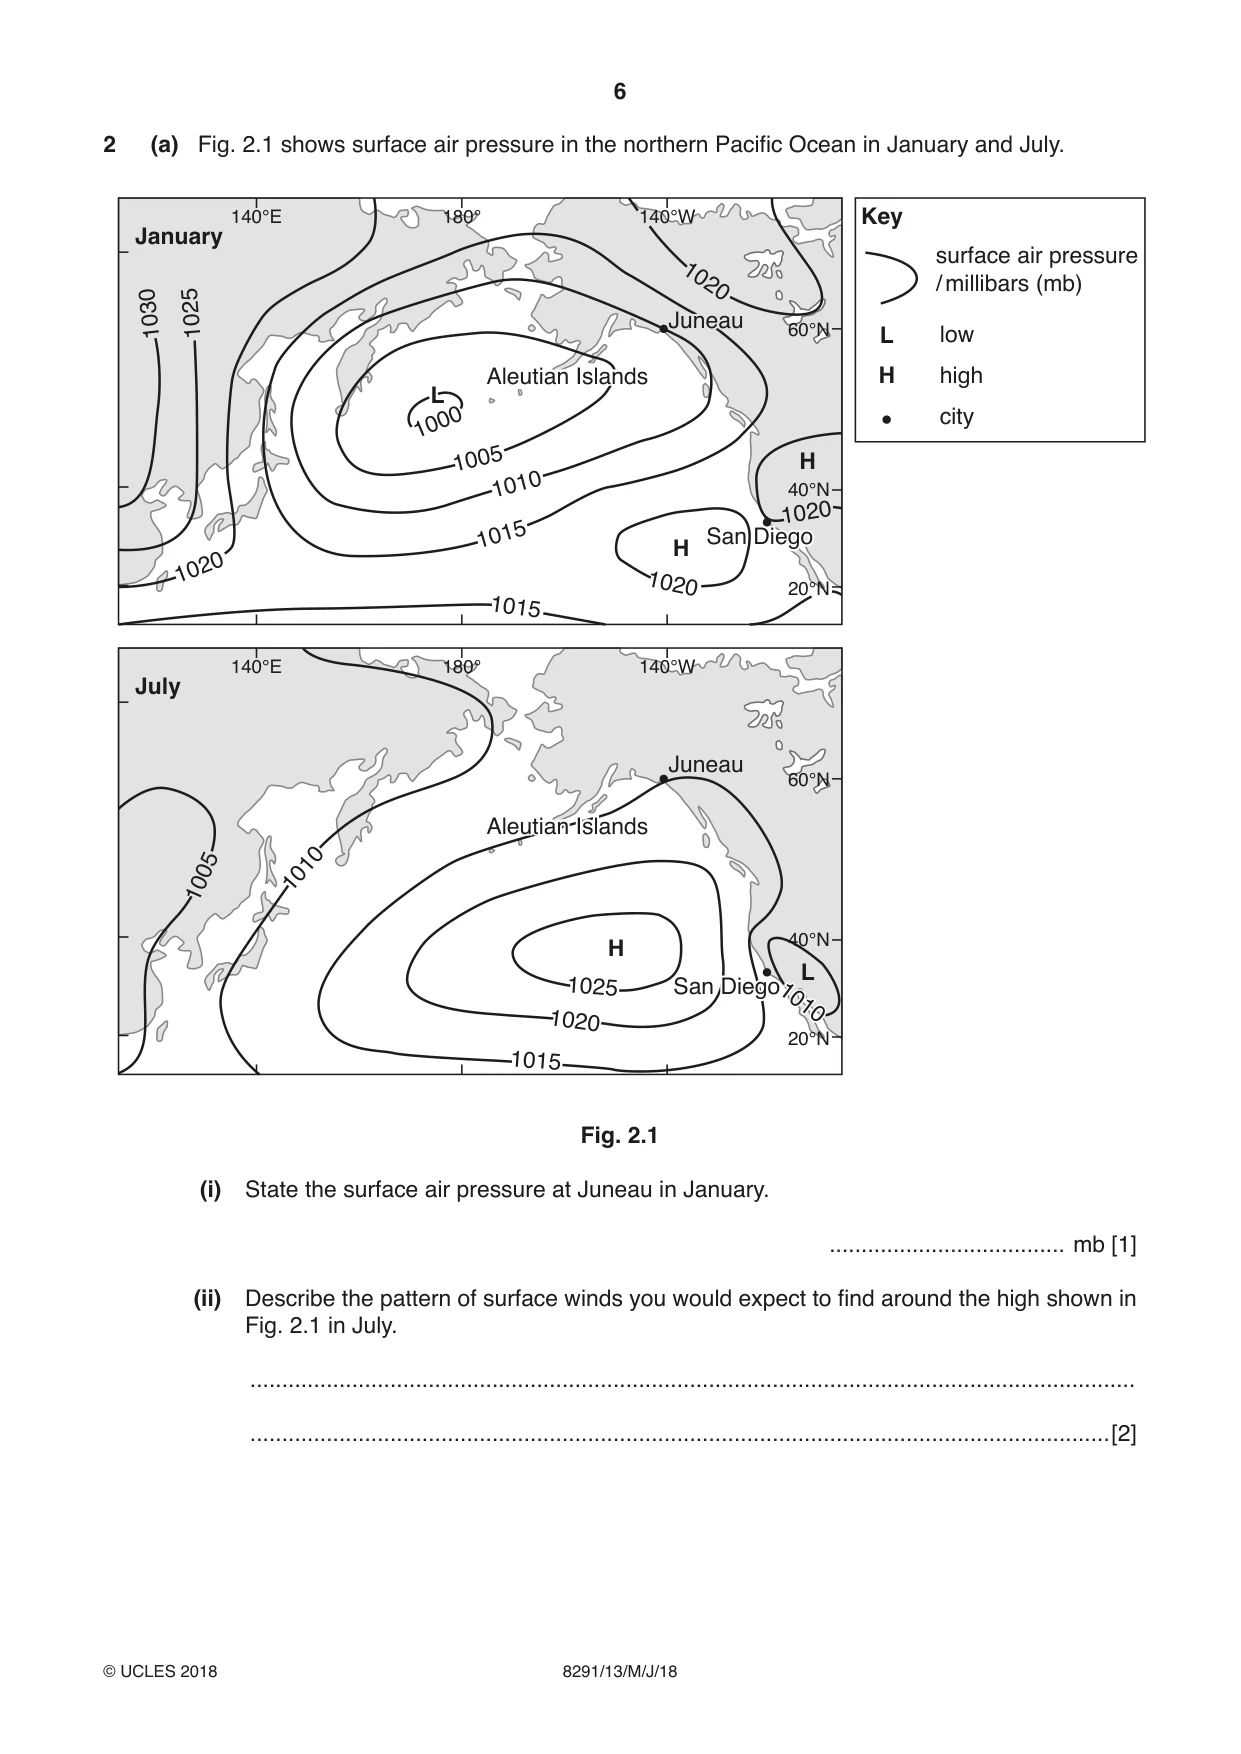
6 8291/13/M/J/18 © UCLES 2018 2 (a) Fig. 2.1 shows surface air pressure in the northern Pacific Ocean in January and July. 140°E 140°W 60°N 40°N 20°N 180° 140°E 140°W 60°N 40°N 20°N 180° January 1030 1025 1020 L H H H L 1000 1005 1010 1015 1015 1020 1020 1020 Juneau Juneau San Diego San Diego Aleutian Islands Aleutian Islands July H L Juneau Juneau San Diego San Diego Aleutian Islands Aleutian Islands 1005 1010 1020 1015 1025 1010 1010 surface air pressure / millibars (mb) Key low high city Fig. 2.1 (i) State the surface air pressure at Juneau in January. … mb [1] (ii) Describe the pattern of surface winds you would expect to find around the high shown in Fig. 2.1 in July. … …[2]
Question paper, page 7
7 8291/13/M/J/18 © UCLES 2018 [Turn over (iii) Suggest five factors responsible for producing the seasonal differences in surface air pressure shown in Fig. 2.1. … … … … … … … … … …[5] (iv) With reference to Fig. 2.1, compare the likely weather conditions expected in the Aleutian Islands in January with those in July. … … … … … … … …[4]
Question paper, page 8
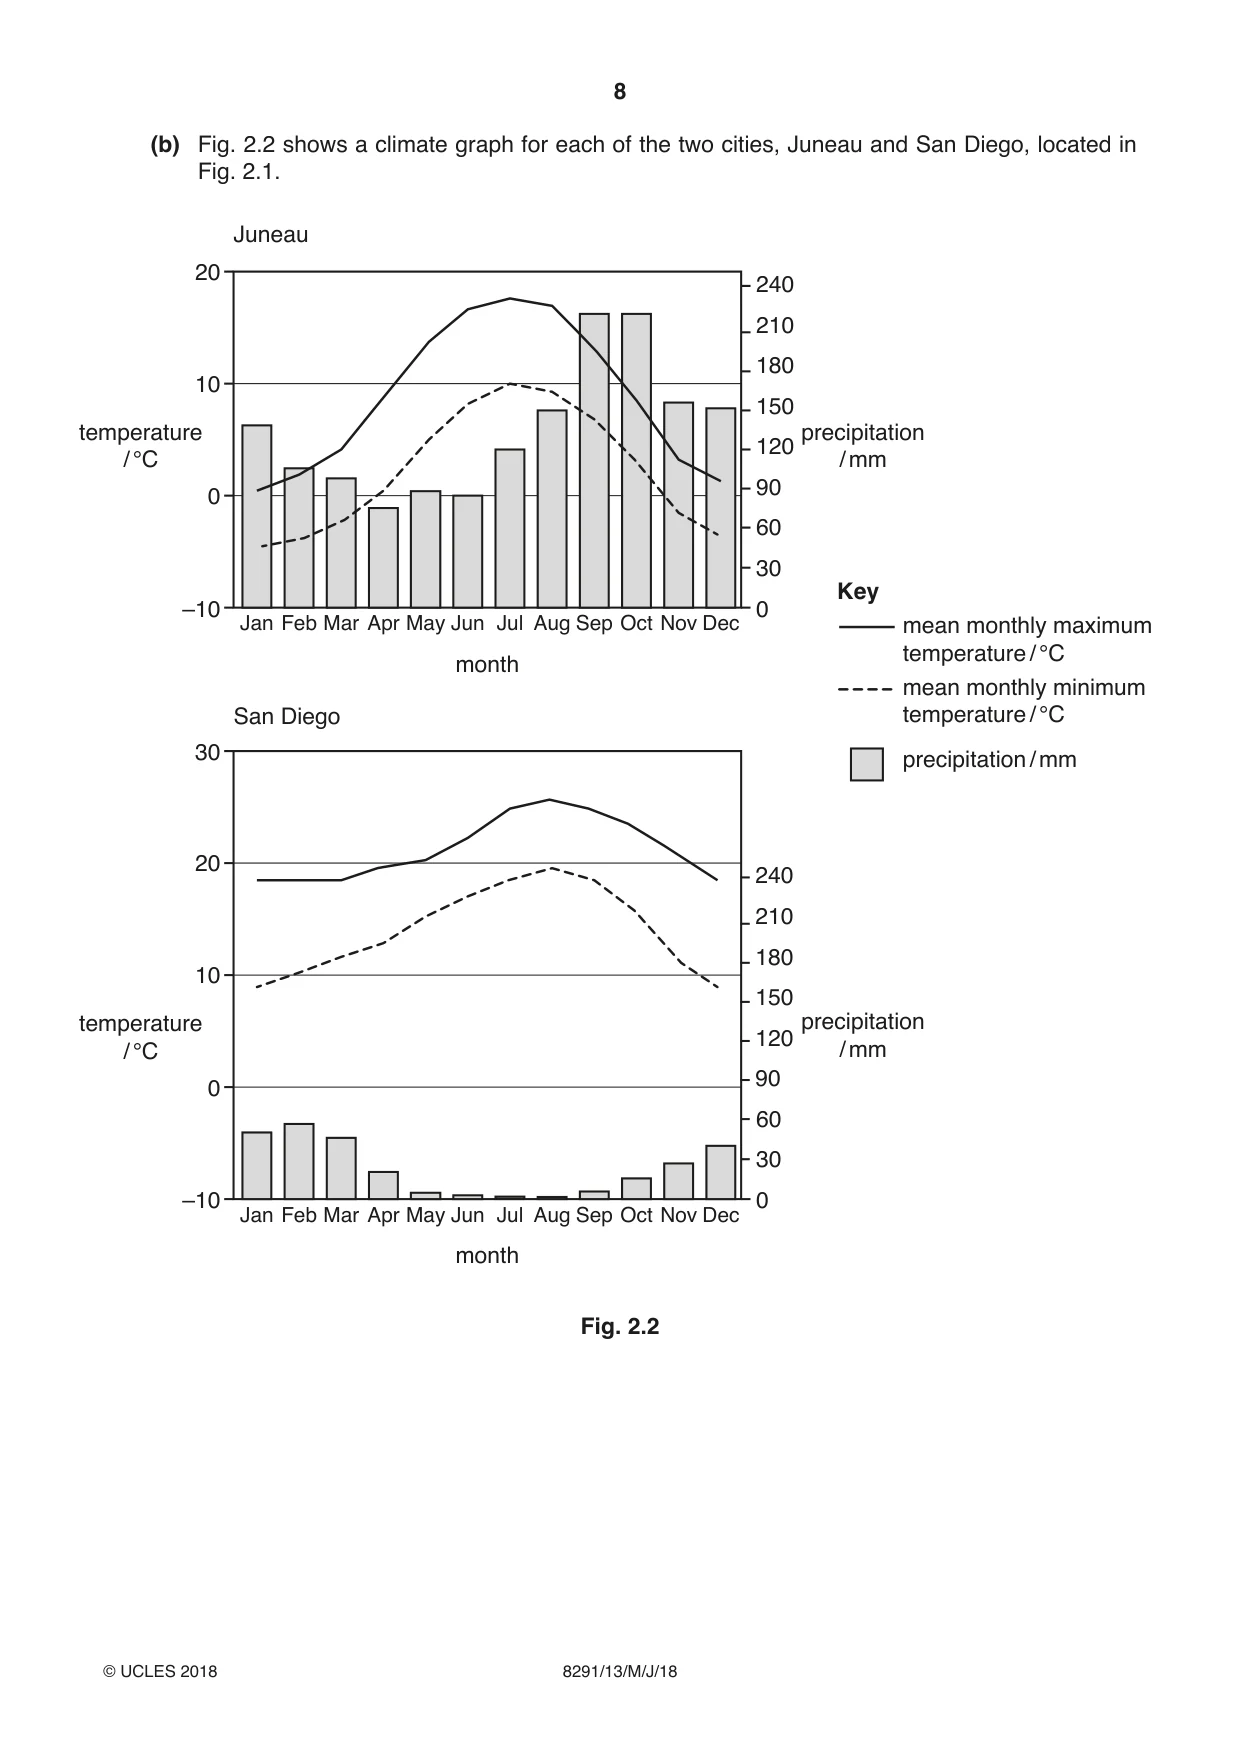
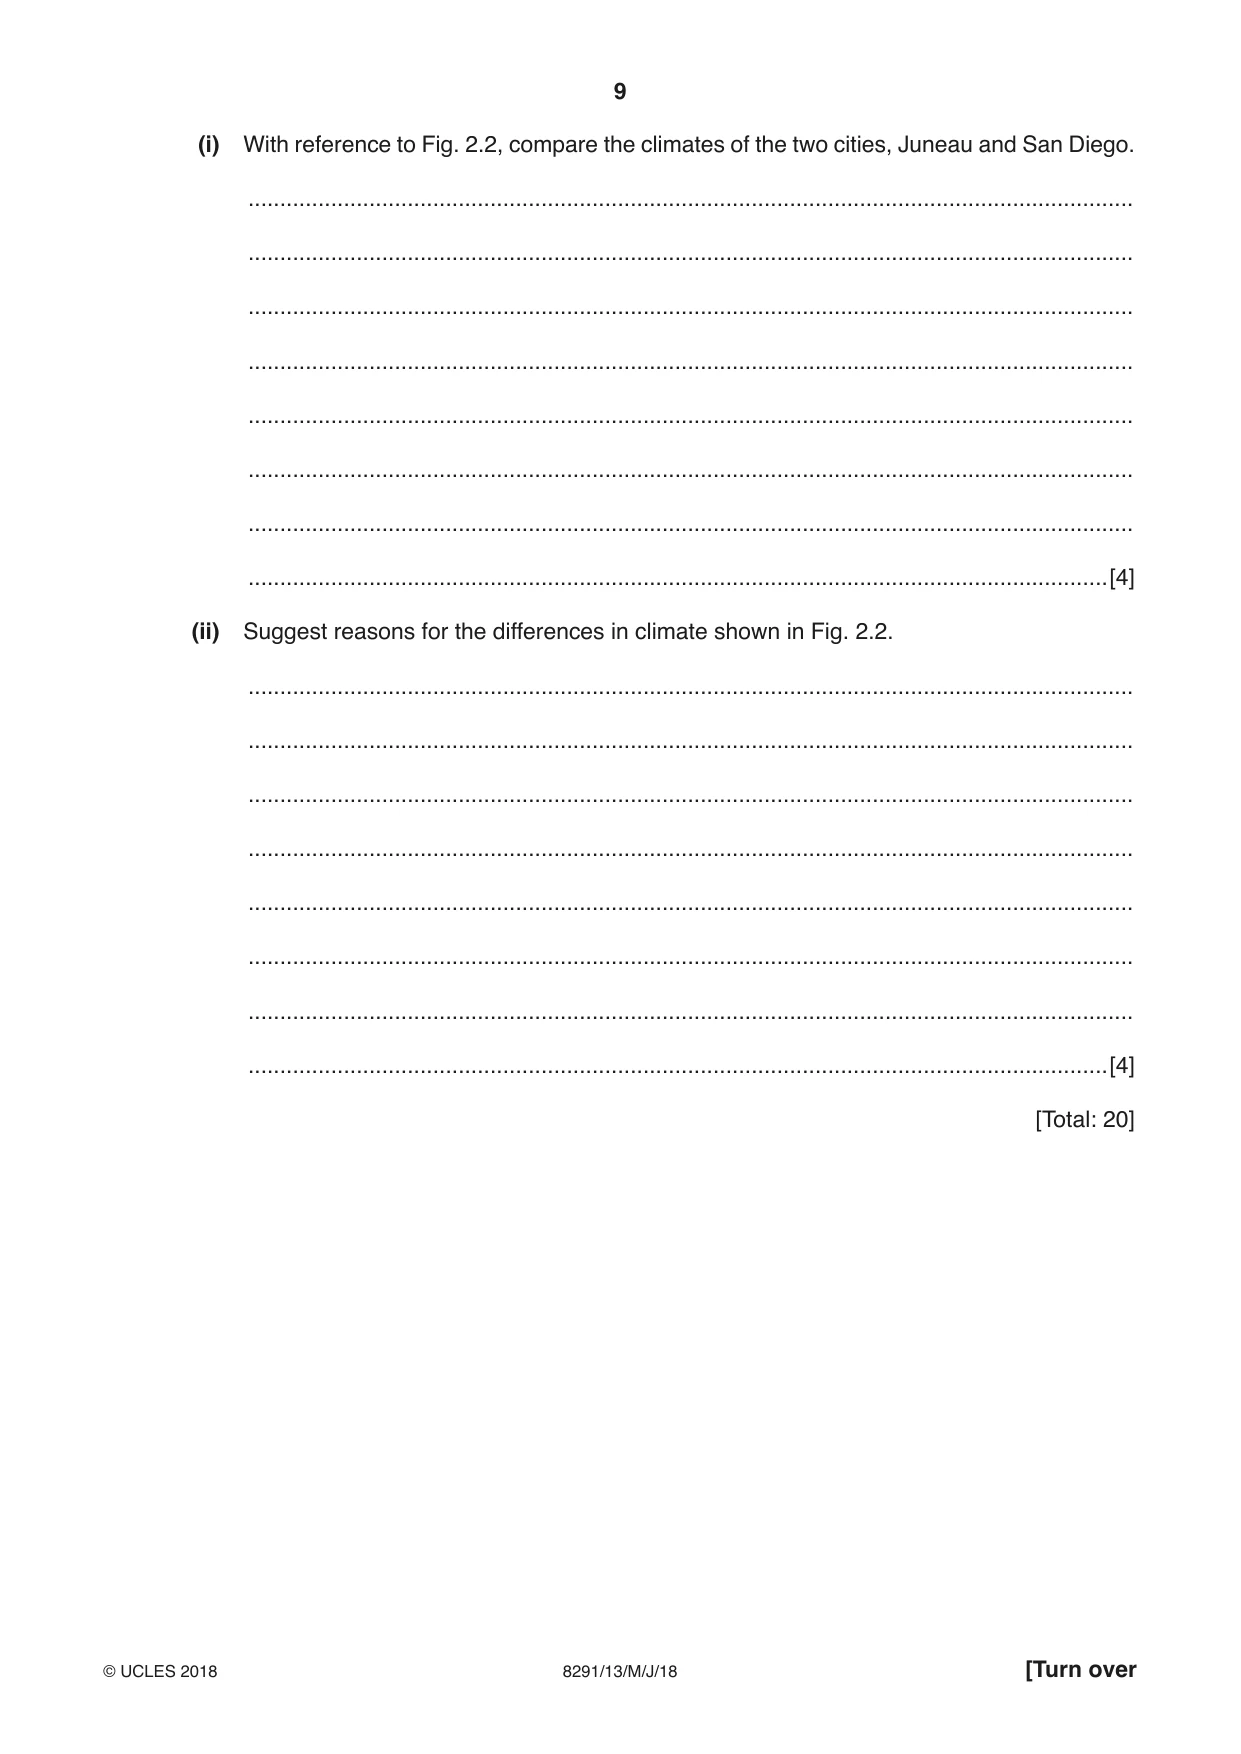
8 8291/13/M/J/18 © UCLES 2018 (b) Fig. 2.2 shows a climate graph for each of the two cities, Juneau and San Diego, located in Fig. 2.1. Jan Feb Mar Apr May Jun month Jul Aug Sep Oct Nov Dec 0 30 60 90 120 150 180 210 240 –10 0 10 20 temperature / °C precipitation / mm Jan Feb Mar Apr May Jun month Jul Aug Sep Oct Nov Dec 0 30 60 –10 0 10 20 30 temperature / °C precipitation / mm 90 120 150 180 210 240 Juneau San Diego Key mean monthly maximum temperature / °C precipitation / mm mean monthly minimum temperature / °C Fig. 2.2
Question paper, page 9
9 8291/13/M/J/18 © UCLES 2018 [Turn over (i) With reference to Fig. 2.2, compare the climates of the two cities, Juneau and San Diego. … … … … … … … …[4] (ii) Suggest reasons for the differences in climate shown in Fig. 2.2. … … … … … … … …[4] [Total: 20]
Question paper, page 10
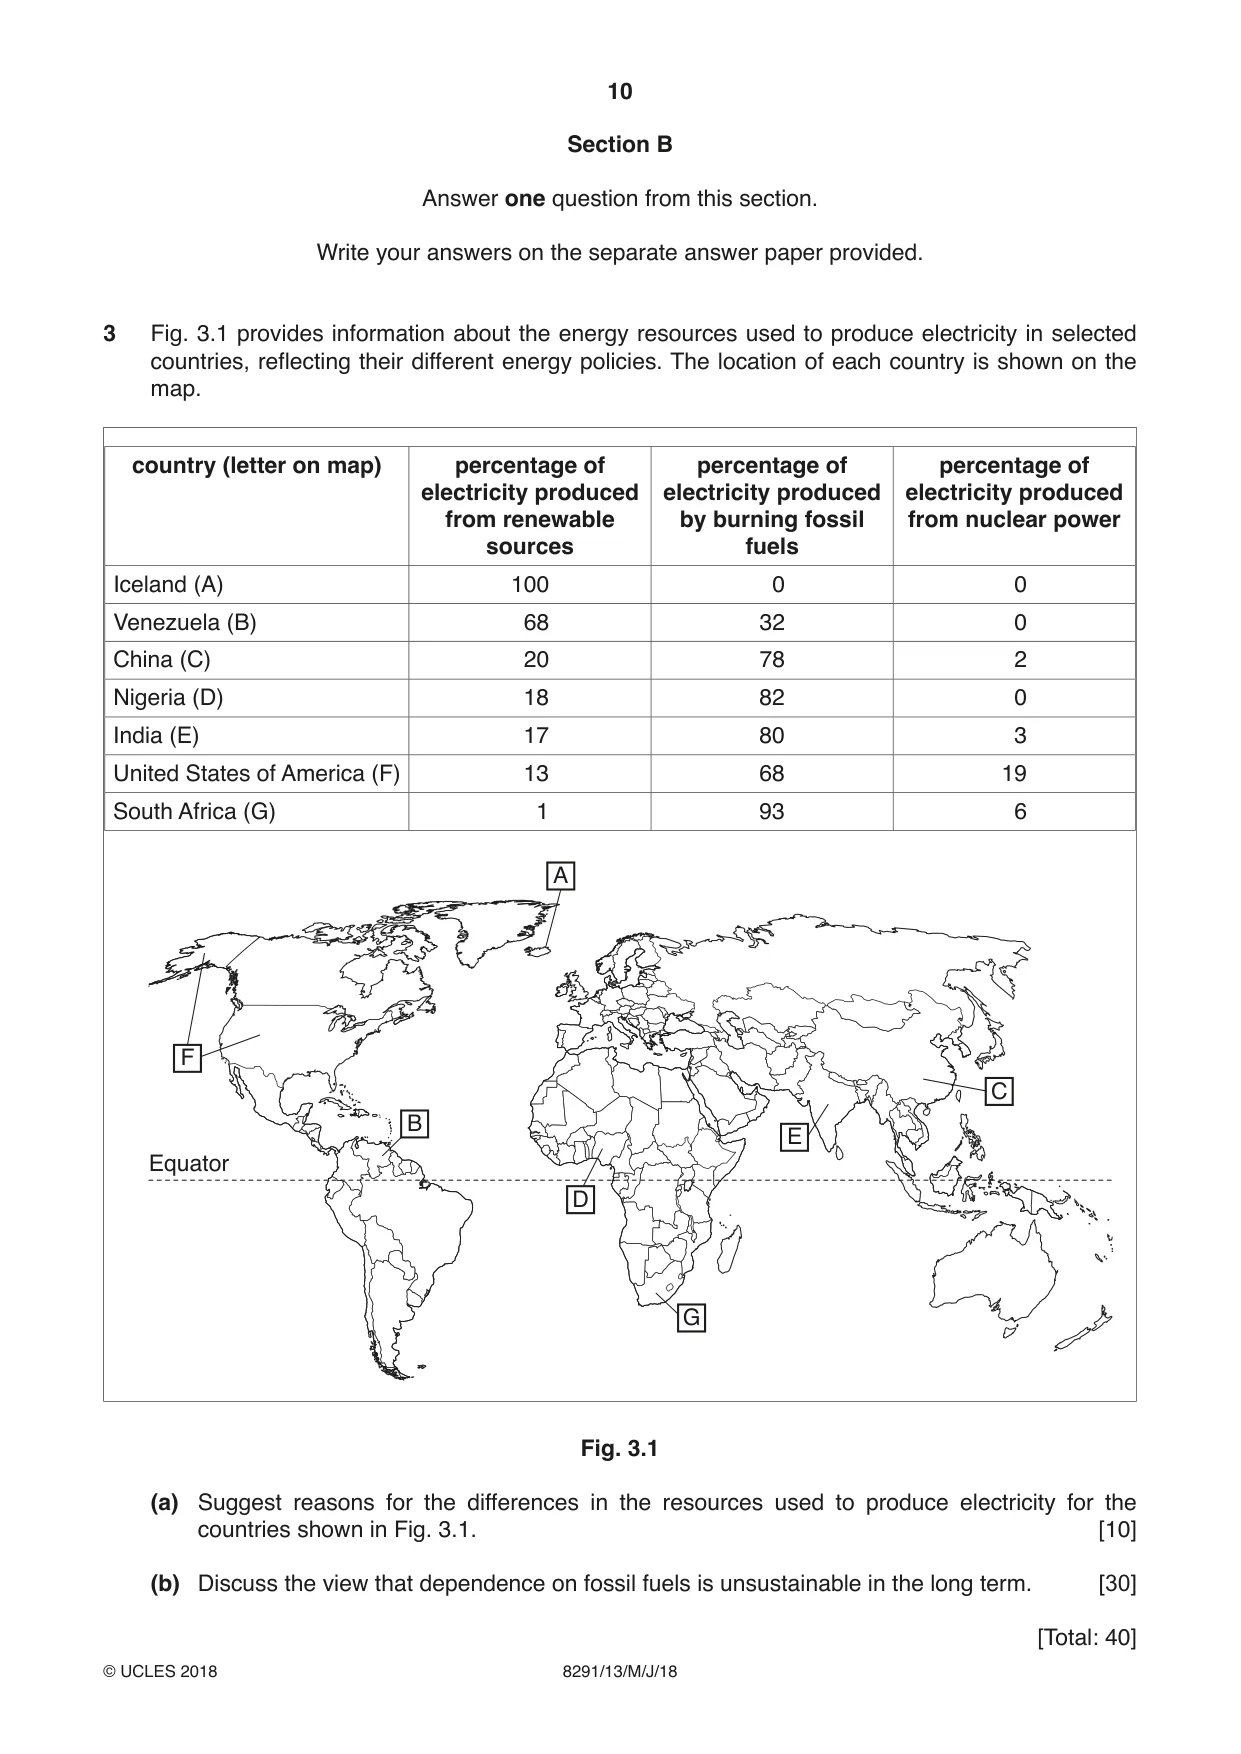
10 8291/13/M/J/18 © UCLES 2018 Section B Answer one question from this section. Write your answers on the separate answer paper provided. 3 Fig. 3.1 provides information about the energy resources used to produce electricity in selected countries, reflecting their different energy policies. The location of each country is shown on the map. country (letter on map) percentage of electricity produced from renewable sources percentage of electricity produced by burning fossil fuels percentage of electricity produced from nuclear power Iceland (A) 100 0 0 Venezuela (B) 68 32 0 China (C) 20 78 2 Nigeria (D) 18 82 0 India (E) 17 80 3 United States of America (F) 13 68 19 South Africa (G) 1 93 6 Equator A B G E C D F Fig. 3.1 (a) Suggest reasons for the differences in the resources used to produce electricity for the countries shown in Fig. 3.1. [10] (b) Discuss the view that dependence on fossil fuels is unsustainable in the long term. [30] [Total: 40]
Question paper, page 11
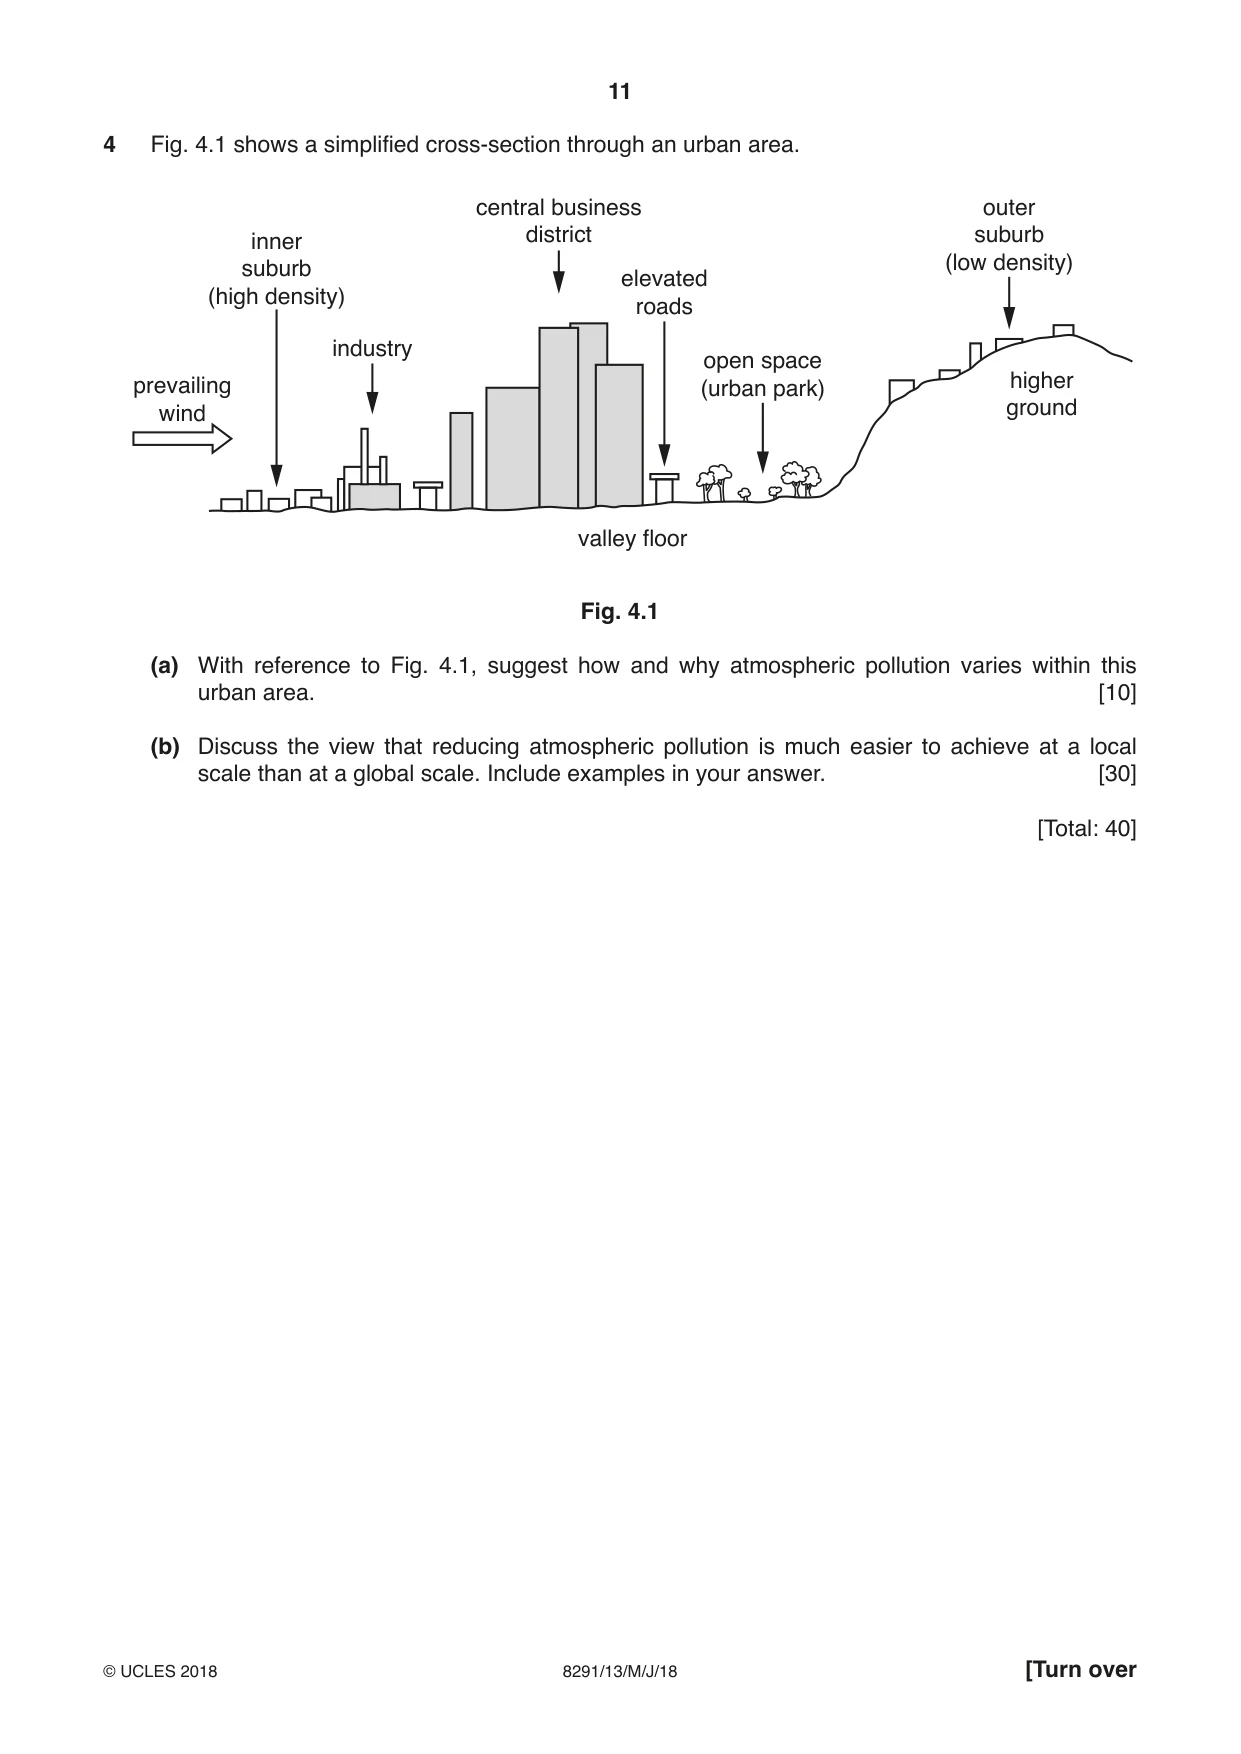
11 8291/13/M/J/18 © UCLES 2018 [Turn over 4 Fig. 4.1 shows a simplified cross-section through an urban area. central business district outer suburb (low density) open space (urban park) elevated roads industry inner suburb (high density) prevailing wind higher ground valley floor Fig. 4.1 (a) With reference to Fig. 4.1, suggest how and why atmospheric pollution varies within this urban area. [10] (b) Discuss the view that reducing atmospheric pollution is much easier to achieve at a local scale than at a global scale. Include examples in your answer. [30] [Total: 40]
Question paper, page 12
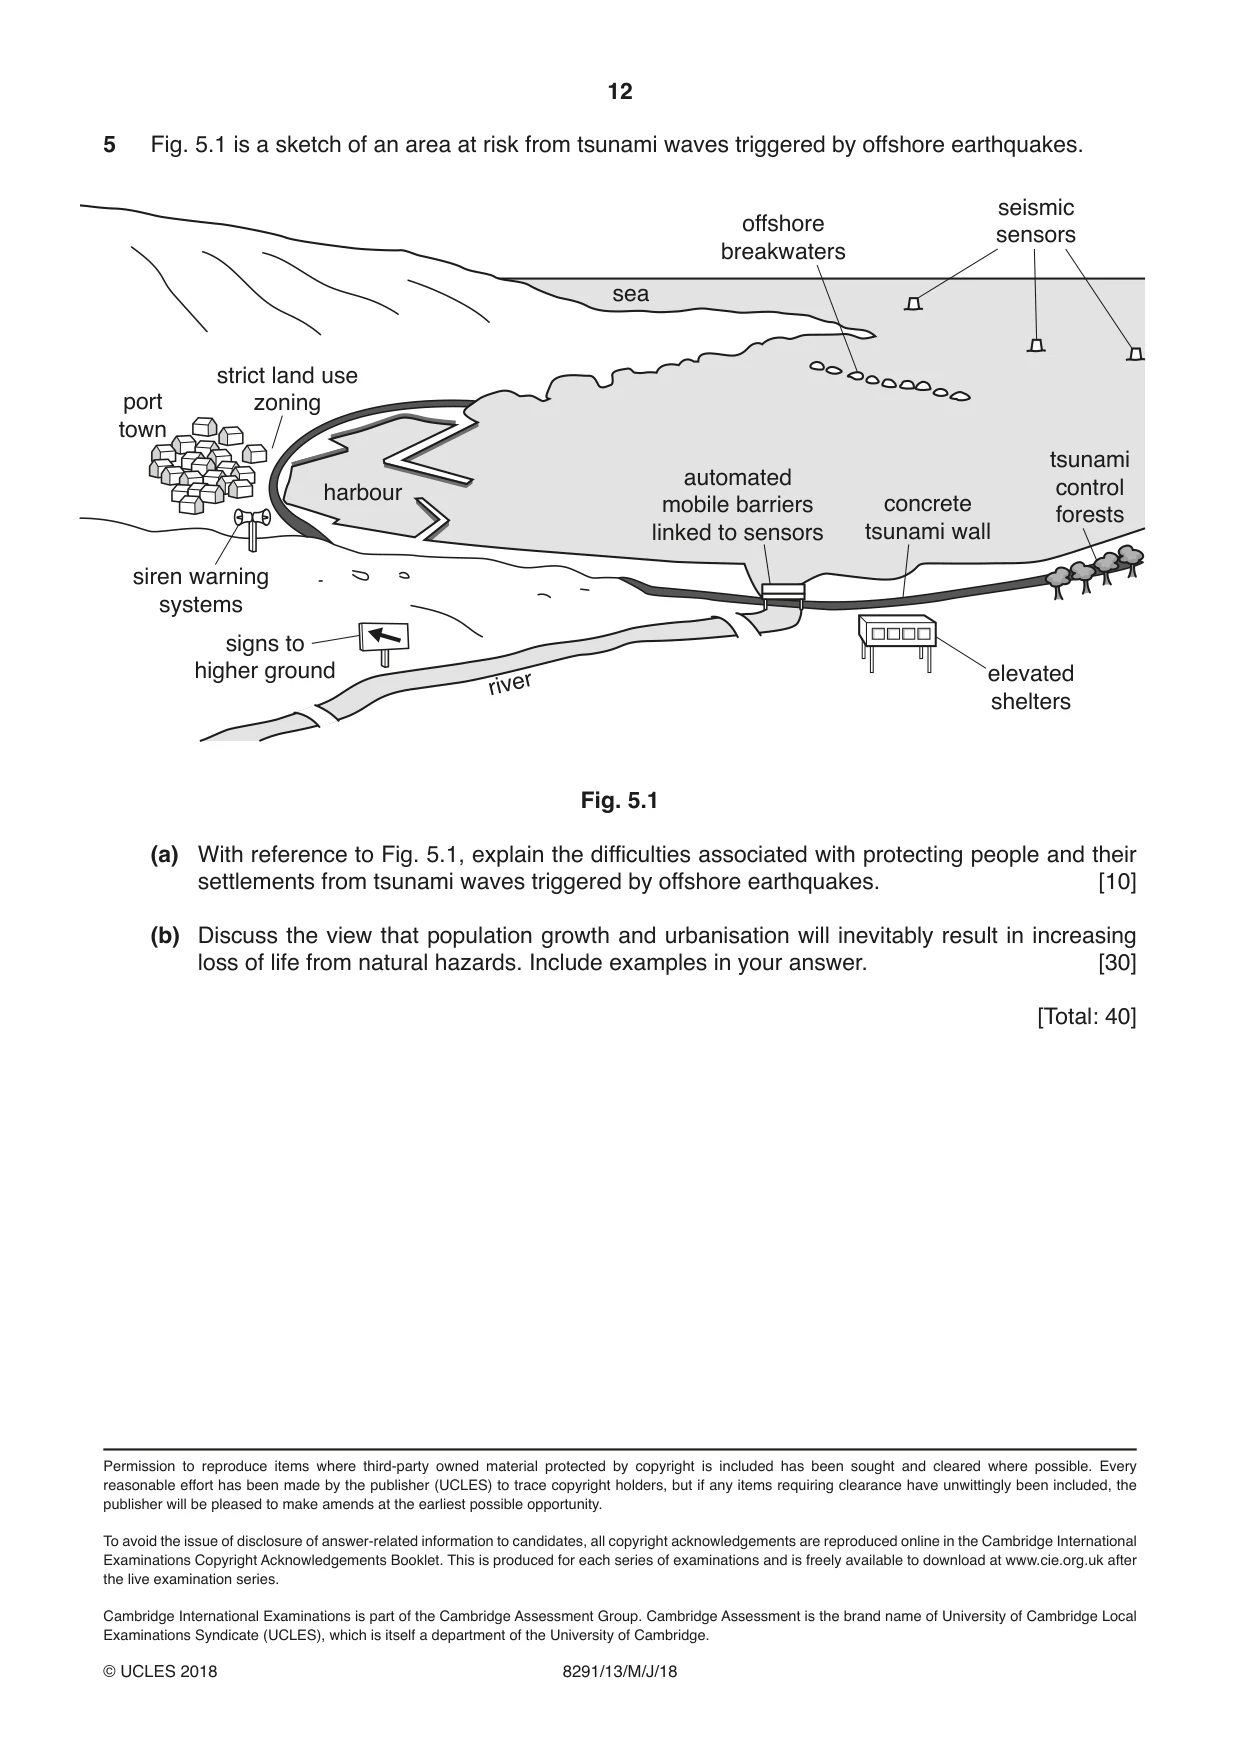
12 8291/13/M/J/18 © UCLES 2018 Permission to reproduce items where third-party owned material protected by copyright is included has been sought and cleared where possible. Every reasonable effort has been made by the publisher (UCLES) to trace copyright holders, but if any items requiring clearance have unwittingly been included, the publisher will be pleased to make amends at the earliest possible opportunity. To avoid the issue of disclosure of answer-related information to candidates, all copyright acknowledgements are reproduced online in the Cambridge International Examinations Copyright Acknowledgements Booklet. This is produced for each series of examinations and is freely available to download at www.cie.org.uk after the live examination series. Cambridge International Examinations is part of the Cambridge Assessment Group. Cambridge Assessment is the brand name of University of Cambridge Local Examinations Syndicate (UCLES), which is itself a department of the University of Cambridge. 5 Fig. 5.1 is a sketch of an area at risk from tsunami waves triggered by offshore earthquakes. offshore breakwaters seismic sensors sea tsunami control forests elevated shelters concrete tsunami wall automated mobile barriers linked to sensors river signs to higher ground siren warning systems harbour strict land use zoning port town Fig. 5.1 (a) With reference to Fig. 5.1, explain the difficulties associated with protecting people and their settlements from tsunami waves triggered by offshore earthquakes. [10] (b) Discuss the view that population growth and urbanisation will inevitably result in increasing loss of life from natural hazards. Include examples in your answer. [30] [Total: 40]
Mark scheme, page 1
IGCSE™ is a registered trademark. This document consists of 14 printed pages. © UCLES 2018 [Turn over Cambridge Assessment International Education Cambridge International Advanced Subsidiary Level ENVIRONMENTAL MANAGEMENT 8291/13 Paper 1 May/June 2018 MARK SCHEME Maximum Mark: 80 Published This mark scheme is published as an aid to teachers and candidates, to indicate the requirements of the examination. It shows the basis on which Examiners were instructed to award marks. It does not indicate the details of the discussions that took place at an Examiners’ meeting before marking began, which would have considered the acceptability of alternative answers. Mark schemes should be read in conjunction with the question paper and the Principal Examiner Report for Teachers. Cambridge International will not enter into discussions about these mark schemes. Cambridge International is publishing the mark schemes for the May/June 2018 series for most Cambridge IGCSE™, Cambridge International A and AS Level and Cambridge Pre-U components, and some Cambridge O Level components.
Mark scheme, page 2
8291/13 Cambridge International AS Level – Mark Scheme PUBLISHED May/June 2018 © UCLES 2018 Page 2 of 14 Generic Marking Principles These general marking principles must be applied by all examiners when marking candidate answers. They should be applied alongside the specific content of the mark scheme or generic level descriptors for a question. Each question paper and mark scheme will also comply with these marking principles. GENERIC MARKING PRINCIPLE 1: Marks must be awarded in line with: • the specific content of the mark scheme or the generic level descriptors for the question • the specific skills defined in the mark scheme or in the generic level descriptors for the question • the standard of response required by a candidate as exemplified by the standardisation scripts. GENERIC MARKING PRINCIPLE 2: Marks awarded are always whole marks (not half marks, or other fractions). GENERIC MARKING PRINCIPLE 3: Marks must be awarded positively: • marks are awarded for correct/valid answers, as defined in the mark scheme. However, credit is given for valid answers which go beyond the scope of the syllabus and mark scheme, referring to your Team Leader as appropriate • marks are awarded when candidates clearly demonstrate what they know and can do • marks are not deducted for errors • marks are not deducted for omissions • answers should only be judged on the quality of spelling, punctuation and grammar when these features are specifically assessed by the question as indicated by the mark scheme. The meaning, however, should be unambiguous. GENERIC MARKING PRINCIPLE 4: Rules must be applied consistently e.g. in situations where candidates have not followed instructions or in the application of generic level descriptors.
Mark scheme, page 3
8291/13 Cambridge International AS Level – Mark Scheme PUBLISHED May/June 2018 © UCLES 2018 Page 3 of 14 GENERIC MARKING PRINCIPLE 5: Marks should be awarded using the full range of marks defined in the mark scheme for the question (however; the use of the full mark range may be limited according to the quality of the candidate responses seen). GENERIC MARKING PRINCIPLE 6: Marks awarded are based solely on the requirements as defined in the mark scheme. Marks should not be awarded with grade thresholds or grade descriptors in mind.
Mark scheme, page 4
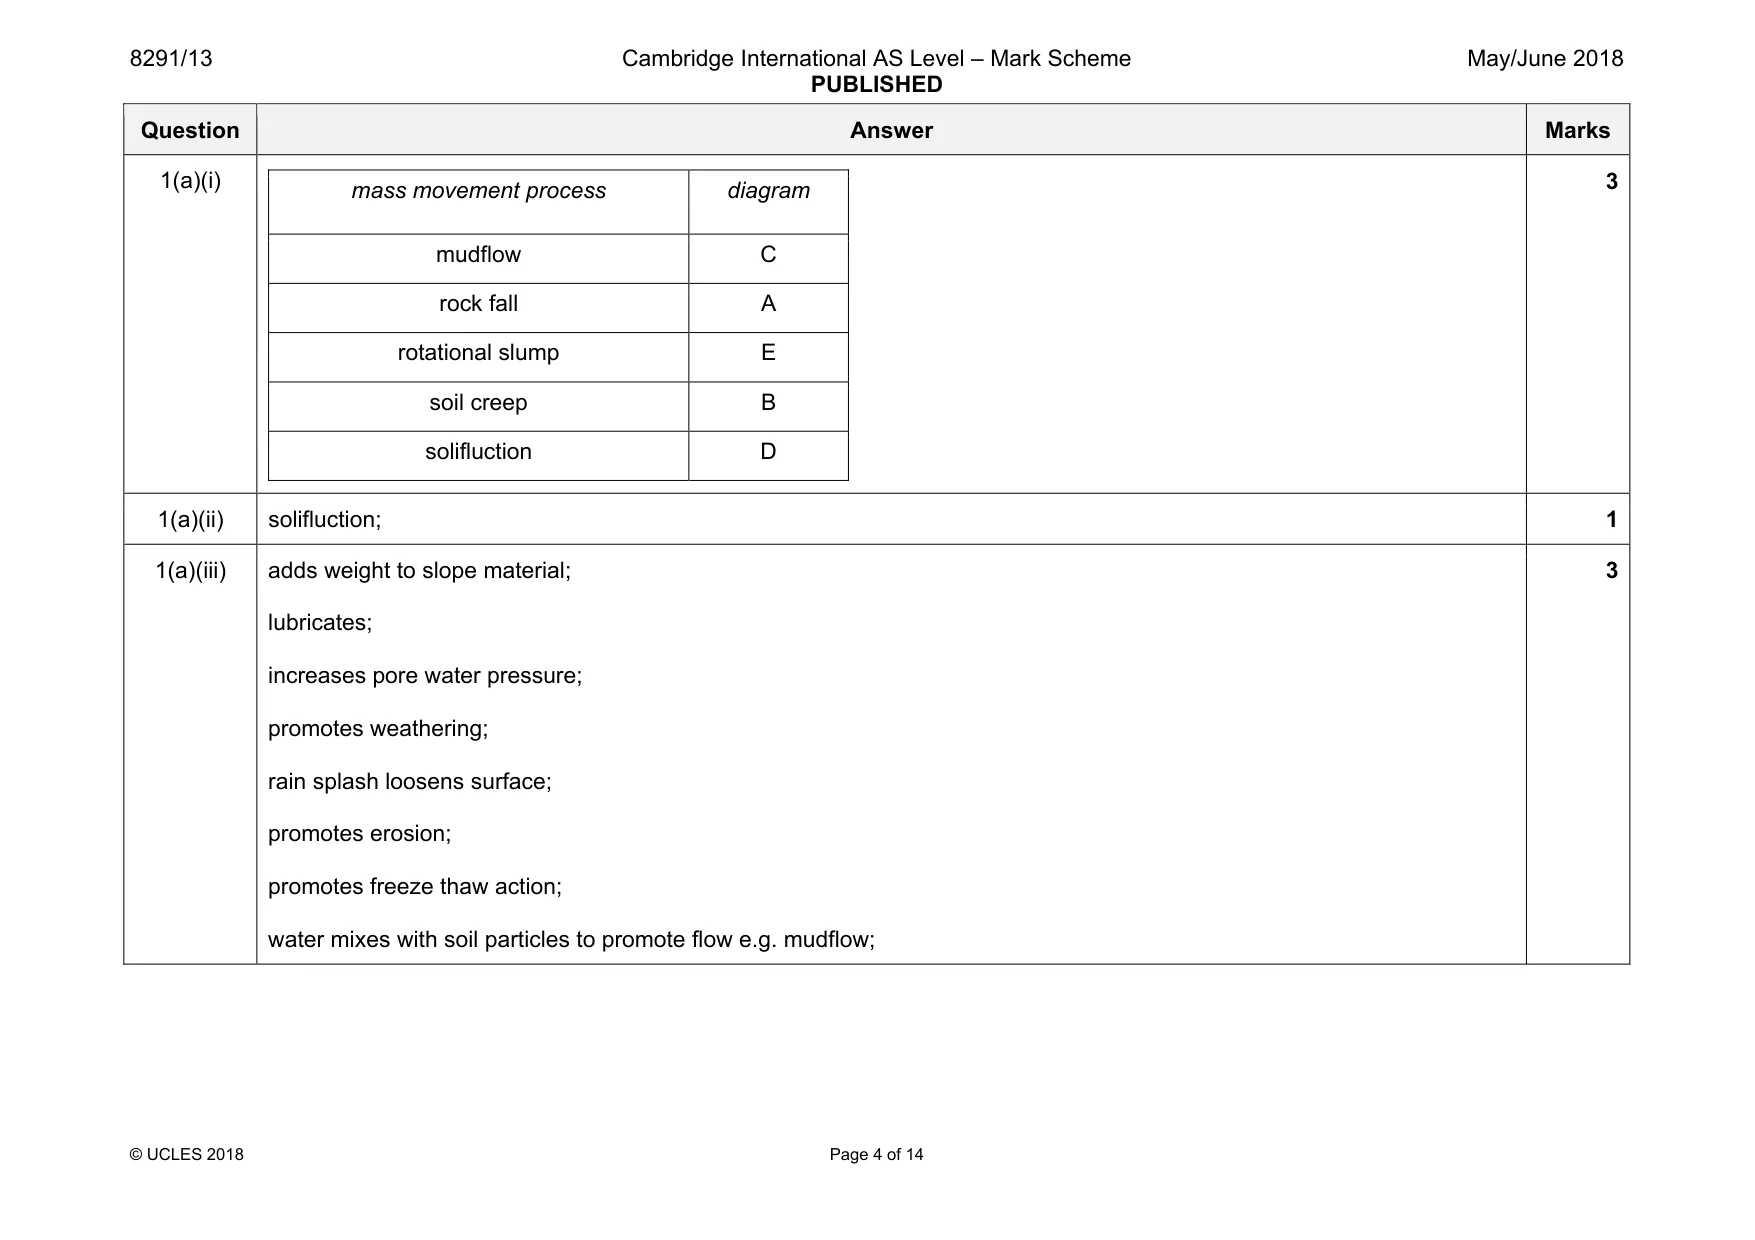
8291/13 Cambridge International AS Level – Mark Scheme PUBLISHED May/June 2018 © UCLES 2018 Page 4 of 14 Question Answer Marks 1(a)(i) mass movement process diagram mudflow C rock fall A rotational slump E soil creep B solifluction D 3 1(a)(ii) solifluction; 1 1(a)(iii) adds weight to slope material; lubricates; increases pore water pressure; promotes weathering; rain splash loosens surface; promotes erosion; promotes freeze thaw action; water mixes with soil particles to promote flow e.g. mudflow; 3
Mark scheme, page 5
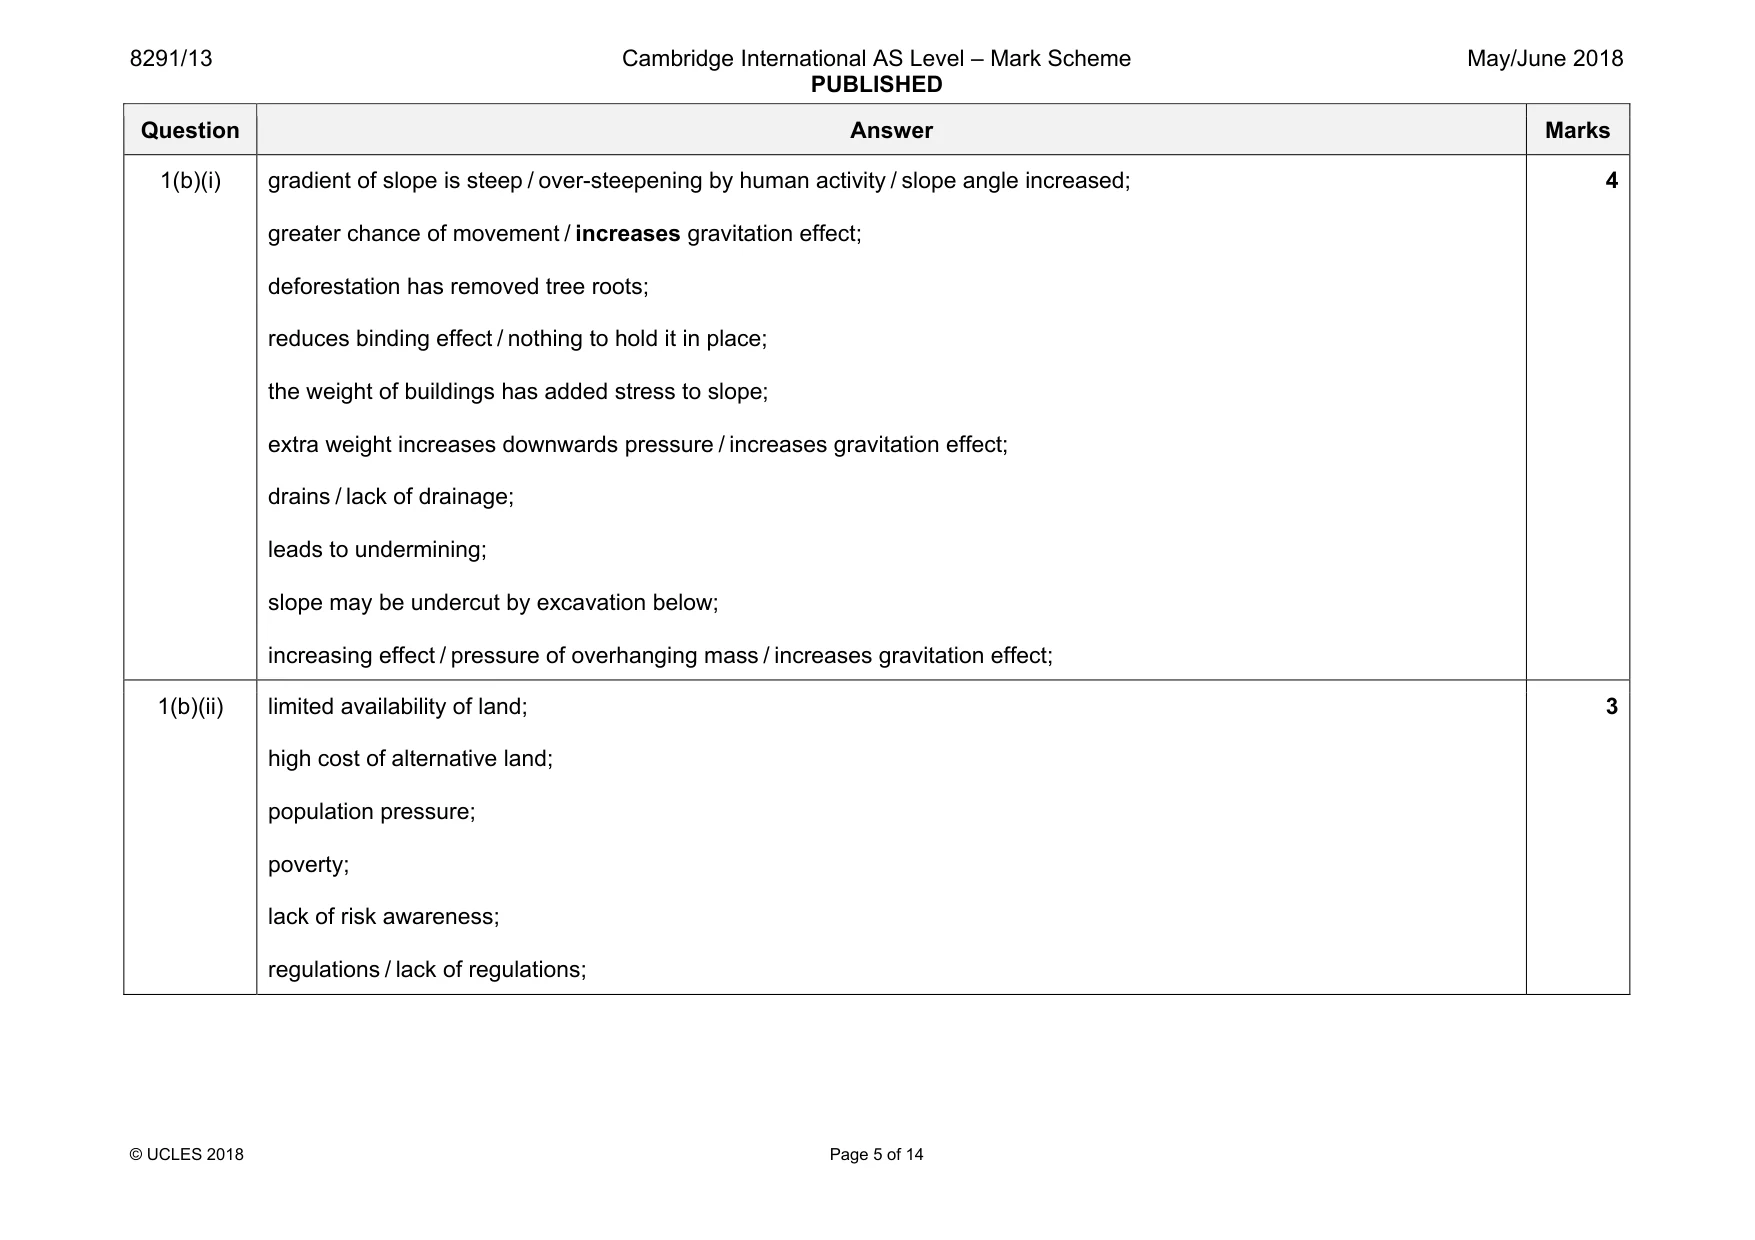
8291/13 Cambridge International AS Level – Mark Scheme PUBLISHED May/June 2018 © UCLES 2018 Page 5 of 14 Question Answer Marks 1(b)(i) gradient of slope is steep / over-steepening by human activity / slope angle increased; greater chance of movement / increases gravitation effect; deforestation has removed tree roots; reduces binding effect / nothing to hold it in place; the weight of buildings has added stress to slope; extra weight increases downwards pressure / increases gravitation effect; drains / lack of drainage; leads to undermining; slope may be undercut by excavation below; increasing effect / pressure of overhanging mass / increases gravitation effect; 4 1(b)(ii) limited availability of land; high cost of alternative land; population pressure; poverty; lack of risk awareness; regulations / lack of regulations; 3
Mark scheme, page 6
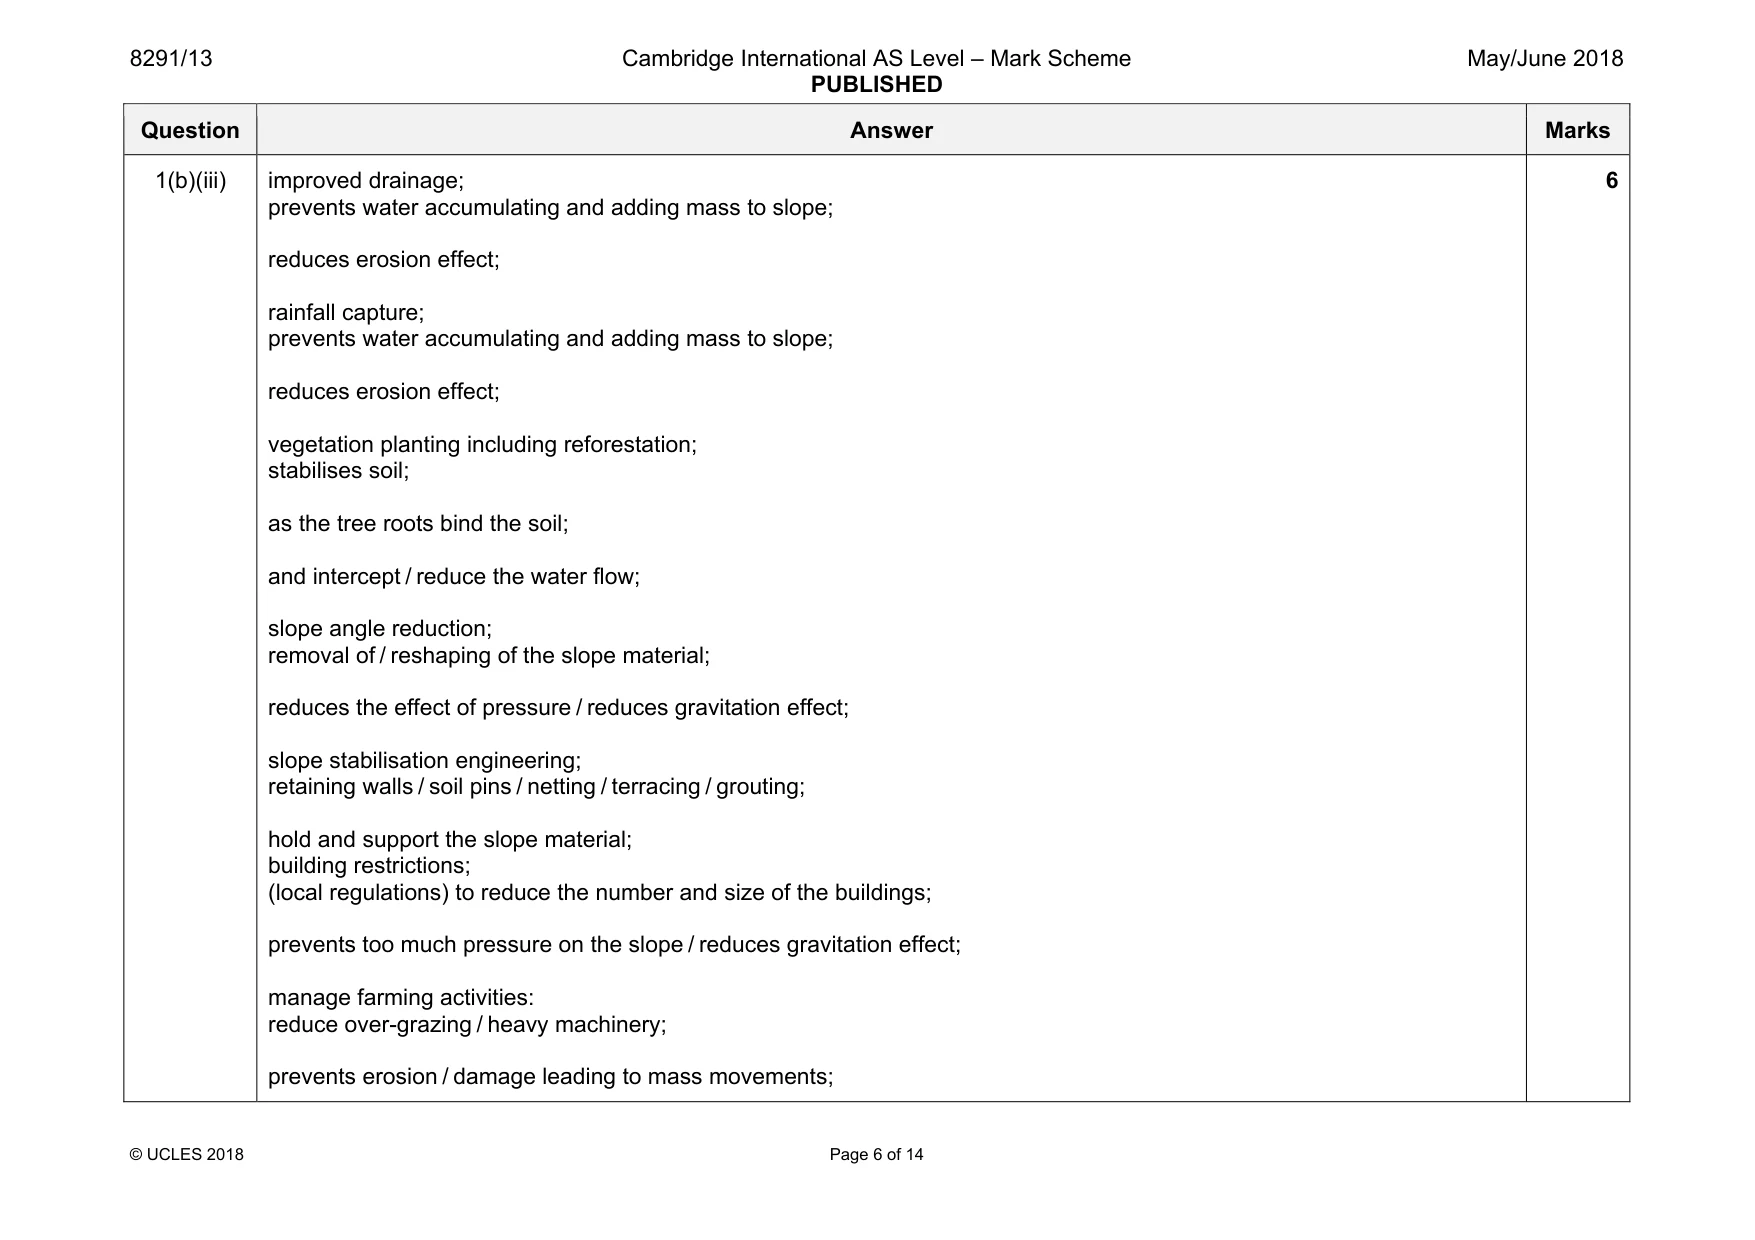
8291/13 Cambridge International AS Level – Mark Scheme PUBLISHED May/June 2018 © UCLES 2018 Page 6 of 14 Question Answer Marks 1(b)(iii) improved drainage; prevents water accumulating and adding mass to slope; reduces erosion effect; rainfall capture; prevents water accumulating and adding mass to slope; reduces erosion effect; vegetation planting including reforestation; stabilises soil; as the tree roots bind the soil; and intercept / reduce the water flow; slope angle reduction; removal of / reshaping of the slope material; reduces the effect of pressure / reduces gravitation effect; slope stabilisation engineering; retaining walls / soil pins / netting / terracing / grouting; hold and support the slope material; building restrictions; (local regulations) to reduce the number and size of the buildings; prevents too much pressure on the slope / reduces gravitation effect; manage farming activities: reduce over-grazing / heavy machinery; prevents erosion / damage leading to mass movements; 6
Mark scheme, page 7
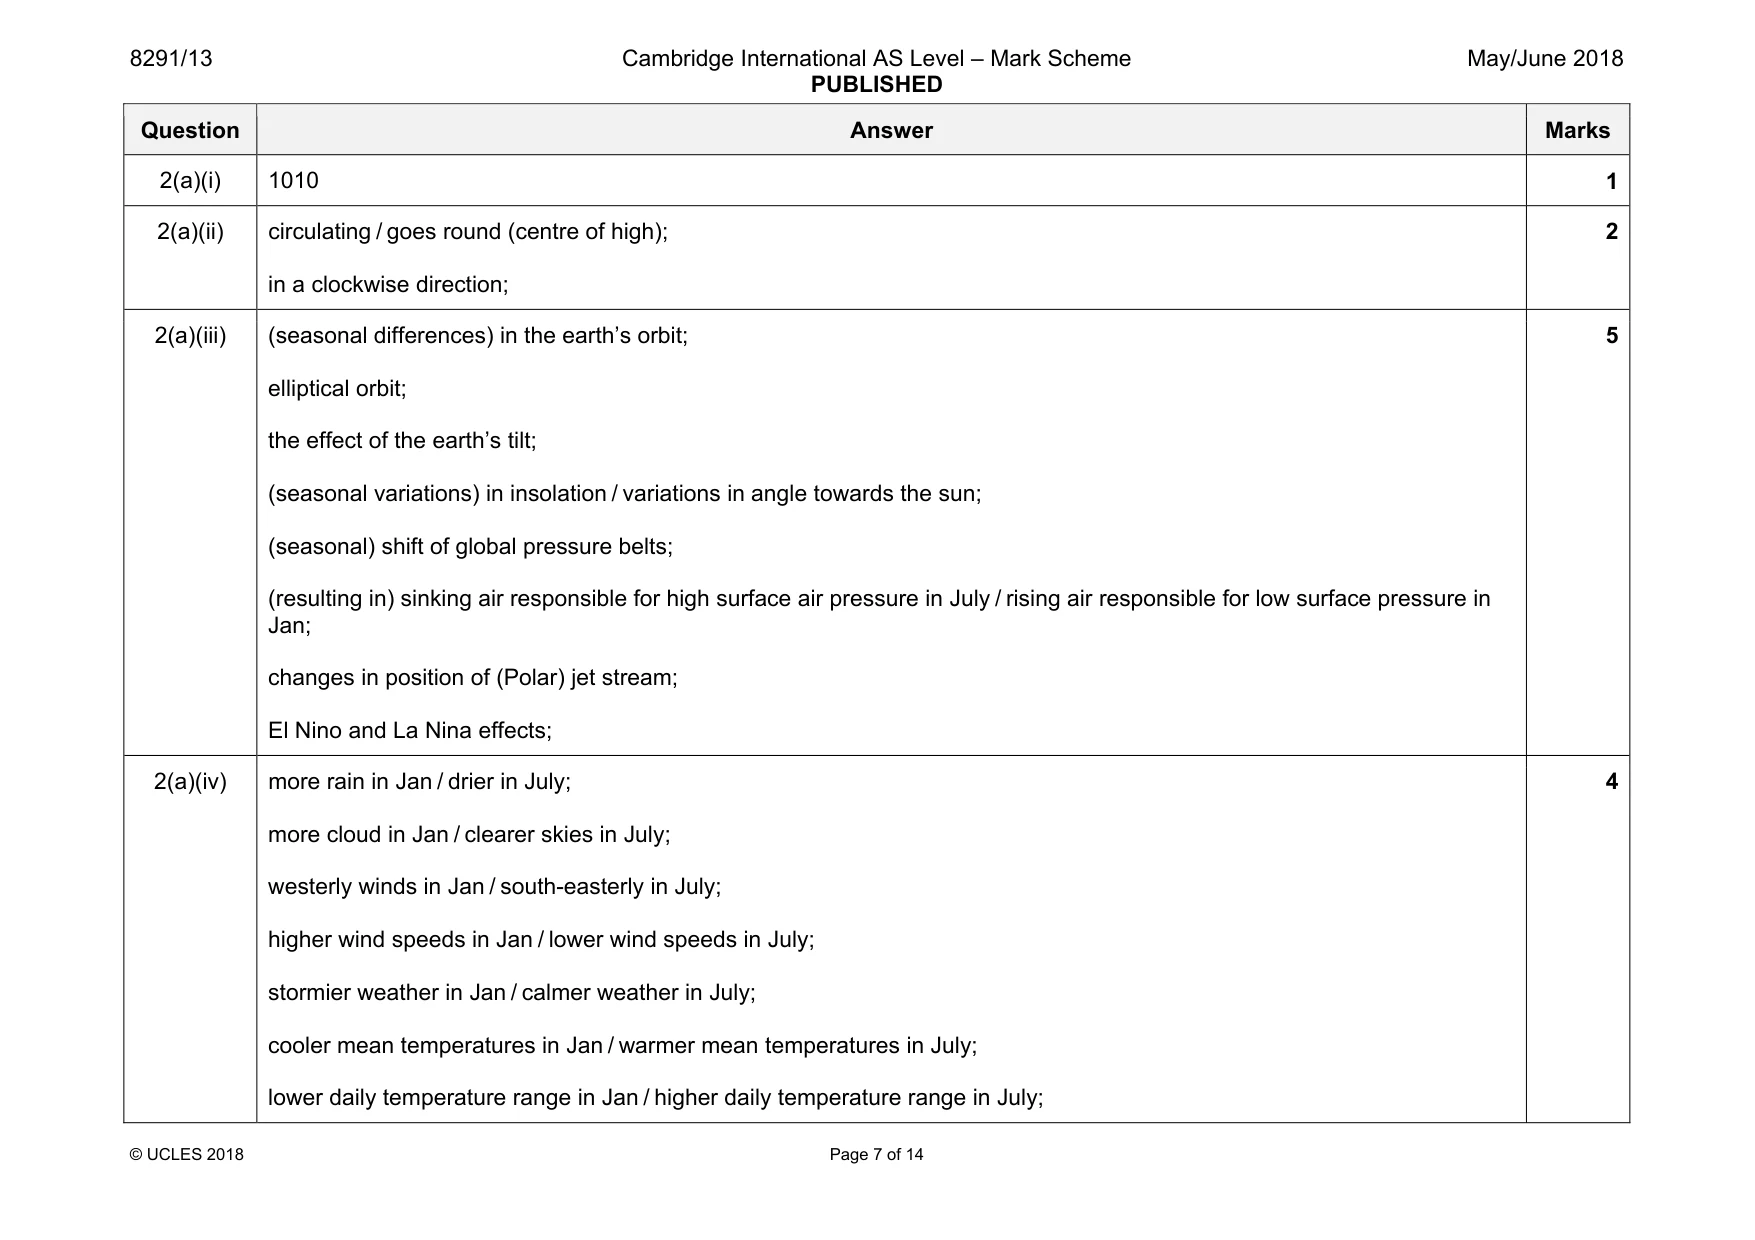
8291/13 Cambridge International AS Level – Mark Scheme PUBLISHED May/June 2018 © UCLES 2018 Page 7 of 14 Question Answer Marks 2(a)(i) 1010 1 2(a)(ii) circulating / goes round (centre of high); in a clockwise direction; 2 2(a)(iii) (seasonal differences) in the earth’s orbit; elliptical orbit; the effect of the earth’s tilt; (seasonal variations) in insolation / variations in angle towards the sun; (seasonal) shift of global pressure belts; (resulting in) sinking air responsible for high surface air pressure in July / rising air responsible for low surface pressure in Jan; changes in position of (Polar) jet stream; El Nino and La Nina effects; 5 2(a)(iv) more rain in Jan / drier in July; more cloud in Jan / clearer skies in July; westerly winds in Jan / south-easterly in July; higher wind speeds in Jan / lower wind speeds in July; stormier weather in Jan / calmer weather in July; cooler mean temperatures in Jan / warmer mean temperatures in July; lower daily temperature range in Jan / higher daily temperature range in July; 4
Mark scheme, page 8
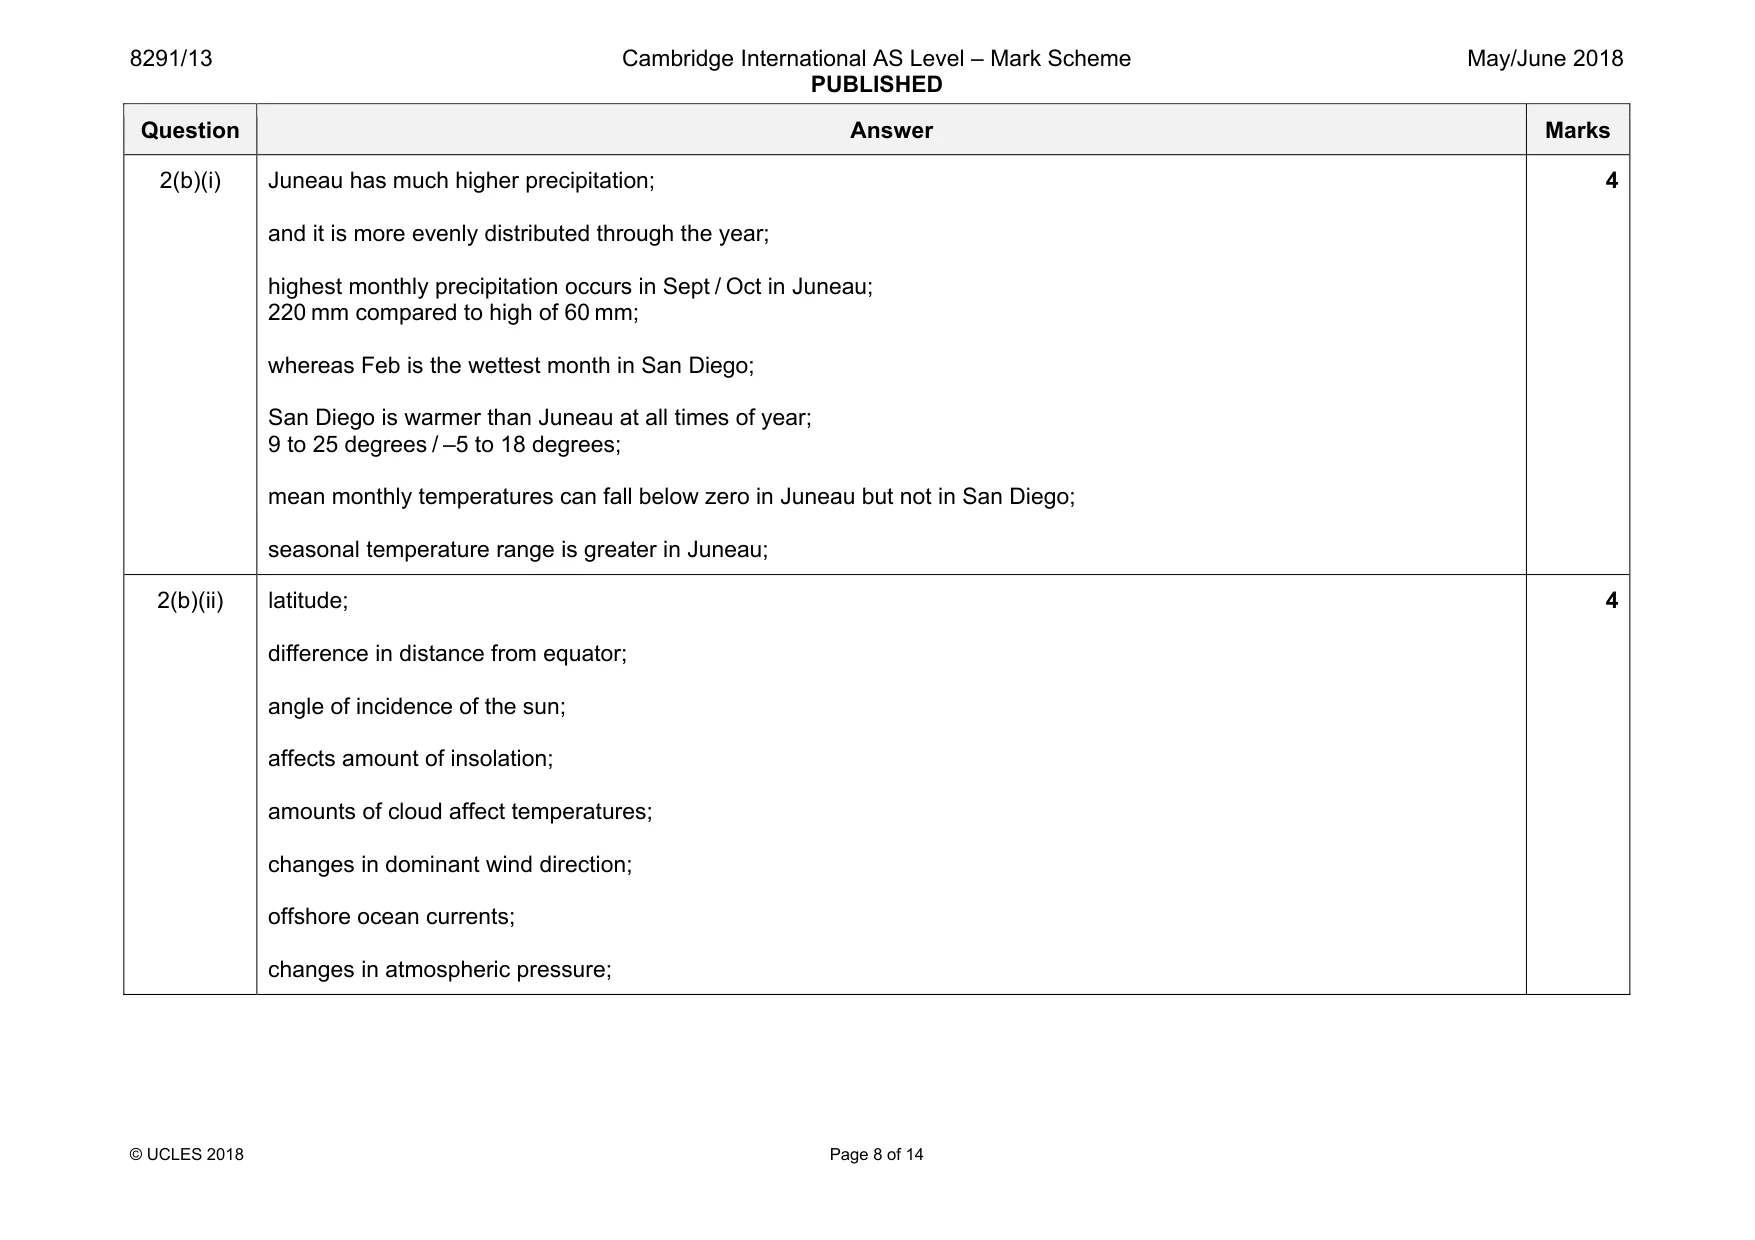
8291/13 Cambridge International AS Level – Mark Scheme PUBLISHED May/June 2018 © UCLES 2018 Page 8 of 14 Question Answer Marks 2(b)(i) Juneau has much higher precipitation; and it is more evenly distributed through the year; highest monthly precipitation occurs in Sept / Oct in Juneau; 220 mm compared to high of 60 mm; whereas Feb is the wettest month in San Diego; San Diego is warmer than Juneau at all times of year; 9 to 25 degrees / –5 to 18 degrees; mean monthly temperatures can fall below zero in Juneau but not in San Diego; seasonal temperature range is greater in Juneau; 4 2(b)(ii) latitude; difference in distance from equator; angle of incidence of the sun; affects amount of insolation; amounts of cloud affect temperatures; changes in dominant wind direction; offshore ocean currents; changes in atmospheric pressure; 4
Mark scheme, page 9
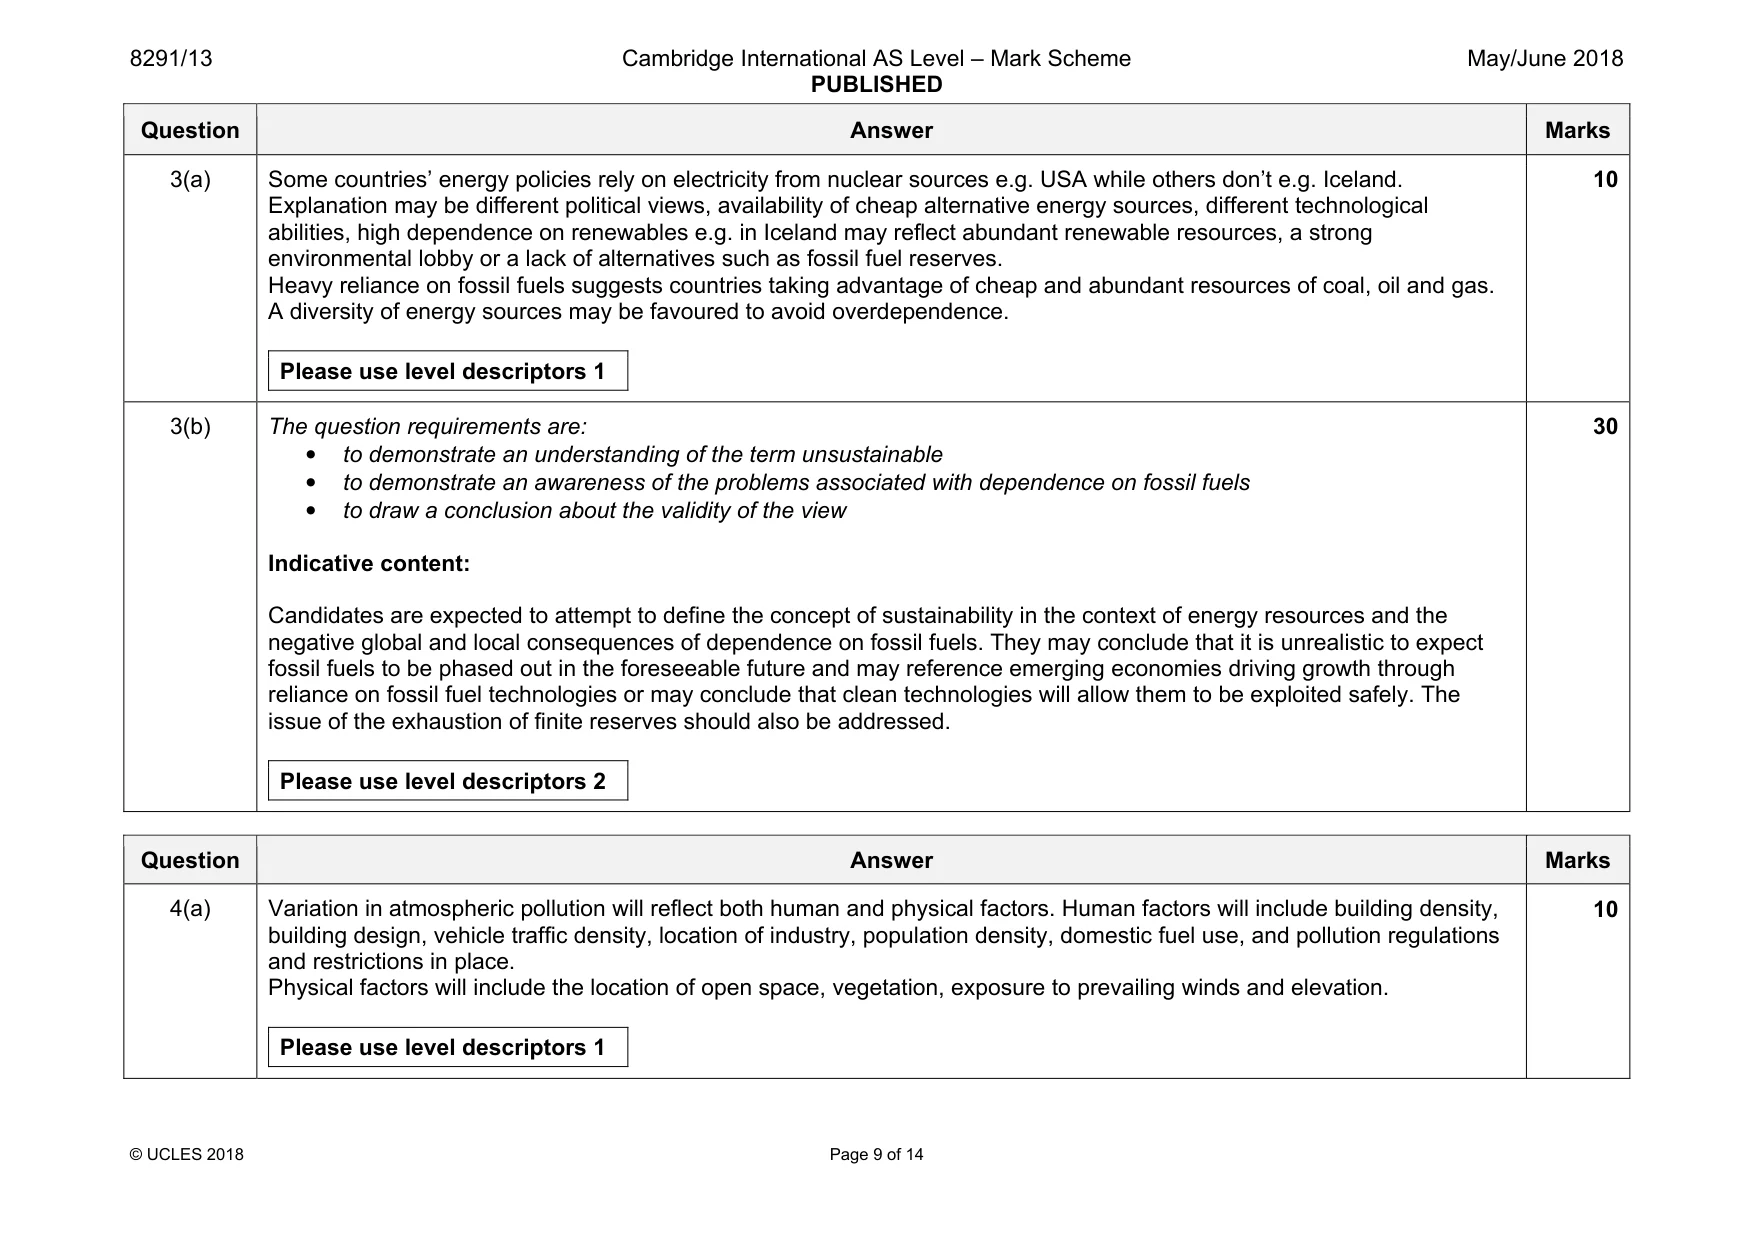
8291/13 Cambridge International AS Level – Mark Scheme PUBLISHED May/June 2018 © UCLES 2018 Page 9 of 14 Question Answer Marks 3(a) Some countries’ energy policies rely on electricity from nuclear sources e.g. USA while others don’t e.g. Iceland. Explanation may be different political views, availability of cheap alternative energy sources, different technological abilities, high dependence on renewables e.g. in Iceland may reflect abundant renewable resources, a strong environmental lobby or a lack of alternatives such as fossil fuel reserves. Heavy reliance on fossil fuels suggests countries taking advantage of cheap and abundant resources of coal, oil and gas. A diversity of energy sources may be favoured to avoid overdependence. Please use level descriptors 1 10 3(b) The question requirements are: • to demonstrate an understanding of the term unsustainable • to demonstrate an awareness of the problems associated with dependence on fossil fuels • to draw a conclusion about the validity of the view Indicative content: Candidates are expected to attempt to define the concept of sustainability in the context of energy resources and the negative global and local consequences of dependence on fossil fuels. They may conclude that it is unrealistic to expect fossil fuels to be phased out in the foreseeable future and may reference emerging economies driving growth through reliance on fossil fuel technologies or may conclude that clean technologies will allow them to be exploited safely. The issue of the exhaustion of finite reserves should also be addressed. Please use level descriptors 2 30 Question Answer Marks 4(a) Variation in atmospheric pollution will reflect both human and physical factors. Human factors will include building density, building design, vehicle traffic density, location of industry, population density, domestic fuel use, and pollution regulations and restrictions in place. Physical factors will include the location of open space, vegetation, exposure to prevailing winds and elevation. Please use level descriptors 1 10
Mark scheme, page 10
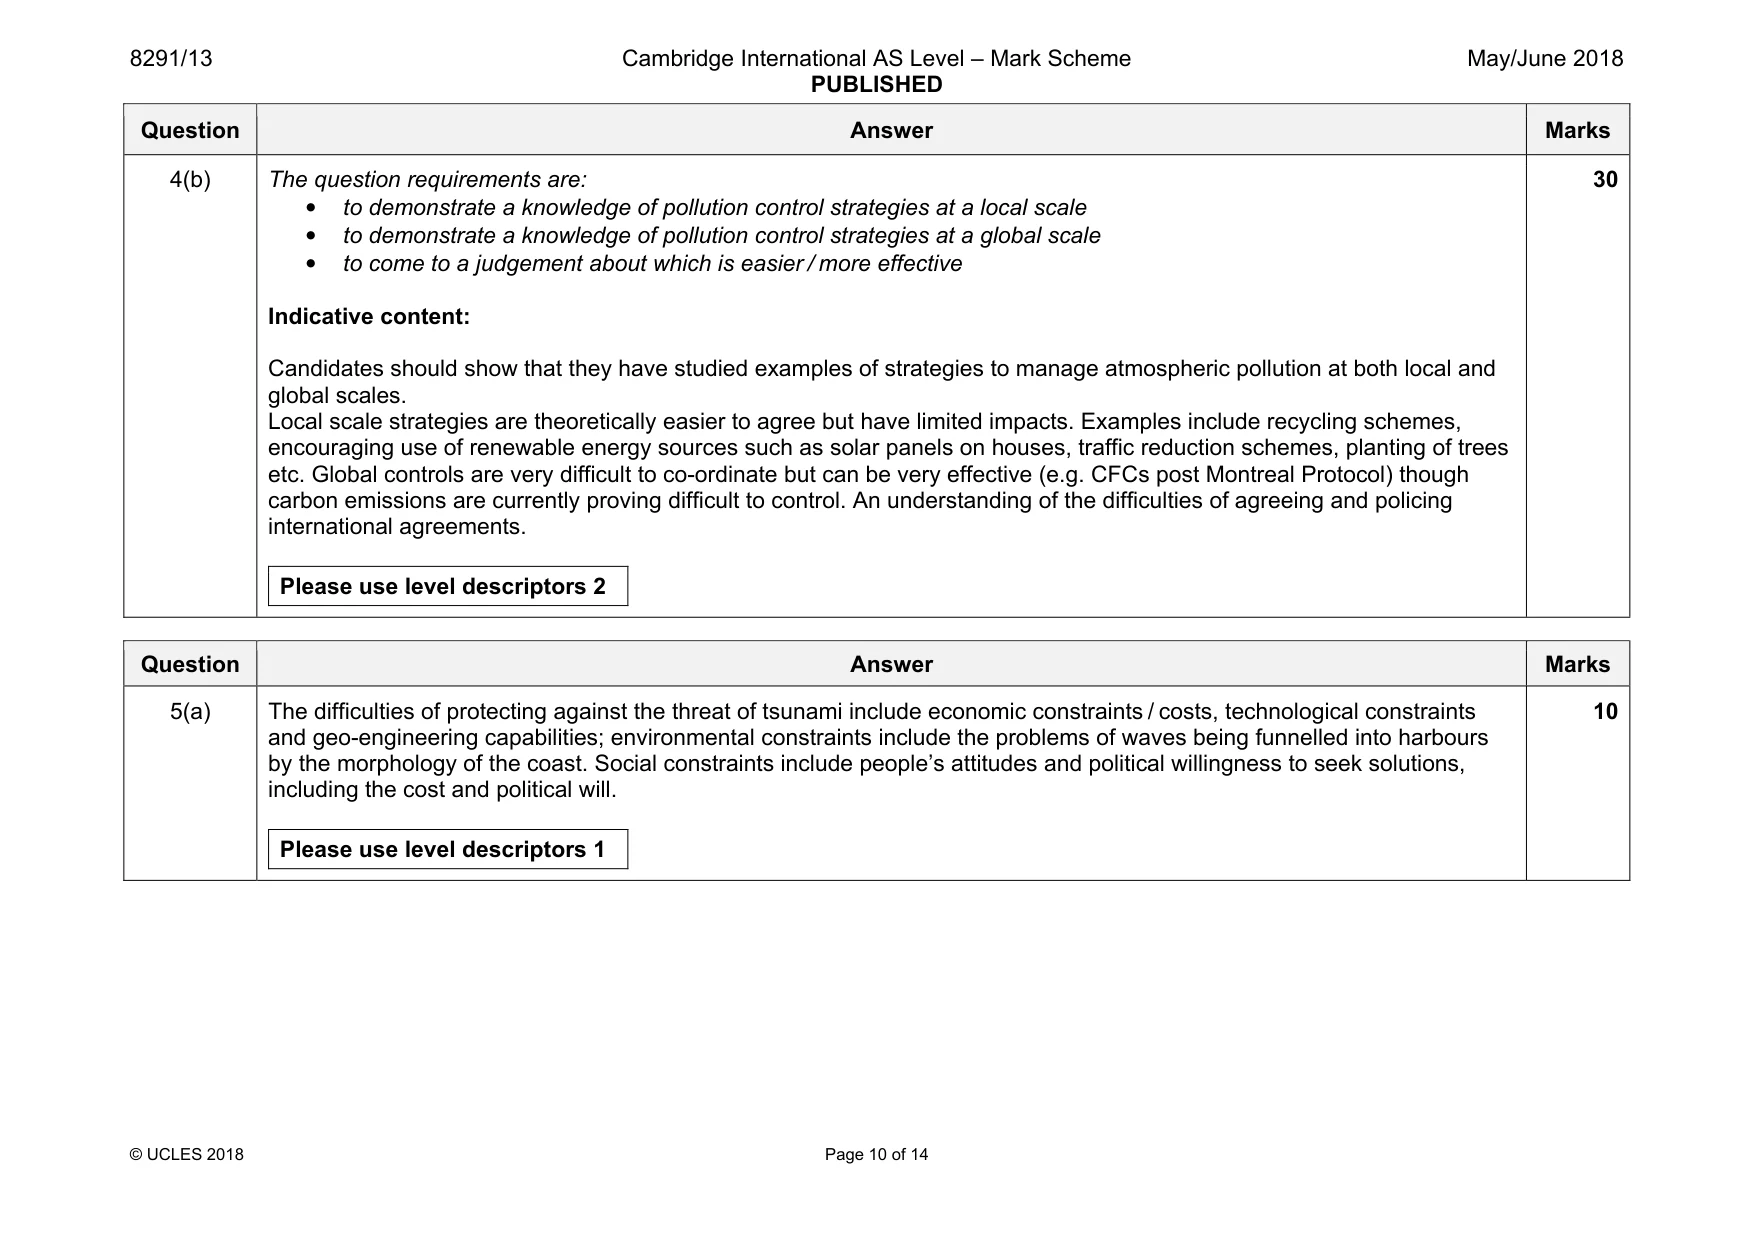
8291/13 Cambridge International AS Level – Mark Scheme PUBLISHED May/June 2018 © UCLES 2018 Page 10 of 14 Question Answer Marks 4(b) The question requirements are: • to demonstrate a knowledge of pollution control strategies at a local scale • to demonstrate a knowledge of pollution control strategies at a global scale • to come to a judgement about which is easier / more effective Indicative content: Candidates should show that they have studied examples of strategies to manage atmospheric pollution at both local and global scales. Local scale strategies are theoretically easier to agree but have limited impacts. Examples include recycling schemes, encouraging use of renewable energy sources such as solar panels on houses, traffic reduction schemes, planting of trees etc. Global controls are very difficult to co-ordinate but can be very effective (e.g. CFCs post Montreal Protocol) though carbon emissions are currently proving difficult to control. An understanding of the difficulties of agreeing and policing international agreements. Please use level descriptors 2 30 Question Answer Marks 5(a) The difficulties of protecting against the threat of tsunami include economic constraints / costs, technological constraints and geo-engineering capabilities; environmental constraints include the problems of waves being funnelled into harbours by the morphology of the coast. Social constraints include people’s attitudes and political willingness to seek solutions, including the cost and political will. Please use level descriptors 1 10
Mark scheme, page 11
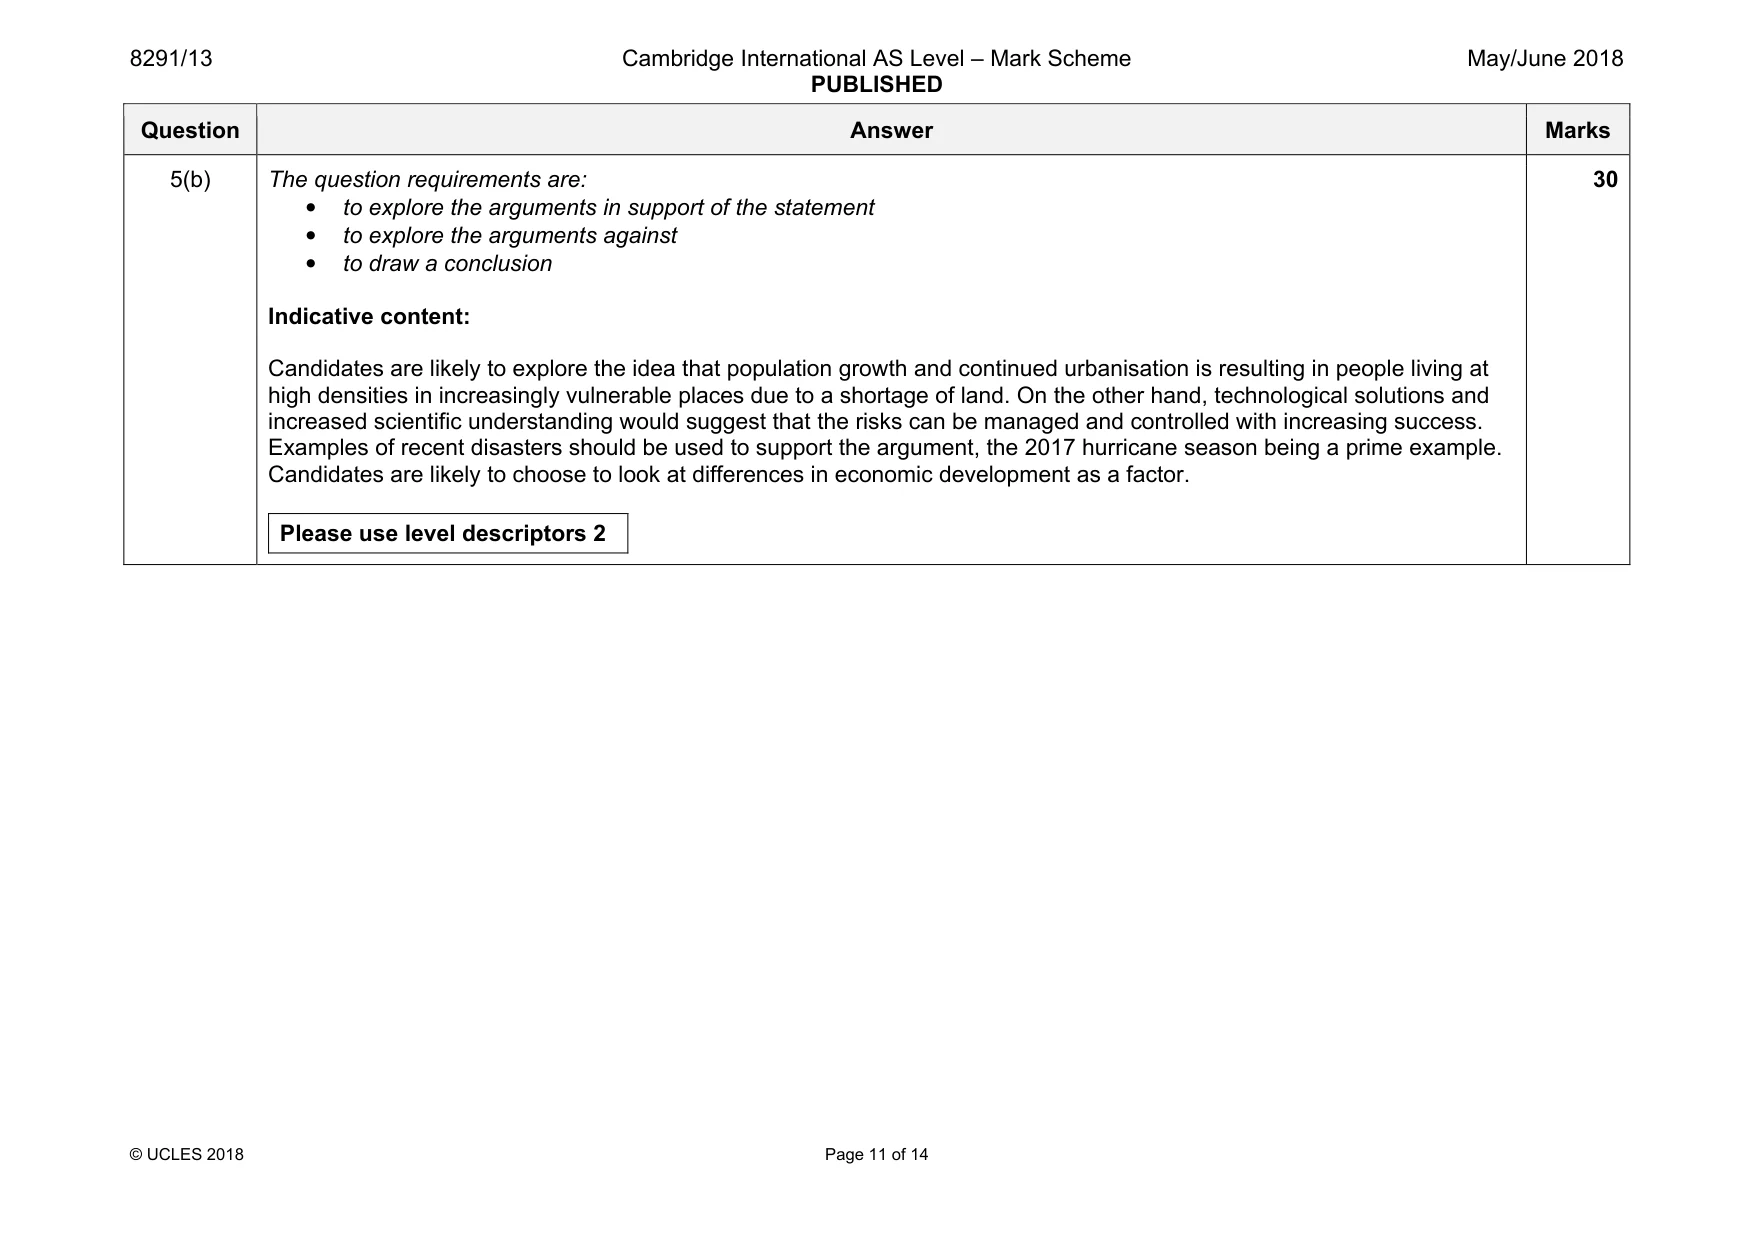
8291/13 Cambridge International AS Level – Mark Scheme PUBLISHED May/June 2018 © UCLES 2018 Page 11 of 14 Question Answer Marks 5(b) The question requirements are: • to explore the arguments in support of the statement • to explore the arguments against • to draw a conclusion Indicative content: Candidates are likely to explore the idea that population growth and continued urbanisation is resulting in people living at high densities in increasingly vulnerable places due to a shortage of land. On the other hand, technological solutions and increased scientific understanding would suggest that the risks can be managed and controlled with increasing success. Examples of recent disasters should be used to support the argument, the 2017 hurricane season being a prime example. Candidates are likely to choose to look at differences in economic development as a factor. Please use level descriptors 2 30
Mark scheme, page 12
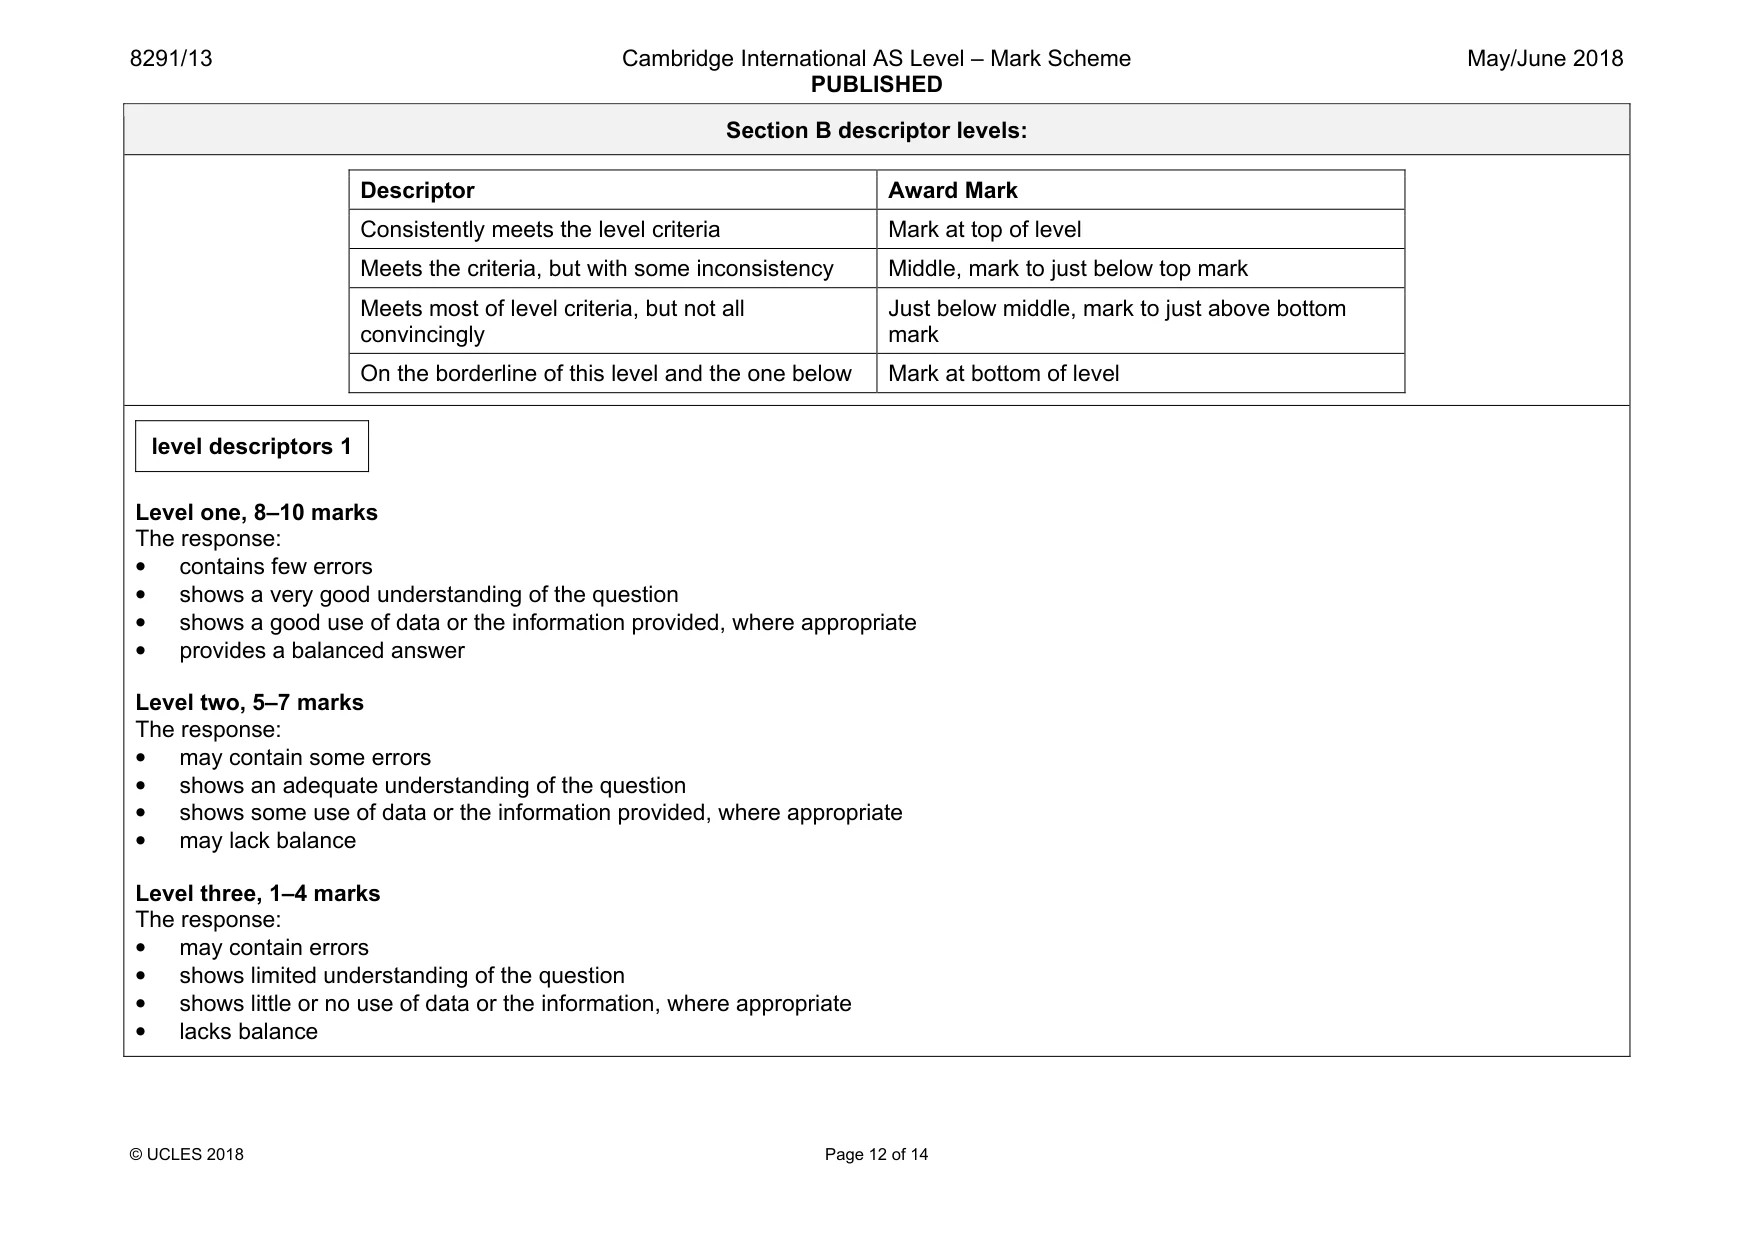
8291/13 Cambridge International AS Level – Mark Scheme PUBLISHED May/June 2018 © UCLES 2018 Page 12 of 14 Section B descriptor levels: Descriptor Award Mark Consistently meets the level criteria Mark at top of level Meets the criteria, but with some inconsistency Middle, mark to just below top mark Meets most of level criteria, but not all convincingly Just below middle, mark to just above bottom mark On the borderline of this level and the one below Mark at bottom of level level descriptors 1 Level one, 8–10 marks The response: • contains few errors • shows a very good understanding of the question • shows a good use of data or the information provided, where appropriate • provides a balanced answer Level two, 5–7 marks The response: • may contain some errors • shows an adequate understanding of the question • shows some use of data or the information provided, where appropriate • may lack balance Level three, 1–4 marks The response: • may contain errors • shows limited understanding of the question • shows little or no use of data or the information, where appropriate • lacks balance
Mark scheme, page 13
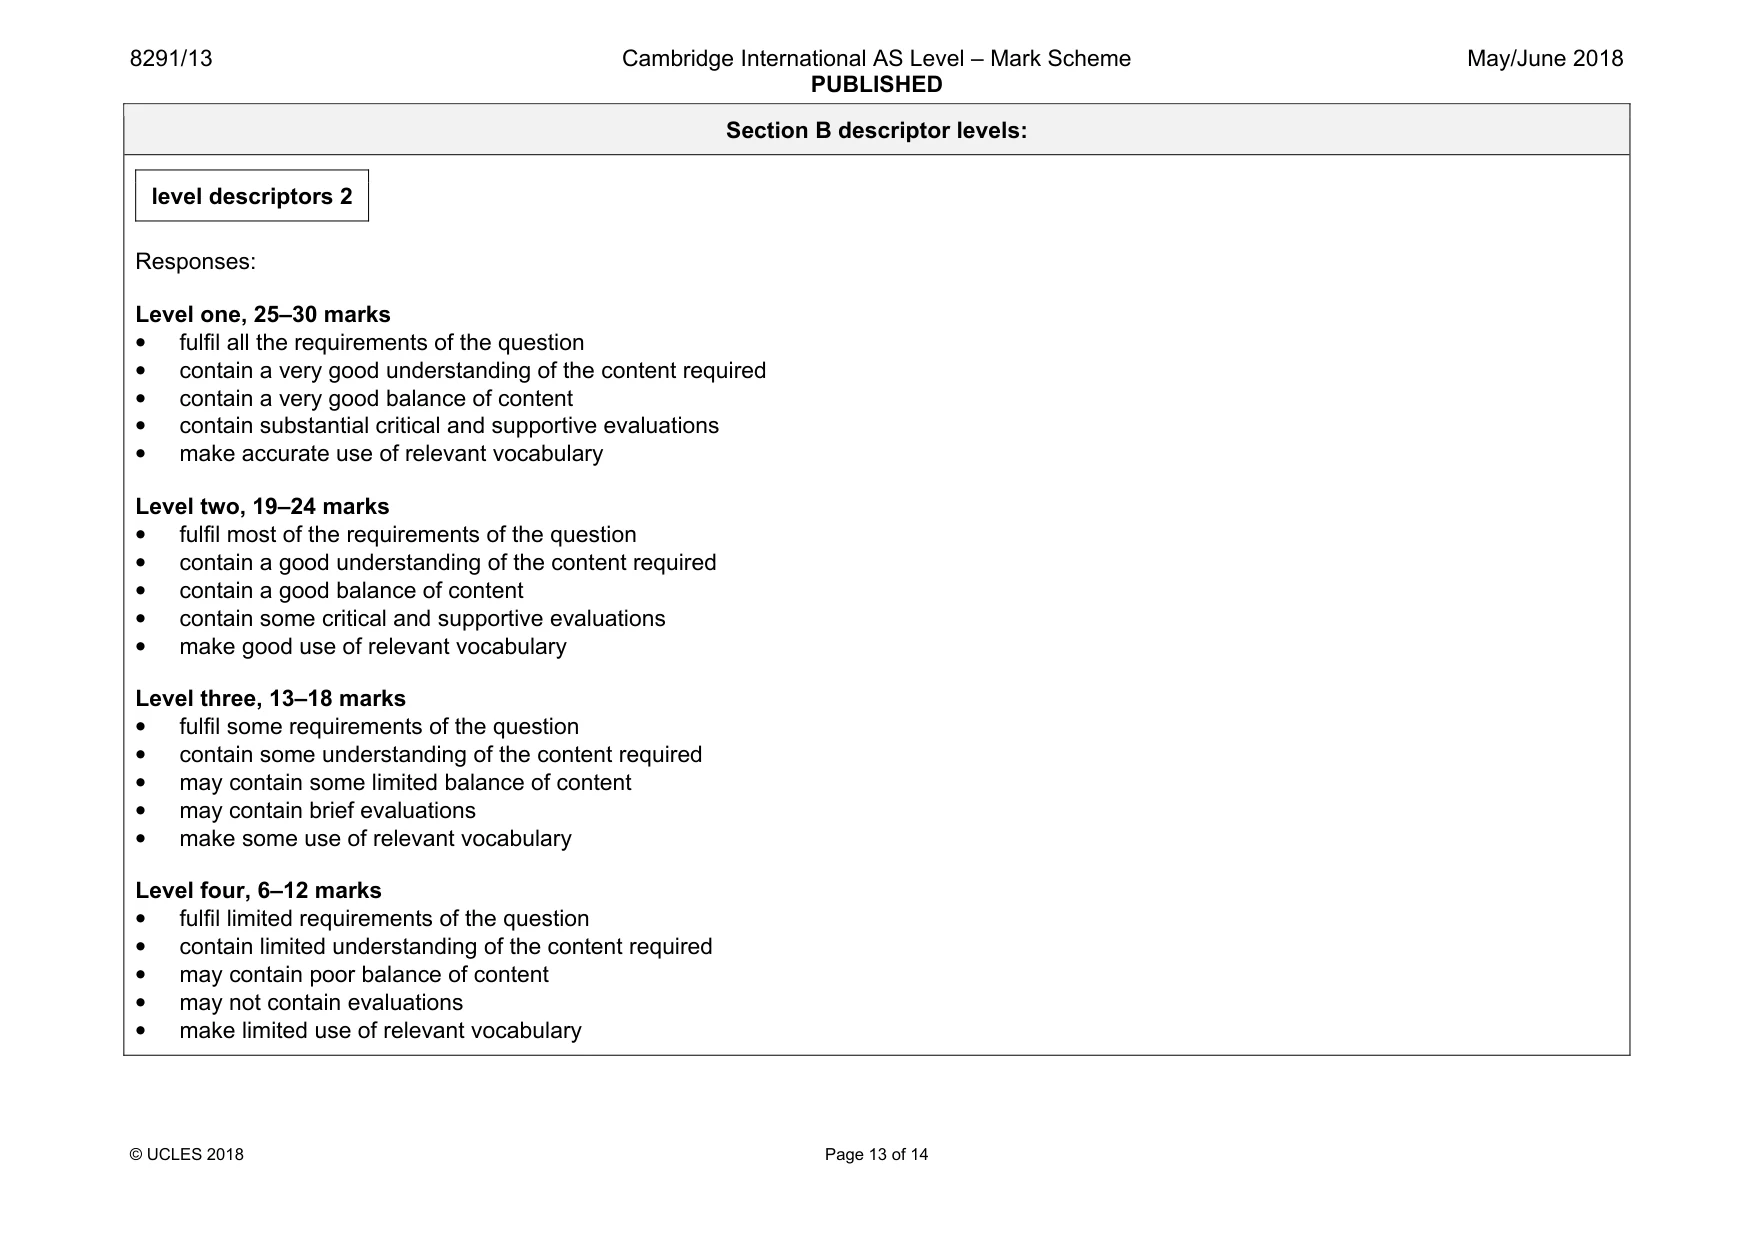
8291/13 Cambridge International AS Level – Mark Scheme PUBLISHED May/June 2018 © UCLES 2018 Page 13 of 14 Section B descriptor levels: level descriptors 2 Responses: Level one, 25–30 marks • fulfil all the requirements of the question • contain a very good understanding of the content required • contain a very good balance of content • contain substantial critical and supportive evaluations • make accurate use of relevant vocabulary Level two, 19–24 marks • fulfil most of the requirements of the question • contain a good understanding of the content required • contain a good balance of content • contain some critical and supportive evaluations • make good use of relevant vocabulary Level three, 13–18 marks • fulfil some requirements of the question • contain some understanding of the content required • may contain some limited balance of content • may contain brief evaluations • make some use of relevant vocabulary Level four, 6–12 marks • fulfil limited requirements of the question • contain limited understanding of the content required • may contain poor balance of content • may not contain evaluations • make limited use of relevant vocabulary
Mark scheme, page 14
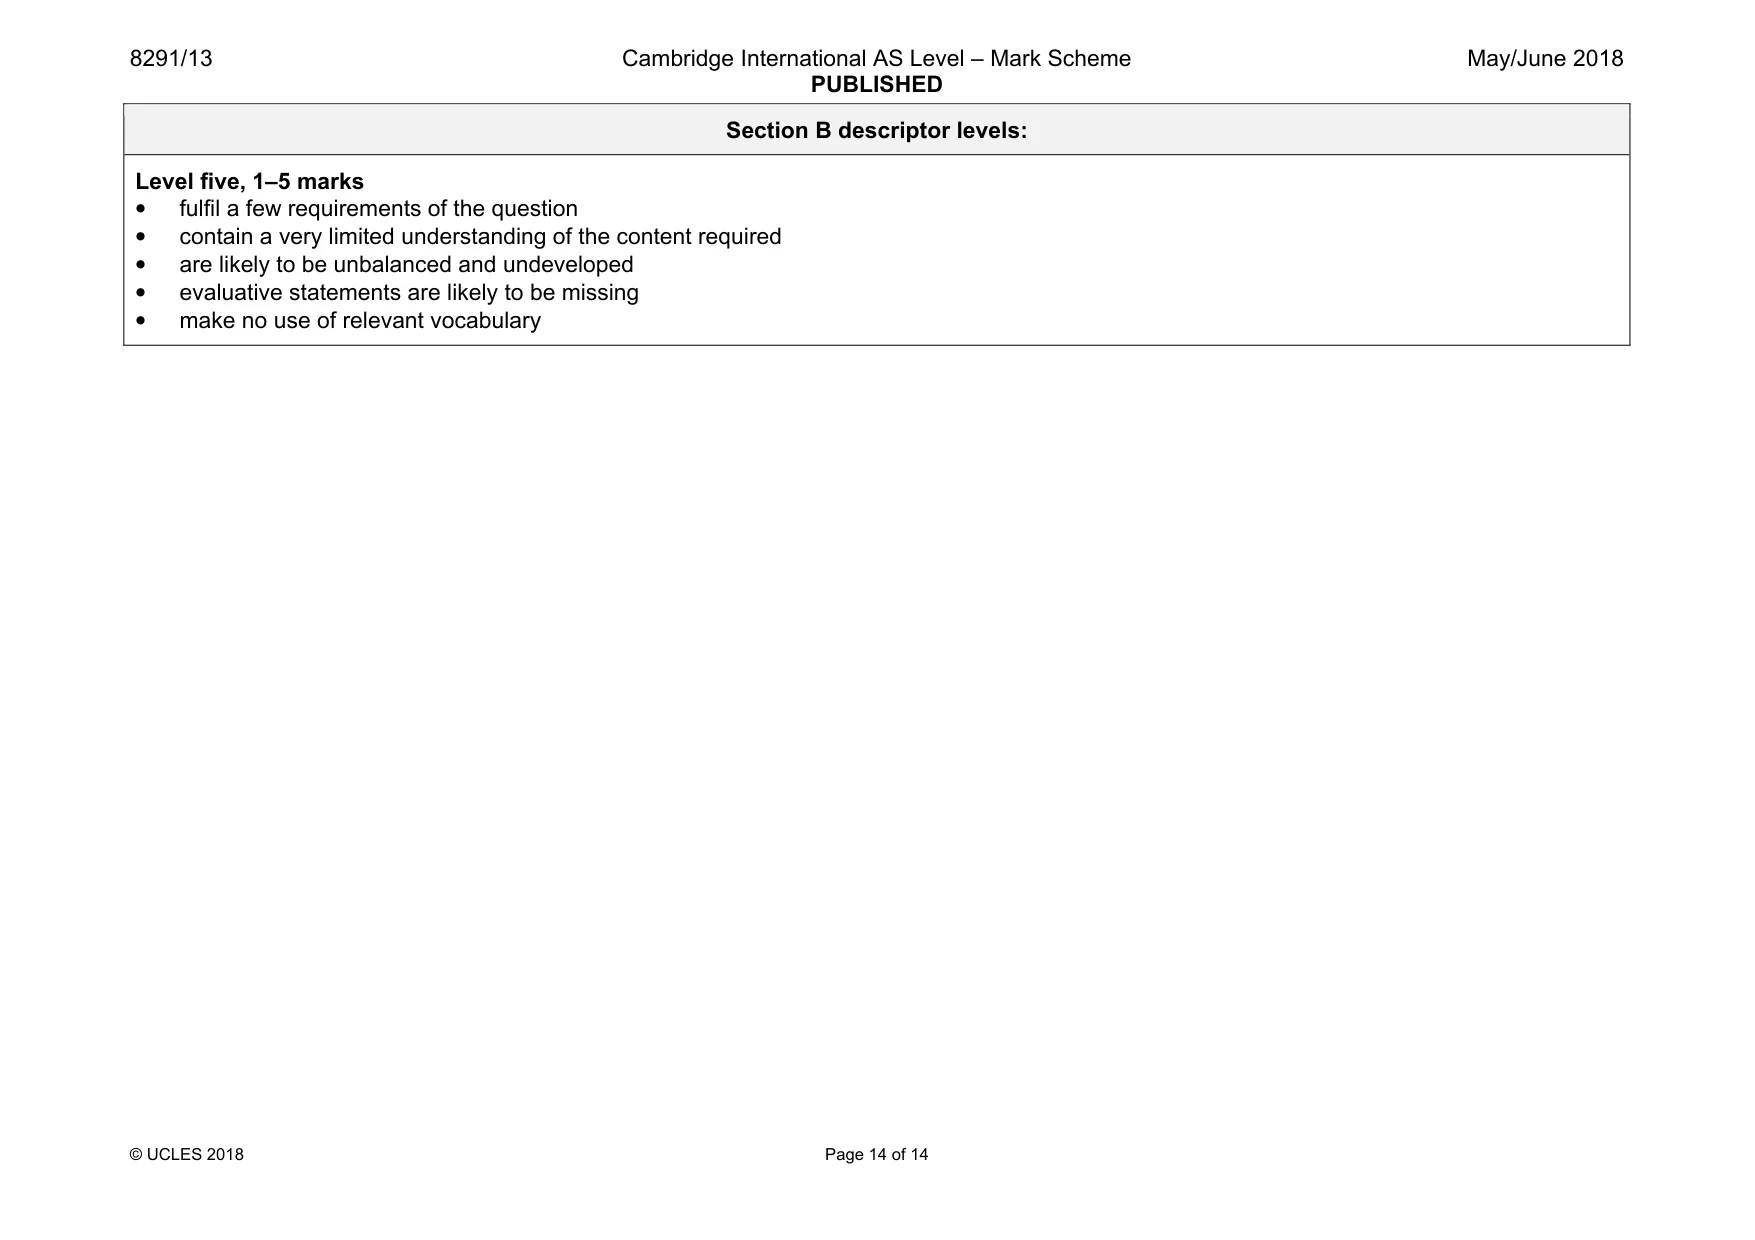
8291/13 Cambridge International AS Level – Mark Scheme PUBLISHED May/June 2018 © UCLES 2018 Page 14 of 14 Section B descriptor levels: Level five, 1–5 marks • fulfil a few requirements of the question • contain a very limited understanding of the content required • are likely to be unbalanced and undeveloped • evaluative statements are likely to be missing • make no use of relevant vocabulary
What you needed in this session
Cambridge’s own grade thresholds for 2018 May/June, Paper 1 · Variant 3. A higher threshold means an easier paper — the bar moves with how the cohort did.