Cambridge A Level Economics 9708 — 2017 May/June Paper 3 · Variant 1
9708/31/M/J/17 · 30 marks · ≈34 min
The question paper and its mark scheme, free to read here and free to download. This is Cambridge’s own paper, exactly as it was sat.
Question paper12 pages
Mark scheme3 pages
Answers below. Sit the paper first if you are practising.
Paper as text
Question paper, page 1
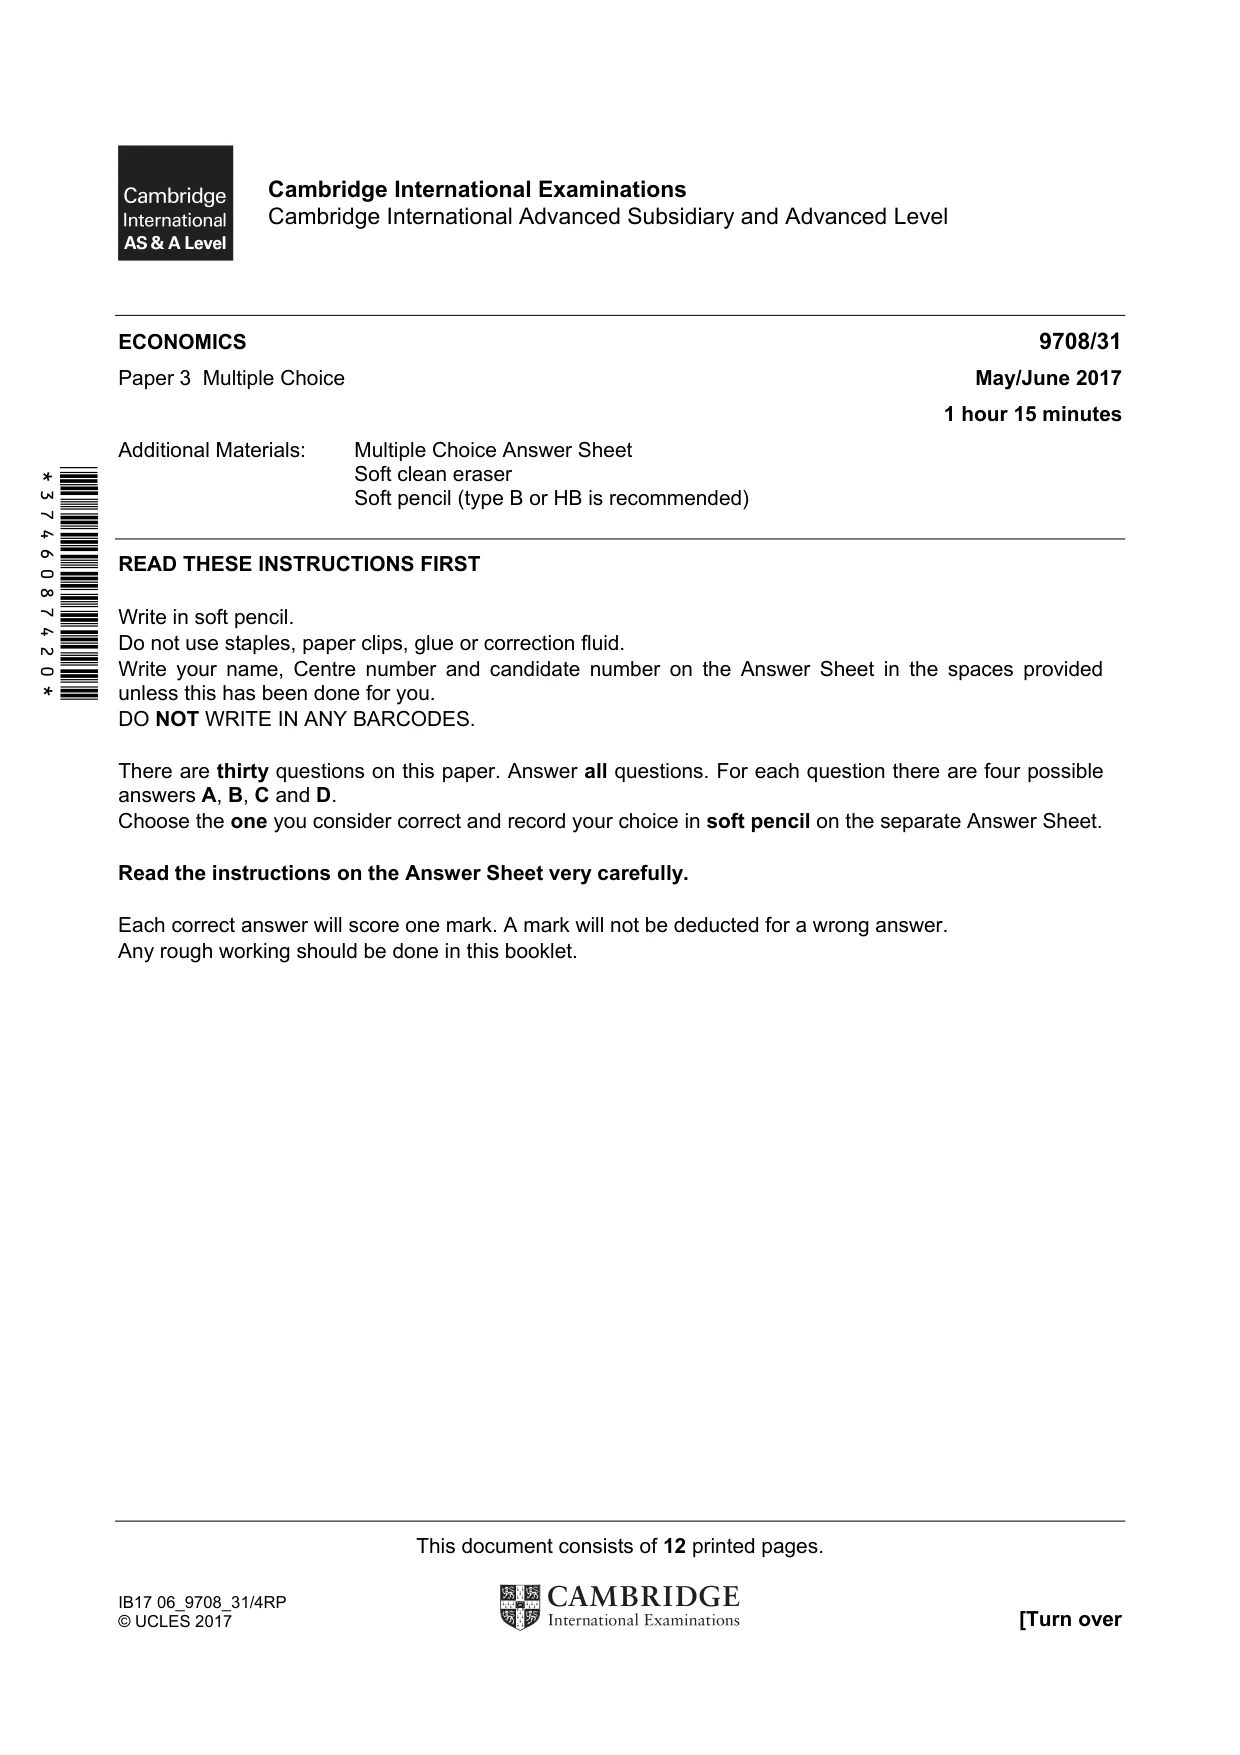
This document consists of 12 printed pages. IB17 06_9708_31/4RP © UCLES 2017 [Turn over *3746087420* Cambridge International Examinations Cambridge International Advanced Subsidiary and Advanced Level ECONOMICS 9708/31 Paper 3 Multiple Choice May/June 2017 1 hour 15 minutes Additional Materials: Multiple Choice Answer Sheet Soft clean eraser Soft pencil (type B or HB is recommended) READ THESE INSTRUCTIONS FIRST Write in soft pencil. Do not use staples, paper clips, glue or correction fluid. Write your name, Centre number and candidate number on the Answer Sheet in the spaces provided unless this has been done for you. DO NOT WRITE IN ANY BARCODES. There are thirty questions on this paper. Answer all questions. For each question there are four possible answers A, B, C and D. Choose the one you consider correct and record your choice in soft pencil on the separate Answer Sheet. Read the instructions on the Answer Sheet very carefully. Each correct answer will score one mark. A mark will not be deducted for a wrong answer. Any rough working should be done in this booklet.
Question paper, page 2
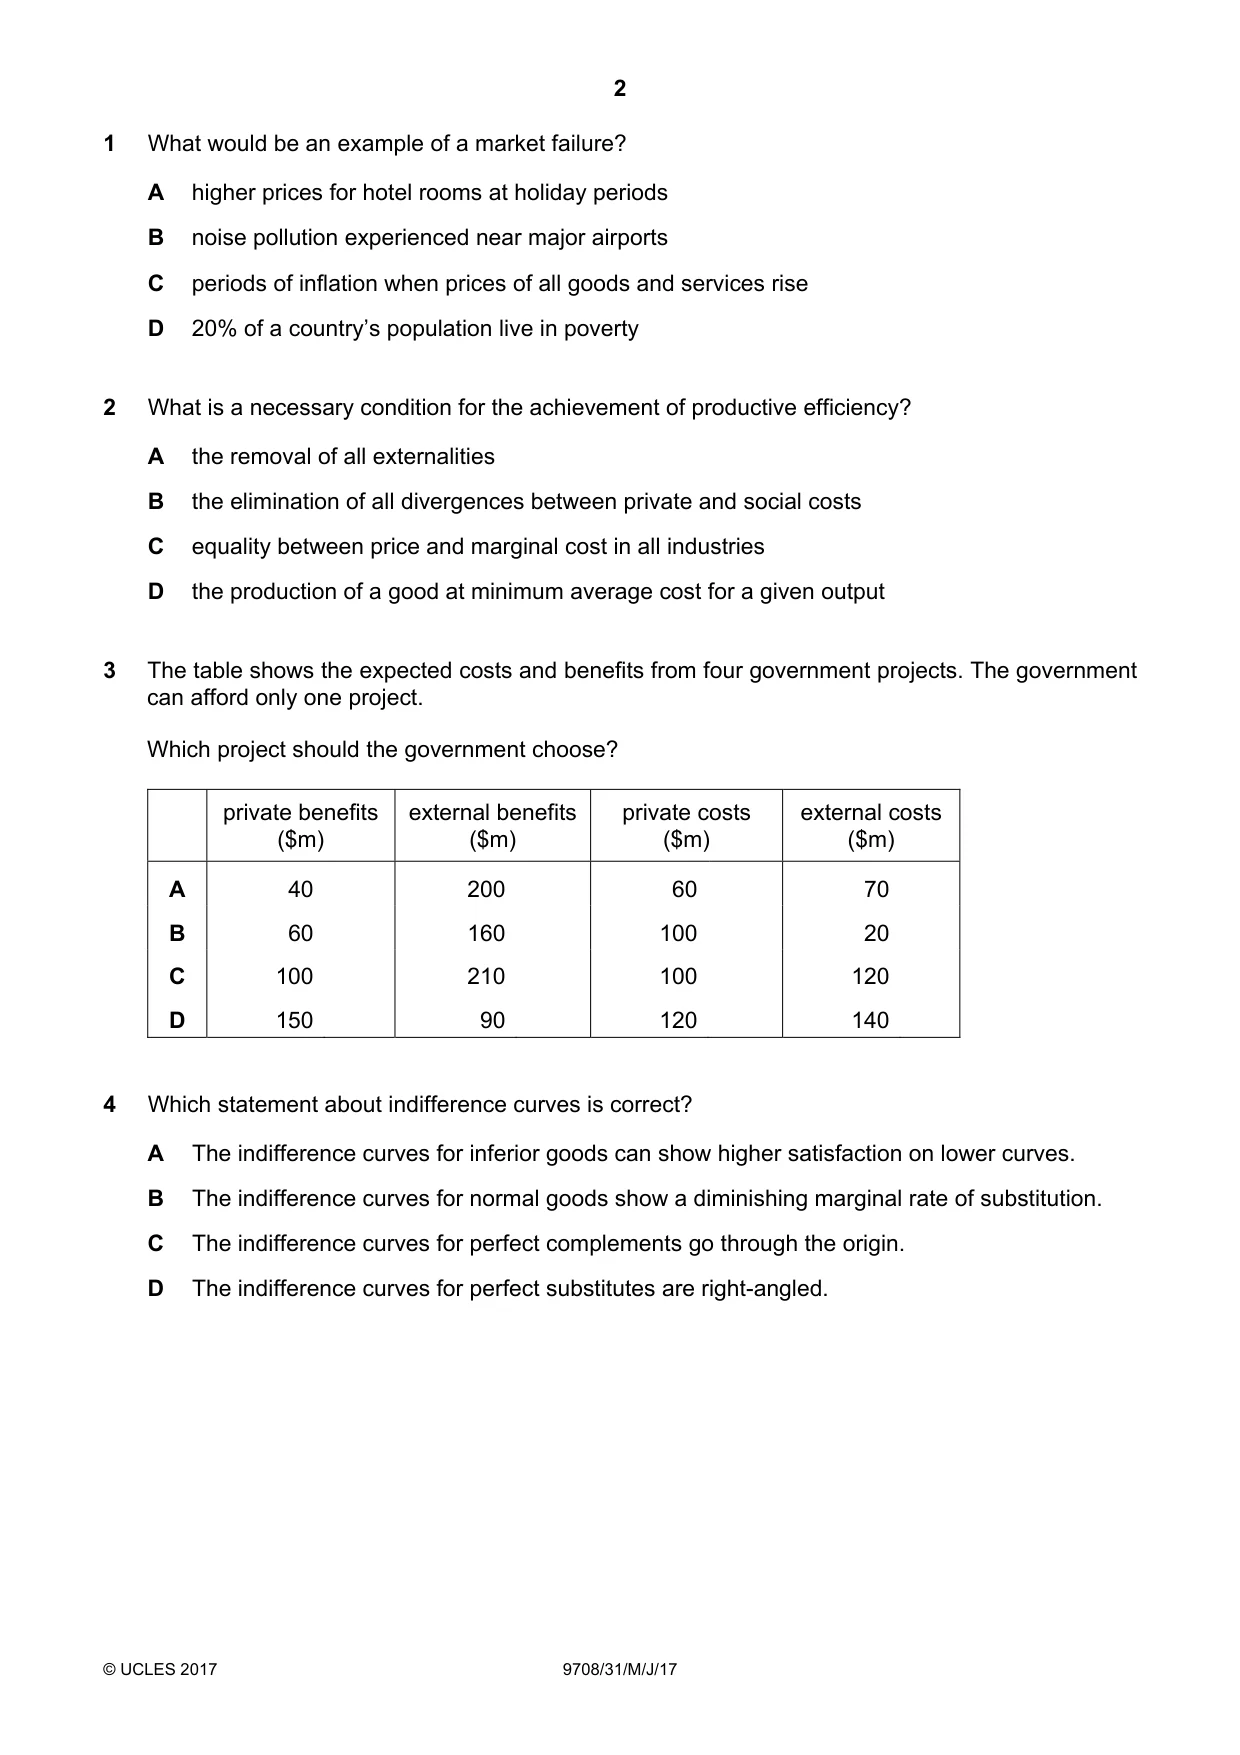
2 © UCLES 2017 9708/31/M/J/17 1 What would be an example of a market failure? A higher prices for hotel rooms at holiday periods B noise pollution experienced near major airports C periods of inflation when prices of all goods and services rise D 20% of a country’s population live in poverty 2 What is a necessary condition for the achievement of productive efficiency? A the removal of all externalities B the elimination of all divergences between private and social costs C equality between price and marginal cost in all industries D the production of a good at minimum average cost for a given output 3 The table shows the expected costs and benefits from four government projects. The government can afford only one project. Which project should the government choose? private benefits ($m) external benefits ($m) private costs ($m) external costs ($m) A 40 200 60 70 B 60 160 100 20 C 100 210 100 120 D 150 90 120 140 4 Which statement about indifference curves is correct? A The indifference curves for inferior goods can show higher satisfaction on lower curves. B The indifference curves for normal goods show a diminishing marginal rate of substitution. C The indifference curves for perfect complements go through the origin. D The indifference curves for perfect substitutes are right-angled.
Question paper, page 3
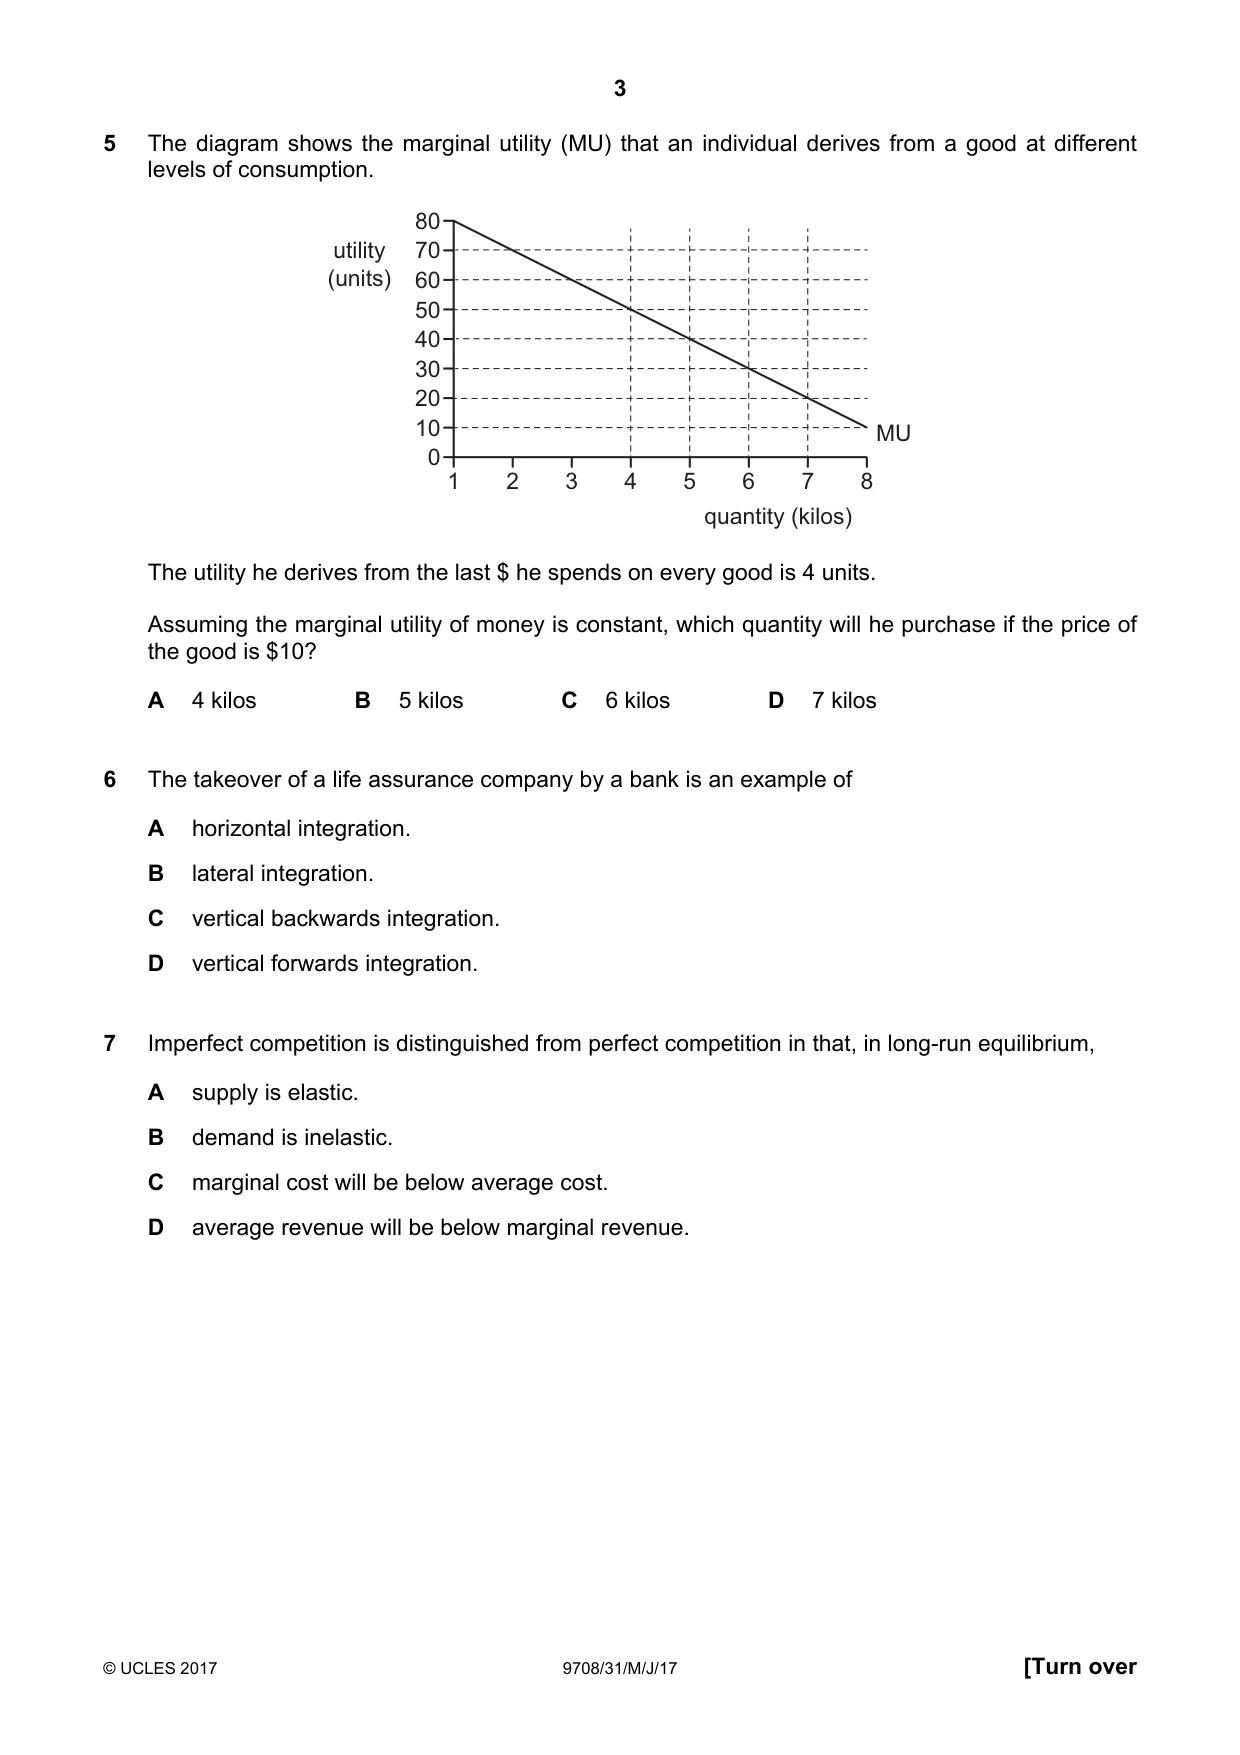
3 © UCLES 2017 9708/31/M/J/17 [Turn over 5 The diagram shows the marginal utility (MU) that an individual derives from a good at different levels of consumption. 1 2 3 4 5 6 7 8 80 70 60 50 40 30 20 10 0 quantity (kilos) utility (units) MU The utility he derives from the last $ he spends on every good is 4 units. Assuming the marginal utility of money is constant, which quantity will he purchase if the price of the good is $10? A 4 kilos B 5 kilos C 6 kilos D 7 kilos 6 The takeover of a life assurance company by a bank is an example of A horizontal integration. B lateral integration. C vertical backwards integration. D vertical forwards integration. 7 Imperfect competition is distinguished from perfect competition in that, in long-run equilibrium, A supply is elastic. B demand is inelastic. C marginal cost will be below average cost. D average revenue will be below marginal revenue.
Question paper, page 4
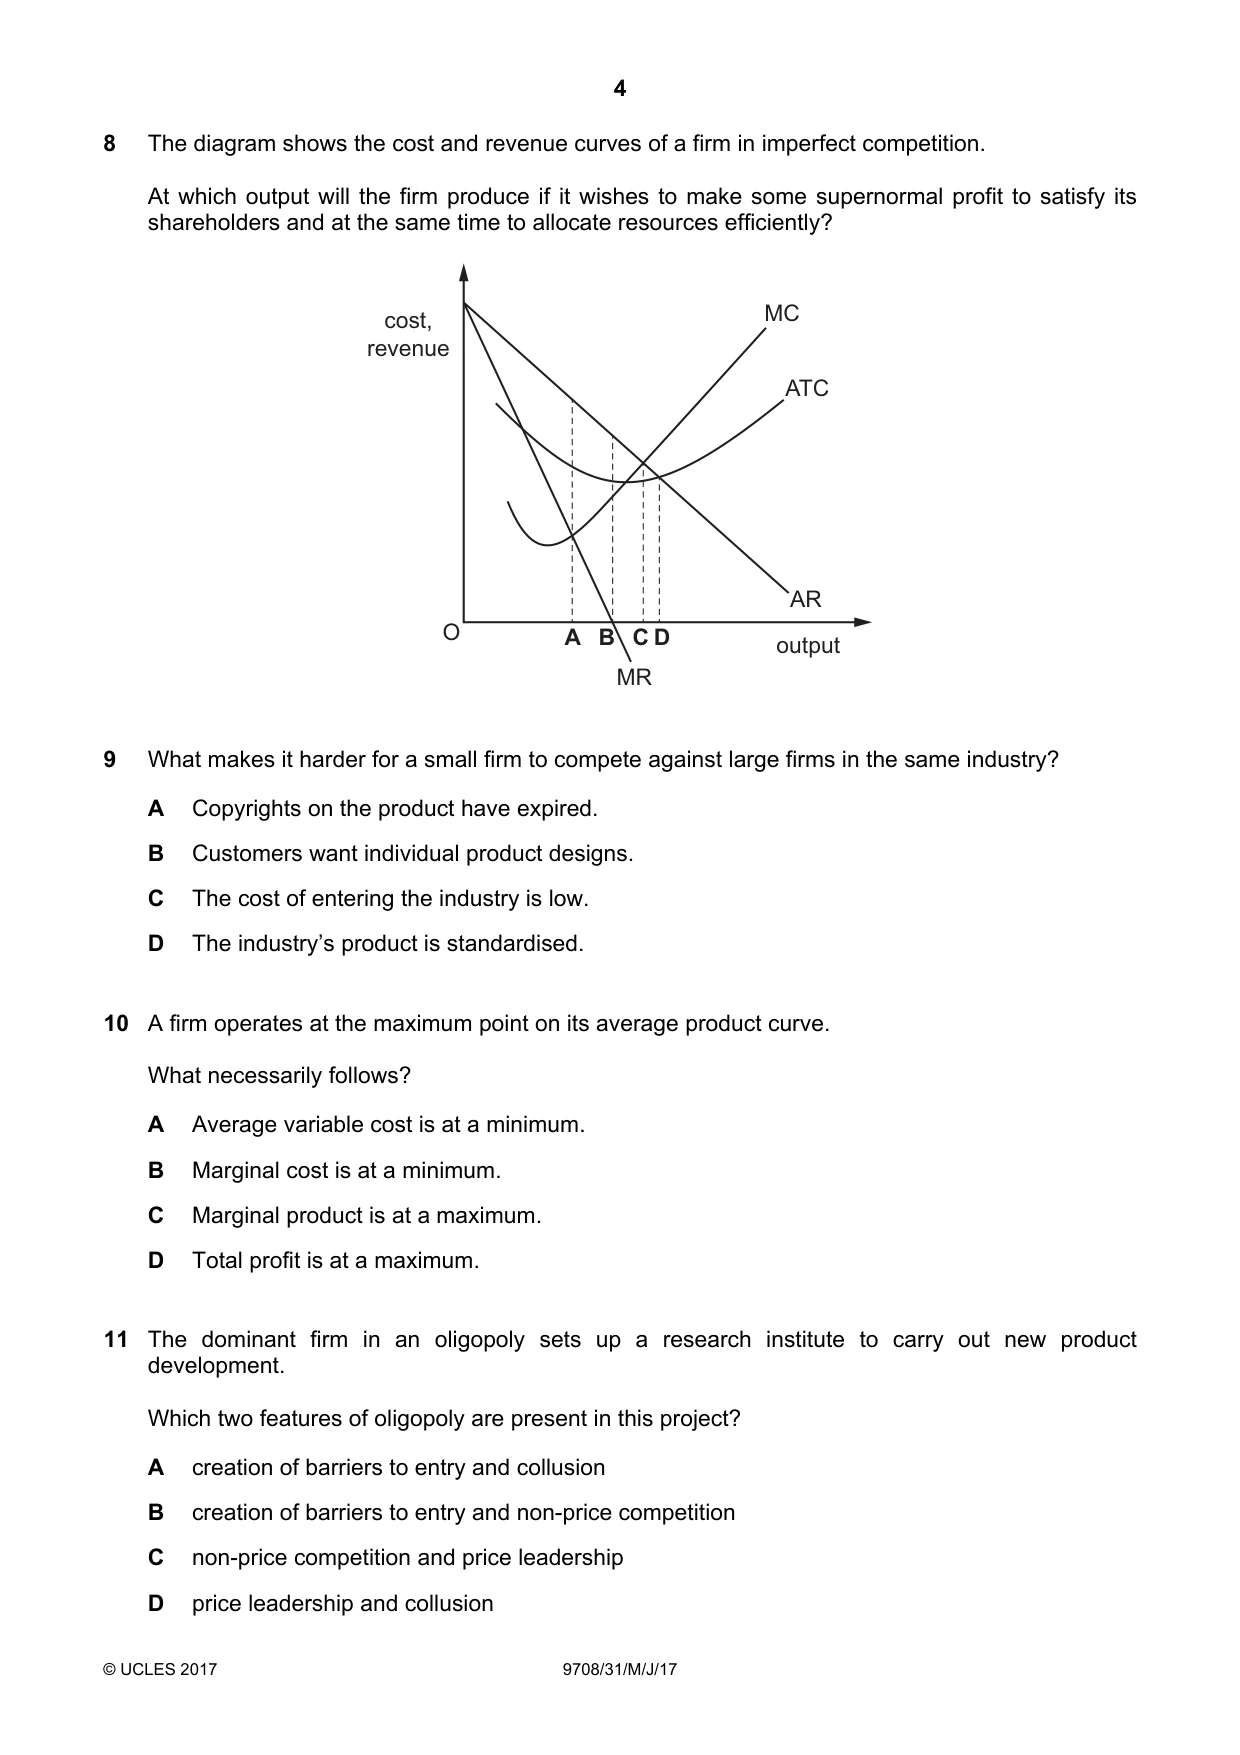
4 © UCLES 2017 9708/31/M/J/17 8 The diagram shows the cost and revenue curves of a firm in imperfect competition. At which output will the firm produce if it wishes to make some supernormal profit to satisfy its shareholders and at the same time to allocate resources efficiently? cost, revenue output O AR ATC MC MR A C D B 9 What makes it harder for a small firm to compete against large firms in the same industry? A Copyrights on the product have expired. B Customers want individual product designs. C The cost of entering the industry is low. D The industry’s product is standardised. 10 A firm operates at the maximum point on its average product curve. What necessarily follows? A Average variable cost is at a minimum. B Marginal cost is at a minimum. C Marginal product is at a maximum. D Total profit is at a maximum. 11 The dominant firm in an oligopoly sets up a research institute to carry out new product development. Which two features of oligopoly are present in this project? A creation of barriers to entry and collusion B creation of barriers to entry and non-price competition C non-price competition and price leadership D price leadership and collusion
Question paper, page 5
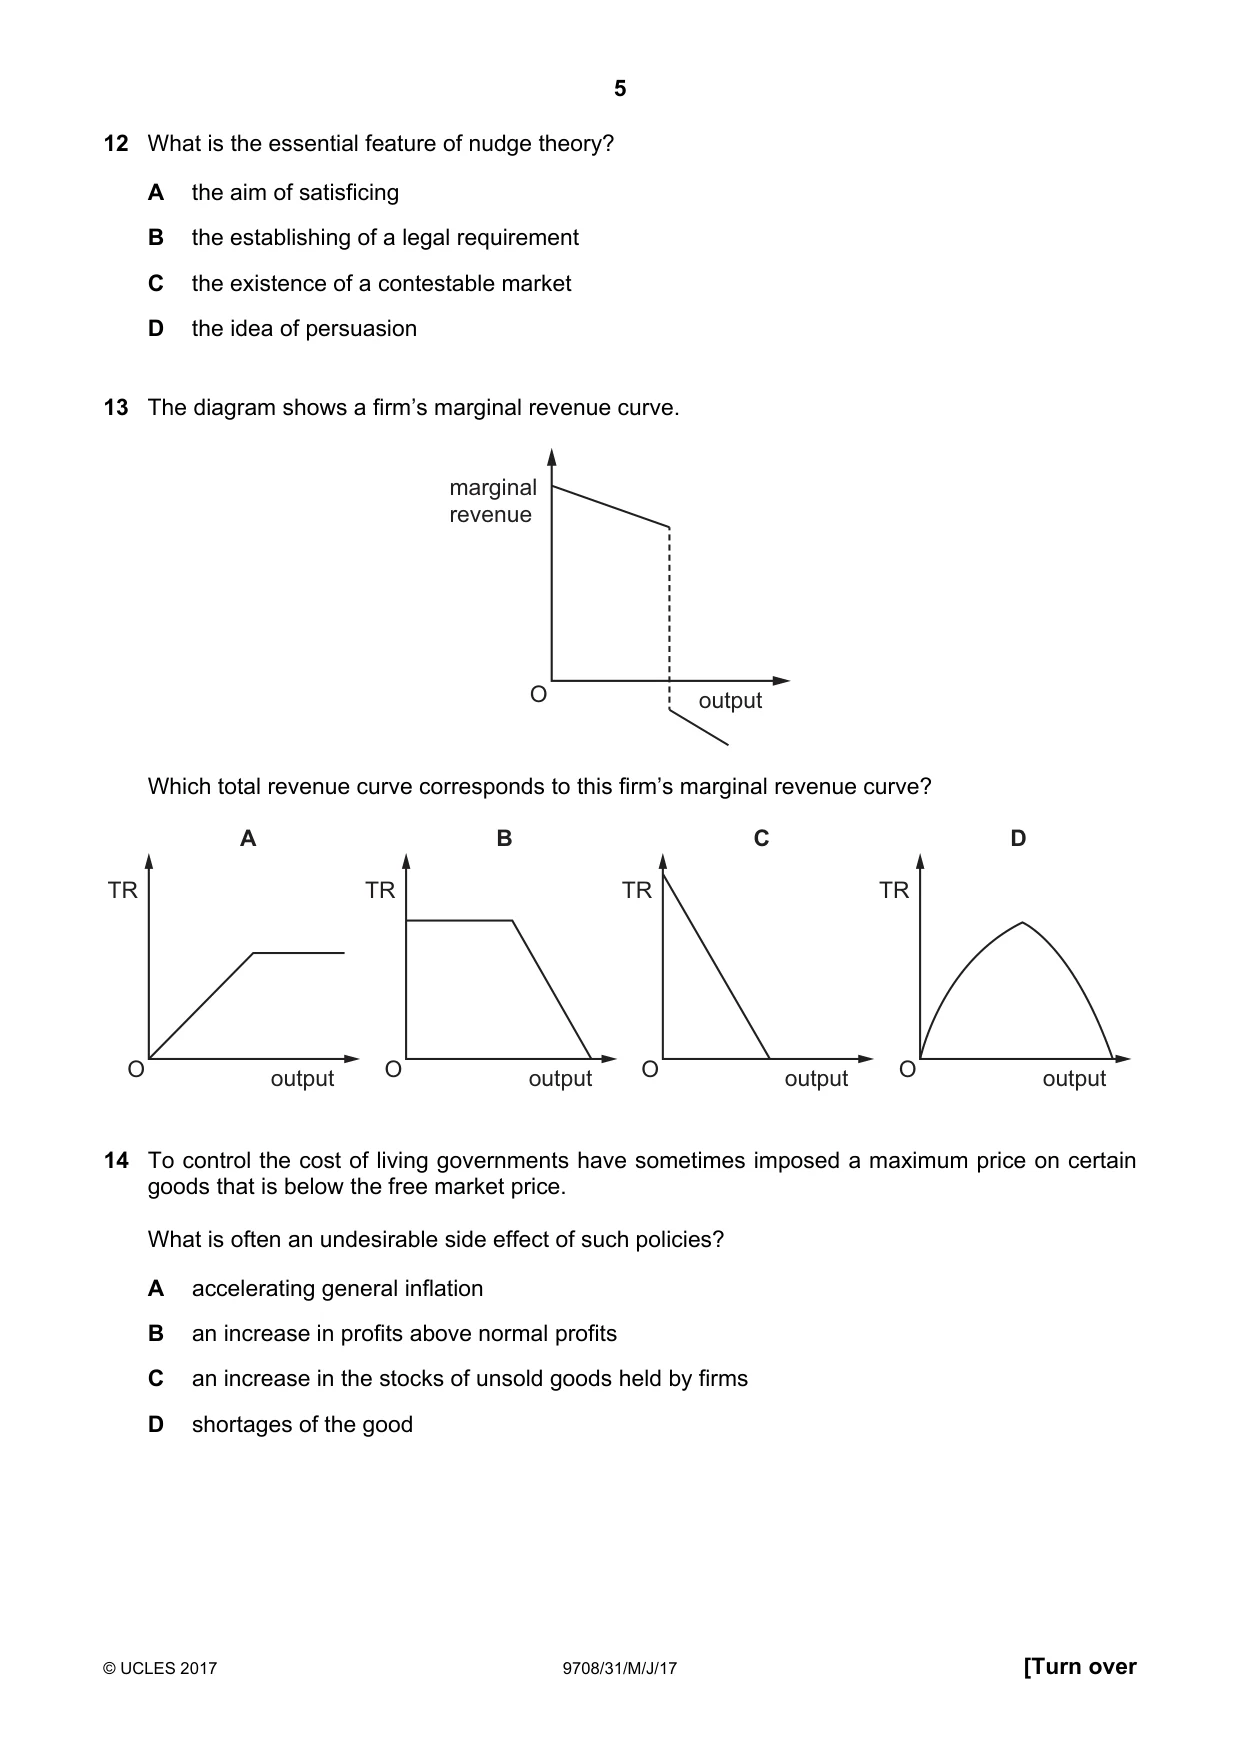
5 © UCLES 2017 9708/31/M/J/17 [Turn over 12 What is the essential feature of nudge theory? A the aim of satisficing B the establishing of a legal requirement C the existence of a contestable market D the idea of persuasion 13 The diagram shows a firm’s marginal revenue curve. O output marginal revenue Which total revenue curve corresponds to this firm’s marginal revenue curve? O output TR A O output TR B O output TR C O output TR D 14 To control the cost of living governments have sometimes imposed a maximum price on certain goods that is below the free market price. What is often an undesirable side effect of such policies? A accelerating general inflation B an increase in profits above normal profits C an increase in the stocks of unsold goods held by firms D shortages of the good
Question paper, page 6
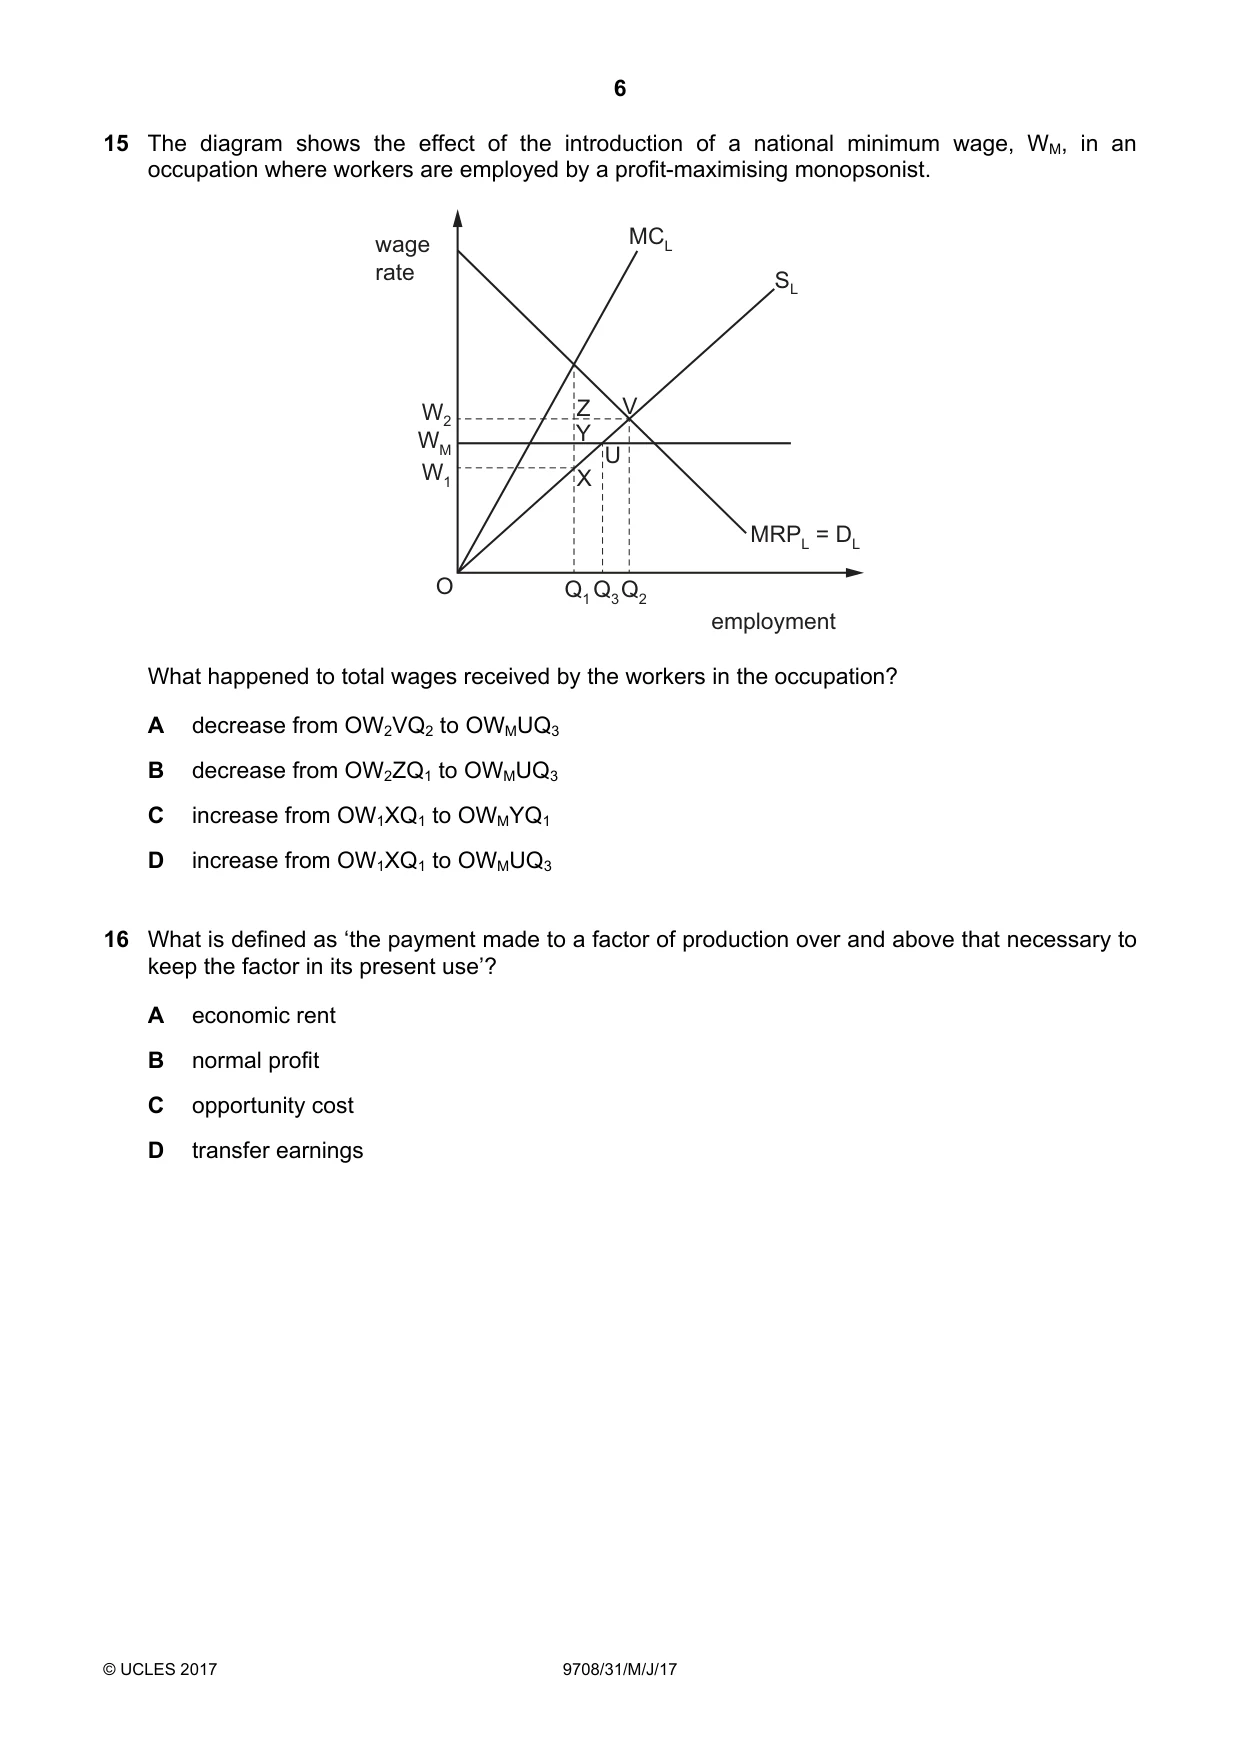
6 © UCLES 2017 9708/31/M/J/17 15 The diagram shows the effect of the introduction of a national minimum wage, WM, in an occupation where workers are employed by a profit-maximising monopsonist. MCL MRPL = DL SL Z V U X Y W2 Q1Q3Q2 W1 WM O employment wage rate What happened to total wages received by the workers in the occupation? A decrease from OW2VQ2 to OWMUQ3 B decrease from OW2ZQ1 to OWMUQ3 C increase from OW1XQ1 to OWMYQ1 D increase from OW1XQ1 to OWMUQ3 16 What is defined as ‘the payment made to a factor of production over and above that necessary to keep the factor in its present use’? A economic rent B normal profit C opportunity cost D transfer earnings
Question paper, page 7
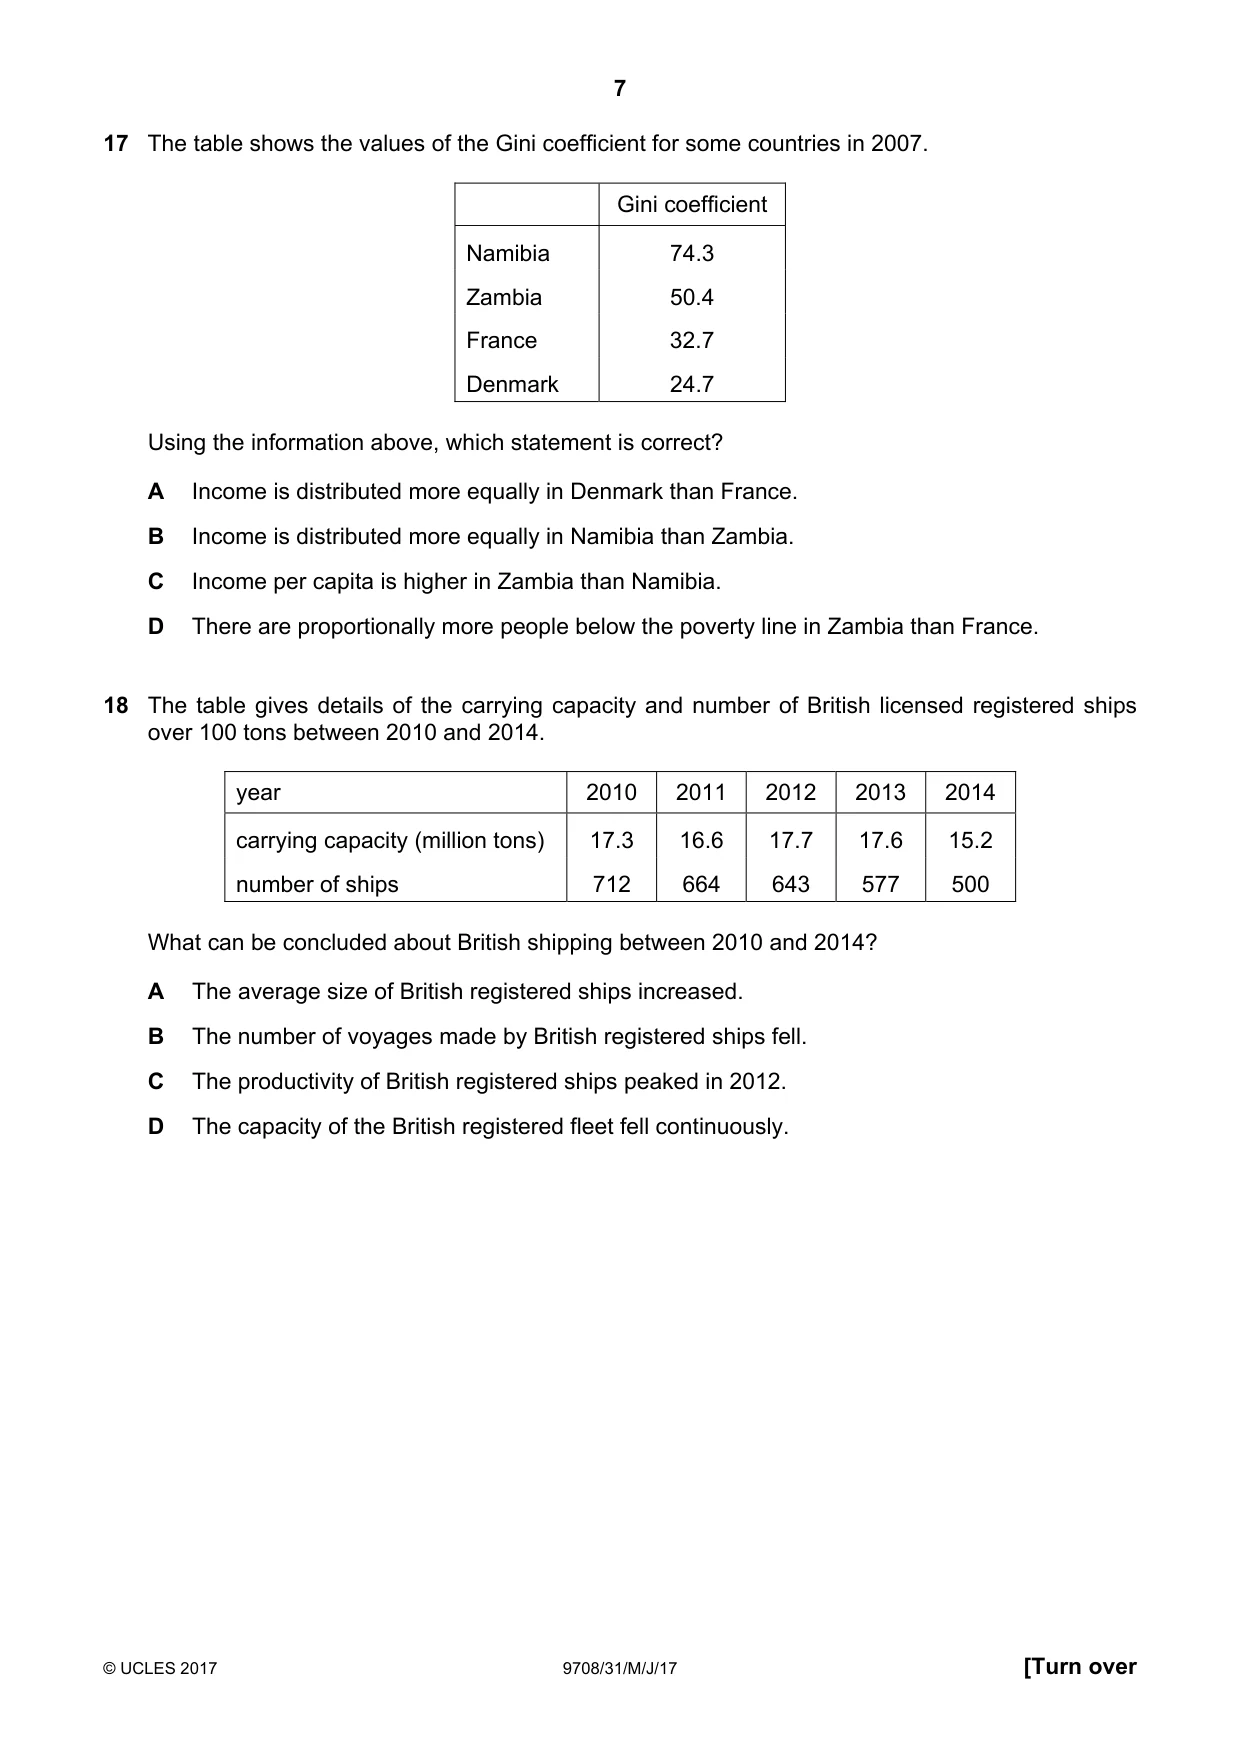
7 © UCLES 2017 9708/31/M/J/17 [Turn over 17 The table shows the values of the Gini coefficient for some countries in 2007. Gini coefficient Namibia 74.3 Zambia 50.4 France 32.7 Denmark 24.7 Using the information above, which statement is correct? A Income is distributed more equally in Denmark than France. B Income is distributed more equally in Namibia than Zambia. C Income per capita is higher in Zambia than Namibia. D There are proportionally more people below the poverty line in Zambia than France. 18 The table gives details of the carrying capacity and number of British licensed registered ships over 100 tons between 2010 and 2014. year 2010 2011 2012 2013 2014 carrying capacity (million tons) 17.3 16.6 17.7 17.6 15.2 number of ships 712 664 643 577 500 What can be concluded about British shipping between 2010 and 2014? A The average size of British registered ships increased. B The number of voyages made by British registered ships fell. C The productivity of British registered ships peaked in 2012. D The capacity of the British registered fleet fell continuously.
Question paper, page 8
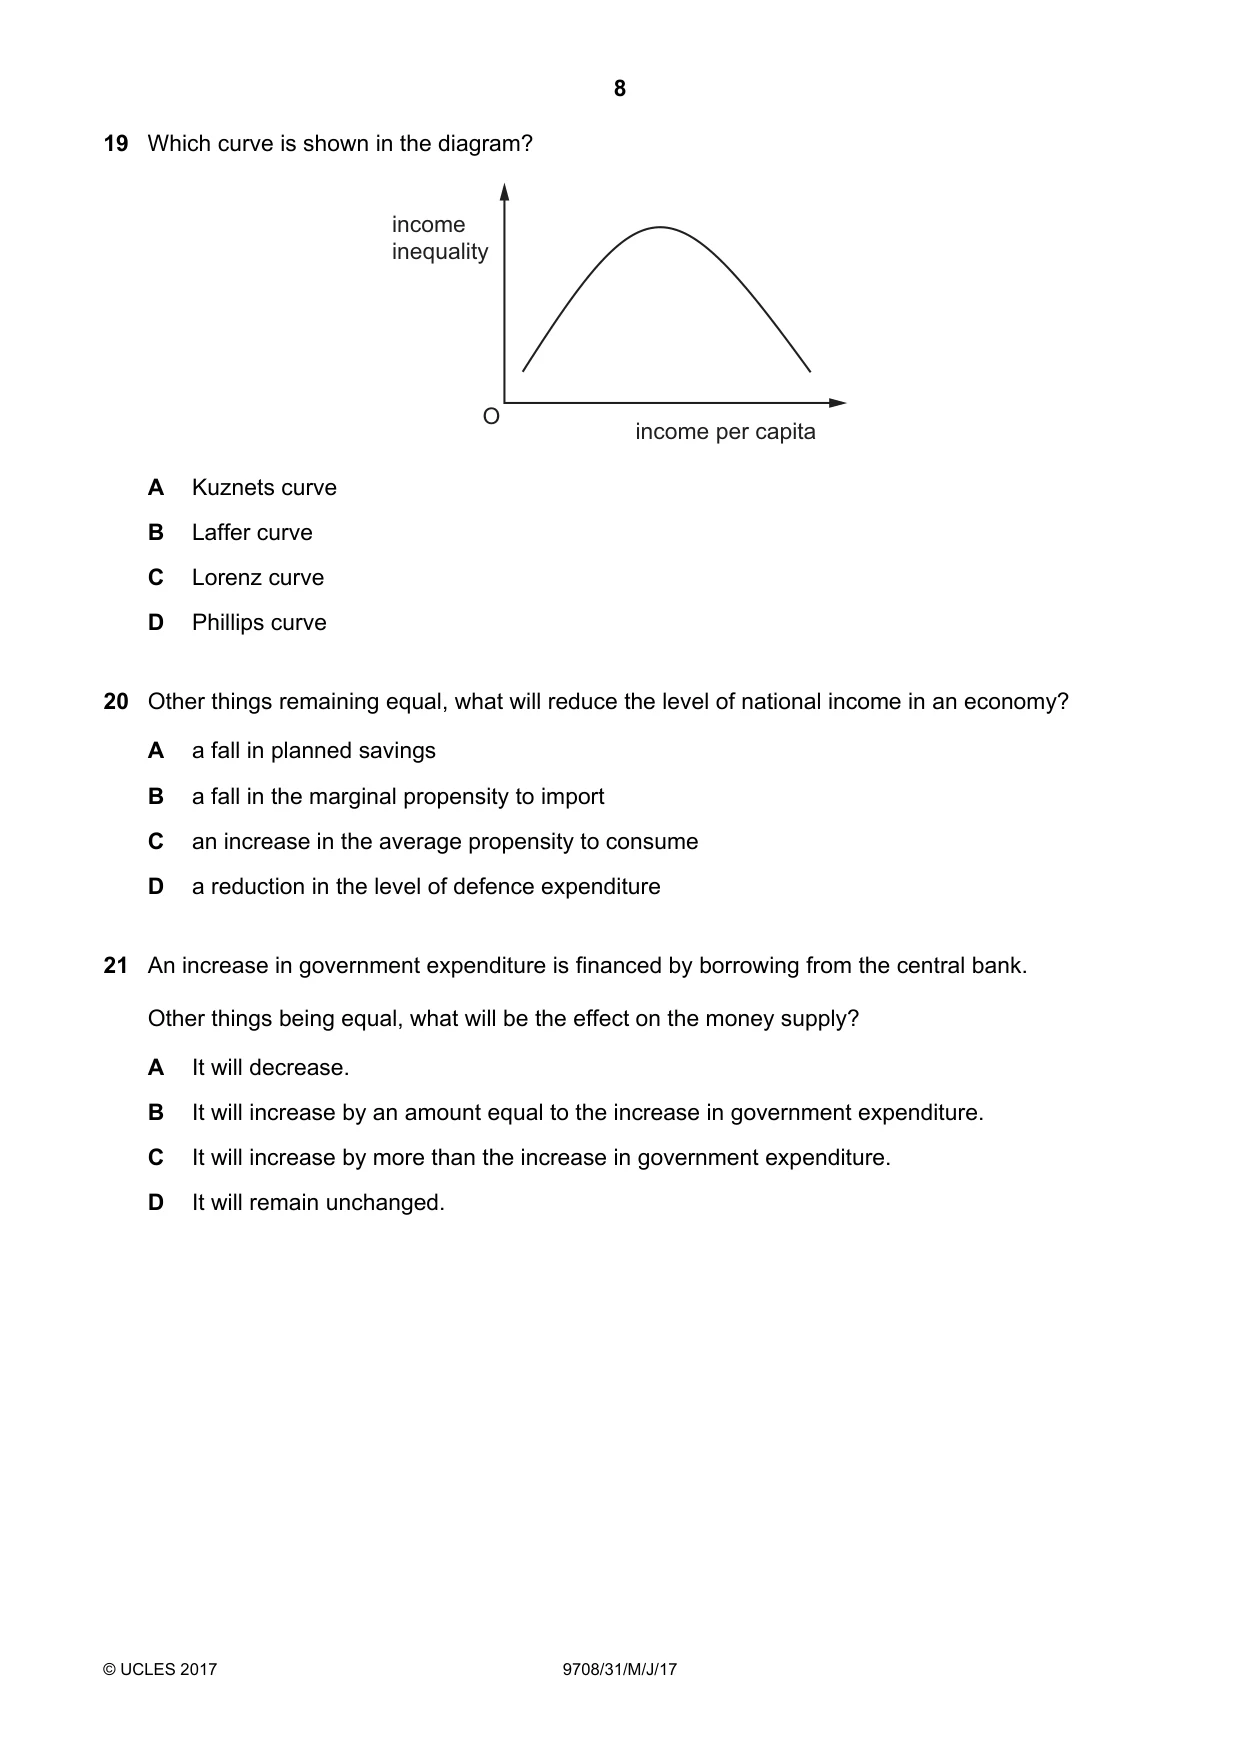
8 © UCLES 2017 9708/31/M/J/17 19 Which curve is shown in the diagram? income inequality income per capita O A Kuznets curve B Laffer curve C Lorenz curve D Phillips curve 20 Other things remaining equal, what will reduce the level of national income in an economy? A a fall in planned savings B a fall in the marginal propensity to import C an increase in the average propensity to consume D a reduction in the level of defence expenditure 21 An increase in government expenditure is financed by borrowing from the central bank. Other things being equal, what will be the effect on the money supply? A It will decrease. B It will increase by an amount equal to the increase in government expenditure. C It will increase by more than the increase in government expenditure. D It will remain unchanged.
Question paper, page 9
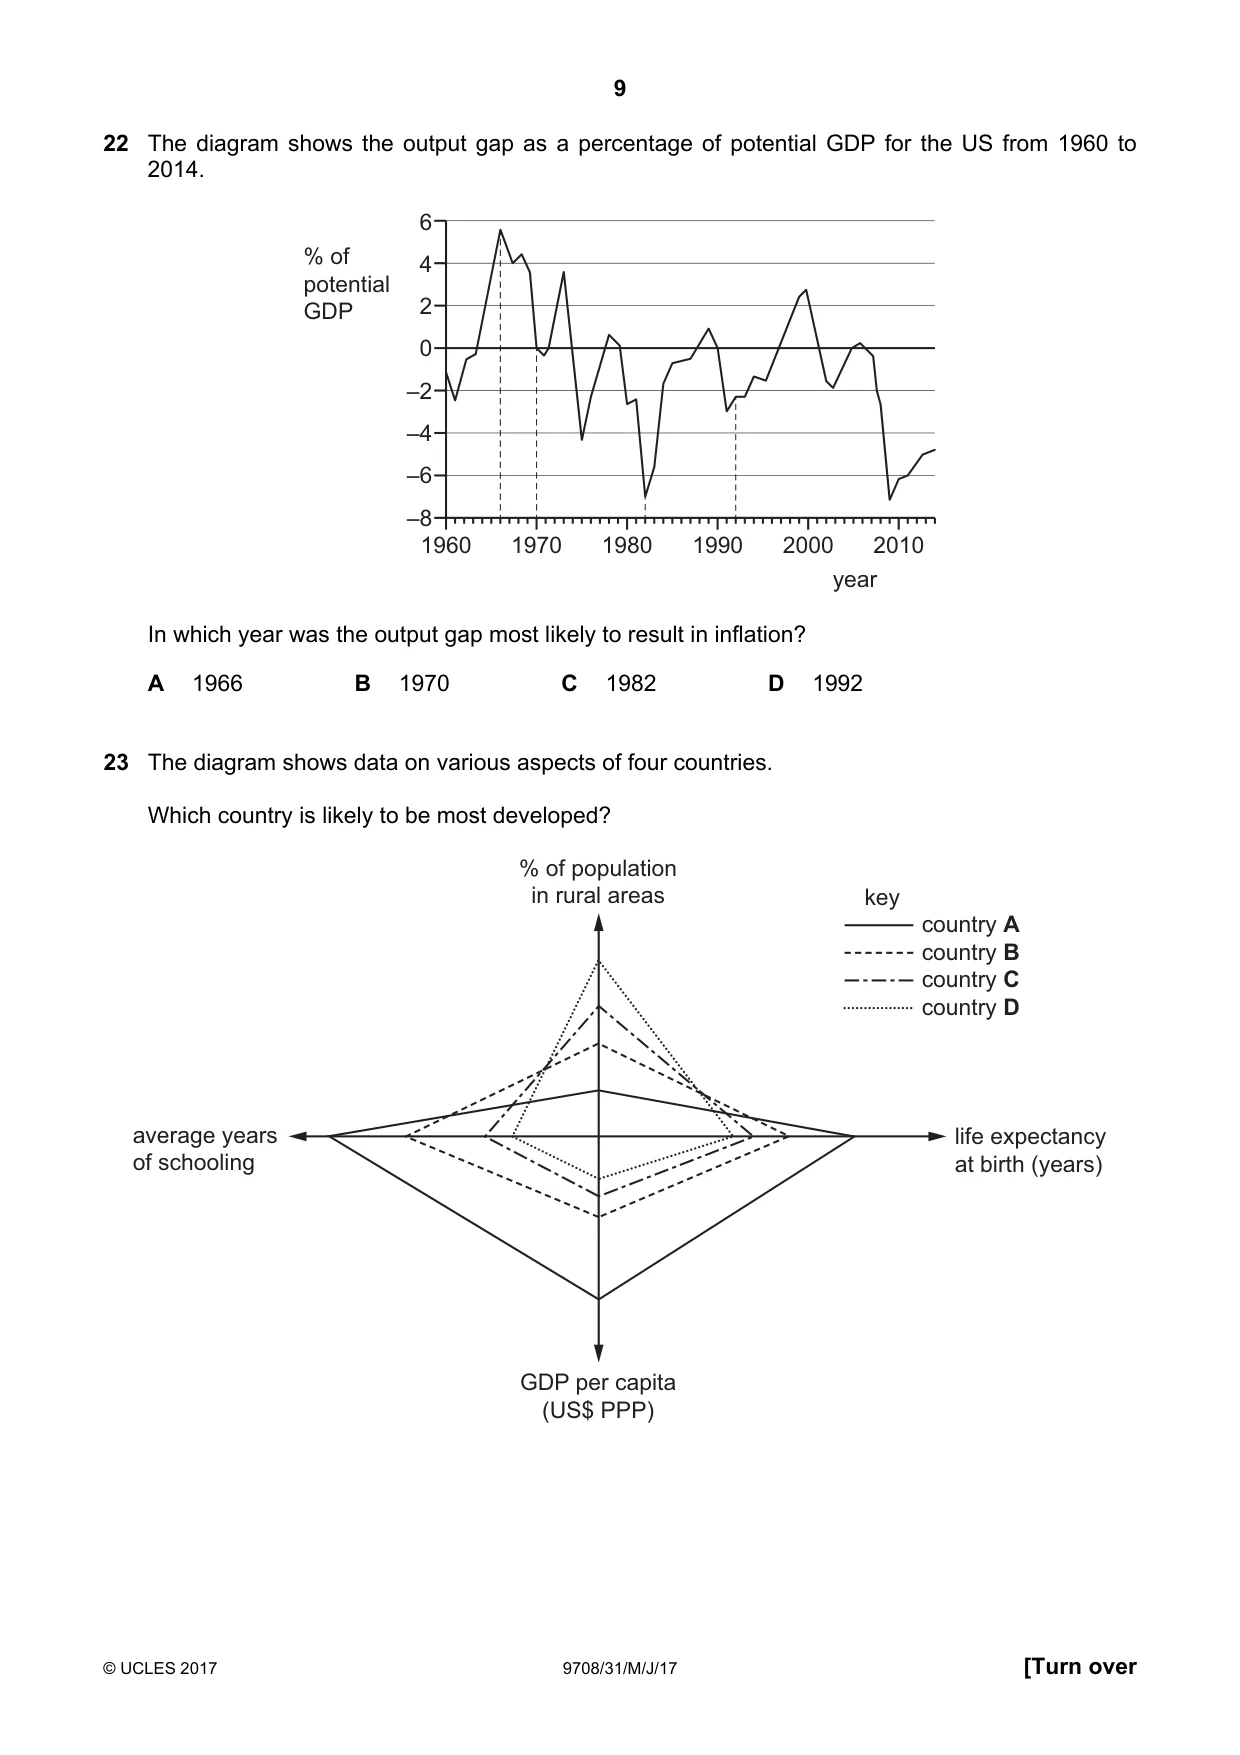
9 © UCLES 2017 9708/31/M/J/17 [Turn over 22 The diagram shows the output gap as a percentage of potential GDP for the US from 1960 to 2014. 6 4 2 0 –2 –4 –6 –8 1960 1970 1980 1990 year 2000 2010 % of potential GDP In which year was the output gap most likely to result in inflation? A 1966 B 1970 C 1982 D 1992 23 The diagram shows data on various aspects of four countries. Which country is likely to be most developed? average years of schooling life expectancy at birth (years) % of population in rural areas GDP per capita (US$ PPP) country A country B country C country D key
Question paper, page 10
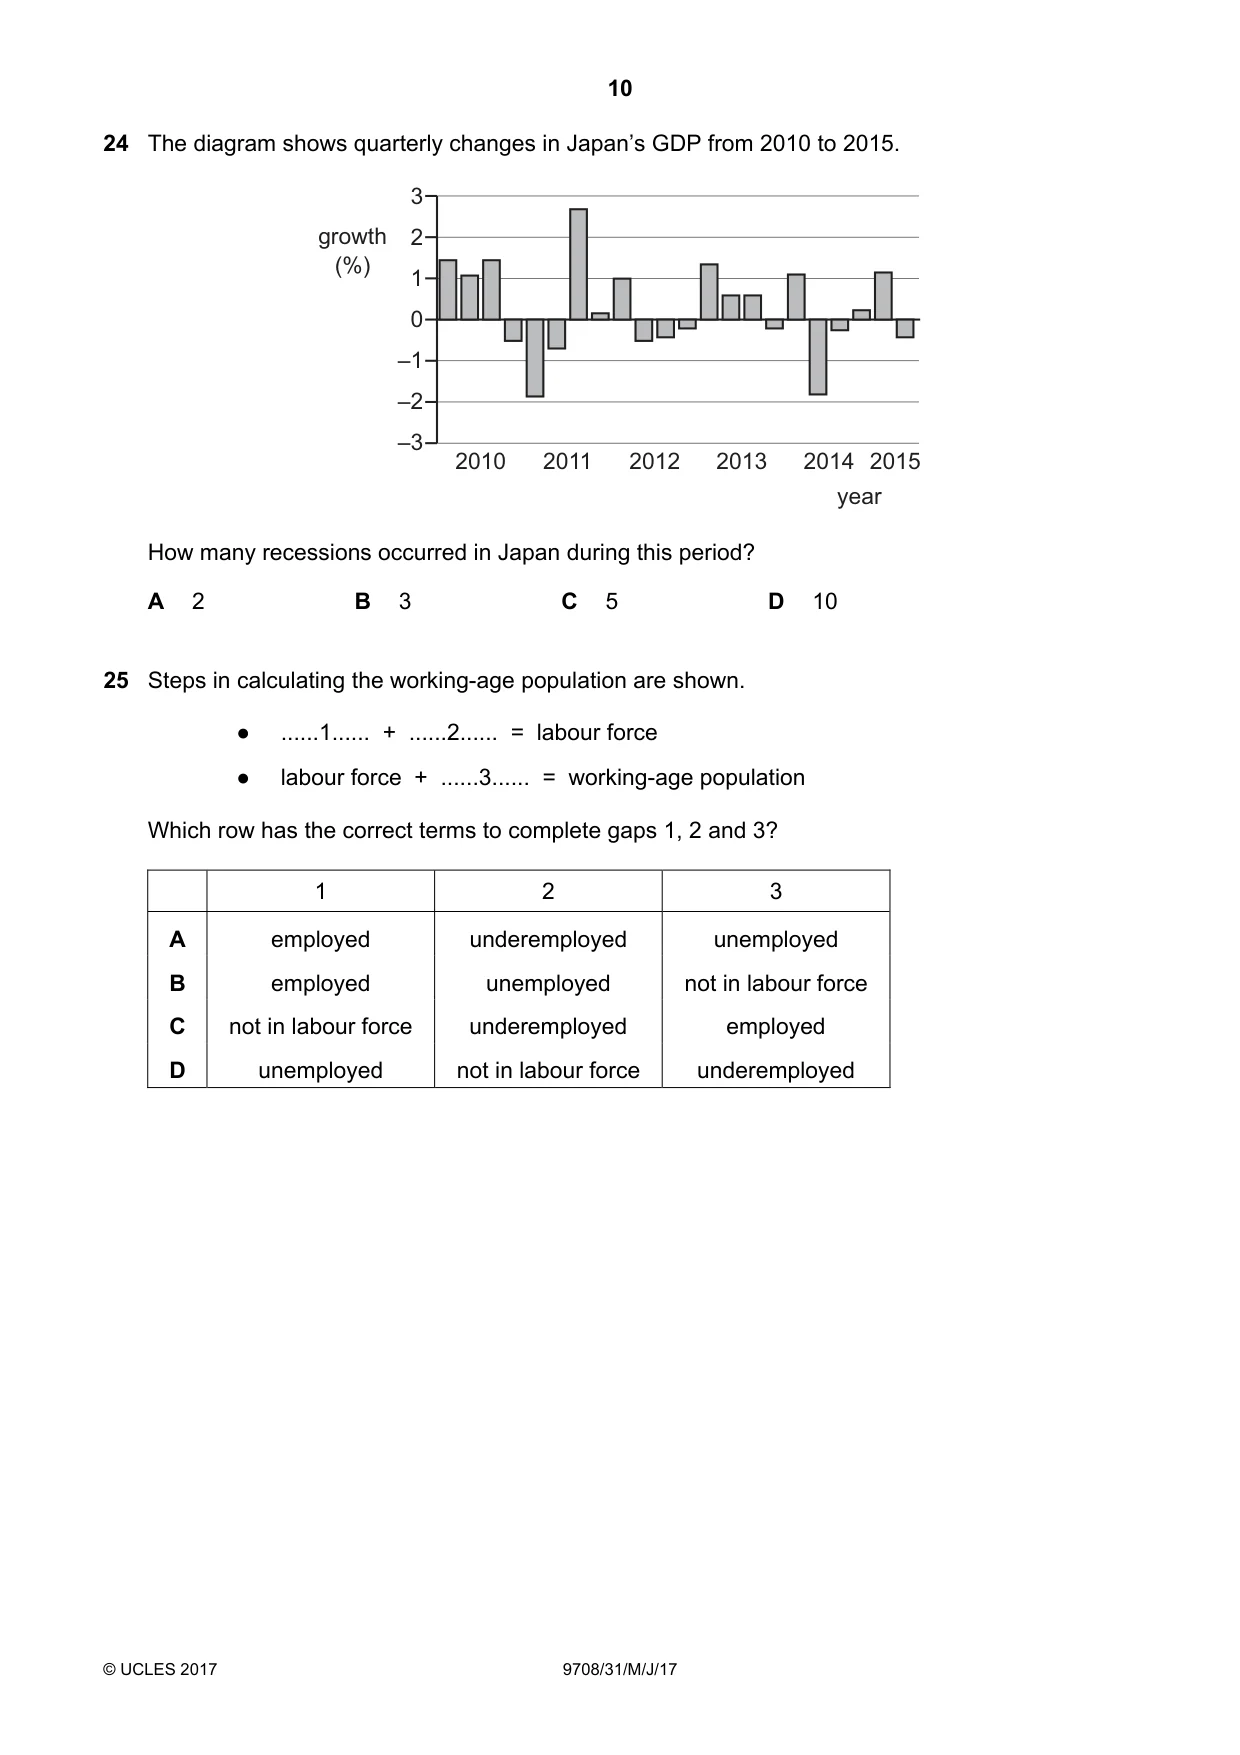
10 © UCLES 2017 9708/31/M/J/17 24 The diagram shows quarterly changes in Japan’s GDP from 2010 to 2015. 3 2 1 0 –1 –2 –3 growth (%) year 2010 2011 2012 2013 2014 2015 How many recessions occurred in Japan during this period? A 2 B 3 C 5 D 10 25 Steps in calculating the working-age population are shown. ● …1… + …2… = labour force ● labour force + …3… = working-age population Which row has the correct terms to complete gaps 1, 2 and 3? 1 2 3 A employed underemployed unemployed B employed unemployed not in labour force C not in labour force underemployed employed D unemployed not in labour force underemployed
Question paper, page 11
11 © UCLES 2017 9708/31/M/J/17 [Turn over 26 The graphs show consumer prices and unemployment for Ireland between 2002 and 2007. What can be concluded from the graphs? A Between 2003 and 2004, unemployment and prices moved in the same direction. B Prices were at their lowest in 2004. C Prices rose continuously over the period. D The number of unemployed workers fell over the period. 27 Which combination of policy measures is most likely to reduce unemployment? A lowering both the exchange rate and domestic interest rates B lowering the exchange rate and increasing direct taxation C raising both the exchange rate and domestic interest rates D raising the exchange rate and increasing direct taxation Content removed due to copyright restrictions.
Question paper, page 12
12 Permission to reproduce items where third-party owned material protected by copyright is included has been sought and cleared where possible. Every reasonable effort has been made by the publisher (UCLES) to trace copyright holders, but if any items requiring clearance have unwittingly been included, the publisher will be pleased to make amends at the earliest possible opportunity. To avoid the issue of disclosure of answer-related information to candidates, all copyright acknowledgements are reproduced online in the Cambridge International Examinations Copyright Acknowledgements Booklet. This is produced for each series of examinations and is freely available to download at www.cie.org.uk after the live examination series. Cambridge International Examinations is part of the Cambridge Assessment Group. Cambridge Assessment is the brand name of University of Cambridge Local Examinations Syndicate (UCLES), which is itself a department of the University of Cambridge. © UCLES 2017 9708/31/M/J/17 28 A government responds to cyclical fluctuations in output by keeping tax rates and benefit rates unchanged. What is the government seeking to achieve by adopting this fiscal policy? A to allow automatic stabilisers to work B to keep output at the full employment level C to maintain a constant balanced budget D to ensure that its budget is in surplus over the trade cycle 29 Manufacturing output in China fell to the lowest for 15 months in June 2015. The government wanted to stimulate the economy. What would be most likely to help the economy recover? A a decrease in government spending B a decrease in unemployment C an increase in income tax D an increase in interest rates 30 The economy of a country is simultaneously experiencing a balance of payments deficit, a budget deficit, demand-pull inflation and unemployment. The government decides to cut personal income taxes. What is most likely to be its main macroeconomic objective? A to improve the balance of payments position B to reduce the budget deficit C to reduce the level of unemployment D to reduce the rate of inflation
Mark scheme, page 1
® IGCSE is a registered trademark. This document consists of 3 printed pages. © UCLES 2017 [Turn over Cambridge International Examinations Cambridge International Advanced Subsidiary and Advanced Level ECONOMICS 9708/31 Paper 3 Multiple Choice May/June 2017 MARK SCHEME Maximum Mark: 30 Published This mark scheme is published as an aid to teachers and candidates, to indicate the requirements of the examination. Mark schemes should be read in conjunction with the question paper and the Principal Examiner Report for Teachers. Cambridge will not enter into discussions about these mark schemes. Cambridge is publishing the mark schemes for the May/June 2017 series for most Cambridge IGCSE®, Cambridge International A and AS Level and Cambridge Pre-U components, and some Cambridge O Level components.
Mark scheme, page 2
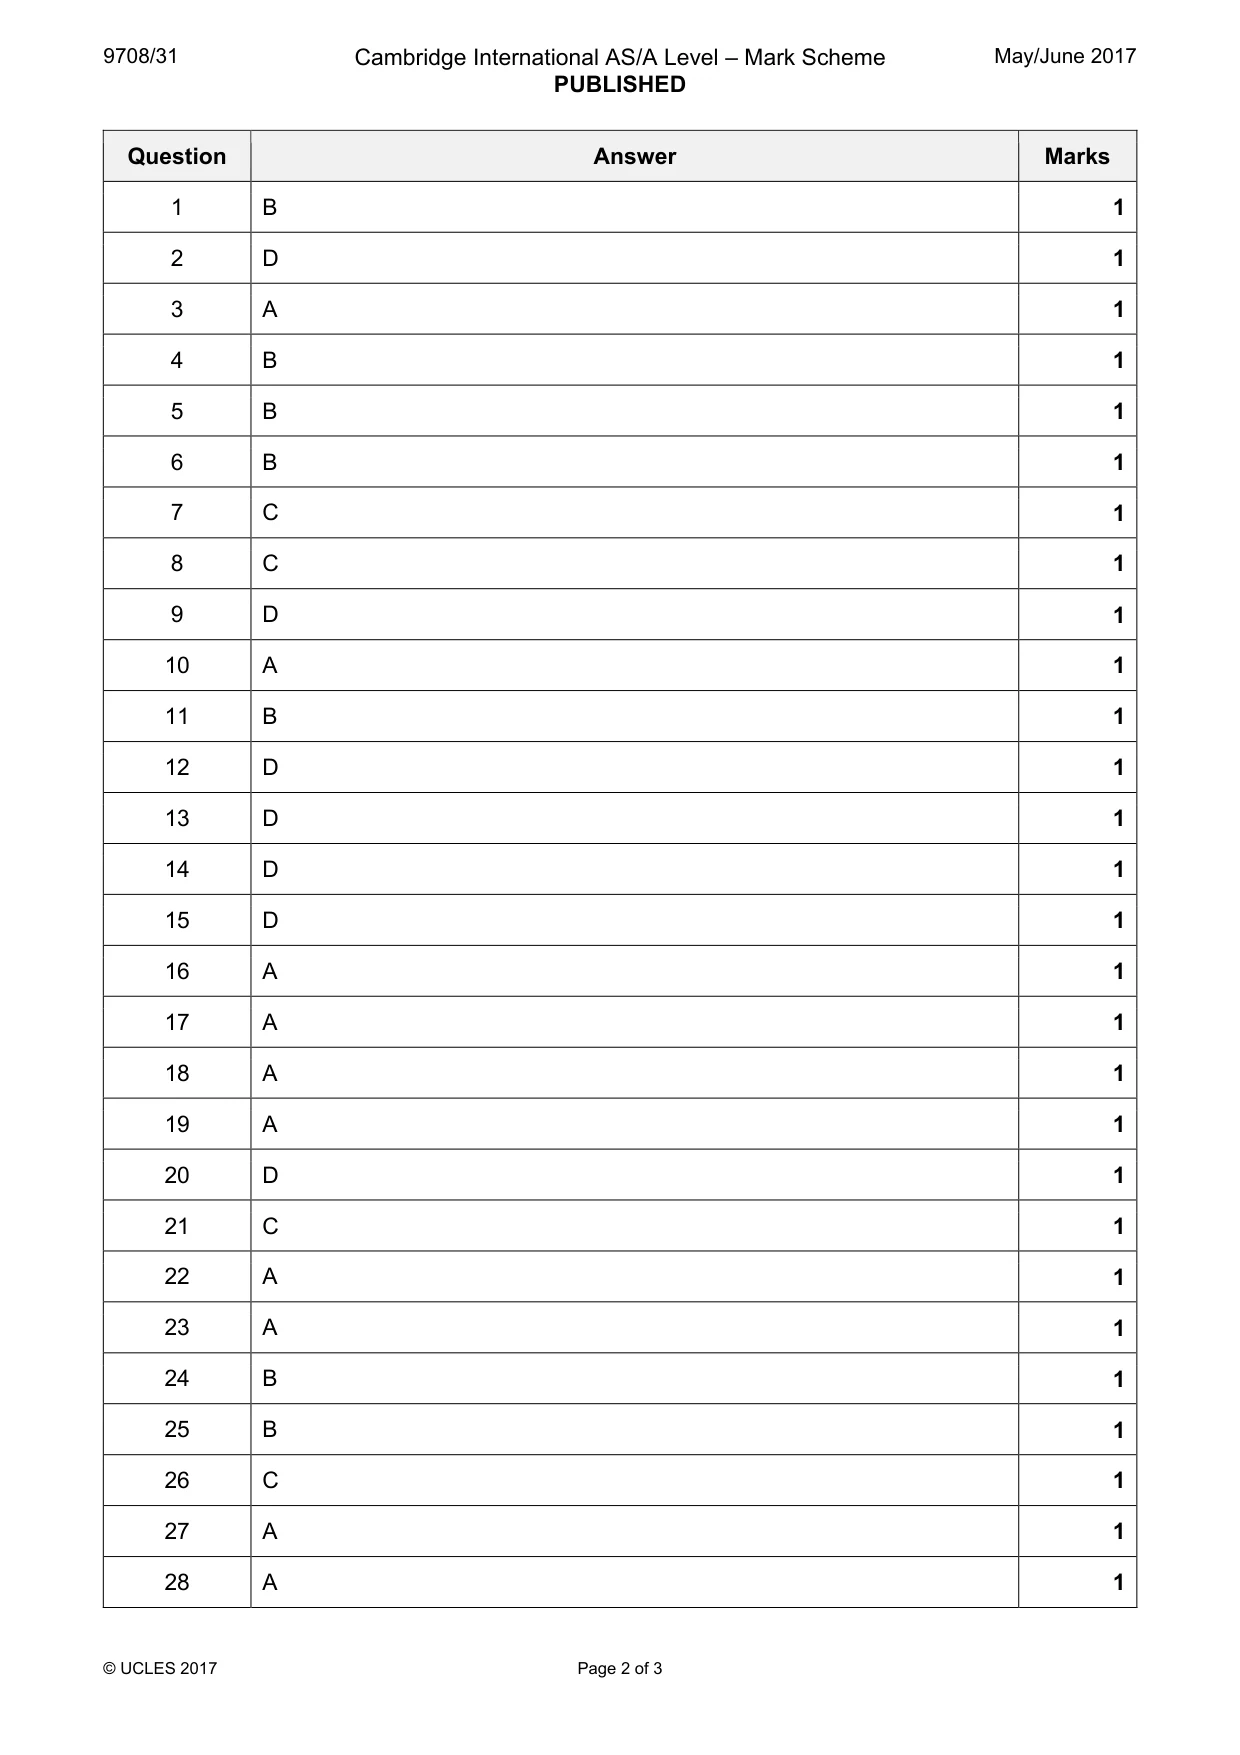
9708/31 Cambridge International AS/A Level – Mark Scheme PUBLISHED May/June 2017 © UCLES 2017 Page 2 of 3 Question Answer Marks 1 B 1 2 D 1 3 A 1 4 B 1 5 B 1 6 B 1 7 C 1 8 C 1 9 D 1 10 A 1 11 B 1 12 D 1 13 D 1 14 D 1 15 D 1 16 A 1 17 A 1 18 A 1 19 A 1 20 D 1 21 C 1 22 A 1 23 A 1 24 B 1 25 B 1 26 C 1 27 A 1 28 A 1
Mark scheme, page 3
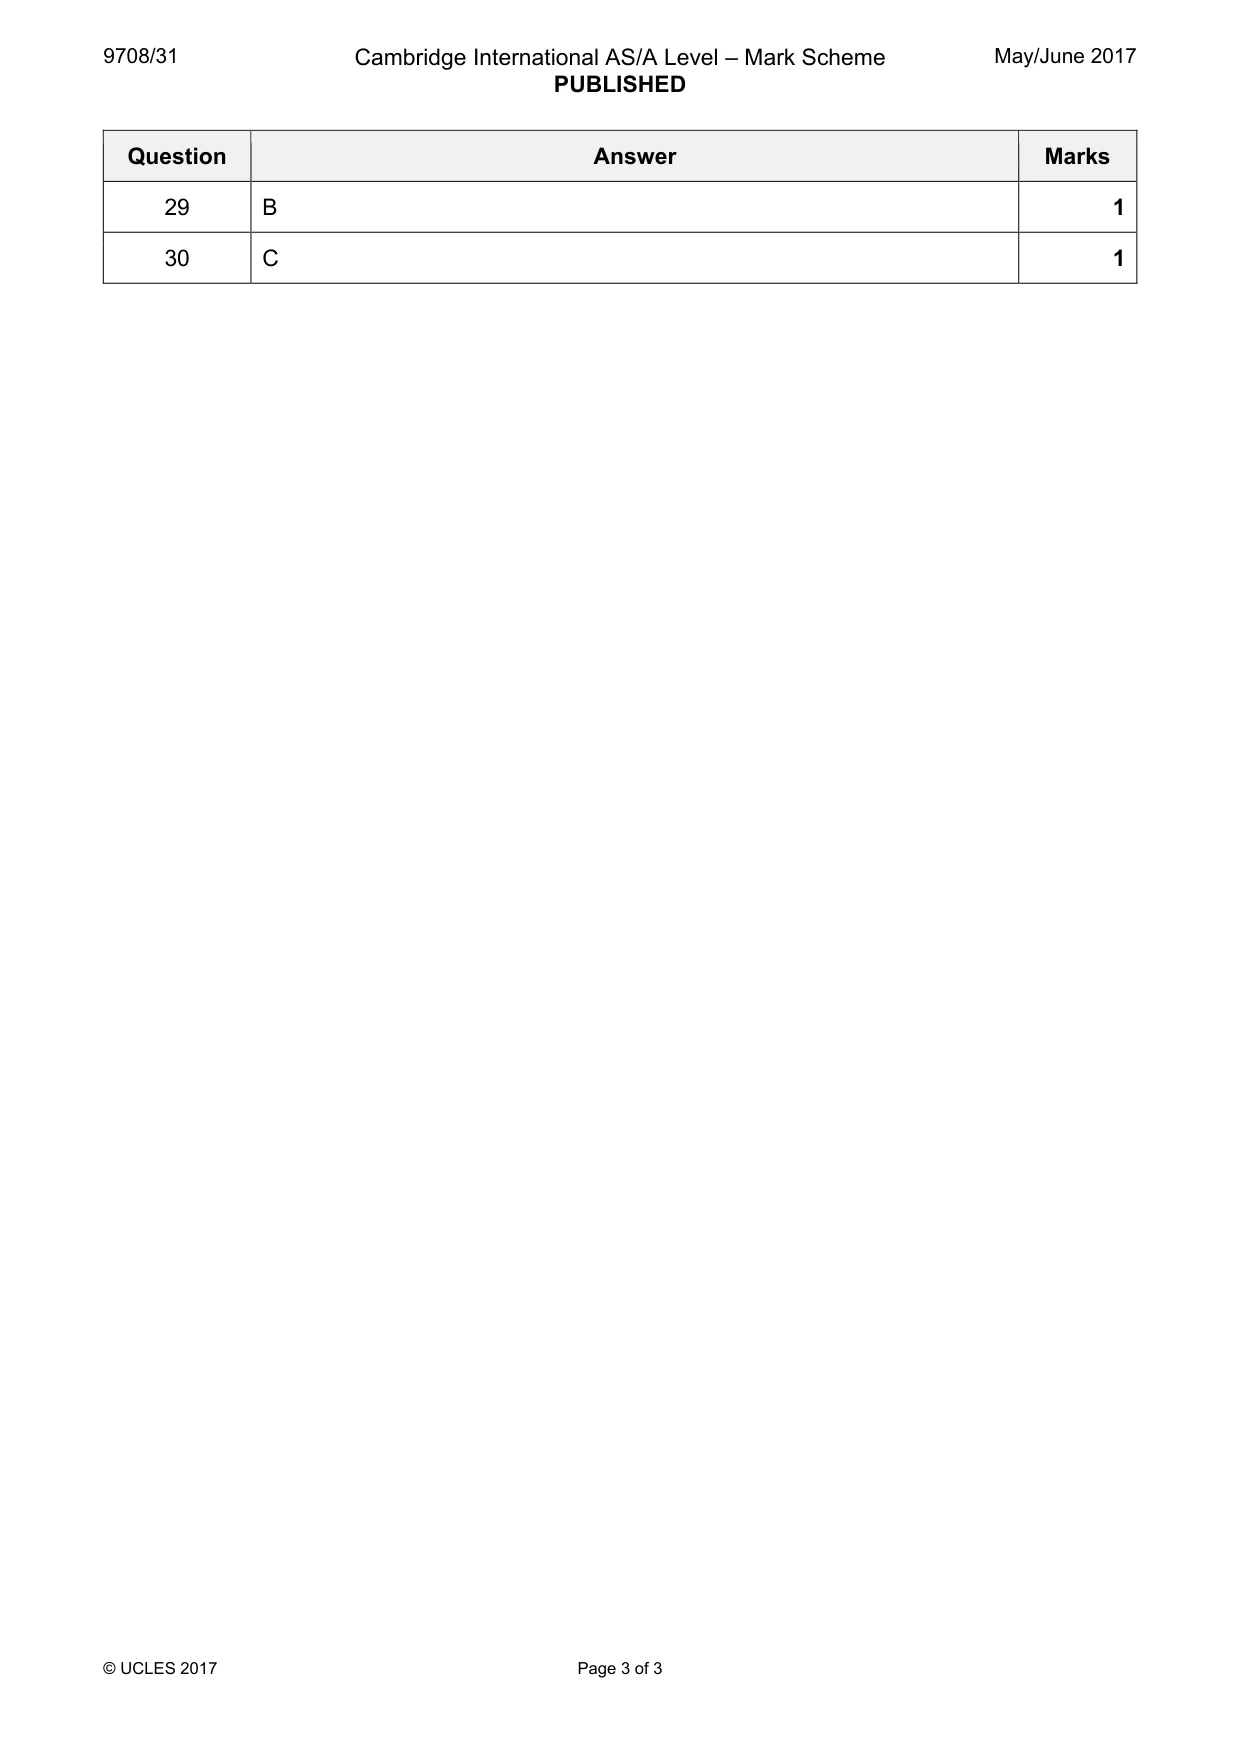
9708/31 Cambridge International AS/A Level – Mark Scheme PUBLISHED May/June 2017 © UCLES 2017 Page 3 of 3 Question Answer Marks 29 B 1 30 C 1
What you needed in this session
Cambridge’s own grade thresholds for 2017 May/June, Paper 3 · Variant 1. A higher threshold means an easier paper — the bar moves with how the cohort did.