Cambridge A Level Chemistry 9701 — 2017 Oct/Nov Paper 3 · Variant 4
9701/34/O/N/17 · 2 questions · 40 marks · ≈45 min
The question paper and its mark scheme, free to read here and free to download. This is Cambridge’s own paper, exactly as it was sat.
Question paper12 pages

Mark scheme6 pages
Answers below. Sit the paper first if you are practising.
Questions as text
Q1 · Sodium thiosulfate reacts with acid to produce a pale yellow precipitate of sulfur
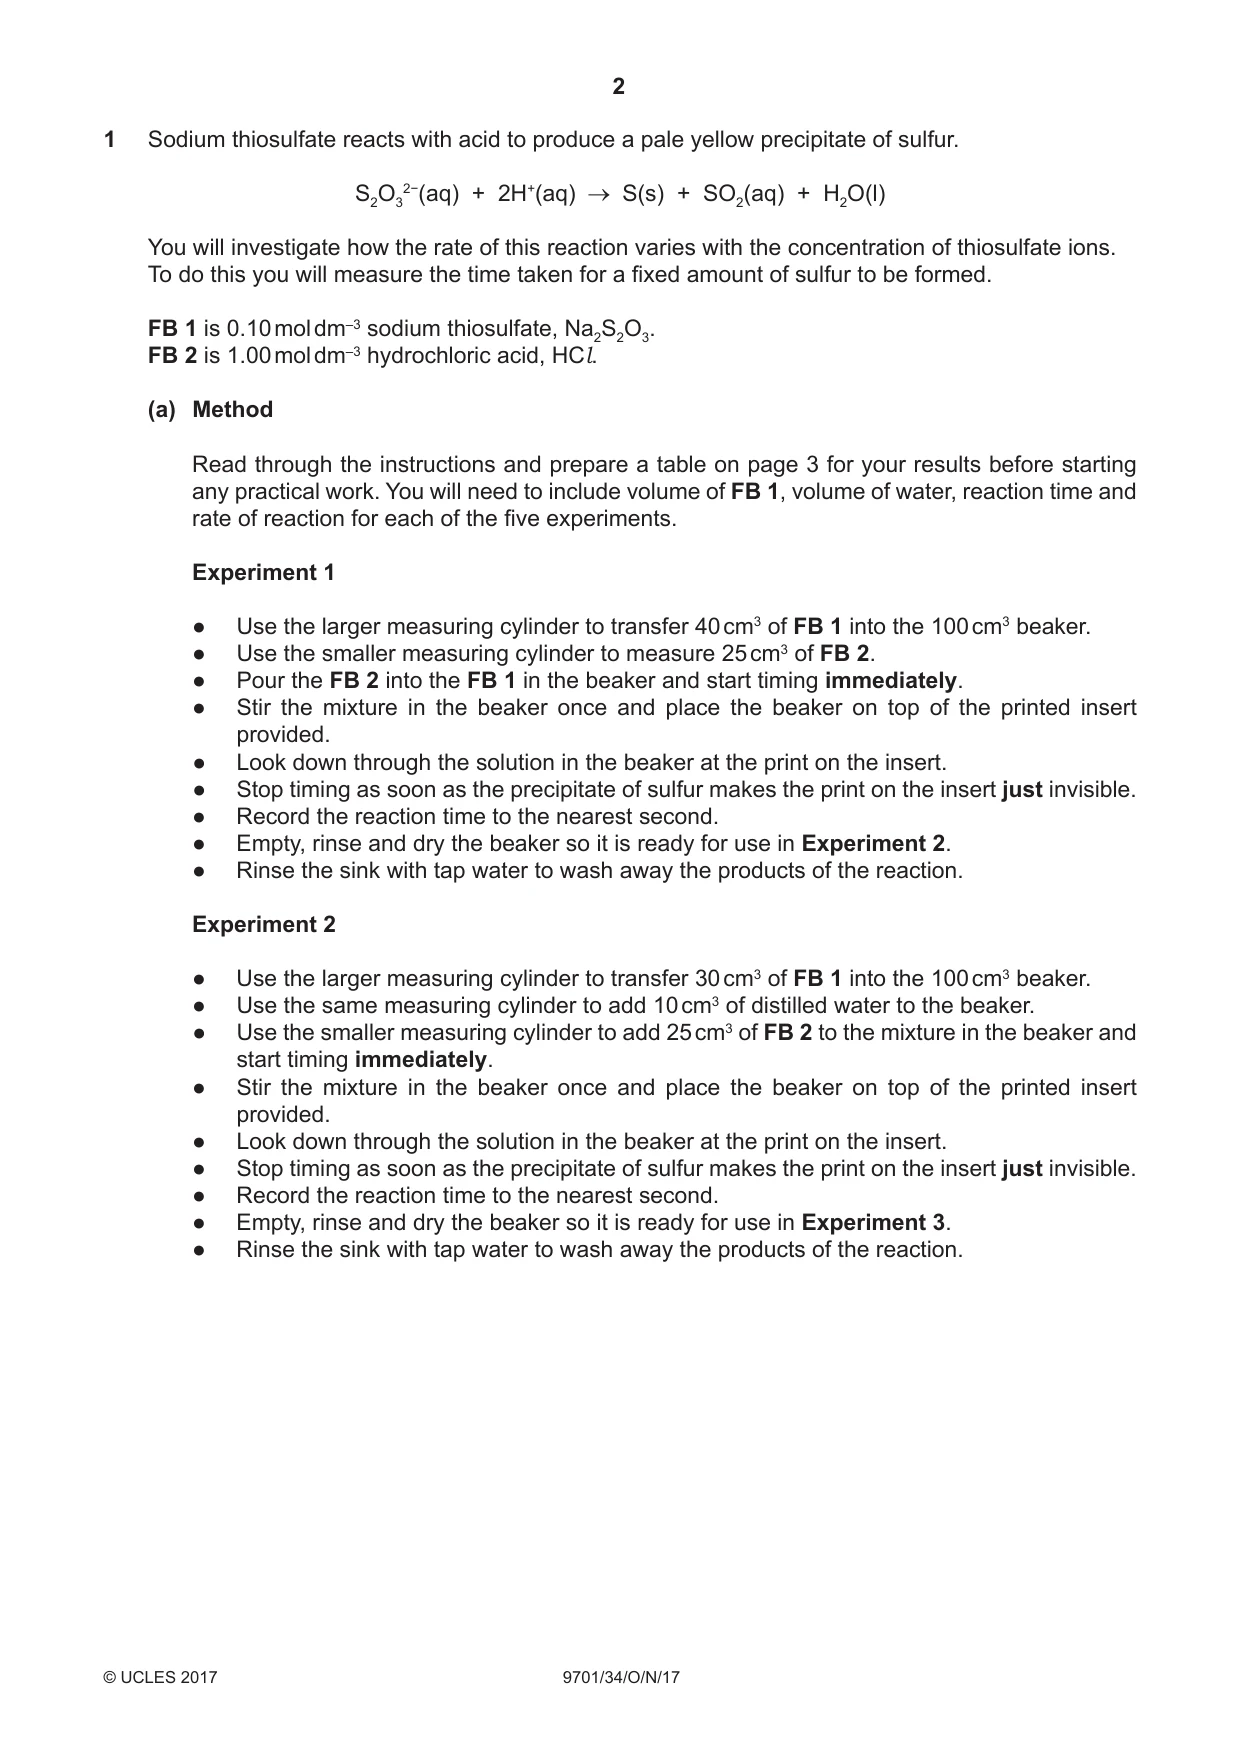
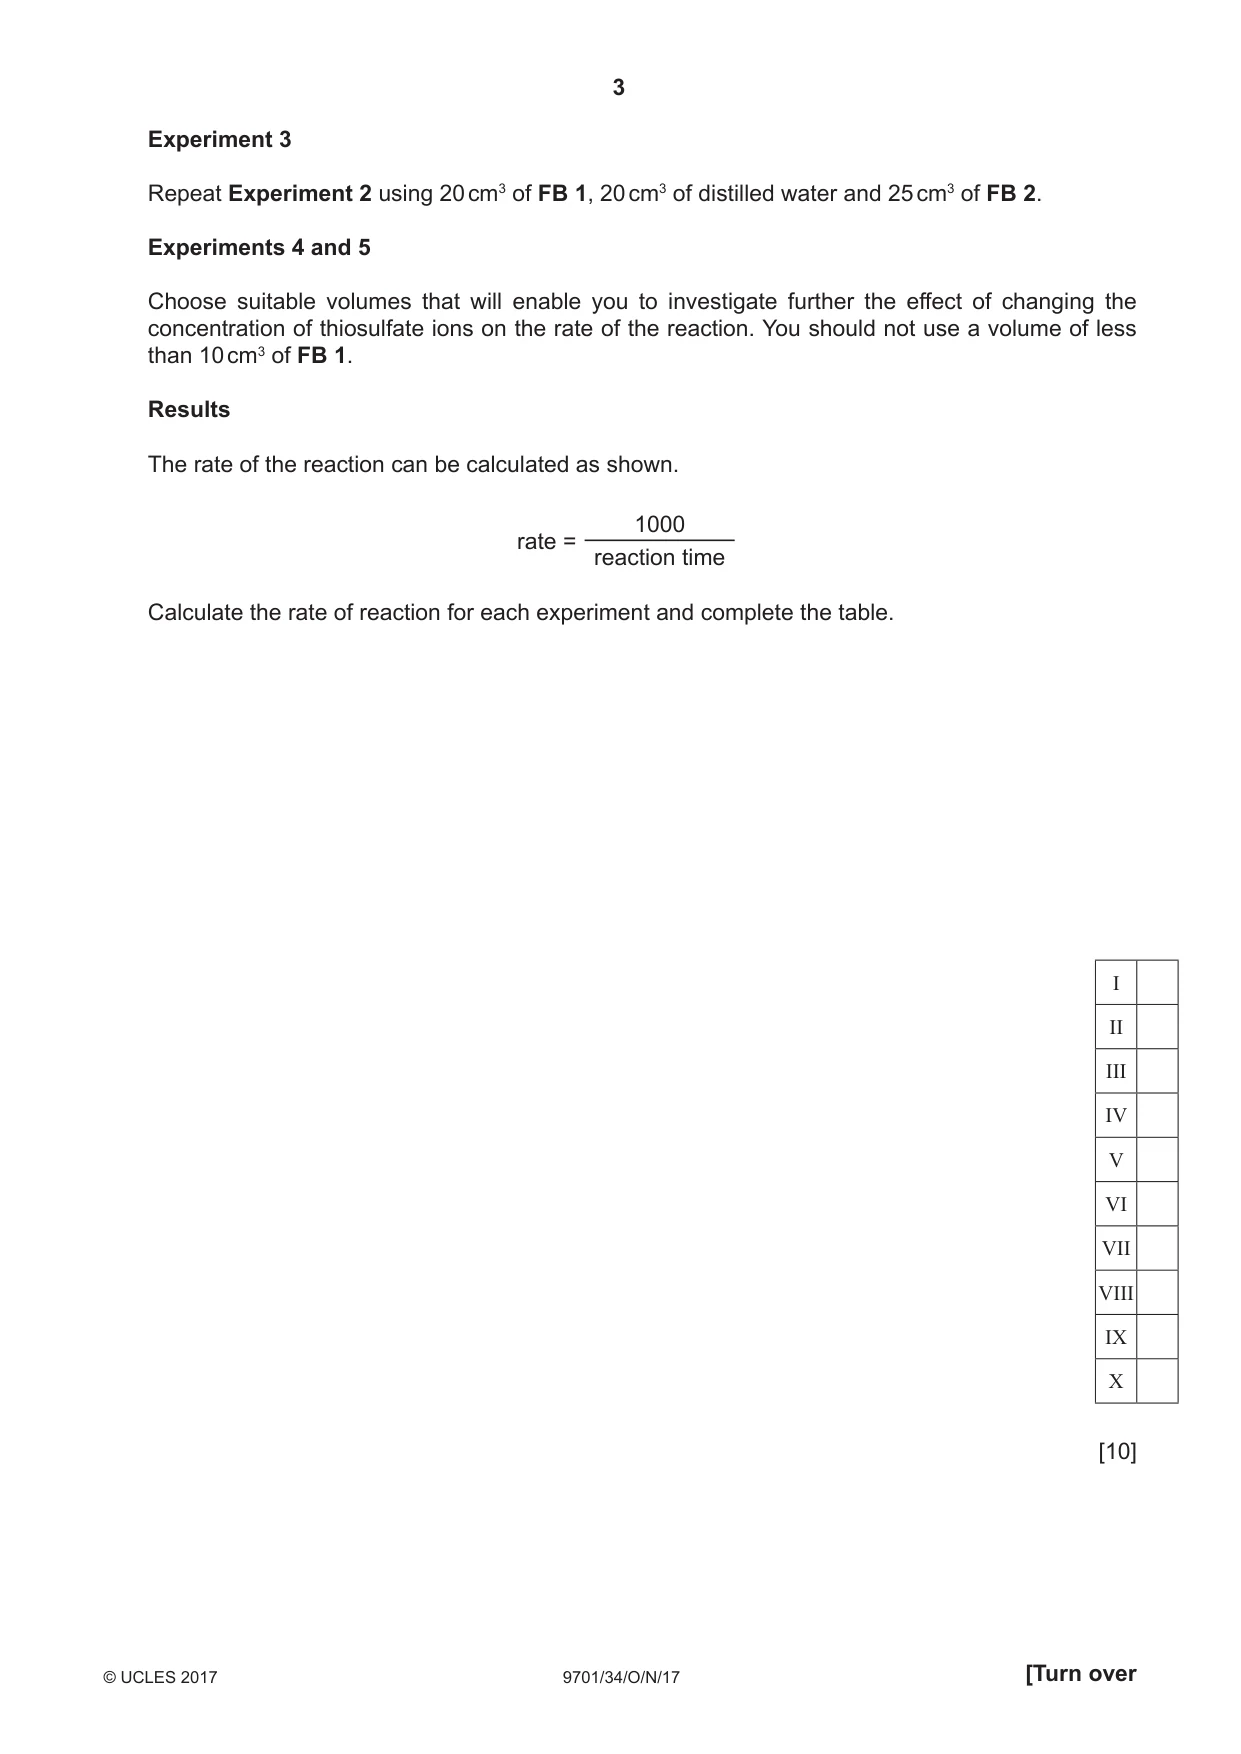
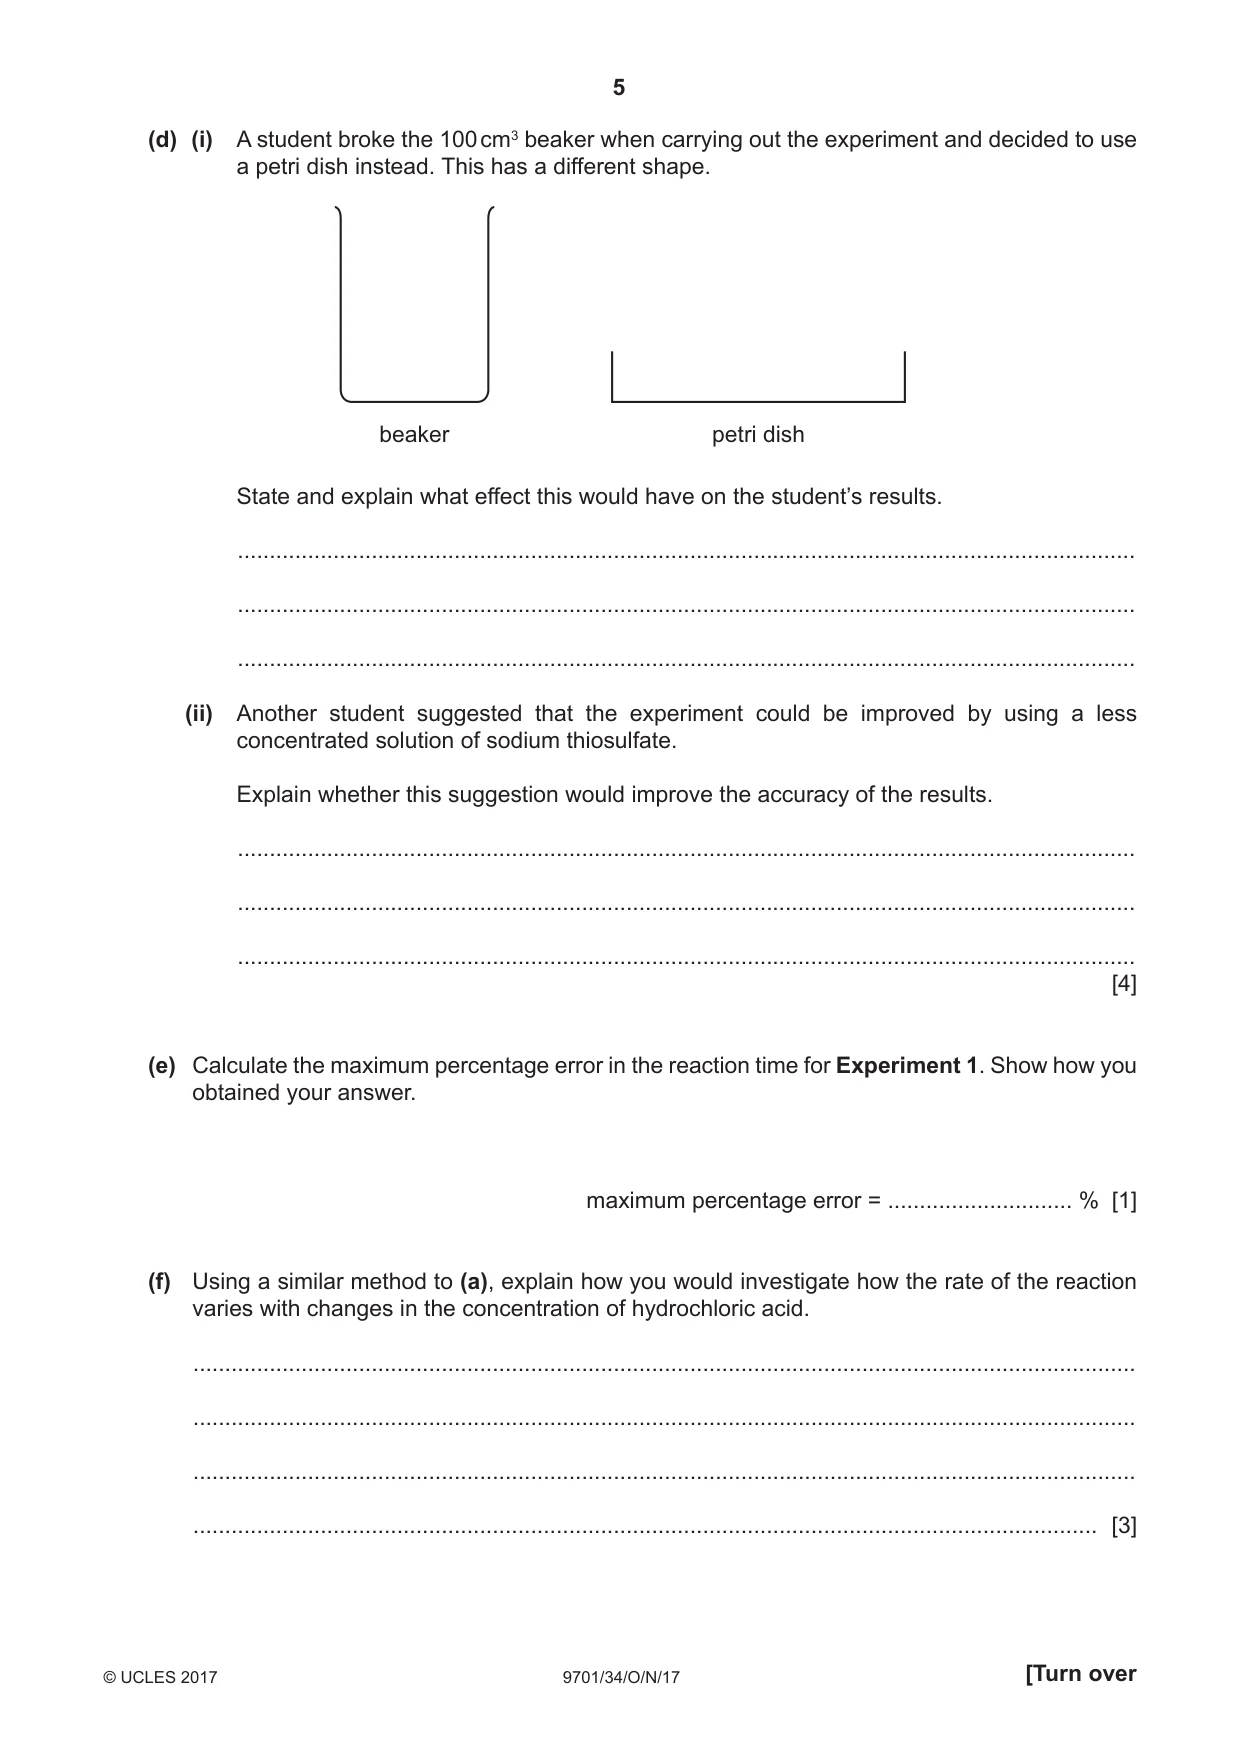
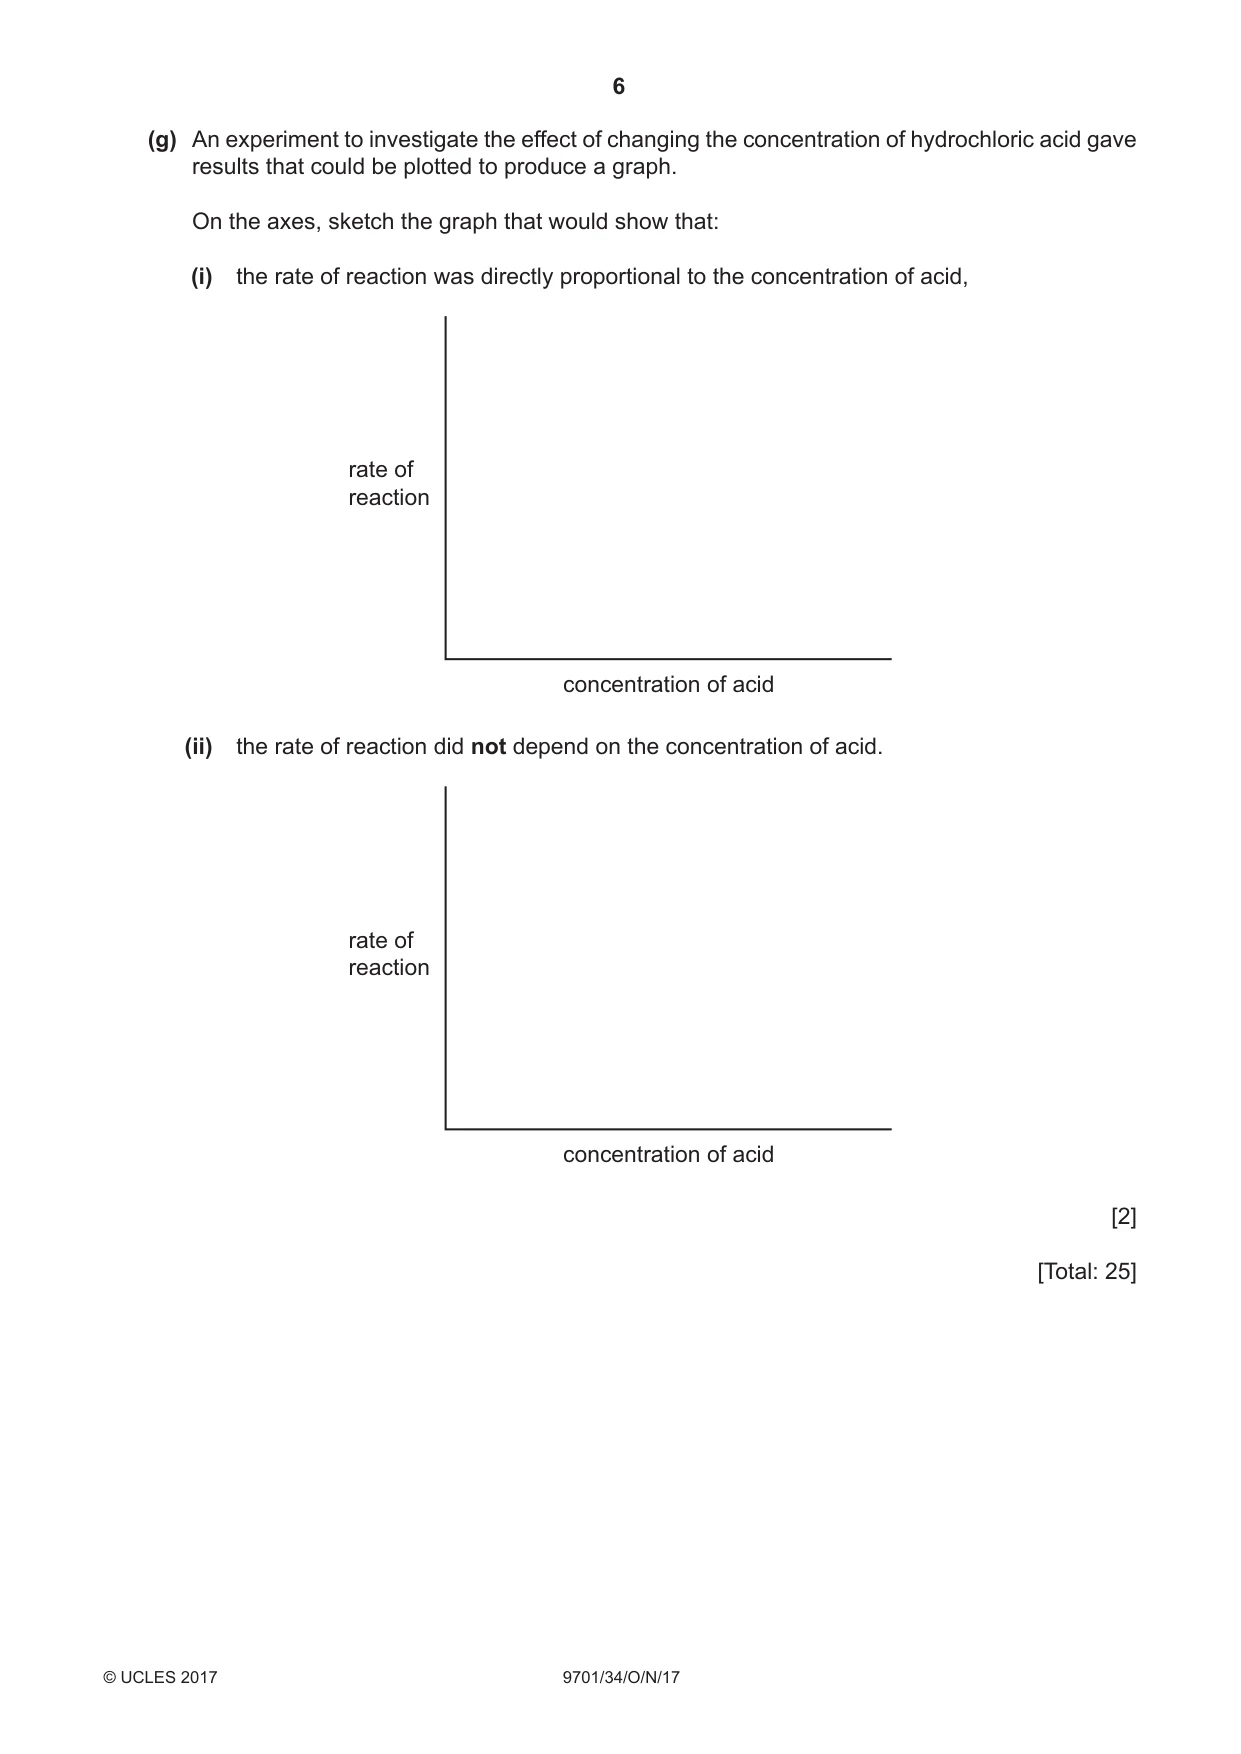
1 Sodium thiosulfate reacts with acid to produce a pale yellow precipitate of sulfur. S2O32−(aq) + 2H+(aq) S(s) + SO2(aq) + H2O(l) You will investigate how the rate of this reaction varies with the concentration of thiosulfate ions. To do this you will measure the time taken for a fixed amount of sulfur to be formed. FB 1 is 0.10 mol dm–3 sodium thiosulfate, Na2S2O3. FB 2 is 1.00 mol dm–3 hydrochloric acid, HCl. (a) Method Read through the instructions and prepare a table on page 3 for your results before starting any practical work. You will need to include volume of FB 1, volume of water, reaction time and rate of reaction for each of the five experiments. Experiment 1 ● Use the larger measuring cylinder to transfer 40 cm3 of FB 1 into the 100 cm3 beaker. ● Use the smaller measuring cylinder to measure 25 cm3 of FB 2. ● Pour the FB 2 into the FB 1 in the beaker and start timing immediately. ● Stir the mixture in the beaker once and place the beaker on top of the printed insert provided. ● Look down through the solution in the beaker at the print on the insert. ● Stop timing as soon as the precipitate of sulfur makes the print on the insert just invisible. ● Record the reaction time to the nearest second. ● Empty, rinse and dry the beaker so it is ready for use in Experiment 2. ● Rinse the sink with tap water to wash away the products of the reaction. Experiment 2 ● Use the larger measuring cylinder to transfer 30 cm3 of FB 1 into the 100 cm3 beaker. ● Use the same measuring cylinder to add 10 cm3 of distilled water to the beaker. ● Use the smaller measuring cylinder to add 25 cm3 of FB 2 to the mixture in the beaker and start timing immediately. ● Stir the mixture in the beaker once and place the beaker on top of the printed insert provided. ● Look down through the solution in the beaker at the print on the insert. ● Stop timing as soon as the precipitate of sulfur makes the print on the insert just invisible. ● Record the reaction time to the nearest second. ● Empty, rinse and dry the beaker so it is ready for use in Experiment 3. ● Rinse the sink with tap water to wash away the products of the reaction. Experiment 3 Repeat Experiment 2 using 20 cm3 of FB 1, 20 cm3 of distilled water and 25 cm3 of FB 2. Experiments 4 and 5 Choose suitable volumes that will enable you to investigate further the effect of changing the concentration of thiosulfate ions on the rate of the reaction. You should not use a volume of less than 10 cm3 of FB 1. Results The rate of the reaction can be calculated as shown. 1000 rate = reaction time Calculate the rate of reaction for each experiment and complete the table. I II III IV V VI VII VIII IX X [10] (d) (i) A student broke the 100 cm3 beaker when carrying out the experiment and decided to use a petri dish instead. This has a different shape. beaker petri dish State and explain what effect this would have on the student’s results. ............................................................................................................................................. ............................................................................................................................................. ............................................................................................................................................. (ii) Another student suggested that the experiment could be improved by using a less concentrated solution of sodium thiosulfate. Explain whether this suggestion would improve the accuracy of the results. ............................................................................................................................................. ............................................................................................................................................. ............................................................................................................................................. [4] (e) Calculate the maximum percentage error in the reaction time for Experiment 1. Show how you obtained your answer. maximum percentage error = ............................. % [1] (f) Using a similar method to (a), explain how you would investigate how the rate of the reaction varies with changes in the concentration of hydrochloric acid. .................................................................................................................................................... .................................................................................................................................................... .................................................................................................................................................... .............................................................................................................................................. [3] (g) An experiment to investigate the effect of changing the concentration of hydrochloric acid gave results that could be plotted to produce a graph. On the axes, sketch the graph that would show that: (i) the rate of reaction was directly proportional to the concentration of acid, rate of reaction concentration of acid (ii) the rate of reaction did not depend on the concentration of acid. rate of reaction concentration of acid [2] [Total: 25]
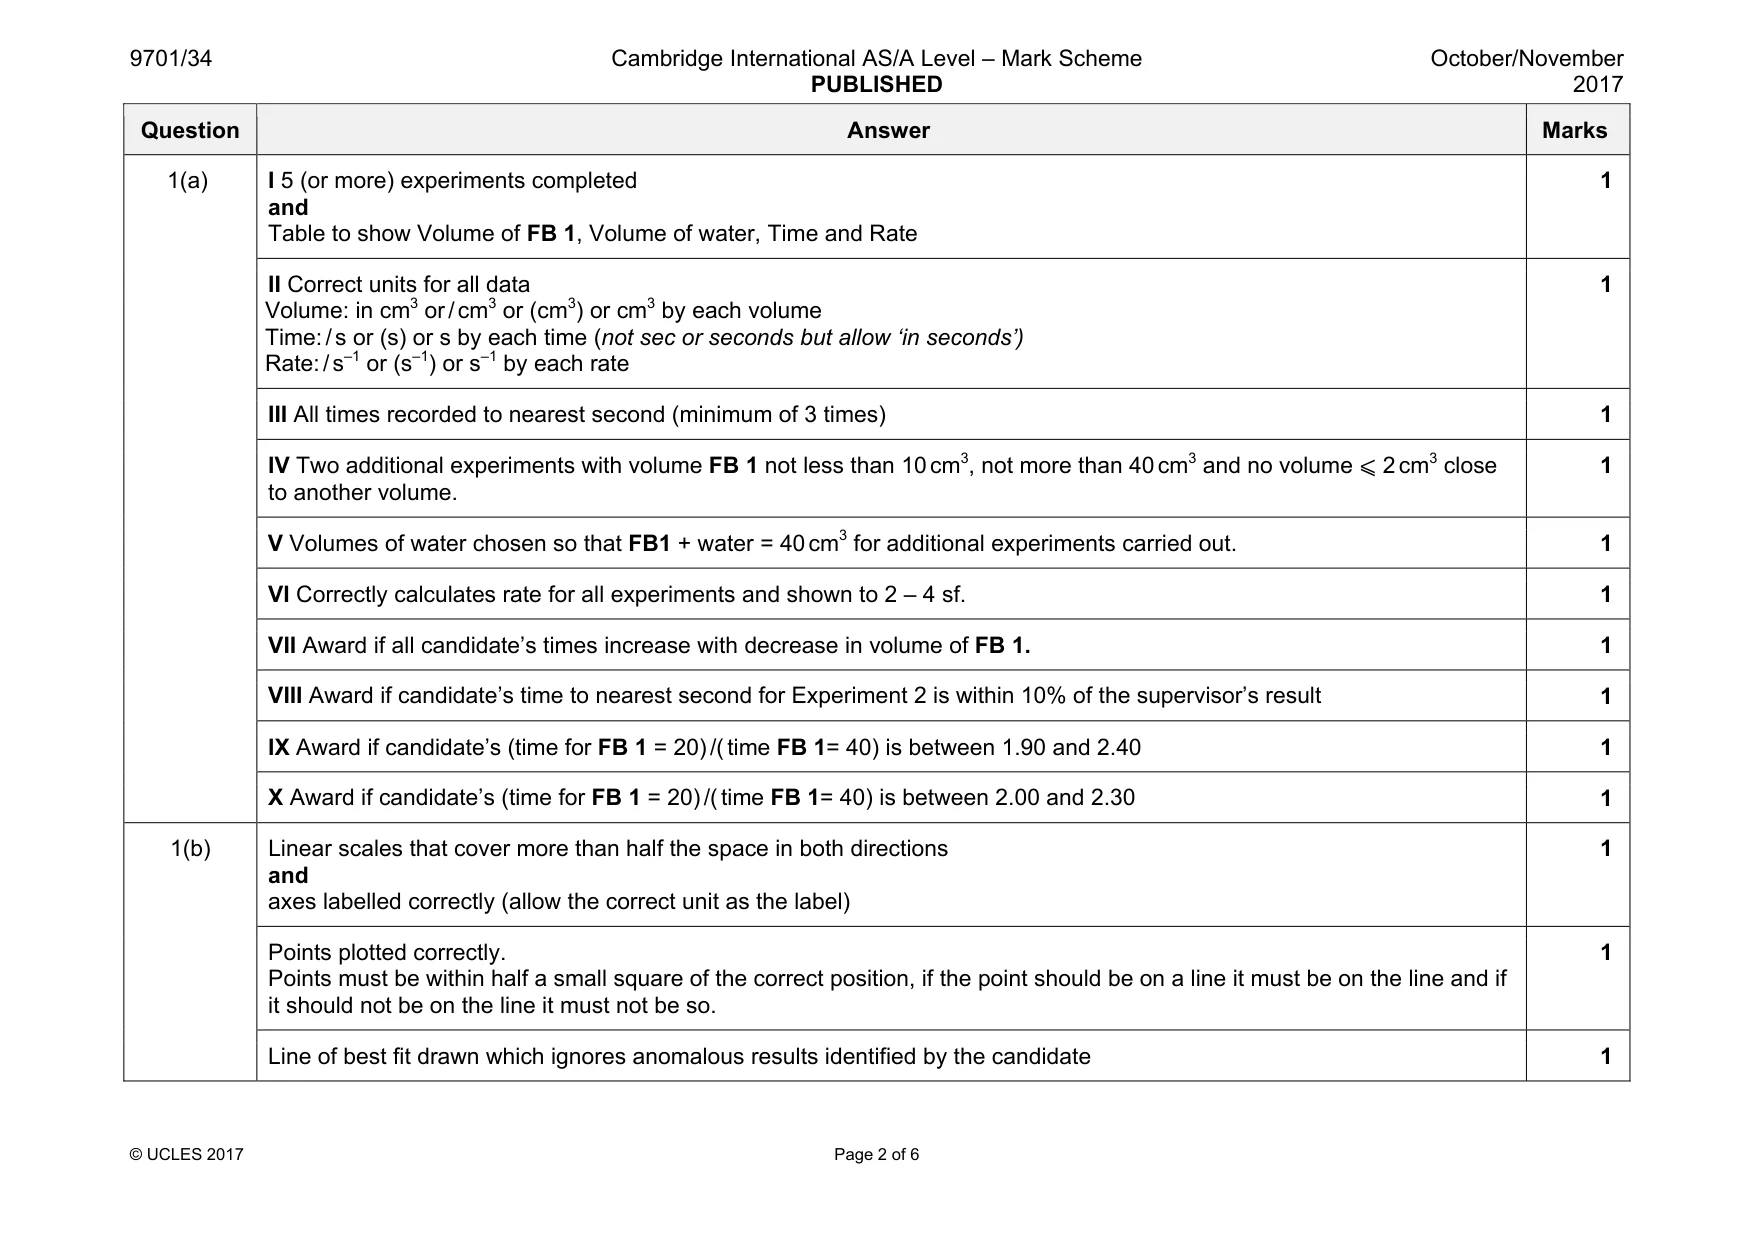
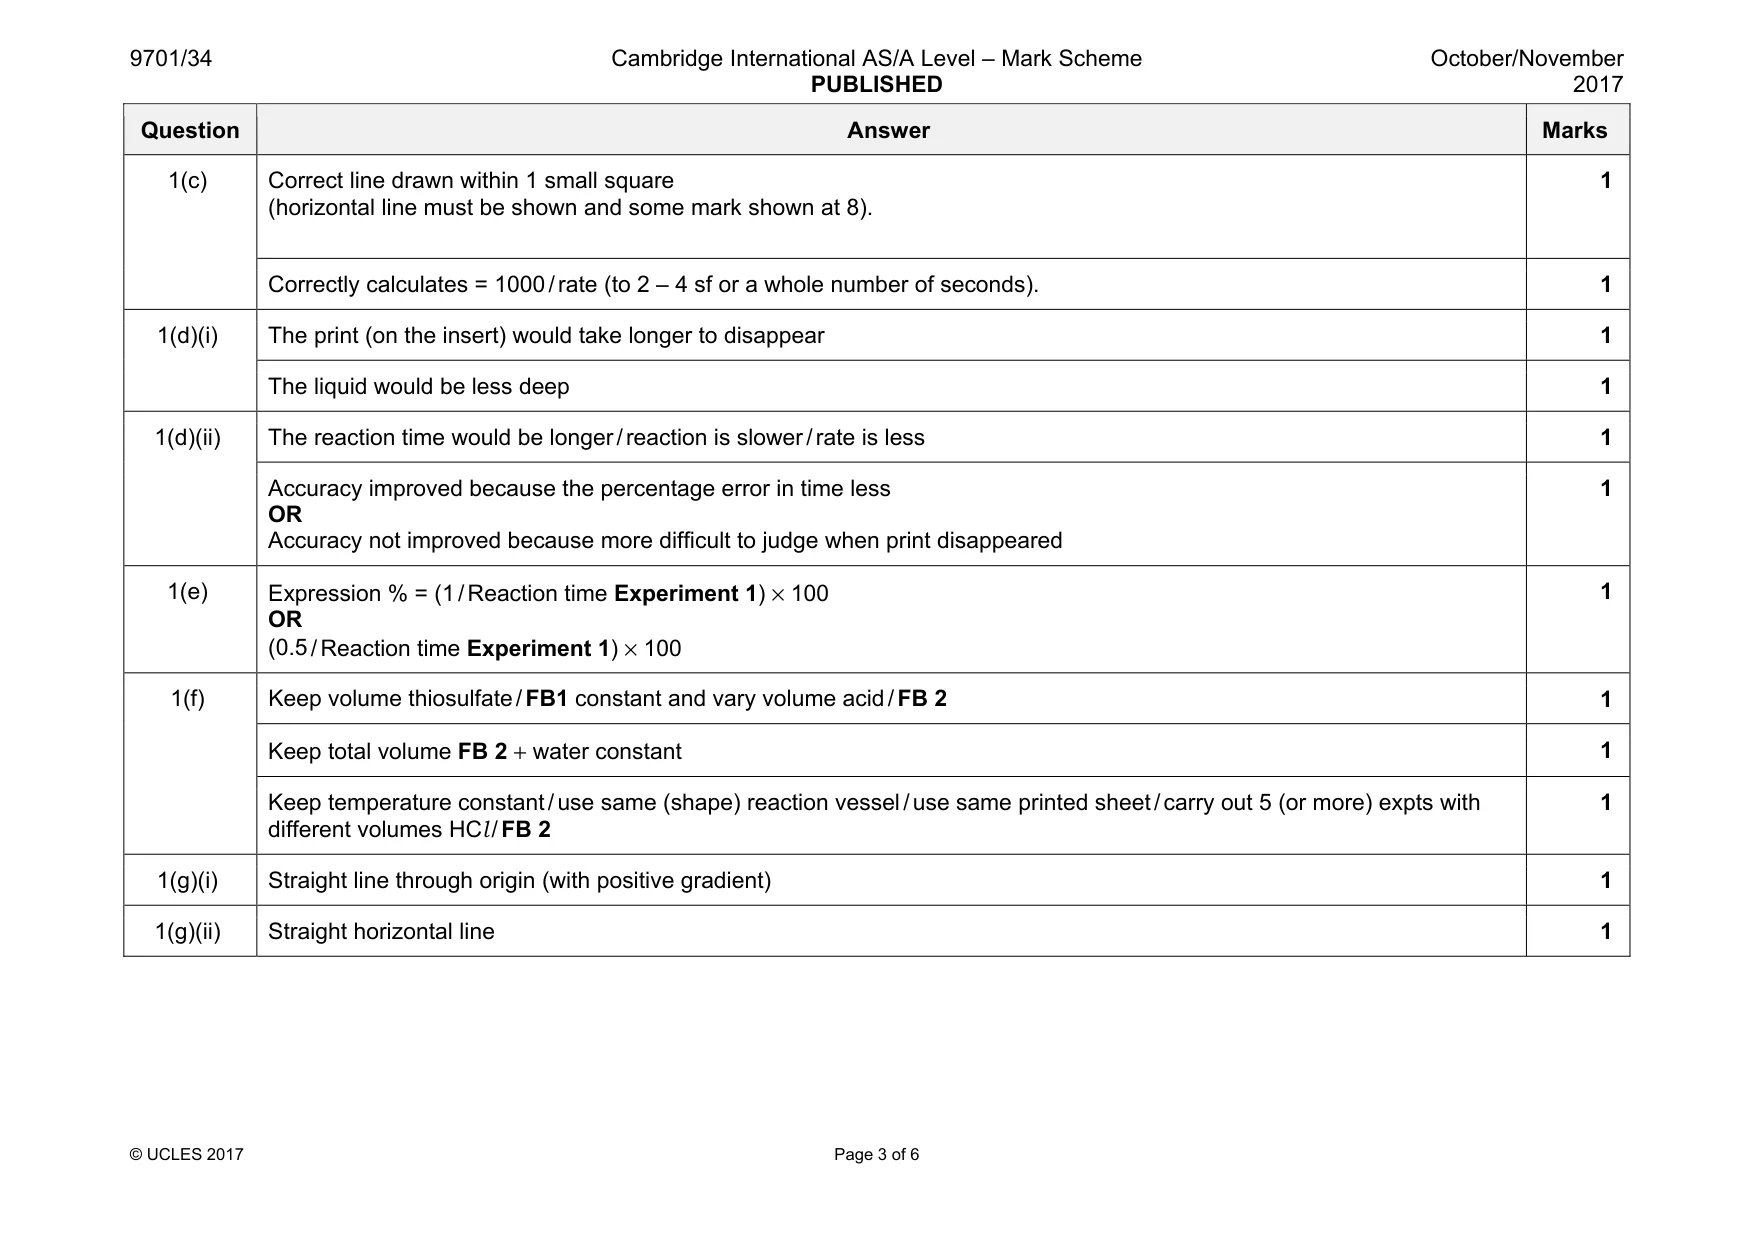
Mark scheme: 1(a) I 5 (or more) experiments completed and Table to show Volume of FB 1, Volume of water, Time and Rate 1 II Correct units for all data Volume: in cm3 or / cm3 or (cm3) or cm3 by each volume Time: / s or (s) or s by each time (not sec or seconds but allow ‘in seconds’) Rate: / s–1 or (s–1) or s–1 by each rate 1 III All times recorded to nearest second (minimum of 3 times) 1 IV Two additional experiments with volume FB 1 not less than 10 cm3, not more than 40 cm3 and no volume ⩽ 2 cm3 close to another volume. 1 V Volumes of water chosen so that FB1 + water = 40 cm3 for additional experiments carried out. 1 VI Correctly calculates rate for all experiments and shown to 2 – 4 sf. 1 VII Award if all candidate’s times increase with decrease in volume of FB 1. 1 VIII Award if candidate’s time to nearest second for Experiment 2 is within 10% of the supervisor’s result 1 IX Award if candidate’s (time for FB 1 = 20) /( time FB 1= 40) is between 1.90 and 2.40 1 X Award if candidate’s (time for FB 1 = 20) /( time FB 1= 40) is between 2.00 and 2.30 1 1(b) Linear scales that cover more than half the space in both directions and axes labelled correctly (allow the correct unit as the label) 1 Points plotted correctly. Points must be within half a small square of the correct position, if the point should be on a line it must be on the line and if it should not be on the line it must not be so. 1 Line of best fit drawn which ignores anomalous results identified by the candidate 1 Question Answer Marks 1(c) Correct line drawn within 1 small square (horizontal line must be shown and some mark shown at 8). 1 Correctly calculates = 1000 / rate (to 2 – 4 sf or a whole number of seconds). 1 1(d)(i) The print (on the insert) would take longer to disappear 1 The liquid would be less deep 1 1(d)(ii) The reaction time would be longer / reaction is slower / rate is less 1 Accuracy improved because the percentage error in time less OR Accuracy not improved because more difficult to judge when print disappeared 1 1(e) Expression % = (1 / Reaction time Experiment 1) × 100 OR (0.5 / Reaction time Experiment 1) × 100 1 1(f) Keep volume thiosulfate / FB1 constant and vary volume acid / FB 2 1 Keep total volume FB 2 + water constant 1 Keep temperature constant / use same (shape) reaction vessel / use same printed sheet / carry out 5 (or more) expts with different volumes HCl / FB 2 1 1(g)(i) Straight line through origin (with positive gradient) 1 1(g)(ii) Straight horizontal line 1
Q2 · Qualitative Analysis At each stage of any test you are to record details of the…
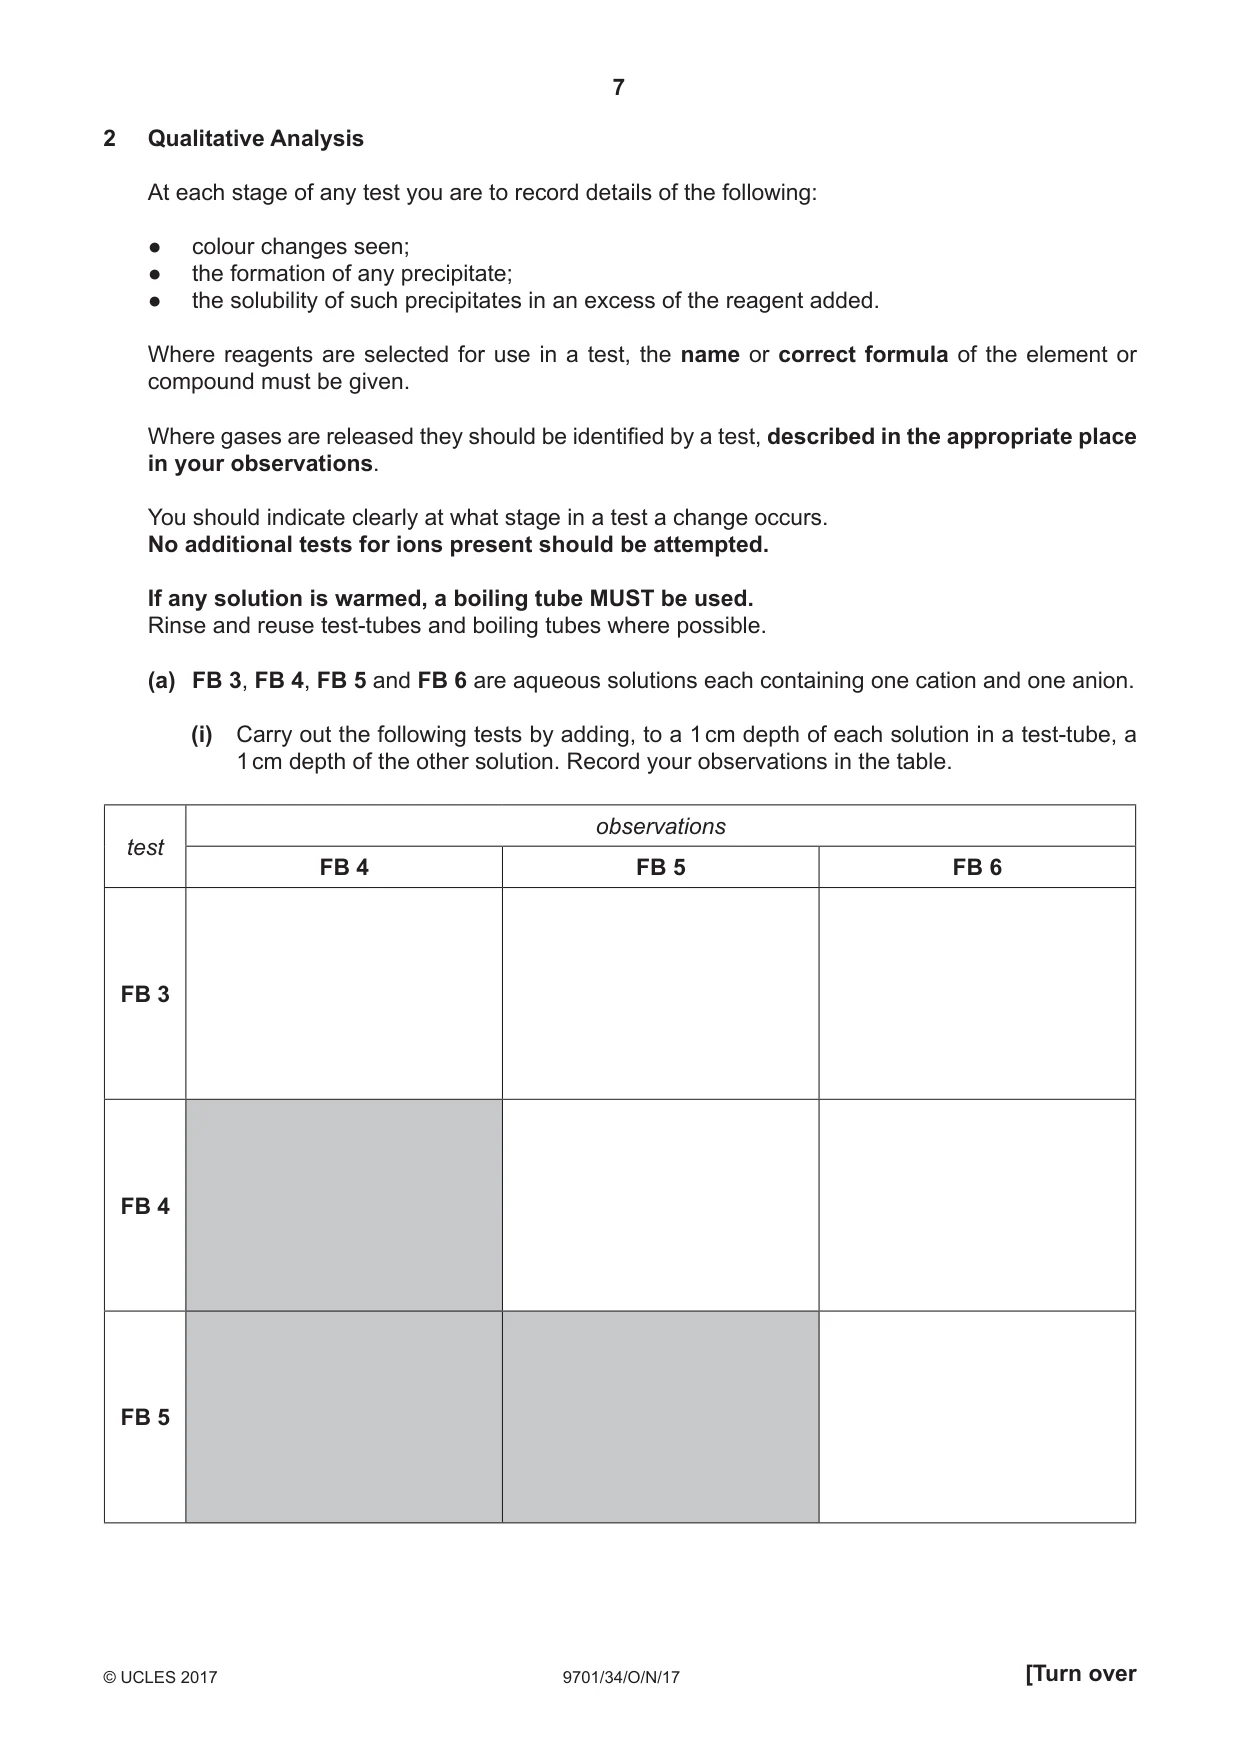
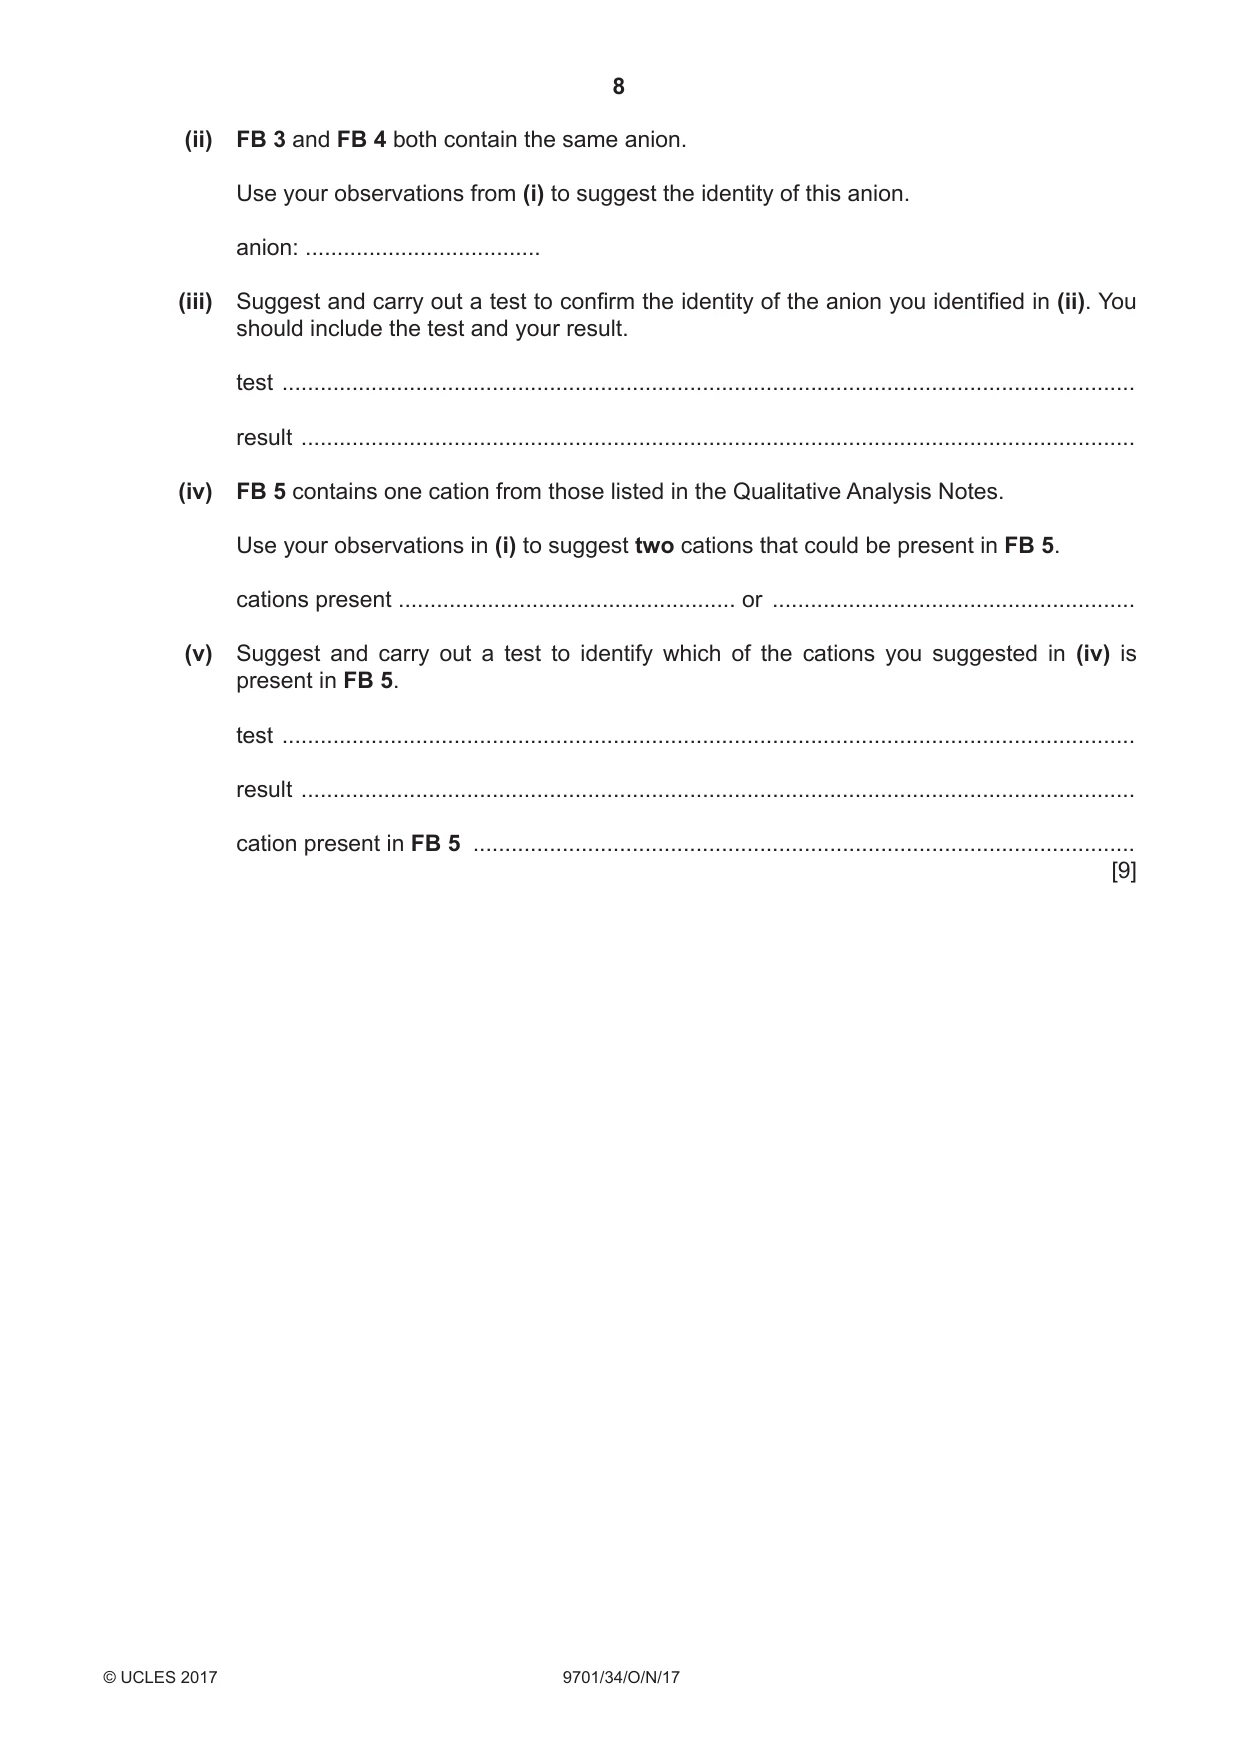
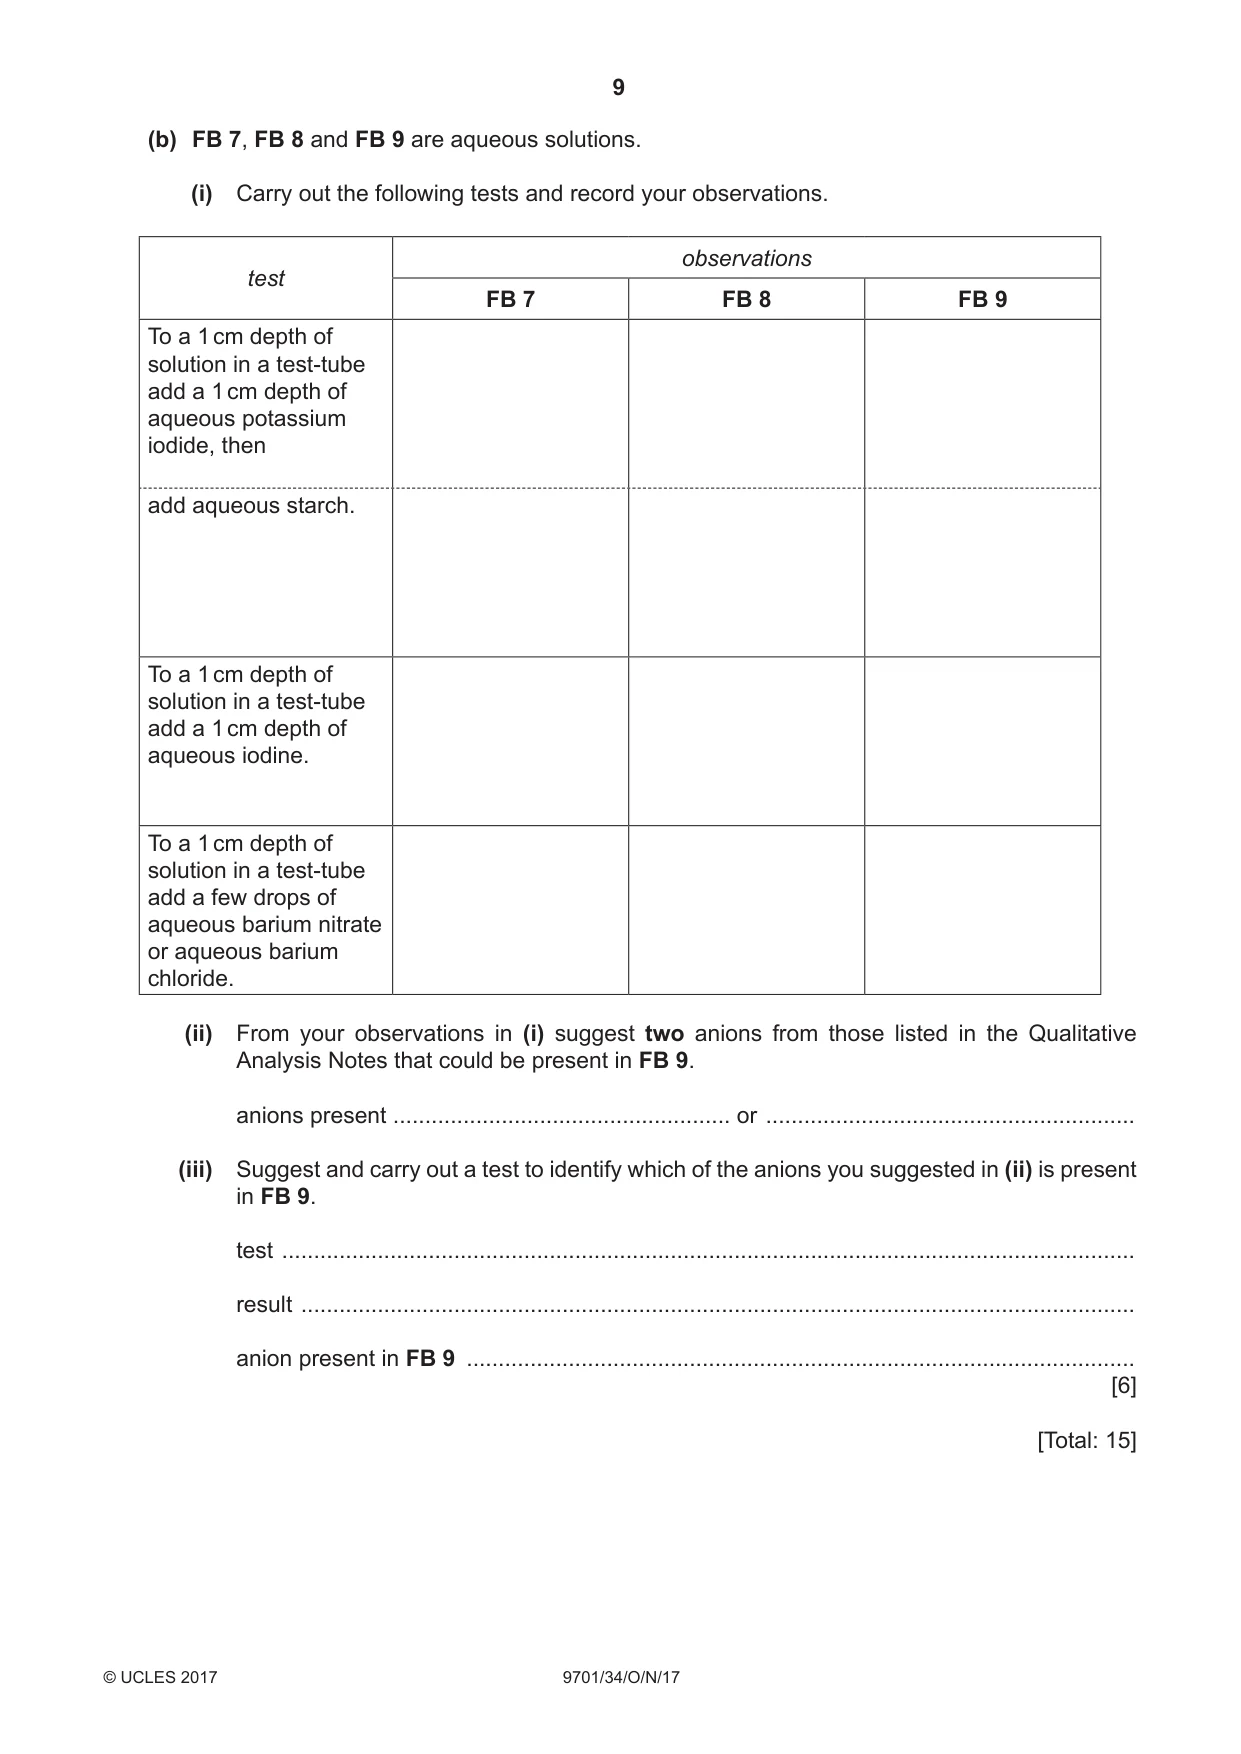
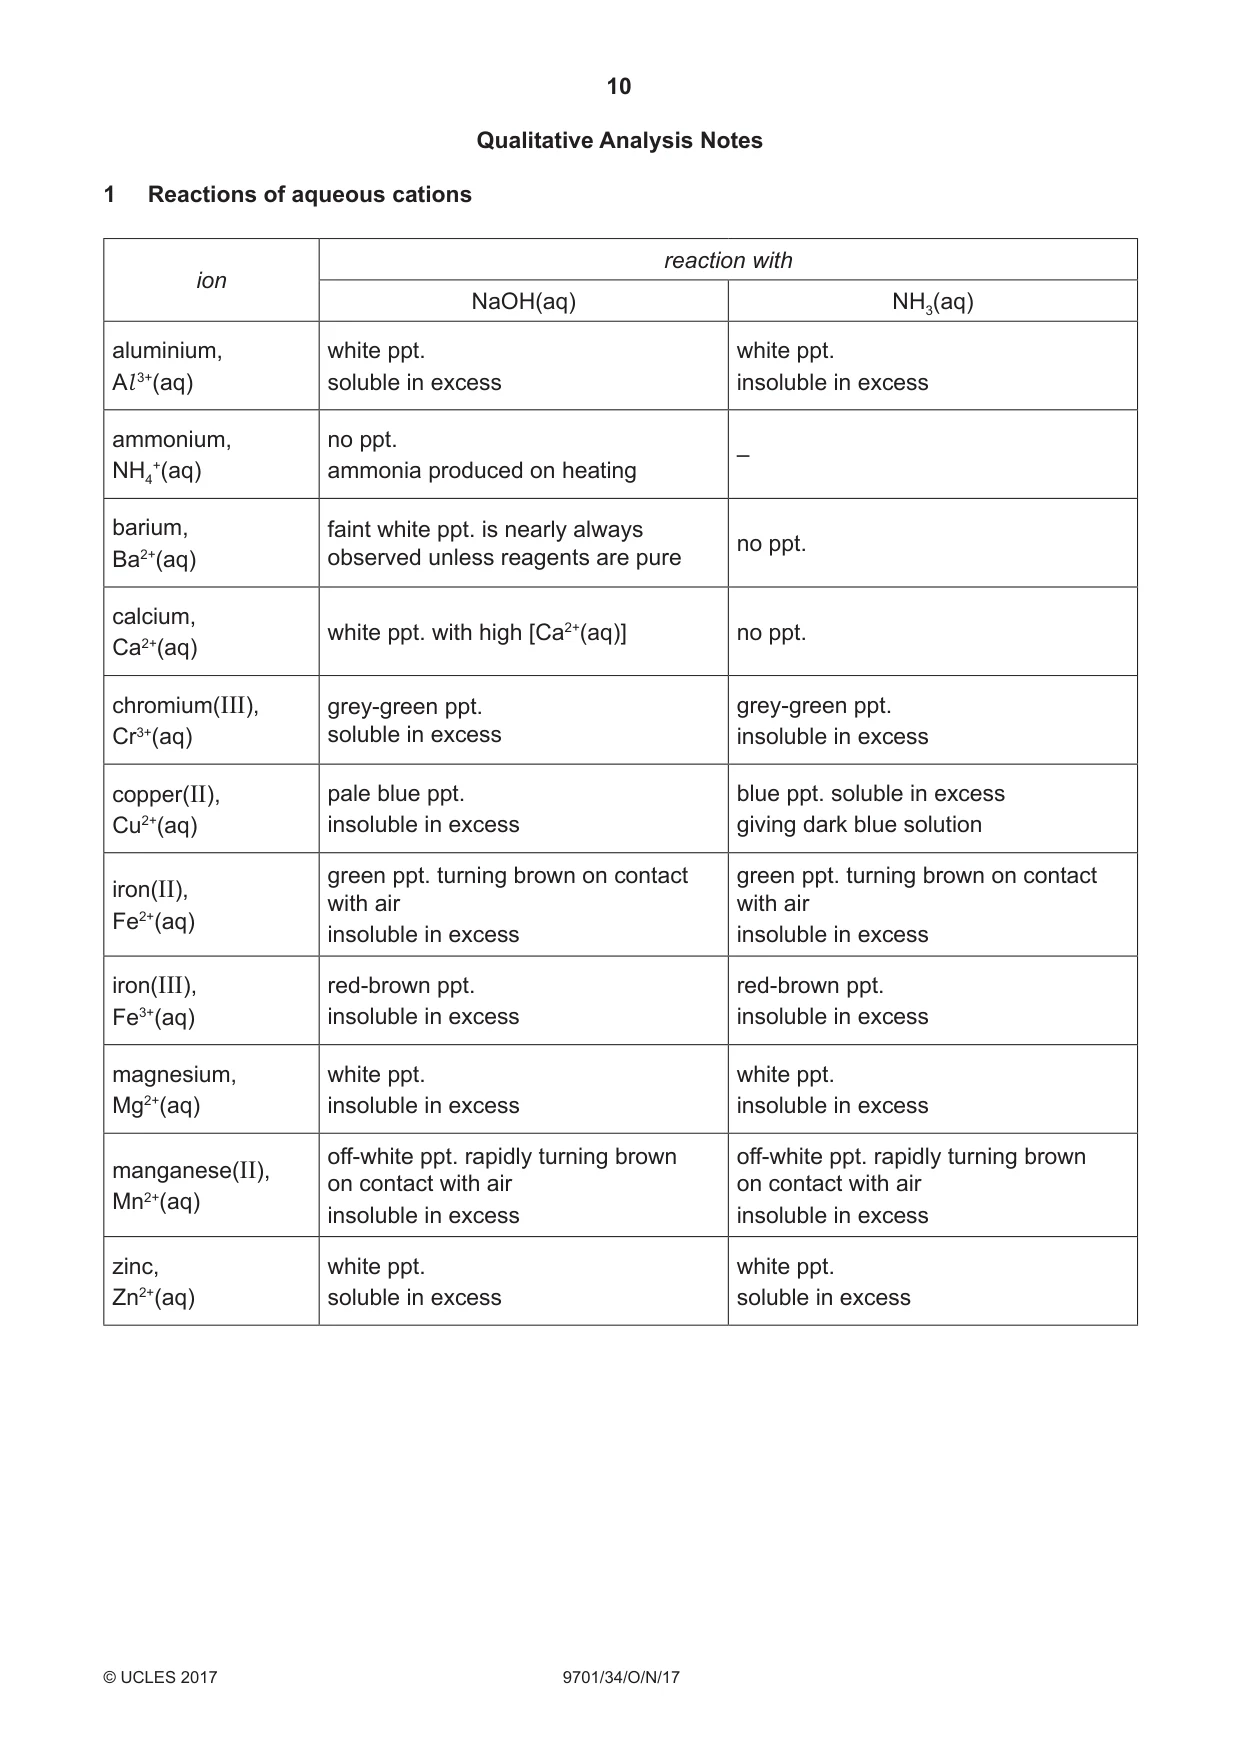
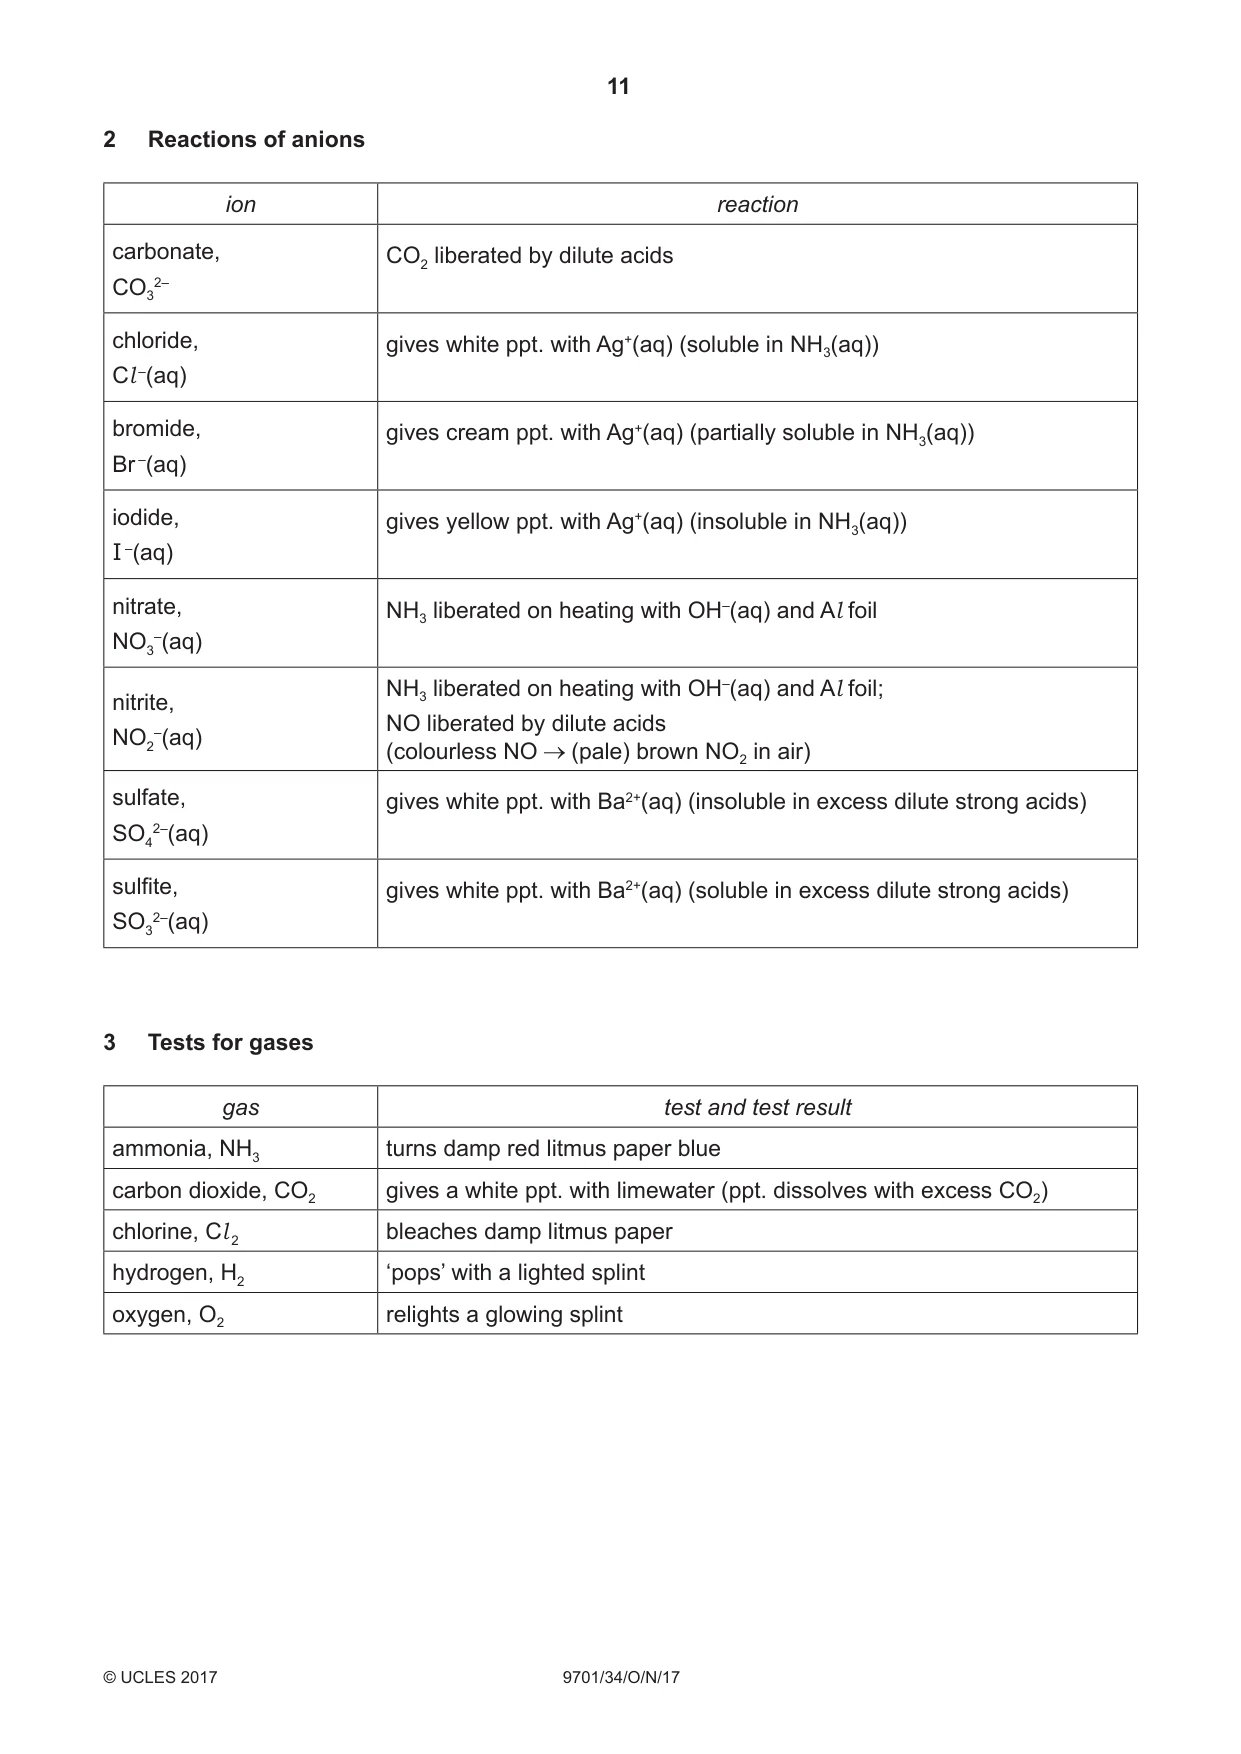
2 Qualitative Analysis At each stage of any test you are to record details of the following: ● colour changes seen; ● the formation of any precipitate; ● the solubility of such precipitates in an excess of the reagent added. Where reagents are selected for use in a test, the name or correct formula of the element or compound must be given. Where gases are released they should be identified by a test, described in the appropriate place in your observations. You should indicate clearly at what stage in a test a change occurs. No additional tests for ions present should be attempted. If any solution is warmed, a boiling tube MUST be used. Rinse and reuse test-tubes and boiling tubes where possible. (a) FB 3, FB 4, FB 5 and FB 6 are aqueous solutions each containing one cation and one anion. (i) Carry out the following tests by adding, to a 1 cm depth of each solution in a test-tube, a 1 cm depth of the other solution. Record your observations in the table. observations test FB 4 FB 5 FB 6 FB 3 FB 4 FB 5 (ii) FB 3 and FB 4 both contain the same anion. Use your observations from (i) to suggest the identity of this anion. anion: ..................................... (iii) Suggest and carry out a test to confirm the identity of the anion you identified in (ii). You should include the test and your result. test ...................................................................................................................................... result ................................................................................................................................... (iv) FB 5 contains one cation from those listed in the Qualitative Analysis Notes. Use your observations in (i) to suggest two cations that could be present in FB 5. cations present ..................................................... or .......................................................... (v) Suggest and carry out a test to identify which of the cations you suggested in (iv) is present in FB 5. test ...................................................................................................................................... result ................................................................................................................................... cation present in FB 5 ......................................................................................................... [9] (b) FB 7, FB 8 and FB 9 are aqueous solutions. (i) Carry out the following tests and record your observations. observations test FB 7 FB 8 FB 9 To a 1 cm depth of solution in a test-tube add a 1 cm depth of aqueous potassium iodide, then add aqueous starch. To a 1 cm depth of solution in a test-tube add a 1 cm depth of aqueous iodine. To a 1 cm depth of solution in a test-tube add a few drops of aqueous barium nitrate or aqueous barium chloride. (ii) From your observations in (i) suggest two anions from those listed in the Qualitative Analysis Notes that could be present in FB 9. anions present ..................................................... or .......................................................... (iii) Suggest and carry out a test to identify which of the anions you suggested in (ii) is present in FB 9. test ...................................................................................................................................... result ................................................................................................................................... anion present in FB 9 .......................................................................................................... [6] [Total: 15]
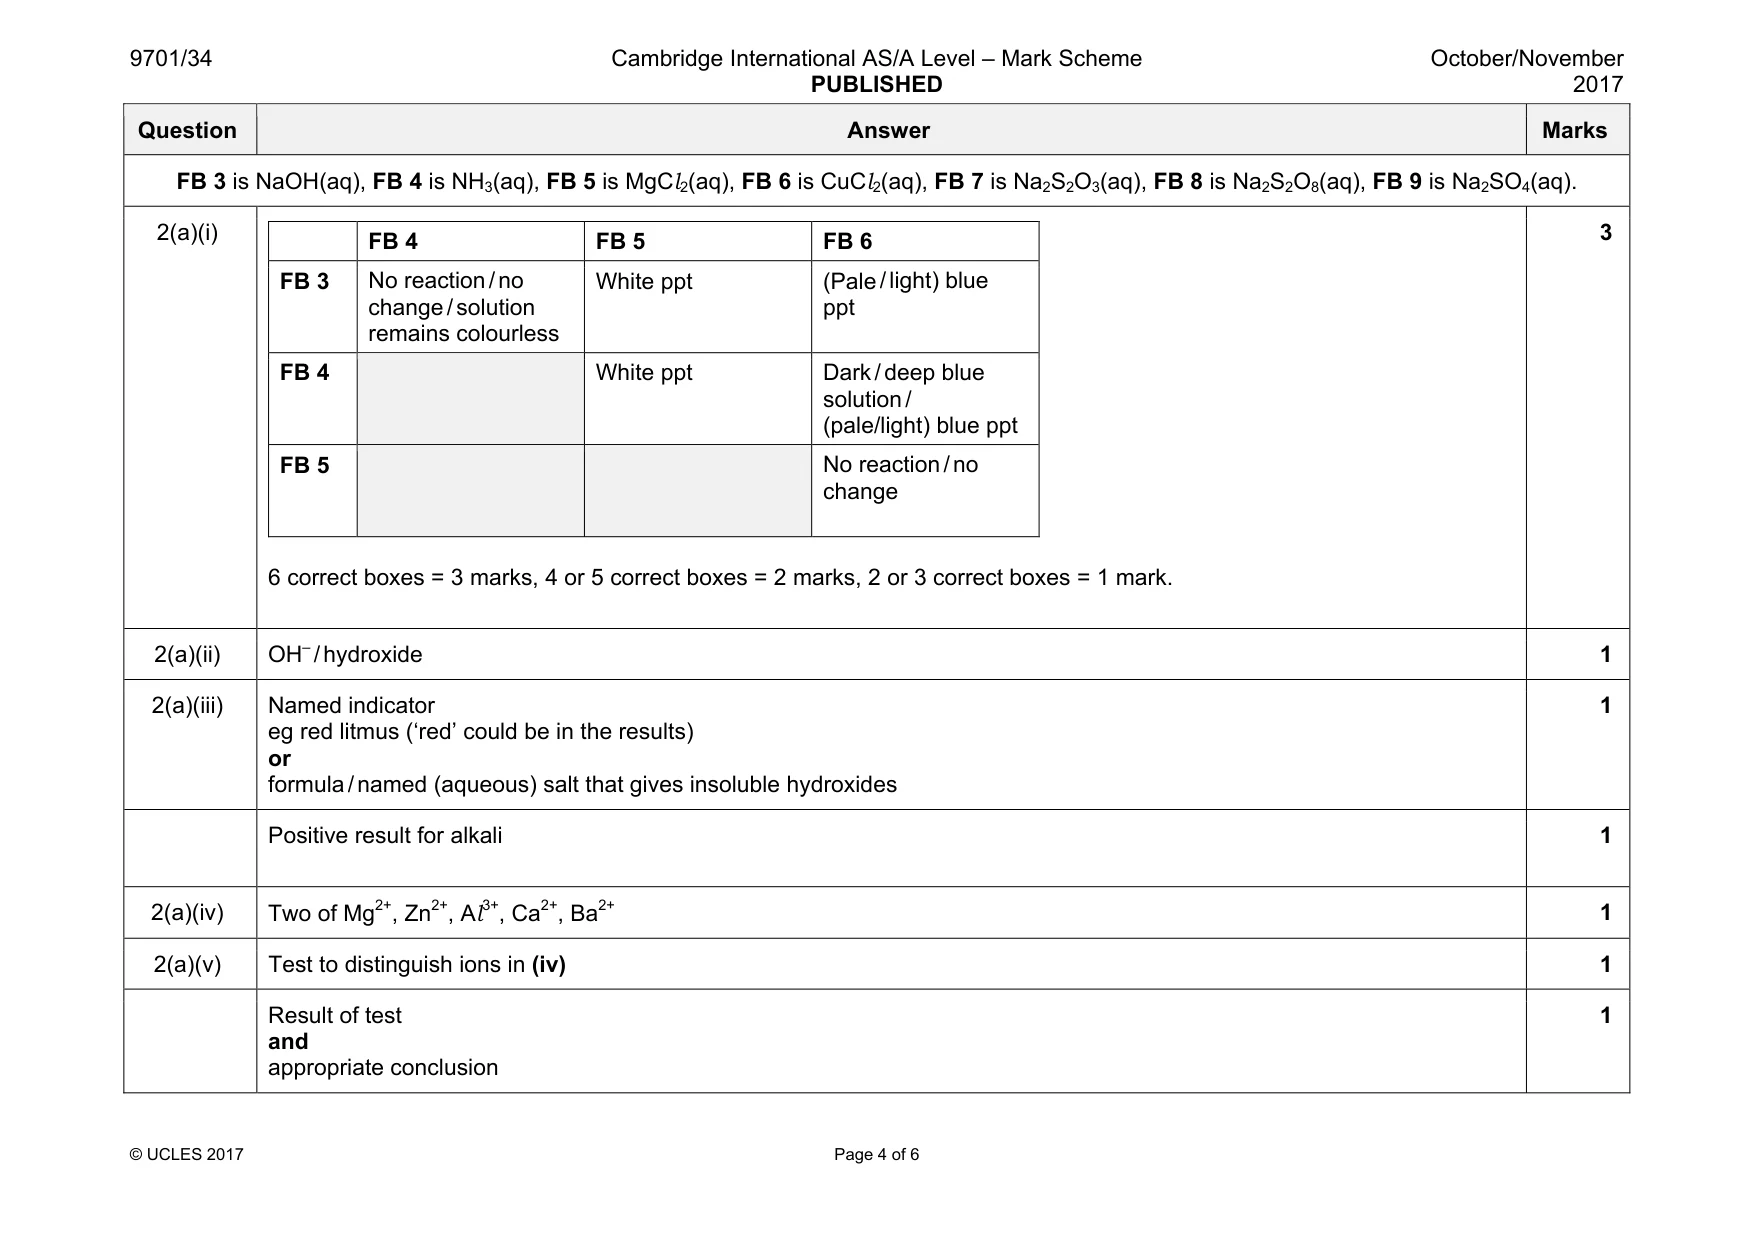
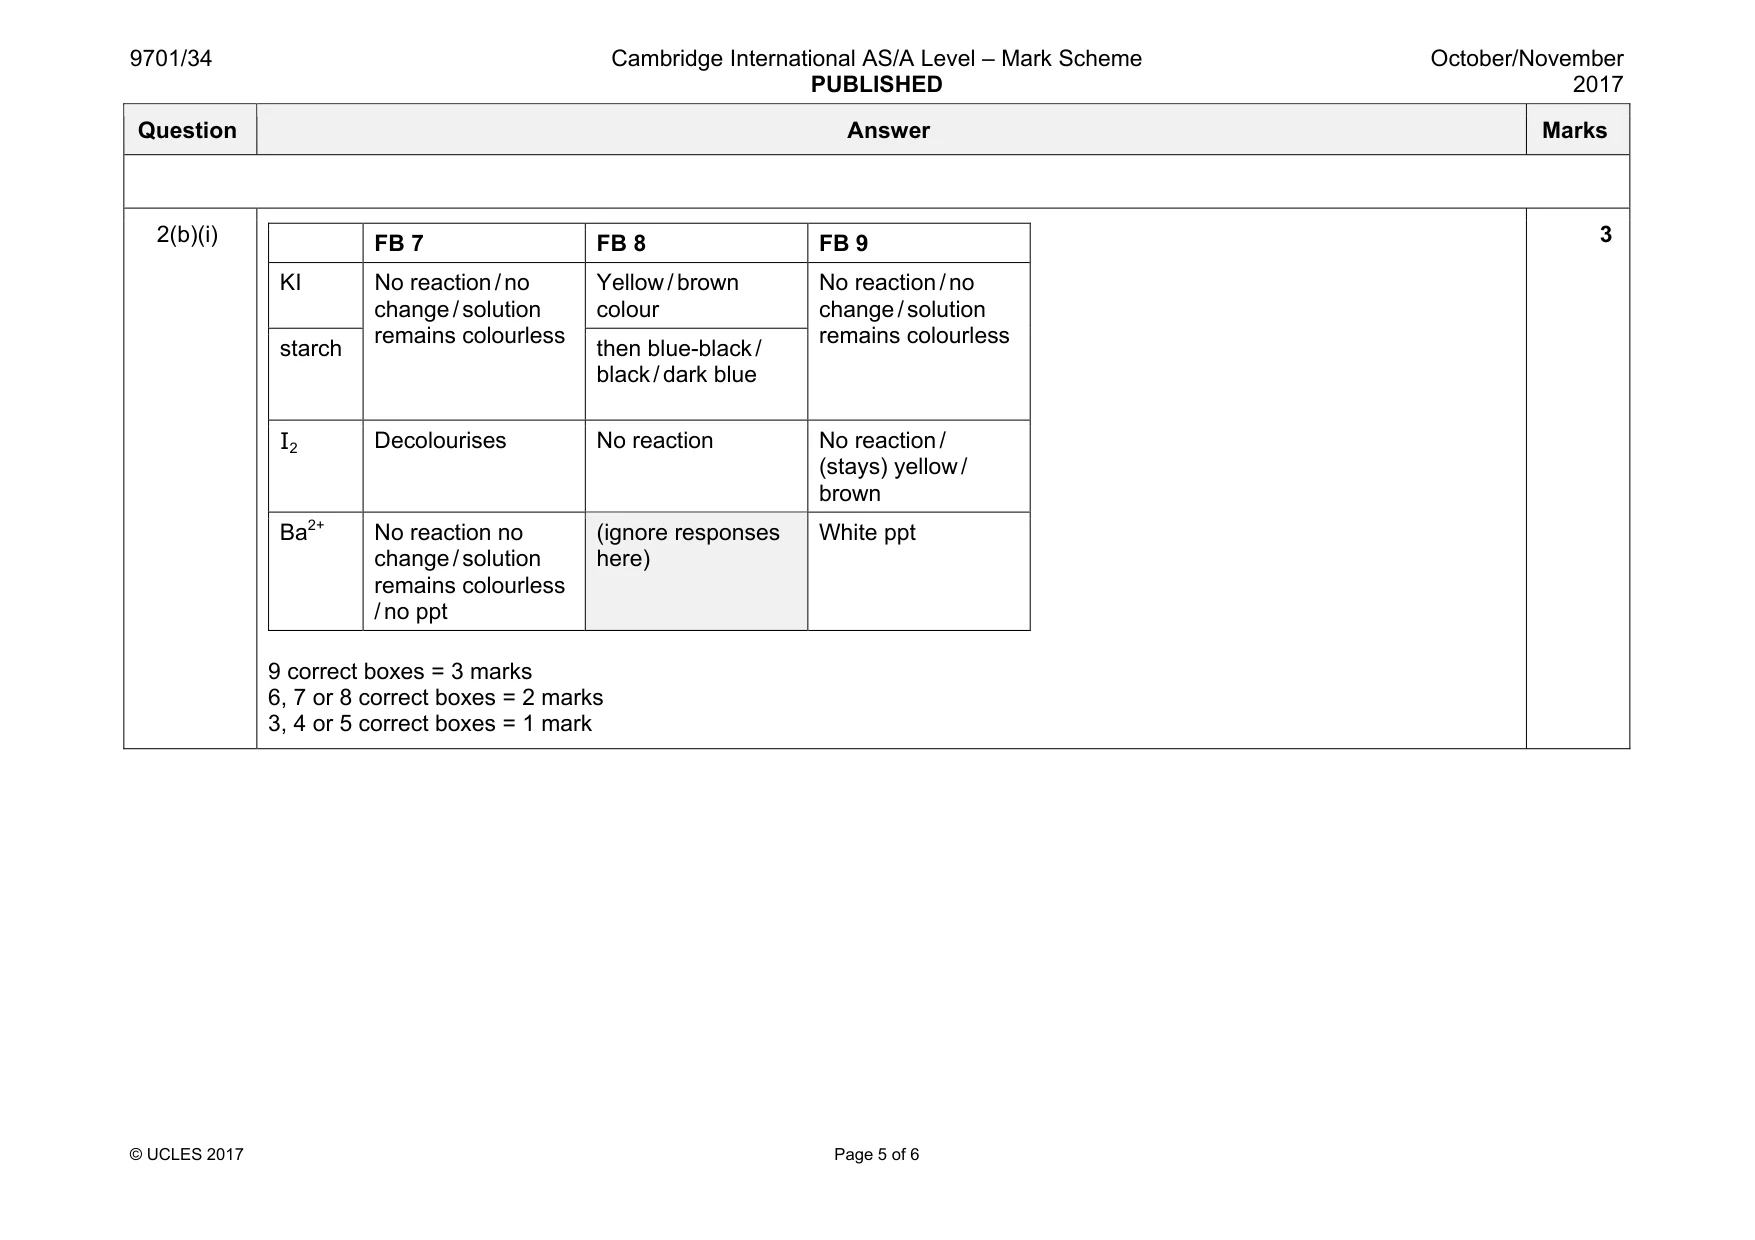
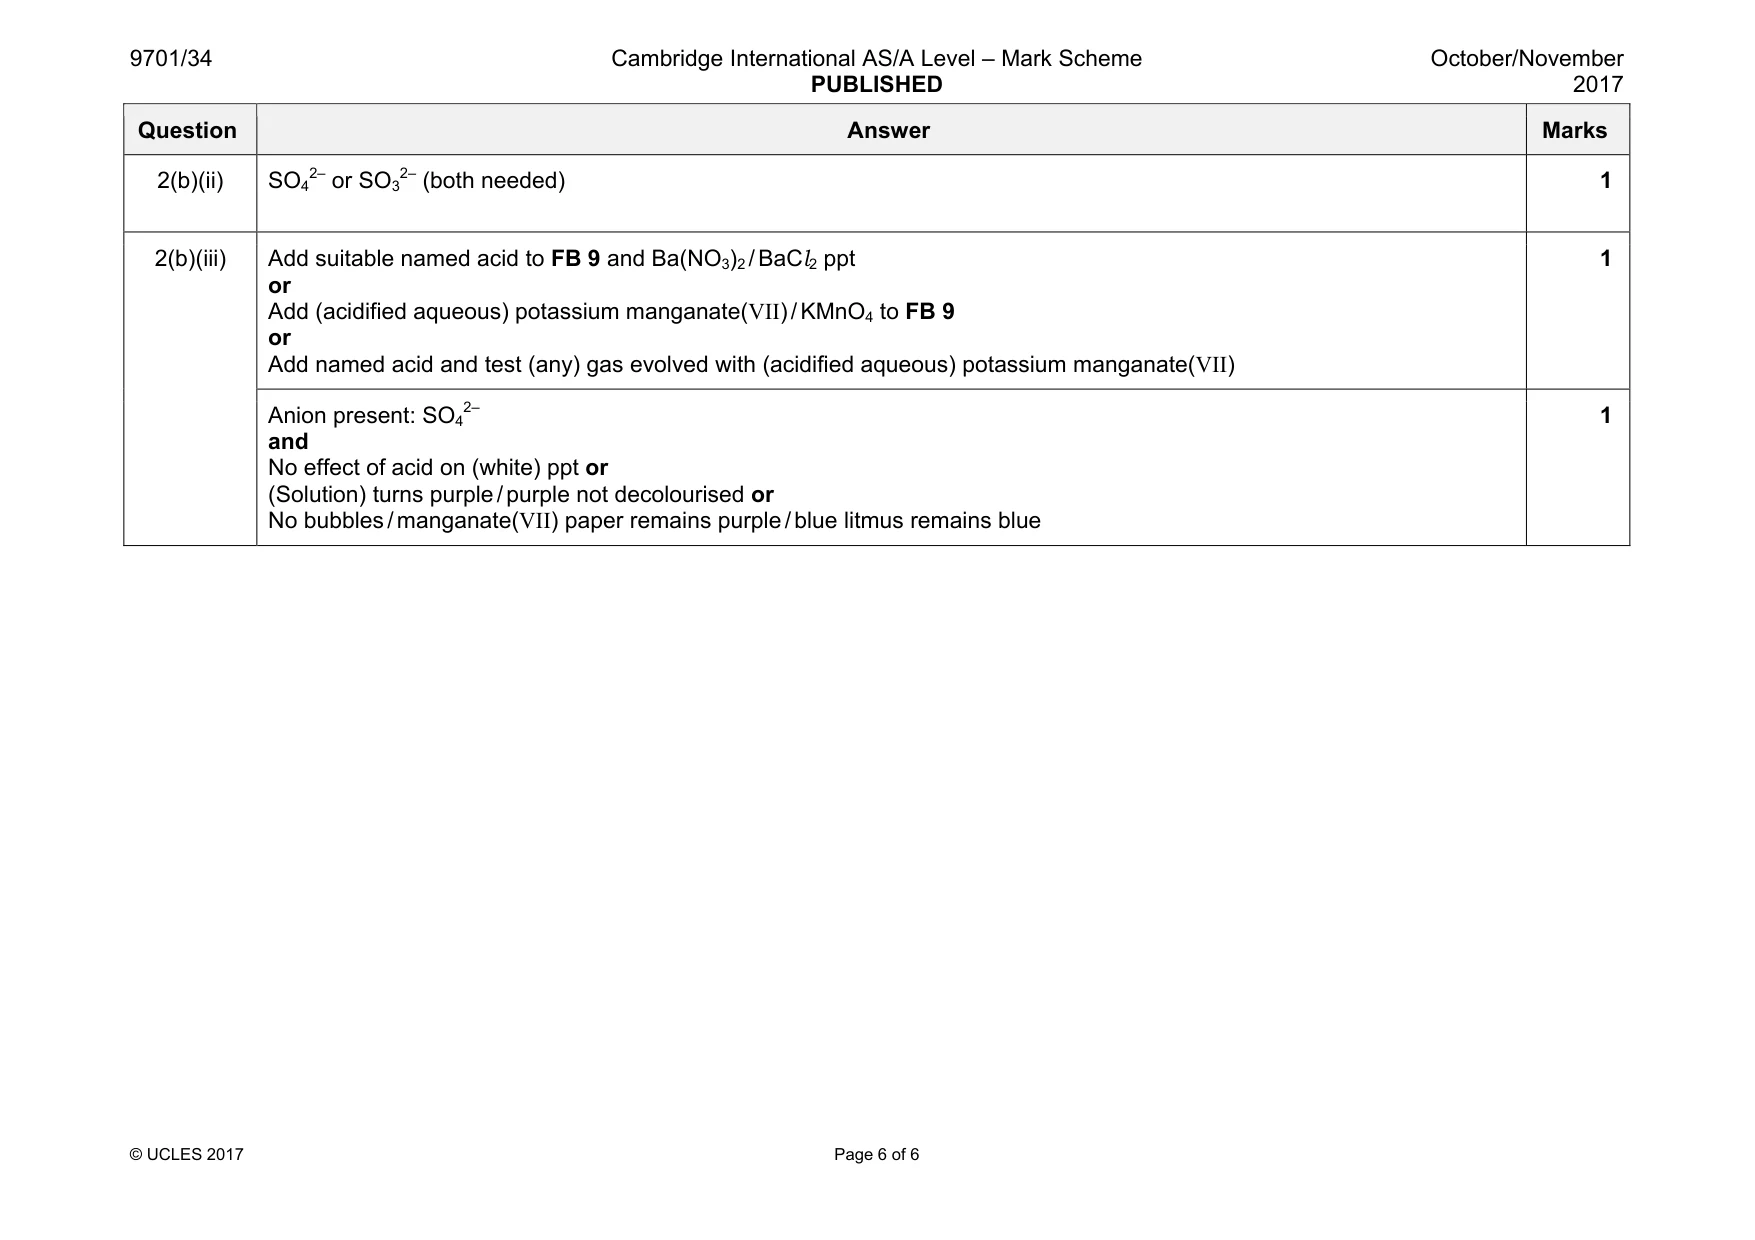
Mark scheme: 2(a)(i) FB 4 FB 5 FB 6 FB 3 No reaction / no change / solution remains colourless White ppt (Pale / light) blue ppt FB 4 White ppt Dark / deep blue solution / (pale/light) blue ppt FB 5 No reaction / no change 6 correct boxes = 3 marks, 4 or 5 correct boxes = 2 marks, 2 or 3 correct boxes = 1 mark. 3 2(a)(ii) OH– / hydroxide 1 2(a)(iii) Named indicator eg red litmus (‘red’ could be in the results) or formula / named (aqueous) salt that gives insoluble hydroxides 1 Positive result for alkali 1 2(a)(iv) Two of Mg2+, Zn2+, Al3+, Ca2+, Ba2+ 1 2(a)(v) Test to distinguish ions in (iv) 1 Result of test and appropriate conclusion 1 Question Answer Marks 2(b)(i) FB 7 FB 8 FB 9 KI No reaction / no change / solution remains colourless Yellow / brown colour No reaction / no change / solution remains colourless starch then blue-black / black / dark blue I2 Decolourises No reaction No reaction / (stays) yellow / brown Ba2+ No reaction no change / solution remains colourless / no ppt (ignore responses here) White ppt 9 correct boxes = 3 marks 6, 7 or 8 correct boxes = 2 marks 3, 4 or 5 correct boxes = 1 mark 3 Question Answer Marks 2(b)(ii) SO4 2– or SO3 2– (both needed) 1 2(b)(iii) Add suitable named acid to FB 9 and Ba(NO3)2 / BaCl2 ppt or Add (acidified aqueous) potassium manganate(VII) / KMnO4 to FB 9 or Add named acid and test (any) gas evolved with (acidified aqueous) potassium manganate(VII) 1 Anion present: SO4 2– and No effect of acid on (white) ppt or (Solution) turns purple / purple not decolourised or No bubbles / manganate(VII) paper remains purple / blue litmus remains blue 1
What was in this paper
The subtopics covered by these 2 questions, and how many questions each got. Open one in a new tab to see every Cambridge question on it.
What you needed in this session
Cambridge’s own grade thresholds for 2017 Oct/Nov, Paper 3 · Variant 4. A higher threshold means an easier paper — the bar moves with how the cohort did.