Cambridge A Level Chemistry 9701 — 2010 May/June Paper 3 · Variant 3
9701/33/M/J/10 · 40 marks · ≈45 min
The question paper and its mark scheme, free to read here and free to download. This is Cambridge’s own paper, exactly as it was sat.
Question paper16 pages


Mark scheme8 pages
Answers below. Sit the paper first if you are practising.
Paper as text
Question paper, page 1
This document consists of 14 printed pages and 2 blank pages. DC (LEO/SW) 23111/3 © UCLES 2010 [Turn over * 8 2 6 3 3 7 1 4 5 4 * UNIVERSITY OF CAMBRIDGE INTERNATIONAL EXAMINATIONS General Certificate of Education Advanced Subsidiary Level and Advanced Level READ THESE INSTRUCTIONS FIRST Write your Centre number, candidate number and name on all the work you hand in. Give details of the practical session and laboratory where appropriate, in the boxes provided. Write in dark blue or black pen. You may use a soft pencil for any diagrams, graphs or rough working. Do not use staples, paper clips, highlighters, glue or correction fluid. DO NOT WRITE IN ANY BARCODES. Answer all questions. You may lose marks if you do not show your working or if you do not use appropriate units. Use of a Data Booklet is unnecessary. Qualitative Analysis Notes are printed on pages 15 and 16. At the end of the examination, fasten all your work securely together. The number of marks is given in brackets [ ] at the end of each question or part question. CHEMISTRY 9701/33 Paper 31 Advanced Practical Skills May/June 2010 2 hours Candidates answer on the Question Paper. Additional Materials: As listed in the Instructions to Supervisors For Examiner’s Use 1 2 Total Session Laboratory
Question paper, page 2
2 9701/33/M/J/10 © UCLES 2010 BLANK PAGE
Question paper, page 3
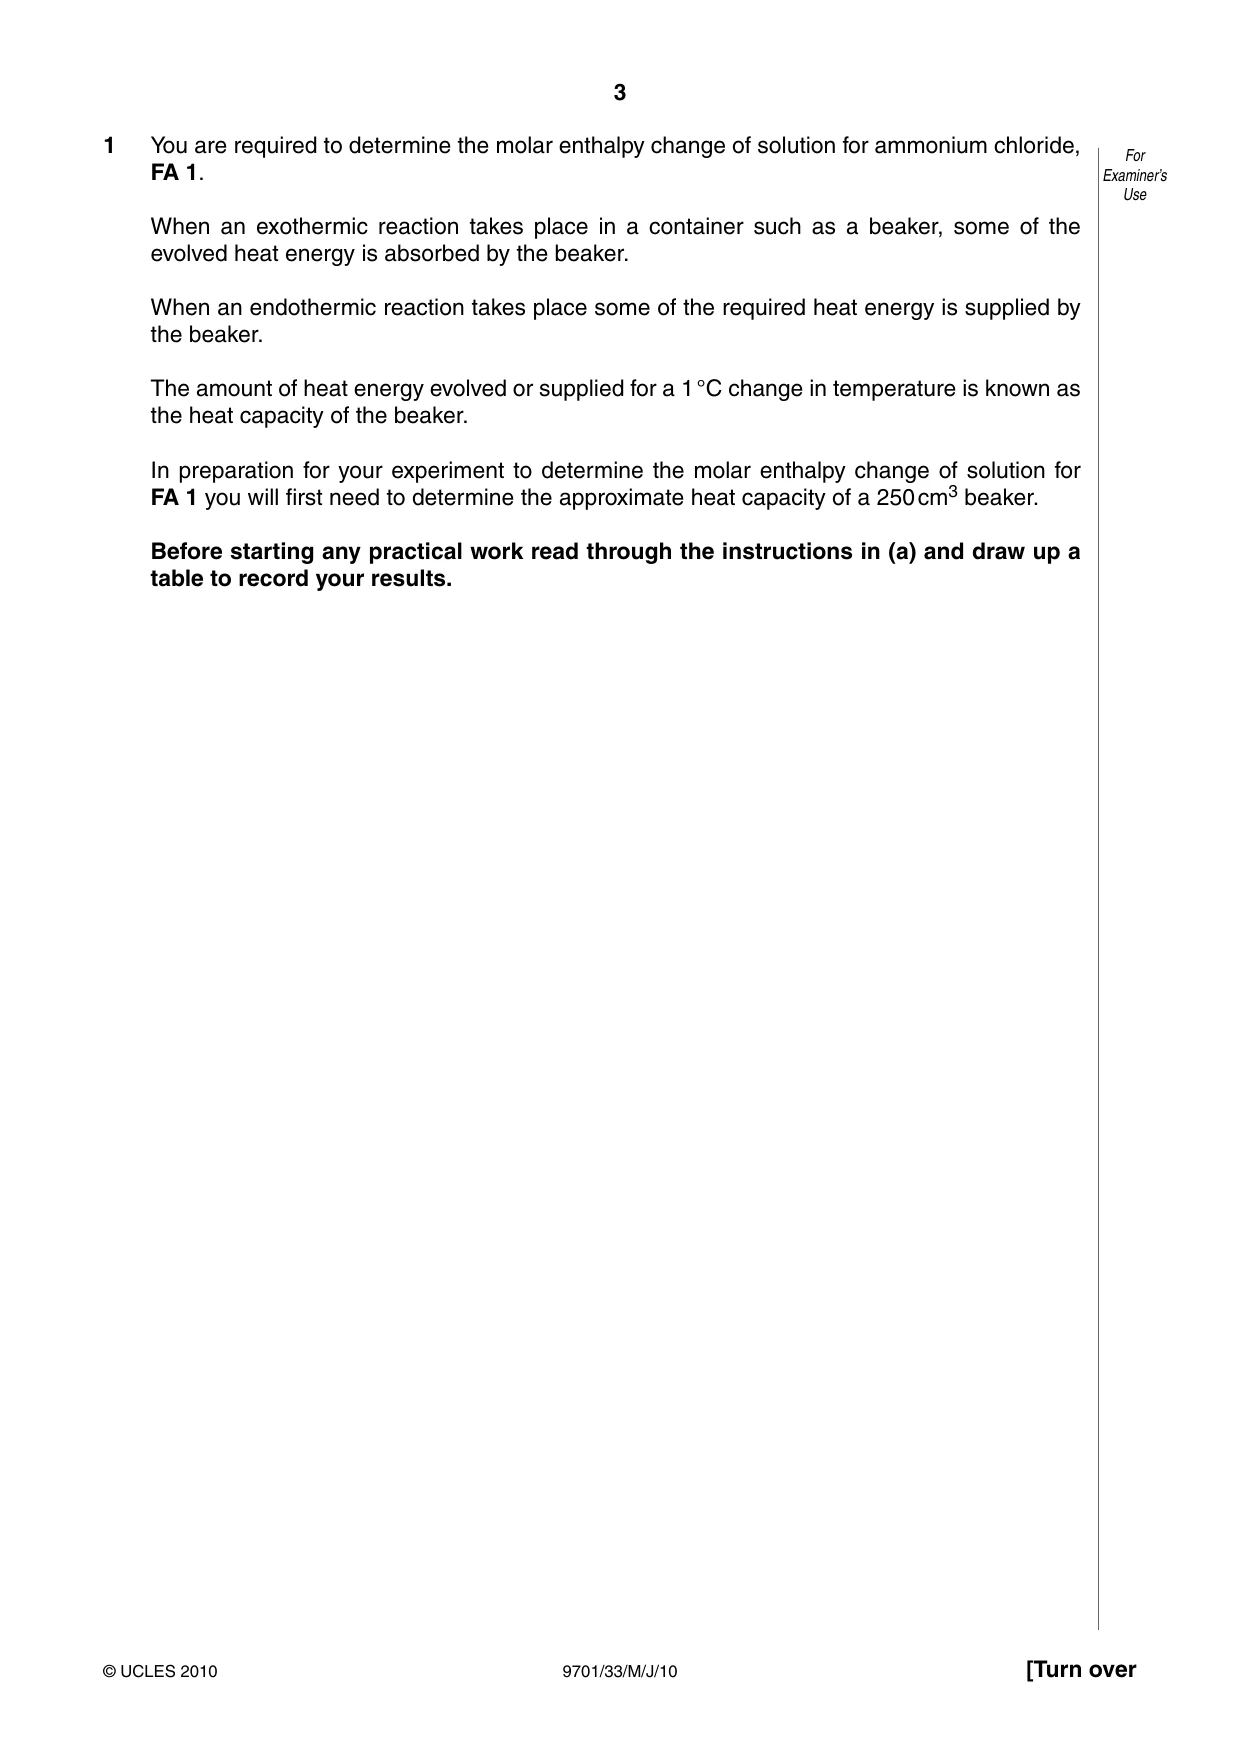
3 9701/33/M/J/10 © UCLES 2010 [Turn over For Examiner’s Use 1 You are required to determine the molar enthalpy change of solution for ammonium chloride, FA 1. When an exothermic reaction takes place in a container such as a beaker, some of the evolved heat energy is absorbed by the beaker. When an endothermic reaction takes place some of the required heat energy is supplied by the beaker. The amount of heat energy evolved or supplied for a 1 °C change in temperature is known as the heat capacity of the beaker. In preparation for your experiment to determine the molar enthalpy change of solution for FA 1 you will first need to determine the approximate heat capacity of a 250 cm3 beaker. Before starting any practical work read through the instructions in (a) and draw up a table to record your results.
Question paper, page 4
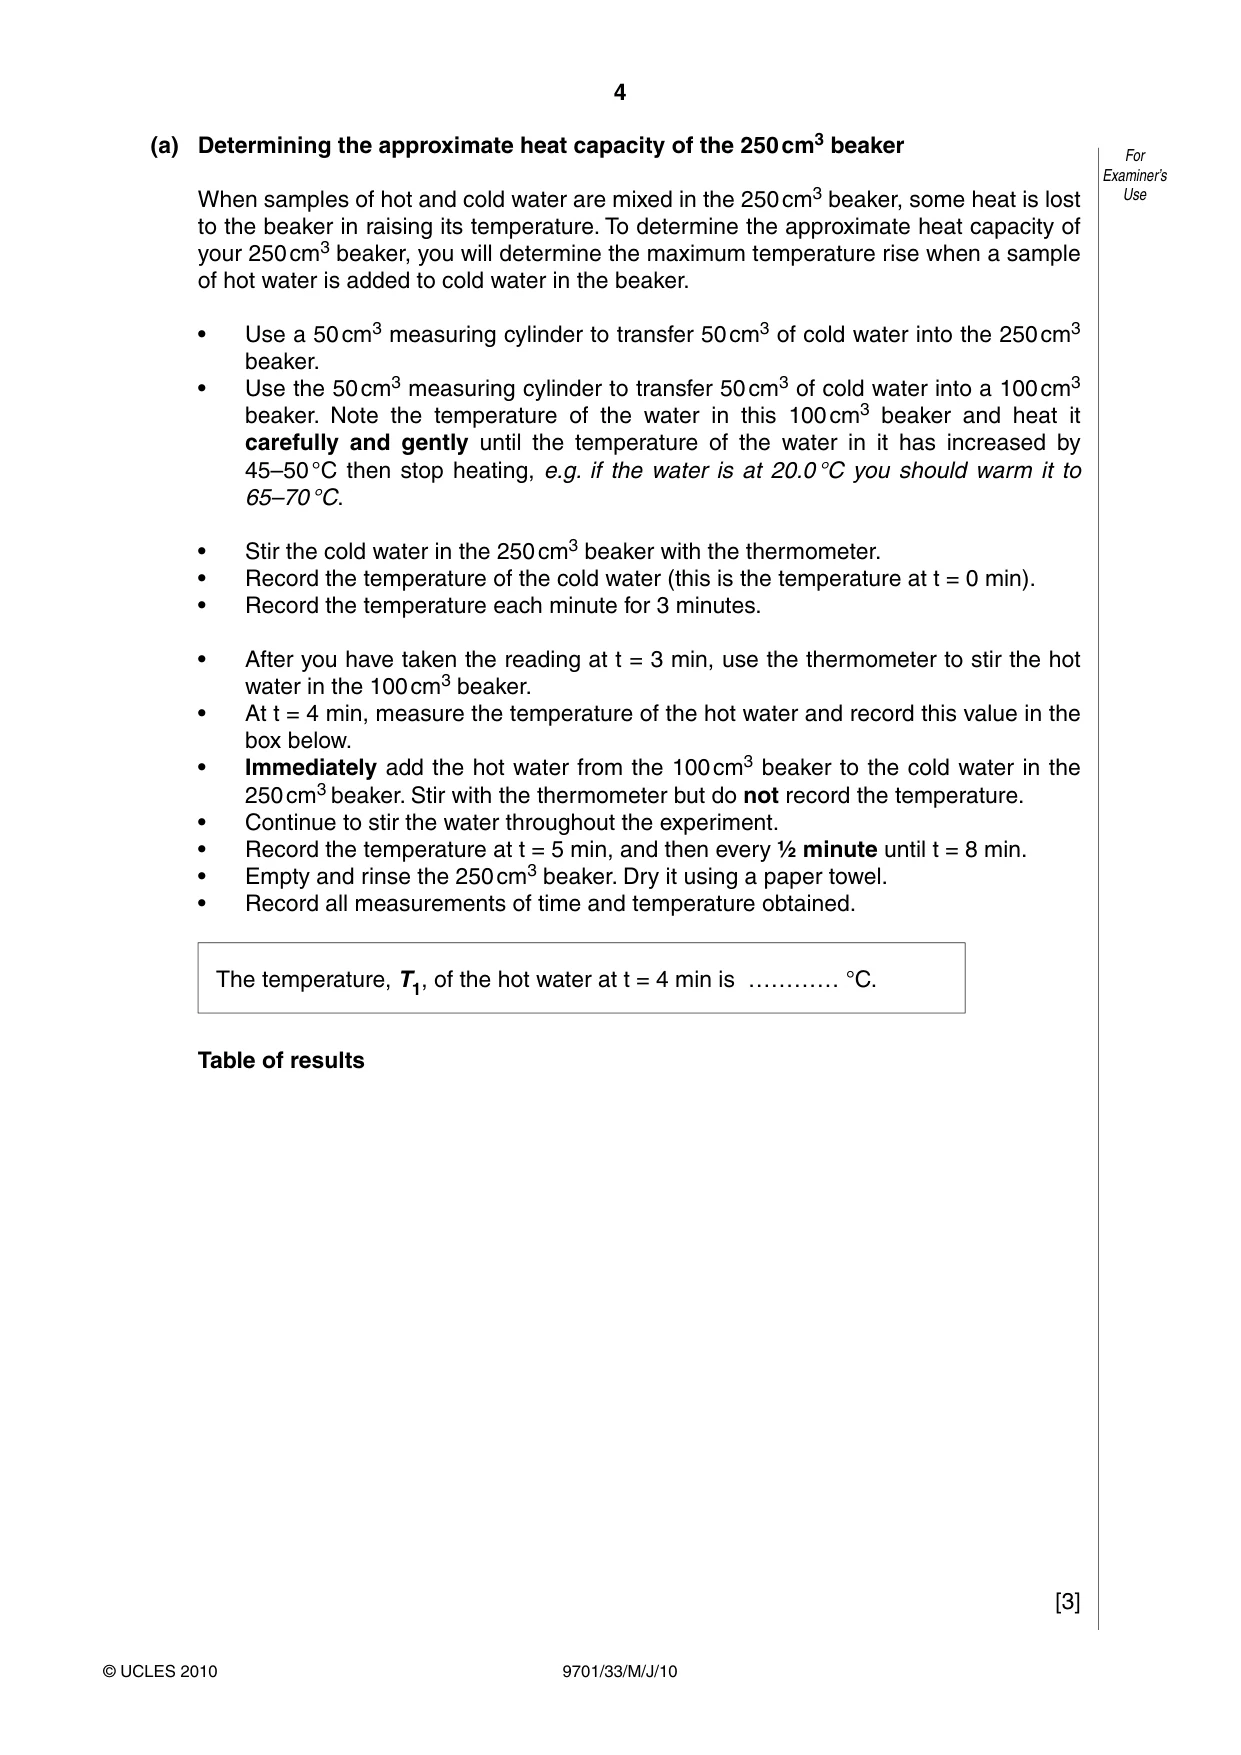
4 9701/33/M/J/10 © UCLES 2010 For Examiner’s Use (a) Determining the approximate heat capacity of the 250 cm3 beaker When samples of hot and cold water are mixed in the 250 cm3 beaker, some heat is lost to the beaker in raising its temperature. To determine the approximate heat capacity of your 250 cm3 beaker, you will determine the maximum temperature rise when a sample of hot water is added to cold water in the beaker. • Use a 50 cm3 measuring cylinder to transfer 50 cm3 of cold water into the 250 cm3 beaker. • Use the 50 cm3 measuring cylinder to transfer 50 cm3 of cold water into a 100 cm3 beaker. Note the temperature of the water in this 100 cm3 beaker and heat it carefully and gently until the temperature of the water in it has increased by 45–50 °C then stop heating, e.g. if the water is at 20.0 °C you should warm it to 65–70 °C. • Stir the cold water in the 250 cm3 beaker with the thermometer. • Record the temperature of the cold water (this is the temperature at t = 0 min). • Record the temperature each minute for 3 minutes. • After you have taken the reading at t = 3 min, use the thermometer to stir the hot water in the 100 cm3 beaker. • At t = 4 min, measure the temperature of the hot water and record this value in the box below. • Immediately add the hot water from the 100 cm3 beaker to the cold water in the 250 cm3 beaker. Stir with the thermometer but do not record the temperature. • Continue to stir the water throughout the experiment. • Record the temperature at t = 5 min, and then every ½ minute until t = 8 min. • Empty and rinse the 250 cm3 beaker. Dry it using a paper towel. • Record all measurements of time and temperature obtained. The temperature, T1, of the hot water at t = 4 min is ………… °C. Table of results [3]
Question paper, page 5
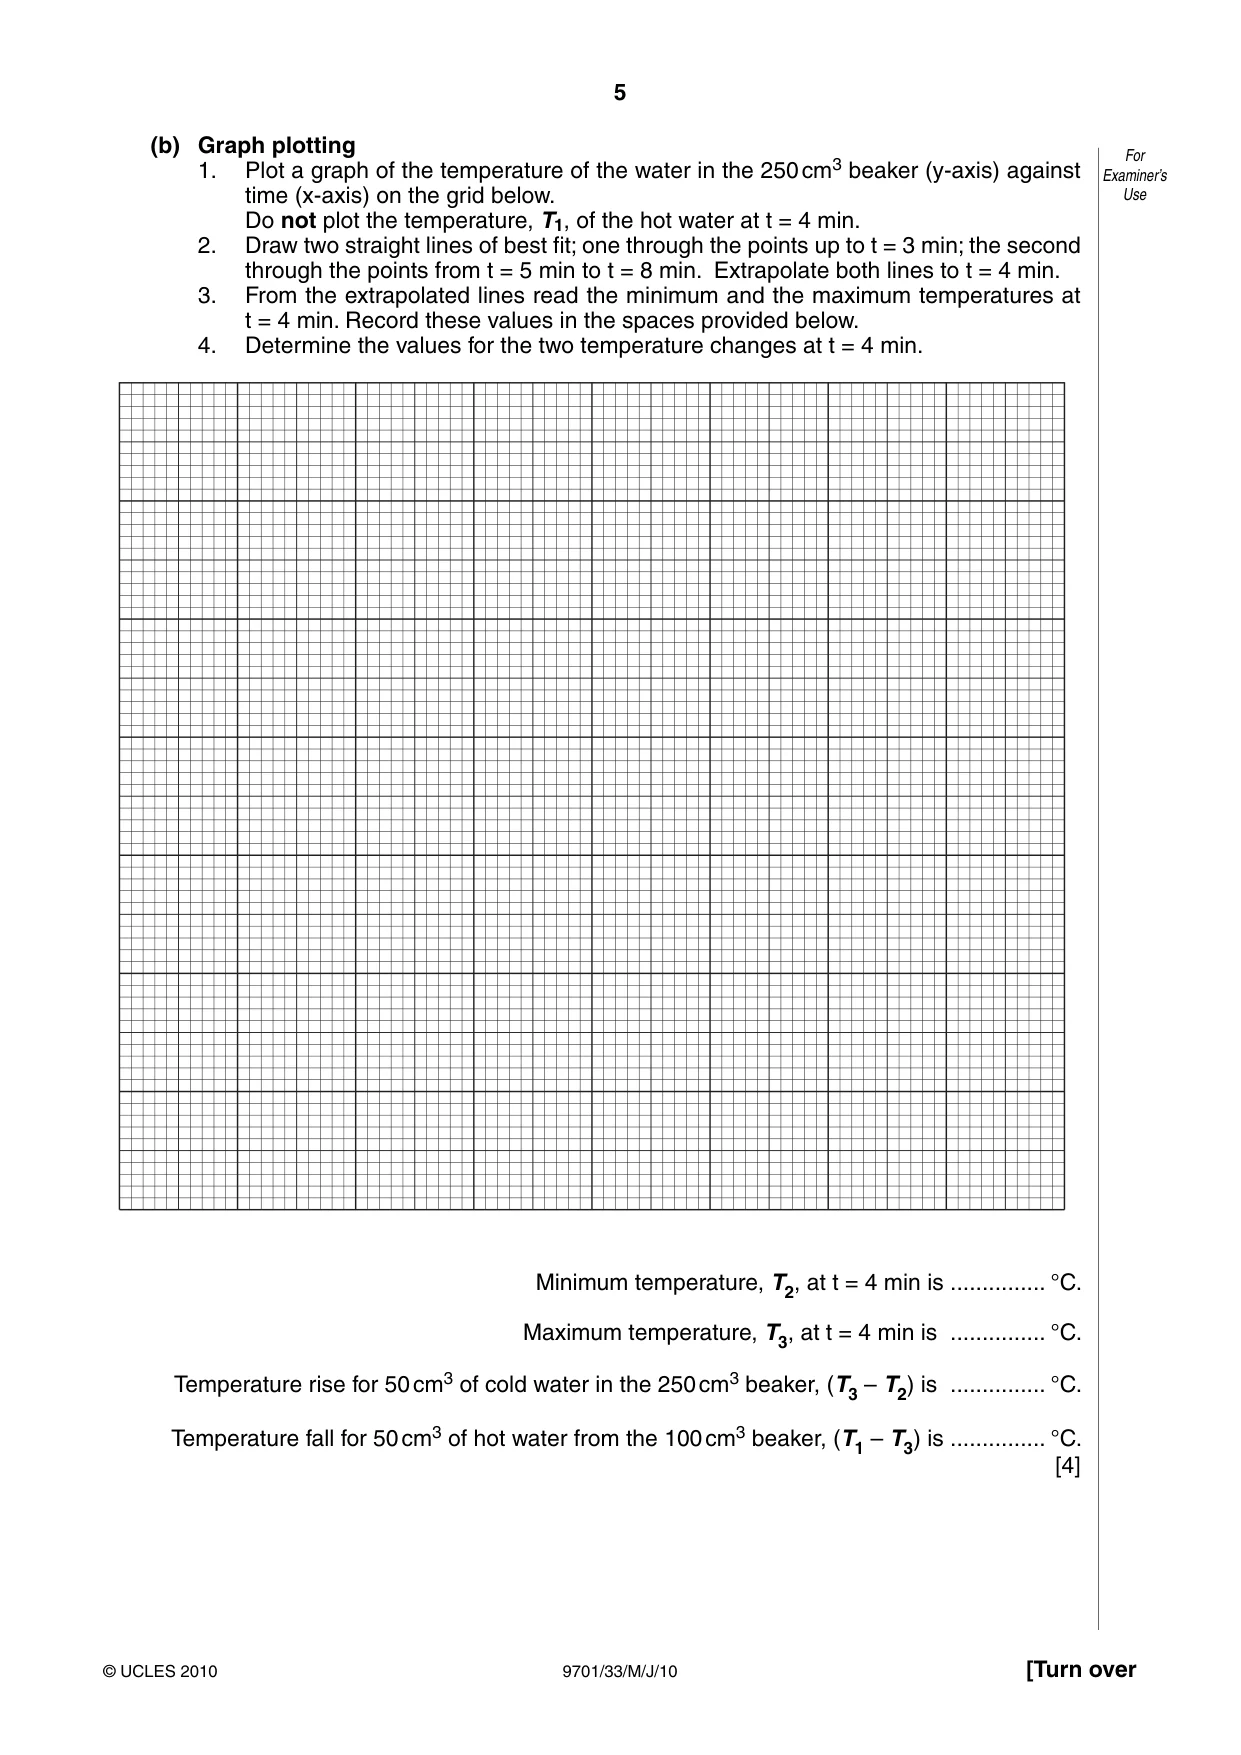
5 9701/33/M/J/10 © UCLES 2010 [Turn over For Examiner’s Use (b) Graph plotting 1. Plot a graph of the temperature of the water in the 250 cm3 beaker (y-axis) against time (x-axis) on the grid below. Do not plot the temperature, T1, of the hot water at t = 4 min. 2. Draw two straight lines of best fit; one through the points up to t = 3 min; the second through the points from t = 5 min to t = 8 min. Extrapolate both lines to t = 4 min. 3. From the extrapolated lines read the minimum and the maximum temperatures at t = 4 min. Record these values in the spaces provided below. 4. Determine the values for the two temperature changes at t = 4 min. Minimum temperature, T2, at t = 4 min is … °C. Maximum temperature, T3, at t = 4 min is … °C. Temperature rise for 50 cm3 of cold water in the 250 cm3 beaker, (T3 – T2) is … °C. Temperature fall for 50 cm3 of hot water from the 100 cm3 beaker, (T1 – T3) is … °C. [4]
Question paper, page 6
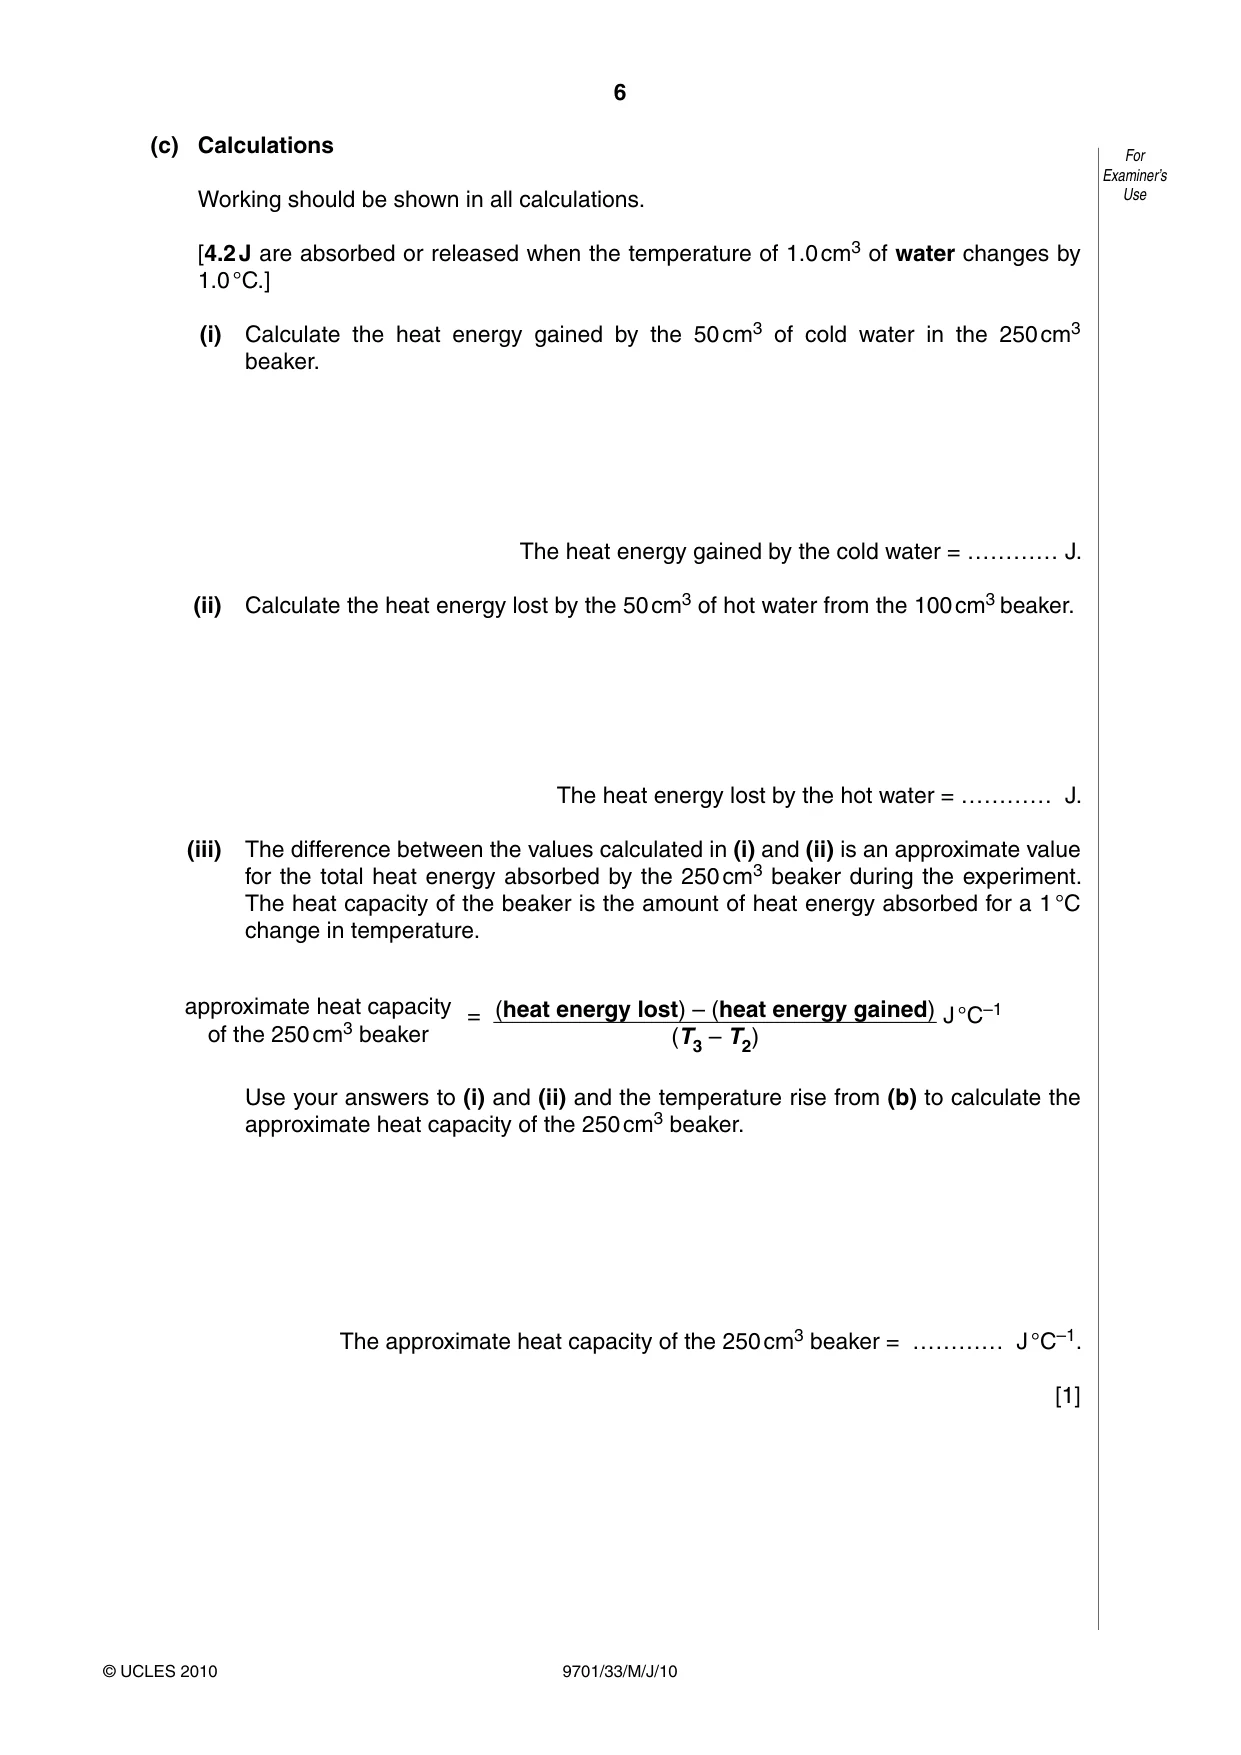
6 9701/33/M/J/10 © UCLES 2010 For Examiner’s Use (c) Calculations Working should be shown in all calculations. [4.2 J are absorbed or released when the temperature of 1.0 cm3 of water changes by 1.0 °C.] (i) Calculate the heat energy gained by the 50 cm3 of cold water in the 250 cm3 beaker. The heat energy gained by the cold water = ………… J. (ii) Calculate the heat energy lost by the 50 cm3 of hot water from the 100 cm3 beaker. The heat energy lost by the hot water = ………… J. (iii) The difference between the values calculated in (i) and (ii) is an approximate value for the total heat energy absorbed by the 250 cm3 beaker during the experiment. The heat capacity of the beaker is the amount of heat energy absorbed for a 1 °C change in temperature. approximate heat capacity of the 250 cm3 beaker = (heat energy lost) – (heat energy gained) (T3 – T2) J °C–1 Use your answers to (i) and (ii) and the temperature rise from (b) to calculate the approximate heat capacity of the 250 cm3 beaker. The approximate heat capacity of the 250 cm3 beaker = ………… J °C–1. [1]
Question paper, page 7
7 9701/33/M/J/10 © UCLES 2010 [Turn over BLANK PAGE
Question paper, page 8
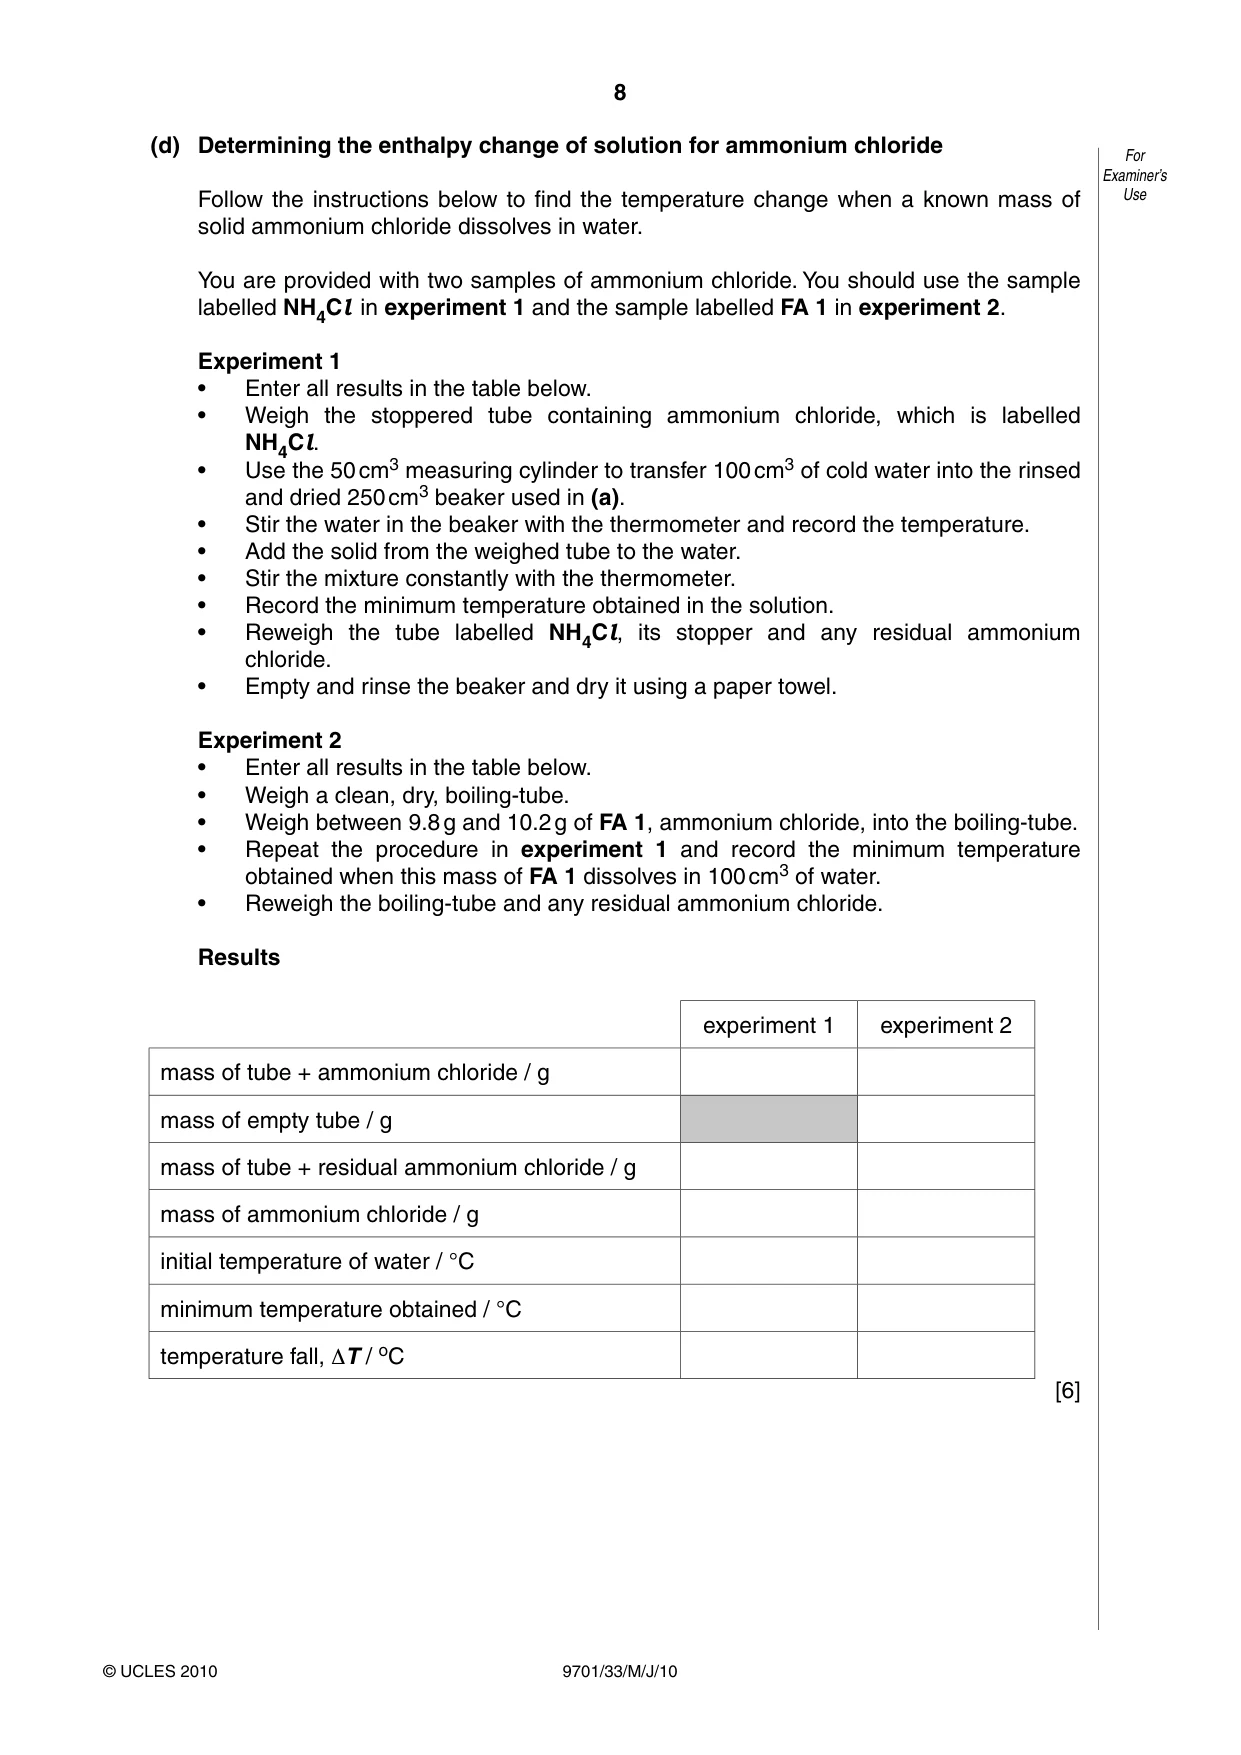
8 9701/33/M/J/10 © UCLES 2010 For Examiner’s Use (d) Determining the enthalpy change of solution for ammonium chloride Follow the instructions below to find the temperature change when a known mass of solid ammonium chloride dissolves in water. You are provided with two samples of ammonium chloride. You should use the sample labelled NH4Cl in experiment 1 and the sample labelled FA 1 in experiment 2. Experiment 1 • Enter all results in the table below. • Weigh the stoppered tube containing ammonium chloride, which is labelled NH4Cl. • Use the 50 cm3 measuring cylinder to transfer 100 cm3 of cold water into the rinsed and dried 250 cm3 beaker used in (a). • Stir the water in the beaker with the thermometer and record the temperature. • Add the solid from the weighed tube to the water. • Stir the mixture constantly with the thermometer. • Record the minimum temperature obtained in the solution. • Reweigh the tube labelled NH4Cl, its stopper and any residual ammonium chloride. • Empty and rinse the beaker and dry it using a paper towel. Experiment 2 • Enter all results in the table below. • Weigh a clean, dry, boiling-tube. • Weigh between 9.8 g and 10.2 g of FA 1, ammonium chloride, into the boiling-tube. • Repeat the procedure in experiment 1 and record the minimum temperature obtained when this mass of FA 1 dissolves in 100 cm3 of water. • Reweigh the boiling-tube and any residual ammonium chloride. Results experiment 1 experiment 2 mass of tube + ammonium chloride / g mass of empty tube / g mass of tube + residual ammonium chloride / g mass of ammonium chloride / g initial temperature of water / °C minimum temperature obtained / °C temperature fall, ΔT / oC [6]
Question paper, page 9
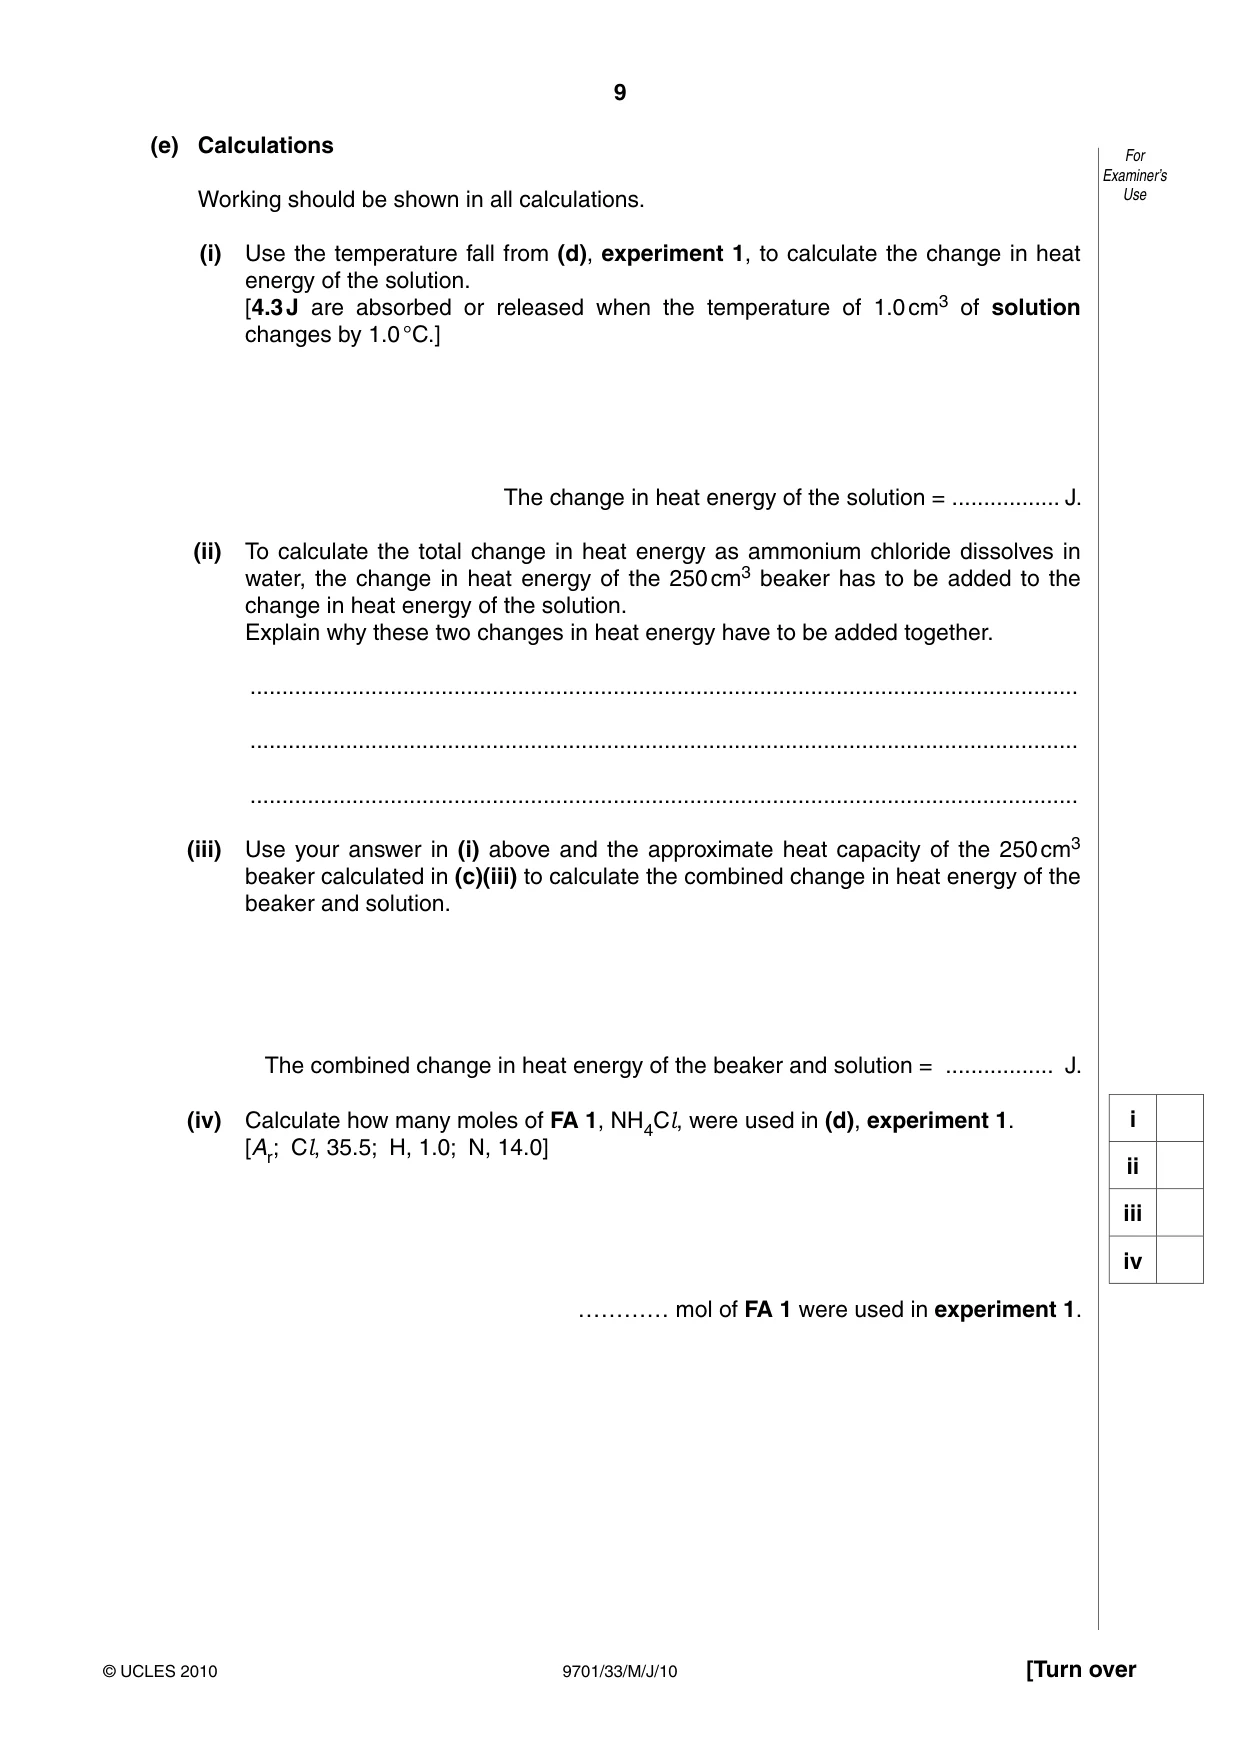
9 9701/33/M/J/10 © UCLES 2010 [Turn over For Examiner’s Use (e) Calculations Working should be shown in all calculations. (i) Use the temperature fall from (d), experiment 1, to calculate the change in heat energy of the solution. [4.3 J are absorbed or released when the temperature of 1.0 cm3 of solution changes by 1.0 °C.] The change in heat energy of the solution = … J. (ii) To calculate the total change in heat energy as ammonium chloride dissolves in water, the change in heat energy of the 250 cm3 beaker has to be added to the change in heat energy of the solution. Explain why these two changes in heat energy have to be added together. … … … (iii) Use your answer in (i) above and the approximate heat capacity of the 250 cm3 beaker calculated in (c)(iii) to calculate the combined change in heat energy of the beaker and solution. The combined change in heat energy of the beaker and solution = … J. (iv) Calculate how many moles of FA 1, NH4Cl, were used in (d), experiment 1. [Ar; Cl, 35.5; H, 1.0; N, 14.0] ………… mol of FA 1 were used in experiment 1. i ii iii iv
Question paper, page 10
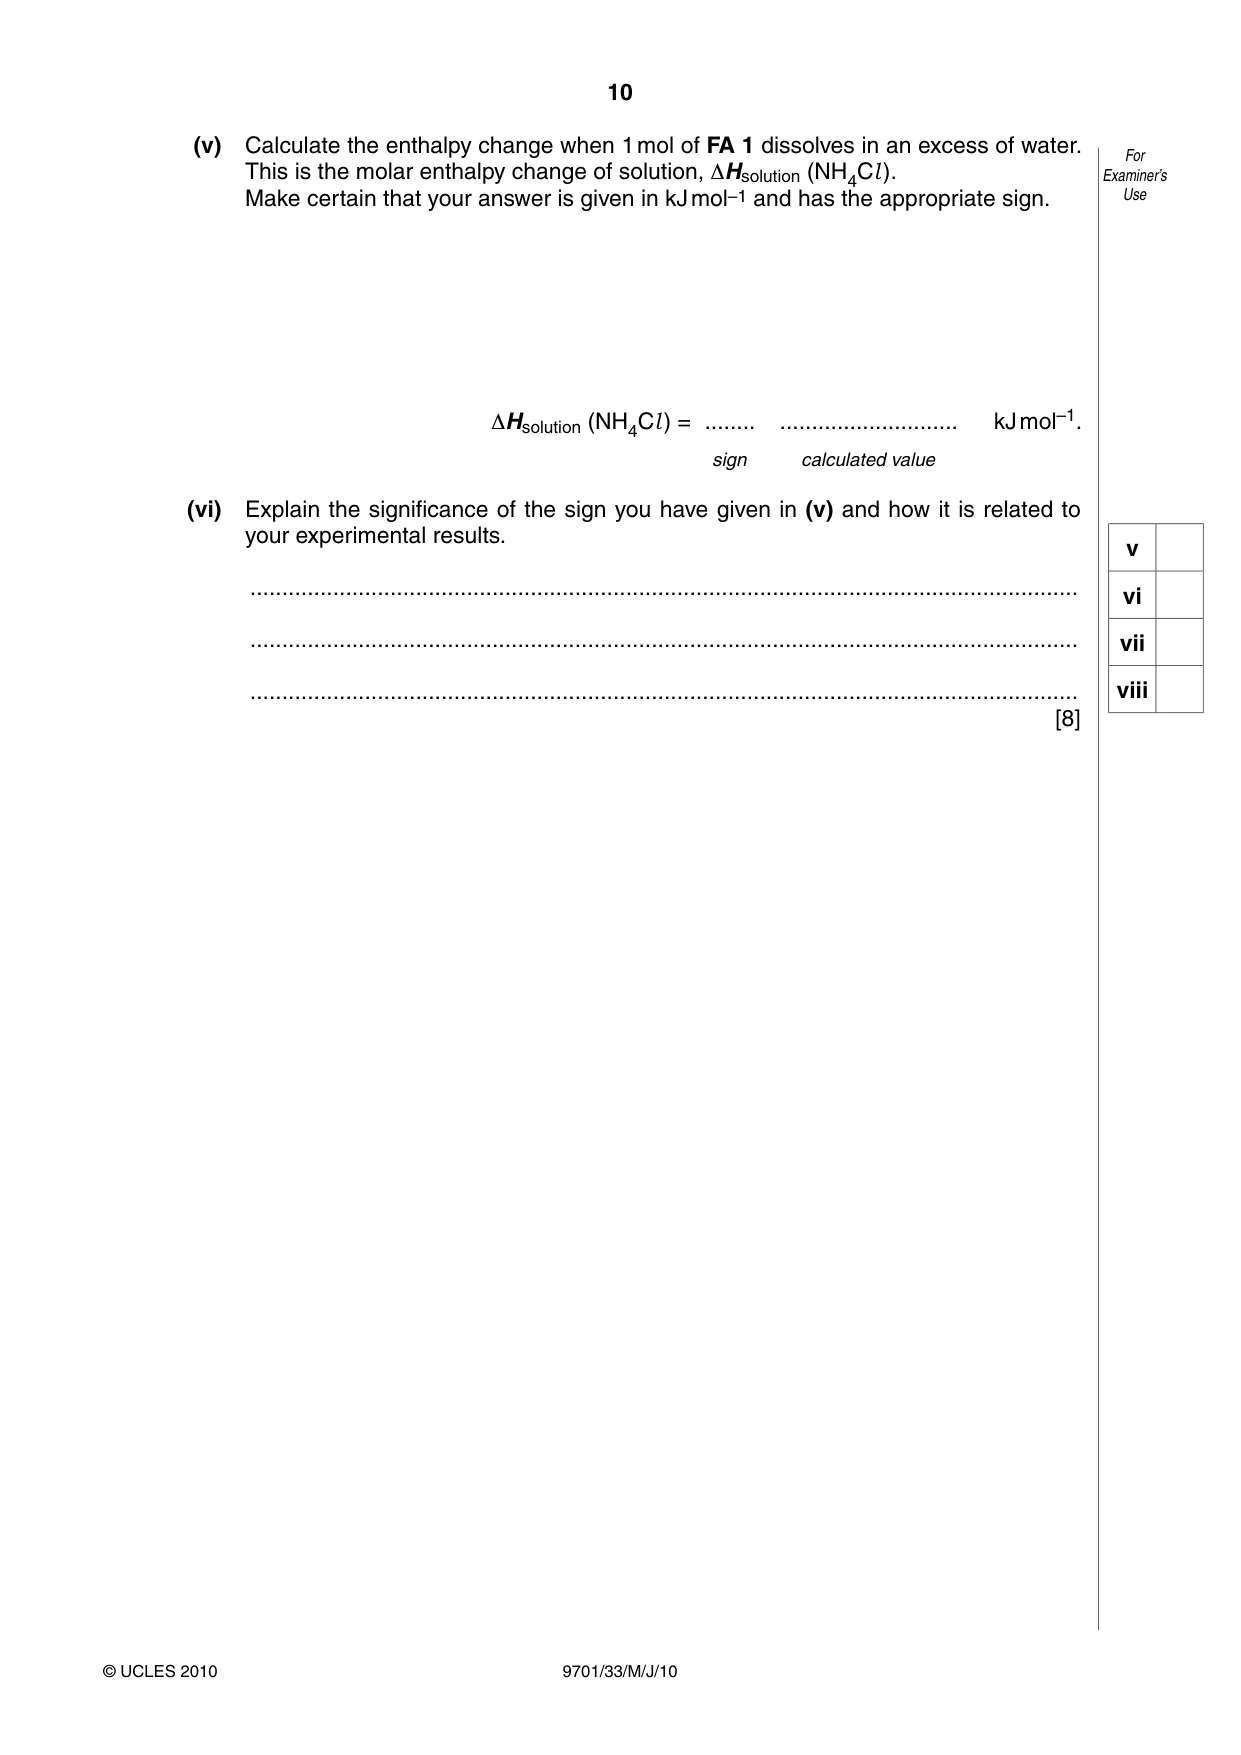
10 9701/33/M/J/10 © UCLES 2010 For Examiner’s Use (v) Calculate the enthalpy change when 1 mol of FA 1 dissolves in an excess of water. This is the molar enthalpy change of solution, ΔHsolution (NH4Cl ). Make certain that your answer is given in kJ mol–1 and has the appropriate sign. ΔHsolution (NH4Cl ) = … … kJ mol–1. sign calculated value (vi) Explain the significance of the sign you have given in (v) and how it is related to your experimental results. … … … [8] v vi vii viii
Question paper, page 11
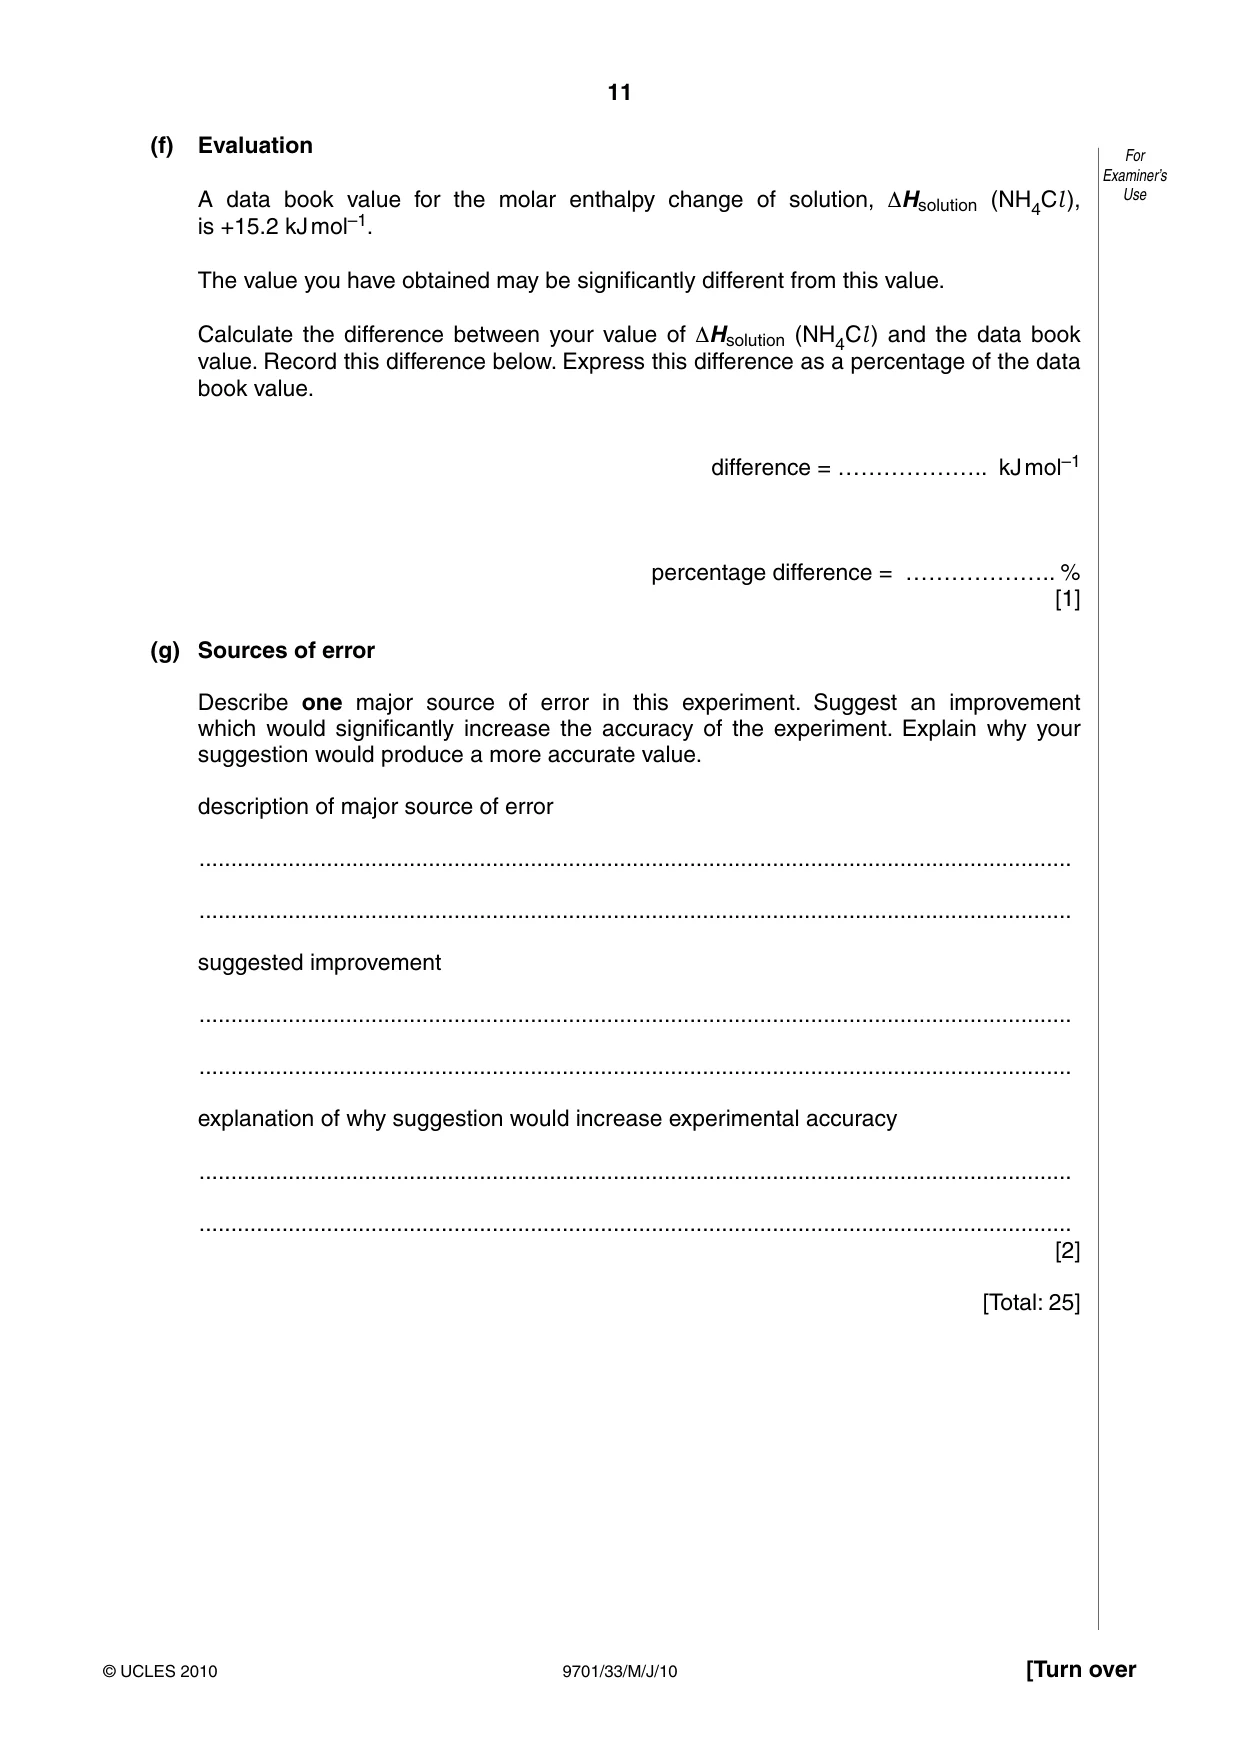
11 9701/33/M/J/10 © UCLES 2010 [Turn over For Examiner’s Use (f) Evaluation A data book value for the molar enthalpy change of solution, ΔHsolution (NH4Cl ), is +15.2 kJ mol–1. The value you have obtained may be significantly different from this value. Calculate the difference between your value of ΔHsolution (NH4Cl ) and the data book value. Record this difference below. Express this difference as a percentage of the data book value. difference = ……………….. kJ mol–1 percentage difference = ……………….. % [1] (g) Sources of error Describe one major source of error in this experiment. Suggest an improvement which would significantly increase the accuracy of the experiment. Explain why your suggestion would produce a more accurate value. description of major source of error … … suggested improvement … … explanation of why suggestion would increase experimental accuracy … … [2] [Total: 25]
Question paper, page 12
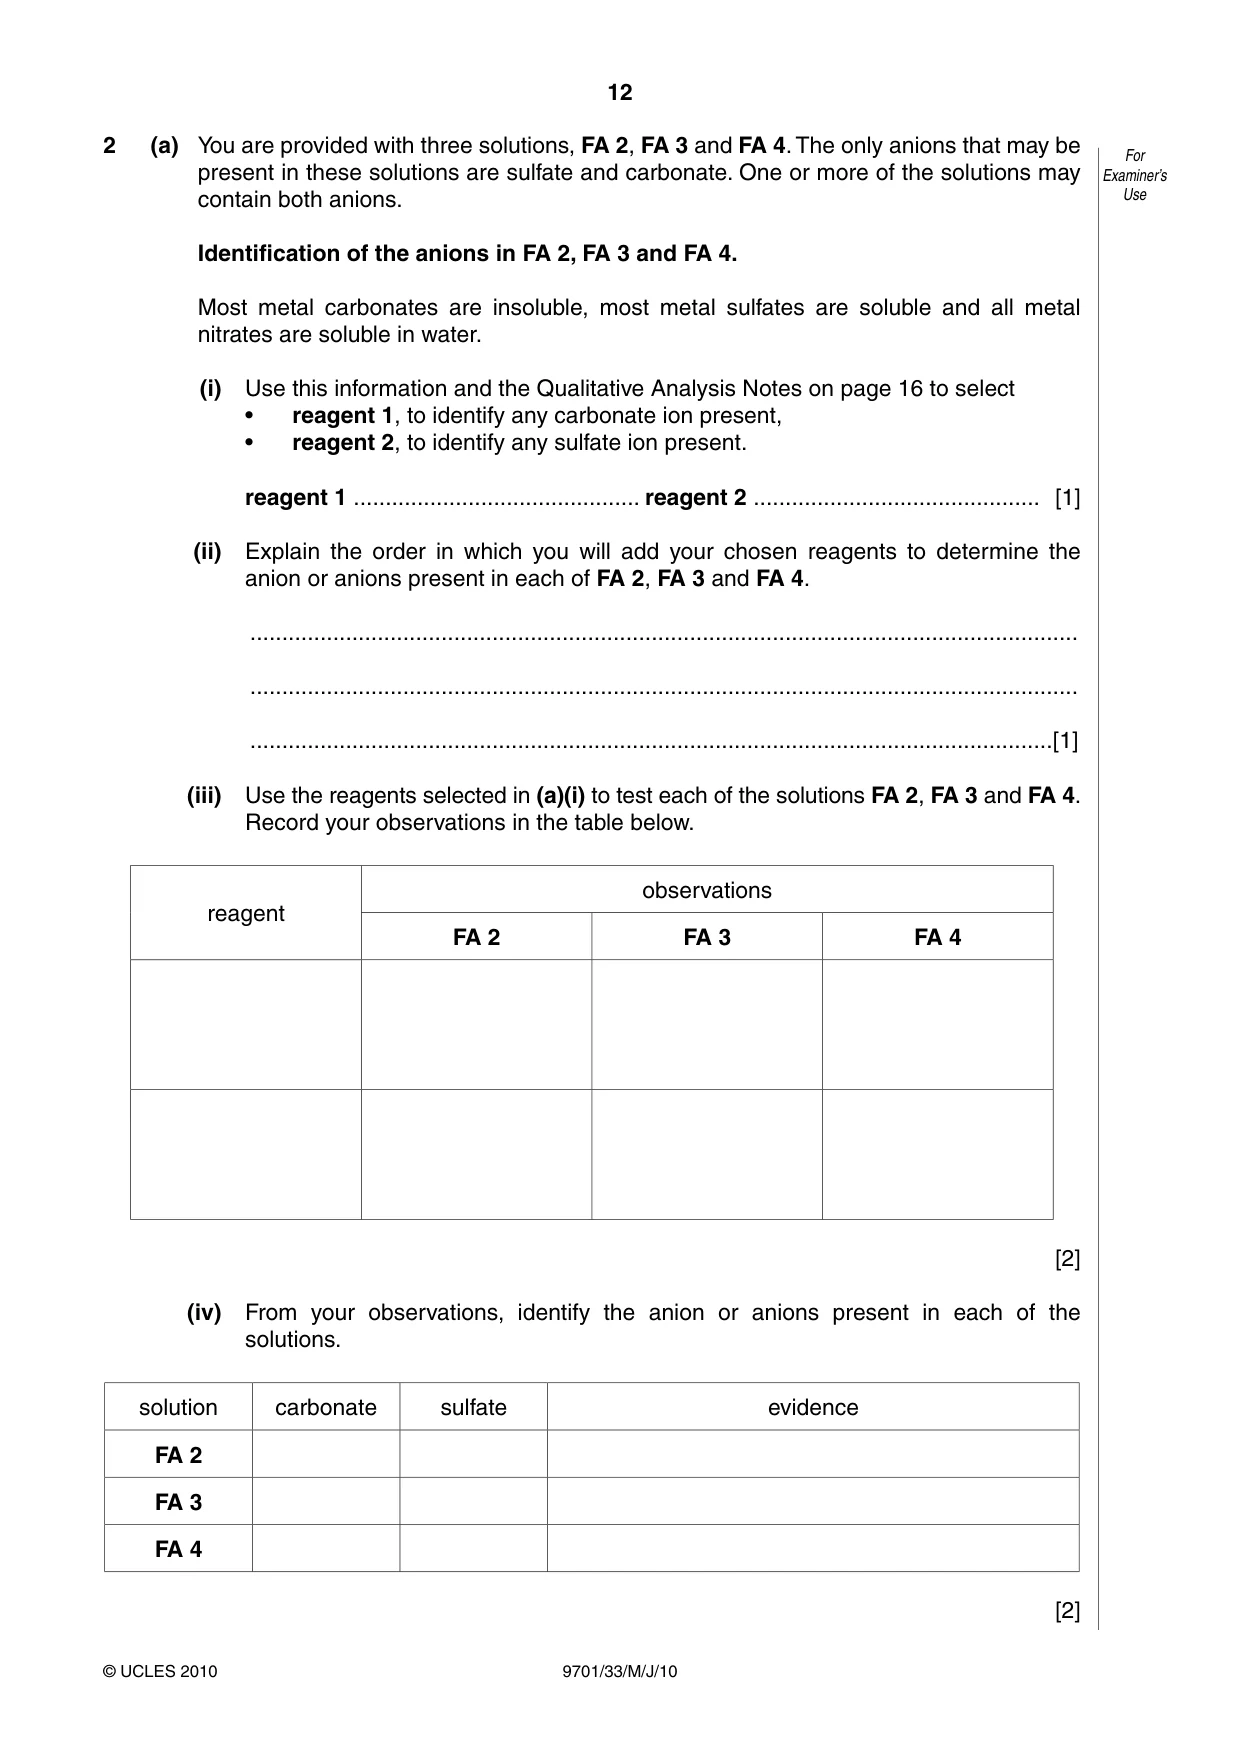
12 9701/33/M/J/10 © UCLES 2010 For Examiner’s Use 2 (a) You are provided with three solutions, FA 2, FA 3 and FA 4. The only anions that may be present in these solutions are sulfate and carbonate. One or more of the solutions may contain both anions. Identification of the anions in FA 2, FA 3 and FA 4. Most metal carbonates are insoluble, most metal sulfates are soluble and all metal nitrates are soluble in water. (i) Use this information and the Qualitative Analysis Notes on page 16 to select • reagent 1, to identify any carbonate ion present, • reagent 2, to identify any sulfate ion present. reagent 1 … reagent 2 … [1] (ii) Explain the order in which you will add your chosen reagents to determine the anion or anions present in each of FA 2, FA 3 and FA 4. … … …[1] (iii) Use the reagents selected in (a)(i) to test each of the solutions FA 2, FA 3 and FA 4. Record your observations in the table below. reagent observations FA 2 FA 3 FA 4 [2] (iv) From your observations, identify the anion or anions present in each of the solutions. solution carbonate sulfate evidence FA 2 FA 3 FA 4 [2]
Question paper, page 13
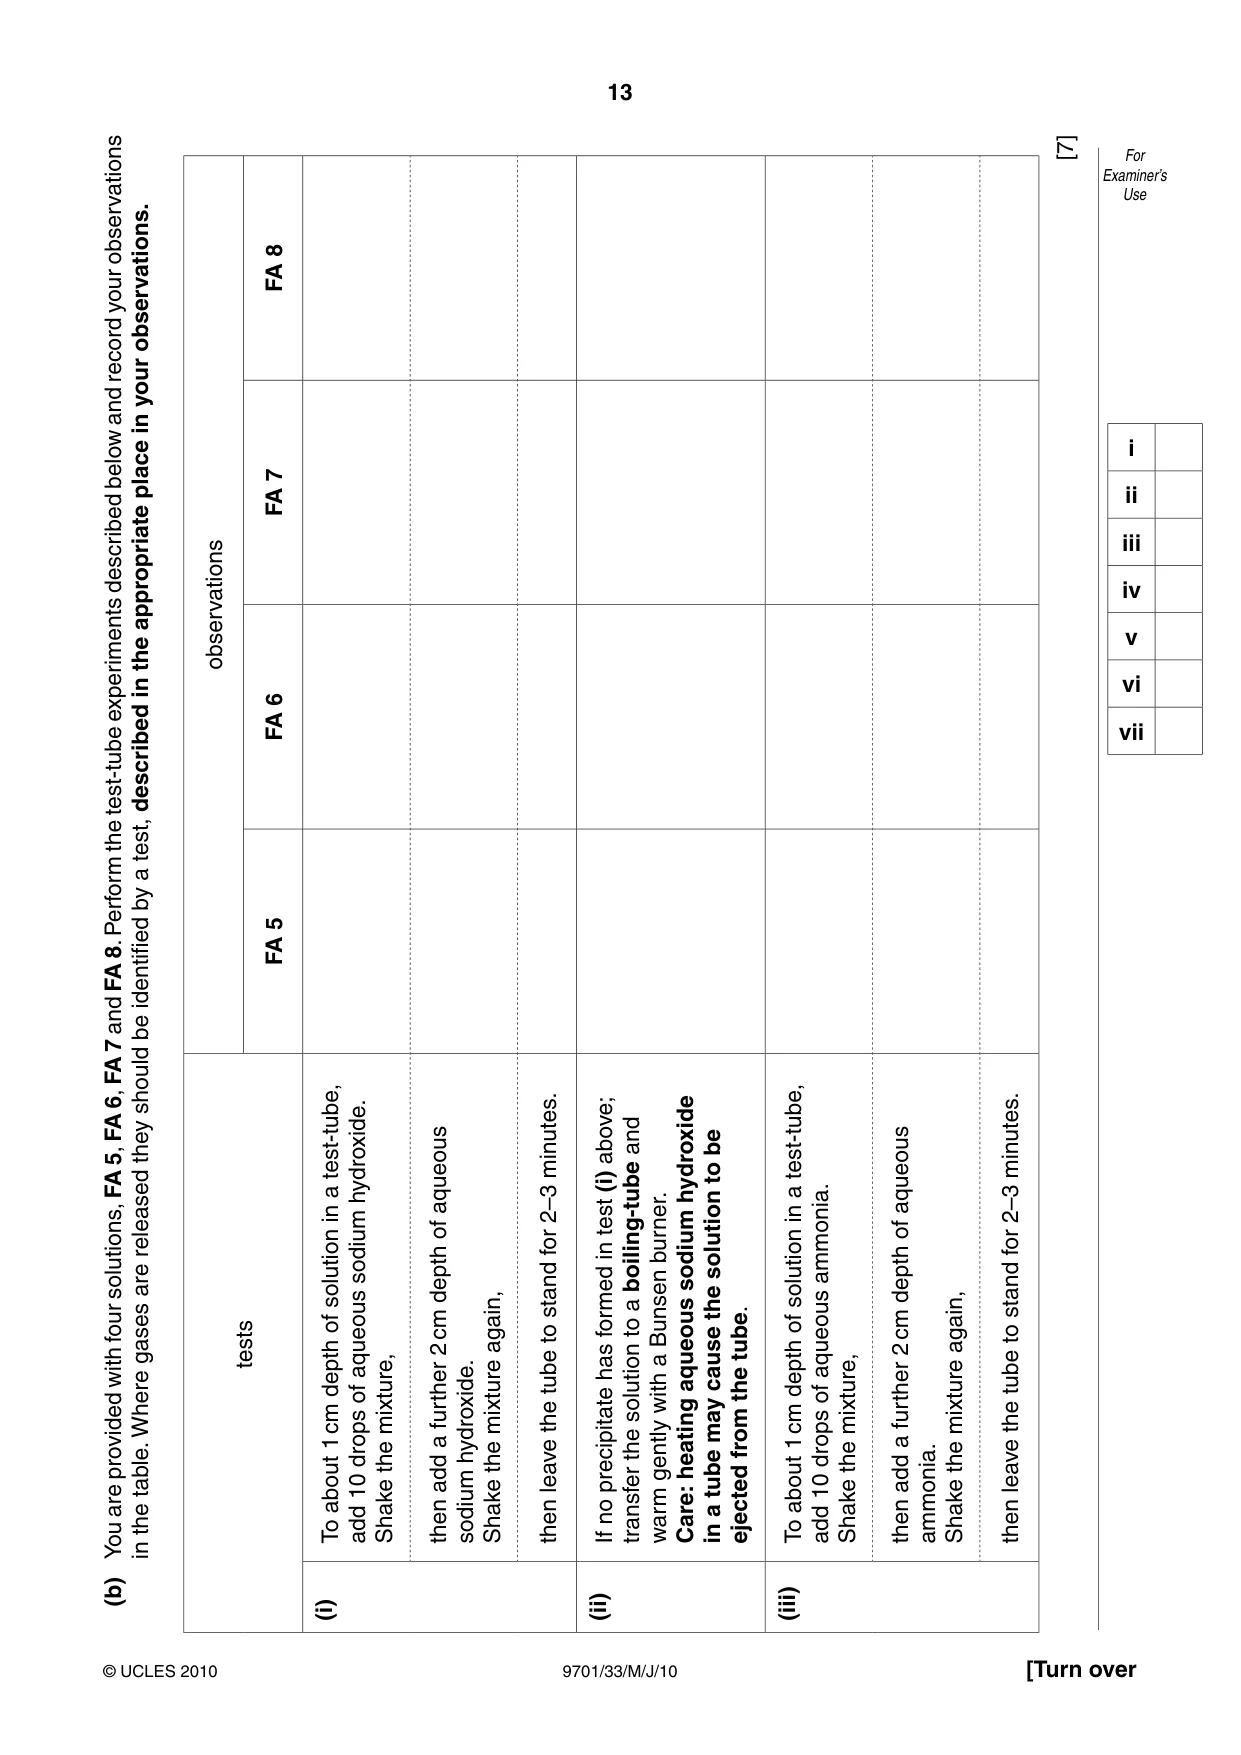
13 9701/33/M/J/10 © UCLES 2010 [Turn over For Examiner’s Use (b) You are provided with four solutions, FA 5, FA 6, FA 7 and FA 8. Perform the test-tube experiments described below and record your observations in the table. Where gases are released they should be identified by a test, described in the appropriate place in your observations. tests observations FA 5 FA 6 FA 7 FA 8 (i) To about 1 cm depth of solution in a test-tube, add 10 drops of aqueous sodium hydroxide. Shake the mixture, then add a further 2 cm depth of aqueous sodium hydroxide. Shake the mixture again, then leave the tube to stand for 2–3 minutes. (ii) If no precipitate has formed in test (i) above; transfer the solution to a boiling-tube and warm gently with a Bunsen burner. Care: heating aqueous sodium hydroxide in a tube may cause the solution to be ejected from the tube. (iii) To about 1 cm depth of solution in a test-tube, add 10 drops of aqueous ammonia. Shake the mixture, then add a further 2 cm depth of aqueous ammonia. Shake the mixture again, then leave the tube to stand for 2–3 minutes. [7] i ii iii iv v vi vii
Question paper, page 14
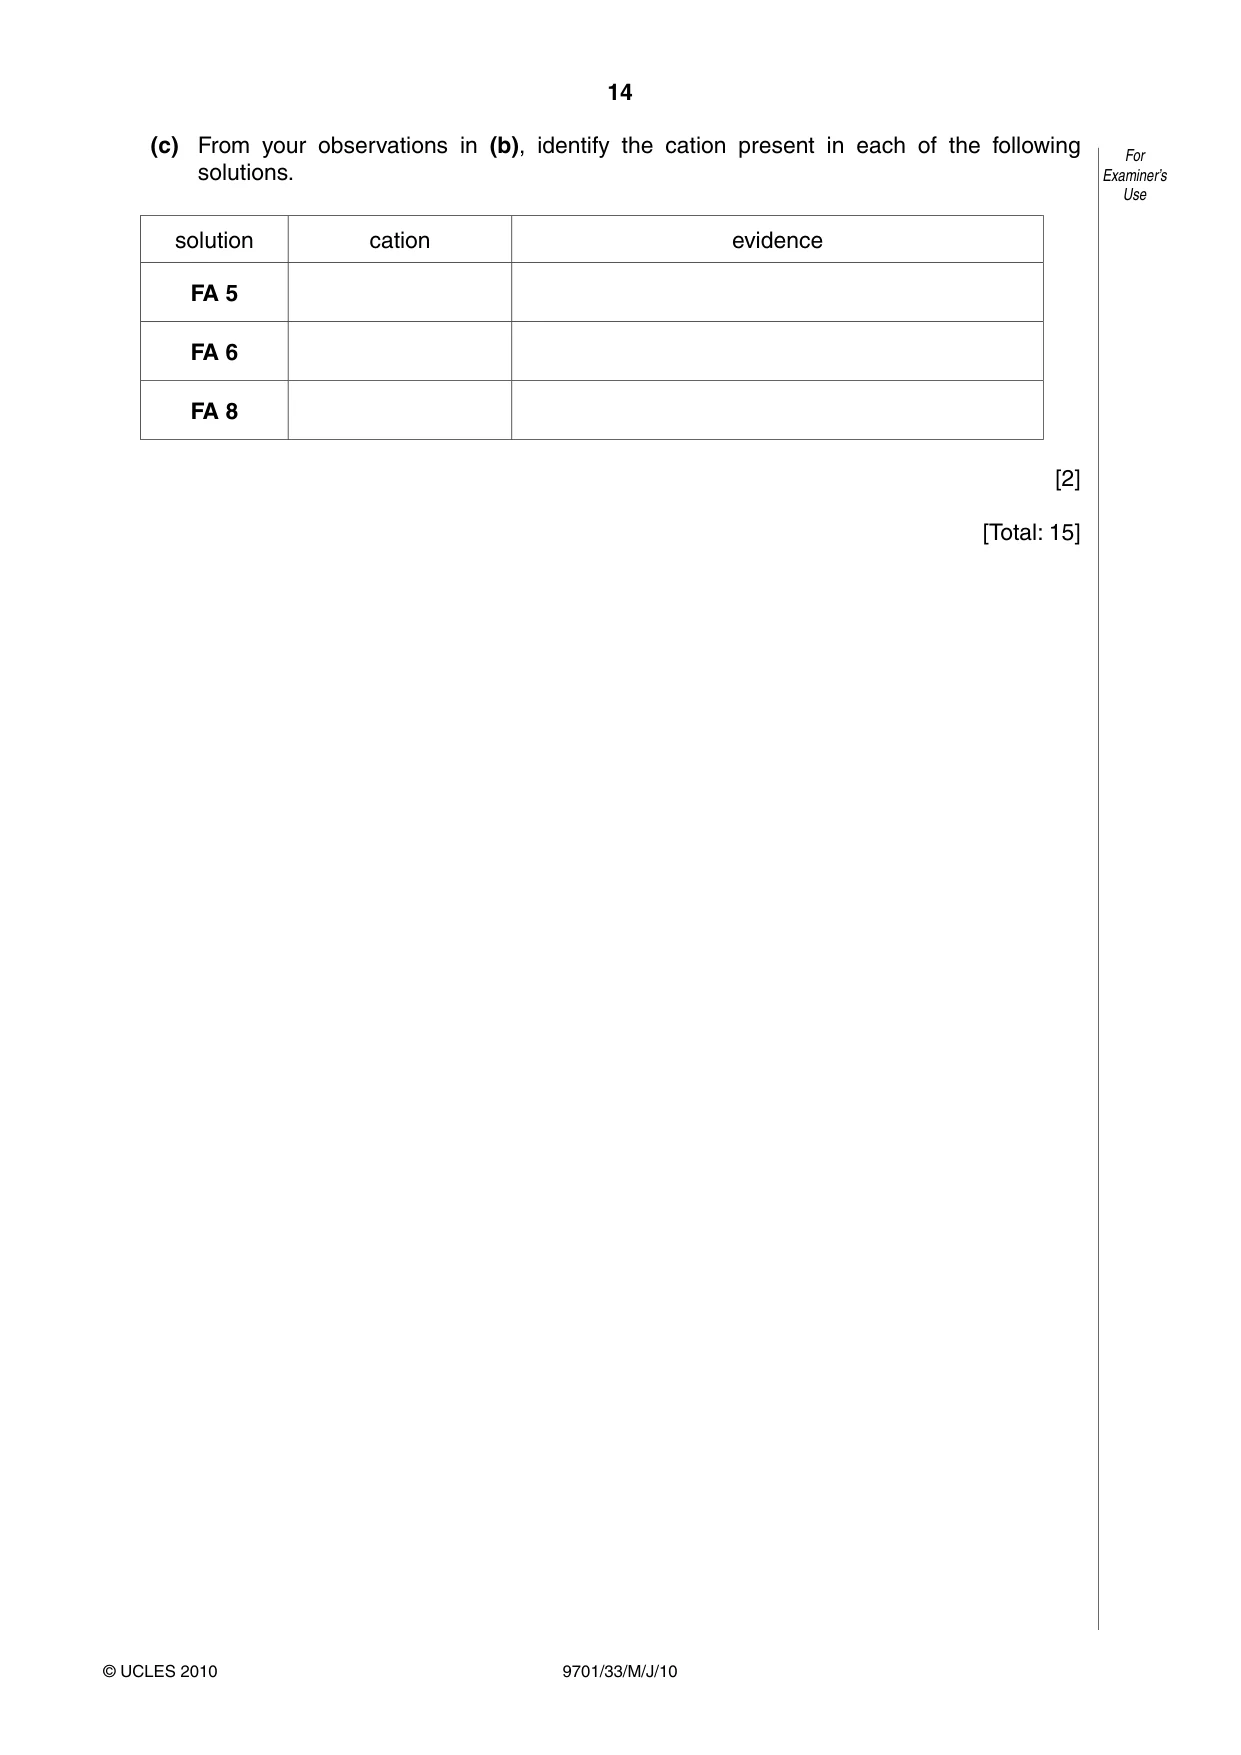
14 9701/33/M/J/10 © UCLES 2010 For Examiner’s Use (c) From your observations in (b), identify the cation present in each of the following solutions. solution cation evidence FA 5 FA 6 FA 8 [2] [Total: 15]
Question paper, page 15
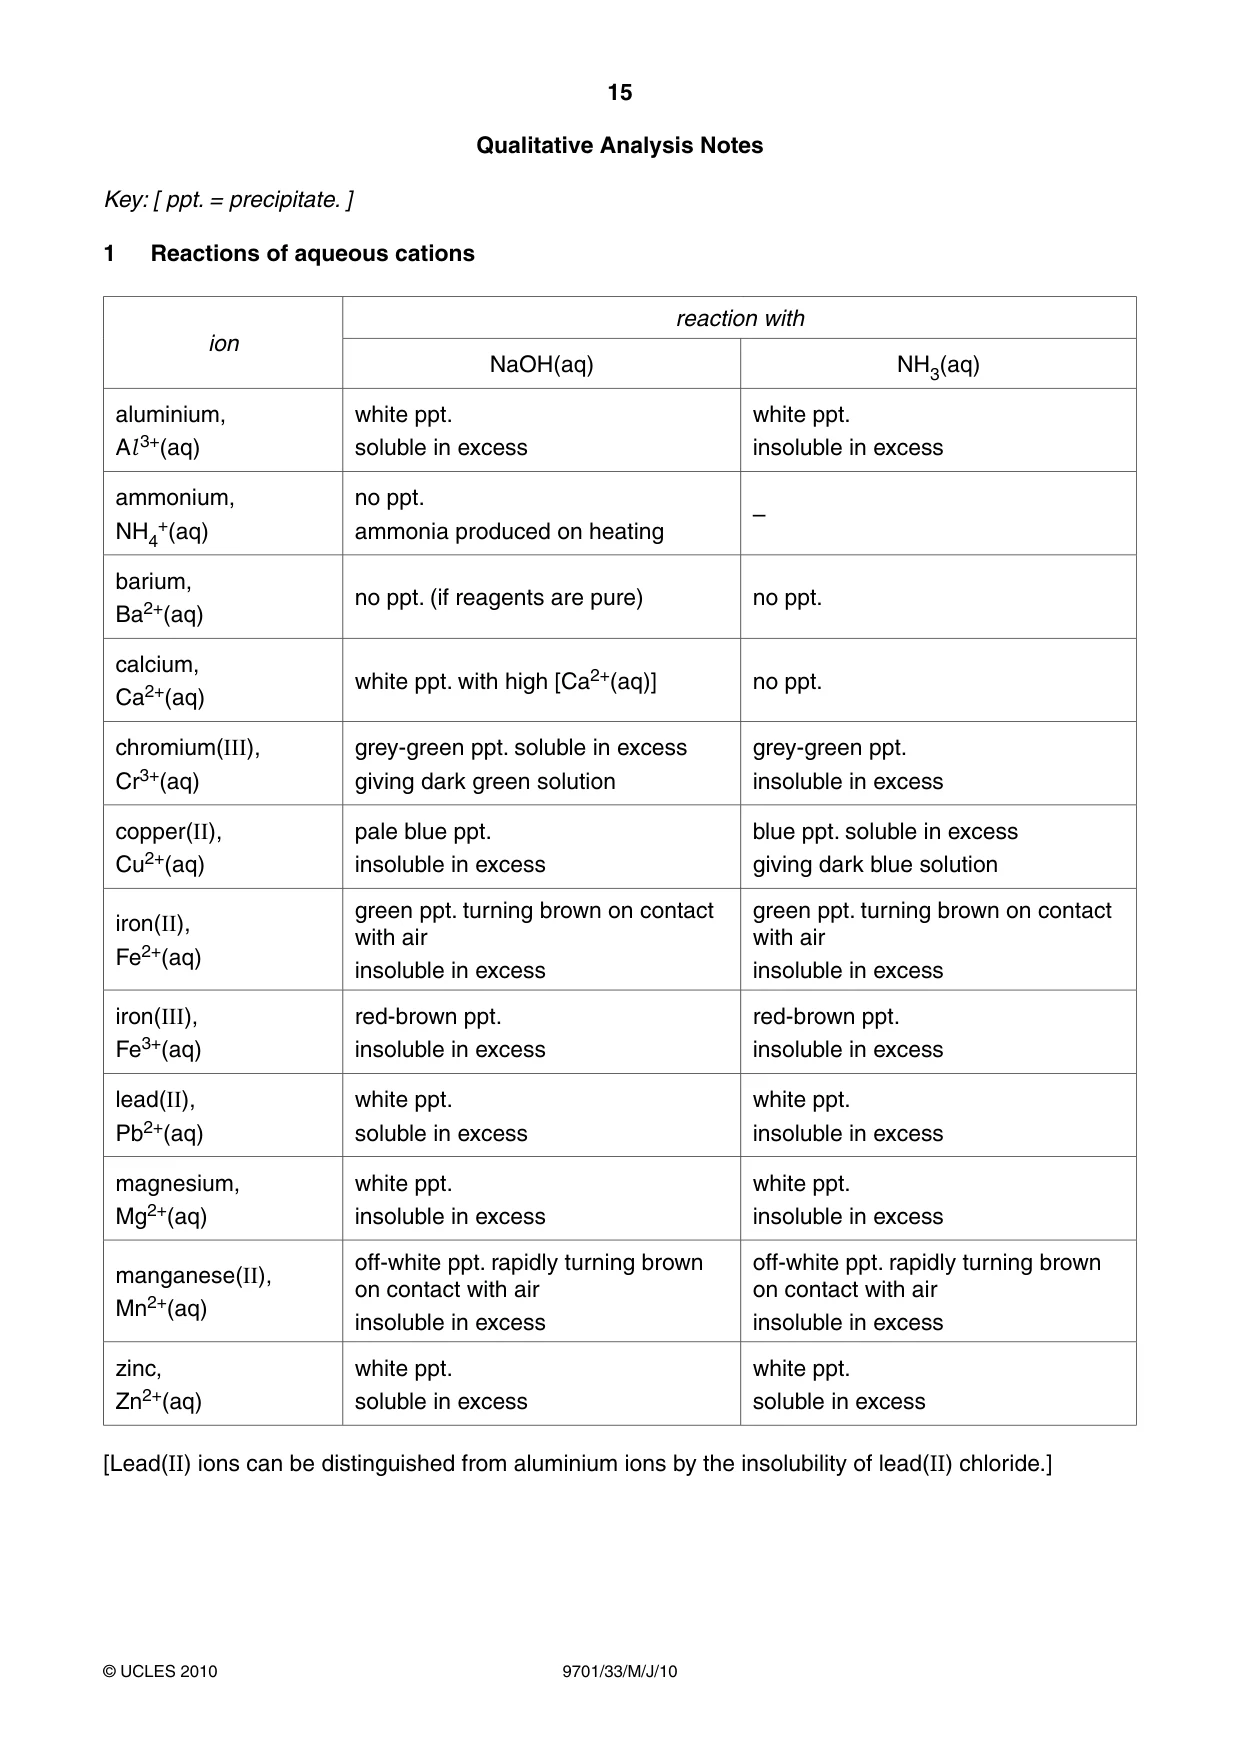
15 9701/33/M/J/10 © UCLES 2010 Qualitative Analysis Notes Key: [ ppt. = precipitate. ] 1 Reactions of aqueous cations ion reaction with NaOH(aq) NH3(aq) aluminium, Al 3+(aq) white ppt. soluble in excess white ppt. insoluble in excess ammonium, NH4 +(aq) no ppt. ammonia produced on heating – barium, Ba2+(aq) no ppt. (if reagents are pure) no ppt. calcium, Ca2+(aq) white ppt. with high [Ca2+(aq)] no ppt. chromium(III), Cr3+(aq) grey-green ppt. soluble in excess giving dark green solution grey-green ppt. insoluble in excess copper(II), Cu2+(aq) pale blue ppt. insoluble in excess blue ppt. soluble in excess giving dark blue solution iron(II), Fe2+(aq) green ppt. turning brown on contact with air insoluble in excess green ppt. turning brown on contact with air insoluble in excess iron(III), Fe3+(aq) red-brown ppt. insoluble in excess red-brown ppt. insoluble in excess lead(II), Pb2+(aq) white ppt. soluble in excess white ppt. insoluble in excess magnesium, Mg2+(aq) white ppt. insoluble in excess white ppt. insoluble in excess manganese(II), Mn2+(aq) off-white ppt. rapidly turning brown on contact with air insoluble in excess off-white ppt. rapidly turning brown on contact with air insoluble in excess zinc, Zn2+(aq) white ppt. soluble in excess white ppt. soluble in excess [Lead(II) ions can be distinguished from aluminium ions by the insolubility of lead(II) chloride.]
Question paper, page 16
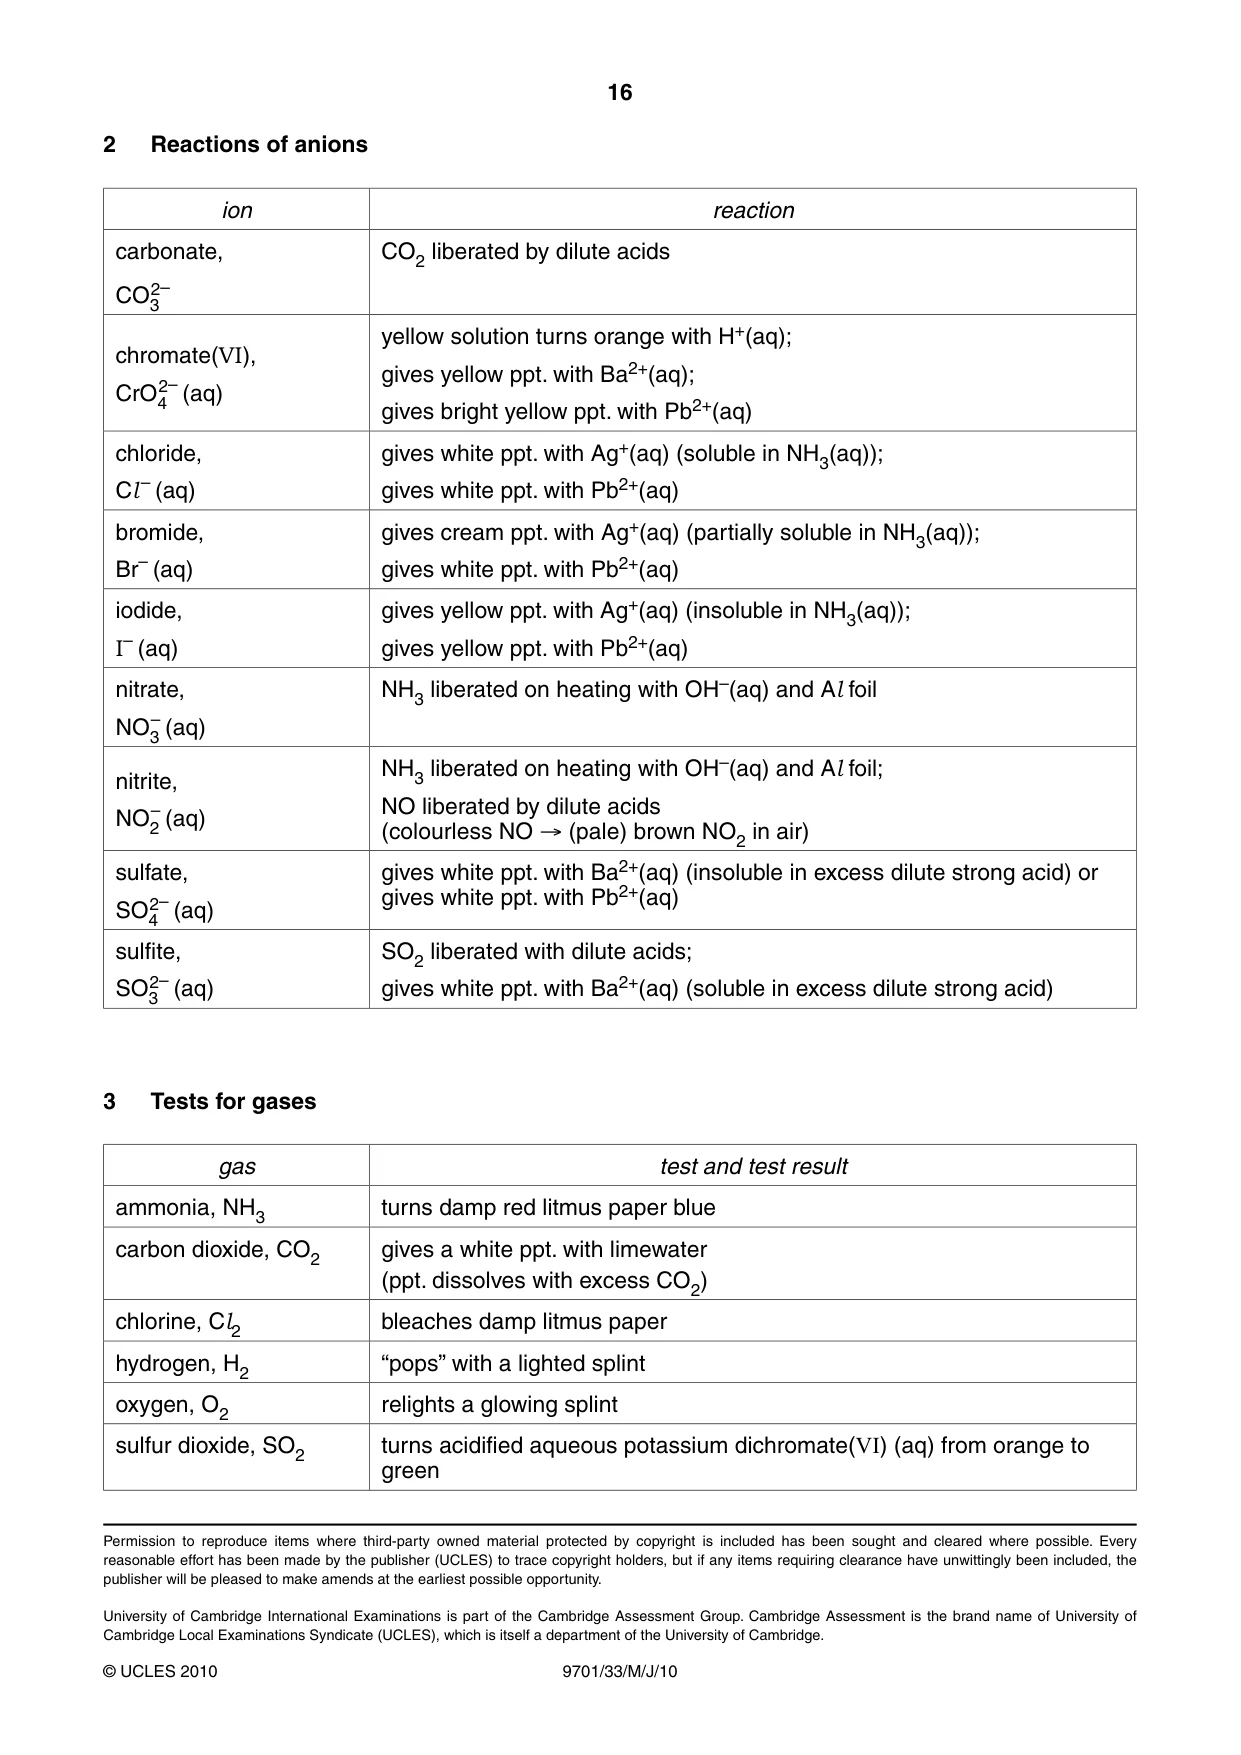
16 9701/33/M/J/10 © UCLES 2010 Permission to reproduce items where third-party owned material protected by copyright is included has been sought and cleared where possible. Every reasonable effort has been made by the publisher (UCLES) to trace copyright holders, but if any items requiring clearance have unwittingly been included, the publisher will be pleased to make amends at the earliest possible opportunity. University of Cambridge International Examinations is part of the Cambridge Assessment Group. Cambridge Assessment is the brand name of University of Cambridge Local Examinations Syndicate (UCLES), which is itself a department of the University of Cambridge. 2 Reactions of anions ion reaction carbonate, CO3 2– CO2 liberated by dilute acids chromate(VI), CrO4 2– (aq) yellow solution turns orange with H+(aq); gives yellow ppt. with Ba2+(aq); gives bright yellow ppt. with Pb2+(aq) chloride, Cl– (aq) gives white ppt. with Ag+(aq) (soluble in NH3(aq)); gives white ppt. with Pb2+(aq) bromide, Br– (aq) gives cream ppt. with Ag+(aq) (partially soluble in NH3(aq)); gives white ppt. with Pb2+(aq) iodide, I– (aq) gives yellow ppt. with Ag+(aq) (insoluble in NH3(aq)); gives yellow ppt. with Pb2+(aq) nitrate, NO3 – (aq) NH3 liberated on heating with OH–(aq) and Al foil nitrite, NO2 – (aq) NH3 liberated on heating with OH–(aq) and Al foil; NO liberated by dilute acids (colourless NO → (pale) brown NO2 in air) sulfate, SO4 2– (aq) gives white ppt. with Ba2+(aq) (insoluble in excess dilute strong acid) or gives white ppt. with Pb2+(aq) sulfite, SO3 2– (aq) SO2 liberated with dilute acids; gives white ppt. with Ba2+(aq) (soluble in excess dilute strong acid) 3 Tests for gases gas test and test result ammonia, NH3 turns damp red litmus paper blue carbon dioxide, CO2 gives a white ppt. with limewater (ppt. dissolves with excess CO2) chlorine, Cl2 bleaches damp litmus paper hydrogen, H2 “pops” with a lighted splint oxygen, O2 relights a glowing splint sulfur dioxide, SO2 turns acidified aqueous potassium dichromate(VI) (aq) from orange to green
Mark scheme, page 1
UNIVERSITY OF CAMBRIDGE INTERNATIONAL EXAMINATIONS GCE Advanced Subsidiary Level and GCE Advanced Level MARK SCHEME for the May/June 2010 question paper for the guidance of teachers 9701 CHEMISTRY 9701/33 Paper 31 (Advanced Practical Skills), maximum raw mark 40 This mark scheme is published as an aid to teachers and candidates, to indicate the requirements of the examination. It shows the basis on which Examiners were instructed to award marks. It does not indicate the details of the discussions that took place at an Examiners’ meeting before marking began, which would have considered the acceptability of alternative answers. Mark schemes must be read in conjunction with the question papers and the report on the examination. • CIE will not enter into discussions or correspondence in connection with these mark schemes. CIE is publishing the mark schemes for the May/June 2010 question papers for most IGCSE, GCE Advanced Level and Advanced Subsidiary Level syllabuses and some Ordinary Level syllabuses.
Mark scheme, page 2
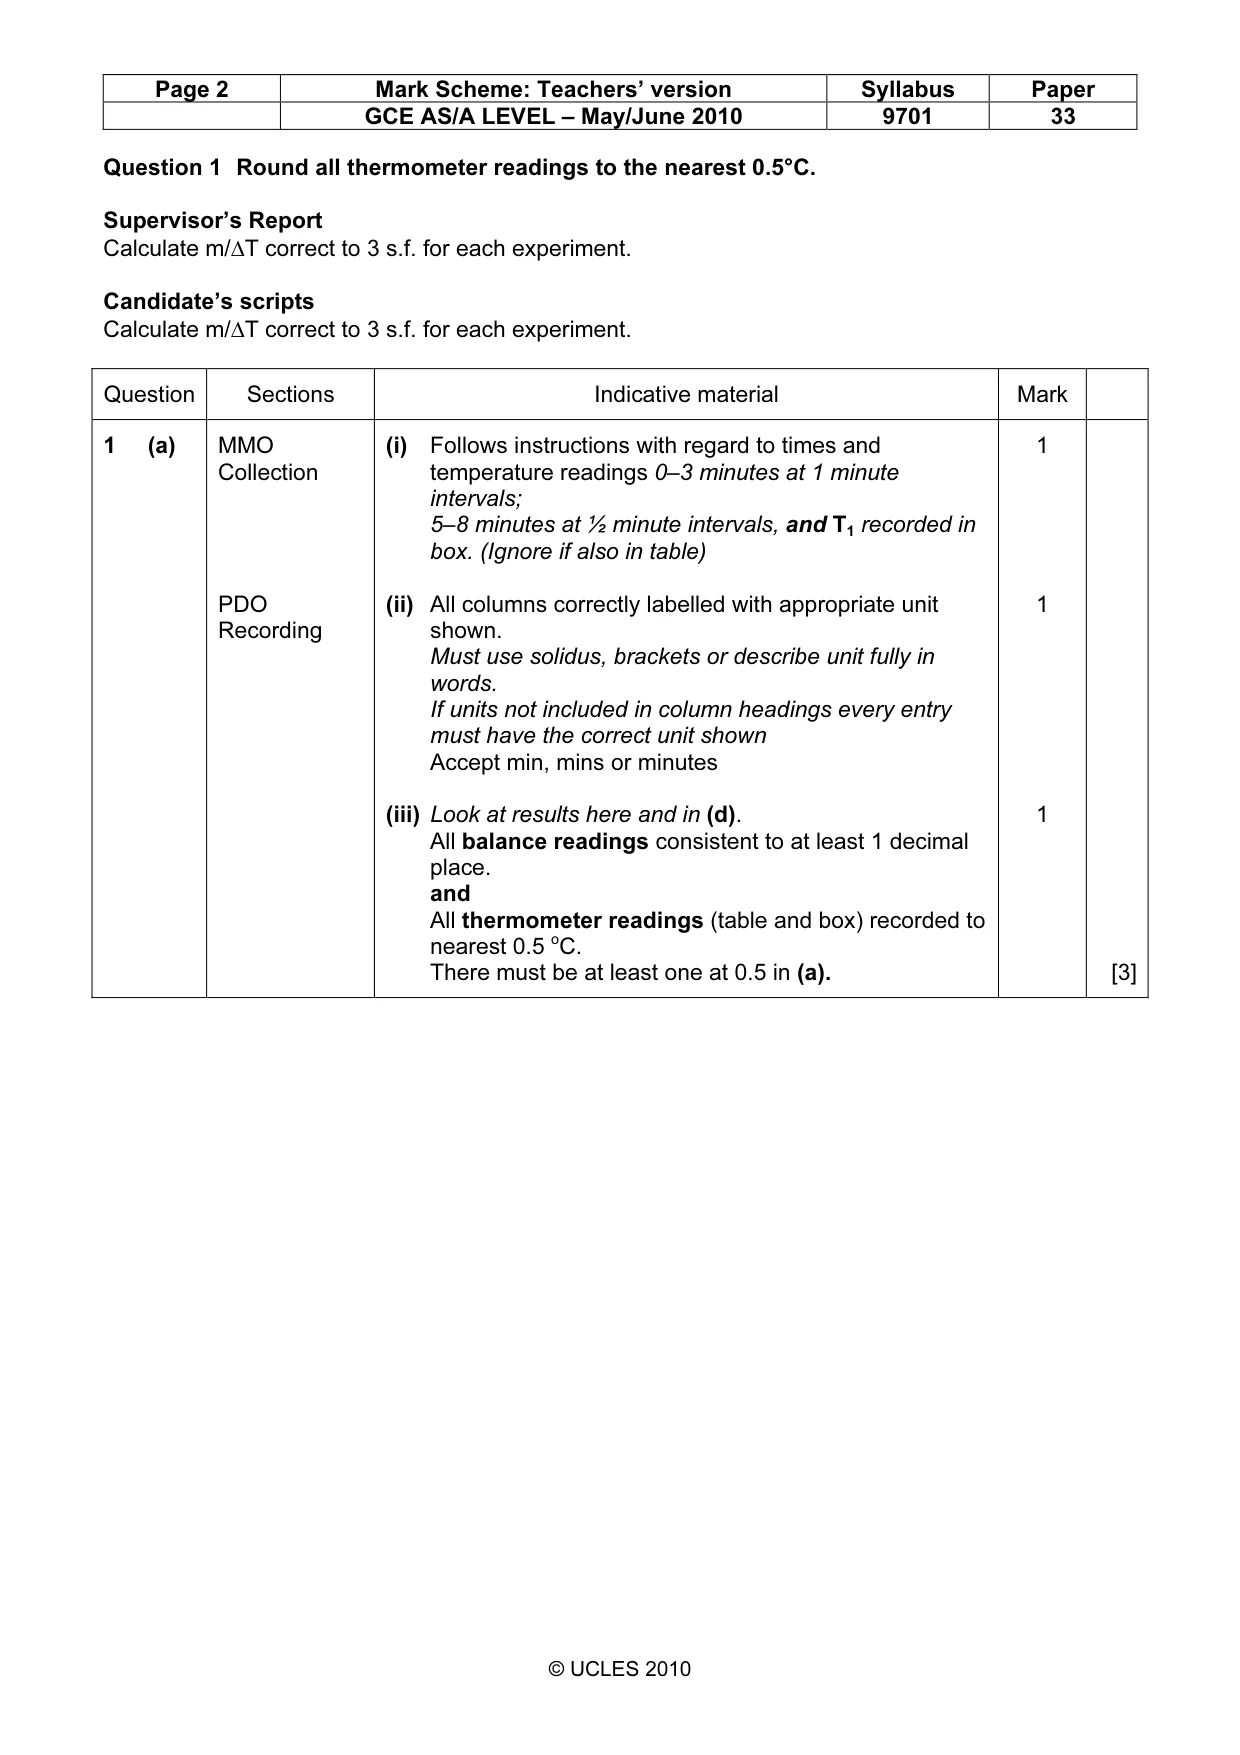
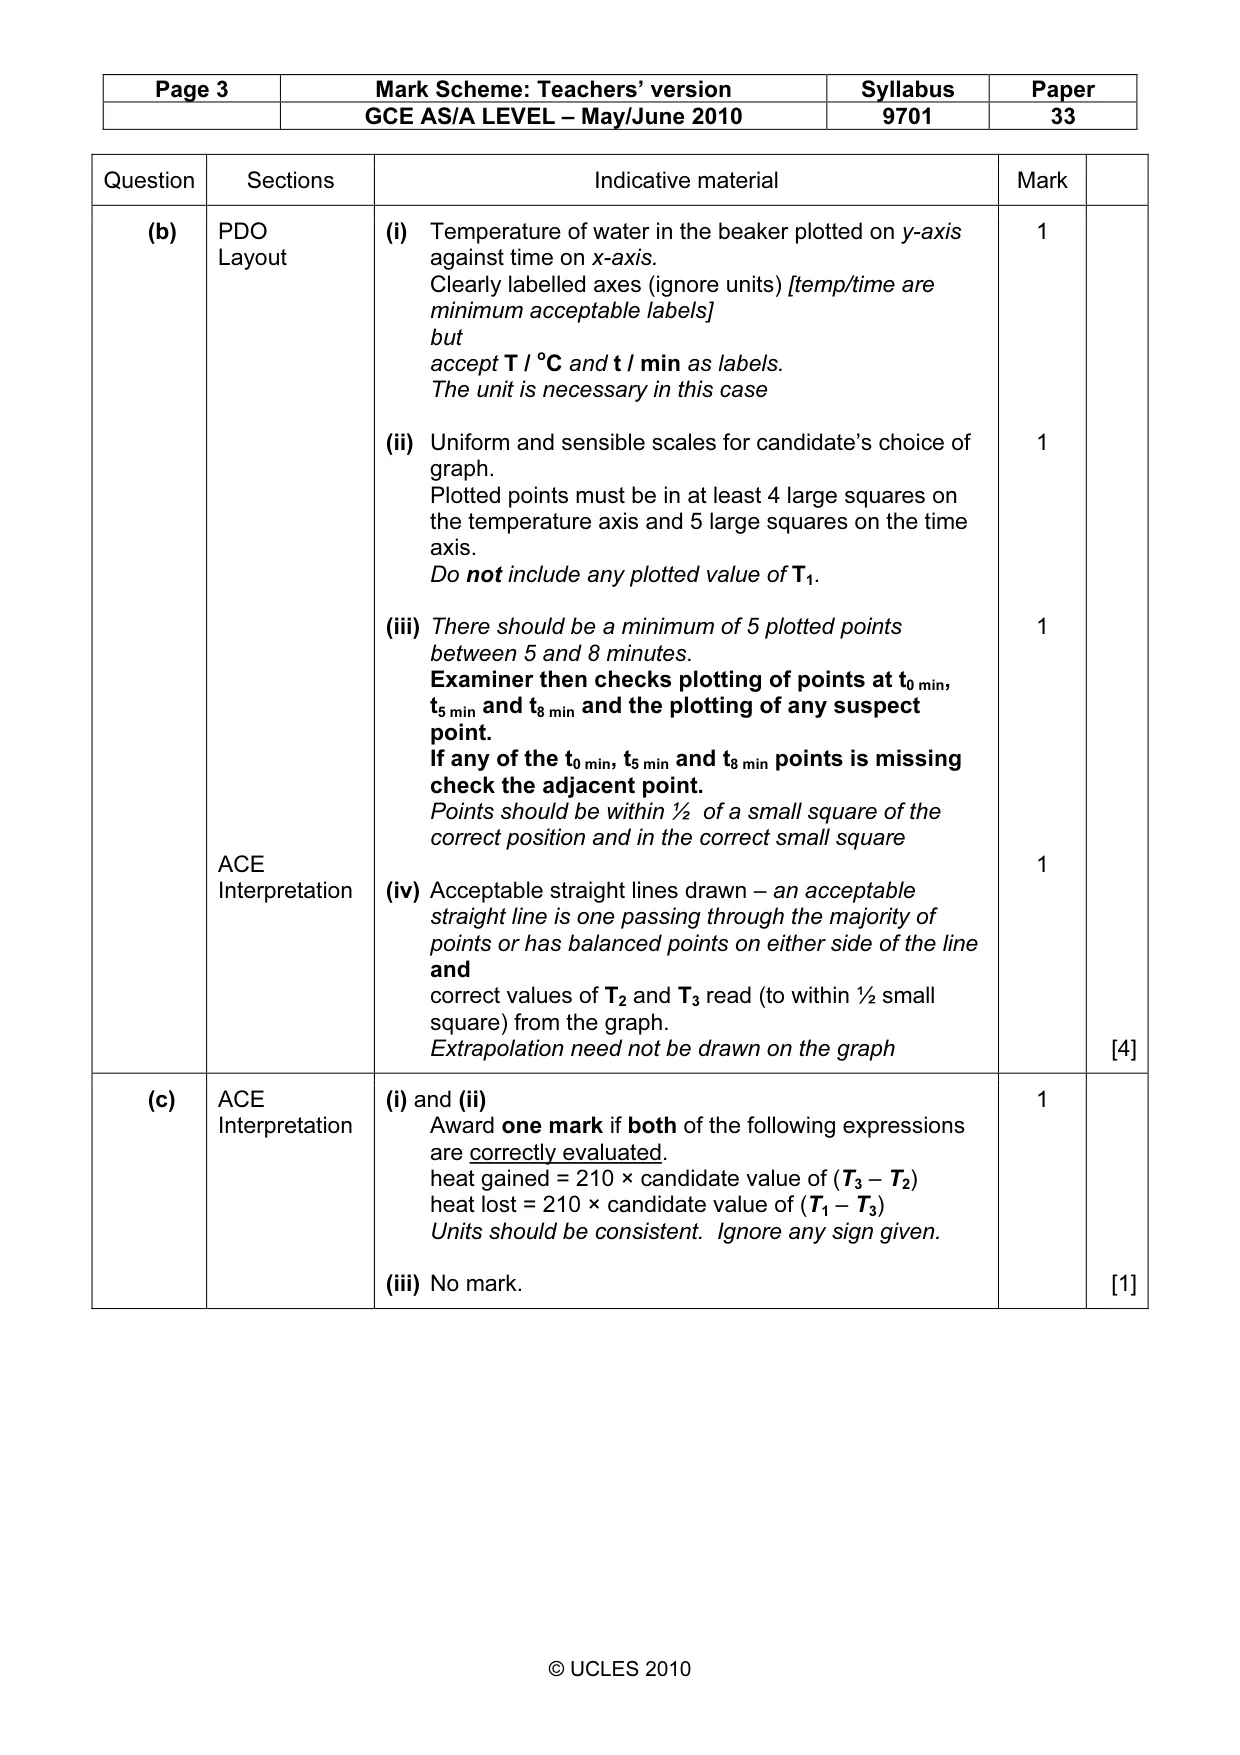
Page 2 Mark Scheme: Teachers’ version Syllabus Paper GCE AS/A LEVEL – May/June 2010 9701 33 © UCLES 2010 Question 1 Round all thermometer readings to the nearest 0.5°C. Supervisor’s Report Calculate m/∆T correct to 3 s.f. for each experiment. Candidate’s scripts Calculate m/∆T correct to 3 s.f. for each experiment. Question Sections Indicative material Mark 1 (a) MMO Collection PDO Recording (i) Follows instructions with regard to times and temperature readings 0–3 minutes at 1 minute intervals; 5–8 minutes at ½ minute intervals, and T1 recorded in box. (Ignore if also in table) (ii) All columns correctly labelled with appropriate unit shown. Must use solidus, brackets or describe unit fully in words. If units not included in column headings every entry must have the correct unit shown Accept min, mins or minutes (iii) Look at results here and in (d). All balance readings consistent to at least 1 decimal place. and All thermometer readings (table and box) recorded to nearest 0.5 oC. There must be at least one at 0.5 in (a). 1 1 1 [3]
Mark scheme, page 3
Page 3 Mark Scheme: Teachers’ version Syllabus Paper GCE AS/A LEVEL – May/June 2010 9701 33 © UCLES 2010 Question Sections Indicative material Mark (b) PDO Layout ACE Interpretation (i) Temperature of water in the beaker plotted on y-axis against time on x-axis. Clearly labelled axes (ignore units) [temp/time are minimum acceptable labels] but accept T / oC and t / min as labels. The unit is necessary in this case (ii) Uniform and sensible scales for candidate’s choice of graph. Plotted points must be in at least 4 large squares on the temperature axis and 5 large squares on the time axis. Do not include any plotted value of T1. (iii) There should be a minimum of 5 plotted points between 5 and 8 minutes. Examiner then checks plotting of points at t0 min, t5 min and t8 min and the plotting of any suspect point. If any of the t0 min, t5 min and t8 min points is missing check the adjacent point. Points should be within ½ of a small square of the correct position and in the correct small square (iv) Acceptable straight lines drawn – an acceptable straight line is one passing through the majority of points or has balanced points on either side of the line and correct values of T2 and T3 read (to within ½ small square) from the graph. Extrapolation need not be drawn on the graph 1 1 1 1 [4] (c) ACE Interpretation (i) and (ii) Award one mark if both of the following expressions are correctly evaluated. heat gained = 210 × candidate value of (T3 – T2) heat lost = 210 × candidate value of (T1 – T3) Units should be consistent. Ignore any sign given. (iii) No mark. 1 [1]
Mark scheme, page 4
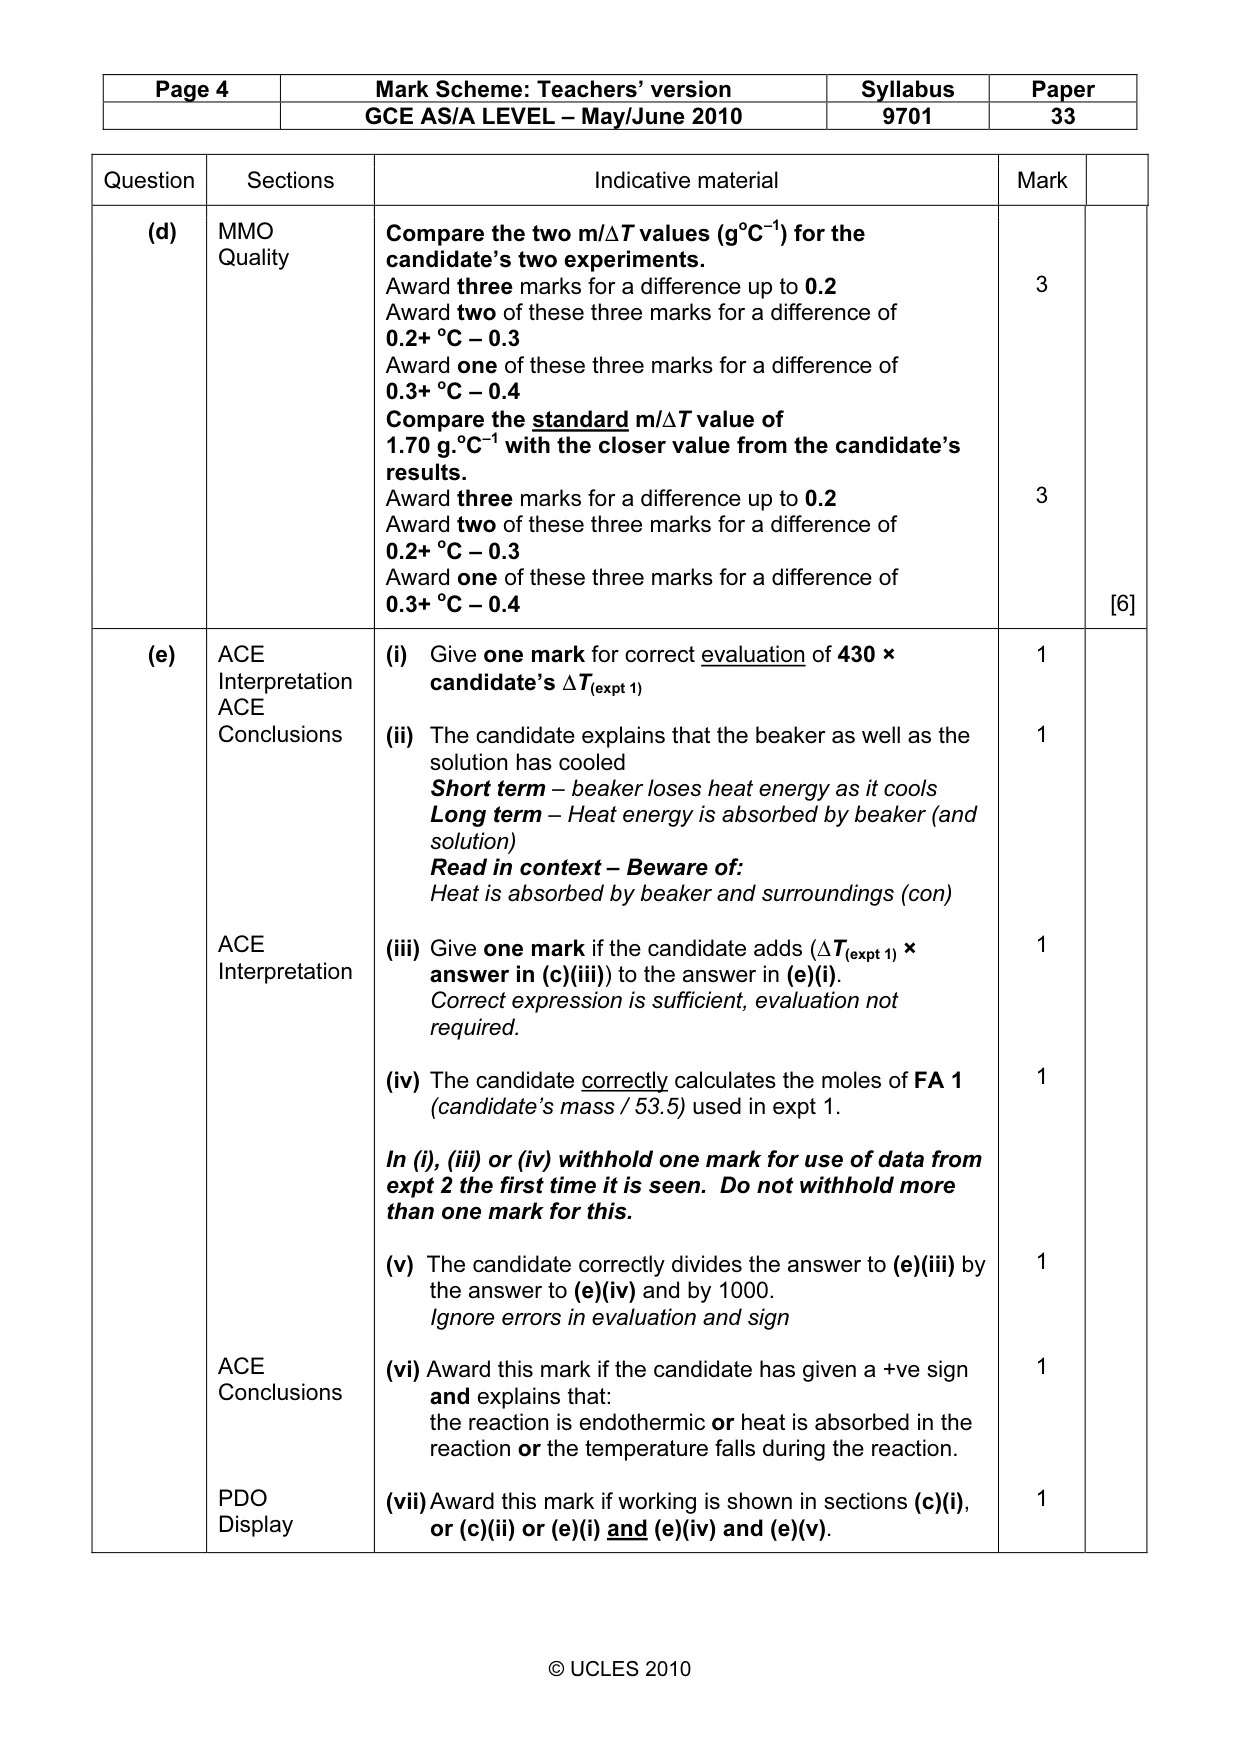
Page 4 Mark Scheme: Teachers’ version Syllabus Paper GCE AS/A LEVEL – May/June 2010 9701 33 © UCLES 2010 Question Sections Indicative material Mark (d) MMO Quality Compare the two m/∆T values (goC–1) for the candidate’s two experiments. Award three marks for a difference up to 0.2 Award two of these three marks for a difference of 0.2+ oC – 0.3 Award one of these three marks for a difference of 0.3+ oC – 0.4 Compare the standard m/∆T value of 1.70 g.oC–1 with the closer value from the candidate’s results. Award three marks for a difference up to 0.2 Award two of these three marks for a difference of 0.2+ oC – 0.3 Award one of these three marks for a difference of 0.3+ oC – 0.4 3 3 [6] (e) ACE Interpretation ACE Conclusions ACE Interpretation ACE Conclusions PDO Display (i) Give one mark for correct evaluation of 430 × candidate’s ∆T(expt 1) (ii) The candidate explains that the beaker as well as the solution has cooled Short term – beaker loses heat energy as it cools Long term – Heat energy is absorbed by beaker (and solution) Read in context – Beware of: Heat is absorbed by beaker and surroundings (con) (iii) Give one mark if the candidate adds (∆T(expt 1) × answer in (c)(iii)) to the answer in (e)(i). Correct expression is sufficient, evaluation not required. (iv) The candidate correctly calculates the moles of FA 1 (candidate’s mass / 53.5) used in expt 1. In (i), (iii) or (iv) withhold one mark for use of data from expt 2 the first time it is seen. Do not withhold more than one mark for this. (v) The candidate correctly divides the answer to (e)(iii) by the answer to (e)(iv) and by 1000. Ignore errors in evaluation and sign (vi) Award this mark if the candidate has given a +ve sign and explains that: the reaction is endothermic or heat is absorbed in the reaction or the temperature falls during the reaction. (vii) Award this mark if working is shown in sections (c)(i), or (c)(ii) or (e)(i) and (e)(iv) and (e)(v). 1 1 1 1 1 1 1
Mark scheme, page 5
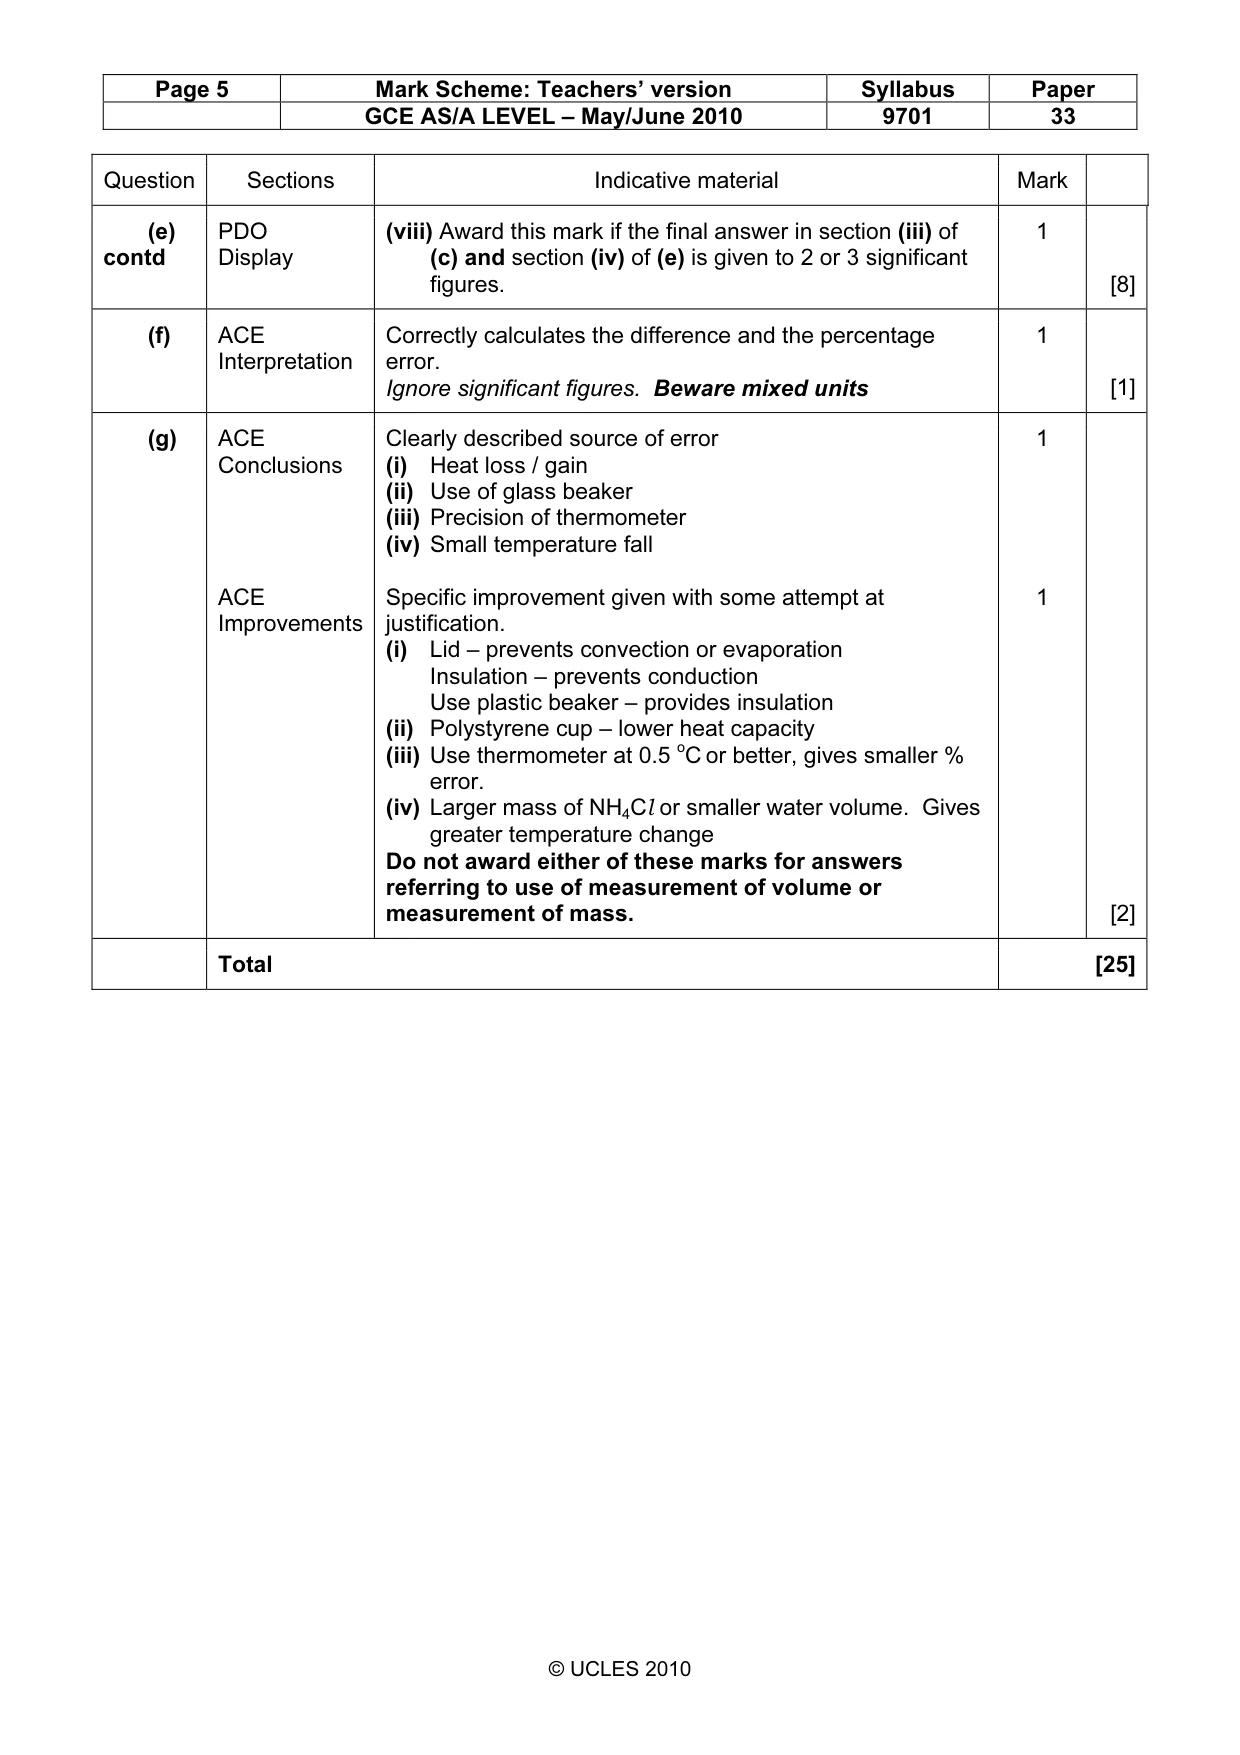
Page 5 Mark Scheme: Teachers’ version Syllabus Paper GCE AS/A LEVEL – May/June 2010 9701 33 © UCLES 2010 Question Sections Indicative material Mark (e) contd PDO Display (viii) Award this mark if the final answer in section (iii) of (c) and section (iv) of (e) is given to 2 or 3 significant figures. 1 [8] (f) ACE Interpretation Correctly calculates the difference and the percentage error. Ignore significant figures. Beware mixed units 1 [1] (g) ACE Conclusions ACE Improvements Clearly described source of error (i) Heat loss / gain (ii) Use of glass beaker (iii) Precision of thermometer (iv) Small temperature fall Specific improvement given with some attempt at justification. (i) Lid – prevents convection or evaporation Insulation – prevents conduction Use plastic beaker – provides insulation (ii) Polystyrene cup – lower heat capacity (iii) Use thermometer at 0.5 oC or better, gives smaller % error. (iv) Larger mass of NH4Cl or smaller water volume. Gives greater temperature change Do not award either of these marks for answers referring to use of measurement of volume or measurement of mass. 1 1 [2] Total [25]
Mark scheme, page 6
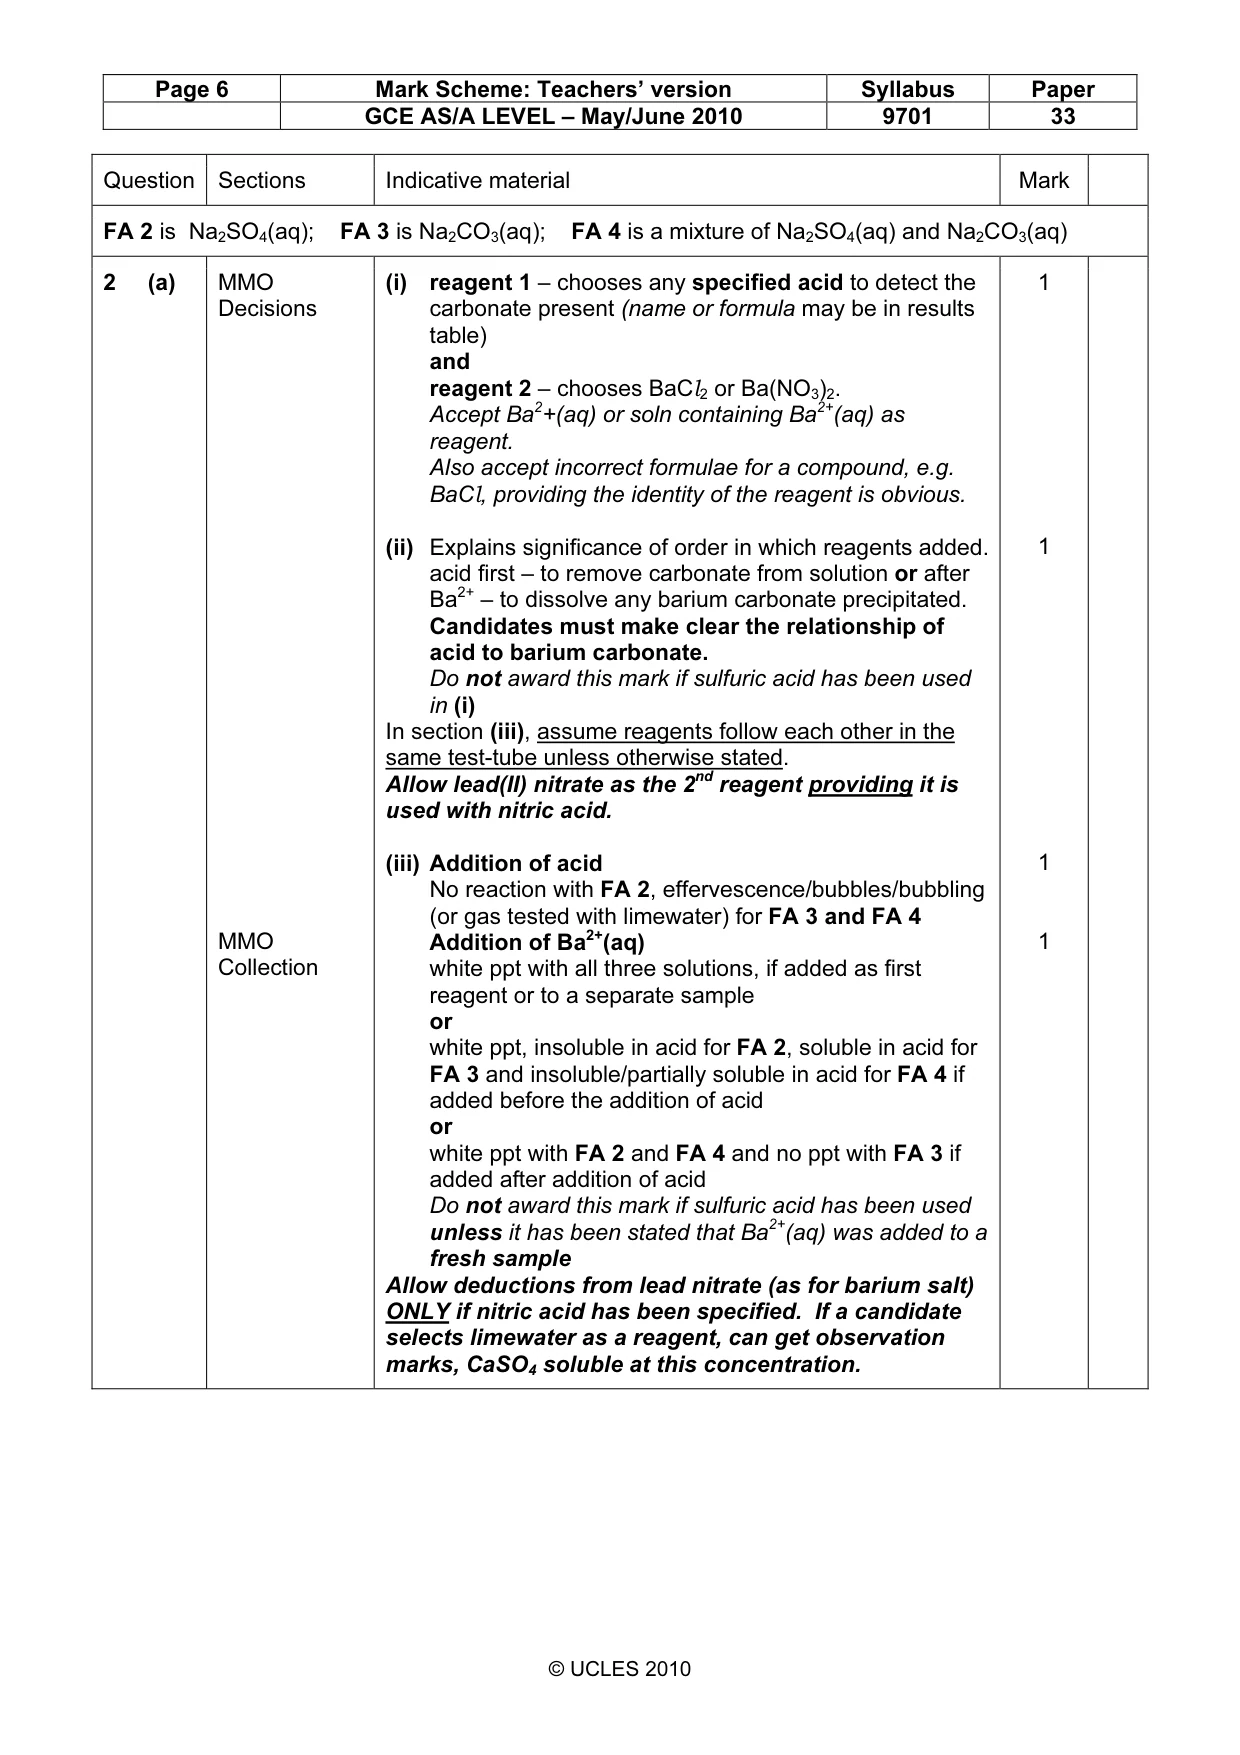
Page 6 Mark Scheme: Teachers’ version Syllabus Paper GCE AS/A LEVEL – May/June 2010 9701 33 © UCLES 2010 Question Sections Indicative material Mark FA 2 is Na2SO4(aq); FA 3 is Na2CO3(aq); FA 4 is a mixture of Na2SO4(aq) and Na2CO3(aq) 2 (a) MMO Decisions MMO Collection (i) reagent 1 – chooses any specified acid to detect the carbonate present (name or formula may be in results table) and reagent 2 – chooses BaCl2 or Ba(NO3)2. Accept Ba2+(aq) or soln containing Ba2+(aq) as reagent. Also accept incorrect formulae for a compound, e.g. BaCl, providing the identity of the reagent is obvious. (ii) Explains significance of order in which reagents added. acid first – to remove carbonate from solution or after Ba2+ – to dissolve any barium carbonate precipitated. Candidates must make clear the relationship of acid to barium carbonate. Do not award this mark if sulfuric acid has been used in (i) In section (iii), assume reagents follow each other in the same test-tube unless otherwise stated. Allow lead(II) nitrate as the 2nd reagent providing it is used with nitric acid. (iii) Addition of acid No reaction with FA 2, effervescence/bubbles/bubbling (or gas tested with limewater) for FA 3 and FA 4 Addition of Ba2+(aq) white ppt with all three solutions, if added as first reagent or to a separate sample or white ppt, insoluble in acid for FA 2, soluble in acid for FA 3 and insoluble/partially soluble in acid for FA 4 if added before the addition of acid or white ppt with FA 2 and FA 4 and no ppt with FA 3 if added after addition of acid Do not award this mark if sulfuric acid has been used unless it has been stated that Ba2+(aq) was added to a fresh sample Allow deductions from lead nitrate (as for barium salt) ONLY if nitric acid has been specified. If a candidate selects limewater as a reagent, can get observation marks, CaSO4 soluble at this concentration. 1 1 1 1
Mark scheme, page 7
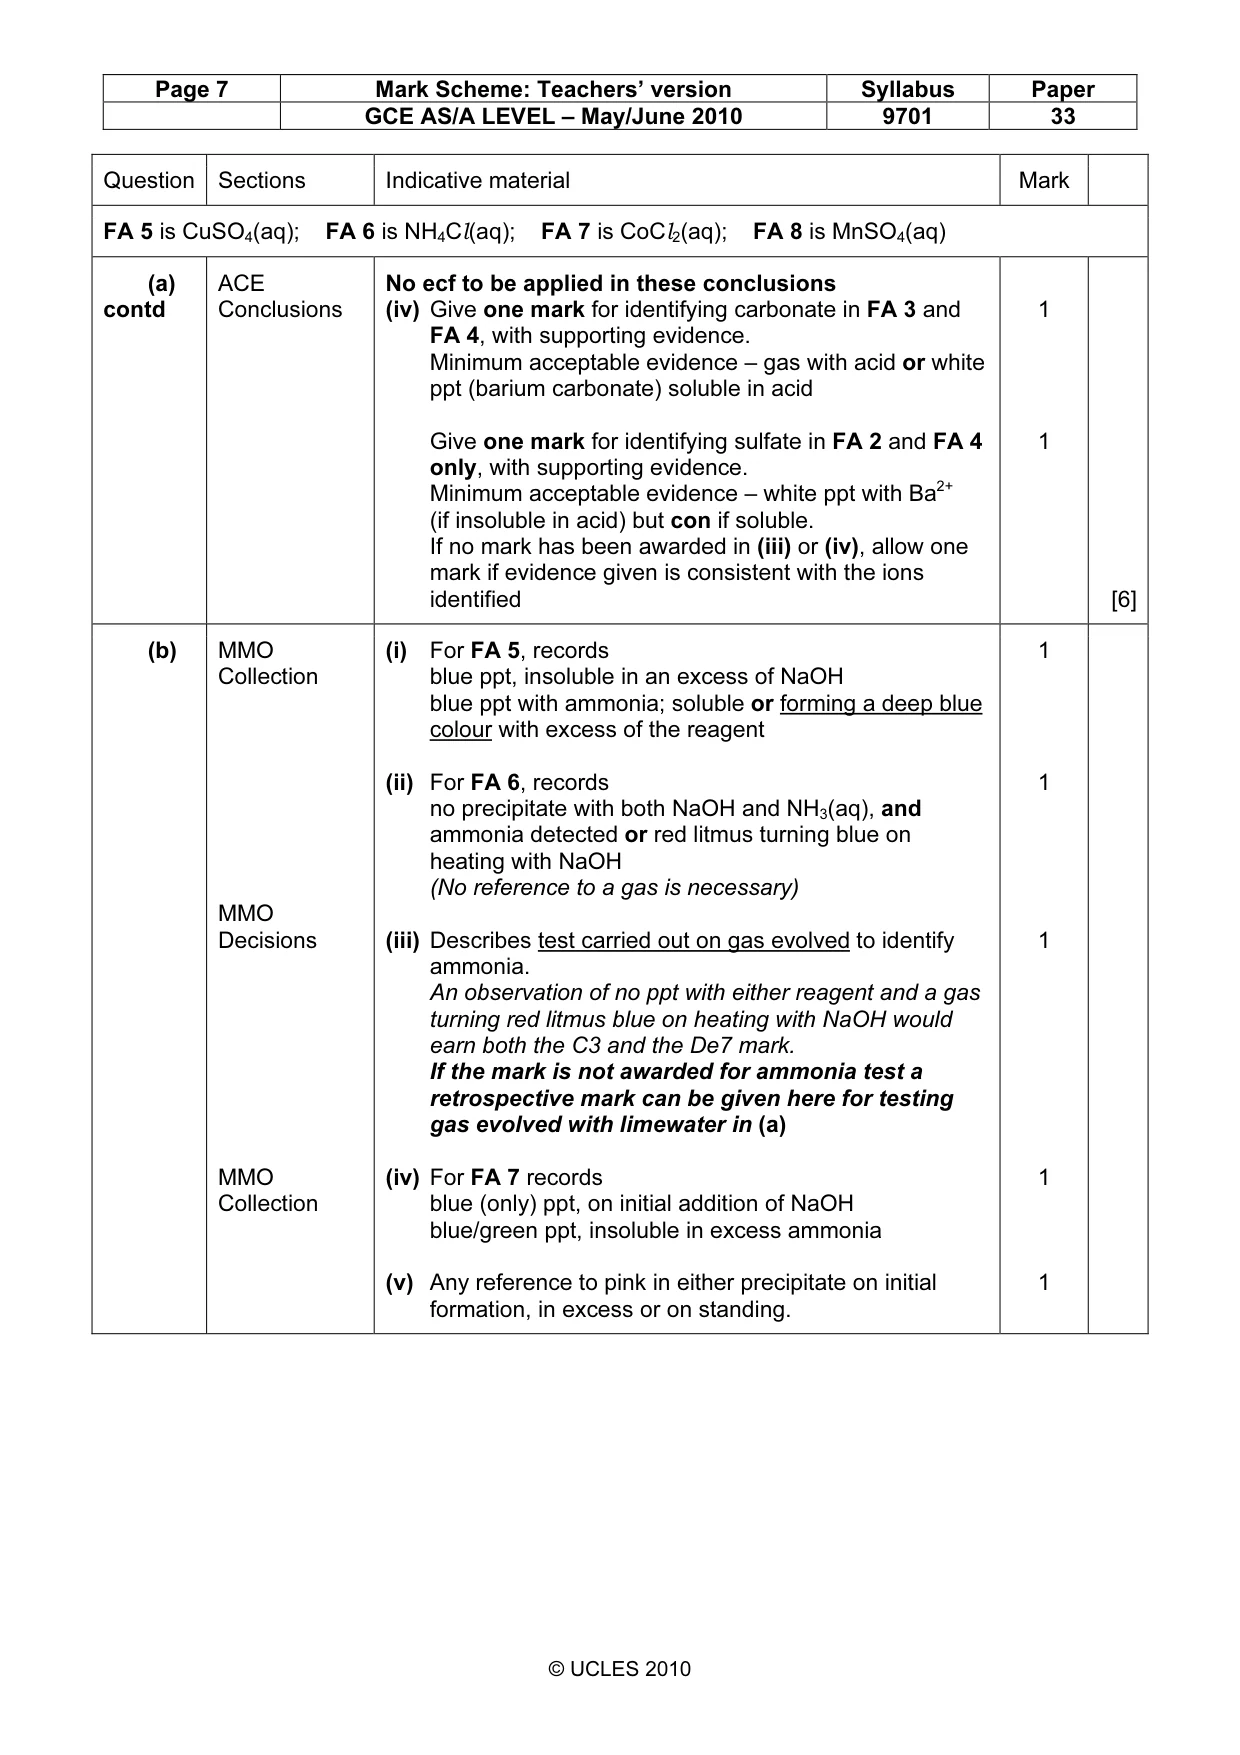
Page 7 Mark Scheme: Teachers’ version Syllabus Paper GCE AS/A LEVEL – May/June 2010 9701 33 © UCLES 2010 Question Sections Indicative material Mark FA 5 is CuSO4(aq); FA 6 is NH4Cl(aq); FA 7 is CoCl2(aq); FA 8 is MnSO4(aq) (a) contd ACE Conclusions No ecf to be applied in these conclusions (iv) Give one mark for identifying carbonate in FA 3 and FA 4, with supporting evidence. Minimum acceptable evidence – gas with acid or white ppt (barium carbonate) soluble in acid Give one mark for identifying sulfate in FA 2 and FA 4 only, with supporting evidence. Minimum acceptable evidence – white ppt with Ba2+ (if insoluble in acid) but con if soluble. If no mark has been awarded in (iii) or (iv), allow one mark if evidence given is consistent with the ions identified 1 1 [6] (b) MMO Collection MMO Decisions MMO Collection (i) For FA 5, records blue ppt, insoluble in an excess of NaOH blue ppt with ammonia; soluble or forming a deep blue colour with excess of the reagent (ii) For FA 6, records no precipitate with both NaOH and NH3(aq), and ammonia detected or red litmus turning blue on heating with NaOH (No reference to a gas is necessary) (iii) Describes test carried out on gas evolved to identify ammonia. An observation of no ppt with either reagent and a gas turning red litmus blue on heating with NaOH would earn both the C3 and the De7 mark. If the mark is not awarded for ammonia test a retrospective mark can be given here for testing gas evolved with limewater in (a) (iv) For FA 7 records blue (only) ppt, on initial addition of NaOH blue/green ppt, insoluble in excess ammonia (v) Any reference to pink in either precipitate on initial formation, in excess or on standing. 1 1 1 1 1
Mark scheme, page 8
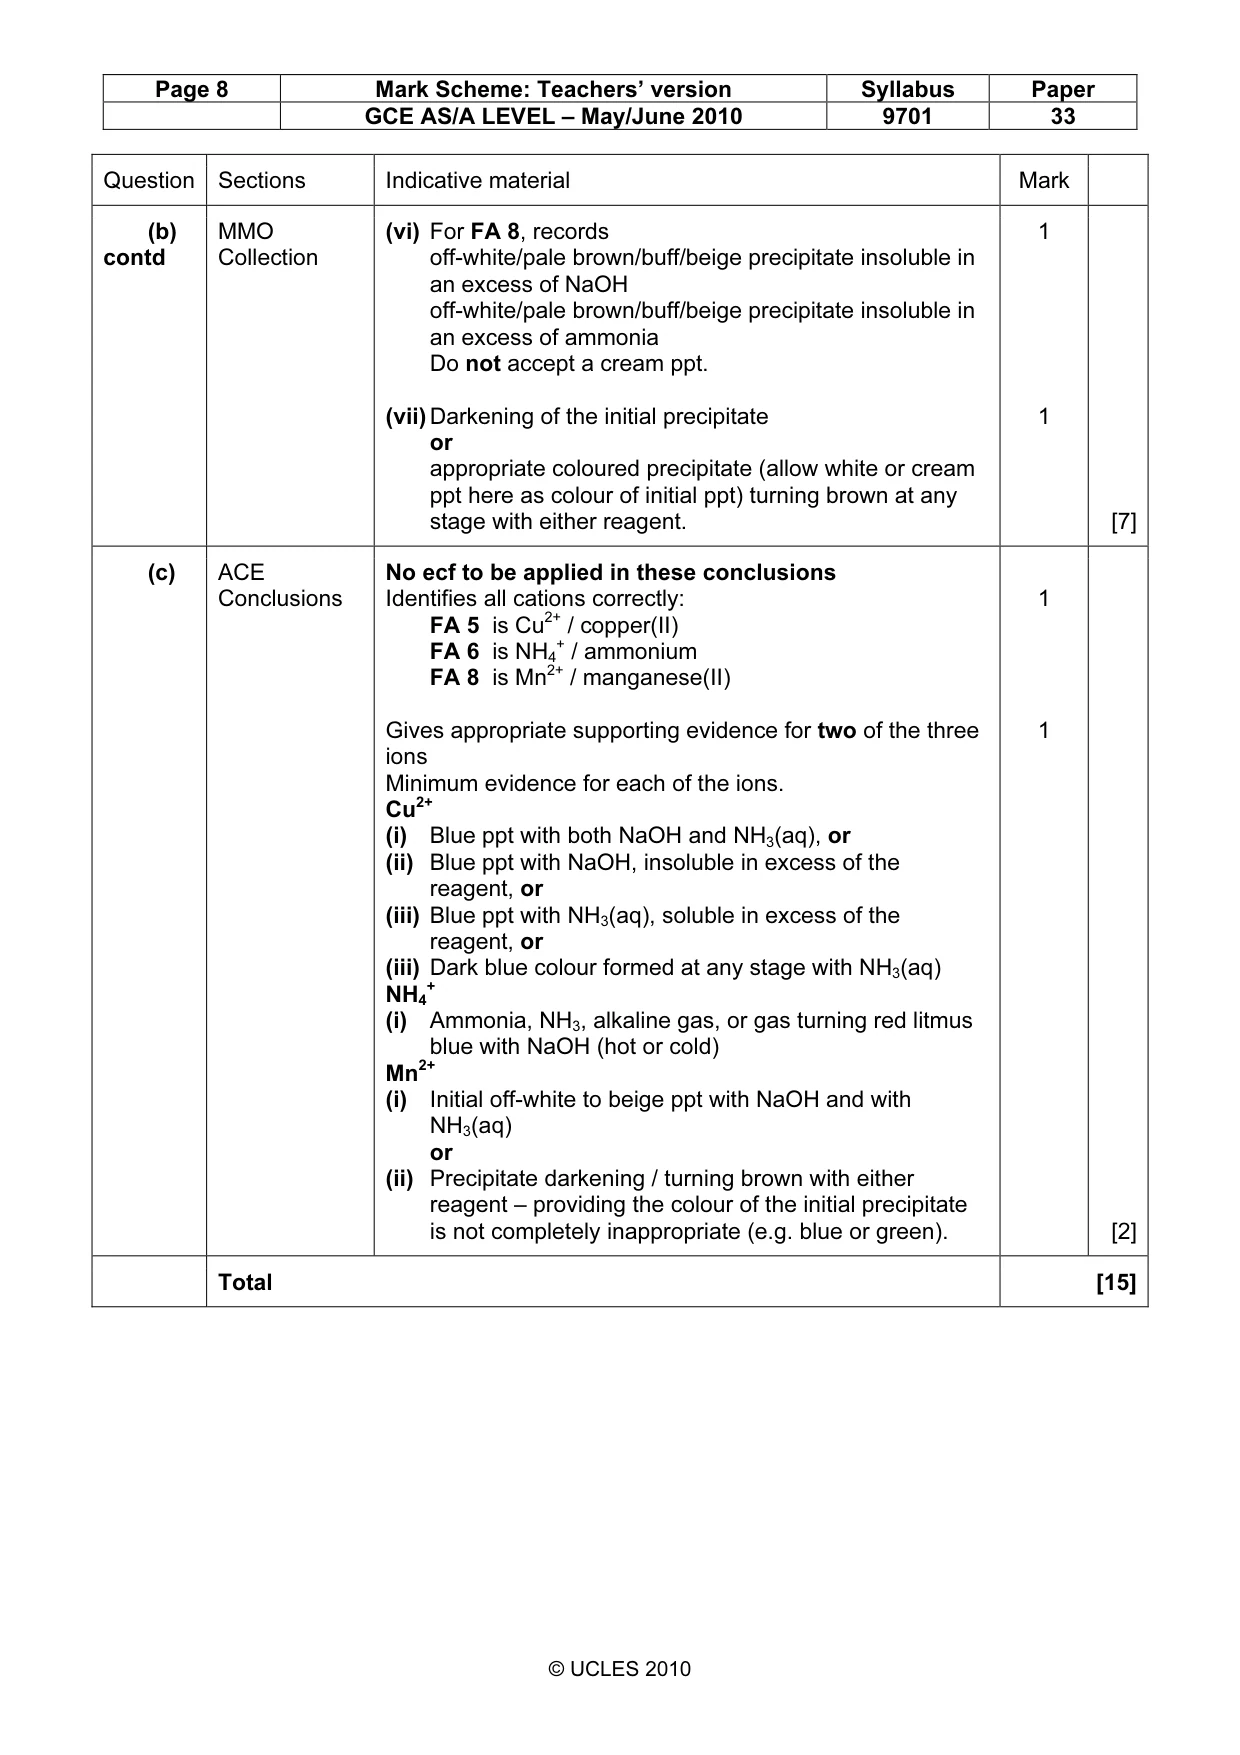
Page 8 Mark Scheme: Teachers’ version Syllabus Paper GCE AS/A LEVEL – May/June 2010 9701 33 © UCLES 2010 Question Sections Indicative material Mark (b) contd MMO Collection (vi) For FA 8, records off-white/pale brown/buff/beige precipitate insoluble in an excess of NaOH off-white/pale brown/buff/beige precipitate insoluble in an excess of ammonia Do not accept a cream ppt. (vii) Darkening of the initial precipitate or appropriate coloured precipitate (allow white or cream ppt here as colour of initial ppt) turning brown at any stage with either reagent. 1 1 [7] (c) ACE Conclusions No ecf to be applied in these conclusions Identifies all cations correctly: FA 5 is Cu2+ / copper(II) FA 6 is NH4 + / ammonium FA 8 is Mn2+ / manganese(II) Gives appropriate supporting evidence for two of the three ions Minimum evidence for each of the ions. Cu2+ (i) Blue ppt with both NaOH and NH3(aq), or (ii) Blue ppt with NaOH, insoluble in excess of the reagent, or (iii) Blue ppt with NH3(aq), soluble in excess of the reagent, or (iii) Dark blue colour formed at any stage with NH3(aq) NH4 + (i) Ammonia, NH3, alkaline gas, or gas turning red litmus blue with NaOH (hot or cold) Mn2+ (i) Initial off-white to beige ppt with NaOH and with NH3(aq) or (ii) Precipitate darkening / turning brown with either reagent – providing the colour of the initial precipitate is not completely inappropriate (e.g. blue or green). 1 1 [2] Total [15]
What you needed in this session
Cambridge’s own grade thresholds for 2010 May/June, Paper 3 · Variant 3. A higher threshold means an easier paper — the bar moves with how the cohort did.