Cambridge A Level Chemistry 9701 — 2008 May/June Paper 3 · Variant 2
9701/32/M/J/08 · 40 marks · ≈45 min
The question paper and its mark scheme, free to read here and free to download. This is Cambridge’s own paper, exactly as it was sat.
Question paper12 pages
Mark scheme11 pages
Answers below. Sit the paper first if you are practising.
Paper as text
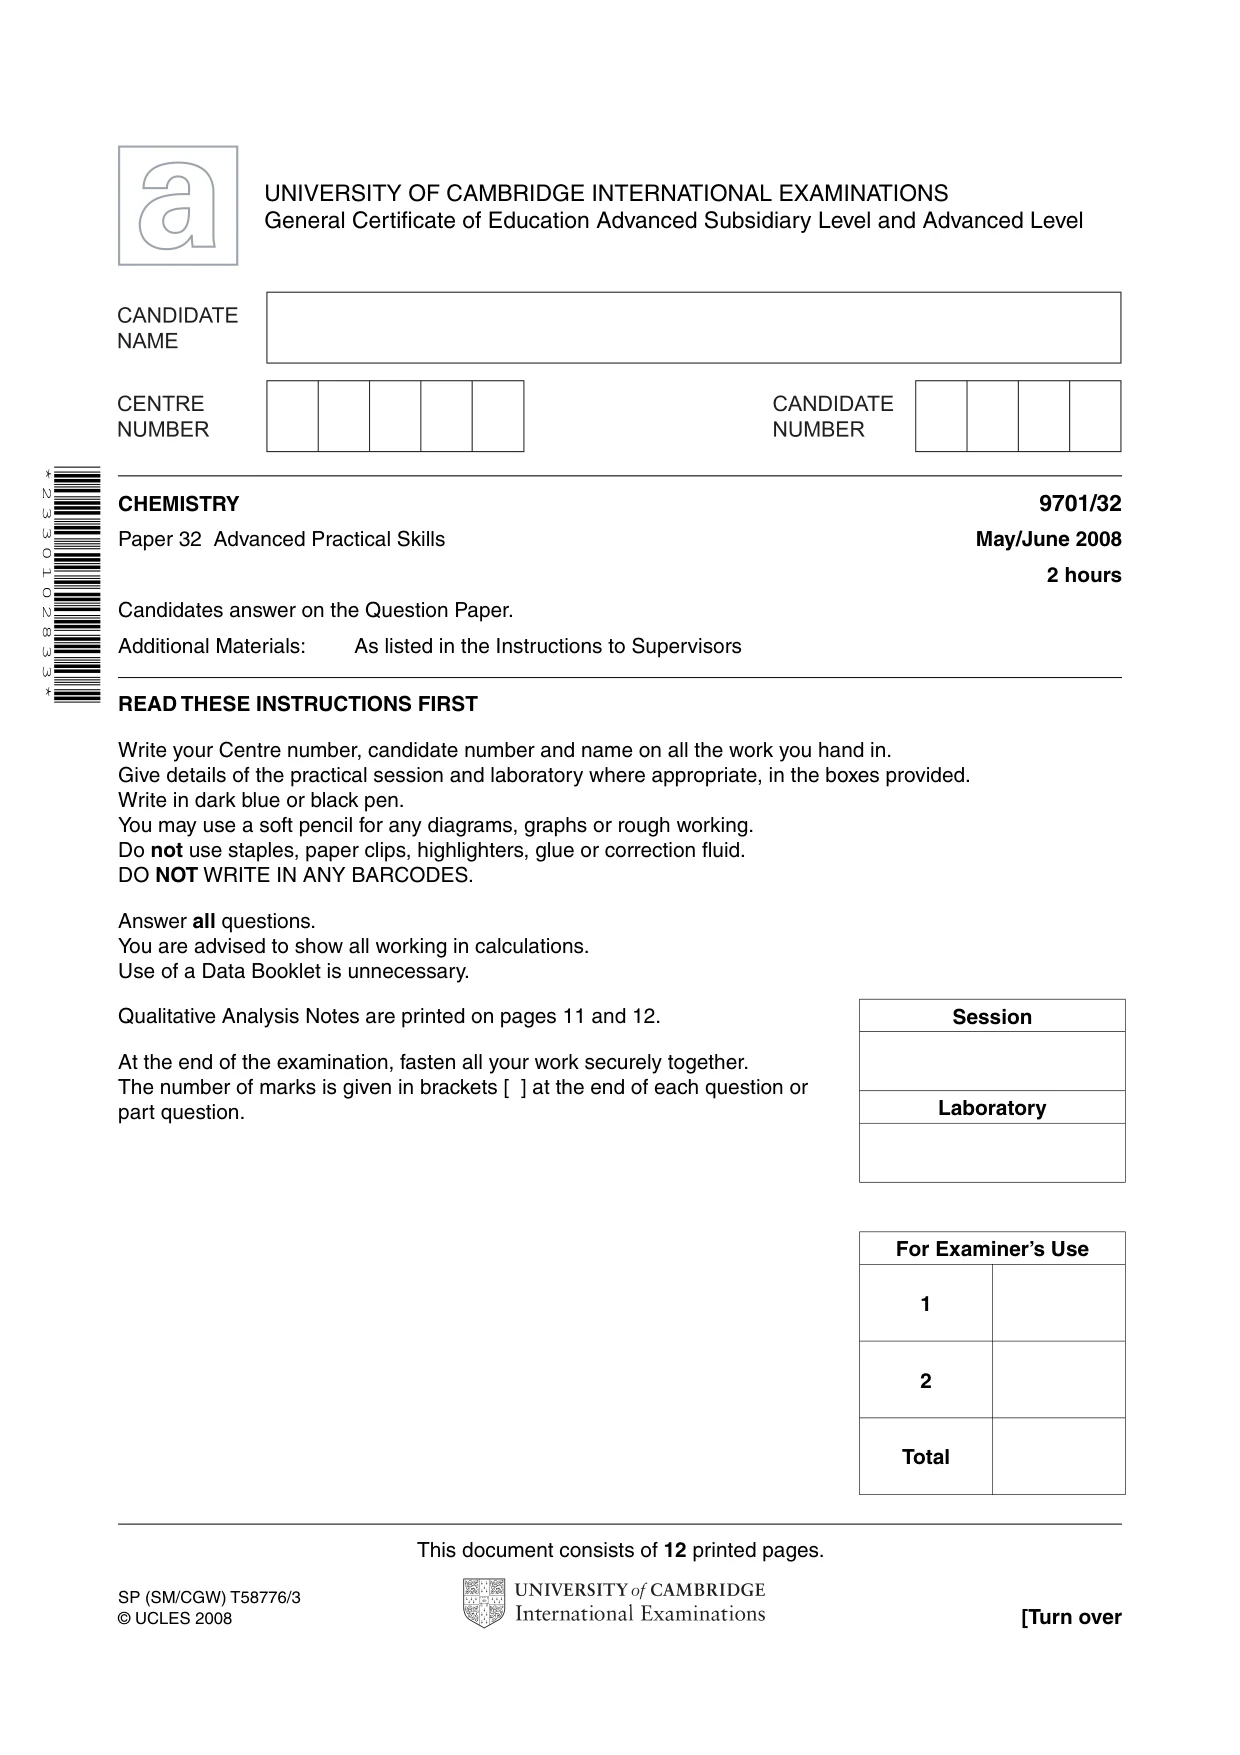
Question paper, page 1
This document consists of 12 printed pages. SP (SM/CGW) T58776/3 © UCLES 2008 [Turn over UNIVERSITY OF CAMBRIDGE INTERNATIONAL EXAMINATIONS General Certificate of Education Advanced Subsidiary Level and Advanced Level READ THESE INSTRUCTIONS FIRST Write your Centre number, candidate number and name on all the work you hand in. Give details of the practical session and laboratory where appropriate, in the boxes provided. Write in dark blue or black pen. You may use a soft pencil for any diagrams, graphs or rough working. Do not use staples, paper clips, highlighters, glue or correction fluid. DO NOT WRITE IN ANY BARCODES. Answer all questions. You are advised to show all working in calculations. Use of a Data Booklet is unnecessary. Qualitative Analysis Notes are printed on pages 11 and 12. At the end of the examination, fasten all your work securely together. The number of marks is given in brackets [ ] at the end of each question or part question. CHEMISTRY 9701/32 Paper 32 Advanced Practical Skills May/June 2008 2 hours Candidates answer on the Question Paper. Additional Materials: As listed in the Instructions to Supervisors For Examiner’s Use 1 2 Total Session Laboratory * 2 3 3 0 1 0 2 8 3 3 *
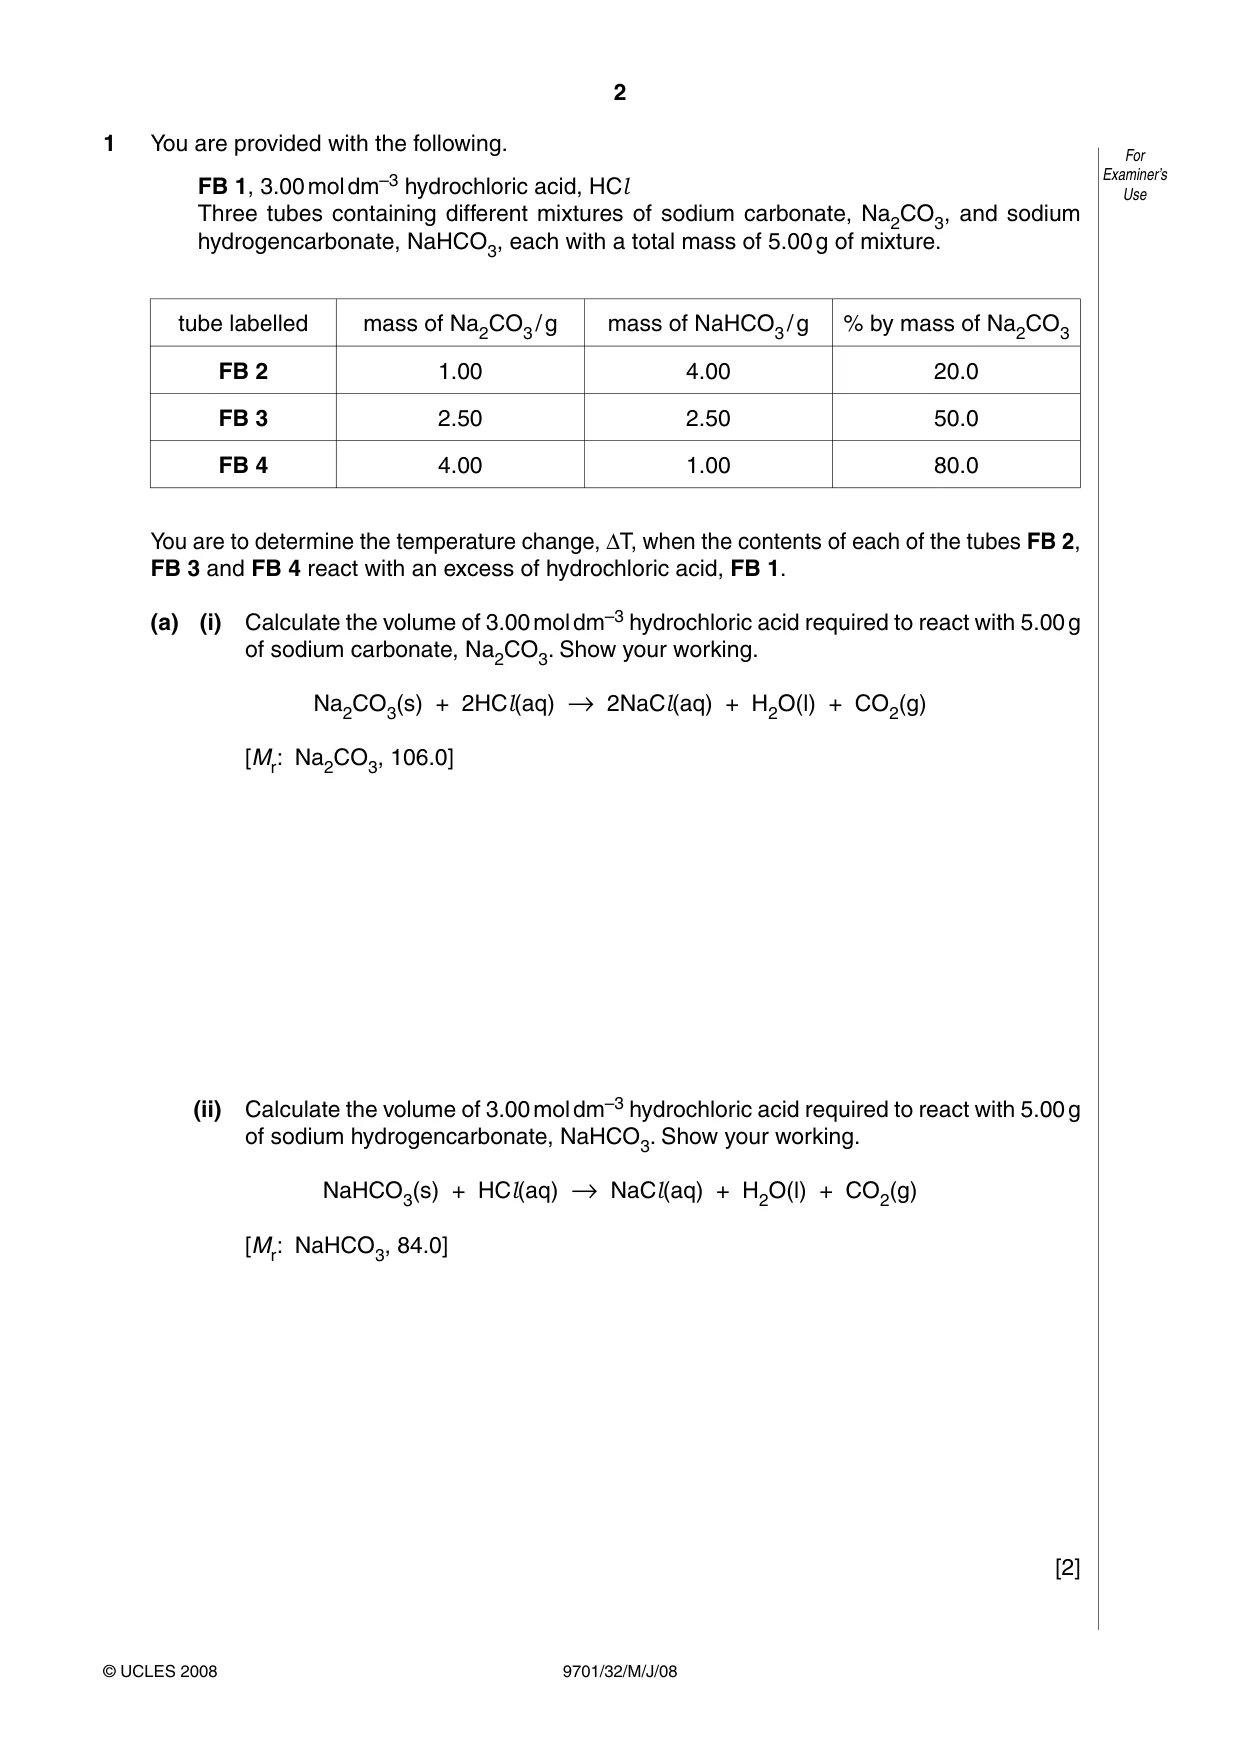
Question paper, page 2
2 © UCLES 2008 For Examiner’s Use 9701/32/M/J/08 1 You are provided with the following. FB 1, 3.00 mol dm–3 hydrochloric acid, HCl Three tubes containing different mixtures of sodium carbonate, Na2CO3, and sodium hydrogencarbonate, NaHCO3, each with a total mass of 5.00 g of mixture. tube labelled mass of Na2CO3 / g mass of NaHCO3 / g % by mass of Na2CO3 FB 2 1.00 4.00 20.0 FB 3 2.50 2.50 50.0 FB 4 4.00 1.00 80.0 You are to determine the temperature change, ∆T, when the contents of each of the tubes FB 2, FB 3 and FB 4 react with an excess of hydrochloric acid, FB 1. (a) (i) Calculate the volume of 3.00 mol dm–3 hydrochloric acid required to react with 5.00 g of sodium carbonate, Na2CO3. Show your working. Na2CO3(s) + 2HCl(aq) → 2NaCl(aq) + H2O(l) + CO2(g) [Mr: Na2CO3, 106.0] (ii) Calculate the volume of 3.00 mol dm–3 hydrochloric acid required to react with 5.00 g of sodium hydrogencarbonate, NaHCO3. Show your working. NaHCO3(s) + HCl(aq) → NaCl(aq) + H2O(l) + CO2(g) [Mr: NaHCO3, 84.0] [2]
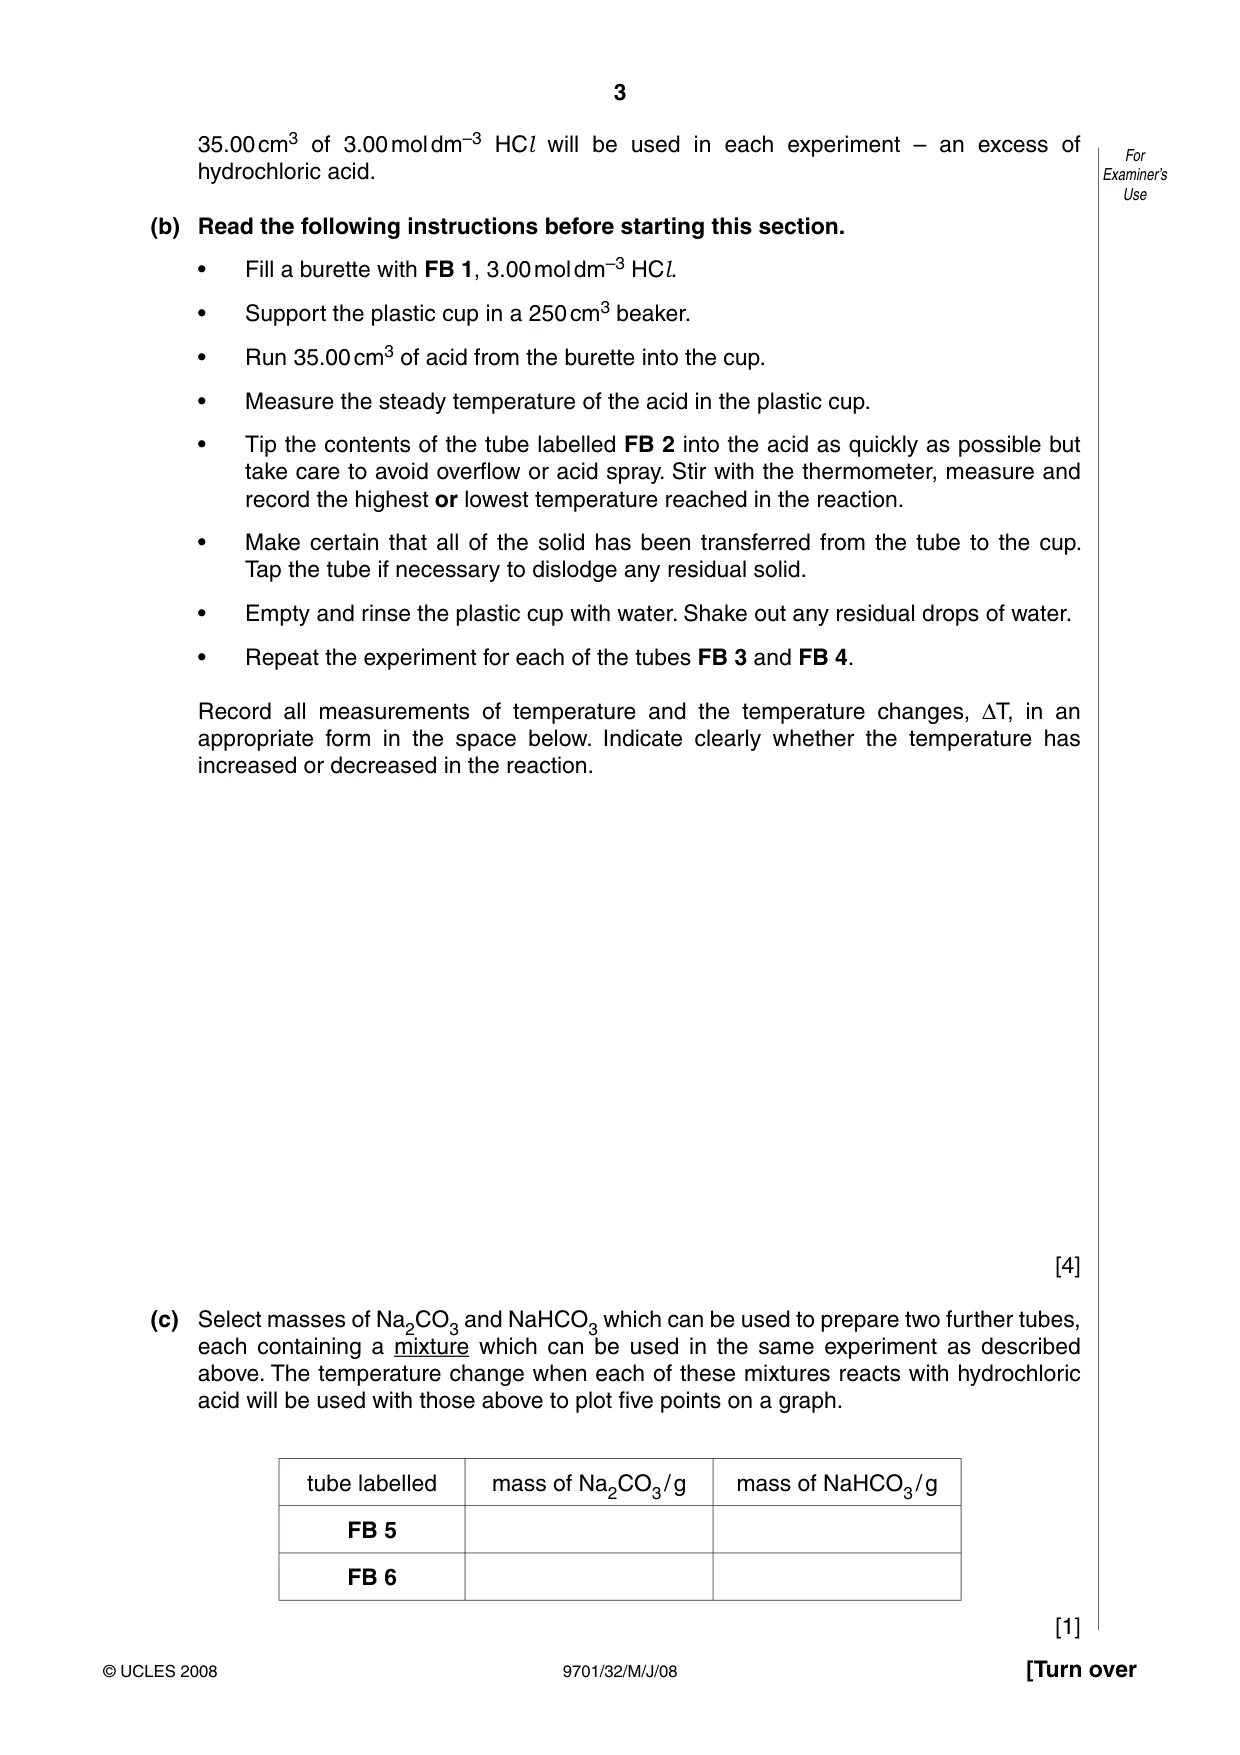
Question paper, page 3
3 © UCLES 2008 [Turn over For Examiner’s Use 9701/32/M/J/08 35.00 cm3 of 3.00 mol dm–3 HCl will be used in each experiment – an excess of hydrochloric acid. (b) Read the following instructions before starting this section. • Fill a burette with FB 1, 3.00 mol dm–3 HCl. • Support the plastic cup in a 250 cm3 beaker. • Run 35.00 cm3 of acid from the burette into the cup. • Measure the steady temperature of the acid in the plastic cup. • Tip the contents of the tube labelled FB 2 into the acid as quickly as possible but take care to avoid overflow or acid spray. Stir with the thermometer, measure and record the highest or lowest temperature reached in the reaction. • Make certain that all of the solid has been transferred from the tube to the cup. Tap the tube if necessary to dislodge any residual solid. • Empty and rinse the plastic cup with water. Shake out any residual drops of water. • Repeat the experiment for each of the tubes FB 3 and FB 4. Record all measurements of temperature and the temperature changes, ∆T, in an appropriate form in the space below. Indicate clearly whether the temperature has increased or decreased in the reaction. [4] (c) Select masses of Na2CO3 and NaHCO3 which can be used to prepare two further tubes, each containing a mixture which can be used in the same experiment as described above. The temperature change when each of these mixtures reacts with hydrochloric acid will be used with those above to plot five points on a graph. tube labelled mass of Na2CO3 / g mass of NaHCO3 / g FB 5 FB 6 [1]
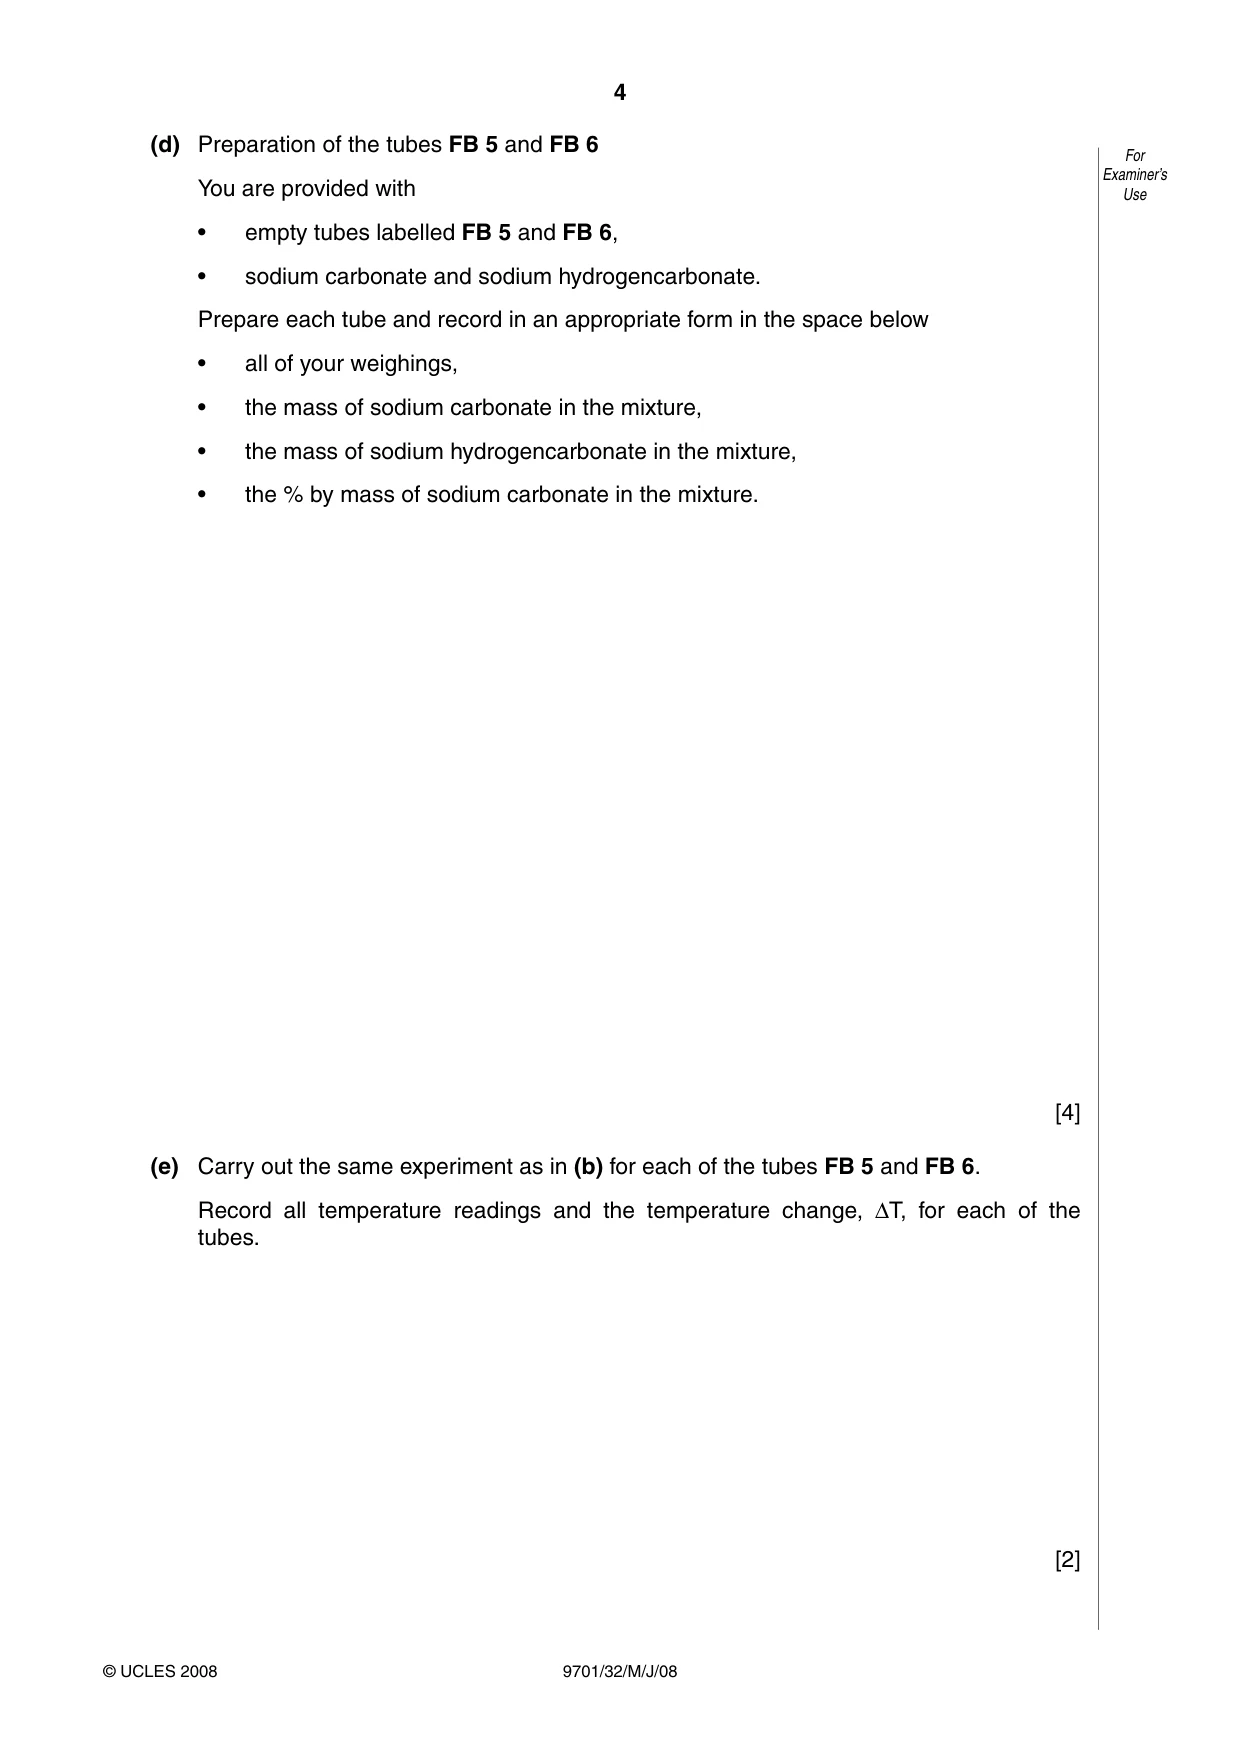
Question paper, page 4
4 © UCLES 2008 For Examiner’s Use 9701/32/M/J/08 (d) Preparation of the tubes FB 5 and FB 6 You are provided with • empty tubes labelled FB 5 and FB 6, • sodium carbonate and sodium hydrogencarbonate. Prepare each tube and record in an appropriate form in the space below • all of your weighings, • the mass of sodium carbonate in the mixture, • the mass of sodium hydrogencarbonate in the mixture, • the % by mass of sodium carbonate in the mixture. [4] (e) Carry out the same experiment as in (b) for each of the tubes FB 5 and FB 6. Record all temperature readings and the temperature change, ∆T, for each of the tubes. [2]
Question paper, page 5
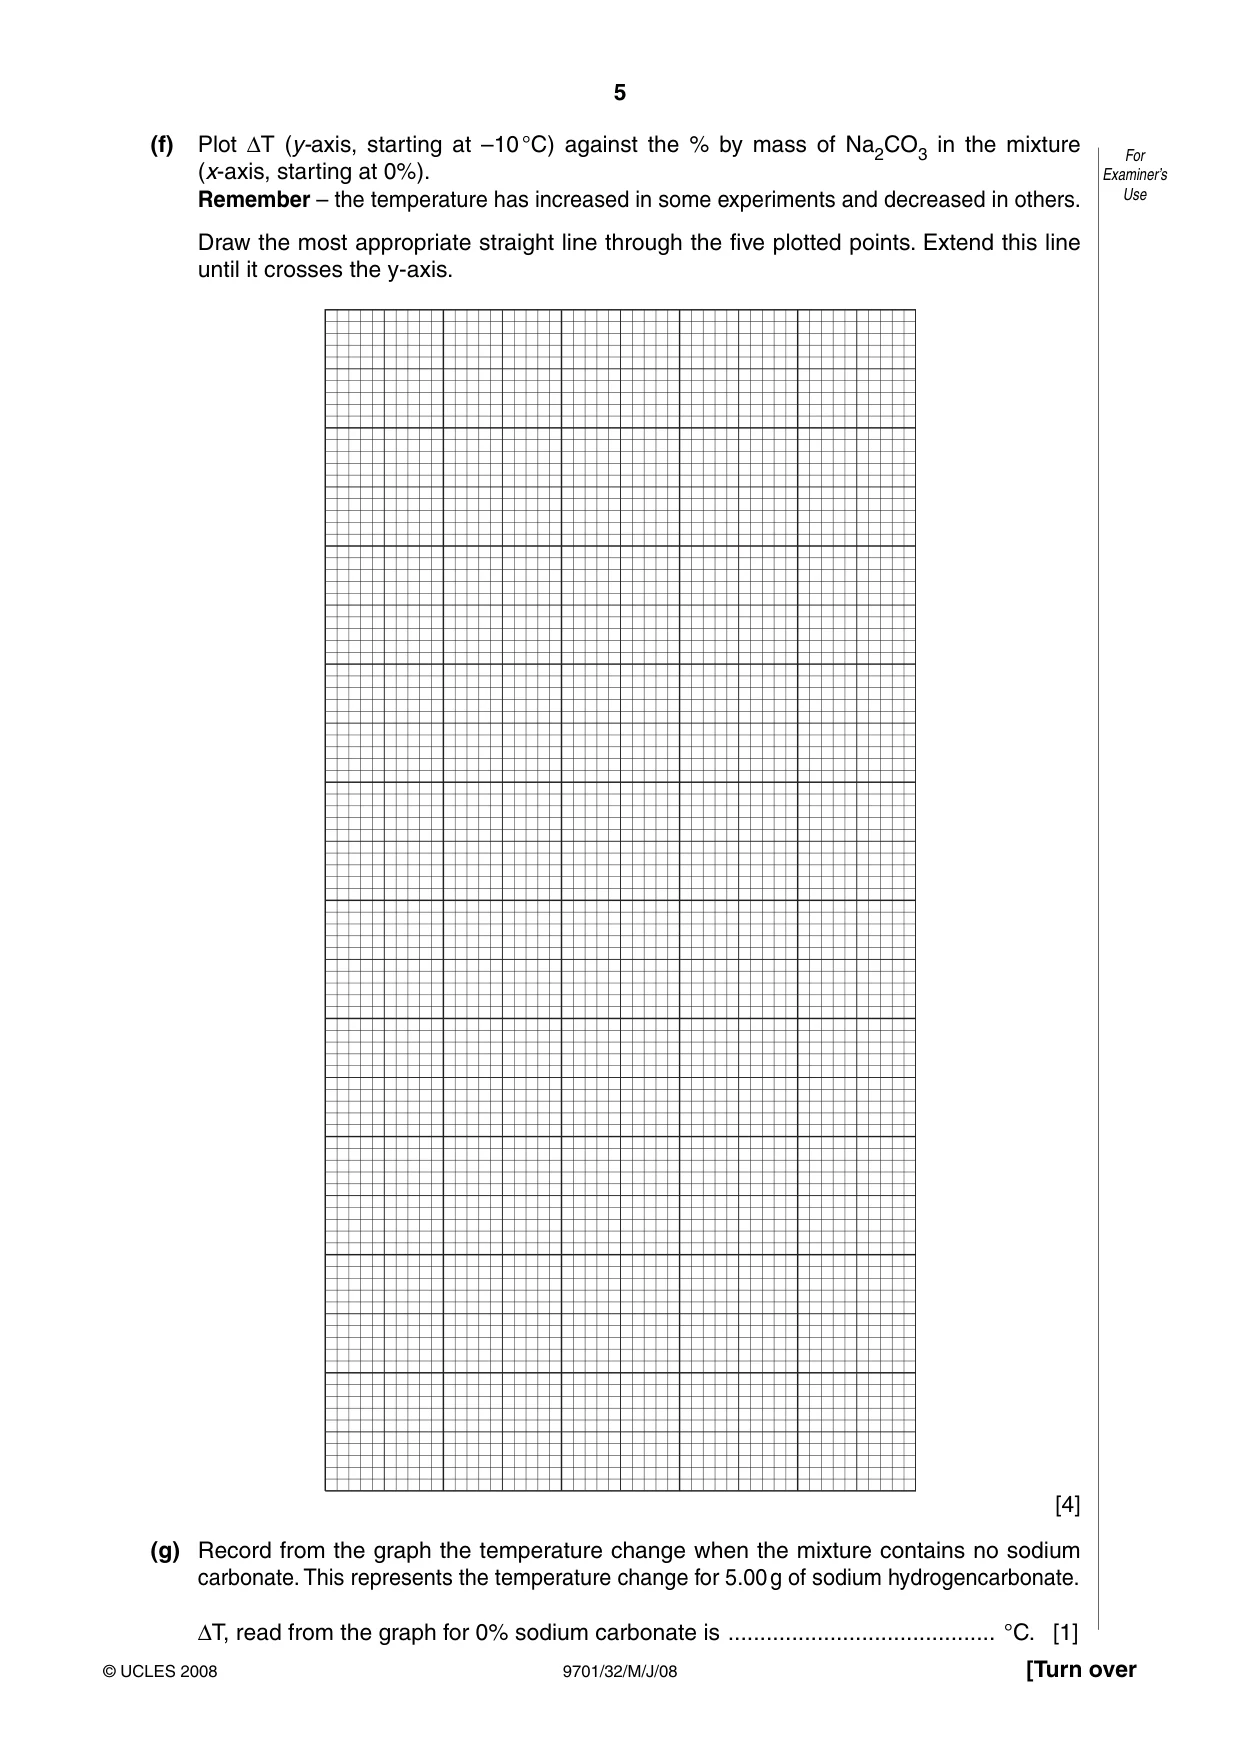
5 © UCLES 2008 [Turn over For Examiner’s Use 9701/32/M/J/08 (f) Plot ∆T (y-axis, starting at –10 °C) against the % by mass of Na2CO3 in the mixture (x-axis, starting at 0%). Remember – the temperature has increased in some experiments and decreased in others. Draw the most appropriate straight line through the five plotted points. Extend this line until it crosses the y-axis. [4] (g) Record from the graph the temperature change when the mixture contains no sodium carbonate. This represents the temperature change for 5.00 g of sodium hydrogencarbonate. ∆T, read from the graph for 0% sodium carbonate is … °C. [1]
Question paper, page 6
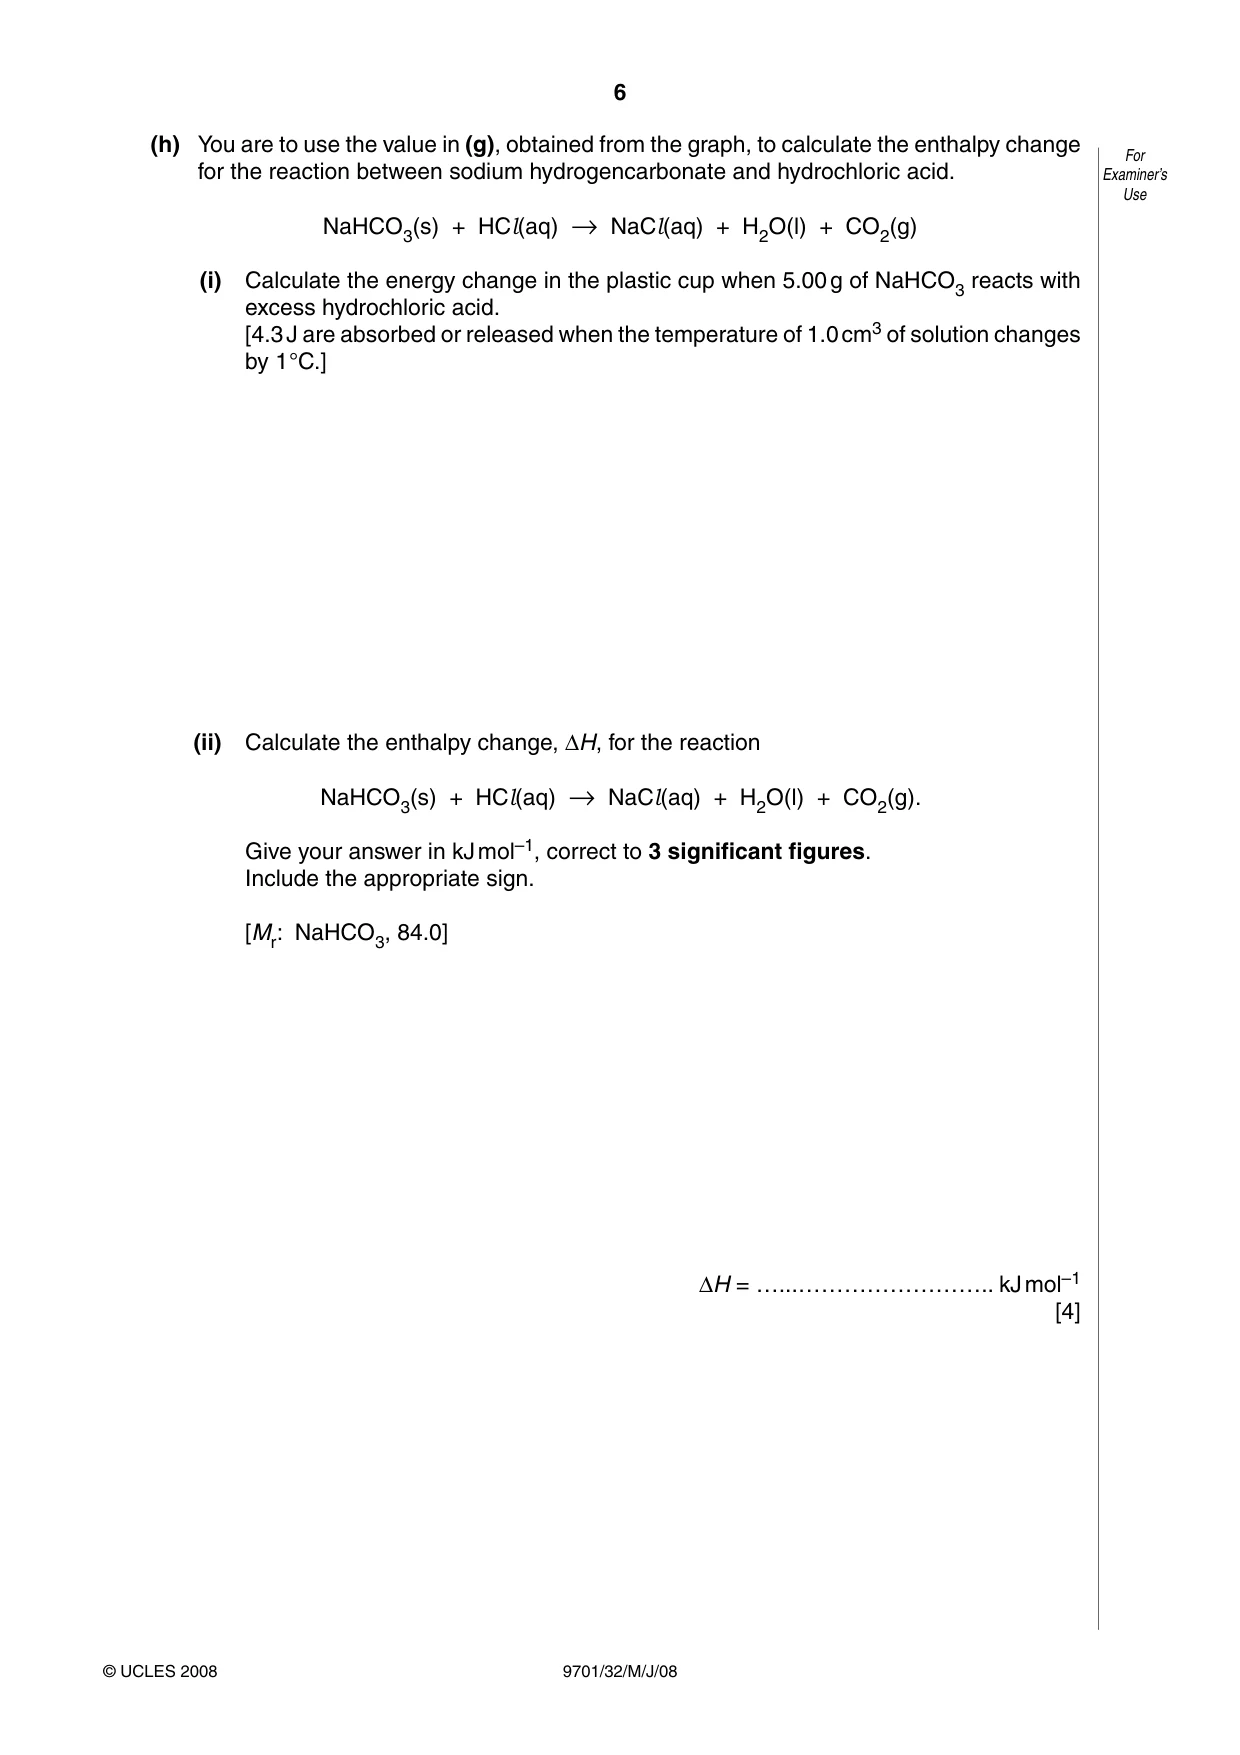
6 © UCLES 2008 For Examiner’s Use 9701/32/M/J/08 (h) You are to use the value in (g), obtained from the graph, to calculate the enthalpy change for the reaction between sodium hydrogencarbonate and hydrochloric acid. NaHCO3(s) + HCl(aq) → NaCl(aq) + H2O(l) + CO2(g) (i) Calculate the energy change in the plastic cup when 5.00 g of NaHCO3 reacts with excess hydrochloric acid. [4.3 J are absorbed or released when the temperature of 1.0 cm3 of solution changes by 1 °C.] (ii) Calculate the enthalpy change, ∆H, for the reaction NaHCO3(s) + HCl(aq) → NaCl(aq) + H2O(l) + CO2(g). Give your answer in kJ mol–1, correct to 3 significant figures. Include the appropriate sign. [Mr: NaHCO3, 84.0] ∆H = …...…………………….. kJ mol–1 [4]
Question paper, page 7
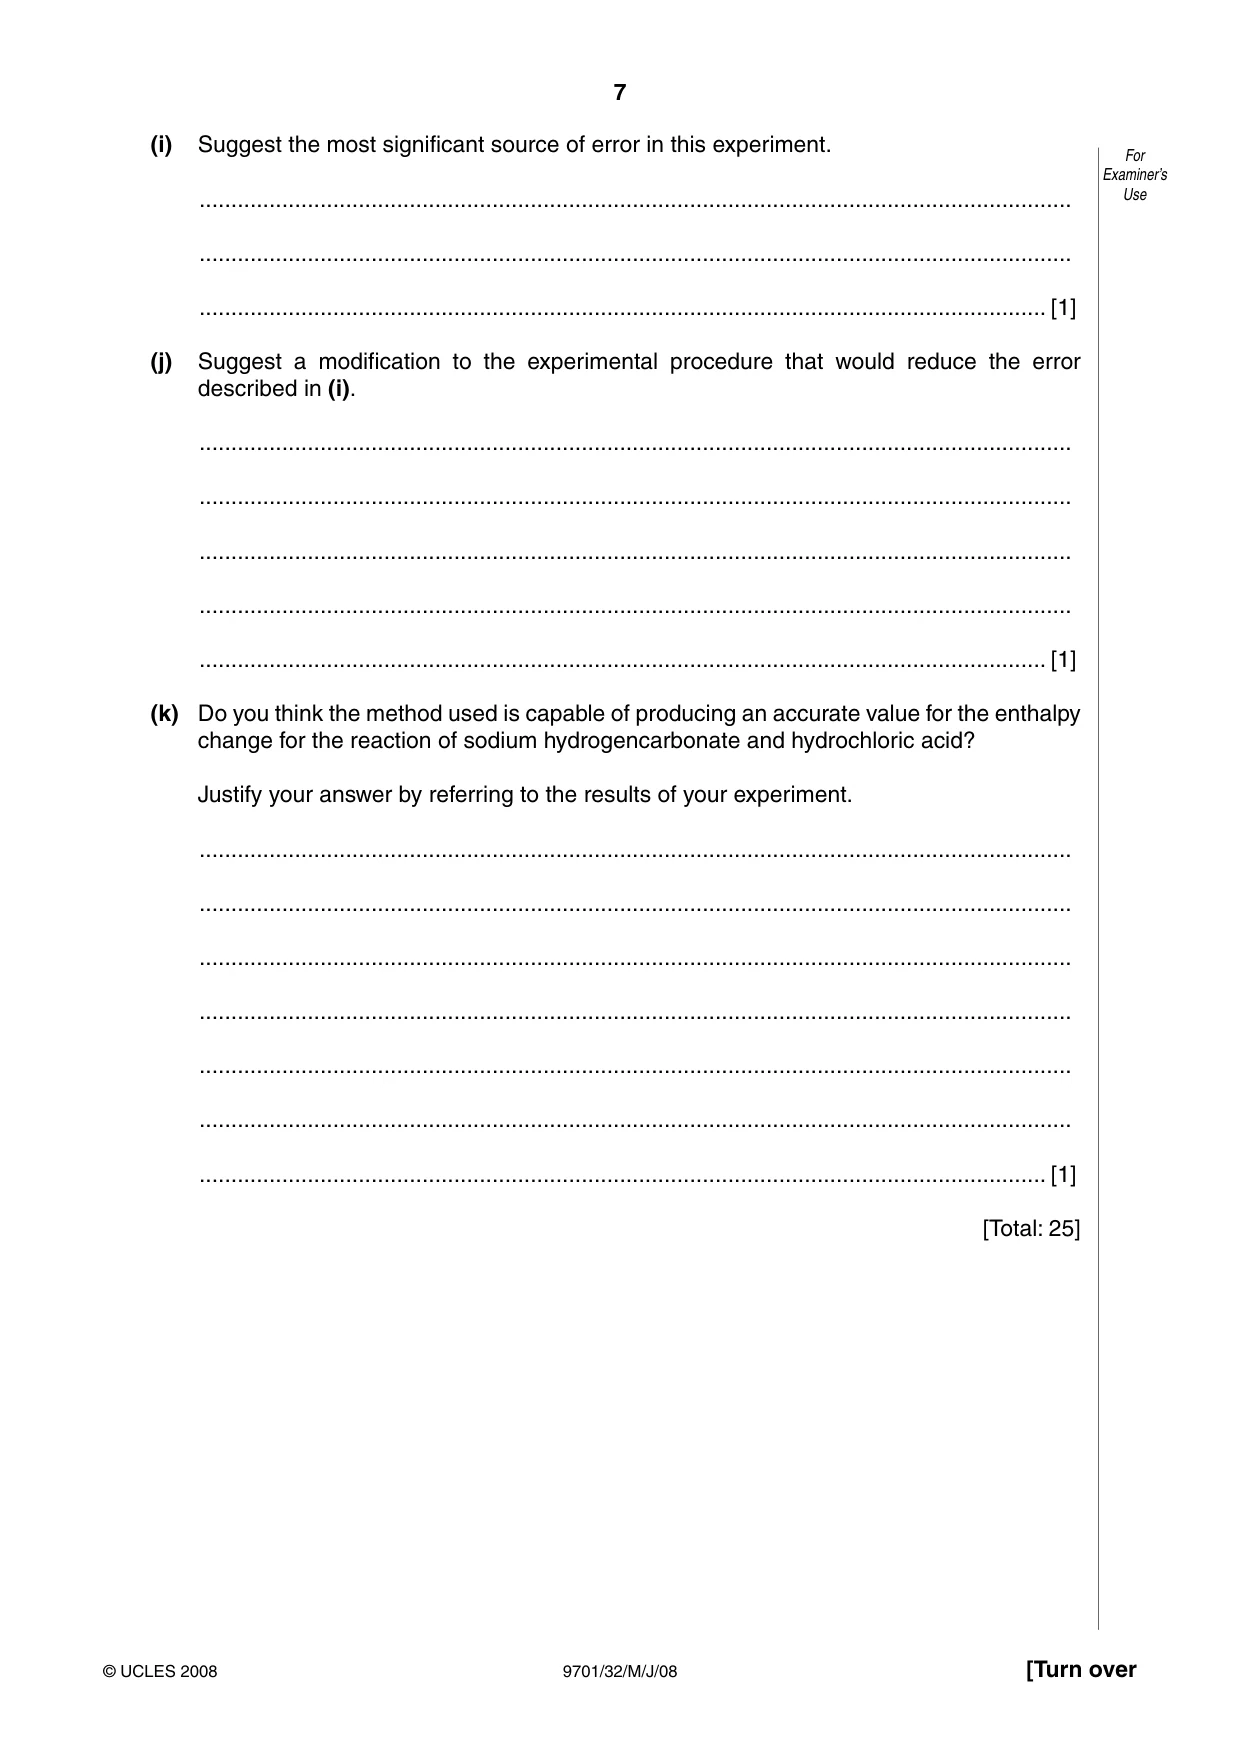
7 © UCLES 2008 [Turn over For Examiner’s Use 9701/32/M/J/08 (i) Suggest the most significant source of error in this experiment. … … … [1] (j) Suggest a modification to the experimental procedure that would reduce the error described in (i). … … … … … [1] (k) Do you think the method used is capable of producing an accurate value for the enthalpy change for the reaction of sodium hydrogencarbonate and hydrochloric acid? Justify your answer by referring to the results of your experiment. … … … … … … … [1] [Total: 25]
Question paper, page 8
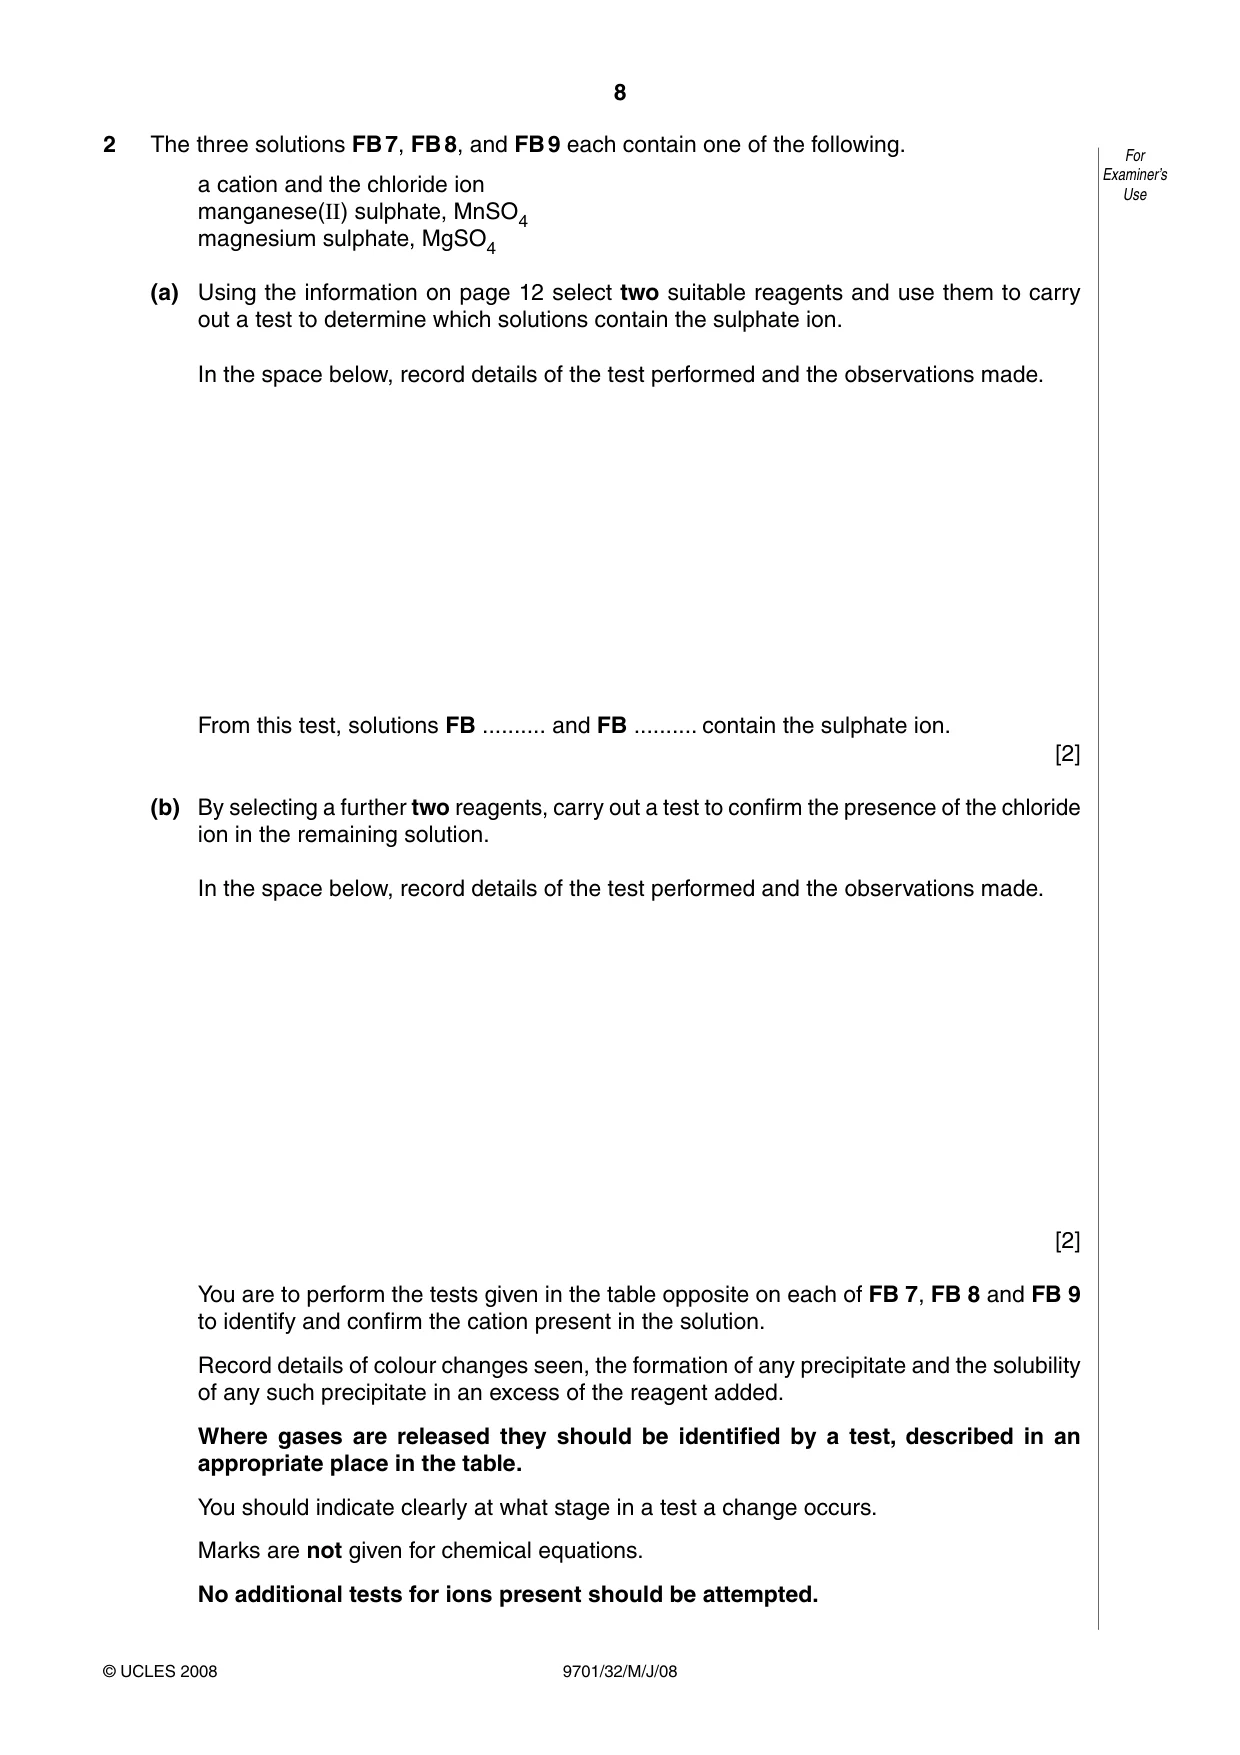
8 © UCLES 2008 For Examiner’s Use 9701/32/M/J/08 2 The three solutions FB 7, FB 8, and FB 9 each contain one of the following. a cation and the chloride ion manganese(II) sulphate, MnSO4 magnesium sulphate, MgSO4 (a) Using the information on page 12 select two suitable reagents and use them to carry out a test to determine which solutions contain the sulphate ion. In the space below, record details of the test performed and the observations made. From this test, solutions FB … and FB … contain the sulphate ion. [2] (b) By selecting a further two reagents, carry out a test to confirm the presence of the chloride ion in the remaining solution. In the space below, record details of the test performed and the observations made. [2] You are to perform the tests given in the table opposite on each of FB 7, FB 8 and FB 9 to identify and confirm the cation present in the solution. Record details of colour changes seen, the formation of any precipitate and the solubility of any such precipitate in an excess of the reagent added. Where gases are released they should be identified by a test, described in an appropriate place in the table. You should indicate clearly at what stage in a test a change occurs. Marks are not given for chemical equations. No additional tests for ions present should be attempted.
Question paper, page 9
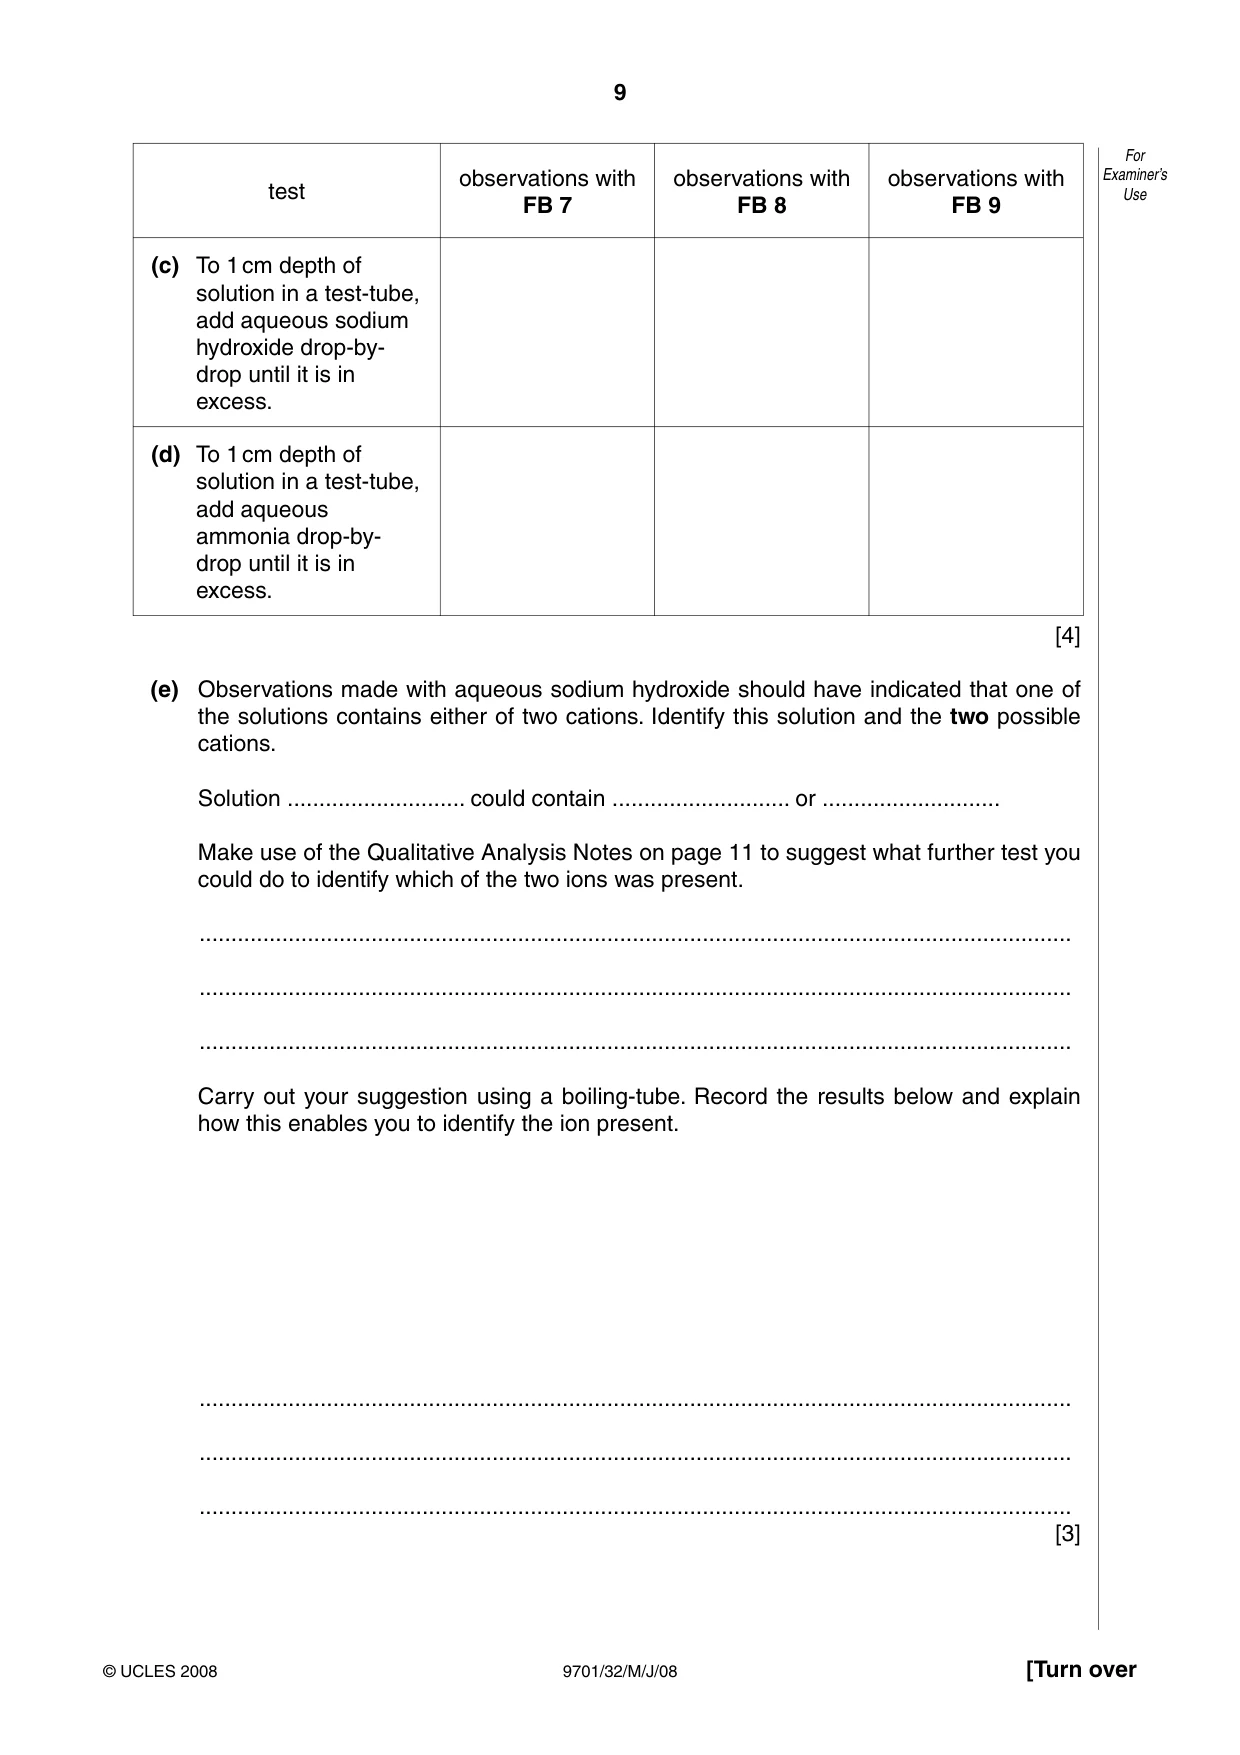
9 © UCLES 2008 [Turn over For Examiner’s Use 9701/32/M/J/08 test observations with FB 7 observations with FB 8 observations with FB 9 (c) To 1 cm depth of solution in a test-tube, add aqueous sodium hydroxide drop-by- drop until it is in excess. (d) To 1 cm depth of solution in a test-tube, add aqueous ammonia drop-by- drop until it is in excess. [4] (e) Observations made with aqueous sodium hydroxide should have indicated that one of the solutions contains either of two cations. Identify this solution and the two possible cations. Solution … could contain … or … Make use of the Qualitative Analysis Notes on page 11 to suggest what further test you could do to identify which of the two ions was present. … … … Carry out your suggestion using a boiling-tube. Record the results below and explain how this enables you to identify the ion present. … … … [3]
Question paper, page 10
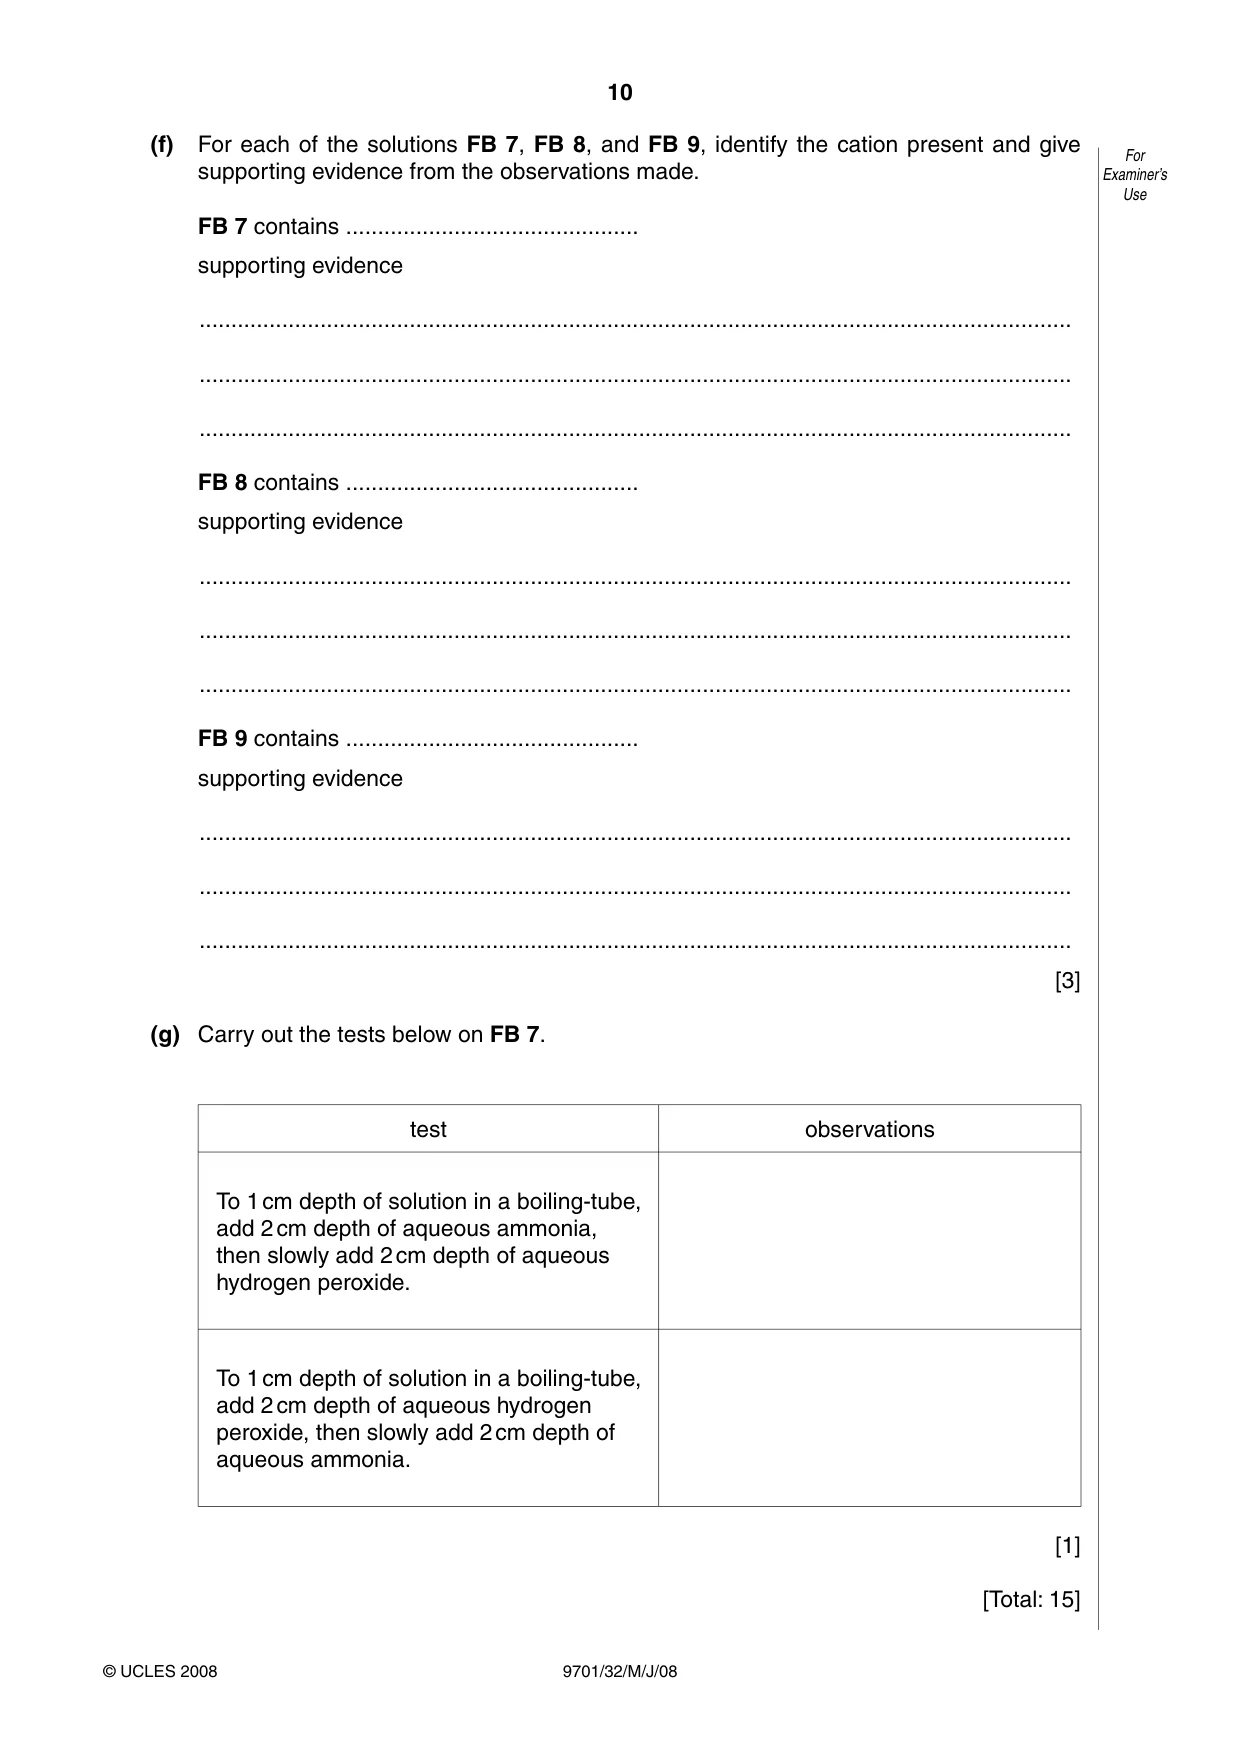
10 © UCLES 2008 For Examiner’s Use 9701/32/M/J/08 (f) For each of the solutions FB 7, FB 8, and FB 9, identify the cation present and give supporting evidence from the observations made. FB 7 contains … supporting evidence … … … FB 8 contains … supporting evidence … … … FB 9 contains … supporting evidence … … … [3] (g) Carry out the tests below on FB 7. test observations To 1 cm depth of solution in a boiling-tube, add 2 cm depth of aqueous ammonia, then slowly add 2 cm depth of aqueous hydrogen peroxide. To 1 cm depth of solution in a boiling-tube, add 2 cm depth of aqueous hydrogen peroxide, then slowly add 2 cm depth of aqueous ammonia. [1] [Total: 15]
Question paper, page 11
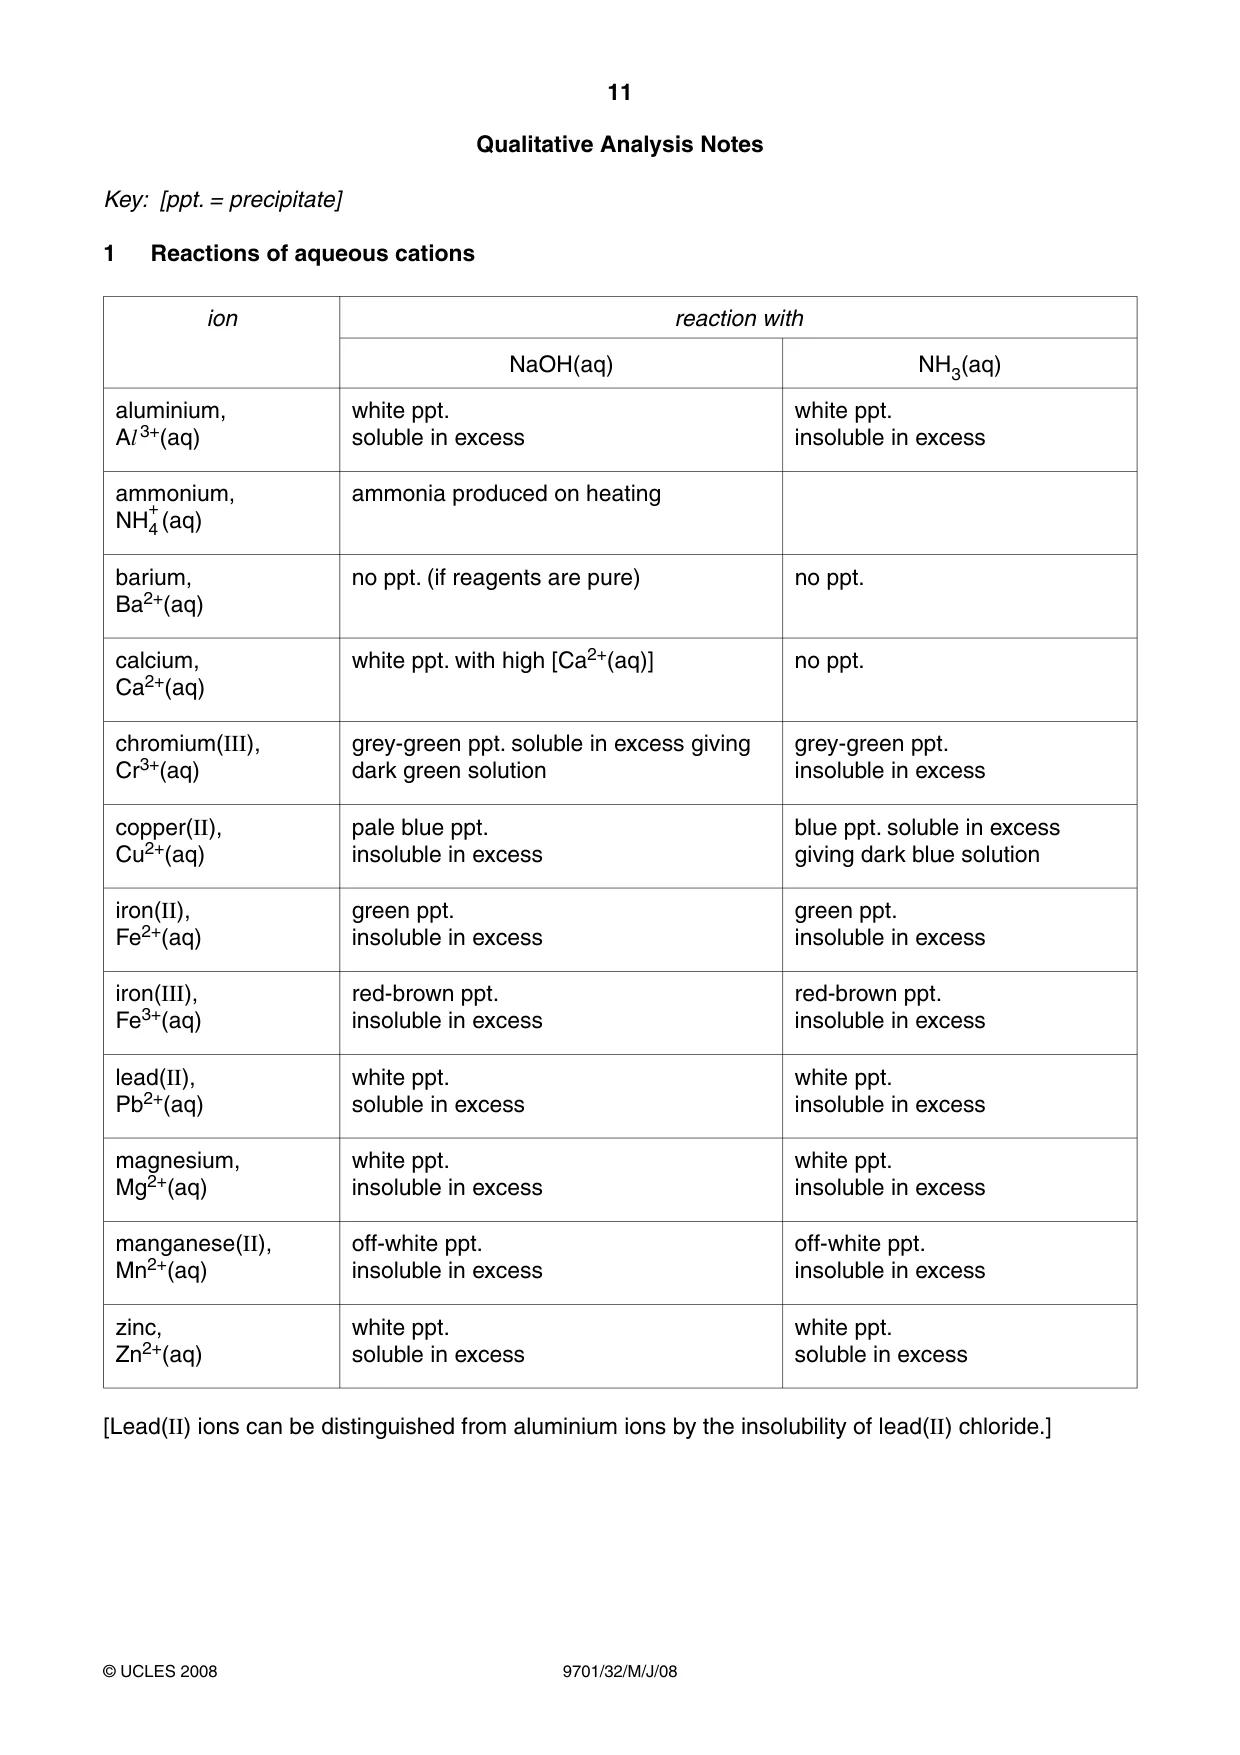
11 9701/32/M/J/08 © UCLES 2008 Qualitative Analysis Notes Key: [ppt. = precipitate] 1 Reactions of aqueous cations ion reaction with NaOH(aq) NH3(aq) aluminium, Al 3+(aq) white ppt. soluble in excess white ppt. insoluble in excess ammonium, NH + 4(aq) ammonia produced on heating barium, Ba2+(aq) no ppt. (if reagents are pure) no ppt. calcium, Ca2+(aq) white ppt. with high [Ca2+(aq)] no ppt. chromium(III), Cr3+(aq) grey-green ppt. soluble in excess giving dark green solution grey-green ppt. insoluble in excess copper(II), Cu2+(aq) pale blue ppt. insoluble in excess blue ppt. soluble in excess giving dark blue solution iron(II), Fe2+(aq) green ppt. insoluble in excess green ppt. insoluble in excess iron(III), Fe3+(aq) red-brown ppt. insoluble in excess red-brown ppt. insoluble in excess lead(II), Pb2+(aq) white ppt. soluble in excess white ppt. insoluble in excess magnesium, Mg2+(aq) white ppt. insoluble in excess white ppt. insoluble in excess manganese(II), Mn2+(aq) off-white ppt. insoluble in excess off-white ppt. insoluble in excess zinc, Zn2+(aq) white ppt. soluble in excess white ppt. soluble in excess [Lead(II) ions can be distinguished from aluminium ions by the insolubility of lead(II) chloride.]
Question paper, page 12
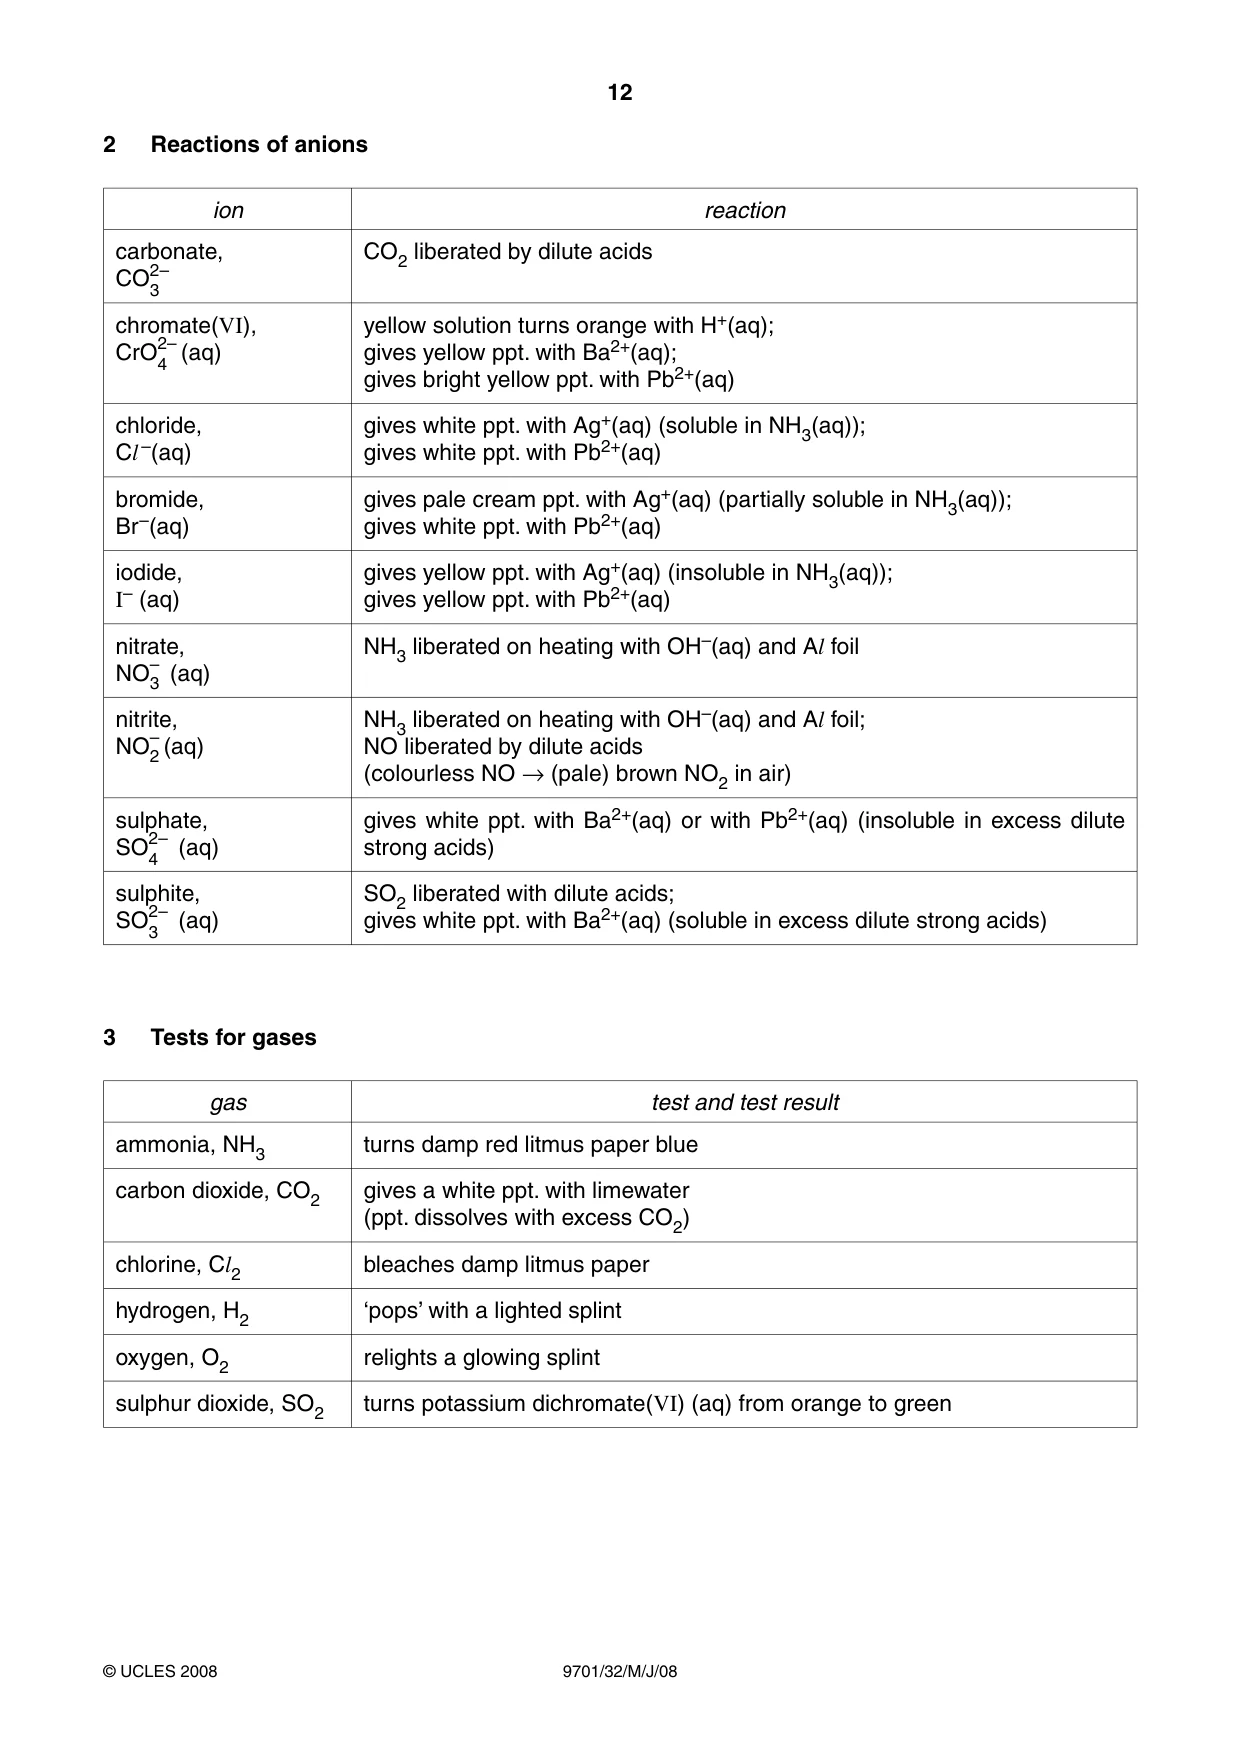
12 9701/32/M/J/08 © UCLES 2008 2 Reactions of anions ion reaction carbonate, CO2– 3 CO2 liberated by dilute acids chromate(VI), CrO2– 4 (aq) yellow solution turns orange with H+(aq); gives yellow ppt. with Ba2+(aq); gives bright yellow ppt. with Pb2+(aq) chloride, Cl –(aq) gives white ppt. with Ag+(aq) (soluble in NH3(aq)); gives white ppt. with Pb2+(aq) bromide, Br –(aq) gives pale cream ppt. with Ag+(aq) (partially soluble in NH3(aq)); gives white ppt. with Pb2+(aq) iodide, I– (aq) gives yellow ppt. with Ag+(aq) (insoluble in NH3(aq)); gives yellow ppt. with Pb2+(aq) nitrate, NO– 3 (aq) NH3 liberated on heating with OH–(aq) and Al foil nitrite, NO– 2 (aq) NH3 liberated on heating with OH–(aq) and Al foil; NO liberated by dilute acids (colourless NO → (pale) brown NO2 in air) sulphate, SO2– 4 (aq) gives white ppt. with Ba2+(aq) or with Pb2+(aq) (insoluble in excess dilute strong acids) sulphite, SO2– 3 (aq) SO2 liberated with dilute acids; gives white ppt. with Ba2+(aq) (soluble in excess dilute strong acids) 3 Tests for gases gas test and test result ammonia, NH3 turns damp red litmus paper blue carbon dioxide, CO2 gives a white ppt. with limewater (ppt. dissolves with excess CO2) chlorine, Cl2 bleaches damp litmus paper hydrogen, H2 ‘pops’ with a lighted splint oxygen, O2 relights a glowing splint sulphur dioxide, SO2 turns potassium dichromate(VI) (aq) from orange to green
Mark scheme, page 1
UNIVERSITY OF CAMBRIDGE INTERNATIONAL EXAMINATIONS GCE Advanced Subsidiary Level and GCE Advanced Level MARK SCHEME for the May/June 2008 question paper 9701 CHEMISTRY 9701/32 Paper 32 (Advanced Practical Skills 2), maximum raw mark 40 Mark schemes must be read in conjunction with the question papers and the report on the examination. • CIE will not enter into discussions or correspondence in connection with these mark schemes. CIE is publishing the mark schemes for the May/June 2008 question papers for most IGCSE, GCE Advanced Level and Advanced Subsidiary Level syllabuses and some Ordinary Level syllabuses.
Mark scheme, page 2
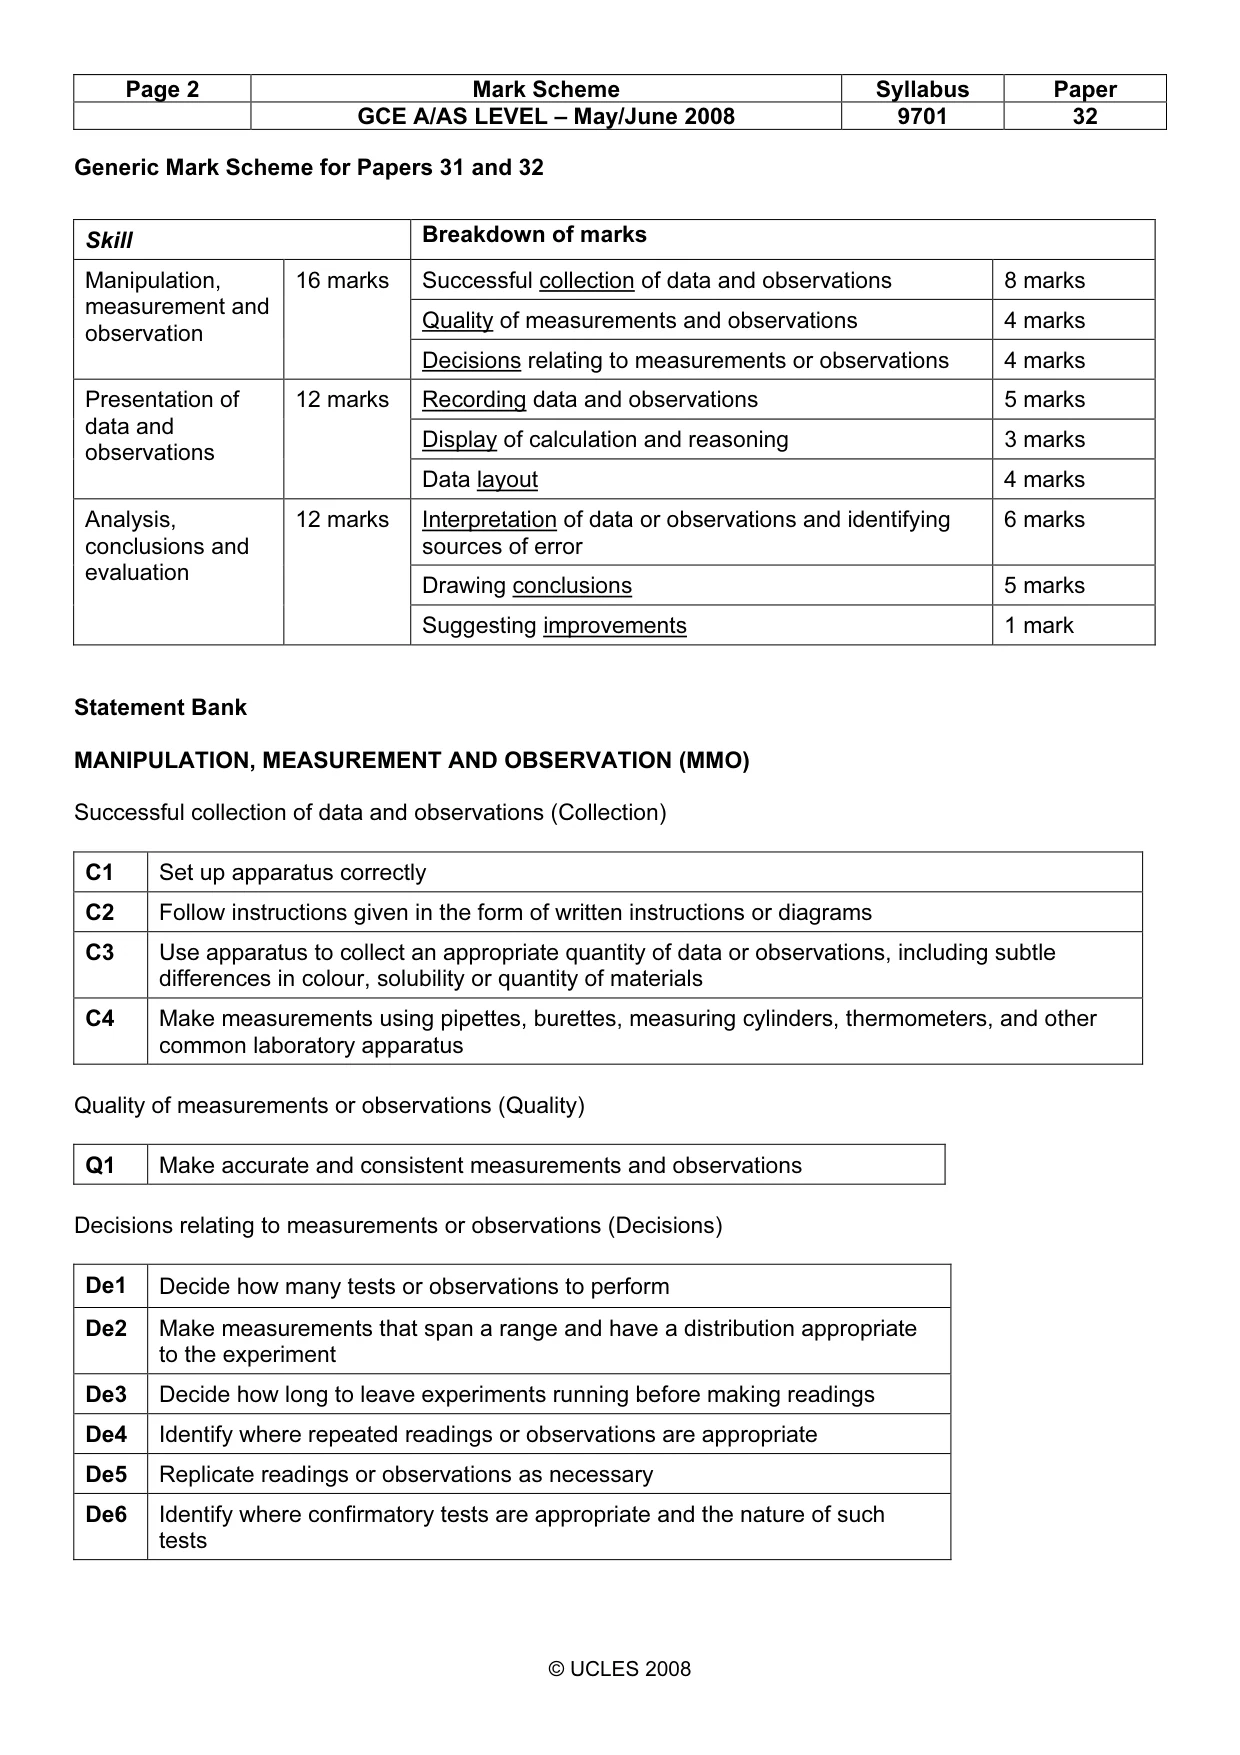
Page 2 Mark Scheme Syllabus Paper GCE A/AS LEVEL – May/June 2008 9701 32 © UCLES 2008 Generic Mark Scheme for Papers 31 and 32 Statement Bank MANIPULATION, MEASUREMENT AND OBSERVATION (MMO) Successful collection of data and observations (Collection) C1 Set up apparatus correctly C2 Follow instructions given in the form of written instructions or diagrams C3 Use apparatus to collect an appropriate quantity of data or observations, including subtle differences in colour, solubility or quantity of materials C4 Make measurements using pipettes, burettes, measuring cylinders, thermometers, and other common laboratory apparatus Quality of measurements or observations (Quality) Q1 Make accurate and consistent measurements and observations Decisions relating to measurements or observations (Decisions) De1 Decide how many tests or observations to perform De2 Make measurements that span a range and have a distribution appropriate to the experiment De3 Decide how long to leave experiments running before making readings De4 Identify where repeated readings or observations are appropriate De5 Replicate readings or observations as necessary De6 Identify where confirmatory tests are appropriate and the nature of such tests Skill Breakdown of marks Successful collection of data and observations 8 marks Quality of measurements and observations 4 marks Manipulation, measurement and observation 16 marks Decisions relating to measurements or observations 4 marks Recording data and observations 5 marks Display of calculation and reasoning 3 marks Presentation of data and observations 12 marks Data layout 4 marks Interpretation of data or observations and identifying sources of error 6 marks Drawing conclusions 5 marks Analysis, conclusions and evaluation 12 marks Suggesting improvements 1 mark
Mark scheme, page 3
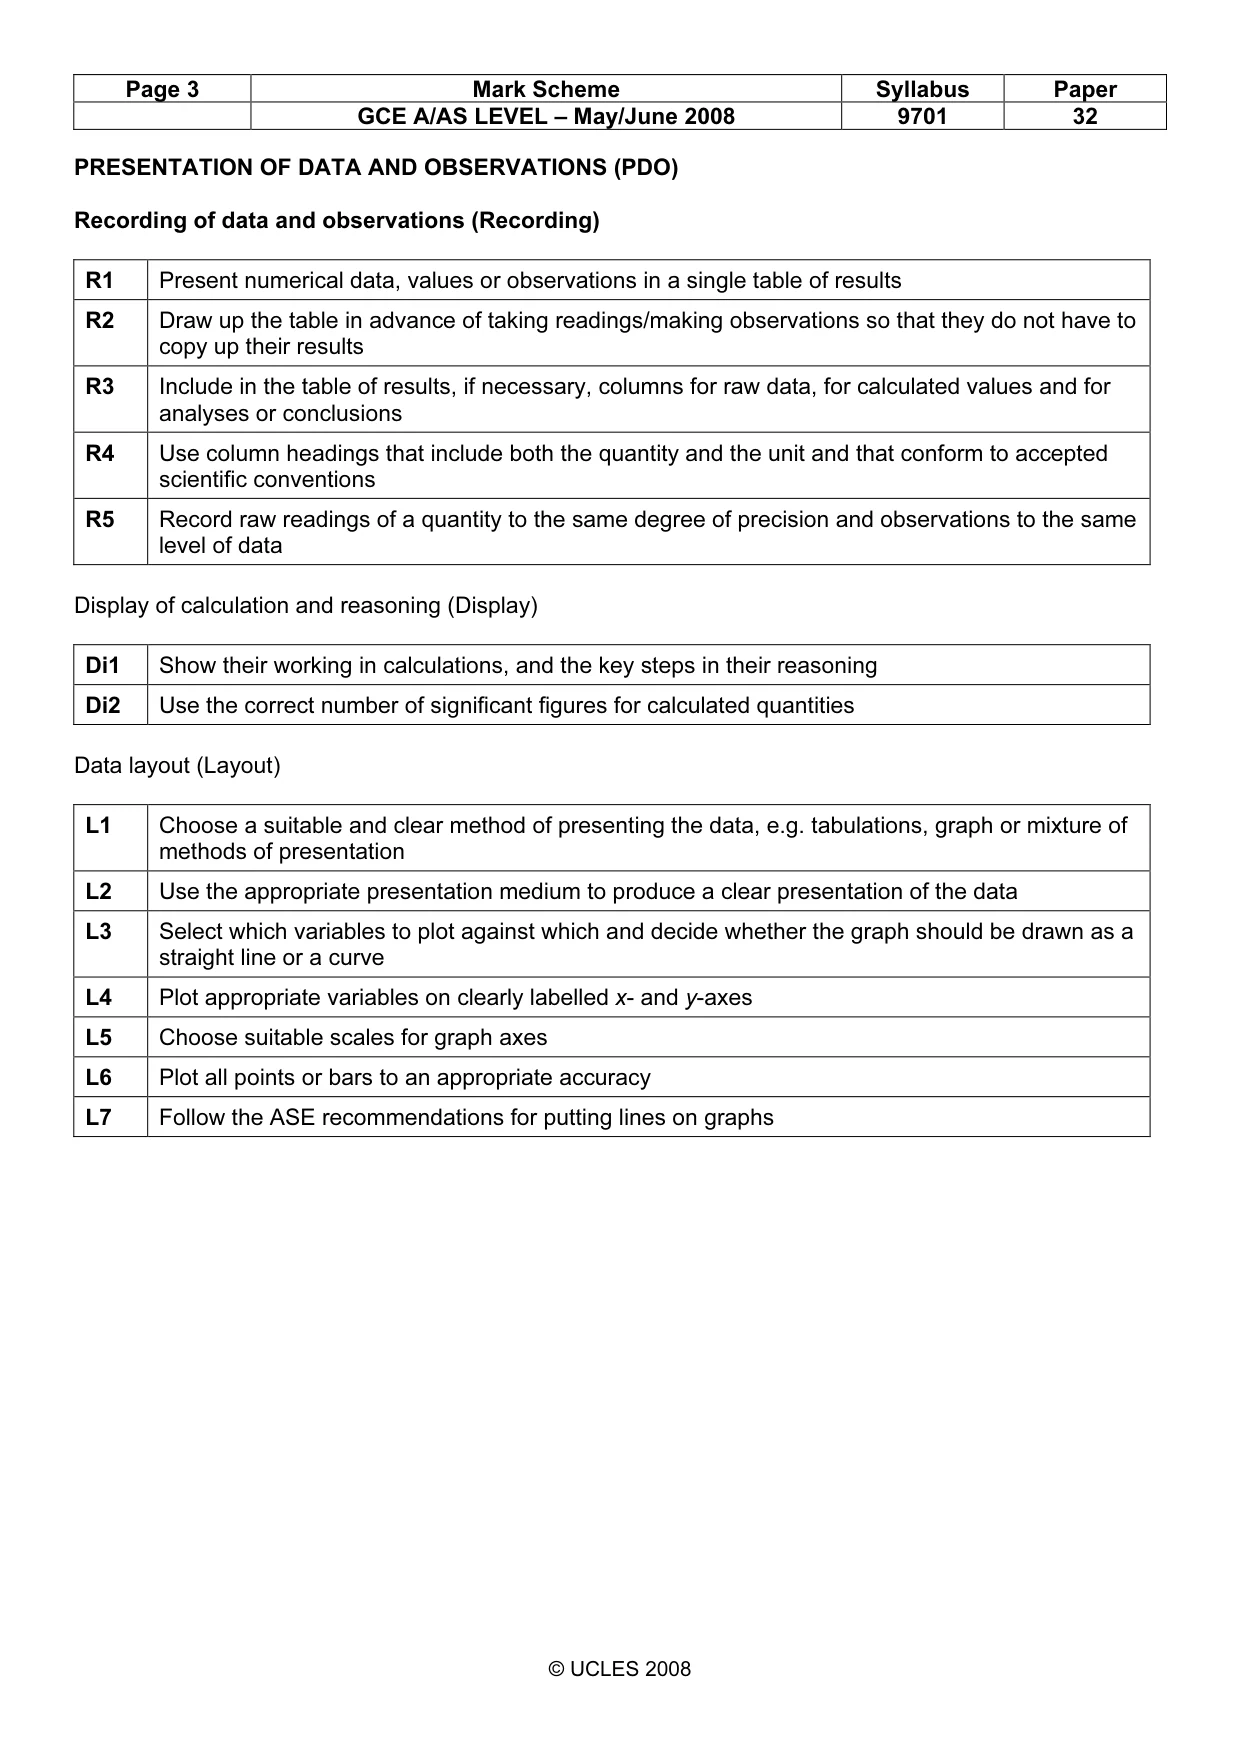
Page 3 Mark Scheme Syllabus Paper GCE A/AS LEVEL – May/June 2008 9701 32 © UCLES 2008 PRESENTATION OF DATA AND OBSERVATIONS (PDO) Recording of data and observations (Recording) R1 Present numerical data, values or observations in a single table of results R2 Draw up the table in advance of taking readings/making observations so that they do not have to copy up their results R3 Include in the table of results, if necessary, columns for raw data, for calculated values and for analyses or conclusions R4 Use column headings that include both the quantity and the unit and that conform to accepted scientific conventions R5 Record raw readings of a quantity to the same degree of precision and observations to the same level of data Display of calculation and reasoning (Display) Di1 Show their working in calculations, and the key steps in their reasoning Di2 Use the correct number of significant figures for calculated quantities Data layout (Layout) L1 Choose a suitable and clear method of presenting the data, e.g. tabulations, graph or mixture of methods of presentation L2 Use the appropriate presentation medium to produce a clear presentation of the data L3 Select which variables to plot against which and decide whether the graph should be drawn as a straight line or a curve L4 Plot appropriate variables on clearly labelled x- and y-axes L5 Choose suitable scales for graph axes L6 Plot all points or bars to an appropriate accuracy L7 Follow the ASE recommendations for putting lines on graphs
Mark scheme, page 4
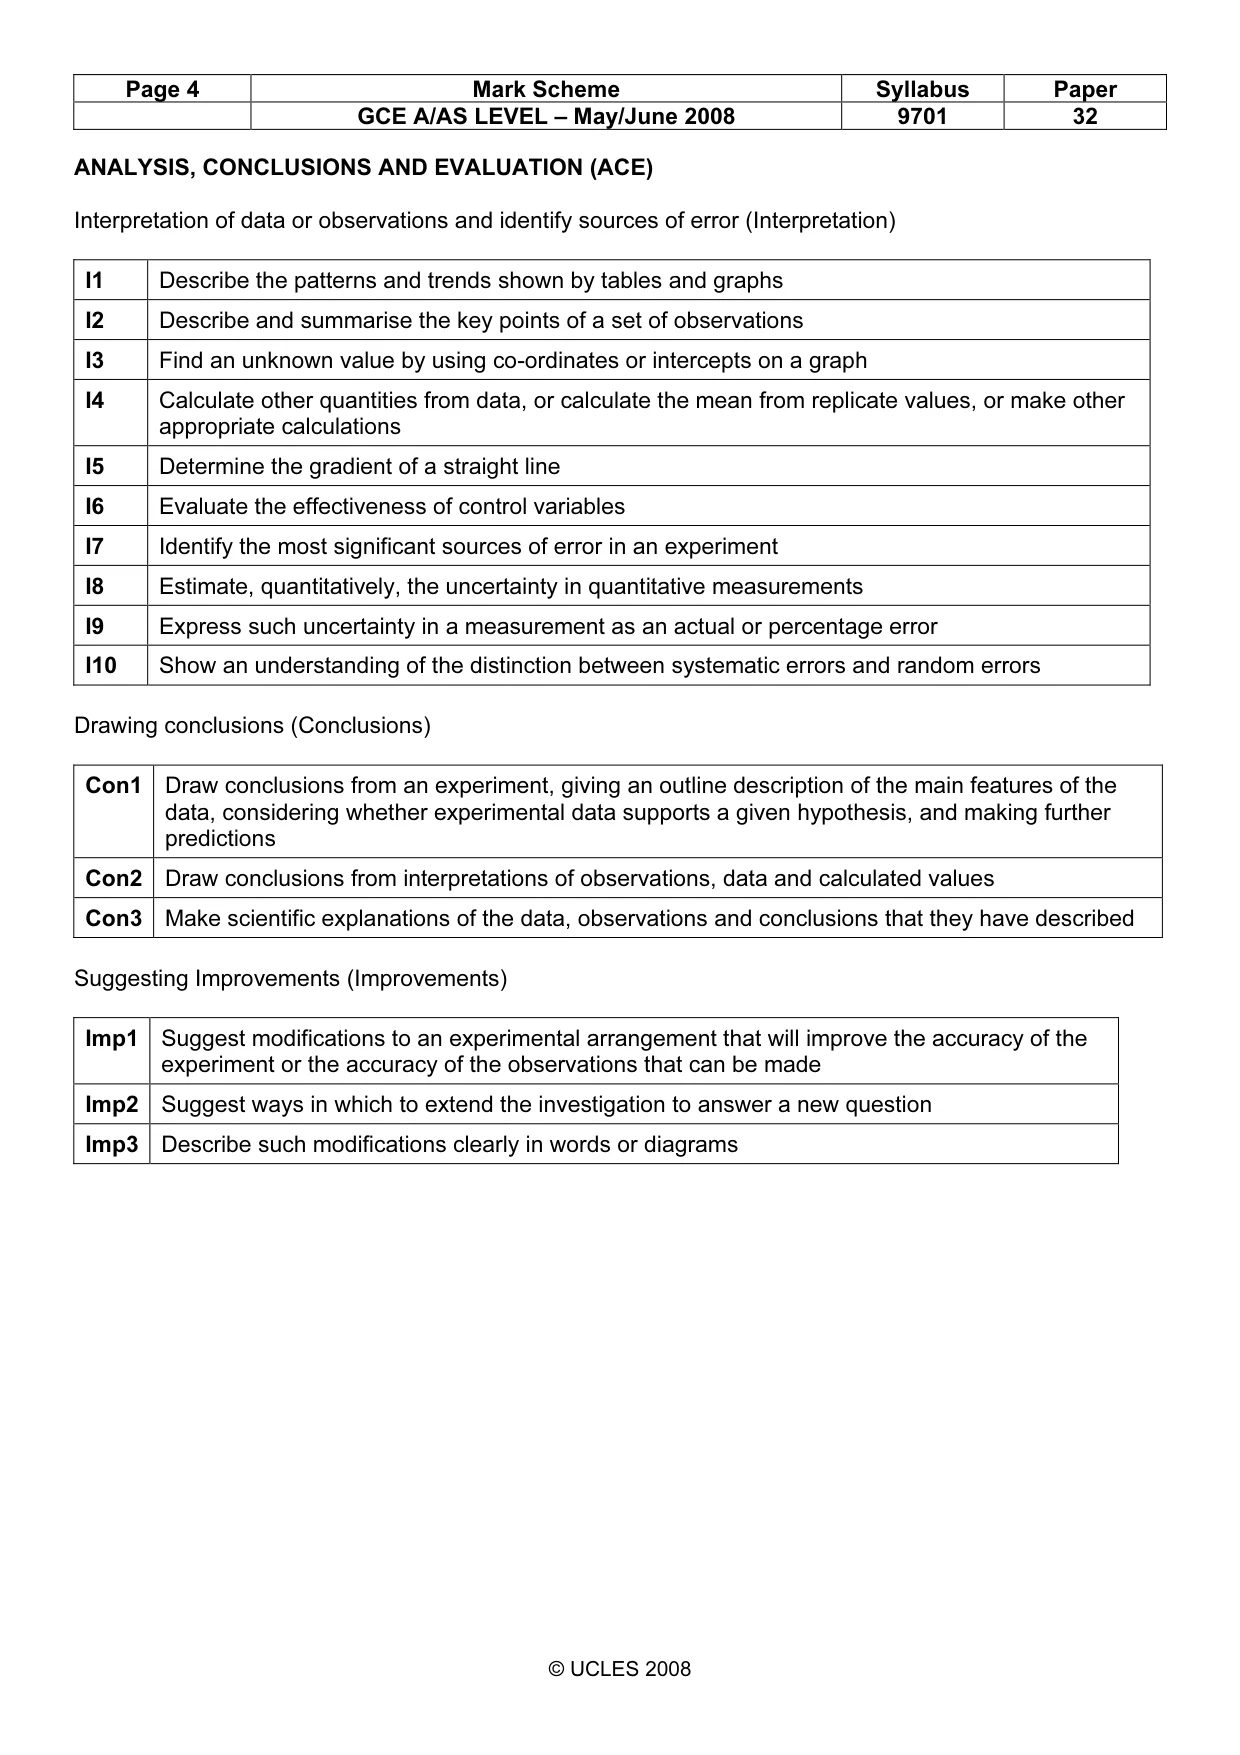
Page 4 Mark Scheme Syllabus Paper GCE A/AS LEVEL – May/June 2008 9701 32 © UCLES 2008 ANALYSIS, CONCLUSIONS AND EVALUATION (ACE) Interpretation of data or observations and identify sources of error (Interpretation) I1 Describe the patterns and trends shown by tables and graphs I2 Describe and summarise the key points of a set of observations I3 Find an unknown value by using co-ordinates or intercepts on a graph I4 Calculate other quantities from data, or calculate the mean from replicate values, or make other appropriate calculations I5 Determine the gradient of a straight line I6 Evaluate the effectiveness of control variables I7 Identify the most significant sources of error in an experiment I8 Estimate, quantitatively, the uncertainty in quantitative measurements I9 Express such uncertainty in a measurement as an actual or percentage error I10 Show an understanding of the distinction between systematic errors and random errors Drawing conclusions (Conclusions) Con1 Draw conclusions from an experiment, giving an outline description of the main features of the data, considering whether experimental data supports a given hypothesis, and making further predictions Con2 Draw conclusions from interpretations of observations, data and calculated values Con3 Make scientific explanations of the data, observations and conclusions that they have described Suggesting Improvements (Improvements) Imp1 Suggest modifications to an experimental arrangement that will improve the accuracy of the experiment or the accuracy of the observations that can be made Imp2 Suggest ways in which to extend the investigation to answer a new question Imp3 Describe such modifications clearly in words or diagrams
Mark scheme, page 5
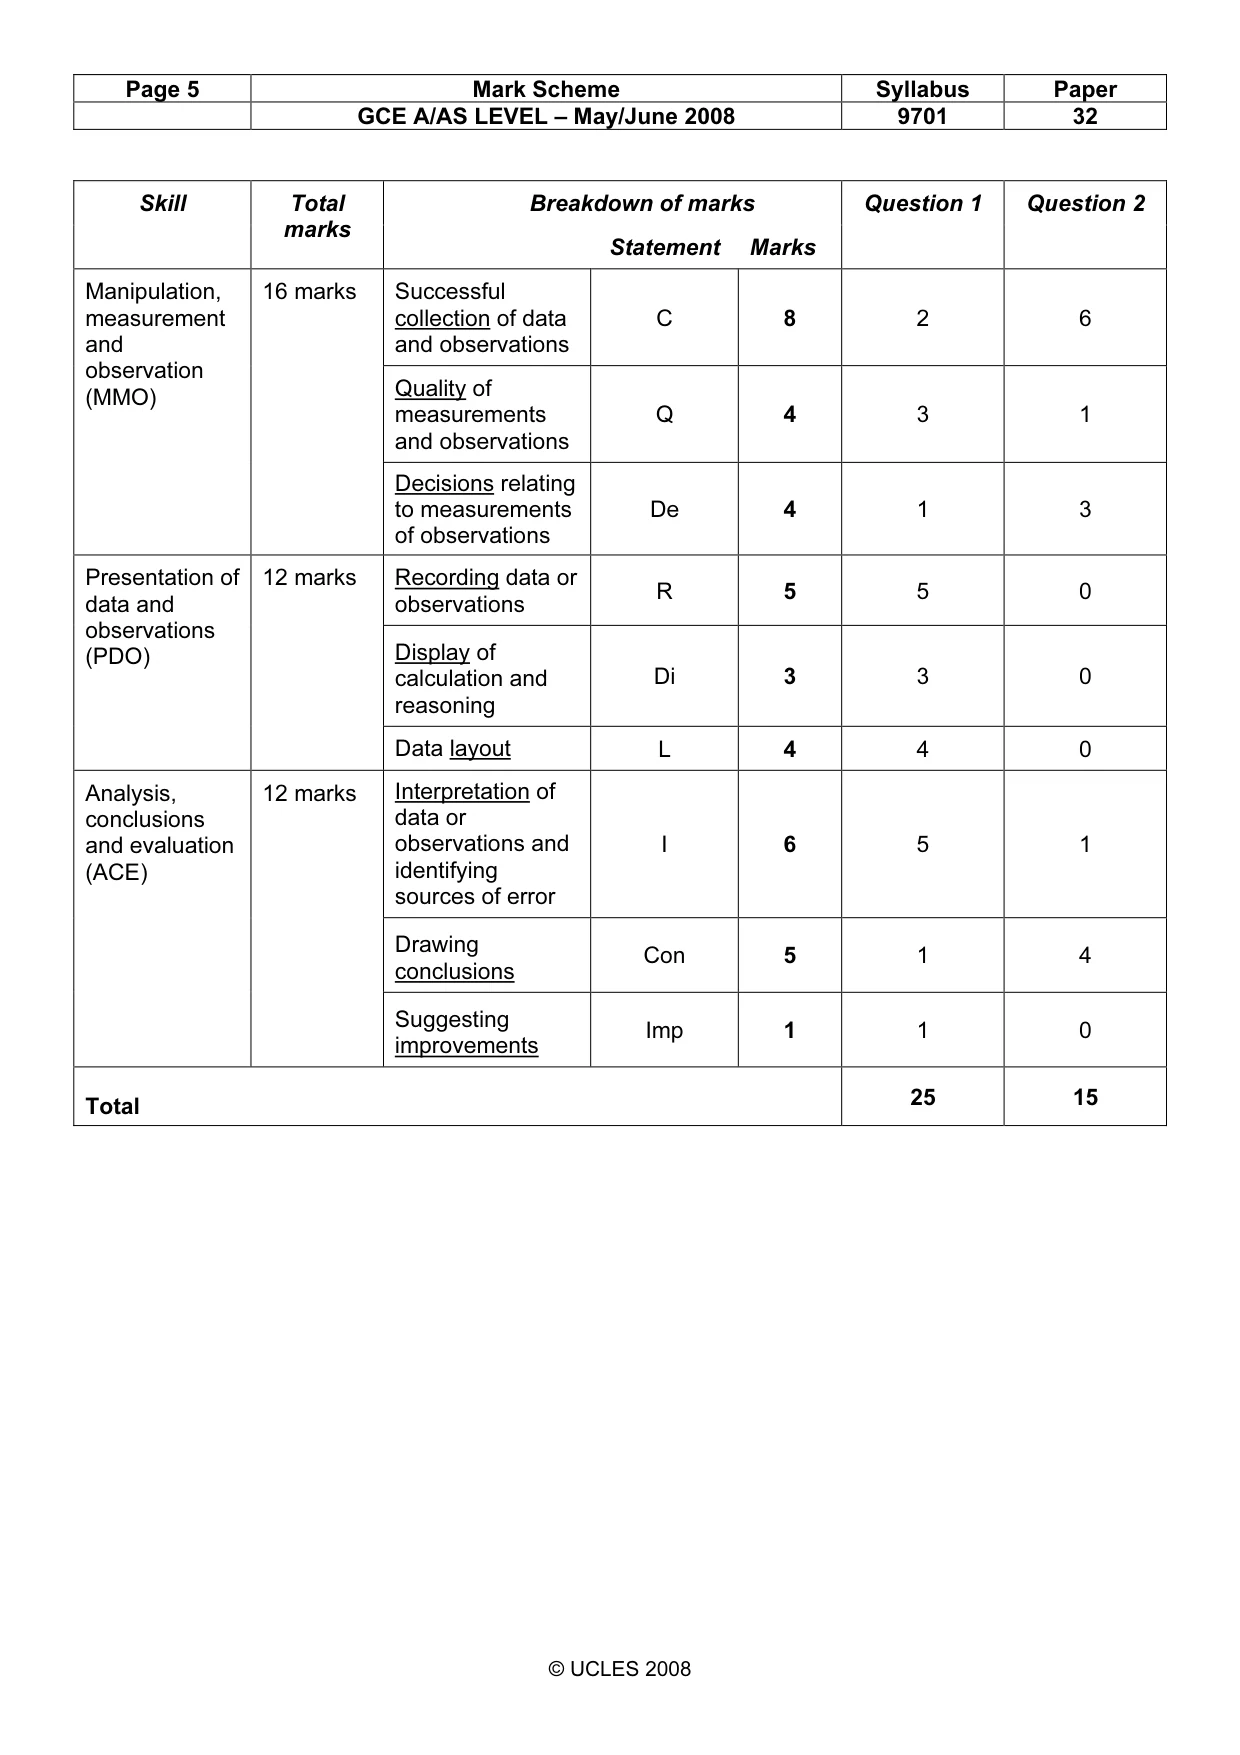
Page 5 Mark Scheme Syllabus Paper GCE A/AS LEVEL – May/June 2008 9701 32 © UCLES 2008 Breakdown of marks Question 1 Question 2 Skill Total marks Statement Marks Successful collection of data and observations C 8 2 6 Quality of measurements and observations Q 4 3 1 Manipulation, measurement and observation (MMO) 16 marks Decisions relating to measurements of observations De 4 1 3 Recording data or observations R 5 5 0 Display of calculation and reasoning Di 3 3 0 Presentation of data and observations (PDO) 12 marks Data layout L 4 4 0 Interpretation of data or observations and identifying sources of error I 6 5 1 Drawing conclusions Con 5 1 4 Analysis, conclusions and evaluation (ACE) 12 marks Suggesting improvements Imp 1 1 0 Total 25 15
Mark scheme, page 6
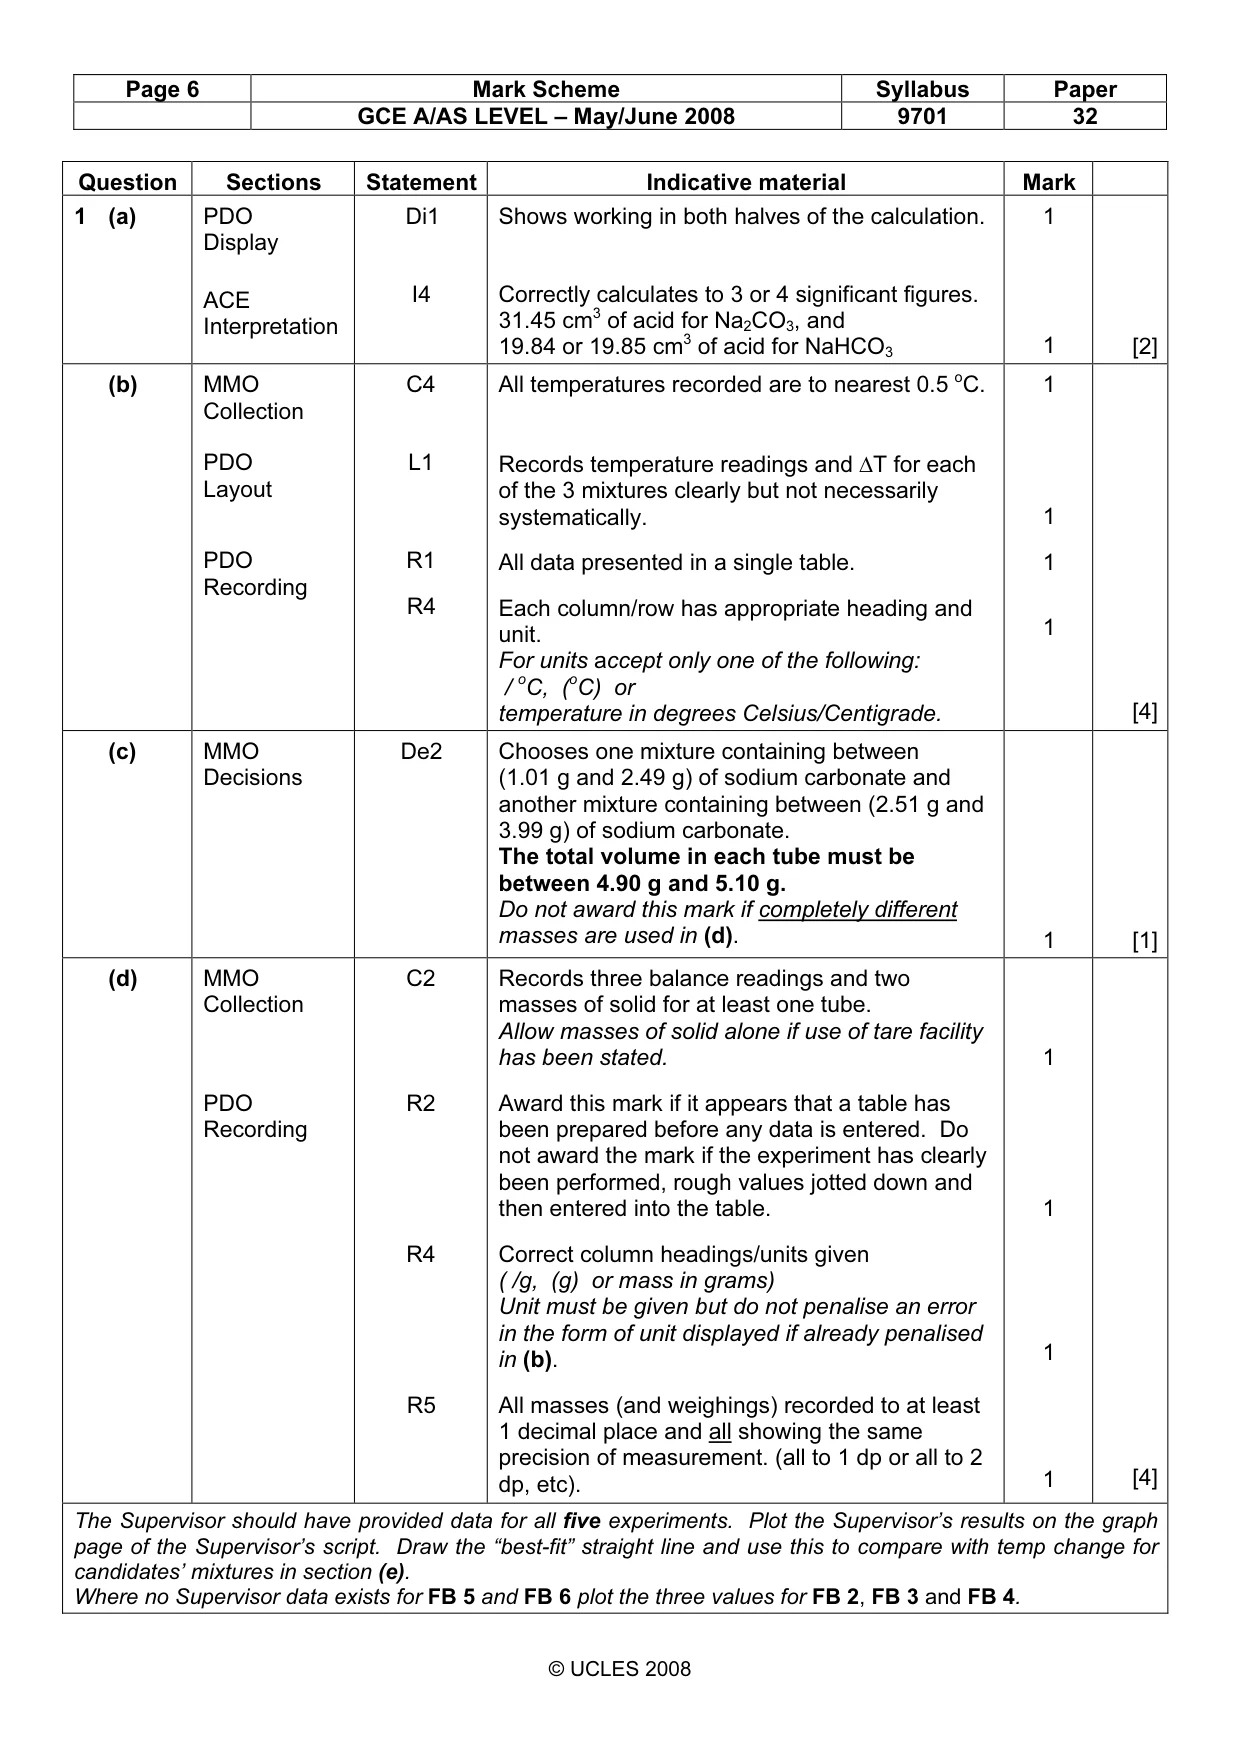
Page 6 Mark Scheme Syllabus Paper GCE A/AS LEVEL – May/June 2008 9701 32 © UCLES 2008 Question Sections Statement Indicative material Mark 1 (a) PDO Display ACE Interpretation Di1 I4 Shows working in both halves of the calculation. Correctly calculates to 3 or 4 significant figures. 31.45 cm3 of acid for Na2CO3, and 19.84 or 19.85 cm3 of acid for NaHCO3 1 1 [2] (b) MMO Collection PDO Layout PDO Recording C4 L1 R1 R4 All temperatures recorded are to nearest 0.5 oC. Records temperature readings and ∆T for each of the 3 mixtures clearly but not necessarily systematically. All data presented in a single table. Each column/row has appropriate heading and unit. For units accept only one of the following: / oC, (oC) or temperature in degrees Celsius/Centigrade. 1 1 1 1 [4] (c) MMO Decisions De2 Chooses one mixture containing between (1.01 g and 2.49 g) of sodium carbonate and another mixture containing between (2.51 g and 3.99 g) of sodium carbonate. The total volume in each tube must be between 4.90 g and 5.10 g. Do not award this mark if completely different masses are used in (d). 1 [1] (d) MMO Collection PDO Recording C2 R2 R4 R5 Records three balance readings and two masses of solid for at least one tube. Allow masses of solid alone if use of tare facility has been stated. Award this mark if it appears that a table has been prepared before any data is entered. Do not award the mark if the experiment has clearly been performed, rough values jotted down and then entered into the table. Correct column headings/units given ( /g, (g) or mass in grams) Unit must be given but do not penalise an error in the form of unit displayed if already penalised in (b). All masses (and weighings) recorded to at least 1 decimal place and all showing the same precision of measurement. (all to 1 dp or all to 2 dp, etc). 1 1 1 1 [4] The Supervisor should have provided data for all five experiments. Plot the Supervisor’s results on the graph page of the Supervisor’s script. Draw the “best-fit” straight line and use this to compare with temp change for candidates’ mixtures in section (e). Where no Supervisor data exists for FB 5 and FB 6 plot the three values for FB 2, FB 3 and FB 4.
Mark scheme, page 7
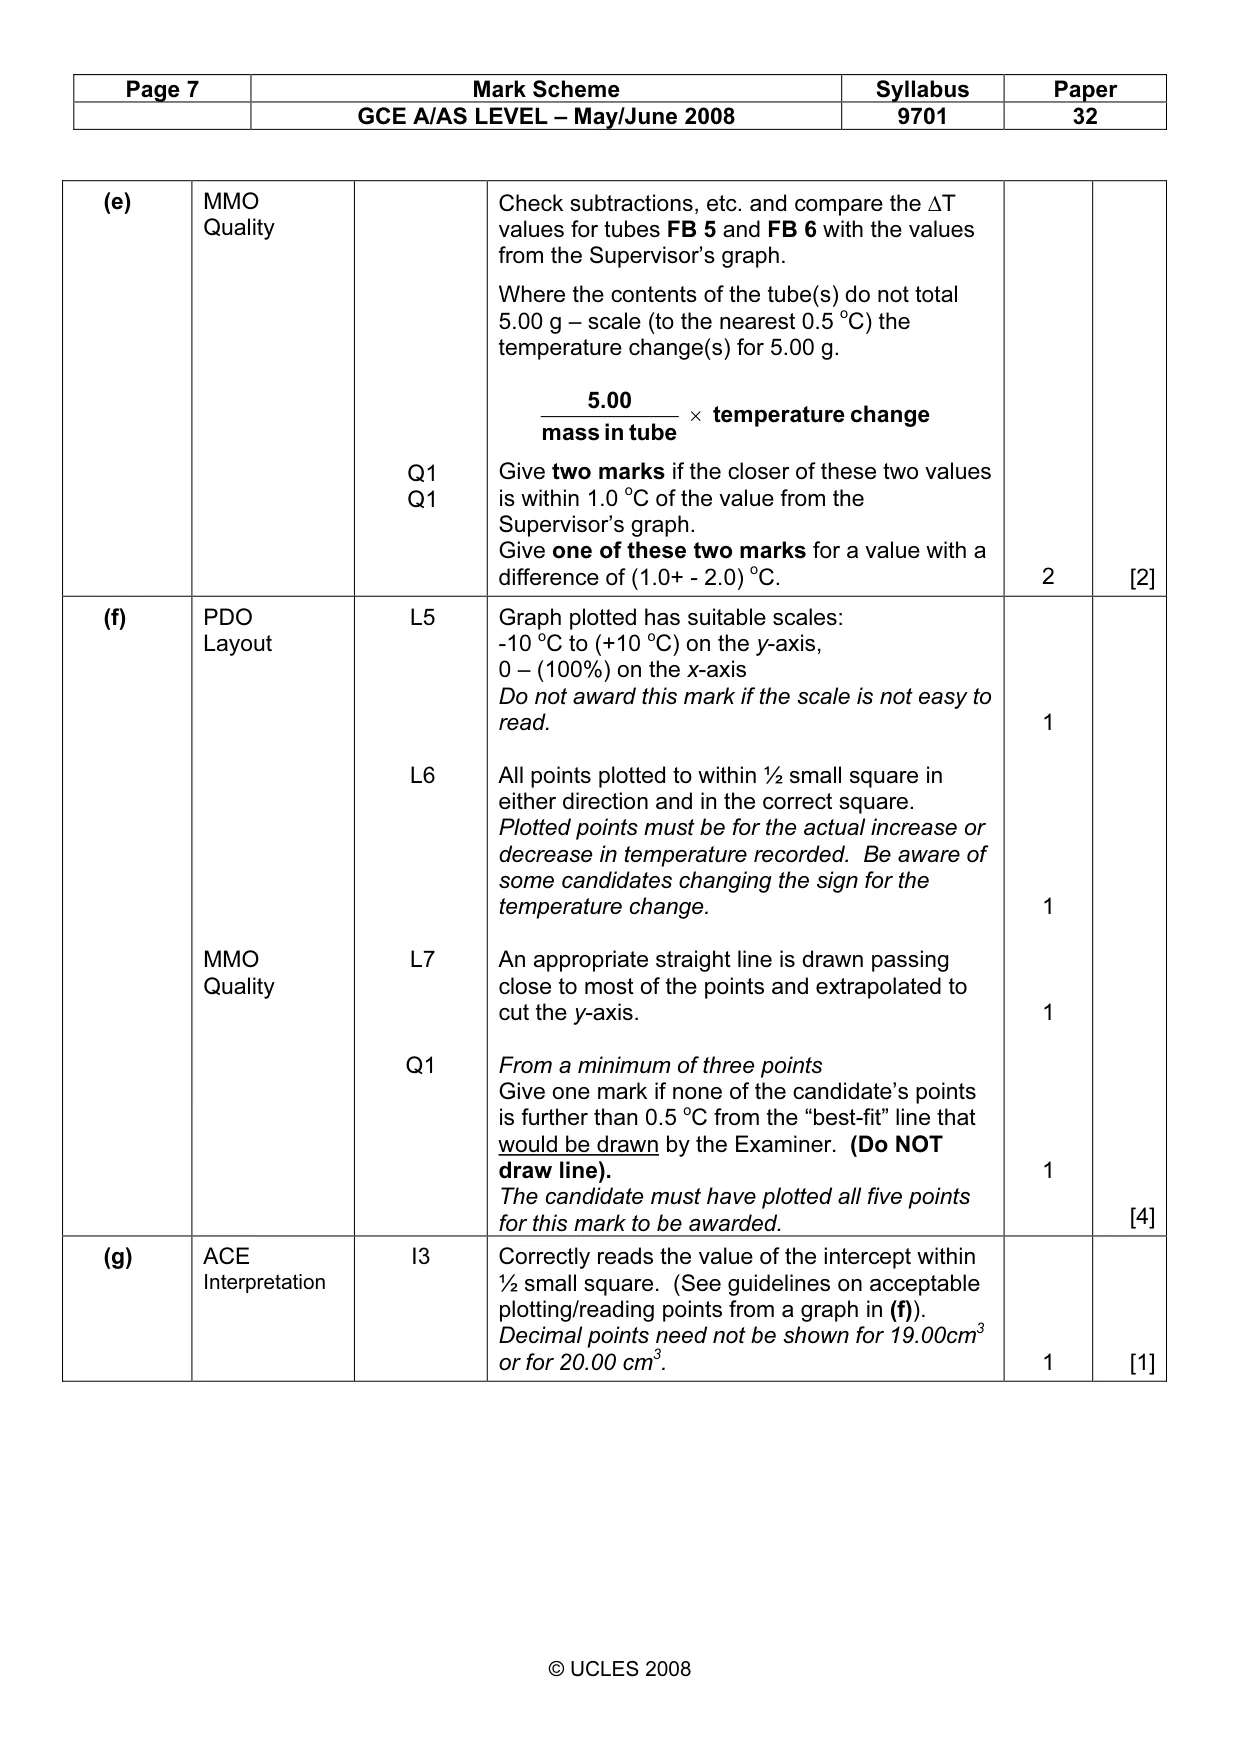
Page 7 Mark Scheme Syllabus Paper GCE A/AS LEVEL – May/June 2008 9701 32 © UCLES 2008 (e) MMO Quality Q1 Q1 Check subtractions, etc. and compare the ∆T values for tubes FB 5 and FB 6 with the values from the Supervisor’s graph. Where the contents of the tube(s) do not total 5.00 g – scale (to the nearest 0.5 oC) the temperature change(s) for 5.00 g. change e temperatur tube in mass 5.00 × Give two marks if the closer of these two values is within 1.0 oC of the value from the Supervisor’s graph. Give one of these two marks for a value with a difference of (1.0+ - 2.0) oC. 2 [2] (f) PDO Layout MMO Quality L5 L6 L7 Q1 Graph plotted has suitable scales: -10 oC to (+10 oC) on the y-axis, 0 – (100%) on the x-axis Do not award this mark if the scale is not easy to read. All points plotted to within ½ small square in either direction and in the correct square. Plotted points must be for the actual increase or decrease in temperature recorded. Be aware of some candidates changing the sign for the temperature change. An appropriate straight line is drawn passing close to most of the points and extrapolated to cut the y-axis. From a minimum of three points Give one mark if none of the candidate’s points is further than 0.5 oC from the “best-fit” line that would be drawn by the Examiner. (Do NOT draw line). The candidate must have plotted all five points for this mark to be awarded. 1 1 1 1 [4] (g) ACE Interpretation I3 Correctly reads the value of the intercept within ½ small square. (See guidelines on acceptable plotting/reading points from a graph in (f)). Decimal points need not be shown for 19.00cm3 or for 20.00 cm3. 1 [1]
Mark scheme, page 8
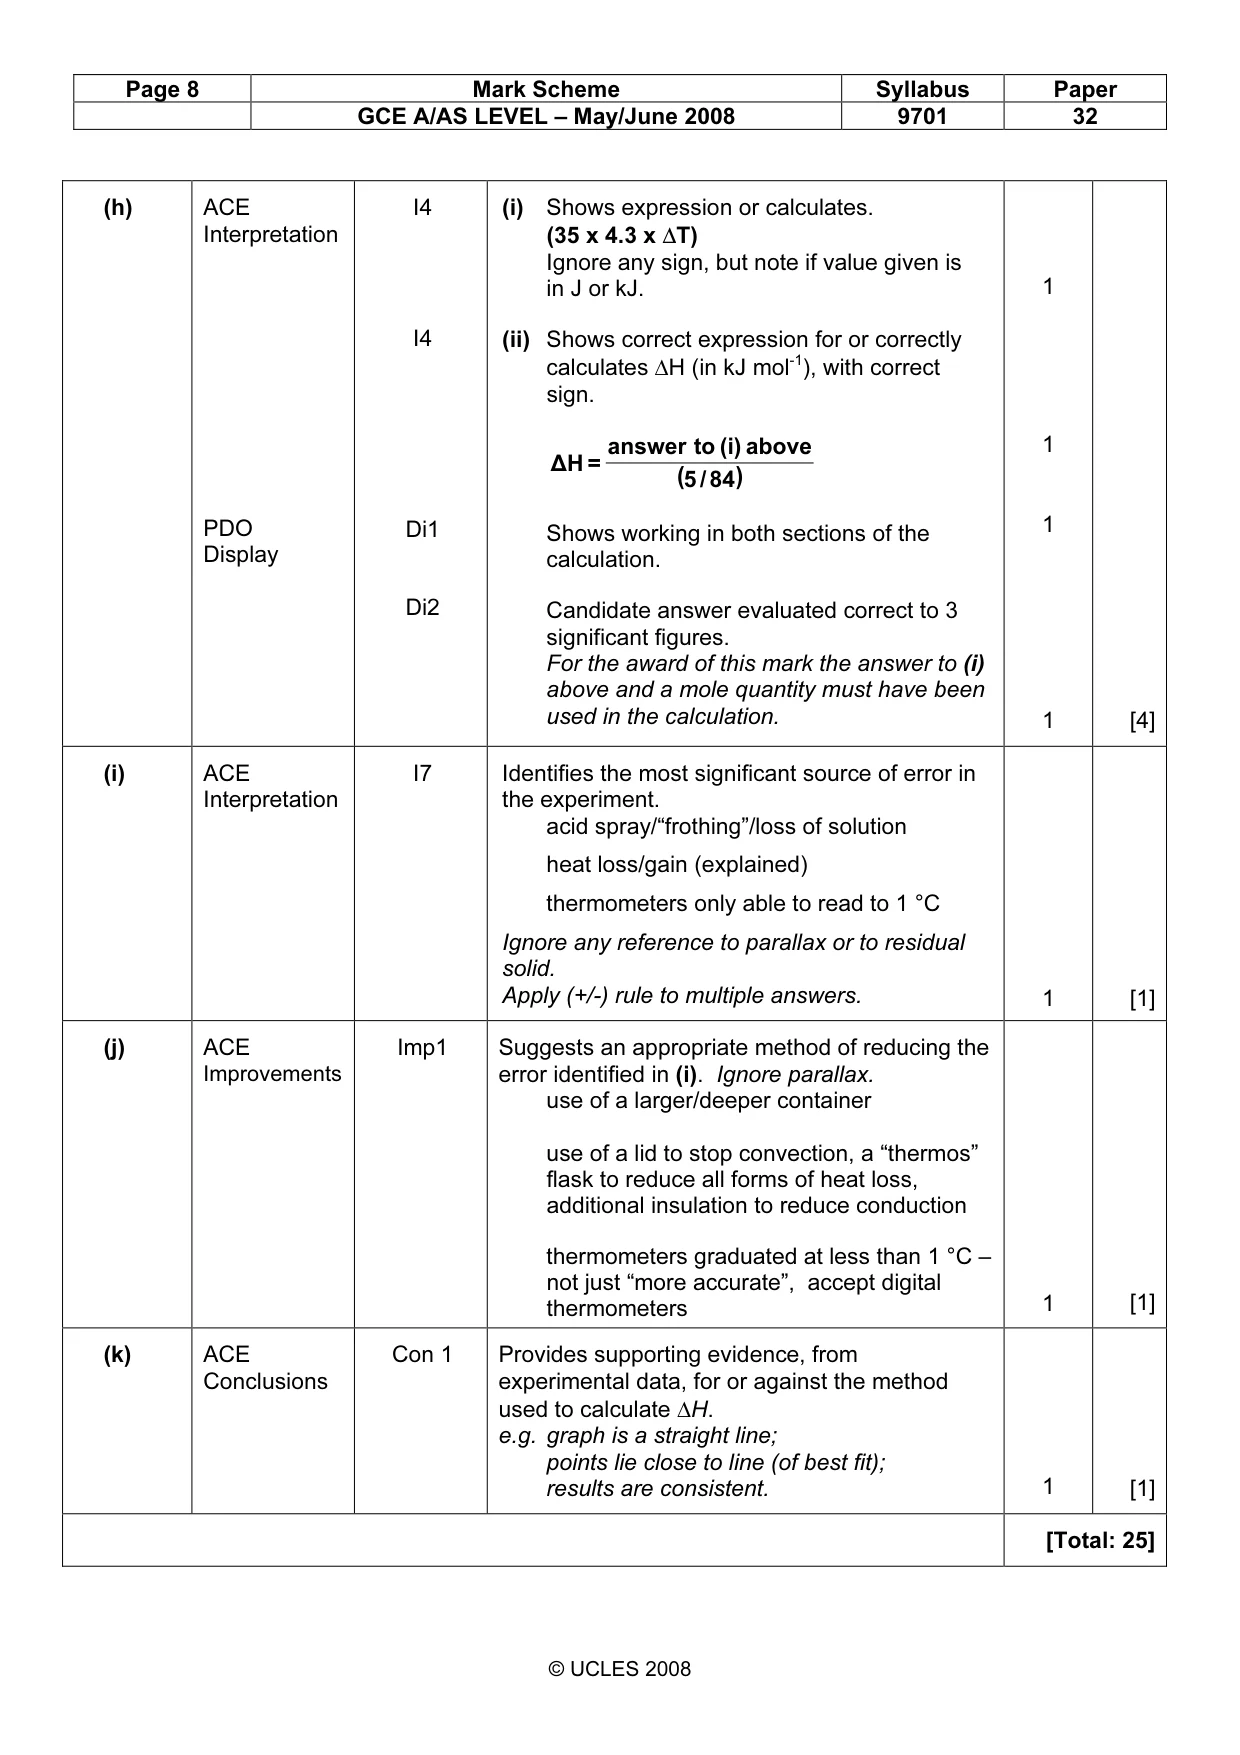
Page 8 Mark Scheme Syllabus Paper GCE A/AS LEVEL – May/June 2008 9701 32 © UCLES 2008 (h) ACE Interpretation PDO Display I4 I4 Di1 Di2 (i) Shows expression or calculates. (35 x 4.3 x ∆T) Ignore any sign, but note if value given is in J or kJ. (ii) Shows correct expression for or correctly calculates ∆H (in kJ mol-1), with correct sign. ( ) 84 / 5 above (i) to answer = H ∆ Shows working in both sections of the calculation. Candidate answer evaluated correct to 3 significant figures. For the award of this mark the answer to (i) above and a mole quantity must have been used in the calculation. 1 1 1 1 [4] (i) ACE Interpretation I7 Identifies the most significant source of error in the experiment. acid spray/“frothing”/loss of solution heat loss/gain (explained) thermometers only able to read to 1 °C Ignore any reference to parallax or to residual solid. Apply (+/-) rule to multiple answers. 1 [1] (j) ACE Improvements Imp1 Suggests an appropriate method of reducing the error identified in (i). Ignore parallax. use of a larger/deeper container use of a lid to stop convection, a “thermos” flask to reduce all forms of heat loss, additional insulation to reduce conduction thermometers graduated at less than 1 °C – not just “more accurate”, accept digital thermometers 1 [1] (k) ACE Conclusions Con 1 Provides supporting evidence, from experimental data, for or against the method used to calculate ∆H. e.g. graph is a straight line; points lie close to line (of best fit); results are consistent. 1 [1] [Total: 25]
Mark scheme, page 9
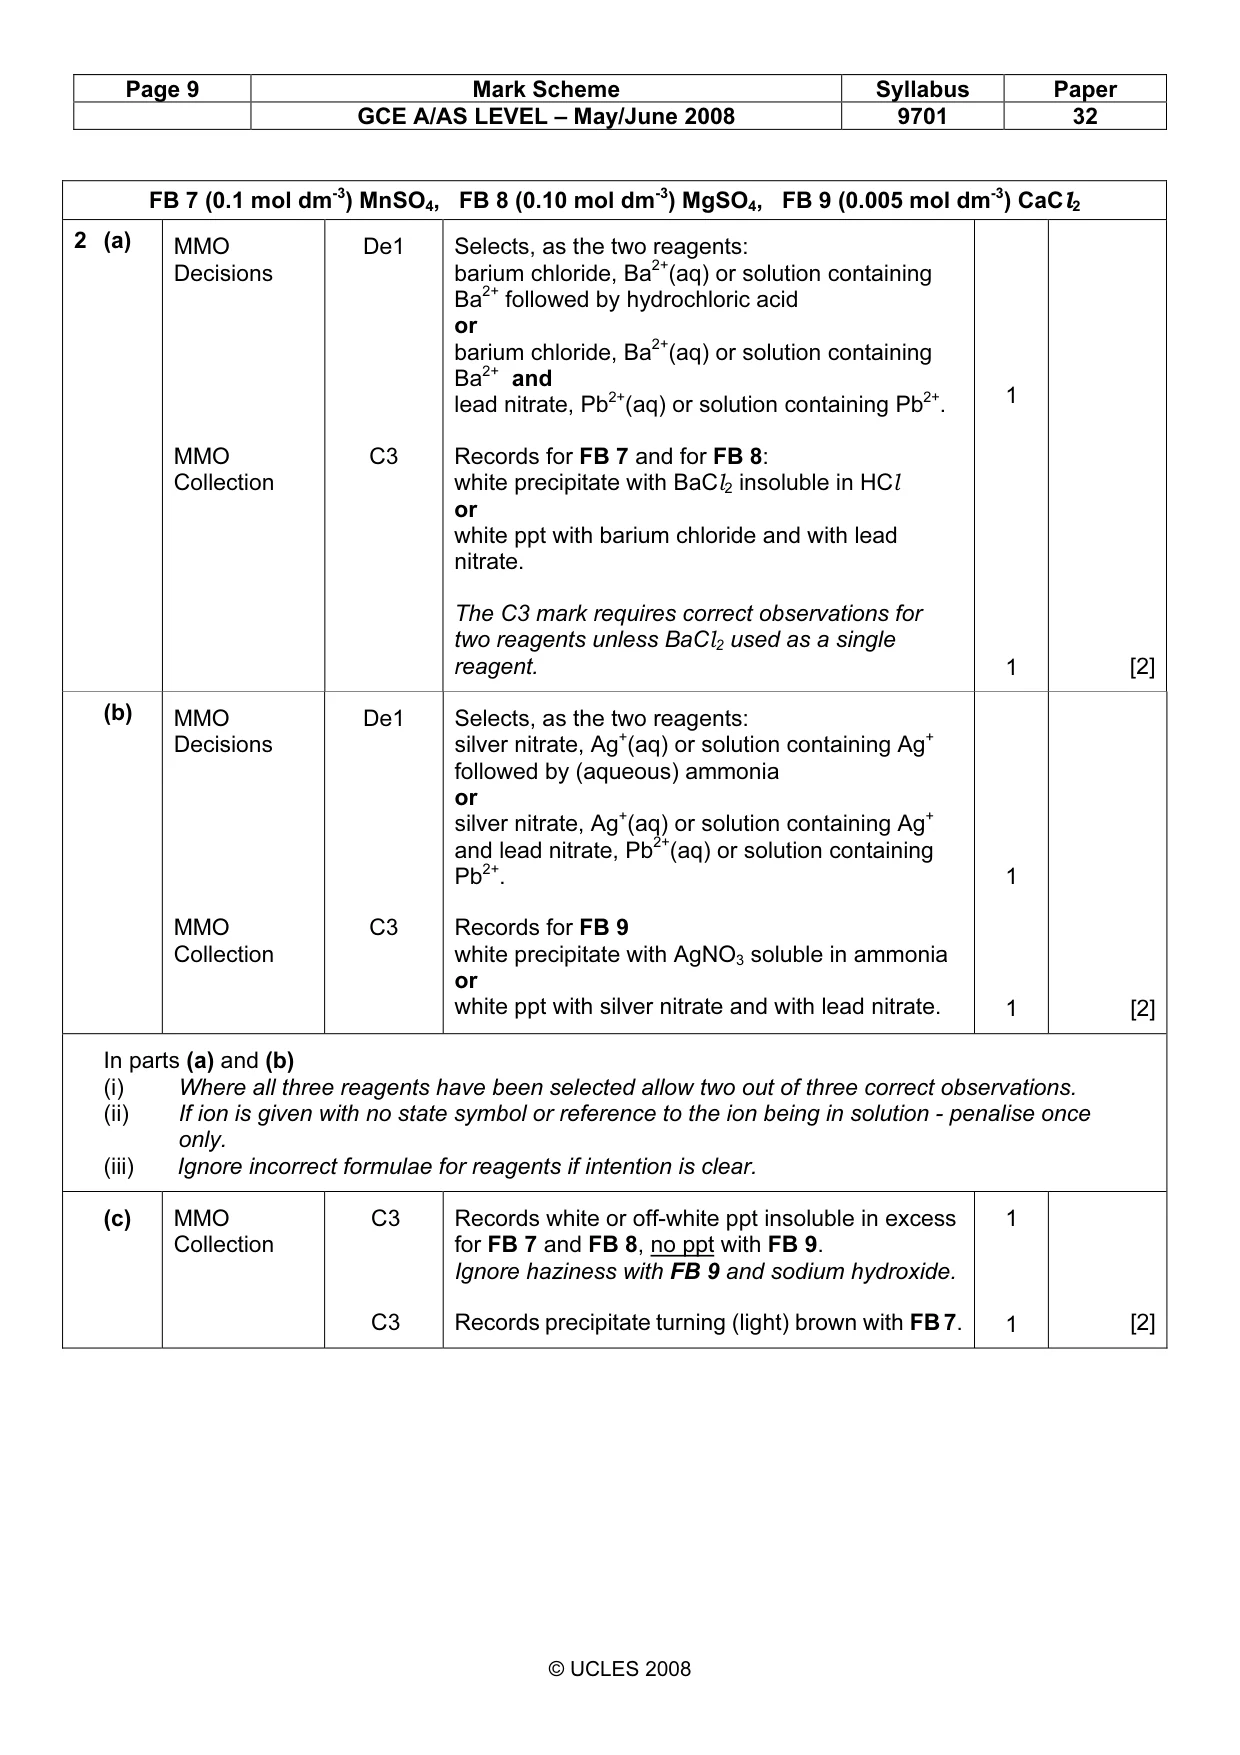
Page 9 Mark Scheme Syllabus Paper GCE A/AS LEVEL – May/June 2008 9701 32 © UCLES 2008 FB 7 (0.1 mol dm-3) MnSO4, FB 8 (0.10 mol dm-3) MgSO4, FB 9 (0.005 mol dm-3) CaCl2 2 (a) MMO Decisions MMO Collection De1 C3 Selects, as the two reagents: barium chloride, Ba2+(aq) or solution containing Ba2+ followed by hydrochloric acid or barium chloride, Ba2+(aq) or solution containing Ba2+ and lead nitrate, Pb2+(aq) or solution containing Pb2+. Records for FB 7 and for FB 8: white precipitate with BaCl2 insoluble in HCl or white ppt with barium chloride and with lead nitrate. The C3 mark requires correct observations for two reagents unless BaCl2 used as a single reagent. 1 1 [2] (b) MMO Decisions MMO Collection De1 C3 Selects, as the two reagents: silver nitrate, Ag+(aq) or solution containing Ag+ followed by (aqueous) ammonia or silver nitrate, Ag+(aq) or solution containing Ag+ and lead nitrate, Pb2+(aq) or solution containing Pb2+. Records for FB 9 white precipitate with AgNO3 soluble in ammonia or white ppt with silver nitrate and with lead nitrate. 1 1 [2] In parts (a) and (b) (i) Where all three reagents have been selected allow two out of three correct observations. (ii) If ion is given with no state symbol or reference to the ion being in solution - penalise once only. (iii) Ignore incorrect formulae for reagents if intention is clear. (c) MMO Collection C3 C3 Records white or off-white ppt insoluble in excess for FB 7 and FB 8, no ppt with FB 9. Ignore haziness with FB 9 and sodium hydroxide. Records precipitate turning (light) brown with FB 7. 1 1 [2]
Mark scheme, page 10
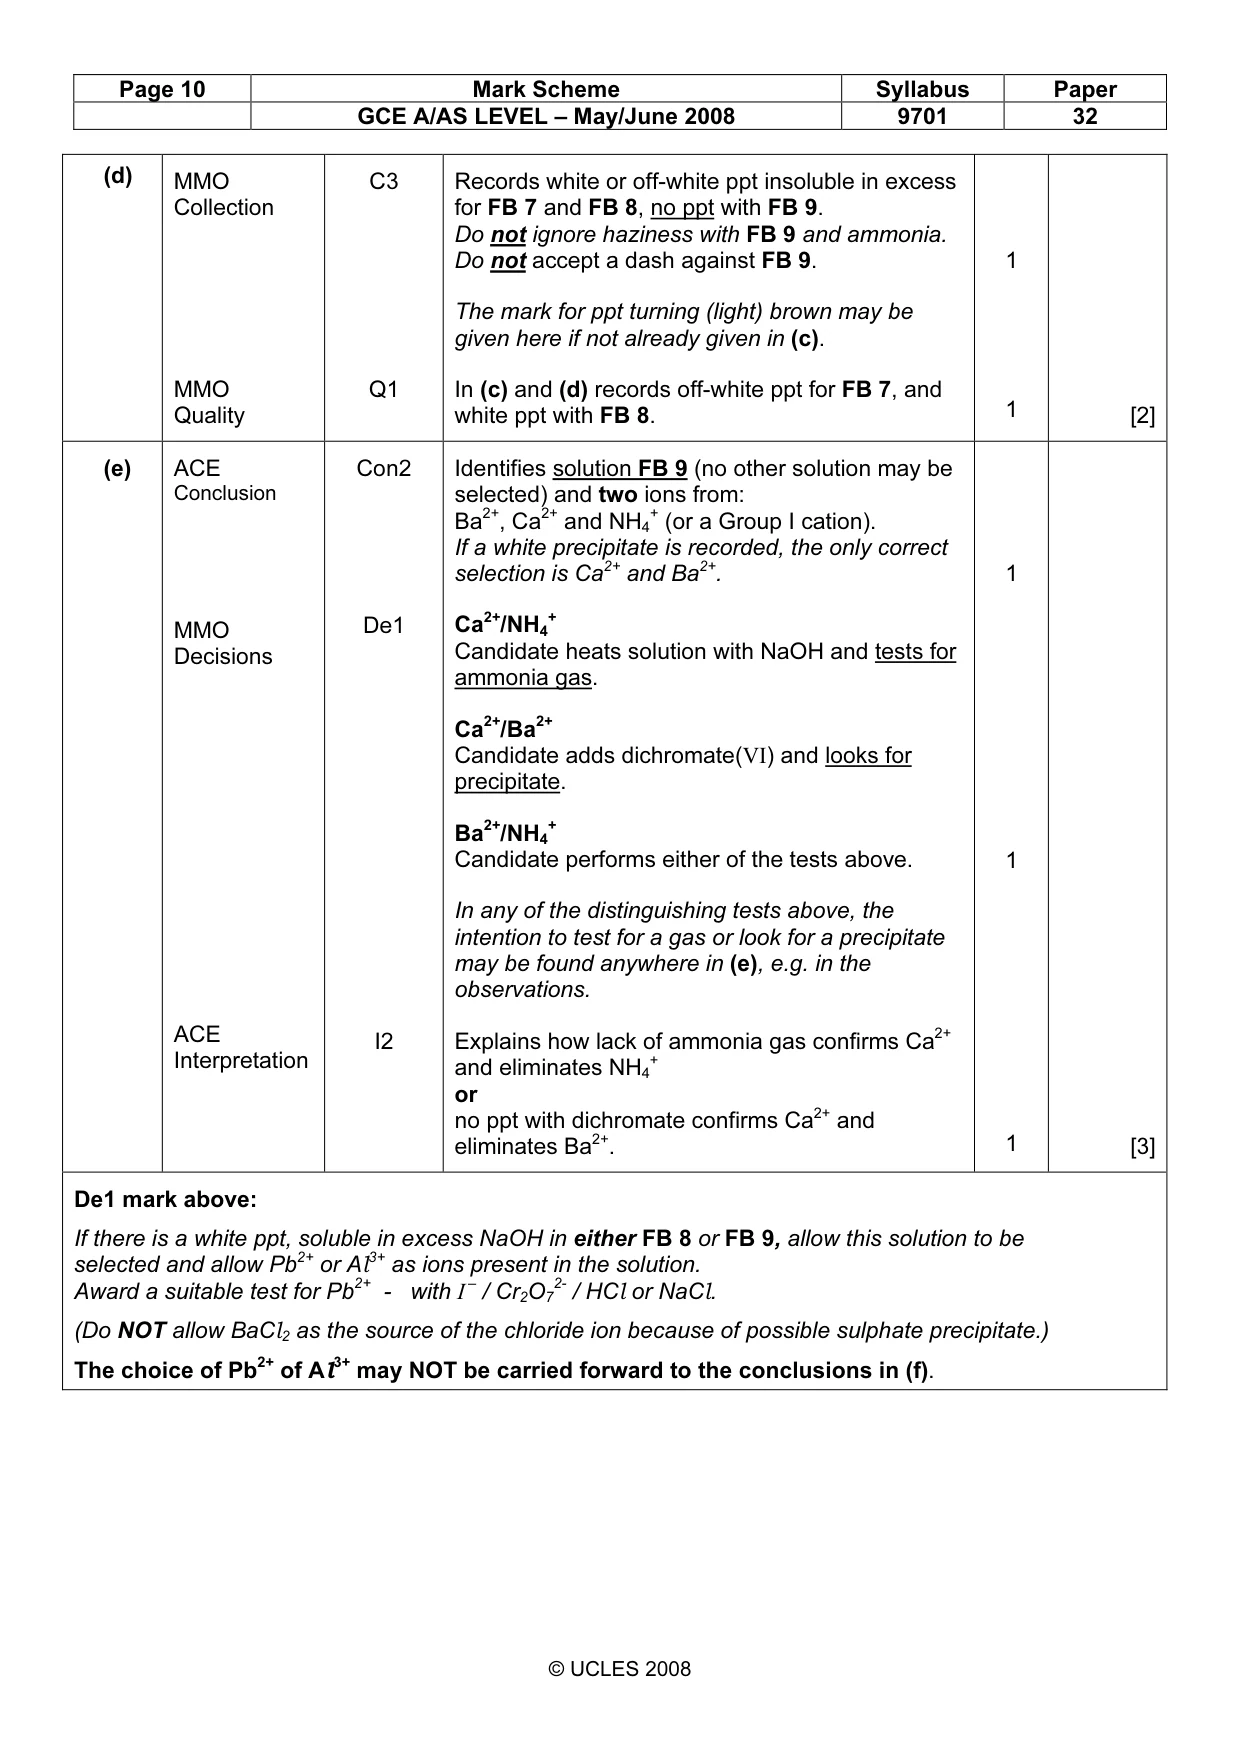
Page 10 Mark Scheme Syllabus Paper GCE A/AS LEVEL – May/June 2008 9701 32 © UCLES 2008 (d) MMO Collection MMO Quality C3 Q1 Records white or off-white ppt insoluble in excess for FB 7 and FB 8, no ppt with FB 9. Do not ignore haziness with FB 9 and ammonia. Do not accept a dash against FB 9. The mark for ppt turning (light) brown may be given here if not already given in (c). In (c) and (d) records off-white ppt for FB 7, and white ppt with FB 8. 1 1 [2] (e) ACE Conclusion MMO Decisions ACE Interpretation Con2 De1 I2 Identifies solution FB 9 (no other solution may be selected) and two ions from: Ba2+, Ca2+ and NH4 + (or a Group I cation). If a white precipitate is recorded, the only correct selection is Ca2+ and Ba2+. Ca2+/NH4 + Candidate heats solution with NaOH and tests for ammonia gas. Ca2+/Ba2+ Candidate adds dichromate(VI) and looks for precipitate. Ba2+/NH4 + Candidate performs either of the tests above. In any of the distinguishing tests above, the intention to test for a gas or look for a precipitate may be found anywhere in (e), e.g. in the observations. Explains how lack of ammonia gas confirms Ca2+ and eliminates NH4 + or no ppt with dichromate confirms Ca2+ and eliminates Ba2+. 1 1 1 [3] De1 mark above: If there is a white ppt, soluble in excess NaOH in either FB 8 or FB 9, allow this solution to be selected and allow Pb2+ or Al3+ as ions present in the solution. Award a suitable test for Pb2+ - with I – / Cr2O7 2- / HCl or NaCl. (Do NOT allow BaCl2 as the source of the chloride ion because of possible sulphate precipitate.) The choice of Pb2+ of Al3+ may NOT be carried forward to the conclusions in (f).
Mark scheme, page 11
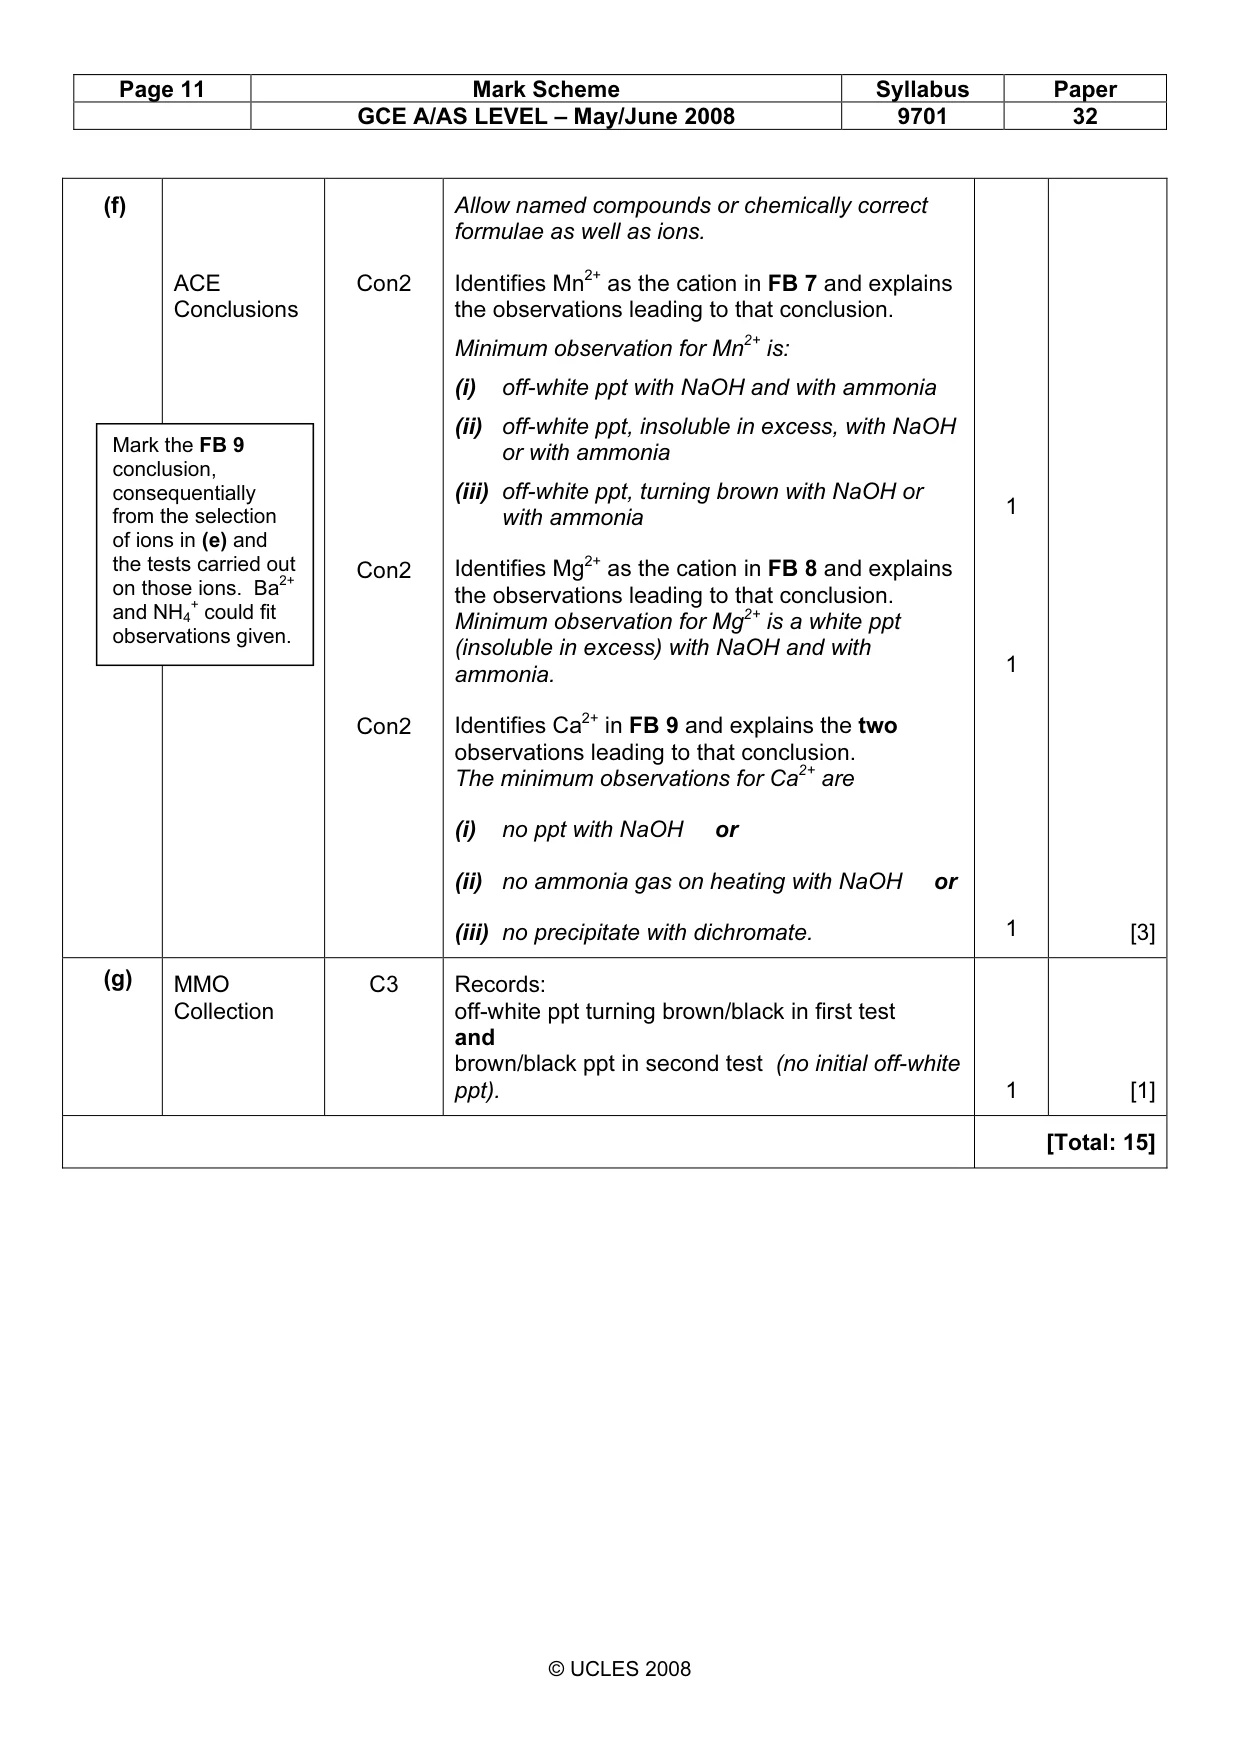
Page 11 Mark Scheme Syllabus Paper GCE A/AS LEVEL – May/June 2008 9701 32 © UCLES 2008 (f) ACE Conclusions Con2 Con2 Con2 Allow named compounds or chemically correct formulae as well as ions. Identifies Mn2+ as the cation in FB 7 and explains the observations leading to that conclusion. Minimum observation for Mn2+ is: (i) off-white ppt with NaOH and with ammonia (ii) off-white ppt, insoluble in excess, with NaOH or with ammonia (iii) off-white ppt, turning brown with NaOH or with ammonia Identifies Mg2+ as the cation in FB 8 and explains the observations leading to that conclusion. Minimum observation for Mg2+ is a white ppt (insoluble in excess) with NaOH and with ammonia. Identifies Ca2+ in FB 9 and explains the two observations leading to that conclusion. The minimum observations for Ca2+ are (i) no ppt with NaOH or (ii) no ammonia gas on heating with NaOH or (iii) no precipitate with dichromate. 1 1 1 [3] (g) MMO Collection C3 Records: off-white ppt turning brown/black in first test and brown/black ppt in second test (no initial off-white ppt). 1 [1] [Total: 15] Mark the FB 9 conclusion, consequentially from the selection of ions in (e) and the tests carried out on those ions. Ba2+ and NH4 + could fit observations given.
What you needed in this session
Cambridge’s own grade thresholds for 2008 May/June, Paper 3 · Variant 2. A higher threshold means an easier paper — the bar moves with how the cohort did.