Cambridge A Level Chemistry 9701 — 2008 May/June Paper 3 · Variant 1
9701/31/M/J/08 · 40 marks · ≈45 min
The question paper and its mark scheme, free to read here and free to download. This is Cambridge’s own paper, exactly as it was sat.
Question paper12 pages

Mark scheme11 pages
Answers below. Sit the paper first if you are practising.

Paper as text
Question paper, page 1
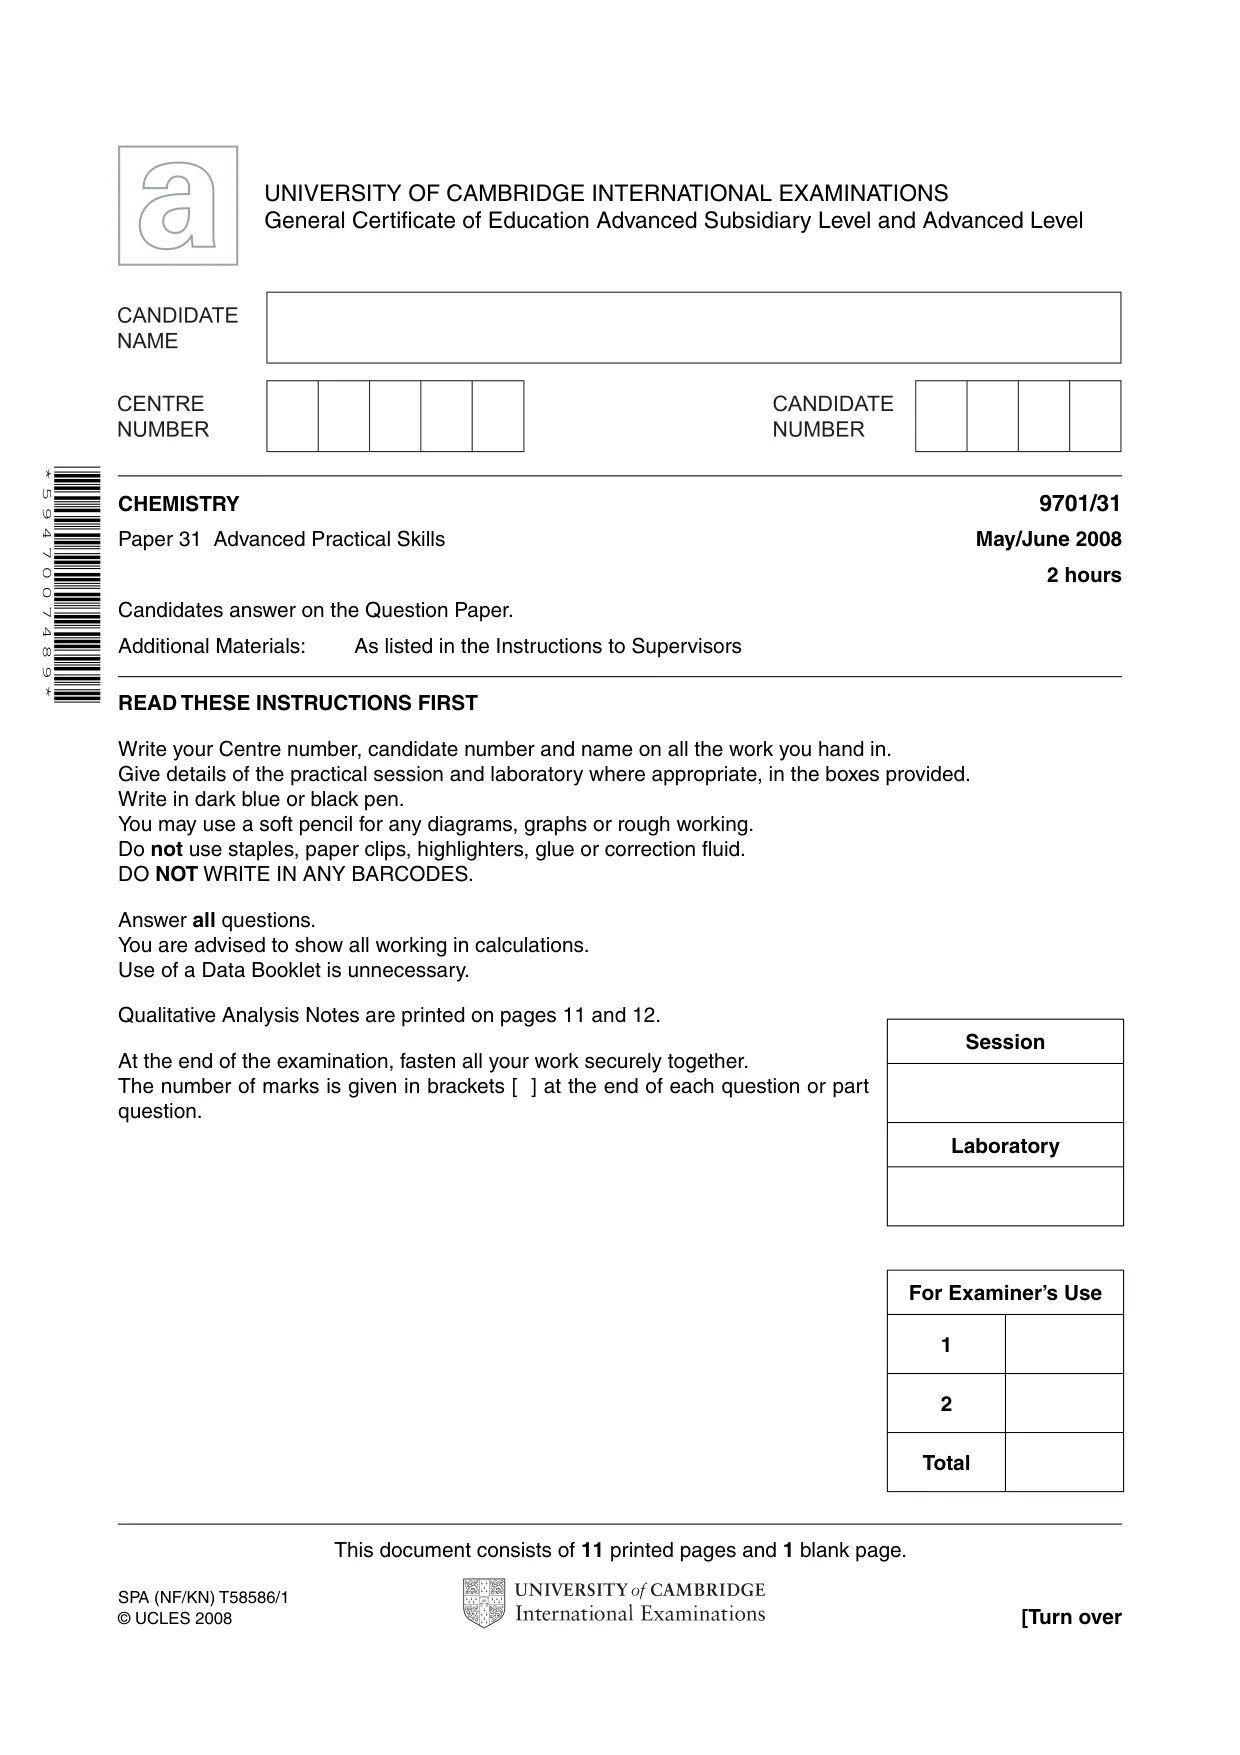
This document consists of 11 printed pages and 1 blank page. SPA (NF/KN) T58586/1 © UCLES 2008 [Turn over UNIVERSITY OF CAMBRIDGE INTERNATIONAL EXAMINATIONS General Certificate of Education Advanced Subsidiary Level and Advanced Level READ THESE INSTRUCTIONS FIRST Write your Centre number, candidate number and name on all the work you hand in. Give details of the practical session and laboratory where appropriate, in the boxes provided. Write in dark blue or black pen. You may use a soft pencil for any diagrams, graphs or rough working. Do not use staples, paper clips, highlighters, glue or correction fluid. DO NOT WRITE IN ANY BARCODES. Answer all questions. You are advised to show all working in calculations. Use of a Data Booklet is unnecessary. Qualitative Analysis Notes are printed on pages 11 and 12. At the end of the examination, fasten all your work securely together. The number of marks is given in brackets [ ] at the end of each question or part question. * 5 9 4 7 0 0 7 4 8 9 * CHEMISTRY 9701/31 Paper 31 Advanced Practical Skills May/June 2008 2 hours Candidates answer on the Question Paper. Additional Materials: As listed in the Instructions to Supervisors Session Laboratory For Examiner’s Use 1 2 Total
Question paper, page 2
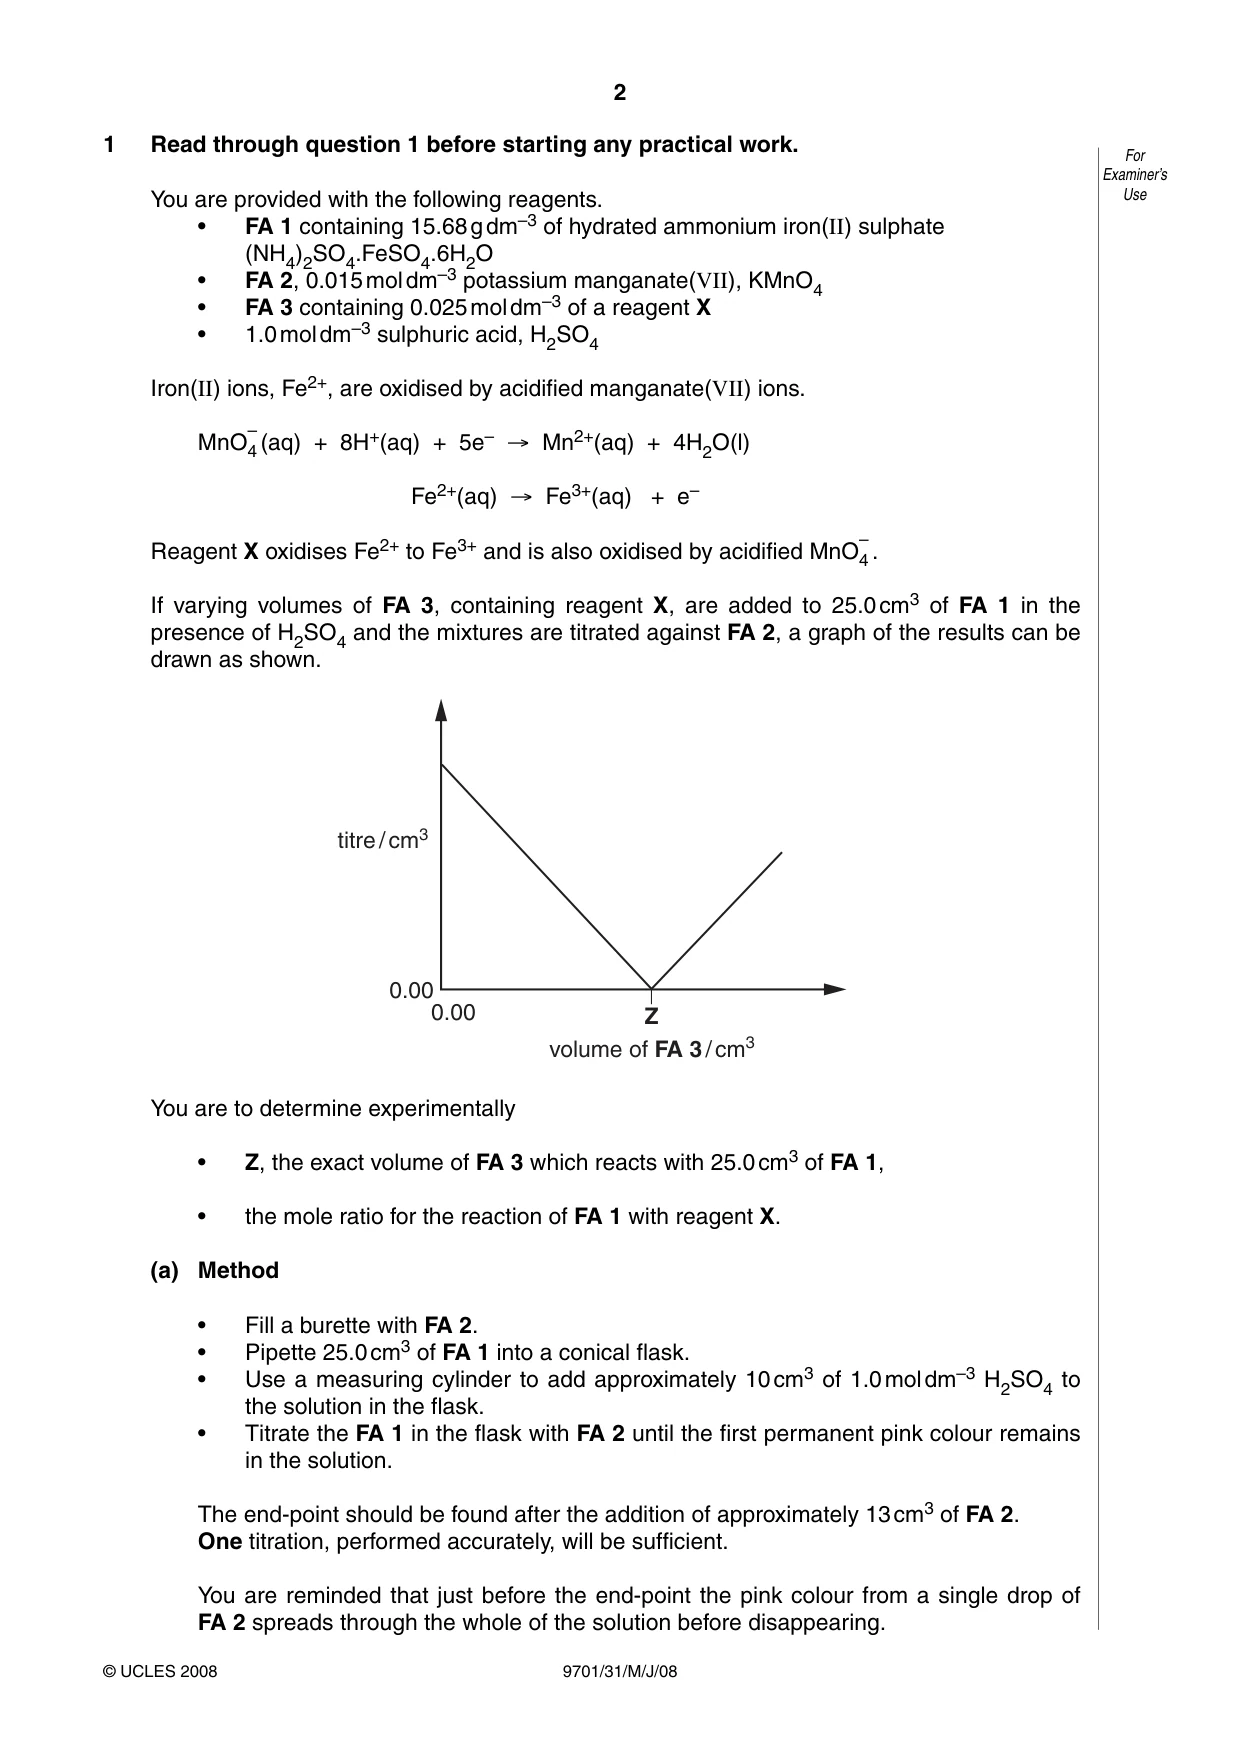
2 9701/31/M/J/08 © UCLES 2008 For Examiner’s Use 1 Read through question 1 before starting any practical work. You are provided with the following reagents. • FA 1 containing 15.68 g dm–3 of hydrated ammonium iron(II) sulphate (NH4)2SO4.FeSO4.6H2O • FA 2, 0.015 mol dm–3 potassium manganate(VII), KMnO4 • FA 3 containing 0.025 mol dm–3 of a reagent X • 1.0 mol dm–3 sulphuric acid, H2SO4 Iron(II) ions, Fe2+, are oxidised by acidified manganate(VII) ions. MnO – 4(aq) + 8H+(aq) + 5e– → Mn2+(aq) + 4H2O(l) Fe2+(aq) → Fe3+(aq) + e– Reagent X oxidises Fe2+ to Fe3+ and is also oxidised by acidified MnO – 4. If varying volumes of FA 3, containing reagent X, are added to 25.0 cm3 of FA 1 in the presence of H2SO4 and the mixtures are titrated against FA 2, a graph of the results can be drawn as shown. titre / cm3 volume of FA 3 / cm3 Z 0.00 0.00 You are to determine experimentally • Z, the exact volume of FA 3 which reacts with 25.0 cm3 of FA 1, • the mole ratio for the reaction of FA 1 with reagent X. (a) Method • Fill a burette with FA 2. • Pipette 25.0 cm3 of FA 1 into a conical flask. • Use a measuring cylinder to add approximately 10 cm3 of 1.0 mol dm–3 H2SO4 to the solution in the flask. • Titrate the FA 1 in the flask with FA 2 until the first permanent pink colour remains in the solution. The end-point should be found after the addition of approximately 13 cm3 of FA 2. One titration, performed accurately, will be sufficient. You are reminded that just before the end-point the pink colour from a single drop of FA 2 spreads through the whole of the solution before disappearing.
Question paper, page 3
3 9701/31/M/J/08 © UCLES 2008 [Turn over For Examiner’s Use Record your titration results in the space below. [1] (b) Method • Fill the second burette with FA 3. • Empty and rinse the conical flask used in part (a). • Pipette 25.0 cm3 of FA 1 into the conical flask and add 10 cm3 of H2SO4 using a measuring cylinder. • Run 12.00 cm3 of FA 3 from the second burette into the flask. • Titrate against FA 2 until the first permanent pink colour remains in the solution. The end-point should be found after the addition of approximately 5 cm3 of FA 2. One titration, performed accurately, will be sufficient. You are reminded that just before the end-point the pink colour from a single drop of FA 2 spreads through the whole of the solution before disappearing. Record your titration results in the space below. [1] (c) The volume of FA 3 added to the flask in (b) reacts with some but not all of the FA 1 present. Calculate the difference between the titres obtained in parts (a) and (b). Use this difference and the volume of FA 3 added to the flask in (b) to calculate the volume of FA 3 that you would expect to react with all of the Fe2+ ions in 25.0 cm3 of FA 1. volume of FA 3 = … cm3 [1]
Question paper, page 4
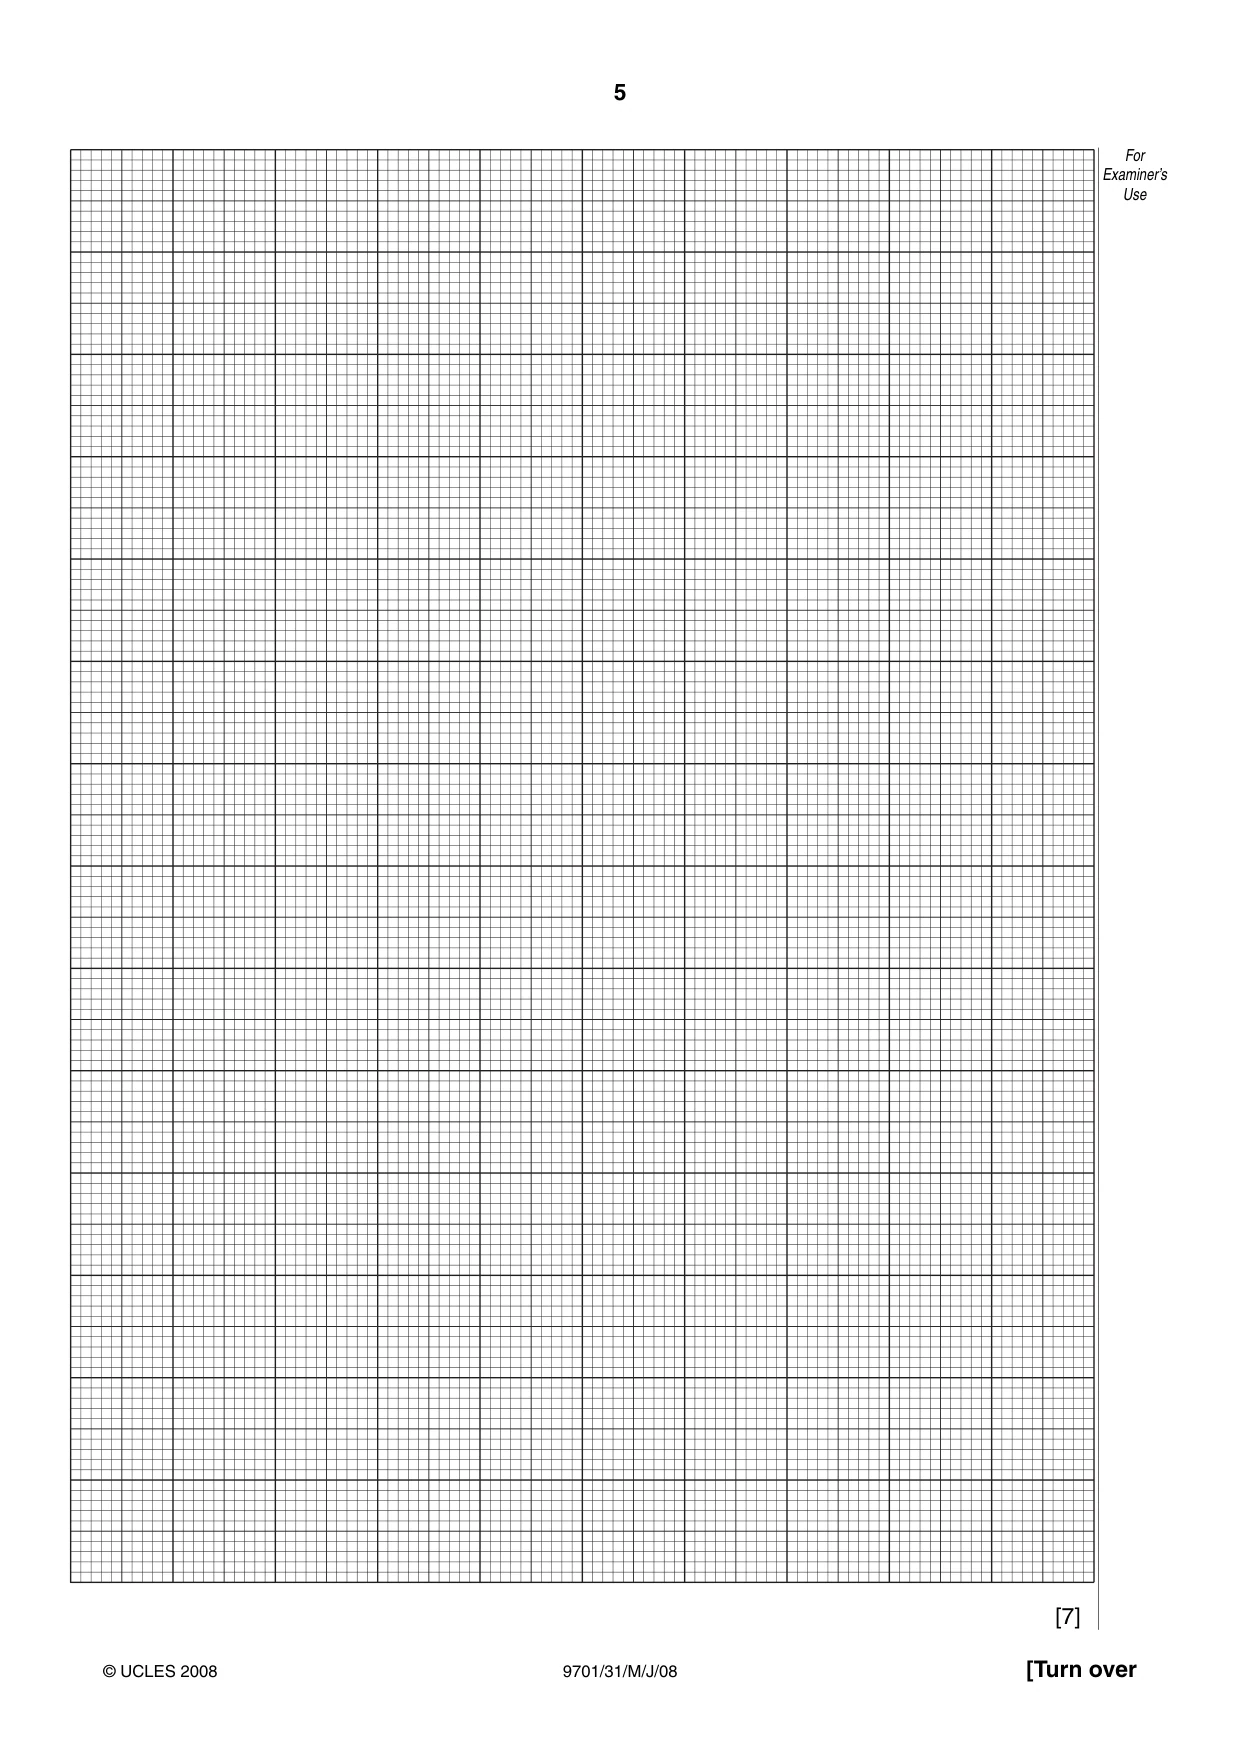
4 9701/31/M/J/08 © UCLES 2008 For Examiner’s Use (d) The value you have obtained in (c) is an approximate value of Z. You are to perform four more titrations, each with a different volume of FA 3 added to 25.0 cm3 of FA 1, in order to plot a graph of the form shown on page 2 and to obtain an exact value for Z. One titration, performed accurately, will be sufficient for each volume of FA 3 added. The volume of FA 3 you have obtained in (c) will help you to choose suitable volumes of FA 3 to be added for each titration. (If you were unable to calculate the volume of FA 3 in (c) assume that the value lies in the range 19.0 cm3 to 21.0 cm3.) Remember • you should not use more than 40.0 cm3 of FA 3 for any single titration, • you already have data for titrations with no FA 3 added and with 12.00 cm3 added. Prepare a table in the space below and use it to record the titration results for each volume of FA 3 added. Include in your table the titre values from parts (a) and (b). [6] (e) Use the grid on the opposite page to plot a graph of titre against volume of FA 3 added. Draw two straight lines through the plotted points to find Z, the volume of FA 3 that just reacts with the Fe2+ ions in 25.0 cm3 of FA 1. Z, the volume of FA 3 read from the graph is … cm3.
Question paper, page 5
5 9701/31/M/J/08 © UCLES 2008 [Turn over For Examiner’s Use [7]
Question paper, page 6
6 9701/31/M/J/08 © UCLES 2008 For Examiner’s Use (f) Circle on the graph one point where a repeat titration might be appropriate and justify you decision. If you do not think that any titration needs to be repeated, explain why you have come to that conclusion. … … … [1] Calculations Show your working and appropriate significant figures in all of your calculations. [2] (g) Calculate how many moles of Fe2+ ions were pipetted into the flask. [Ar: Fe, 55.8; H, 1.0; N, 14.0; O, 16.0; S, 32.1] … mol of Fe2+ were pipetted into the flask. [2] (h) Calculate how many moles of X are present in Z, the volume of FA 3 read from your graph. … mol of X were present in … cm3 of FA 3. [1] (i) Calculate, to 3 significant figures, the number of moles of Fe2+ ions that react with 1 mol of X. [2] [Total: 24]
Question paper, page 8
8 9701/31/M/J/08 © UCLES 2008 For Examiner’s Use 2 The three solutions FA 4, FA 5, and FA 6 each contain one of the following. aluminium sulphate, Al2(SO4)3 ammonium iodide, NH4I zinc nitrate, Zn(NO3)2 (a) Use the information on page 12 to select two suitable reagents to use to discover which solution contains iodide ions. Record, in the space below, the reagents used and the observations made. From these tests, solution FA … contains iodide ions. [5] You are to perform the tests given in the table opposite on each of FA 4, FA 5 and FA 6 to identify, where possible, the cation and anion present in each solution. Record details of colour changes seen, the formation of any precipitate and the solubility of any such precipitate in an excess of the reagent added. Where gases are released they should be identified by a test, described in the appropriate place in your table. You should indicate clearly at what stage in a test a change occurs. Marks are not given for chemical equations. No additional tests for ions present should be attempted.
Question paper, page 9
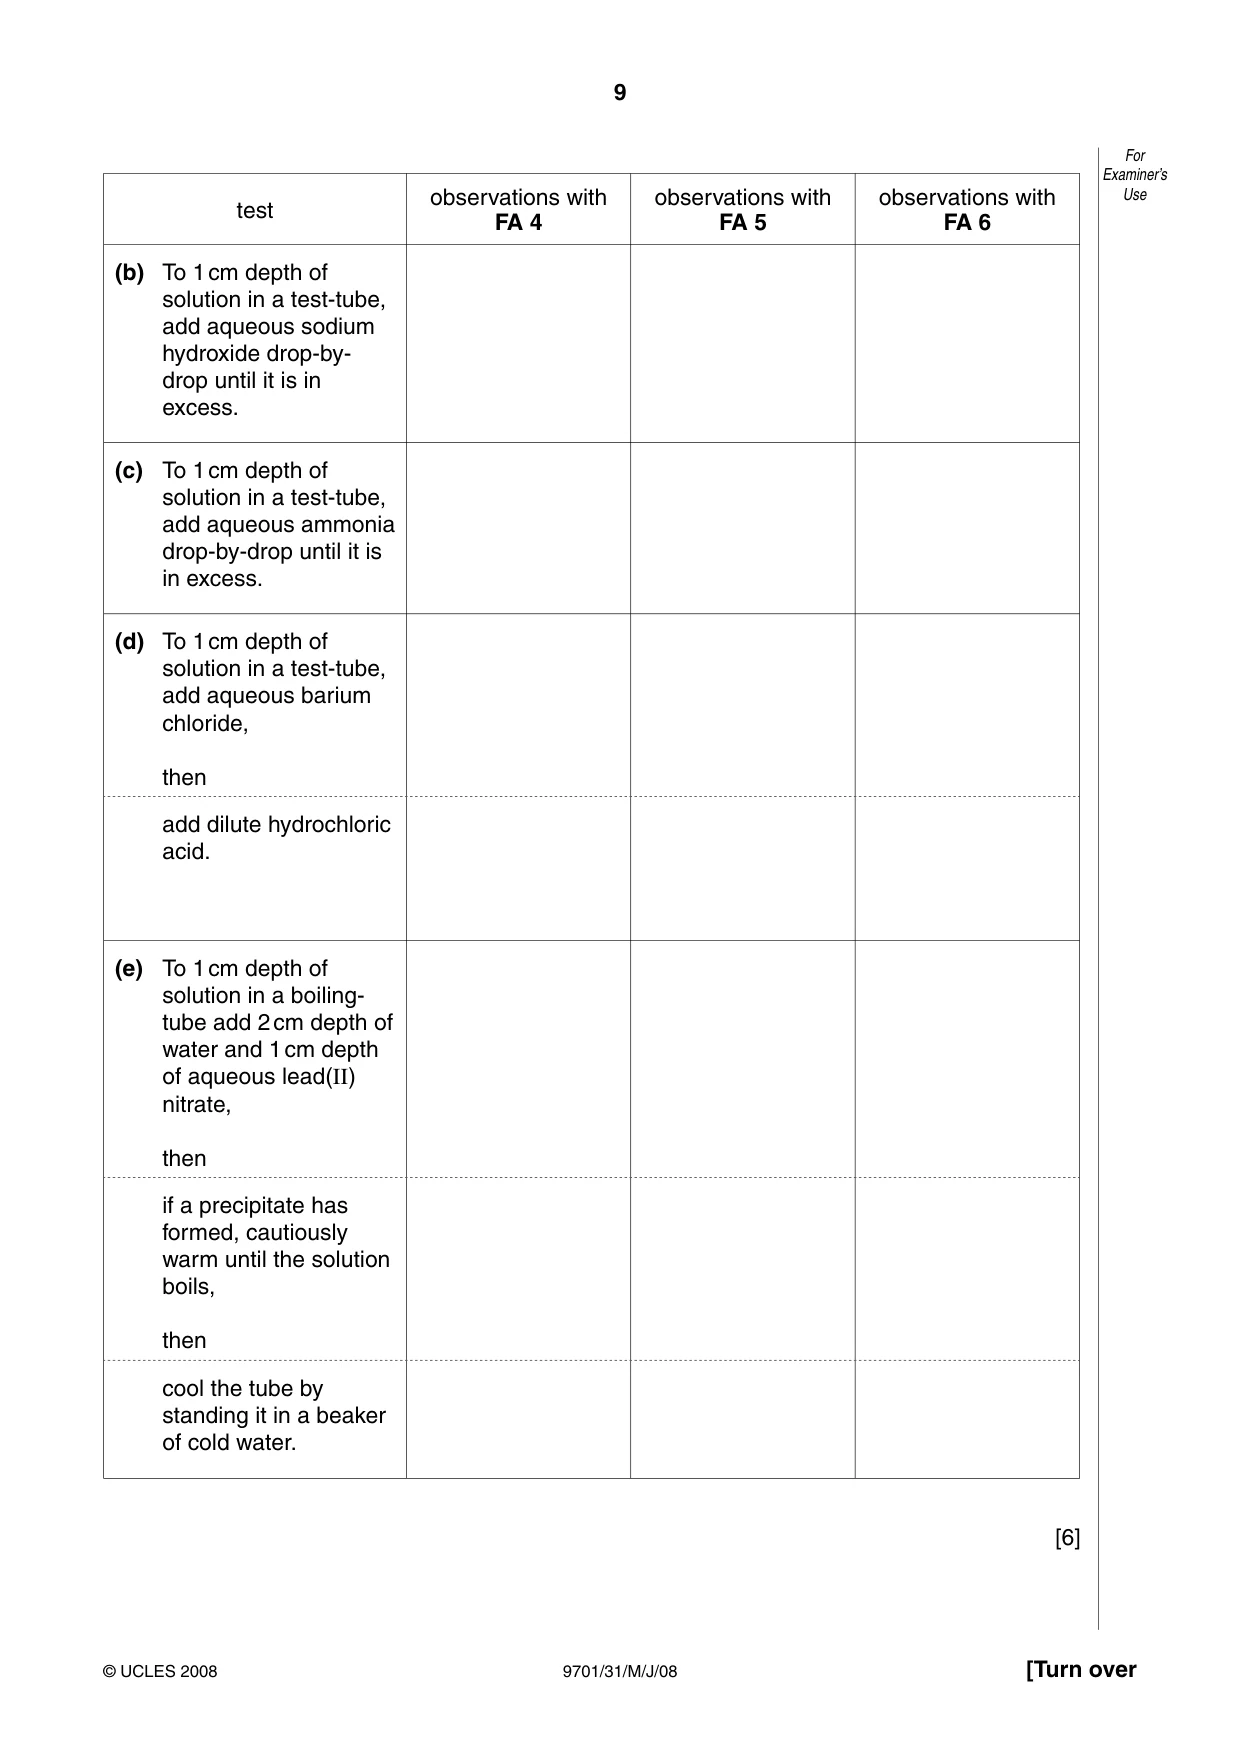
9 9701/31/M/J/08 © UCLES 2008 [Turn over For Examiner’s Use test observations with FA 4 observations with FA 5 observations with FA 6 (b) To 1 cm depth of solution in a test-tube, add aqueous sodium hydroxide drop-by- drop until it is in excess. (c) To 1 cm depth of solution in a test-tube, add aqueous ammonia drop-by-drop until it is in excess. (d) To 1 cm depth of solution in a test-tube, add aqueous barium chloride, then add dilute hydrochloric acid. (e) To 1 cm depth of solution in a boiling- tube add 2 cm depth of water and 1 cm depth of aqueous lead(II) nitrate, then if a precipitate has formed, cautiously warm until the solution boils, then cool the tube by standing it in a beaker of cold water. [6]
Question paper, page 10
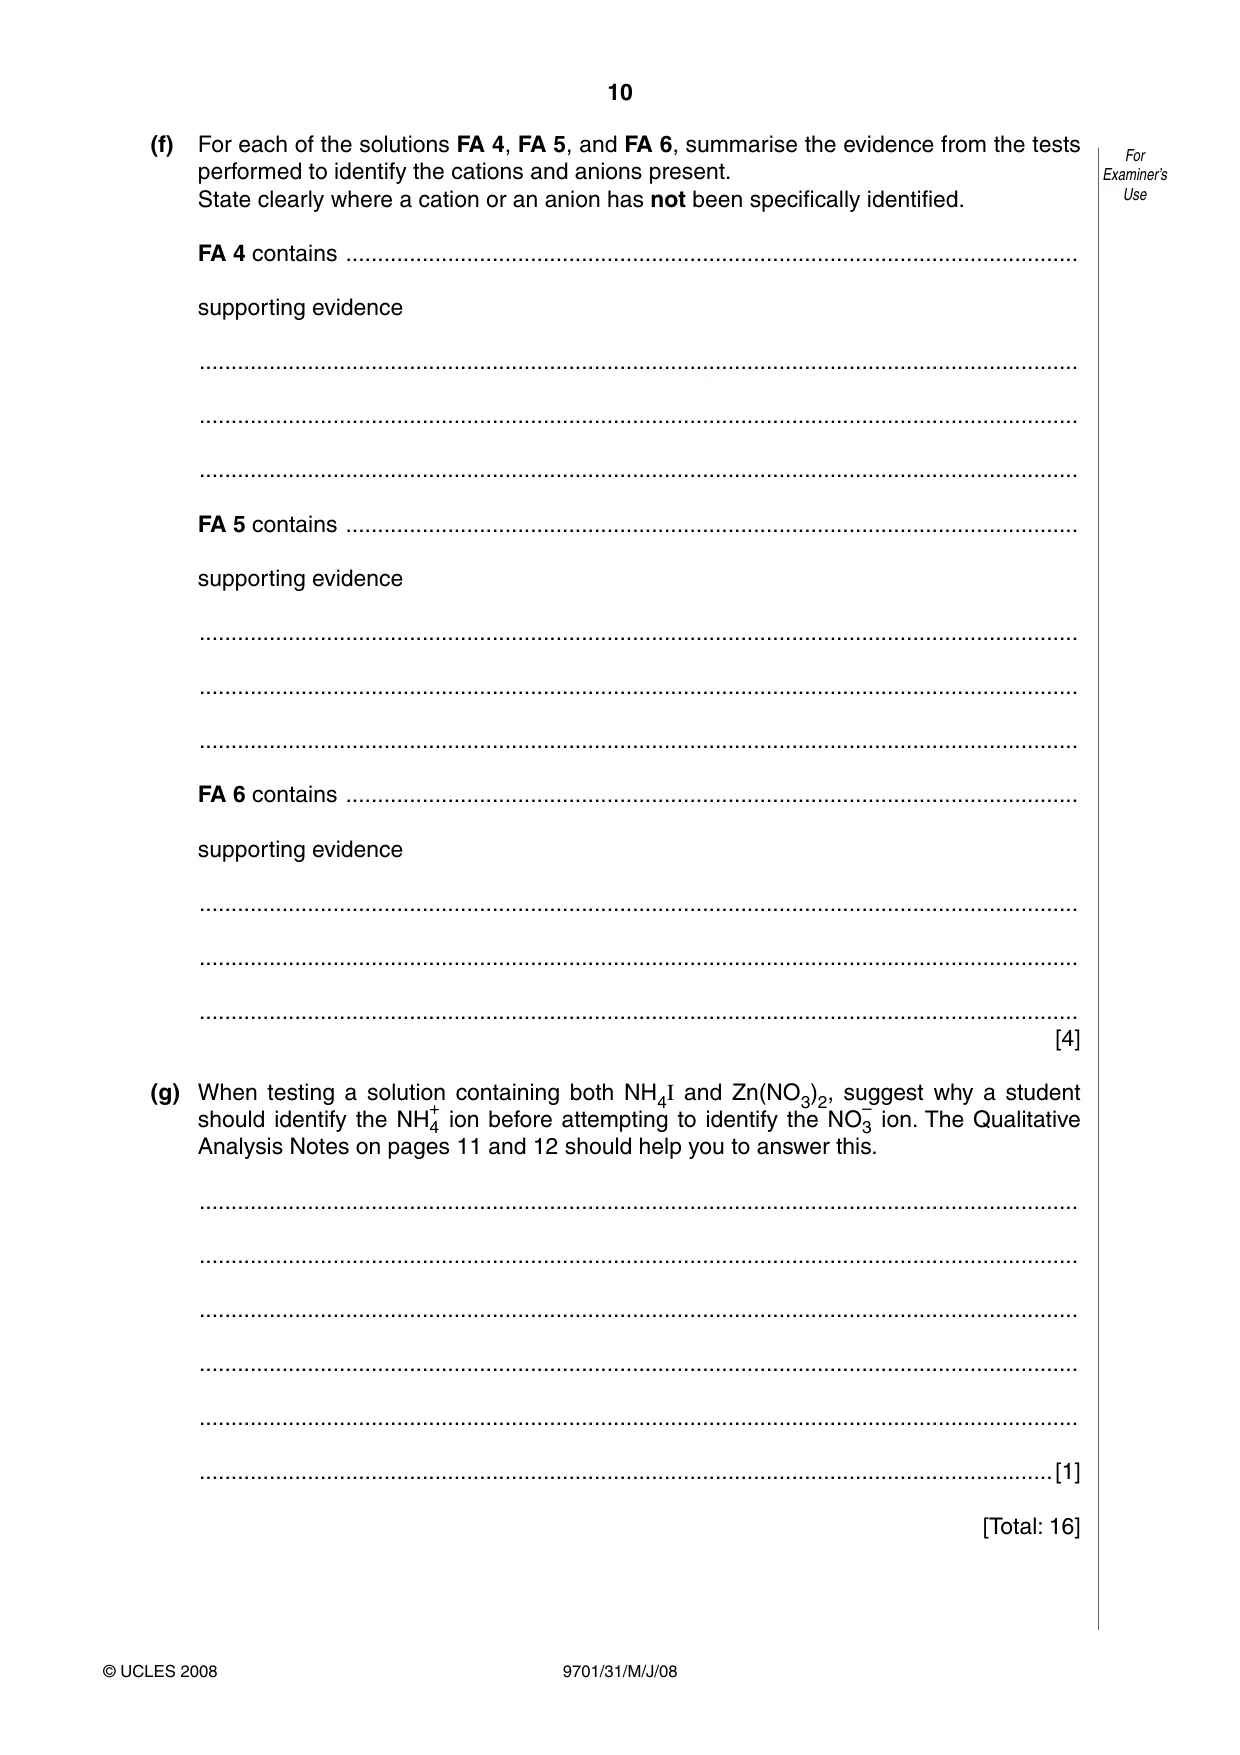
10 9701/31/M/J/08 © UCLES 2008 For Examiner’s Use (f) For each of the solutions FA 4, FA 5, and FA 6, summarise the evidence from the tests performed to identify the cations and anions present. State clearly where a cation or an anion has not been specifically identified. FA 4 contains … supporting evidence … … … FA 5 contains … supporting evidence … … … FA 6 contains … supporting evidence … … … [4] (g) When testing a solution containing both NH4I and Zn(NO3)2, suggest why a student should identify the NH+ 4 ion before attempting to identify the NO– 3 ion. The Qualitative Analysis Notes on pages 11 and 12 should help you to answer this. … … … … … …[1] [Total: 16]
Question paper, page 11
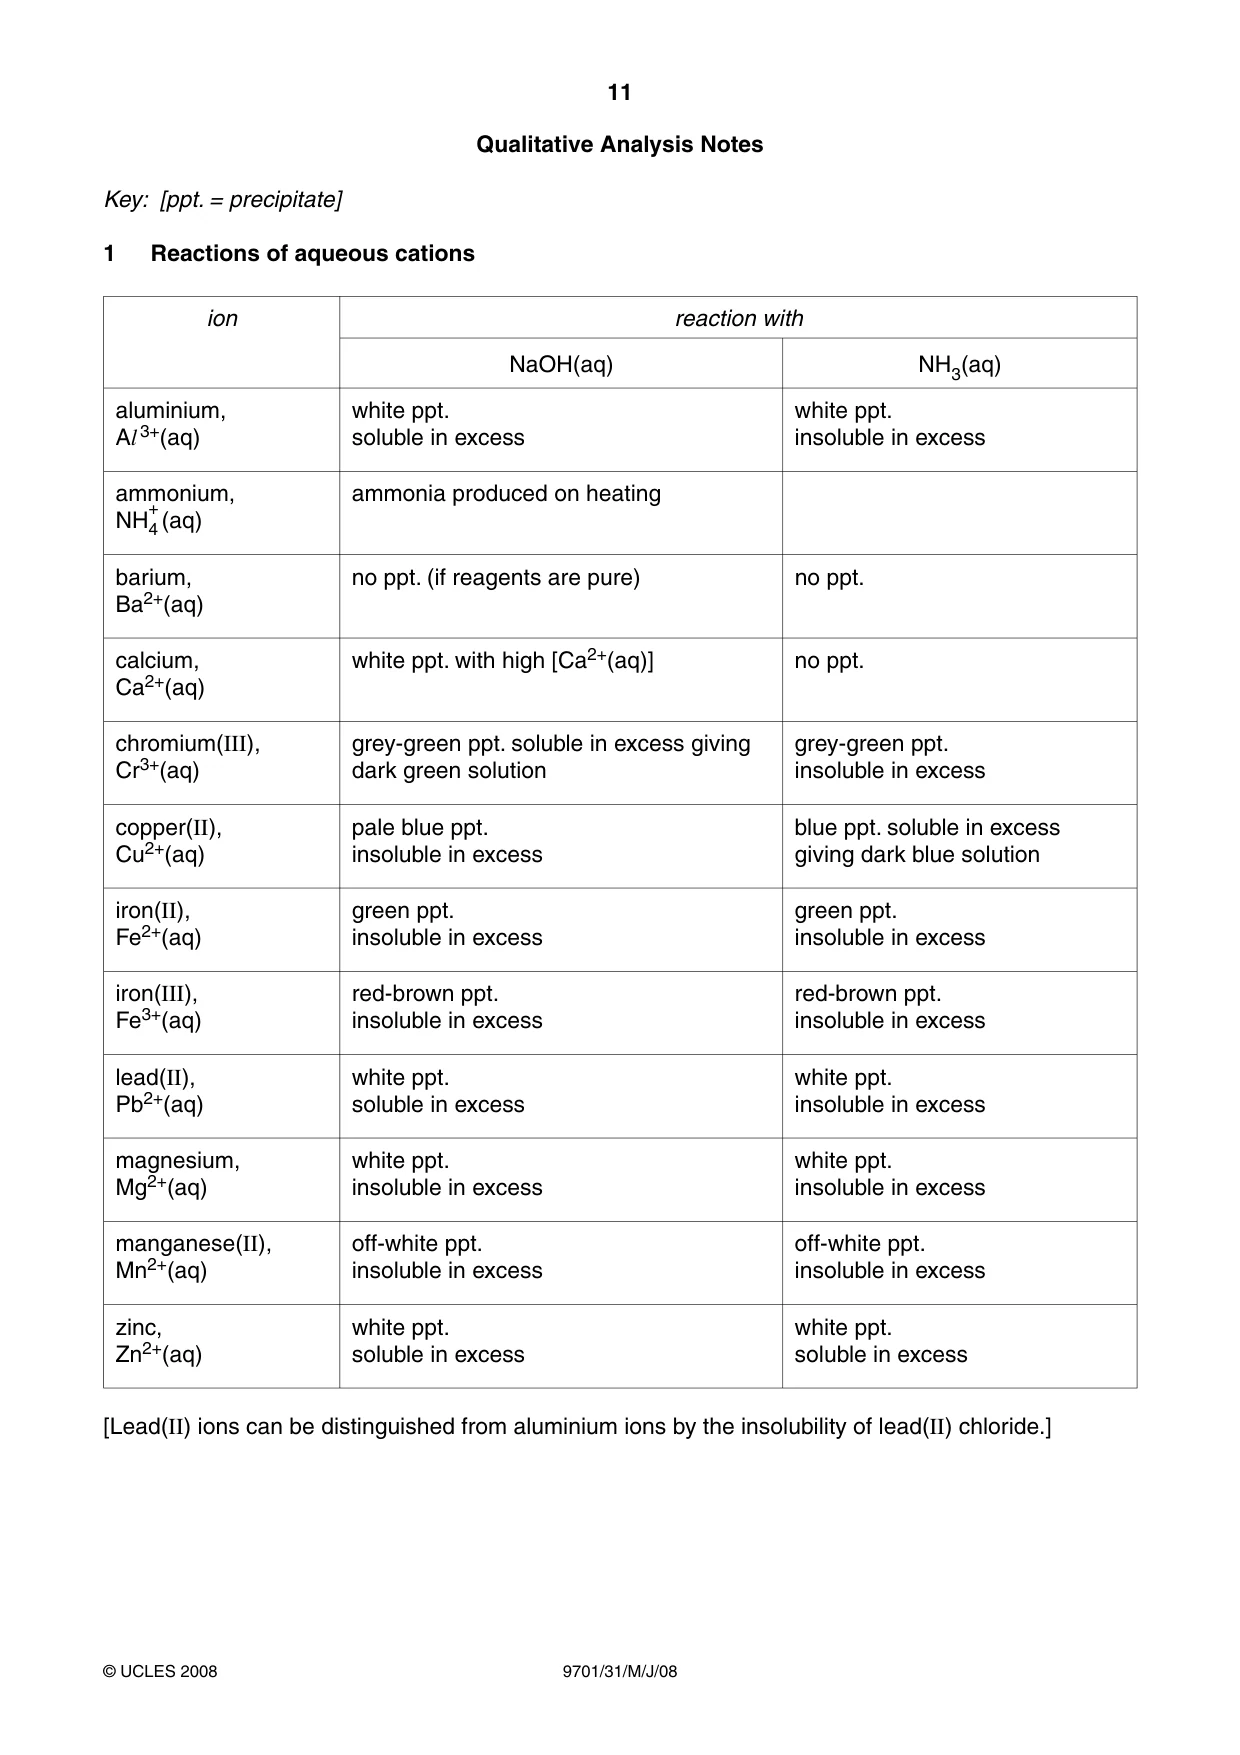
11 9701/31/M/J/08 © UCLES 2008 Qualitative Analysis Notes Key: [ppt. = precipitate] 1 Reactions of aqueous cations ion reaction with NaOH(aq) NH3(aq) aluminium, Al 3+(aq) white ppt. soluble in excess white ppt. insoluble in excess ammonium, NH + 4(aq) ammonia produced on heating barium, Ba2+(aq) no ppt. (if reagents are pure) no ppt. calcium, Ca2+(aq) white ppt. with high [Ca2+(aq)] no ppt. chromium(III), Cr3+(aq) grey-green ppt. soluble in excess giving dark green solution grey-green ppt. insoluble in excess copper(II), Cu2+(aq) pale blue ppt. insoluble in excess blue ppt. soluble in excess giving dark blue solution iron(II), Fe2+(aq) green ppt. insoluble in excess green ppt. insoluble in excess iron(III), Fe3+(aq) red-brown ppt. insoluble in excess red-brown ppt. insoluble in excess lead(II), Pb2+(aq) white ppt. soluble in excess white ppt. insoluble in excess magnesium, Mg2+(aq) white ppt. insoluble in excess white ppt. insoluble in excess manganese(II), Mn2+(aq) off-white ppt. insoluble in excess off-white ppt. insoluble in excess zinc, Zn2+(aq) white ppt. soluble in excess white ppt. soluble in excess [Lead(II) ions can be distinguished from aluminium ions by the insolubility of lead(II) chloride.]
Question paper, page 12
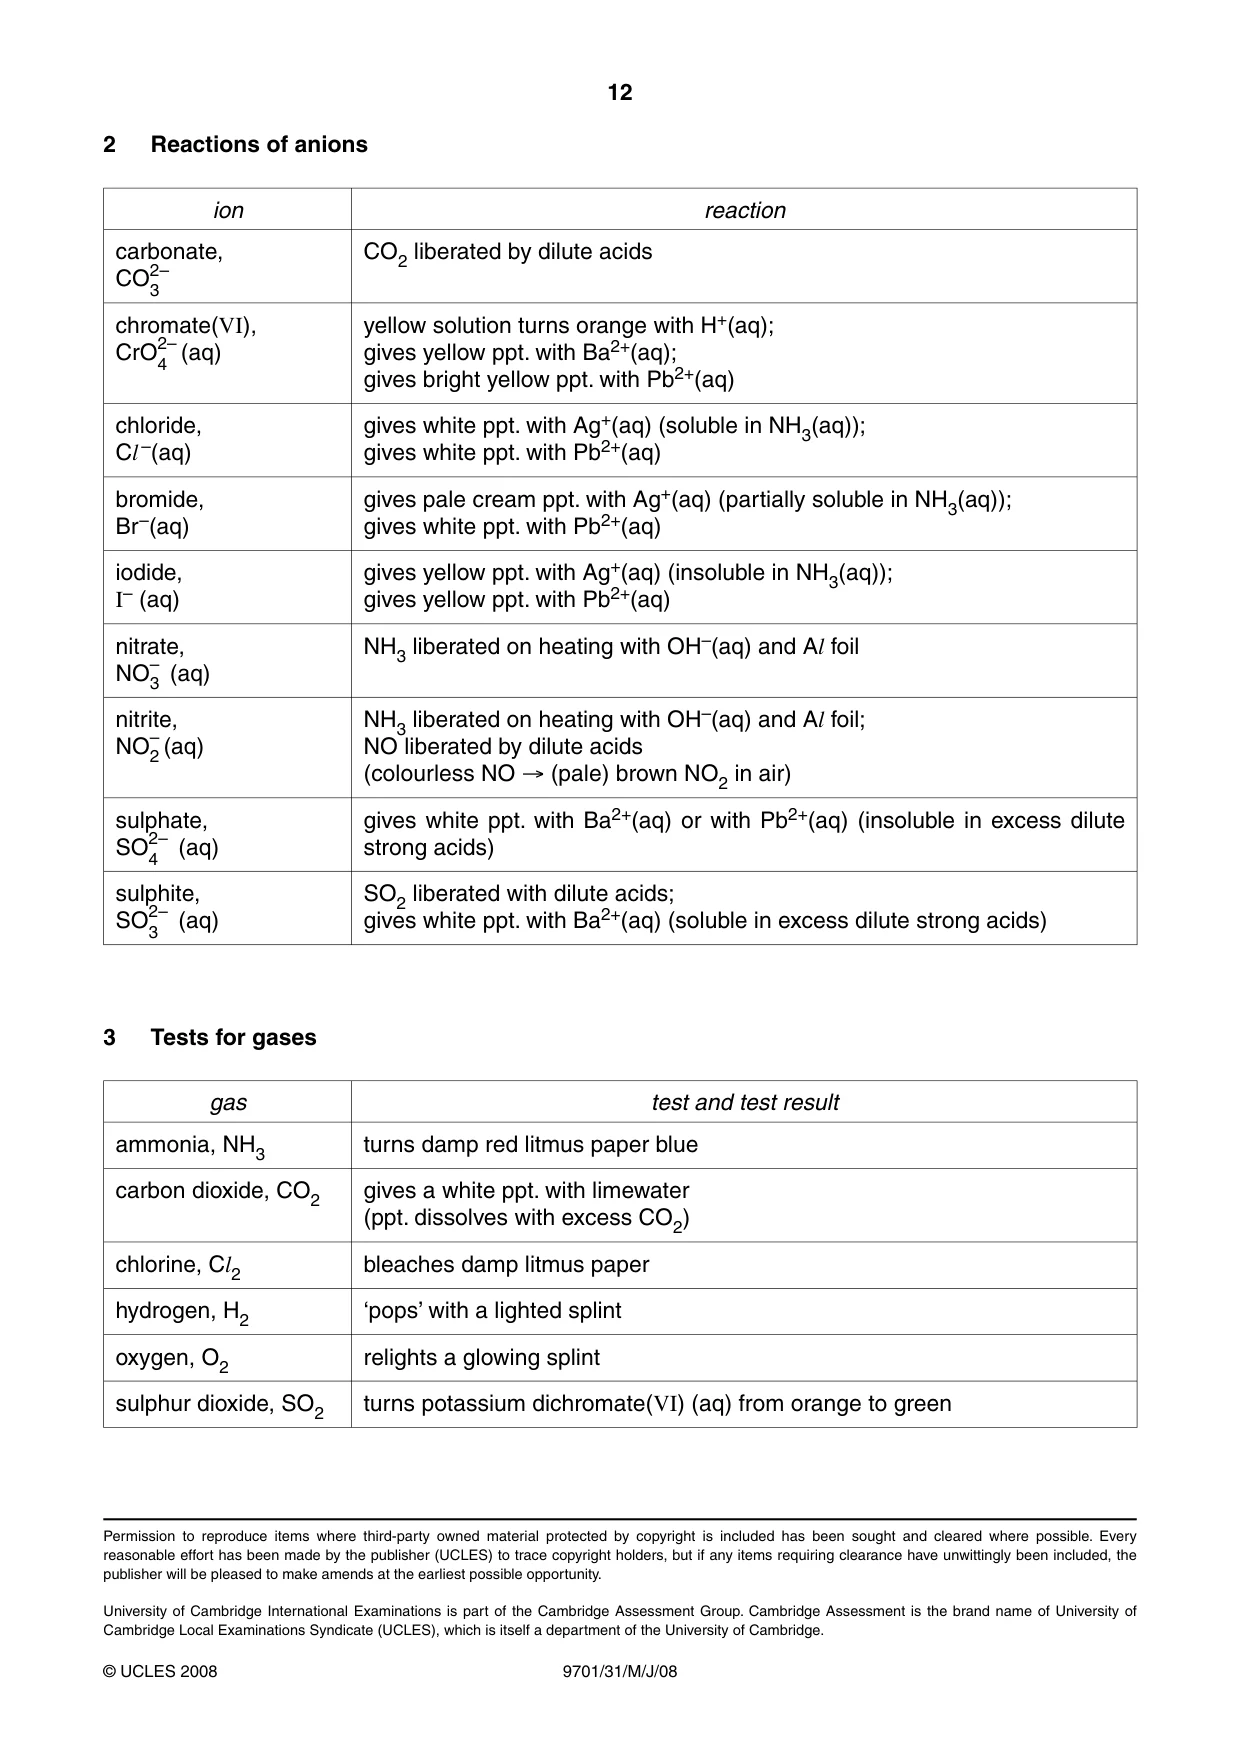
12 9701/31/M/J/08 © UCLES 2008 2 Reactions of anions ion reaction carbonate, CO2– 3 CO2 liberated by dilute acids chromate(VI), CrO2– 4 (aq) yellow solution turns orange with H+(aq); gives yellow ppt. with Ba2+(aq); gives bright yellow ppt. with Pb2+(aq) chloride, Cl –(aq) gives white ppt. with Ag+(aq) (soluble in NH3(aq)); gives white ppt. with Pb2+(aq) bromide, Br –(aq) gives pale cream ppt. with Ag+(aq) (partially soluble in NH3(aq)); gives white ppt. with Pb2+(aq) iodide, I– (aq) gives yellow ppt. with Ag+(aq) (insoluble in NH3(aq)); gives yellow ppt. with Pb2+(aq) nitrate, NO– 3 (aq) NH3 liberated on heating with OH–(aq) and Al foil nitrite, NO– 2 (aq) NH3 liberated on heating with OH–(aq) and Al foil; NO liberated by dilute acids (colourless NO → (pale) brown NO2 in air) sulphate, SO2– 4 (aq) gives white ppt. with Ba2+(aq) or with Pb2+(aq) (insoluble in excess dilute strong acids) sulphite, SO2– 3 (aq) SO2 liberated with dilute acids; gives white ppt. with Ba2+(aq) (soluble in excess dilute strong acids) 3 Tests for gases gas test and test result ammonia, NH3 turns damp red litmus paper blue carbon dioxide, CO2 gives a white ppt. with limewater (ppt. dissolves with excess CO2) chlorine, Cl2 bleaches damp litmus paper hydrogen, H2 ‘pops’ with a lighted splint oxygen, O2 relights a glowing splint sulphur dioxide, SO2 turns potassium dichromate(VI) (aq) from orange to green Permission to reproduce items where third-party owned material protected by copyright is included has been sought and cleared where possible. Every reasonable effort has been made by the publisher (UCLES) to trace copyright holders, but if any items requiring clearance have unwittingly been included, the publisher will be pleased to make amends at the earliest possible opportunity. University of Cambridge International Examinations is part of the Cambridge Assessment Group. Cambridge Assessment is the brand name of University of Cambridge Local Examinations Syndicate (UCLES), which is itself a department of the University of Cambridge.
Mark scheme, page 1
UNIVERSITY OF CAMBRIDGE INTERNATIONAL EXAMINATIONS GCE Advanced Subsidiary Level and GCE Advanced Level MARK SCHEME for the May/June 2008 question paper 9701 CHEMISTRY 9701/31 Paper 31 (Advanced Practical Skills 1), maximum raw mark 40 Mark schemes must be read in conjunction with the question papers and the report on the examination. • CIE will not enter into discussions or correspondence in connection with these mark schemes. CIE is publishing the mark schemes for the May/June 2008 question papers for most IGCSE, GCE Advanced Level and Advanced Subsidiary Level syllabuses and some Ordinary Level syllabuses.
Mark scheme, page 2
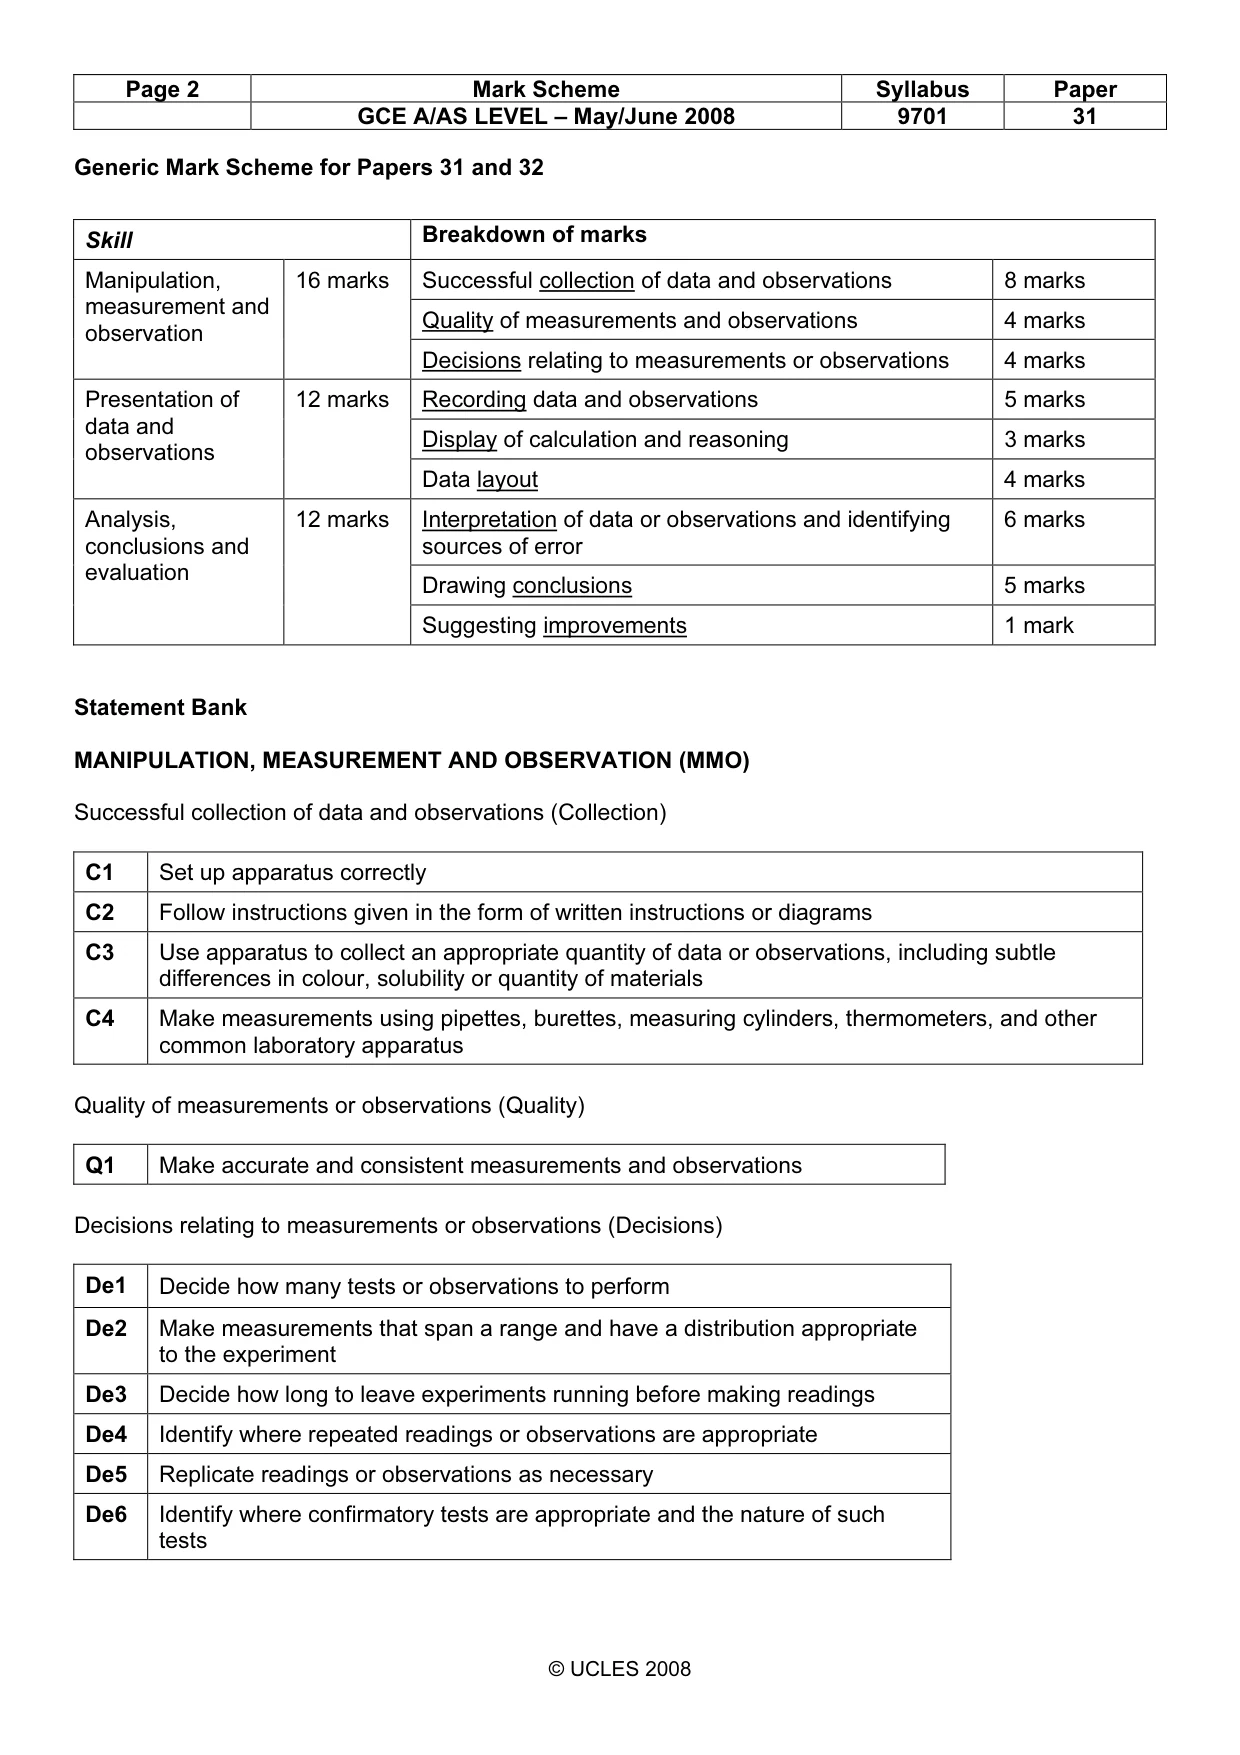
Page 2 Mark Scheme Syllabus Paper GCE A/AS LEVEL – May/June 2008 9701 31 © UCLES 2008 Generic Mark Scheme for Papers 31 and 32 Statement Bank MANIPULATION, MEASUREMENT AND OBSERVATION (MMO) Successful collection of data and observations (Collection) C1 Set up apparatus correctly C2 Follow instructions given in the form of written instructions or diagrams C3 Use apparatus to collect an appropriate quantity of data or observations, including subtle differences in colour, solubility or quantity of materials C4 Make measurements using pipettes, burettes, measuring cylinders, thermometers, and other common laboratory apparatus Quality of measurements or observations (Quality) Q1 Make accurate and consistent measurements and observations Decisions relating to measurements or observations (Decisions) De1 Decide how many tests or observations to perform De2 Make measurements that span a range and have a distribution appropriate to the experiment De3 Decide how long to leave experiments running before making readings De4 Identify where repeated readings or observations are appropriate De5 Replicate readings or observations as necessary De6 Identify where confirmatory tests are appropriate and the nature of such tests Skill Breakdown of marks Successful collection of data and observations 8 marks Quality of measurements and observations 4 marks Manipulation, measurement and observation 16 marks Decisions relating to measurements or observations 4 marks Recording data and observations 5 marks Display of calculation and reasoning 3 marks Presentation of data and observations 12 marks Data layout 4 marks Interpretation of data or observations and identifying sources of error 6 marks Drawing conclusions 5 marks Analysis, conclusions and evaluation 12 marks Suggesting improvements 1 mark
Mark scheme, page 3
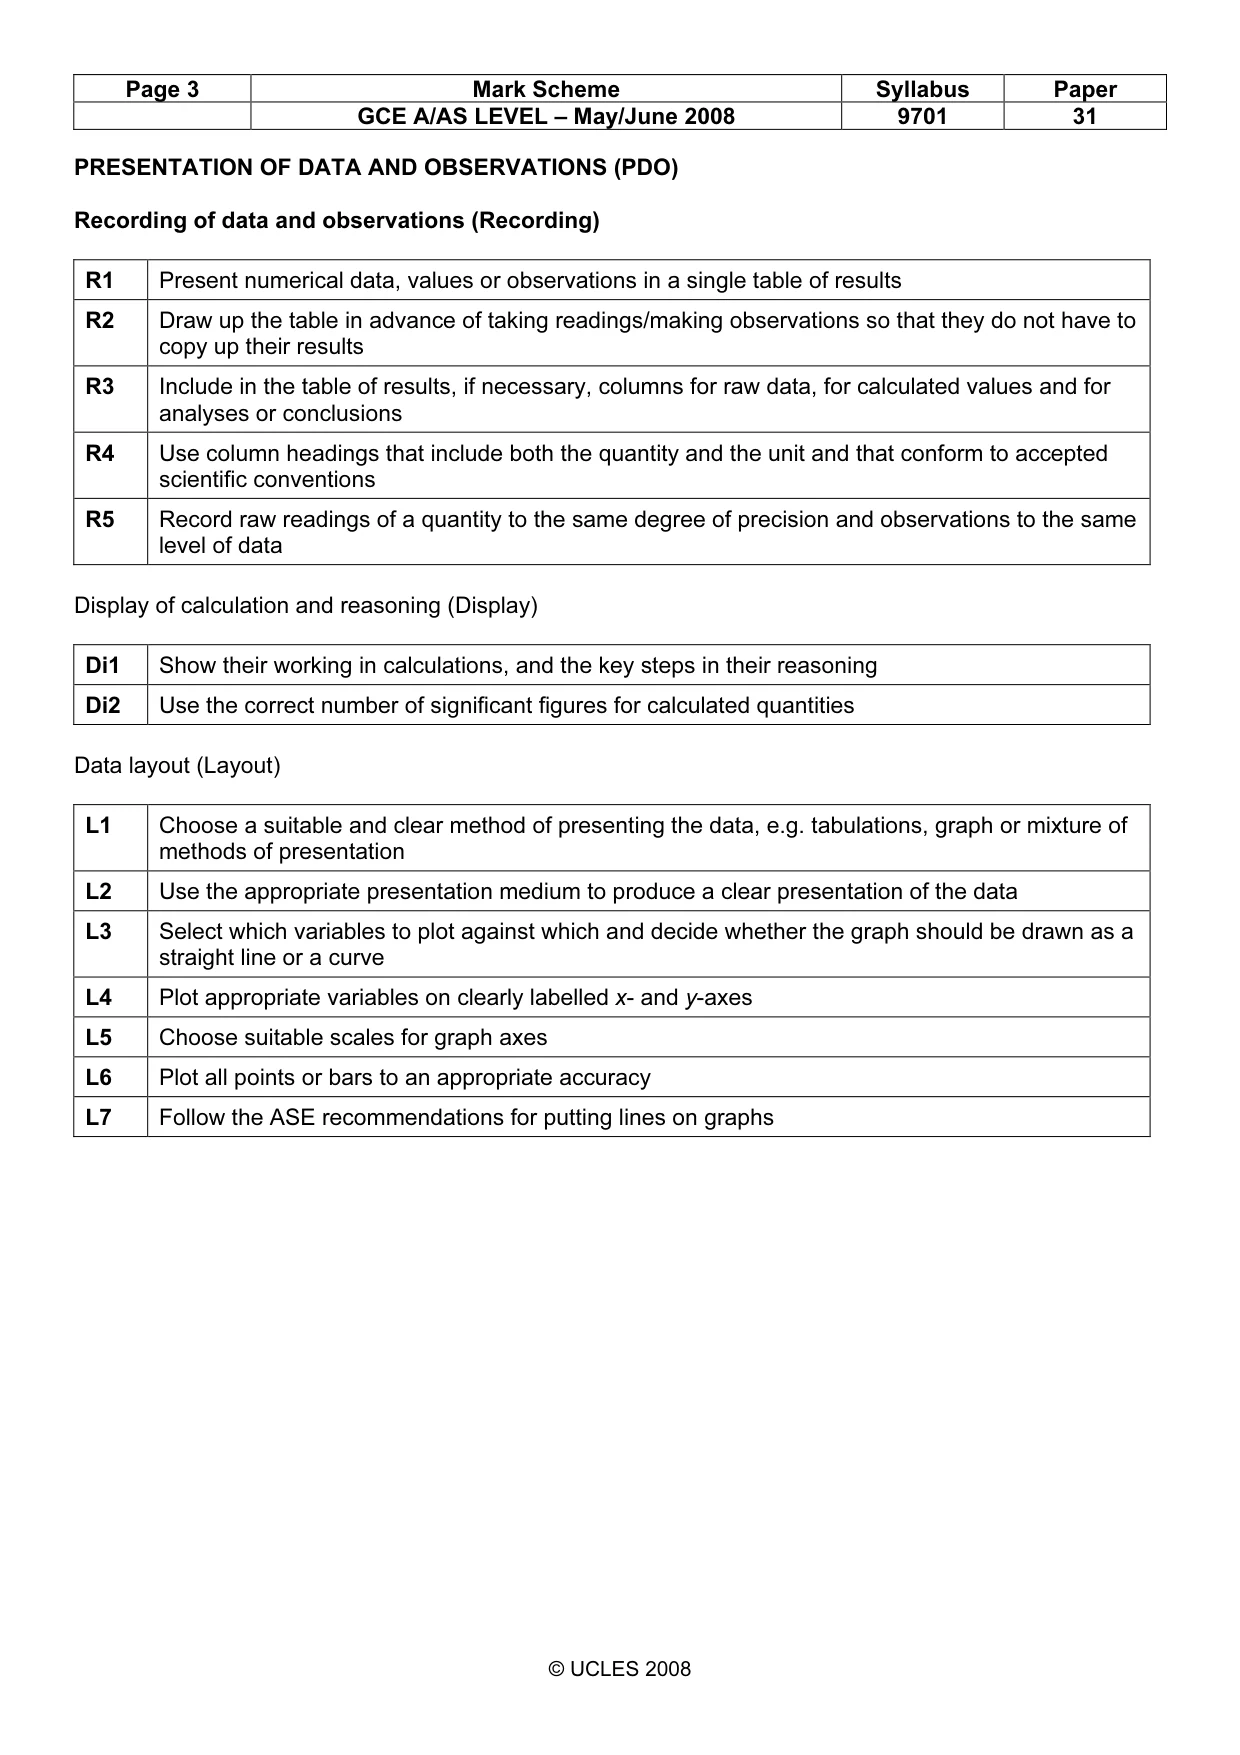
Page 3 Mark Scheme Syllabus Paper GCE A/AS LEVEL – May/June 2008 9701 31 © UCLES 2008 PRESENTATION OF DATA AND OBSERVATIONS (PDO) Recording of data and observations (Recording) R1 Present numerical data, values or observations in a single table of results R2 Draw up the table in advance of taking readings/making observations so that they do not have to copy up their results R3 Include in the table of results, if necessary, columns for raw data, for calculated values and for analyses or conclusions R4 Use column headings that include both the quantity and the unit and that conform to accepted scientific conventions R5 Record raw readings of a quantity to the same degree of precision and observations to the same level of data Display of calculation and reasoning (Display) Di1 Show their working in calculations, and the key steps in their reasoning Di2 Use the correct number of significant figures for calculated quantities Data layout (Layout) L1 Choose a suitable and clear method of presenting the data, e.g. tabulations, graph or mixture of methods of presentation L2 Use the appropriate presentation medium to produce a clear presentation of the data L3 Select which variables to plot against which and decide whether the graph should be drawn as a straight line or a curve L4 Plot appropriate variables on clearly labelled x- and y-axes L5 Choose suitable scales for graph axes L6 Plot all points or bars to an appropriate accuracy L7 Follow the ASE recommendations for putting lines on graphs
Mark scheme, page 4
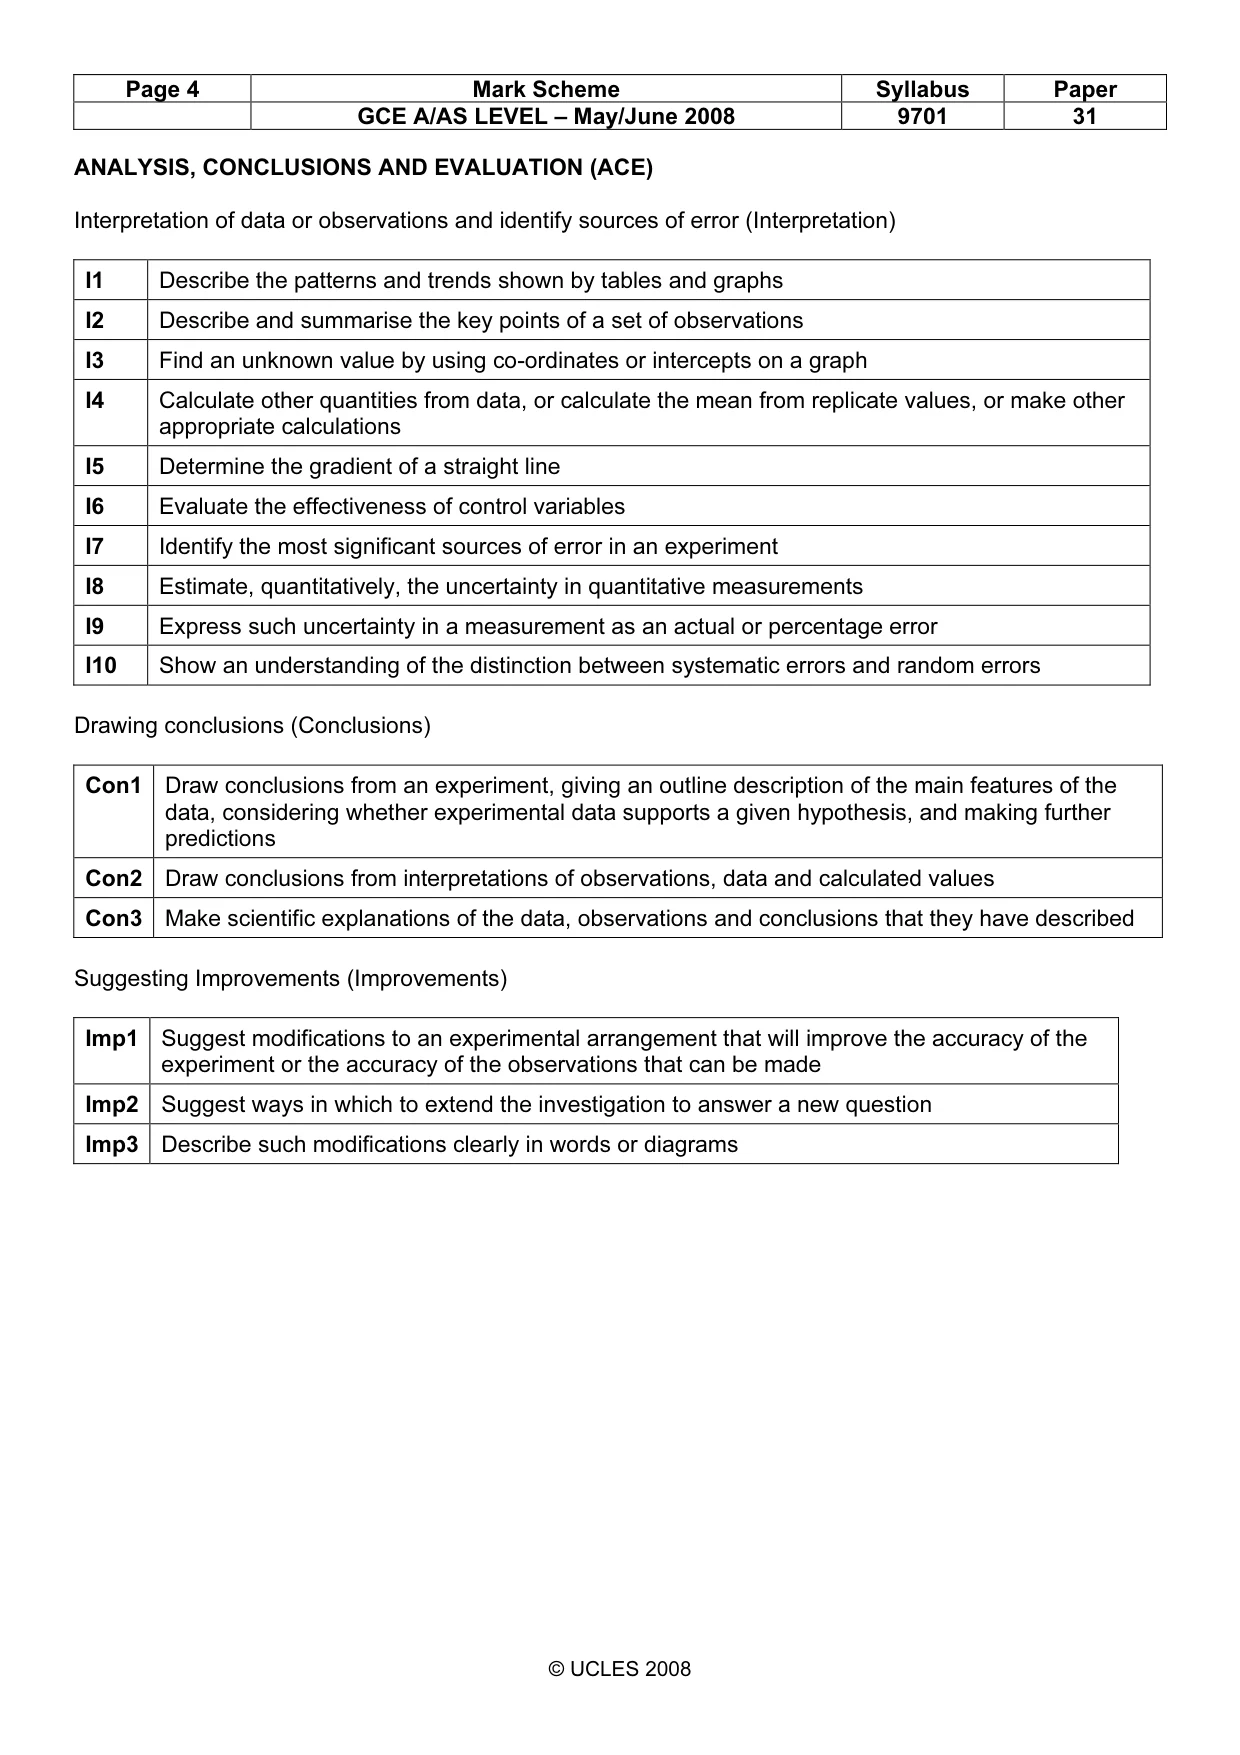
Page 4 Mark Scheme Syllabus Paper GCE A/AS LEVEL – May/June 2008 9701 31 © UCLES 2008 ANALYSIS, CONCLUSIONS AND EVALUATION (ACE) Interpretation of data or observations and identify sources of error (Interpretation) I1 Describe the patterns and trends shown by tables and graphs I2 Describe and summarise the key points of a set of observations I3 Find an unknown value by using co-ordinates or intercepts on a graph I4 Calculate other quantities from data, or calculate the mean from replicate values, or make other appropriate calculations I5 Determine the gradient of a straight line I6 Evaluate the effectiveness of control variables I7 Identify the most significant sources of error in an experiment I8 Estimate, quantitatively, the uncertainty in quantitative measurements I9 Express such uncertainty in a measurement as an actual or percentage error I10 Show an understanding of the distinction between systematic errors and random errors Drawing conclusions (Conclusions) Con1 Draw conclusions from an experiment, giving an outline description of the main features of the data, considering whether experimental data supports a given hypothesis, and making further predictions Con2 Draw conclusions from interpretations of observations, data and calculated values Con3 Make scientific explanations of the data, observations and conclusions that they have described Suggesting Improvements (Improvements) Imp1 Suggest modifications to an experimental arrangement that will improve the accuracy of the experiment or the accuracy of the observations that can be made Imp2 Suggest ways in which to extend the investigation to answer a new question Imp3 Describe such modifications clearly in words or diagrams
Mark scheme, page 5
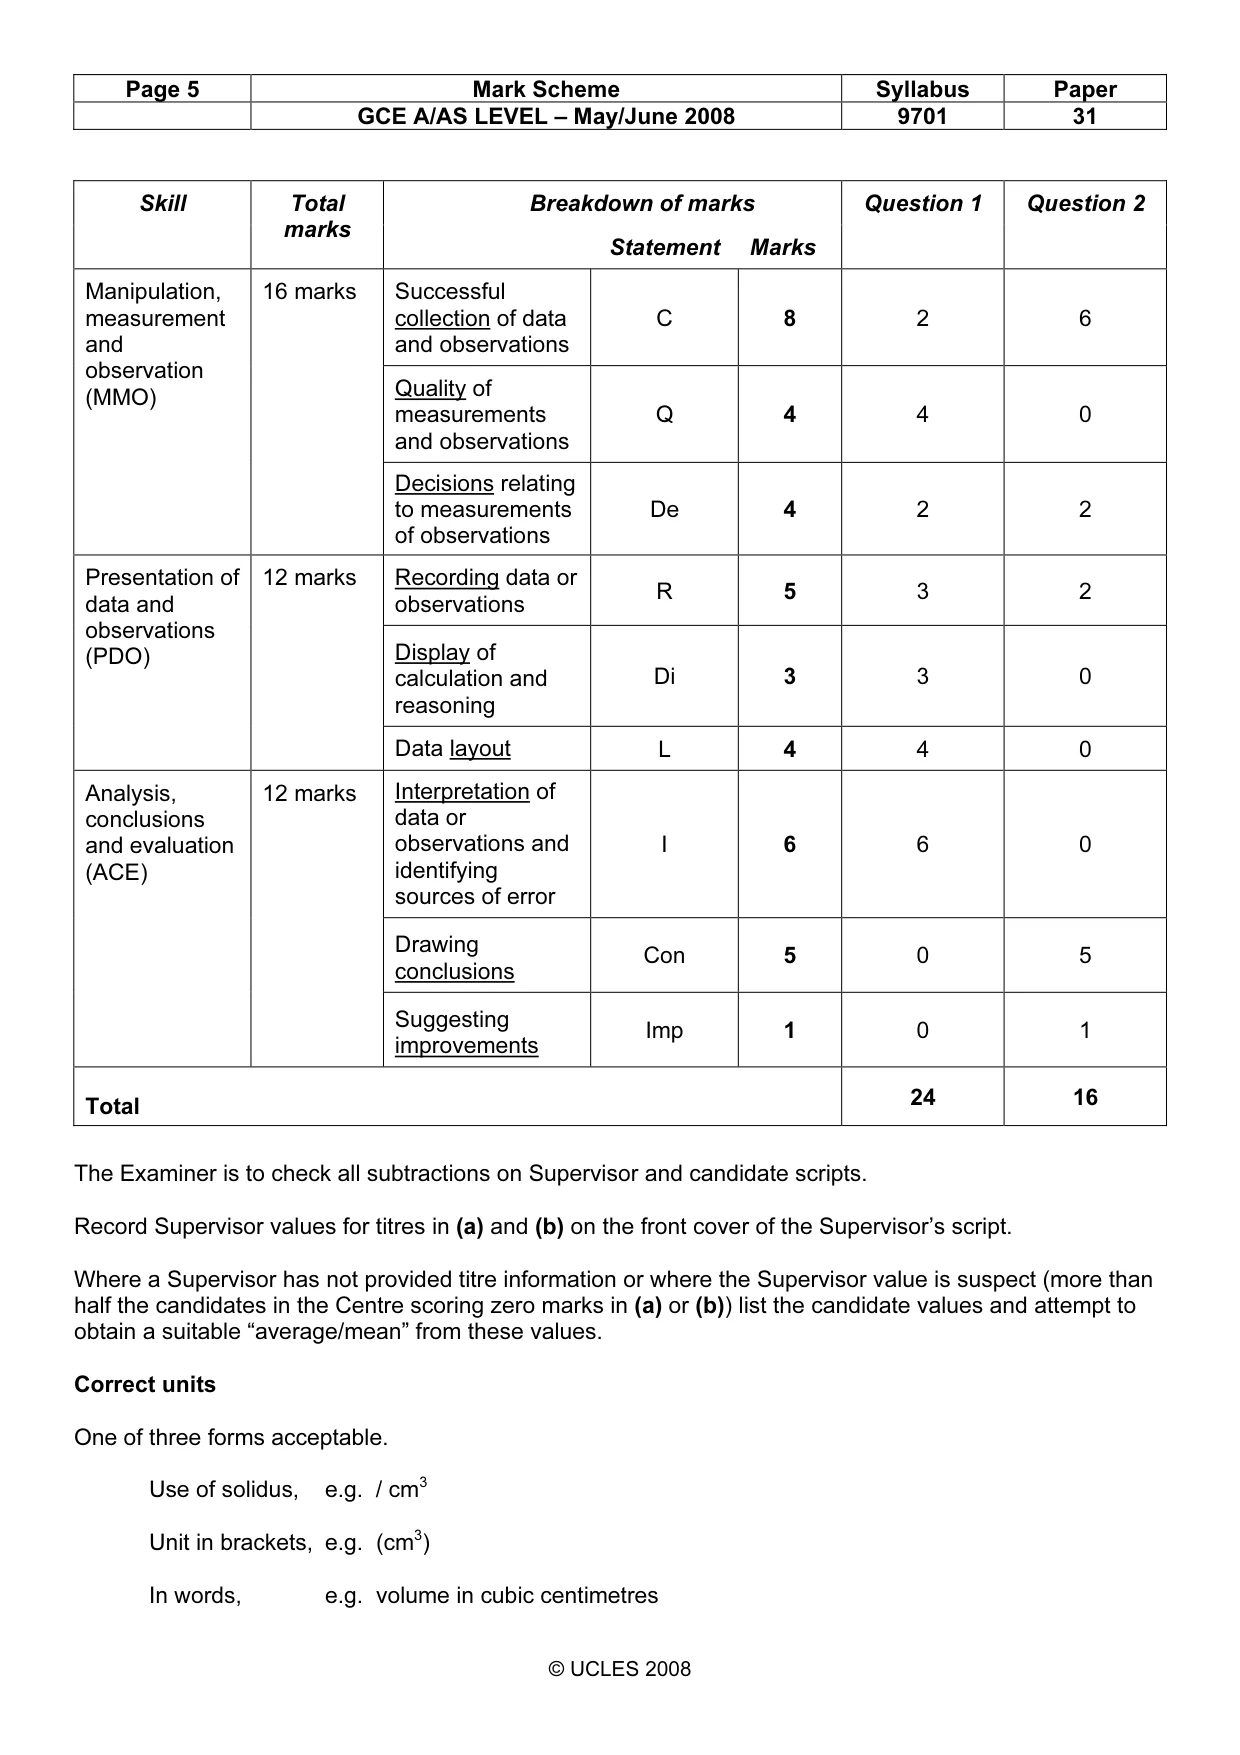
Page 5 Mark Scheme Syllabus Paper GCE A/AS LEVEL – May/June 2008 9701 31 © UCLES 2008 Breakdown of marks Question 1 Question 2 Skill Total marks Statement Marks Successful collection of data and observations C 8 2 6 Quality of measurements and observations Q 4 4 0 Manipulation, measurement and observation (MMO) 16 marks Decisions relating to measurements of observations De 4 2 2 Recording data or observations R 5 3 2 Display of calculation and reasoning Di 3 3 0 Presentation of data and observations (PDO) 12 marks Data layout L 4 4 0 Interpretation of data or observations and identifying sources of error I 6 6 0 Drawing conclusions Con 5 0 5 Analysis, conclusions and evaluation (ACE) 12 marks Suggesting improvements Imp 1 0 1 Total 24 16 The Examiner is to check all subtractions on Supervisor and candidate scripts. Record Supervisor values for titres in (a) and (b) on the front cover of the Supervisor’s script. Where a Supervisor has not provided titre information or where the Supervisor value is suspect (more than half the candidates in the Centre scoring zero marks in (a) or (b)) list the candidate values and attempt to obtain a suitable “average/mean” from these values. Correct units One of three forms acceptable. Use of solidus, e.g. / cm3 Unit in brackets, e.g. (cm3) In words, e.g. volume in cubic centimetres
Mark scheme, page 6
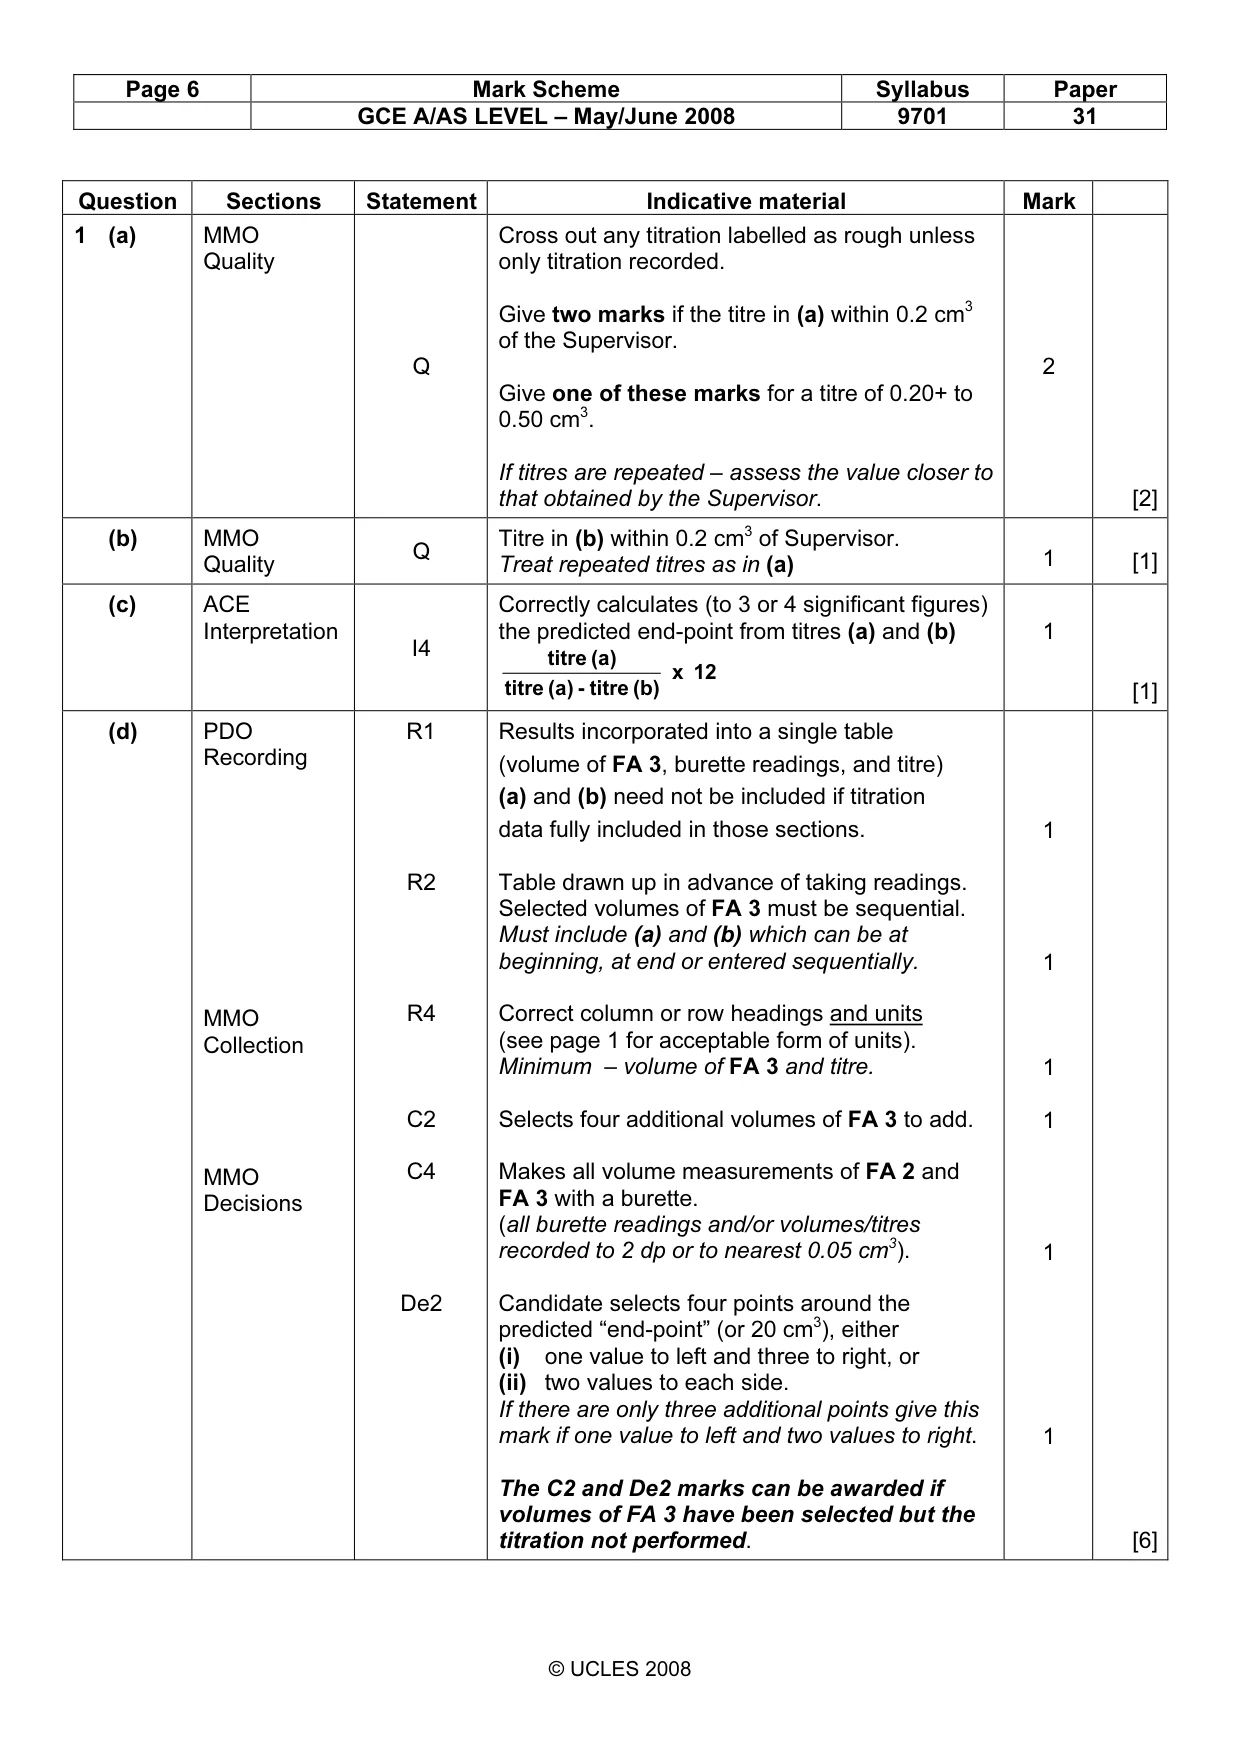
Page 6 Mark Scheme Syllabus Paper GCE A/AS LEVEL – May/June 2008 9701 31 © UCLES 2008 Question Sections Statement Indicative material Mark 1 (a) MMO Quality Q Cross out any titration labelled as rough unless only titration recorded. Give two marks if the titre in (a) within 0.2 cm3 of the Supervisor. Give one of these marks for a titre of 0.20+ to 0.50 cm3. If titres are repeated – assess the value closer to that obtained by the Supervisor. 2 [2] (b) MMO Quality Q Titre in (b) within 0.2 cm3 of Supervisor. Treat repeated titres as in (a) 1 [1] (c) ACE Interpretation I4 Correctly calculates (to 3 or 4 significant figures) the predicted end-point from titres (a) and (b) 12 x (b) titre - (a) titre (a) titre 1 [1] (d) PDO Recording MMO Collection MMO Decisions R1 R2 R4 C2 C4 De2 Results incorporated into a single table (volume of FA 3, burette readings, and titre) (a) and (b) need not be included if titration data fully included in those sections. Table drawn up in advance of taking readings. Selected volumes of FA 3 must be sequential. Must include (a) and (b) which can be at beginning, at end or entered sequentially. Correct column or row headings and units (see page 1 for acceptable form of units). Minimum – volume of FA 3 and titre. Selects four additional volumes of FA 3 to add. Makes all volume measurements of FA 2 and FA 3 with a burette. (all burette readings and/or volumes/titres recorded to 2 dp or to nearest 0.05 cm3). Candidate selects four points around the predicted “end-point” (or 20 cm3), either (i) one value to left and three to right, or (ii) two values to each side. If there are only three additional points give this mark if one value to left and two values to right. The C2 and De2 marks can be awarded if volumes of FA 3 have been selected but the titration not performed. 1 1 1 1 1 1 [6]
Mark scheme, page 7
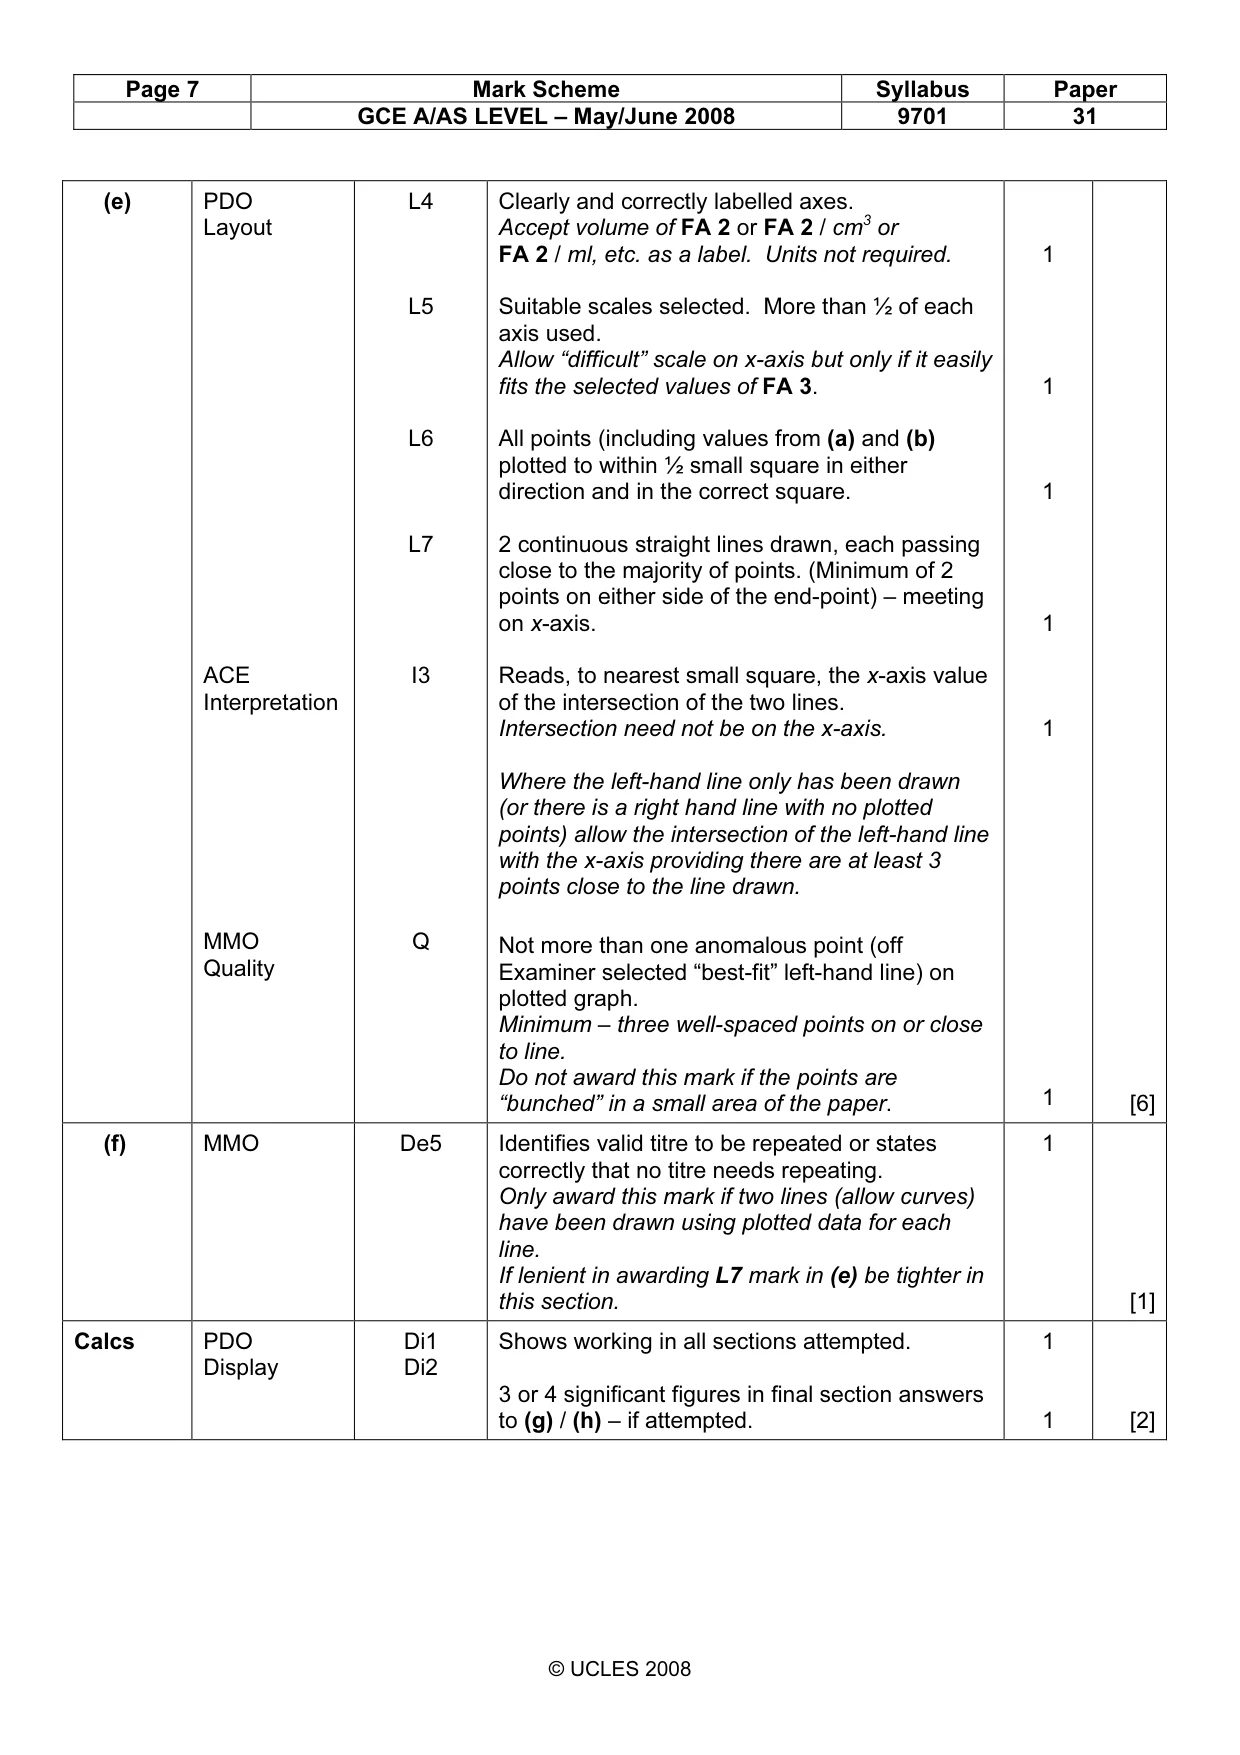
Page 7 Mark Scheme Syllabus Paper GCE A/AS LEVEL – May/June 2008 9701 31 © UCLES 2008 (e) PDO Layout ACE Interpretation MMO Quality L4 L5 L6 L7 I3 Q Clearly and correctly labelled axes. Accept volume of FA 2 or FA 2 / cm3 or FA 2 / ml, etc. as a label. Units not required. Suitable scales selected. More than ½ of each axis used. Allow “difficult” scale on x-axis but only if it easily fits the selected values of FA 3. All points (including values from (a) and (b) plotted to within ½ small square in either direction and in the correct square. 2 continuous straight lines drawn, each passing close to the majority of points. (Minimum of 2 points on either side of the end-point) – meeting on x-axis. Reads, to nearest small square, the x-axis value of the intersection of the two lines. Intersection need not be on the x-axis. Where the left-hand line only has been drawn (or there is a right hand line with no plotted points) allow the intersection of the left-hand line with the x-axis providing there are at least 3 points close to the line drawn. Not more than one anomalous point (off Examiner selected “best-fit” left-hand line) on plotted graph. Minimum – three well-spaced points on or close to line. Do not award this mark if the points are “bunched” in a small area of the paper. 1 1 1 1 1 1 [6] (f) MMO De5 Identifies valid titre to be repeated or states correctly that no titre needs repeating. Only award this mark if two lines (allow curves) have been drawn using plotted data for each line. If lenient in awarding L7 mark in (e) be tighter in this section. 1 [1] Calcs PDO Display Di1 Di2 Shows working in all sections attempted. 3 or 4 significant figures in final section answers to (g) / (h) – if attempted. 1 1 [2]
Mark scheme, page 8
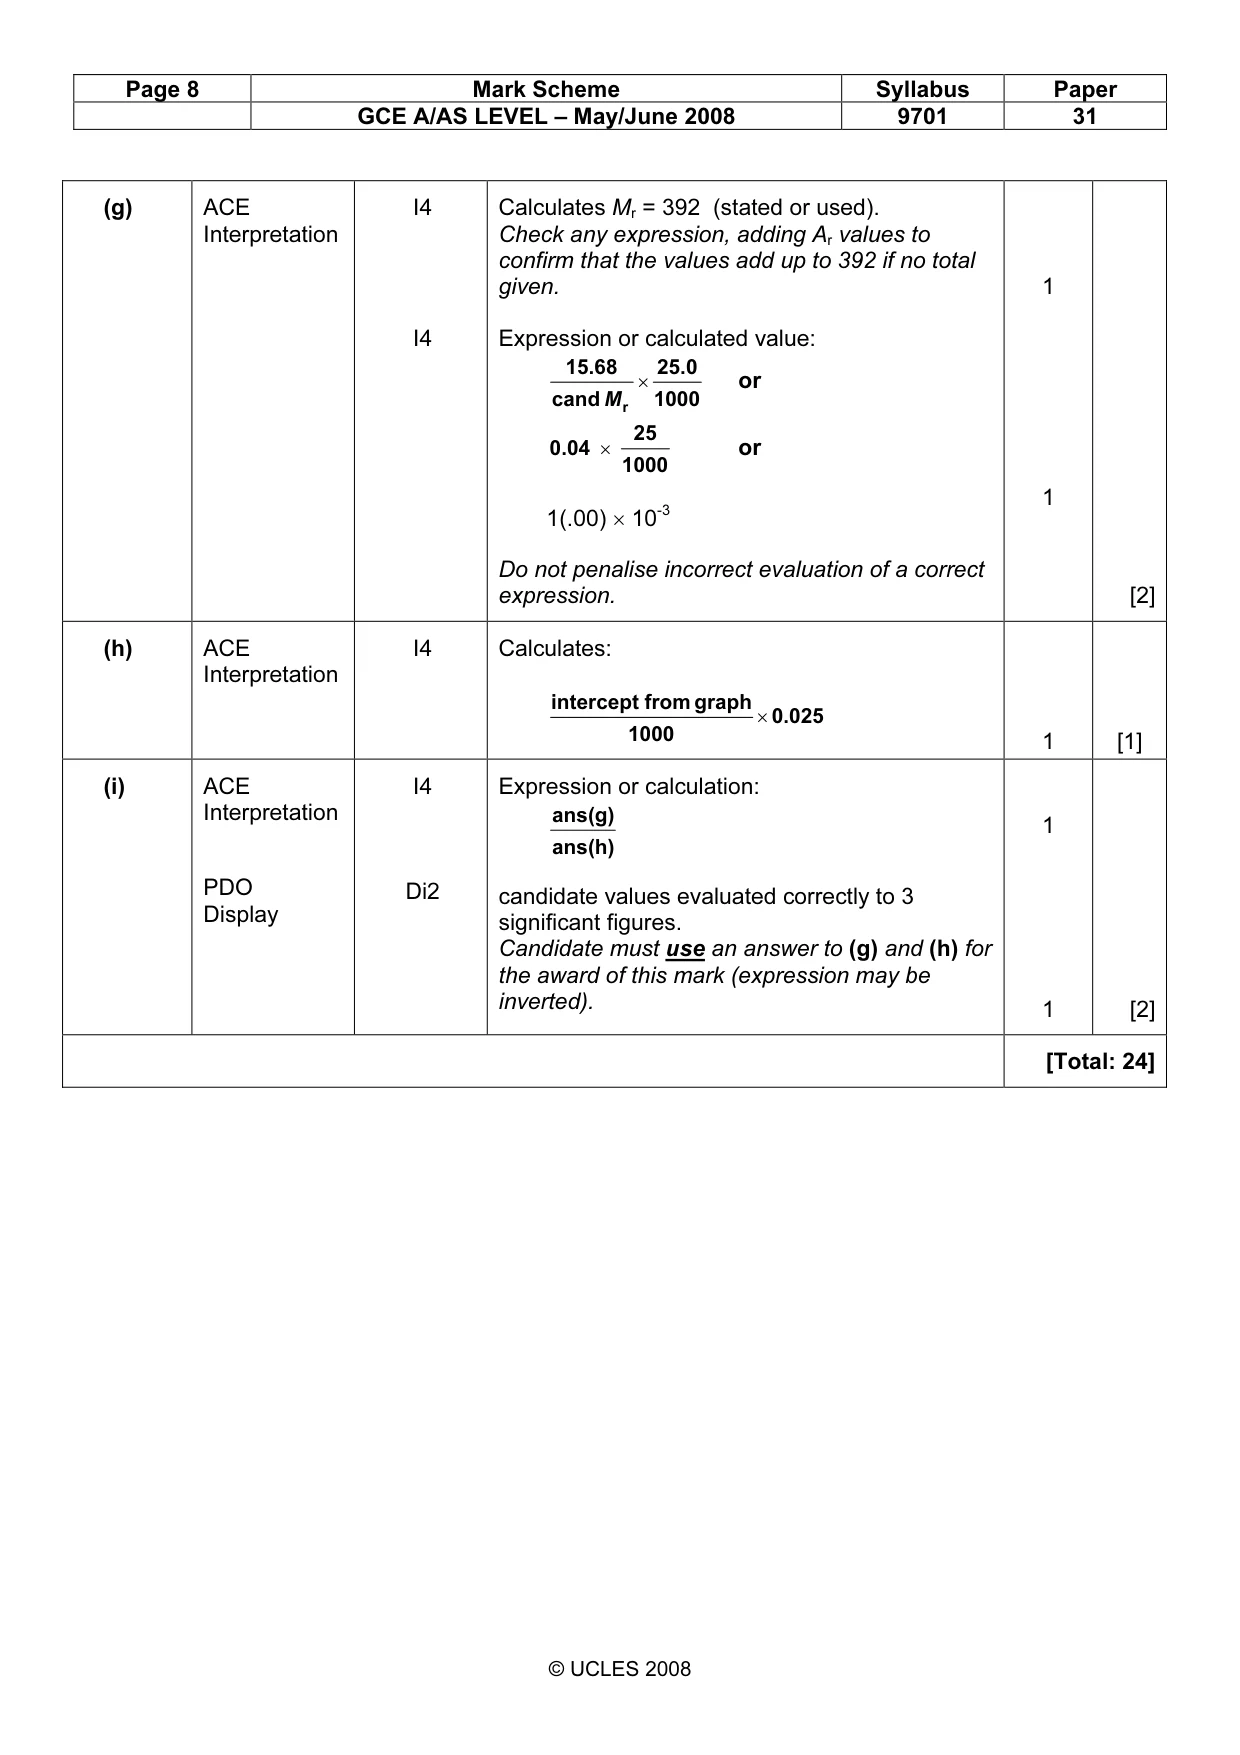
Page 8 Mark Scheme Syllabus Paper GCE A/AS LEVEL – May/June 2008 9701 31 © UCLES 2008 (g) ACE Interpretation I4 I4 Calculates Mr = 392 (stated or used). Check any expression, adding Ar values to confirm that the values add up to 392 if no total given. Expression or calculated value: 1000 25.0 cand 15.68 r × M or 1000 25 0.04 × or 1(.00) × 10-3 Do not penalise incorrect evaluation of a correct expression. 1 1 [2] (h) ACE Interpretation I4 Calculates: 0.025 1000 graph from intercept × 1 [1] (i) ACE Interpretation PDO Display I4 Di2 Expression or calculation: ans(h) ans(g) candidate values evaluated correctly to 3 significant figures. Candidate must use an answer to (g) and (h) for the award of this mark (expression may be inverted). 1 1 [2] [Total: 24]
Mark scheme, page 9
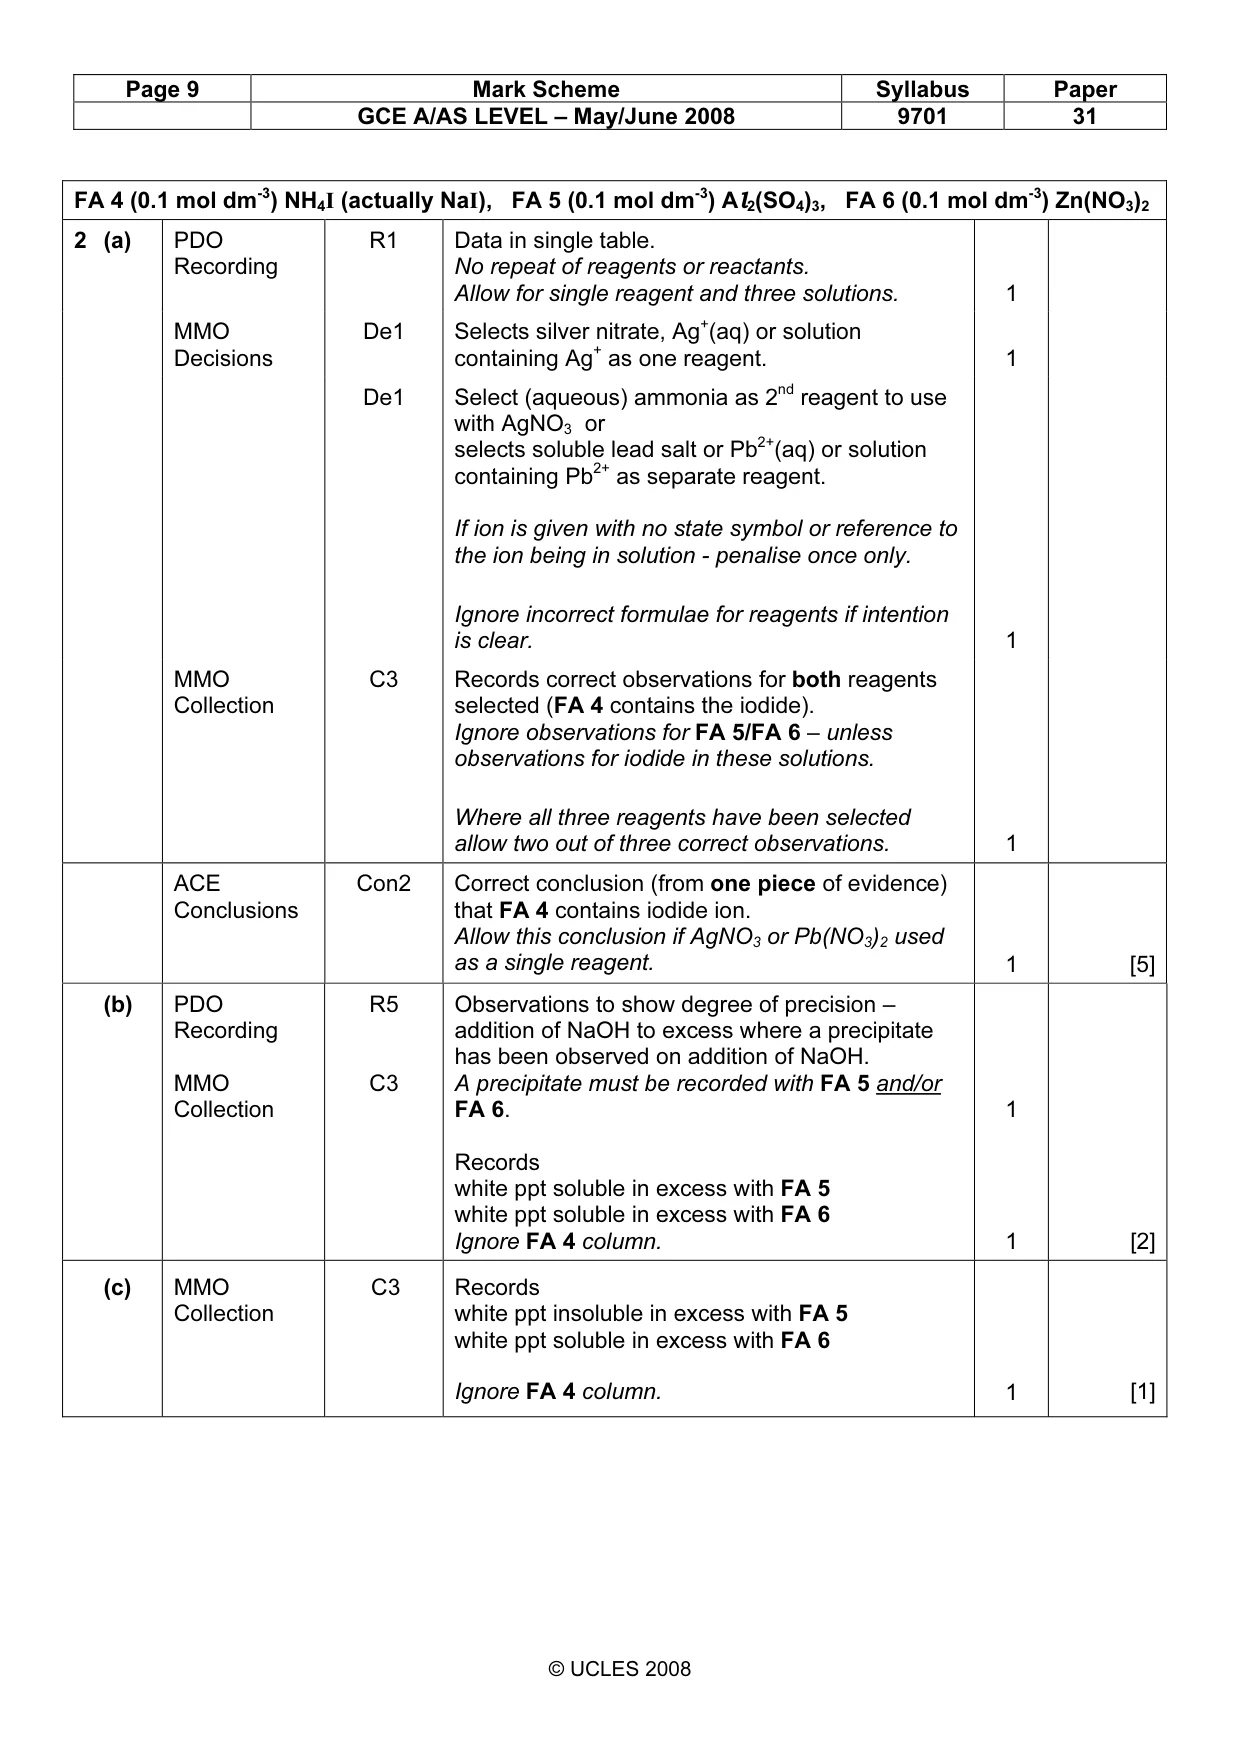
Page 9 Mark Scheme Syllabus Paper GCE A/AS LEVEL – May/June 2008 9701 31 © UCLES 2008 FA 4 (0.1 mol dm-3) NH4I (actually NaI), FA 5 (0.1 mol dm-3) Al2(SO4)3, FA 6 (0.1 mol dm-3) Zn(NO3)2 2 (a) PDO Recording R1 Data in single table. No repeat of reagents or reactants. Allow for single reagent and three solutions. 1 MMO Decisions De1 Selects silver nitrate, Ag+(aq) or solution containing Ag+ as one reagent. 1 De1 Select (aqueous) ammonia as 2nd reagent to use with AgNO3 or selects soluble lead salt or Pb2+(aq) or solution containing Pb2+ as separate reagent. If ion is given with no state symbol or reference to the ion being in solution - penalise once only. Ignore incorrect formulae for reagents if intention is clear. 1 MMO Collection C3 Records correct observations for both reagents selected (FA 4 contains the iodide). Ignore observations for FA 5/FA 6 – unless observations for iodide in these solutions. Where all three reagents have been selected allow two out of three correct observations. 1 ACE Conclusions Con2 Correct conclusion (from one piece of evidence) that FA 4 contains iodide ion. Allow this conclusion if AgNO3 or Pb(NO3)2 used as a single reagent. 1 [5] (b) PDO Recording MMO Collection R5 C3 Observations to show degree of precision – addition of NaOH to excess where a precipitate has been observed on addition of NaOH. A precipitate must be recorded with FA 5 and/or FA 6. Records white ppt soluble in excess with FA 5 white ppt soluble in excess with FA 6 Ignore FA 4 column. 1 1 [2] (c) MMO Collection C3 Records white ppt insoluble in excess with FA 5 white ppt soluble in excess with FA 6 Ignore FA 4 column. 1 [1]
Mark scheme, page 10
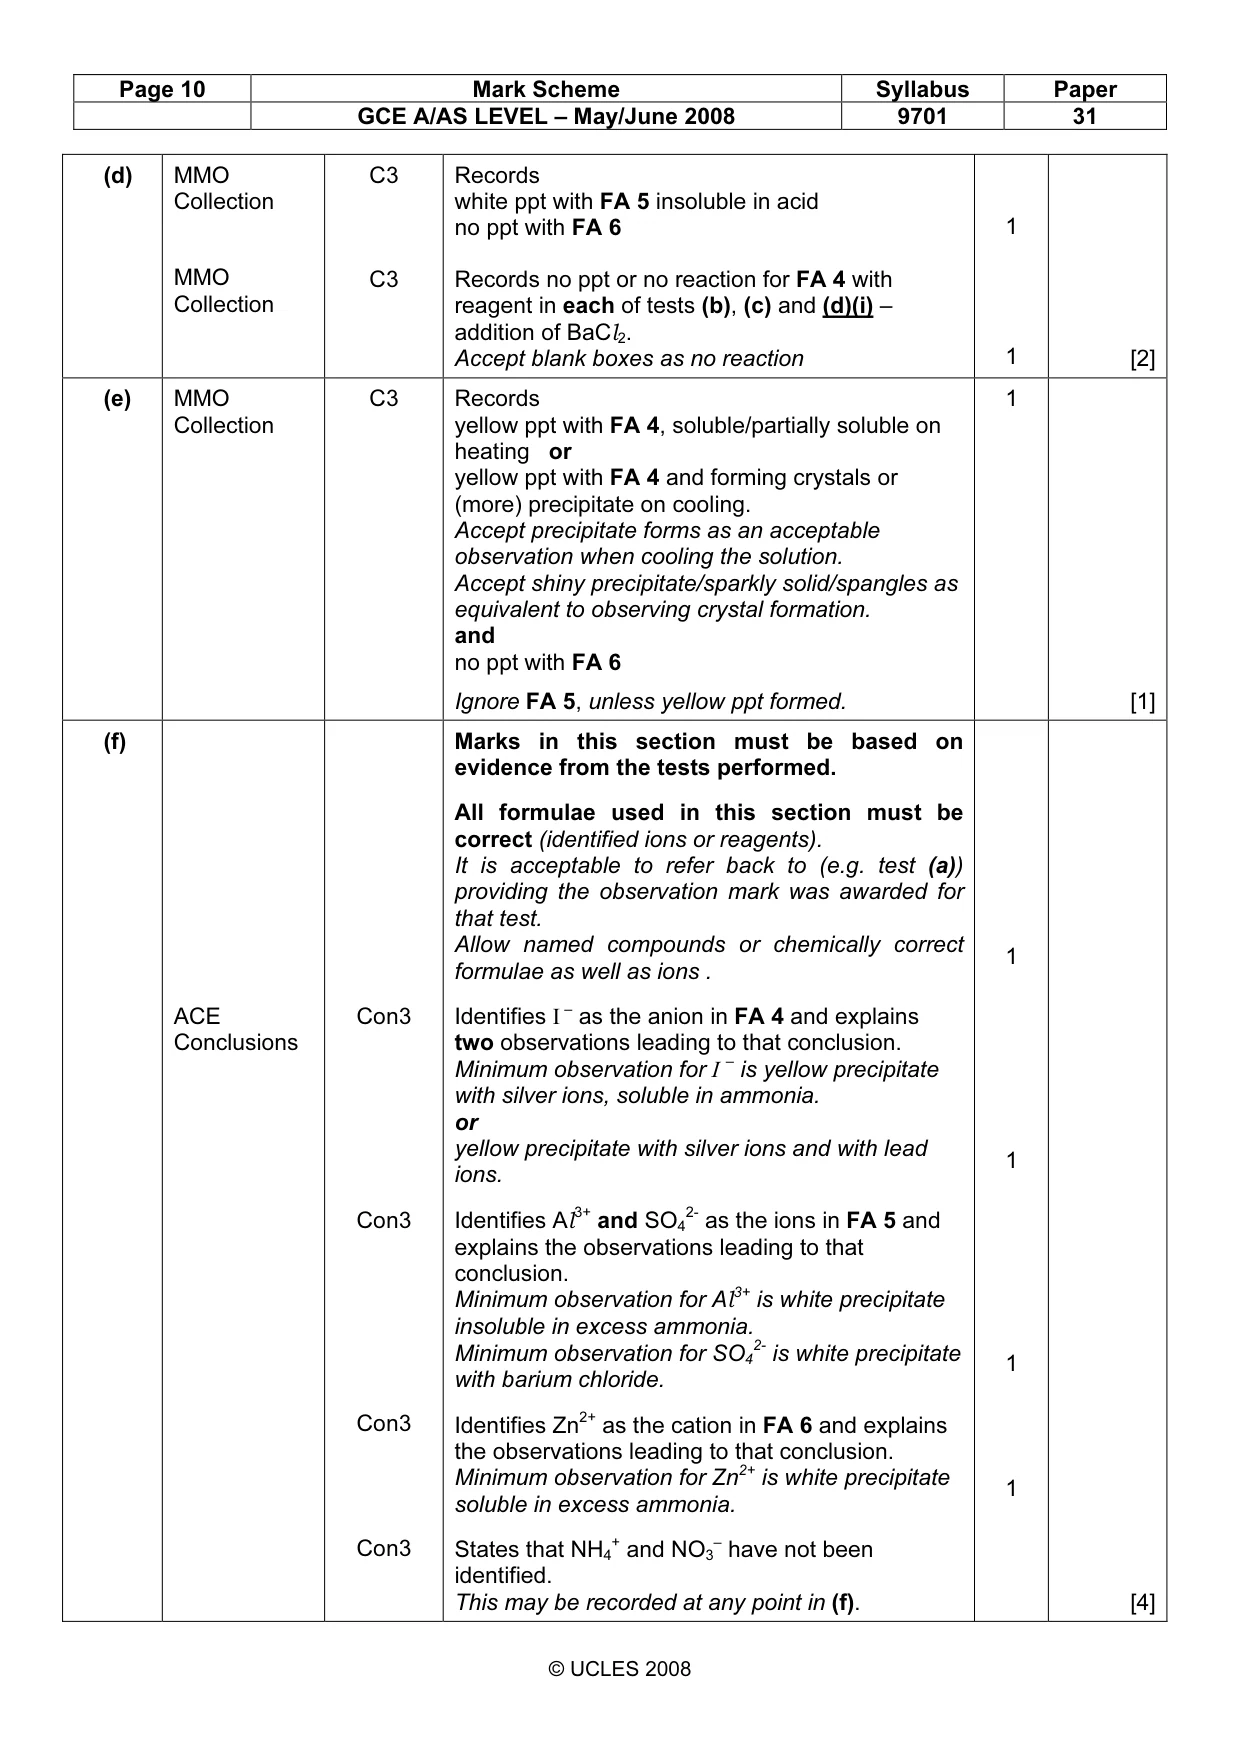
Page 10 Mark Scheme Syllabus Paper GCE A/AS LEVEL – May/June 2008 9701 31 © UCLES 2008 (d) MMO Collection MMO Collection C3 C3 Records white ppt with FA 5 insoluble in acid no ppt with FA 6 Records no ppt or no reaction for FA 4 with reagent in each of tests (b), (c) and (d)(i) – addition of BaCl2. Accept blank boxes as no reaction 1 1 [2] (e) MMO Collection C3 Records yellow ppt with FA 4, soluble/partially soluble on heating or yellow ppt with FA 4 and forming crystals or (more) precipitate on cooling. Accept precipitate forms as an acceptable observation when cooling the solution. Accept shiny precipitate/sparkly solid/spangles as equivalent to observing crystal formation. and no ppt with FA 6 Ignore FA 5, unless yellow ppt formed. 1 [1] (f) ACE Conclusions Con3 Con3 Con3 Con3 Marks in this section must be based on evidence from the tests performed. All formulae used in this section must be correct (identified ions or reagents). It is acceptable to refer back to (e.g. test (a)) providing the observation mark was awarded for that test. Allow named compounds or chemically correct formulae as well as ions . Identifies I – as the anion in FA 4 and explains two observations leading to that conclusion. Minimum observation for I – is yellow precipitate with silver ions, soluble in ammonia. or yellow precipitate with silver ions and with lead ions. Identifies Al3+ and SO4 2- as the ions in FA 5 and explains the observations leading to that conclusion. Minimum observation for Al3+ is white precipitate insoluble in excess ammonia. Minimum observation for SO4 2- is white precipitate with barium chloride. Identifies Zn2+ as the cation in FA 6 and explains the observations leading to that conclusion. Minimum observation for Zn2+ is white precipitate soluble in excess ammonia. States that NH4 + and NO3 – have not been identified. This may be recorded at any point in (f). 1 1 1 1 [4]
Mark scheme, page 11
Page 11 Mark Scheme Syllabus Paper GCE A/AS LEVEL – May/June 2008 9701 31 © UCLES 2008 (g) ACE Improve Imp2 NaOH, Al and heat used to test for NO3 – would also liberate ammonia from NH4 + so would not be specific to NO3 –. Candidates must show clear understanding of why the solution must be tested for ammonium ion before being tested for nitrate. 1 [1] [Total: 16]
What you needed in this session
Cambridge’s own grade thresholds for 2008 May/June, Paper 3 · Variant 1. A higher threshold means an easier paper — the bar moves with how the cohort did.