Cambridge IGCSE Physics (9-1) 0972 — 2025 May/June Paper 6 · Variant 2
0972/62/M/J/25 · 4 questions · 40 marks · ≈45 min
The question paper and its mark scheme, free to read here and free to download. This is Cambridge’s own paper, exactly as it was sat.
Question paper16 pages
Mark scheme11 pages
Answers below. Sit the paper first if you are practising.
Questions as text
Q1 · A student determines the internal diameter d of a test-tube
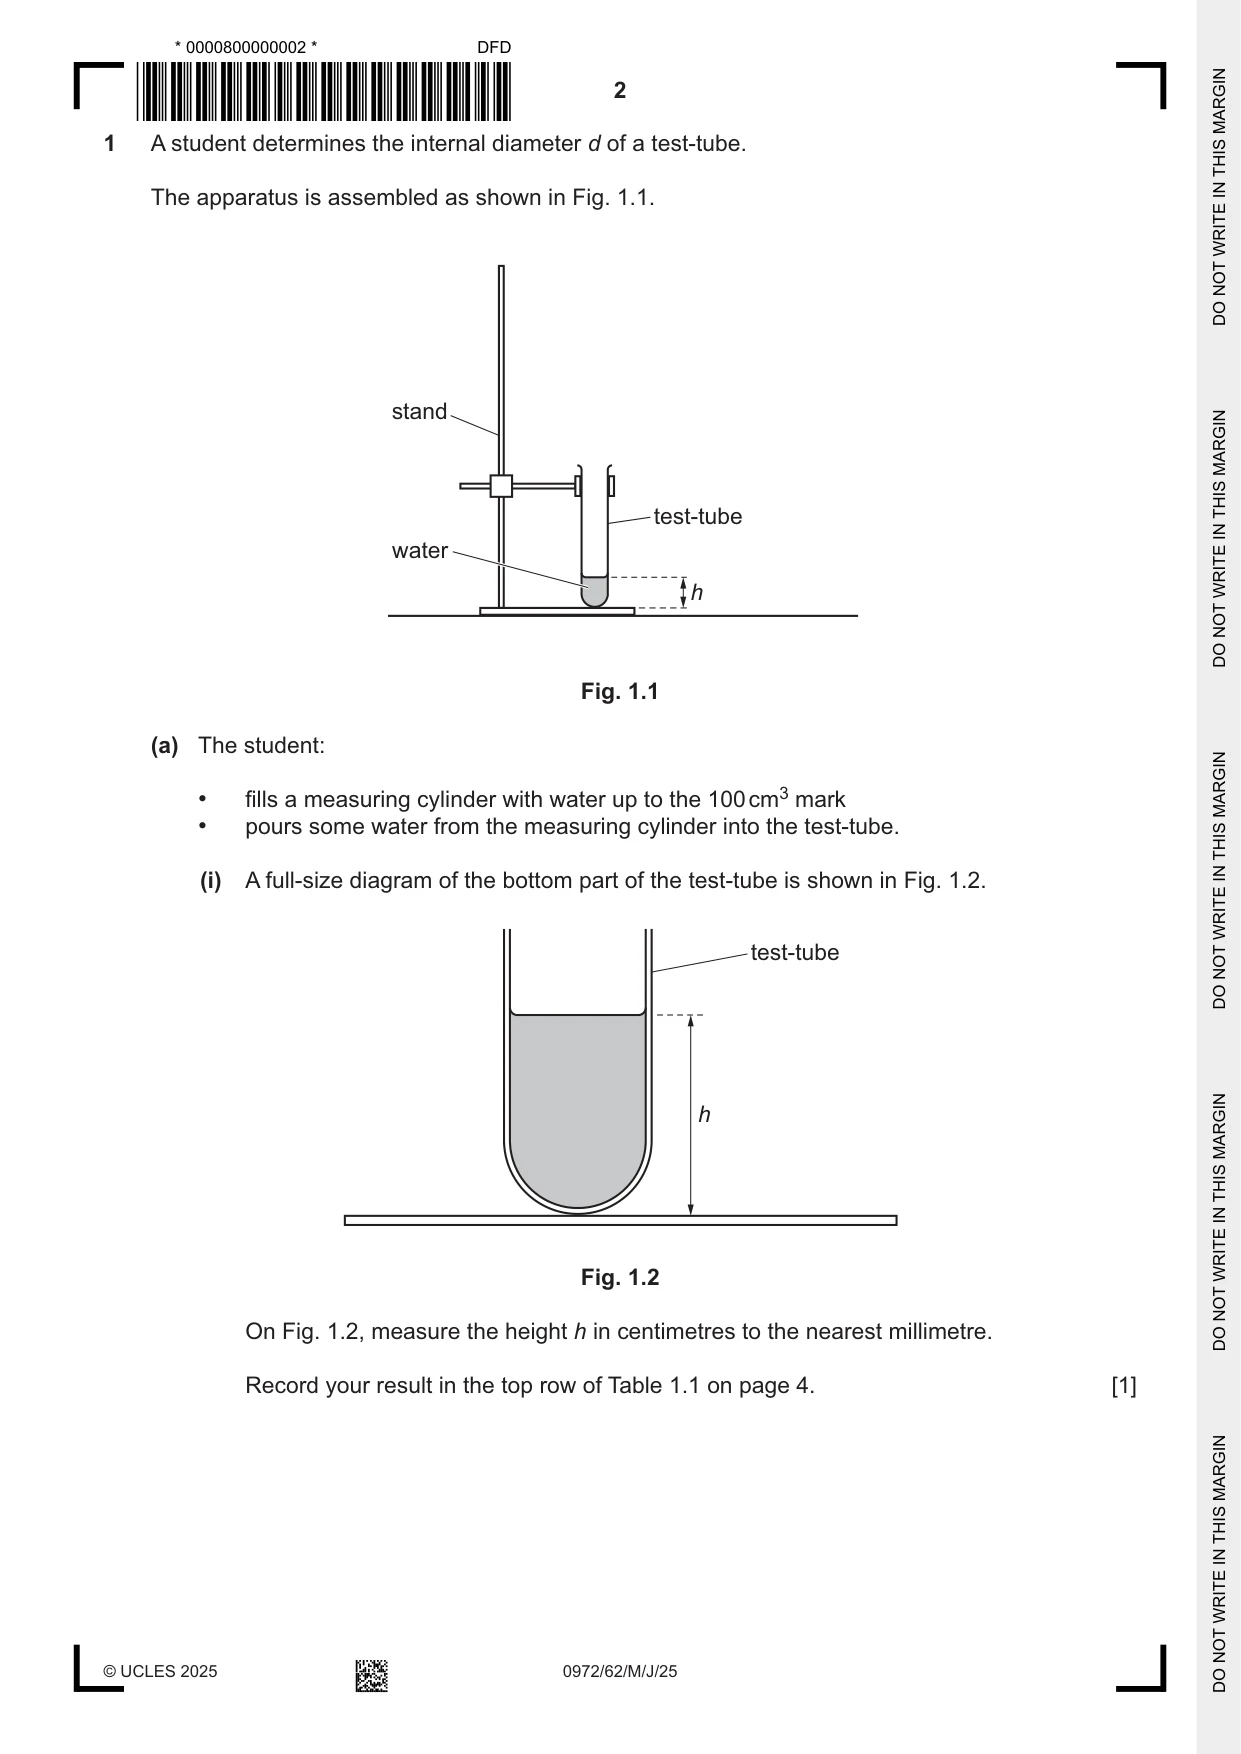
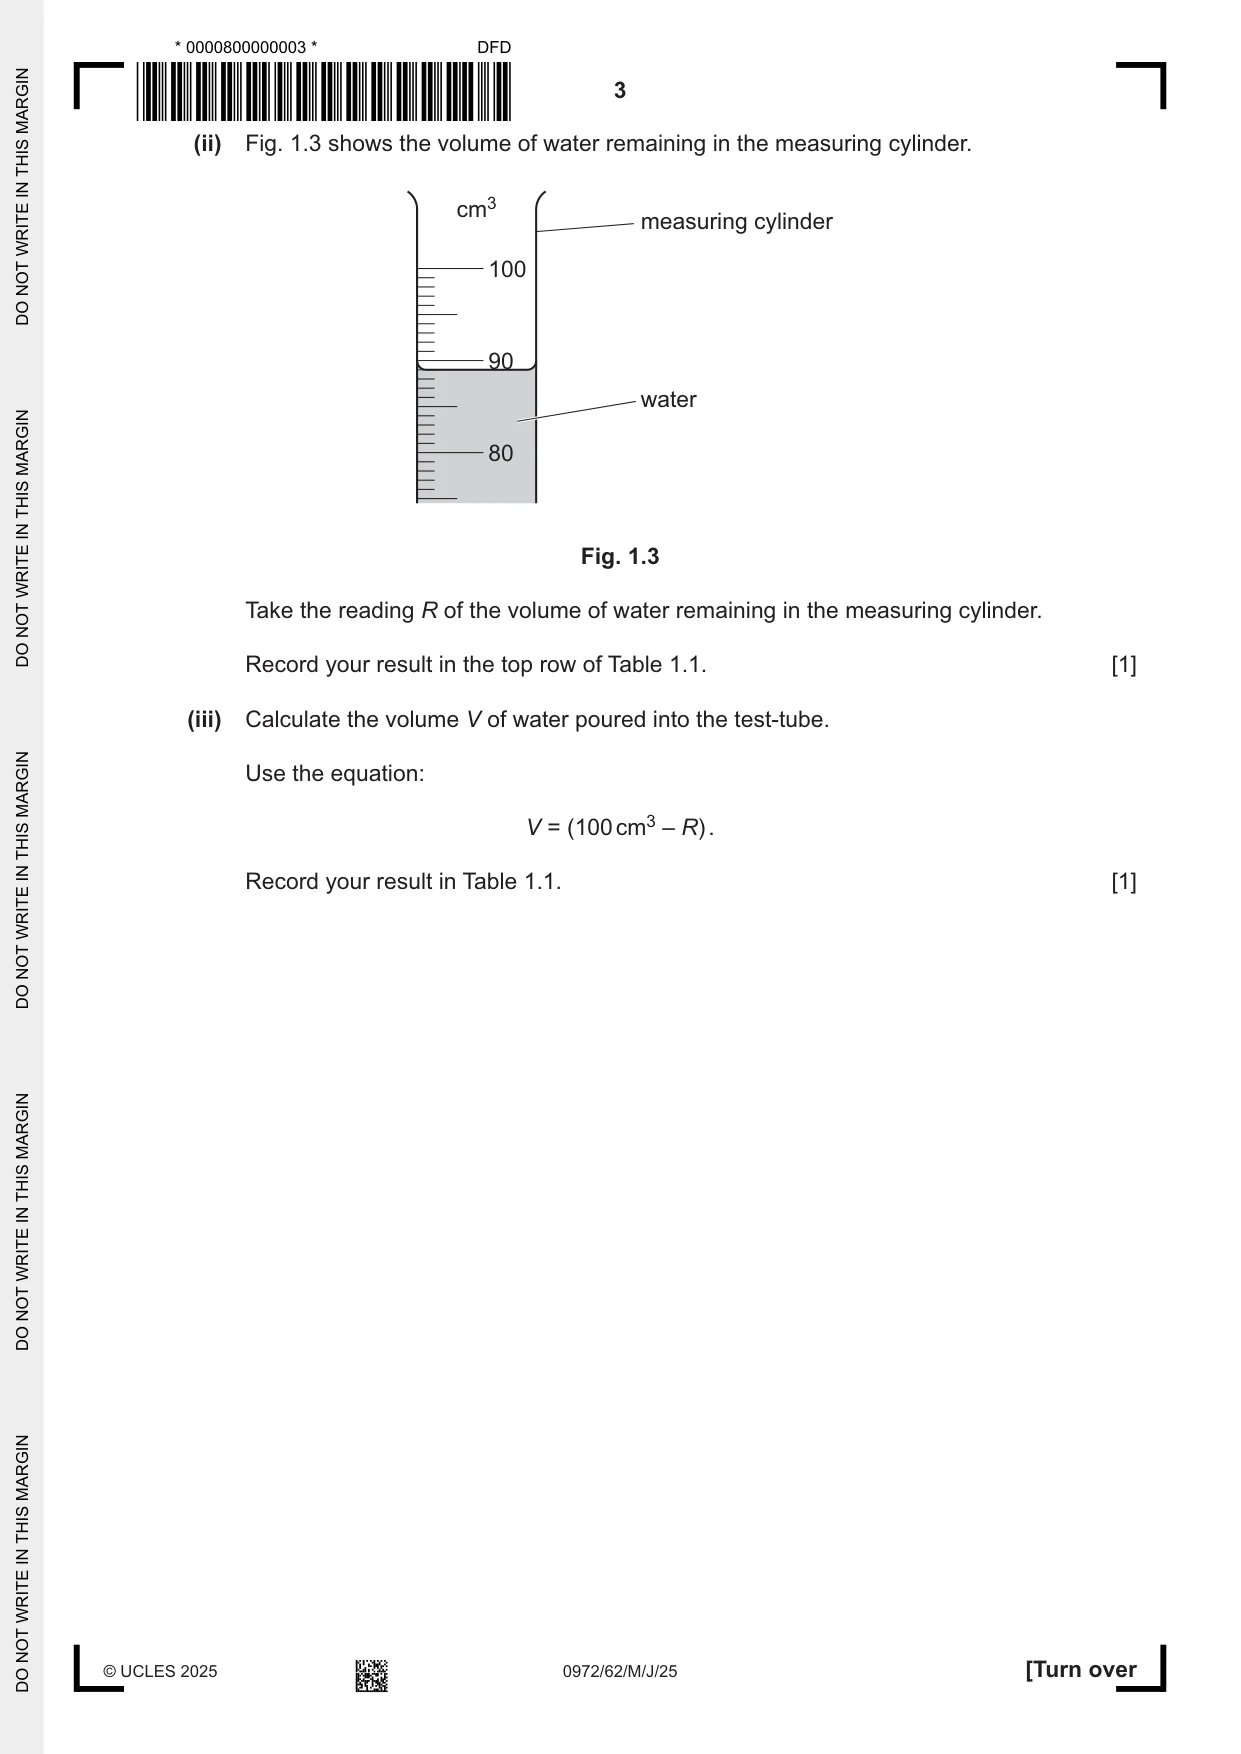
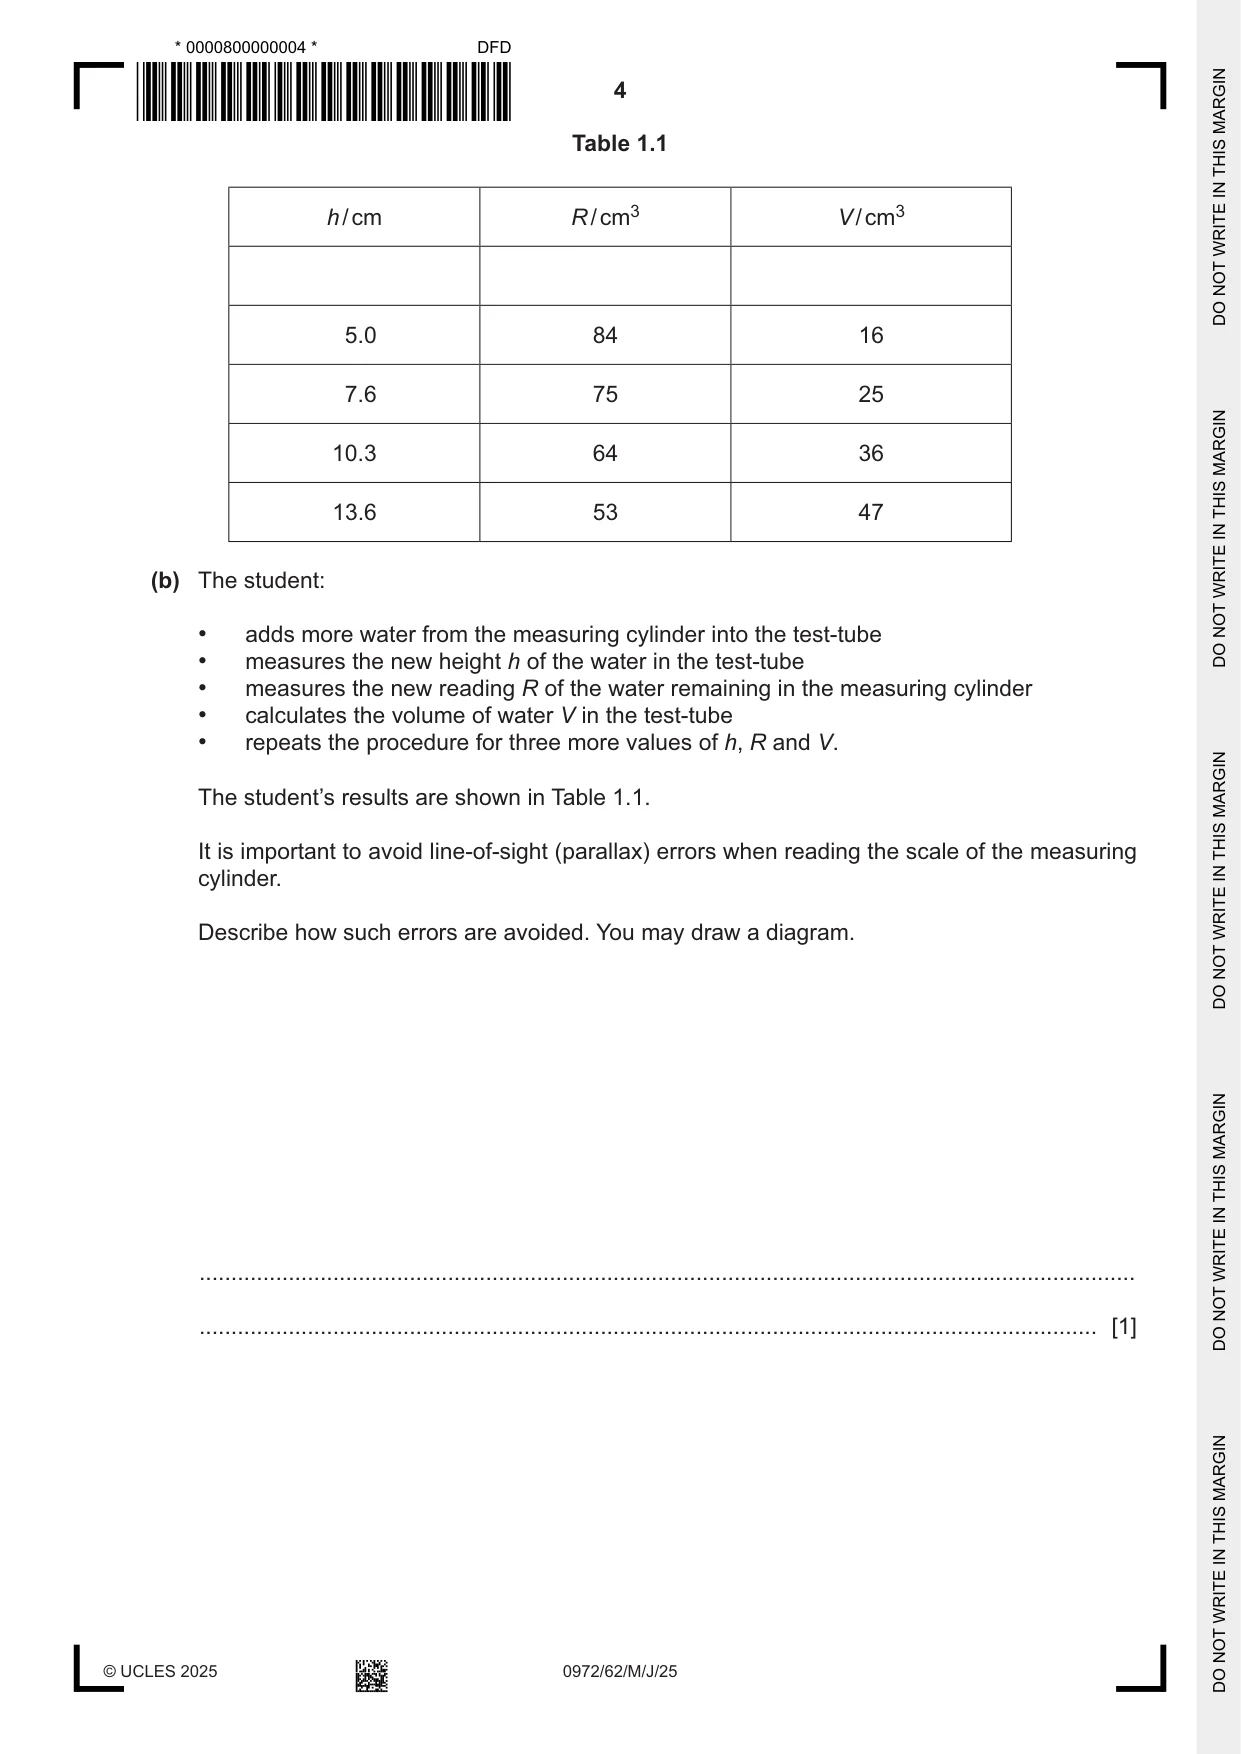
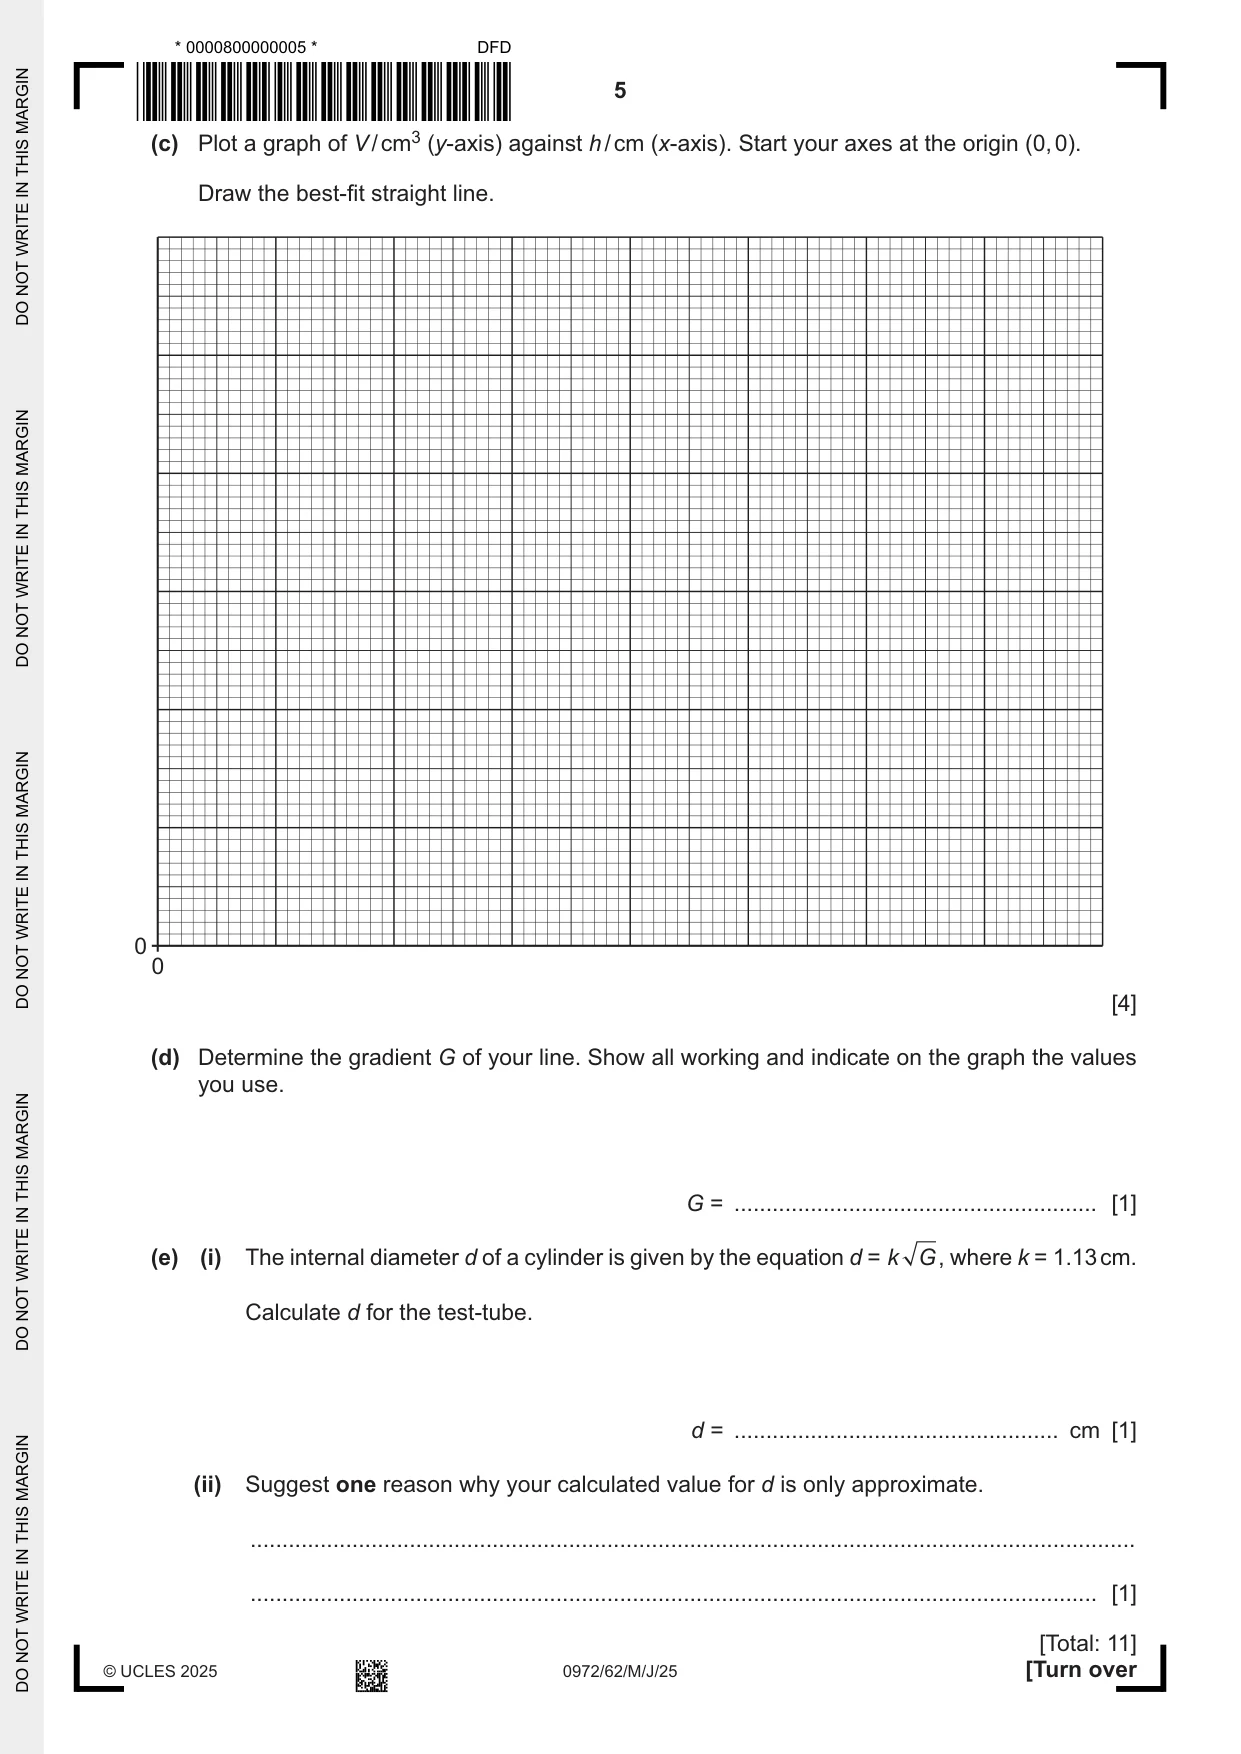
1 A student determines the internal diameter d of a test-tube. The apparatus is assembled as shown in Fig. 1.1. stand test-tube water h Fig. 1.1 (a) The student: • fills a measuring cylinder with water up to the 100 cm3 mark • pours some water from the measuring cylinder into the test-tube. (i) A full-size diagram of the bottom part of the test-tube is shown in Fig. 1.2. test-tube h Fig. 1.2 On Fig. 1.2, measure the height h in centimetres to the nearest millimetre. Record your result in the top row of Table 1.1 on page 4. [1] (ii) Fig. 1.3 shows the volume of water remaining in the measuring cylinder. cm3 measuring cylinder 100 90 water 80 Fig. 1.3 Take the reading R of the volume of water remaining in the measuring cylinder. Record your result in the top row of Table 1.1. [1] (iii) Calculate the volume V of water poured into the test-tube. Use the equation: V = (100 cm3 – R) . Record your result in Table 1.1. [1] Table 1.1 h / cm R / cm3 V / cm3 5.0 84 16 7.6 75 25 10.3 64 36 13.6 53 47 (b) The student: • adds more water from the measuring cylinder into the test-tube • measures the new height h of the water in the test-tube • measures the new reading R of the water remaining in the measuring cylinder • calculates the volume of water V in the test-tube • repeats the procedure for three more values of h, R and V. The student’s results are shown in Table 1.1. It is important to avoid line-of-sight (parallax) errors when reading the scale of the measuring cylinder. Describe how such errors are avoided. You may draw a diagram. ................................................................................................................................................... ............................................................................................................................................. [1] (c) Plot a graph of V / cm3 (y-axis) against h / cm (x-axis). Start your axes at the origin (0, 0). Draw the best-fit straight line. 0 0 [4] (d) Determine the gradient G of your line. Show all working and indicate on the graph the values you use. G = ......................................................... [1] (e) (i) The internal diameter d of a cylinder is given by the equation d = k G, where k = 1.13 cm. Calculate d for the test-tube. d = ................................................... cm [1] (ii) Suggest one reason why your calculated value for d is only approximate. ........................................................................................................................................... ..................................................................................................................................... [1] [Total: 11]
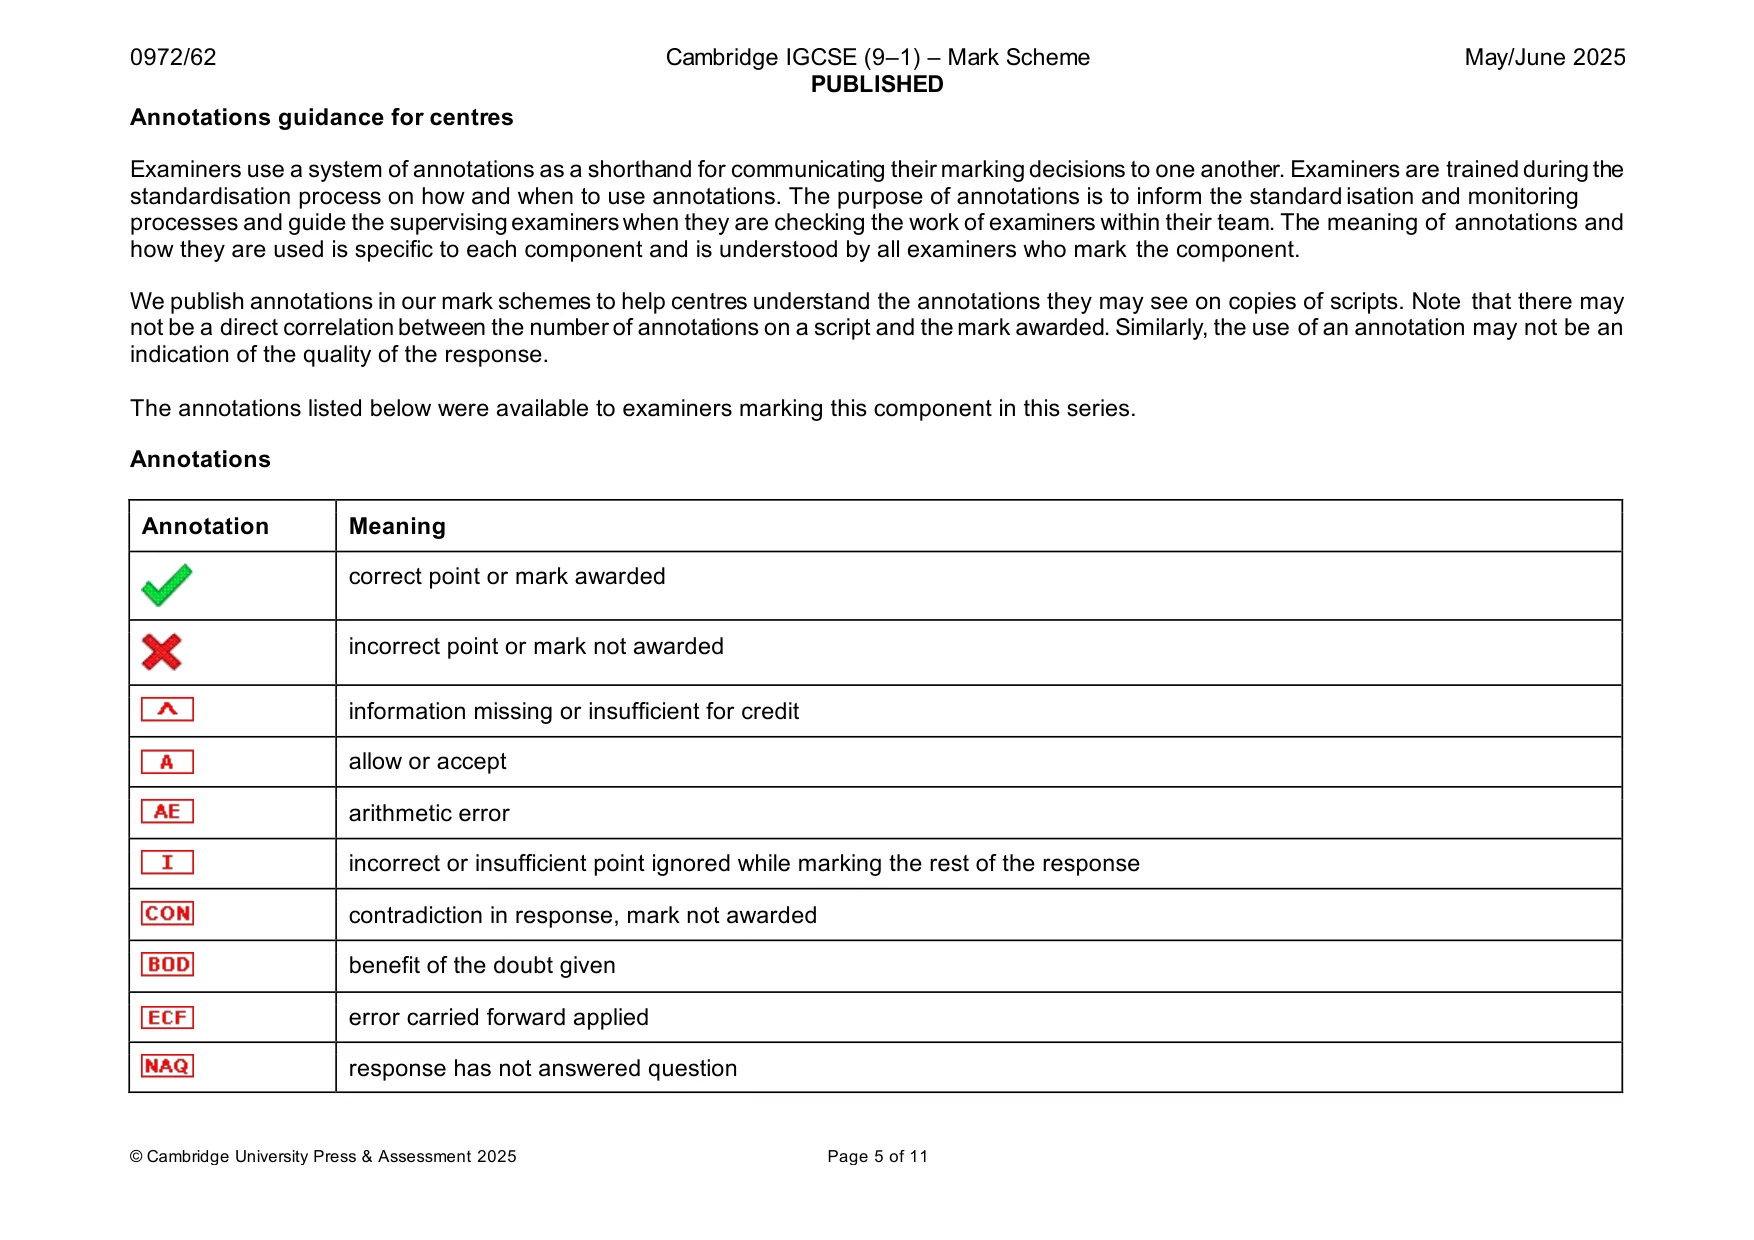
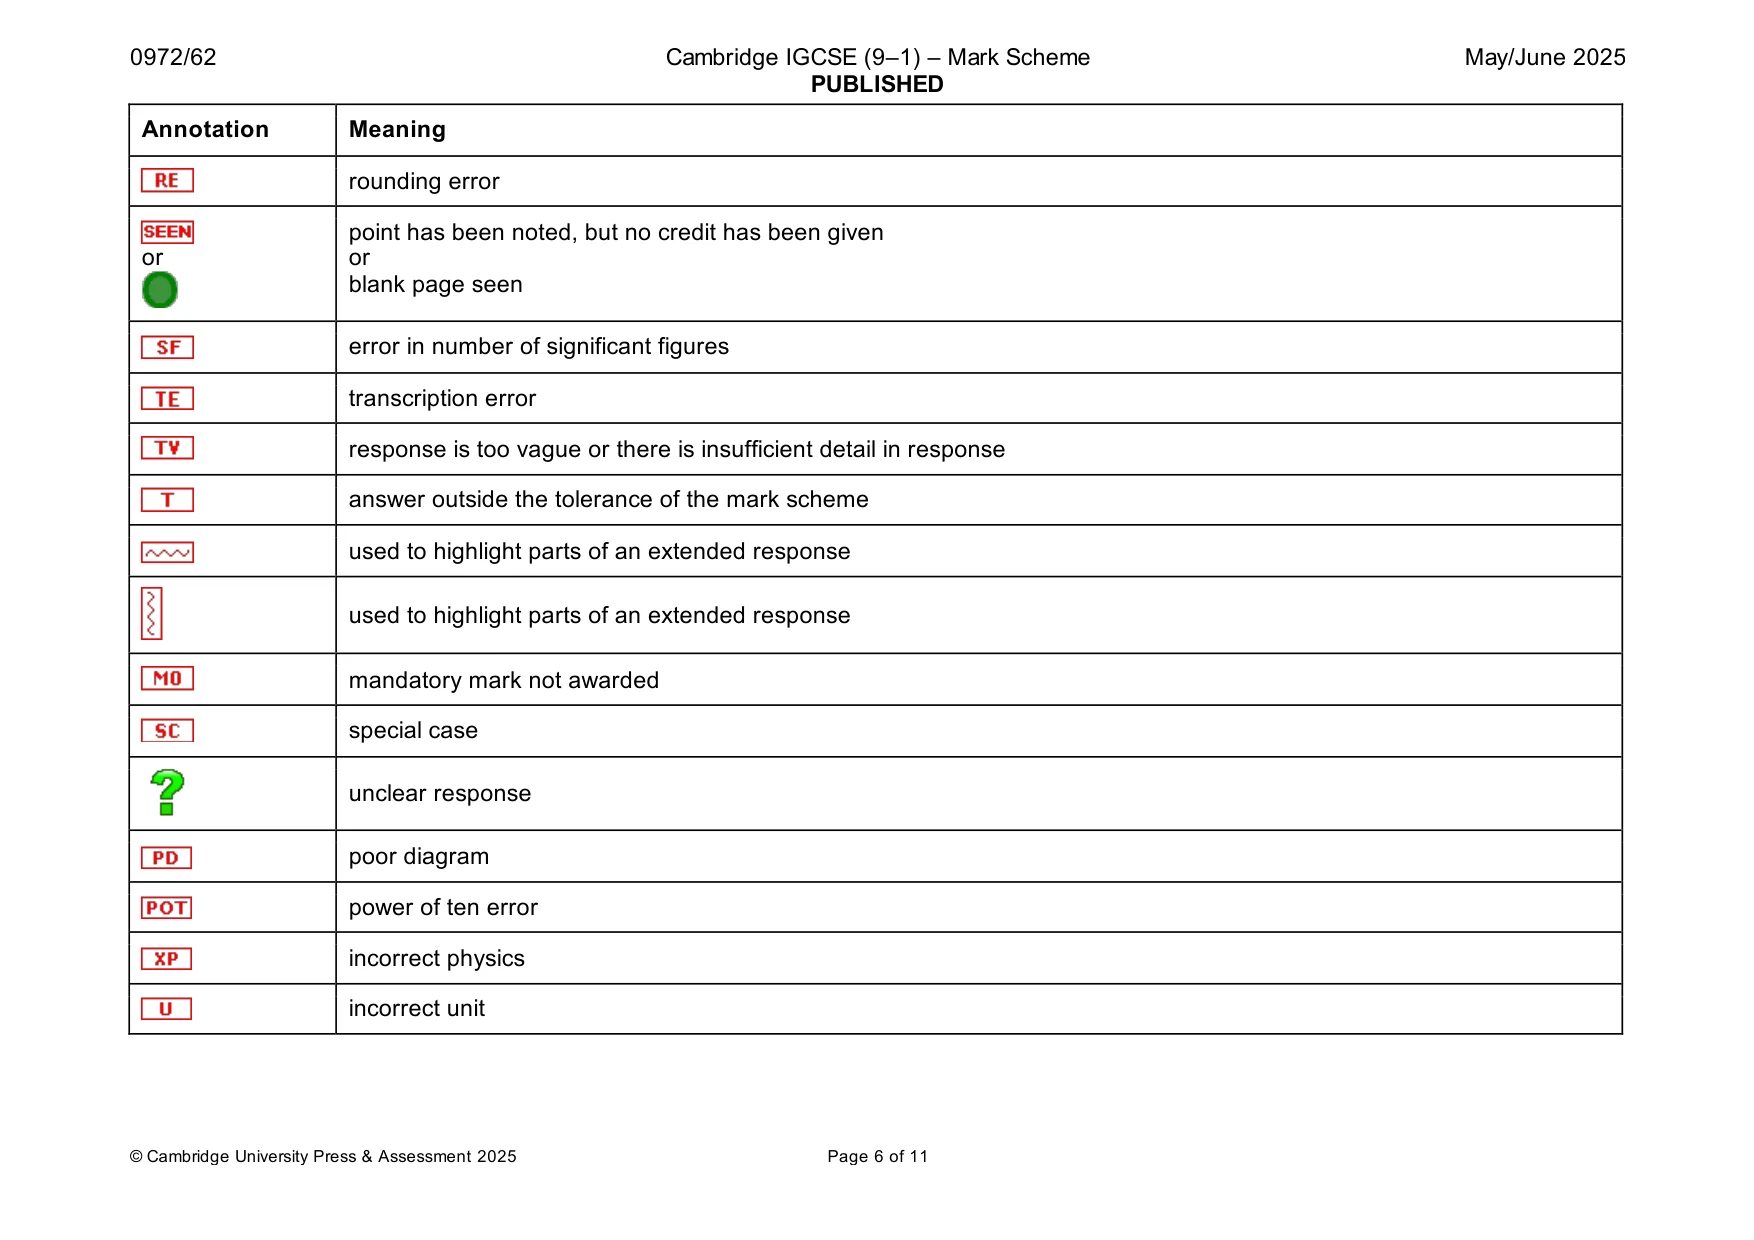
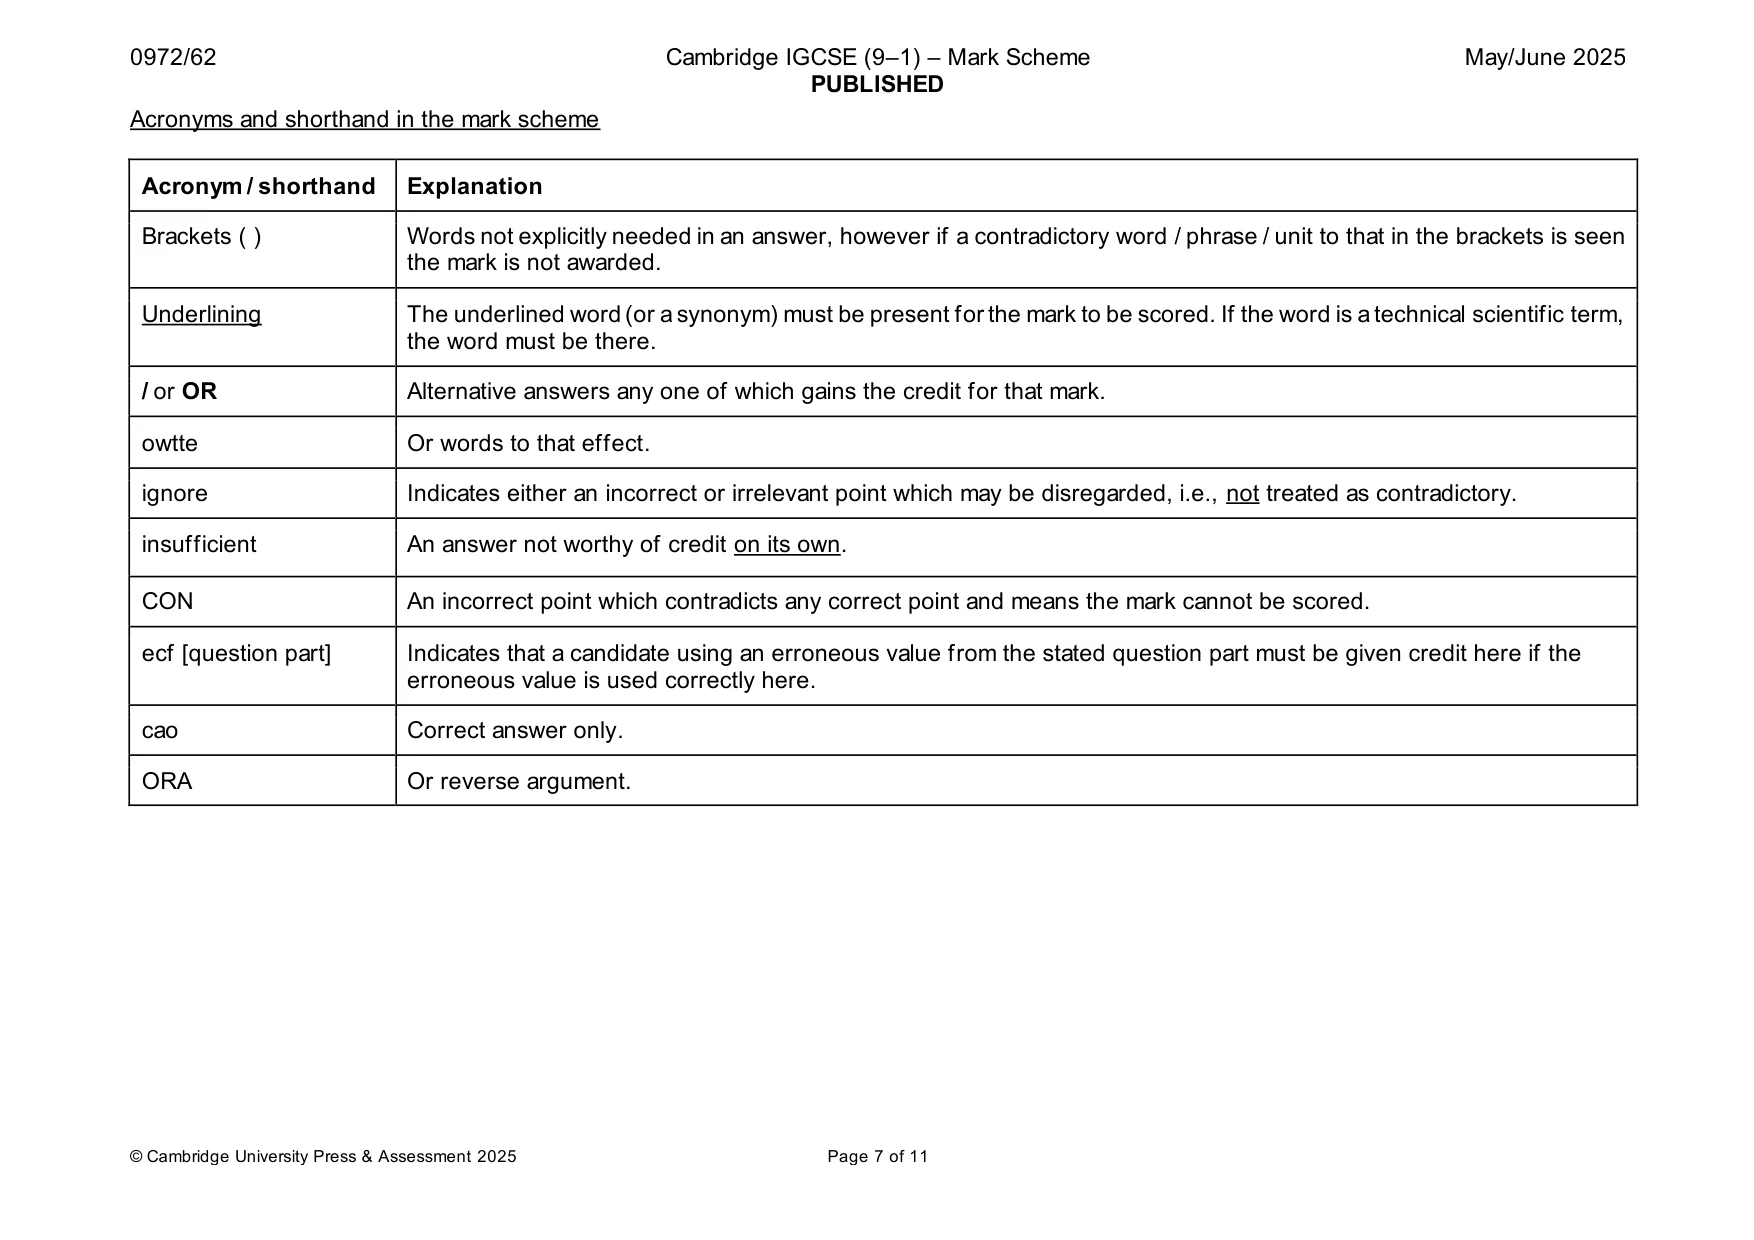
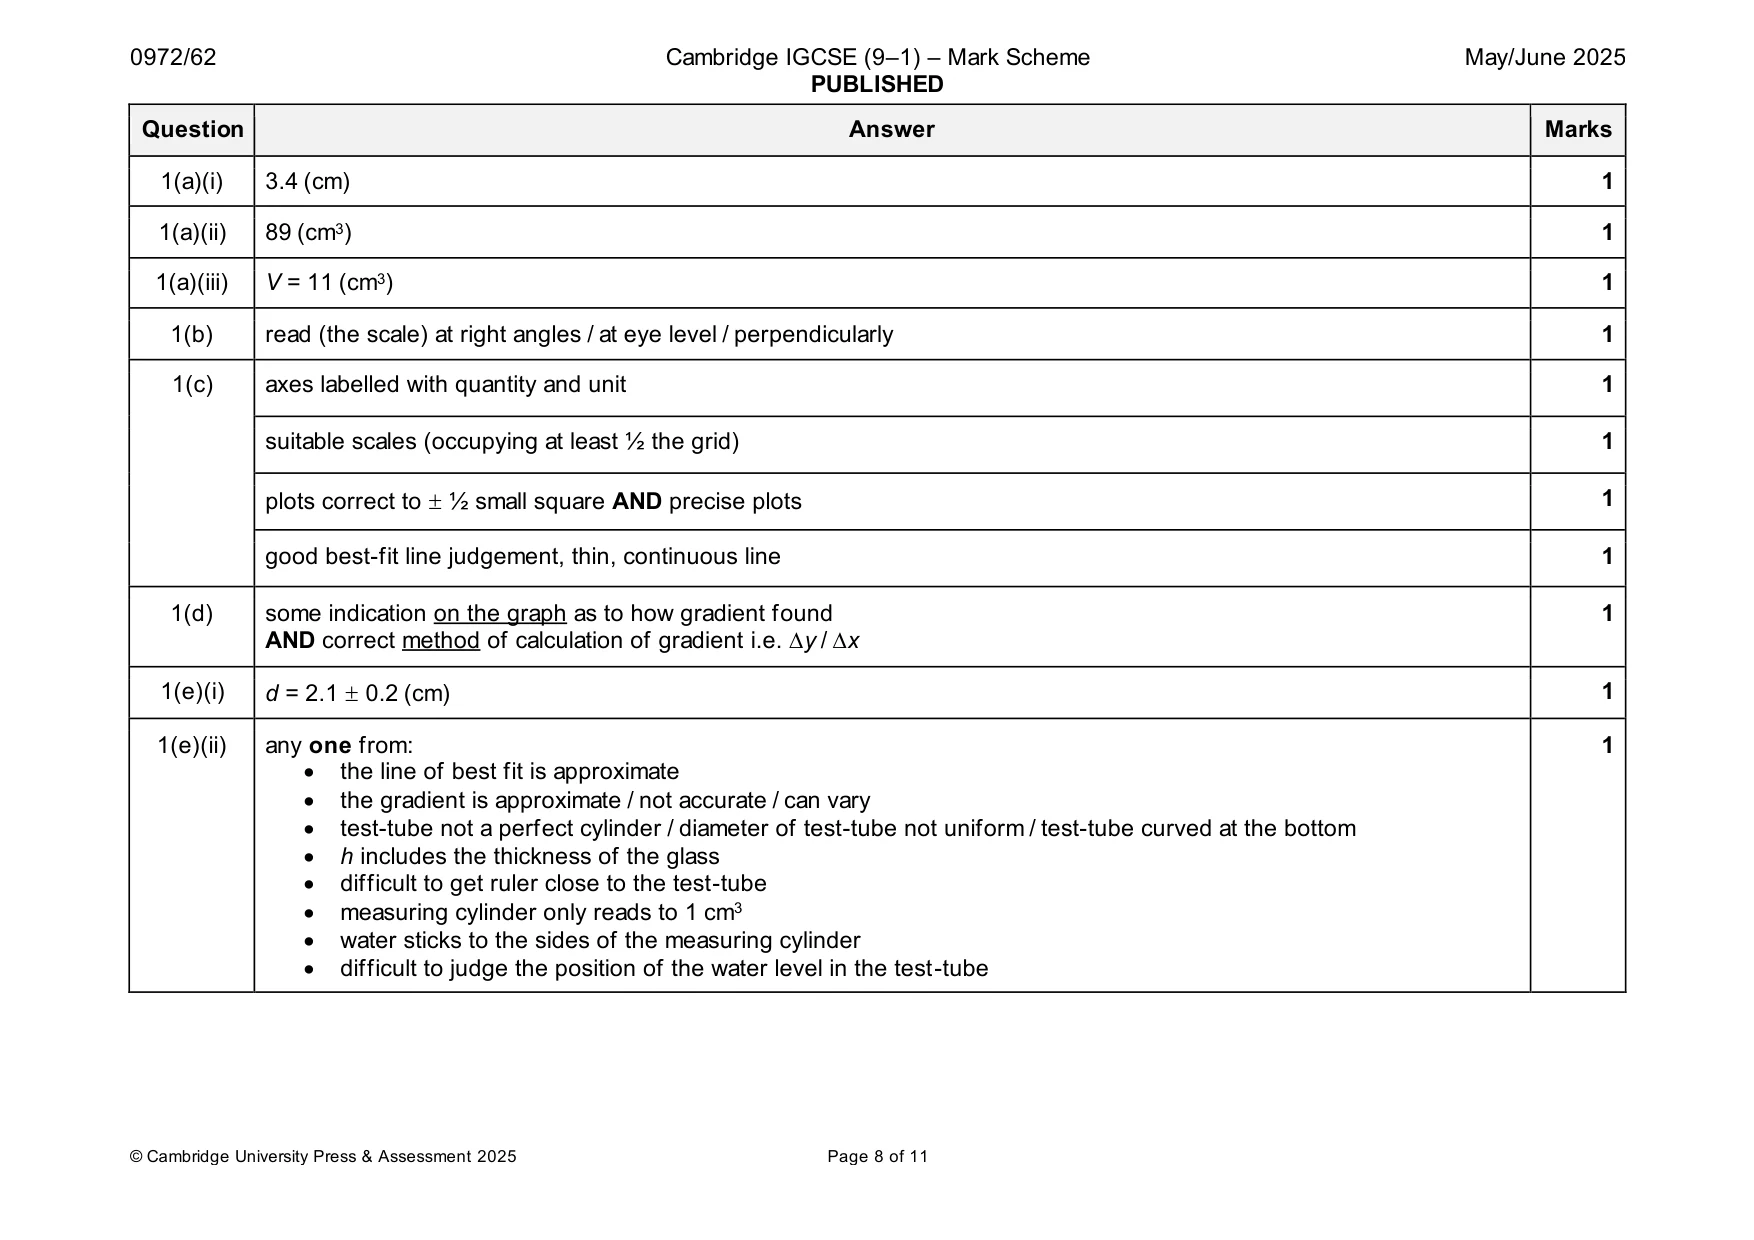
Mark scheme: Question Answer Marks 1(a)(i) 3.4 (cm) 1 1(a)(ii) 89 (cm3) 1 1(a)(iii) V = 11 (cm3) 1 1(b) read (the scale) at right angles / at eye level / perpendicularly 1 1(c) axes labelled with quantity and unit 1 suitable scales (occupying at least ½ the grid) 1 plots correct to ½ small square AND precise plots 1 good best-fit line judgement, thin, continuous line 1 1(d) some indication on the graph as to how gradient found 1 AND correct method of calculation of gradient i.e. y / x 1(e)(i) d = 2.1 0.2 (cm) 1 1(e)(ii) any one from: 1 • the line of best fit is approximate • the gradient is approximate / not accurate / can vary • test-tube not a perfect cylinder / diameter of test-tube not uniform / test-tube curved at the bottom • h includes the thickness of the glass • difficult to get ruler close to the test-tube • measuring cylinder only reads to 1 cm3 • water sticks to the sides of the measuring cylinder • difficult to judge the position of the water level in the test-tube
More questions on Physical quantities and measurement techniques
Q2 · A student investigates a light-dependent resistor (LDR)
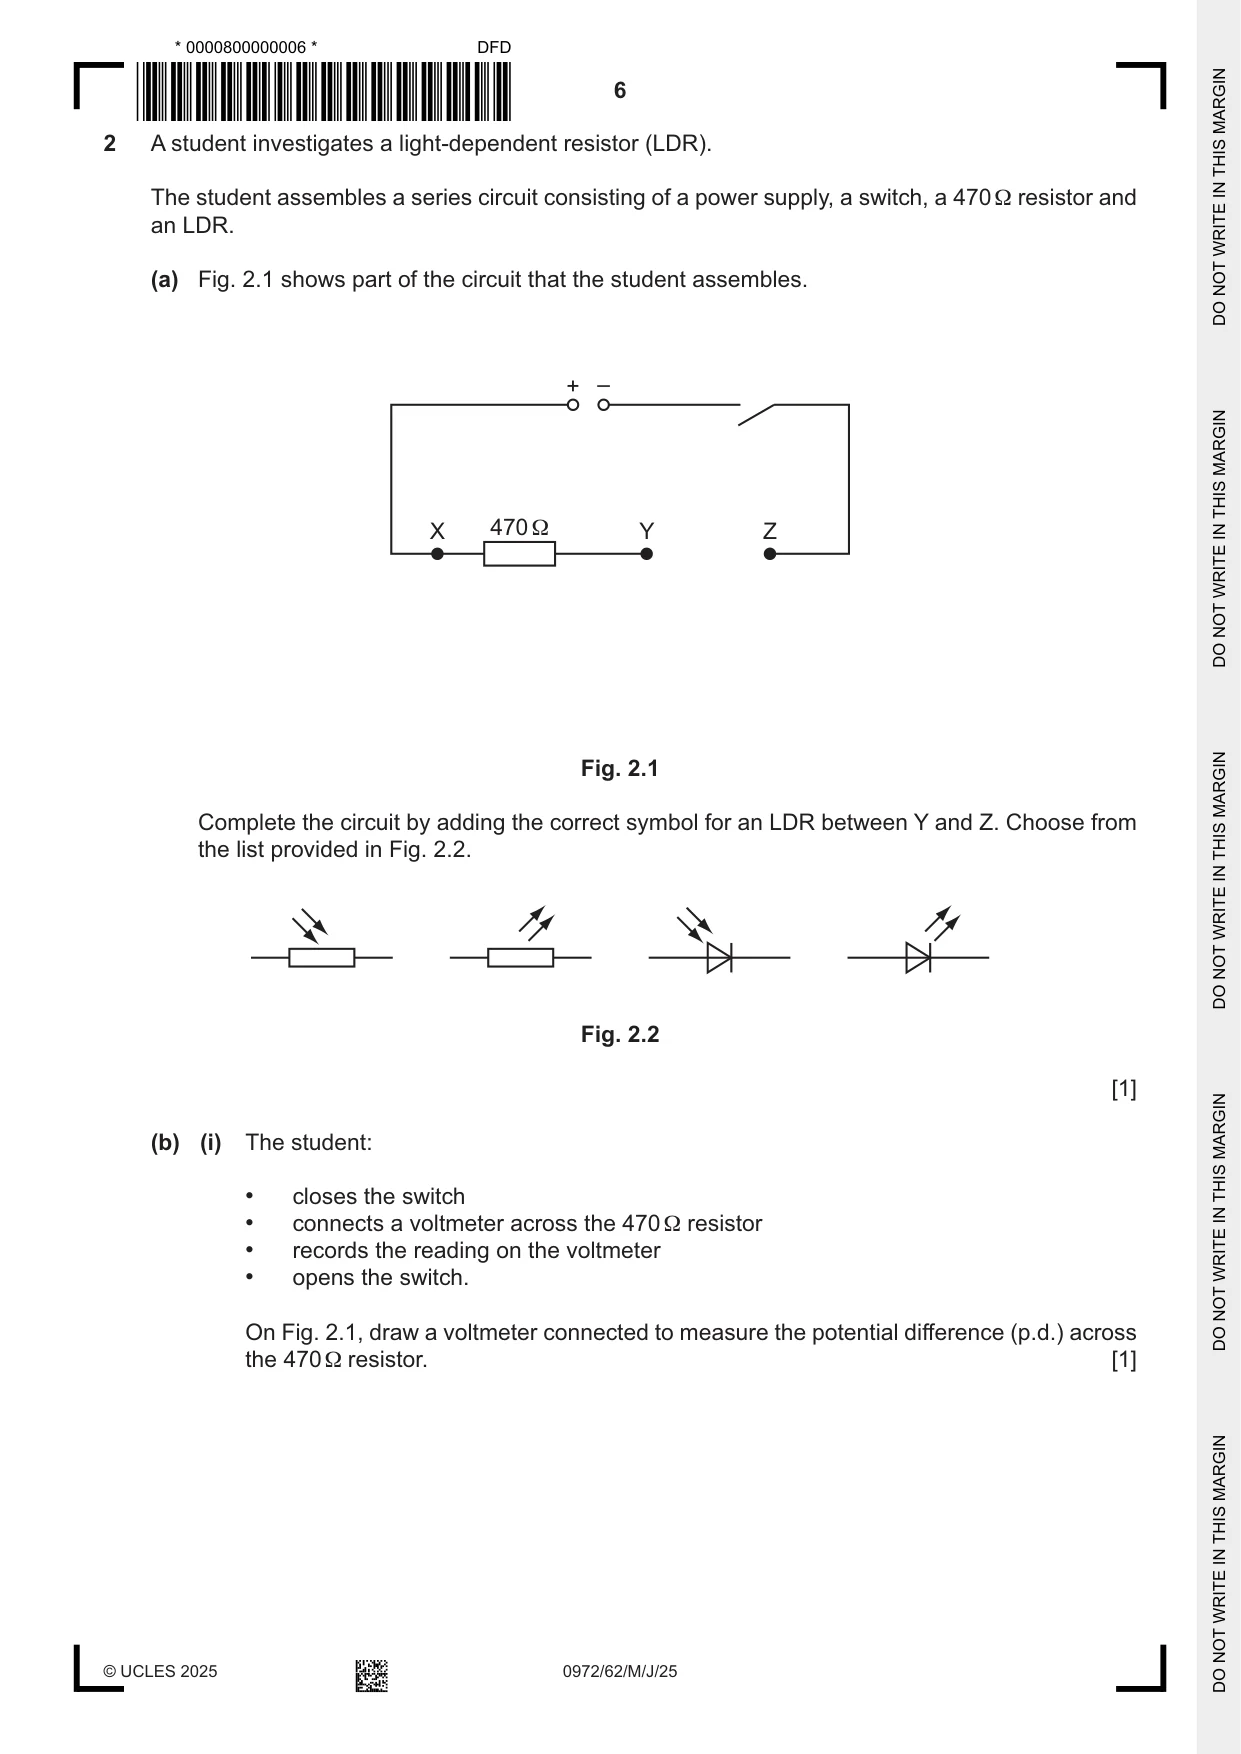
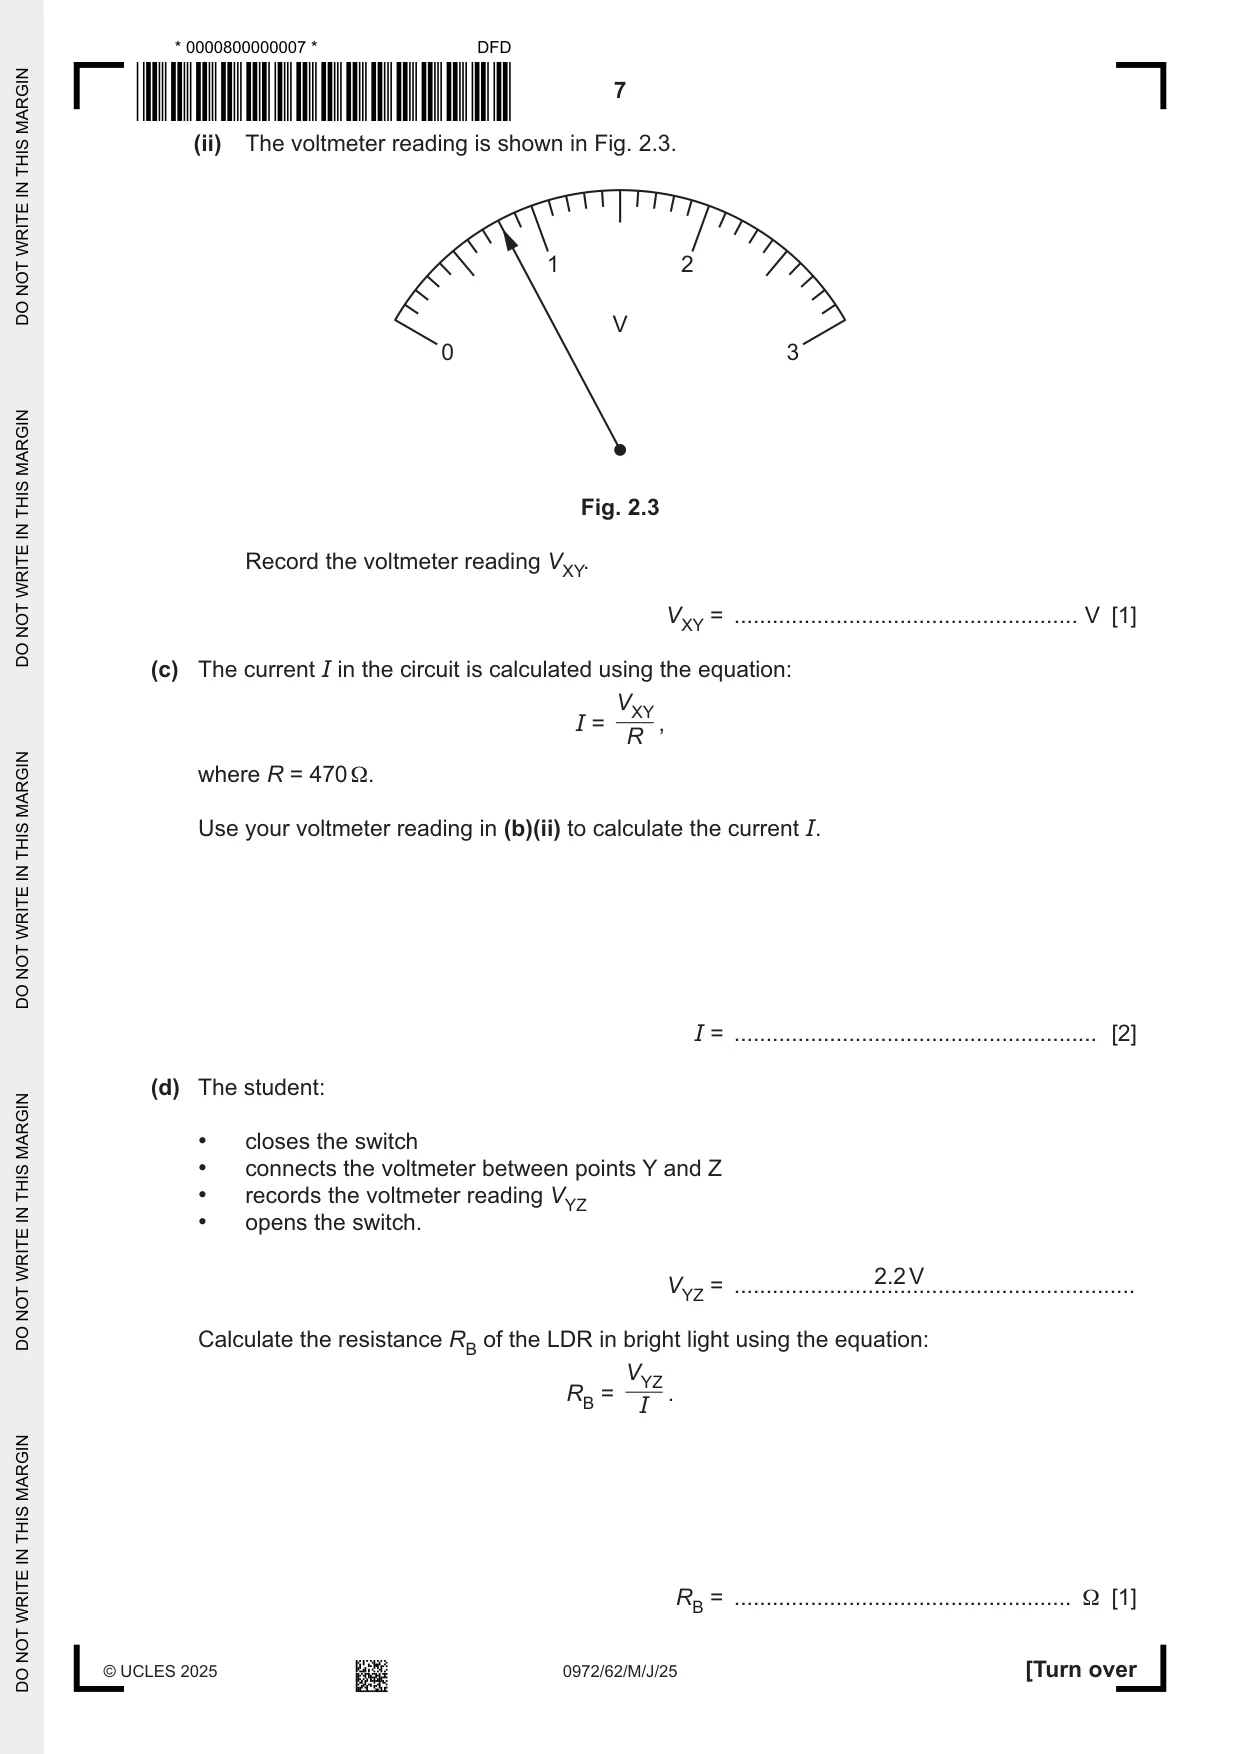
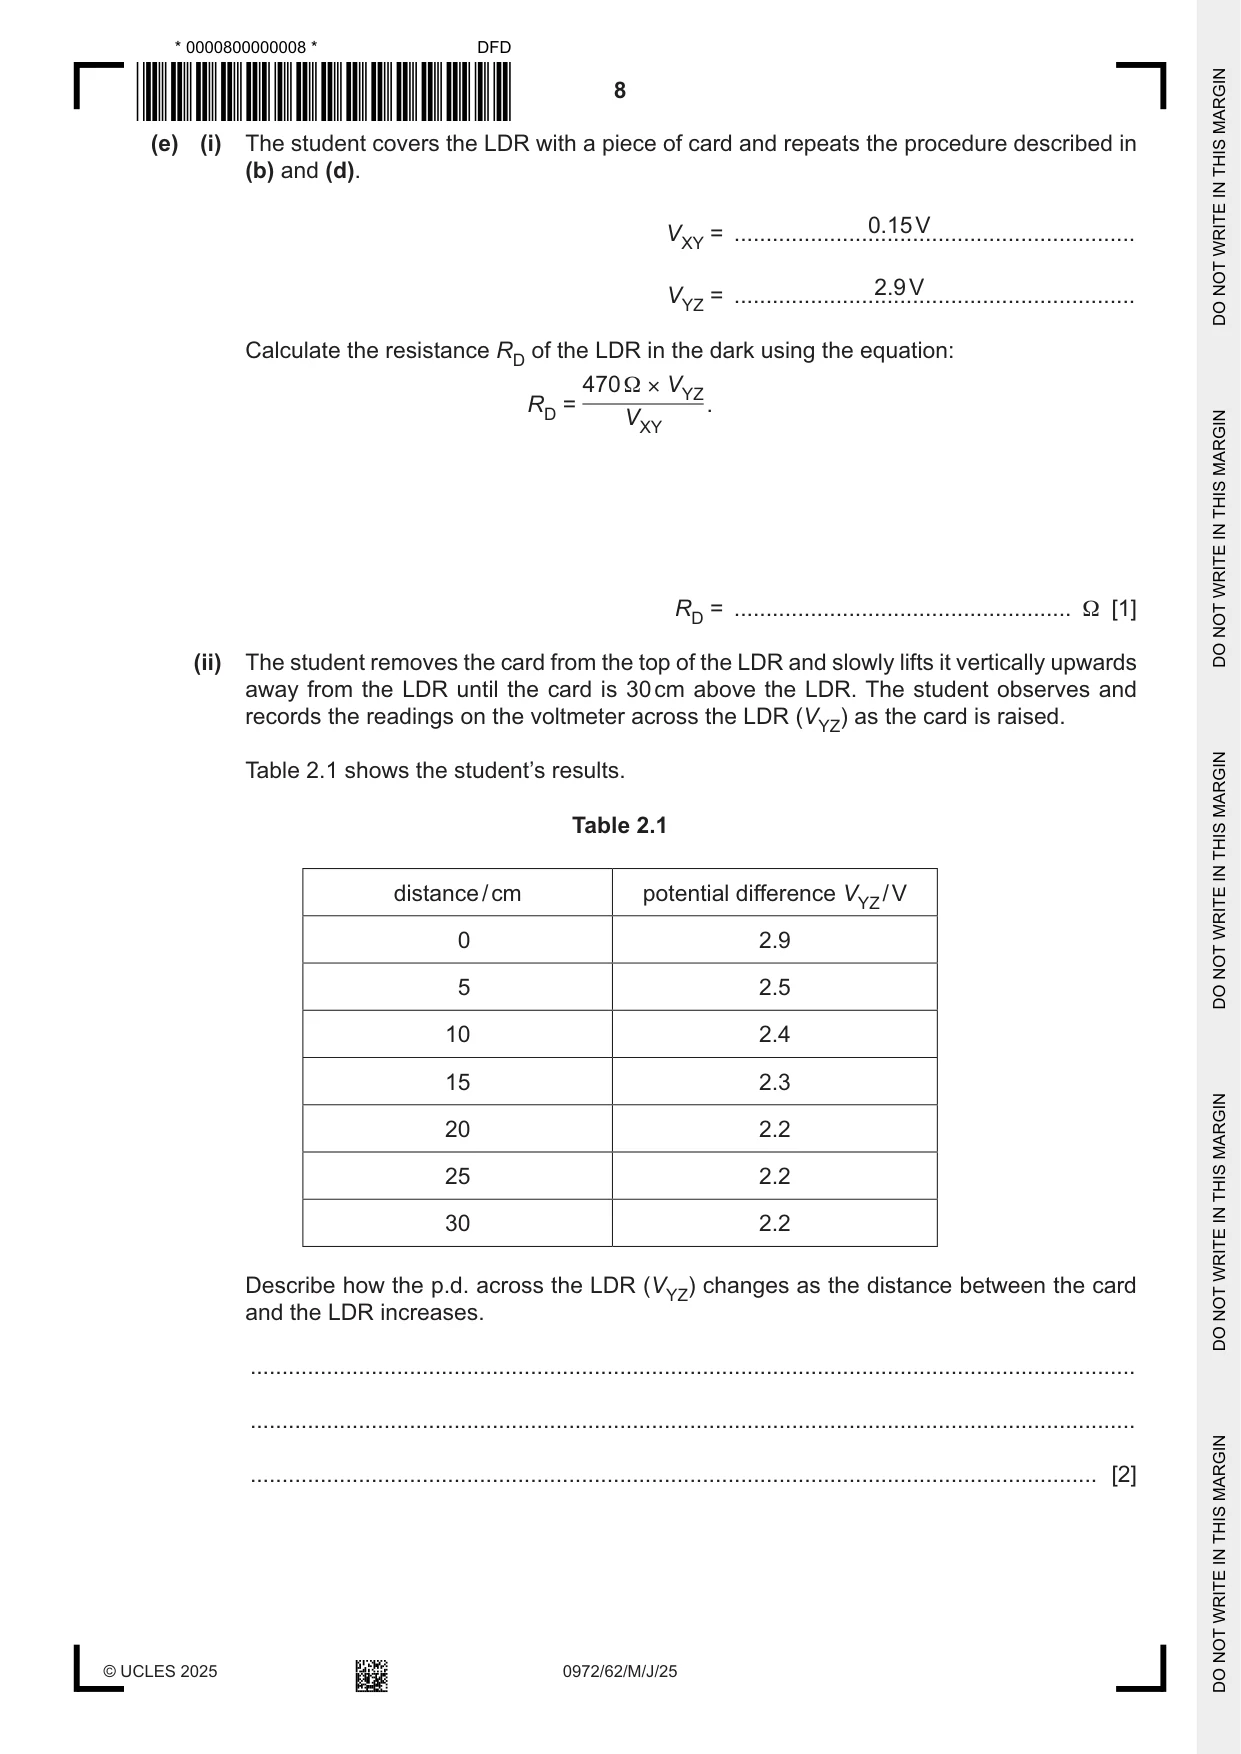
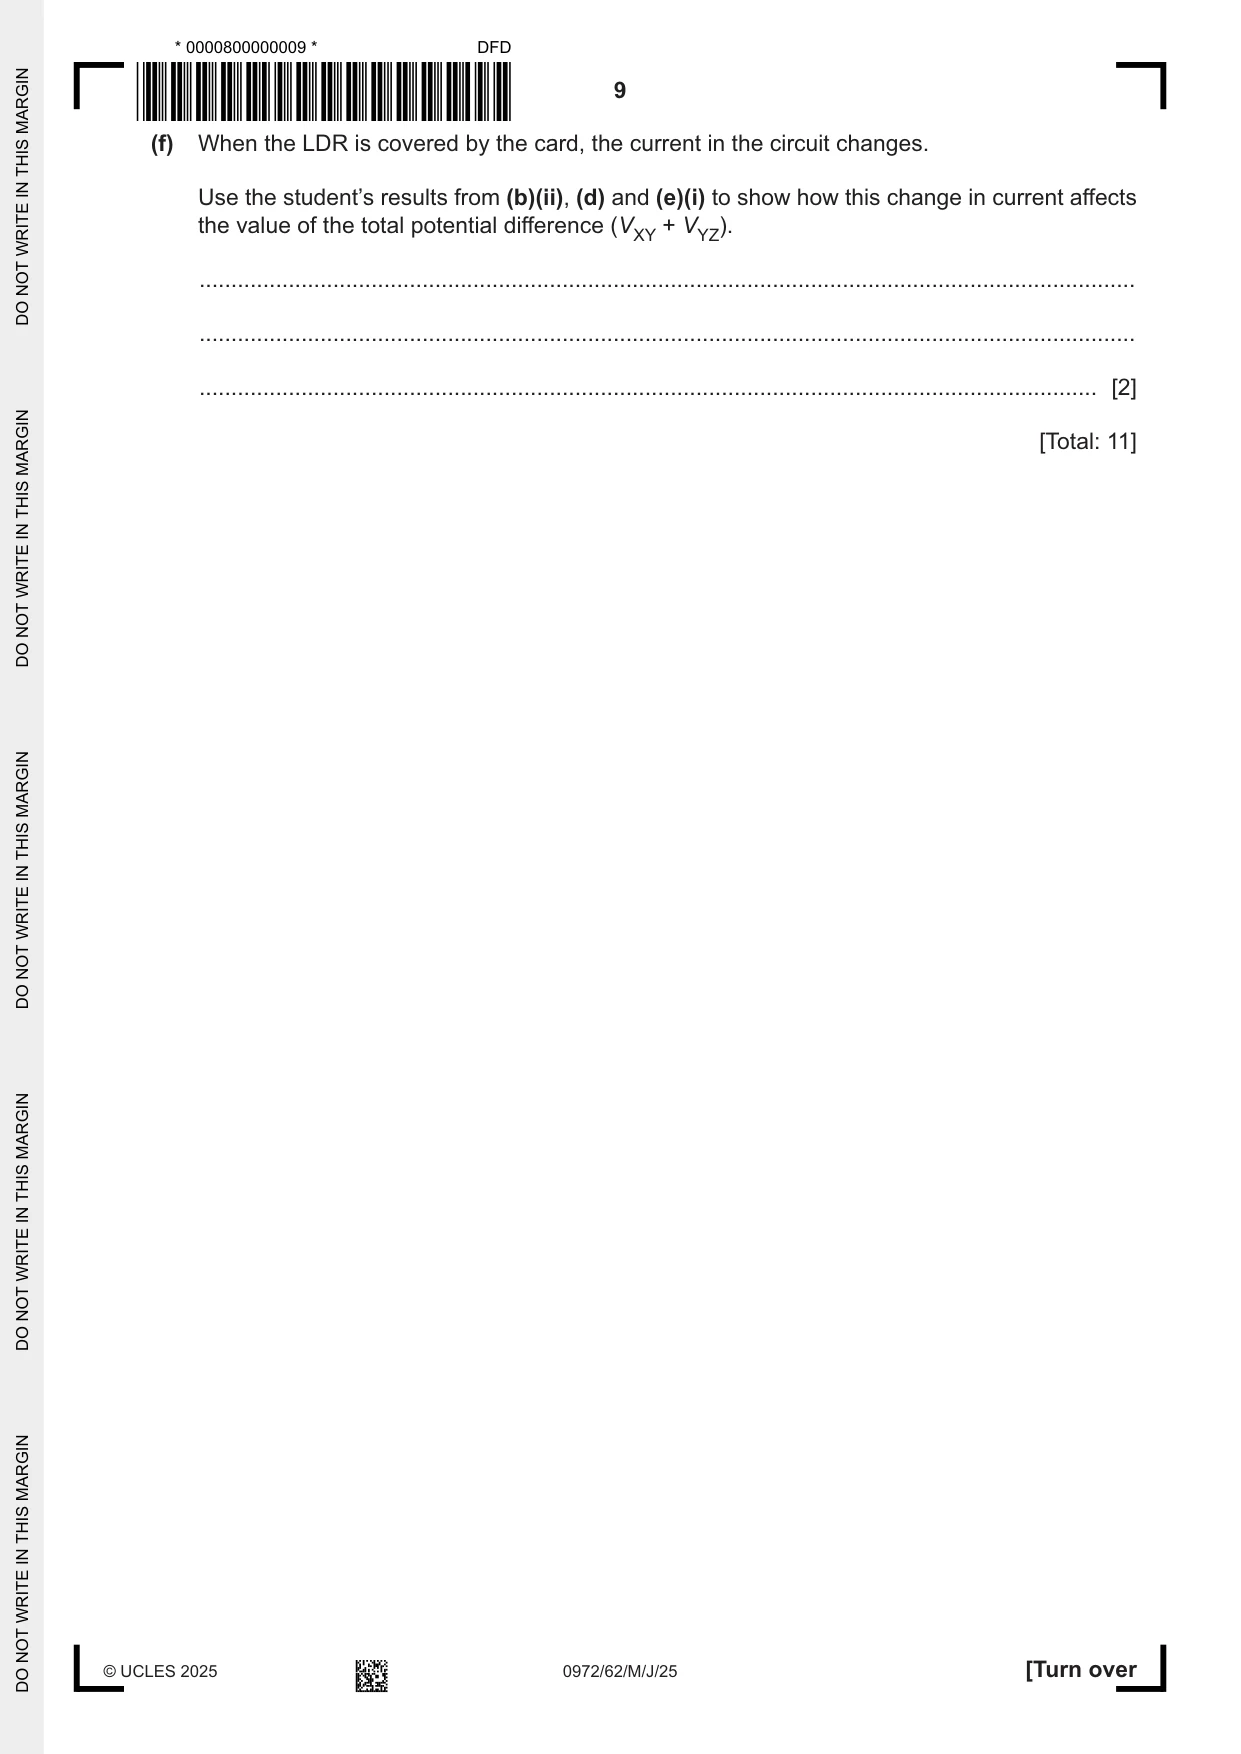
2 A student investigates a light-dependent resistor (LDR). The student assembles a series circuit consisting of a power supply, a switch, a 470 Ω resistor and an LDR. (a) Fig. 2.1 shows part of the circuit that the student assembles. + – X 470 Ω Y Z Fig. 2.1 Complete the circuit by adding the correct symbol for an LDR between Y and Z. Choose from the list provided in Fig. 2.2. Fig. 2.2 [1] (b) (i) The student: • closes the switch • connects a voltmeter across the 470 Ω resistor • records the reading on the voltmeter • opens the switch. On Fig. 2.1, draw a voltmeter connected to measure the potential difference (p.d.) across the 470 Ω resistor. [1] (ii) The voltmeter reading is shown in Fig. 2.3. 1 2 V 0 3 Fig. 2.3 Record the voltmeter reading VXY. VXY = ...................................................... V [1] (c) The current I in the circuit is calculated using the equation: VXY I = , R where R = 470 Ω. Use your voltmeter reading in (b)(ii) to calculate the current I. I = ......................................................... [2] (d) The student: • closes the switch • connects the voltmeter between points Y and Z • records the voltmeter reading VYZ • opens the switch. 2.2 V VYZ = ............................................................... Calculate the resistance RB of the LDR in bright light using the equation: VYZ RB = I . RB = ..................................................... Ω [1] (e) (i) The student covers the LDR with a piece of card and repeats the procedure described in (b) and (d). 0.15 V VXY = ............................................................... 2.9 V VYZ = ............................................................... Calculate the resistance RD of the LDR in the dark using the equation: 470 Ω × VYZ RD = . VXY RD = ..................................................... Ω [1] (ii) The student removes the card from the top of the LDR and slowly lifts it vertically upwards away from the LDR until the card is 30 cm above the LDR. The student observes and records the readings on the voltmeter across the LDR (VYZ) as the card is raised. Table 2.1 shows the student’s results. Table 2.1 distance / cm potential difference VYZ / V 0 2.9 5 2.5 10 2.4 15 2.3 20 2.2 25 2.2 30 2.2 Describe how the p.d. across the LDR (VYZ) changes as the distance between the card and the LDR increases. ........................................................................................................................................... ........................................................................................................................................... ..................................................................................................................................... [2] (f) When the LDR is covered by the card, the current in the circuit changes. Use the student’s results from (b)(ii), (d) and (e)(i) to show how this change in current affects the value of the total potential difference (VXY + VYZ). ................................................................................................................................................... ................................................................................................................................................... ............................................................................................................................................. [2] [Total: 11]
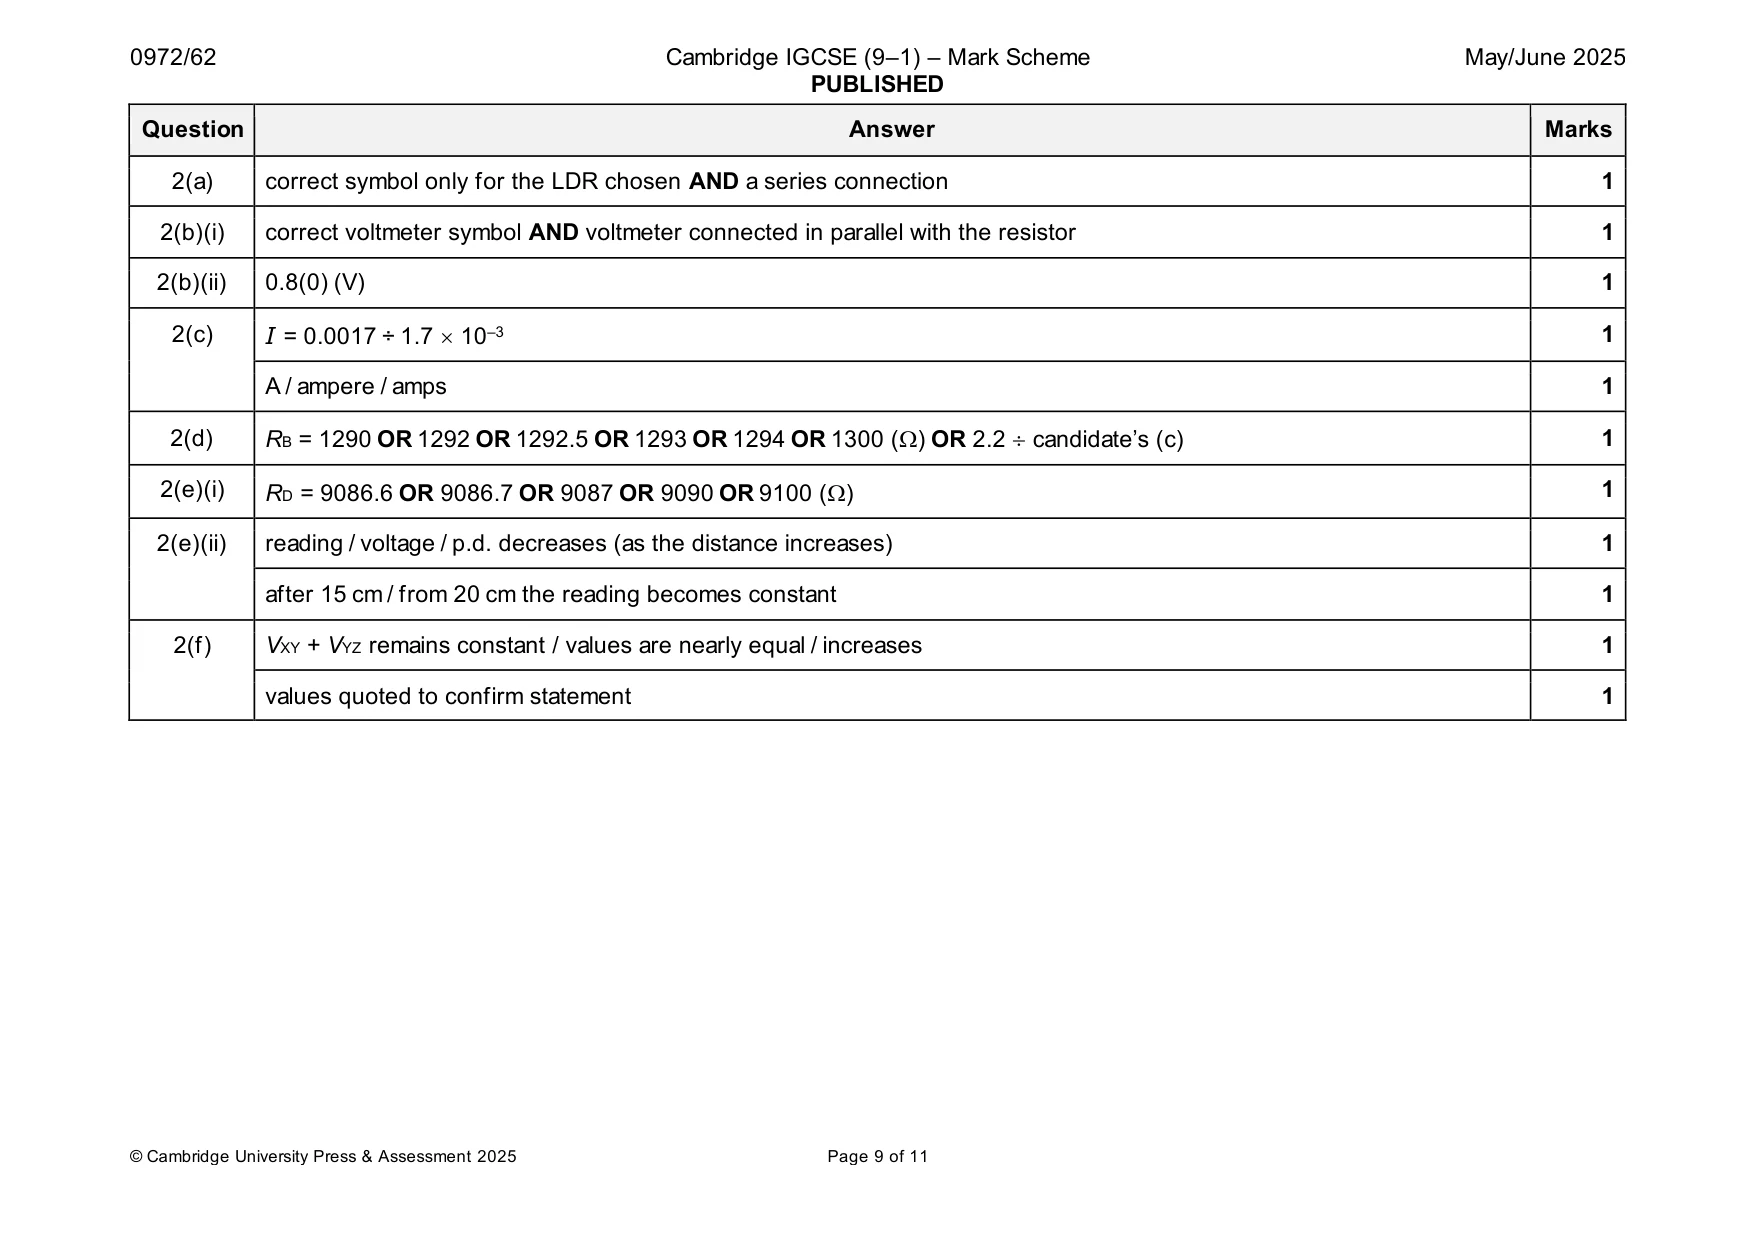
Mark scheme: 2(a) correct symbol only for the LDR chosen AND a series connection 1 2(b)(i) correct voltmeter symbol AND voltmeter connected in parallel with the resistor 1 2(b)(ii) 0.8(0) (V) 1 2(c) I = 0.0017 ÷ 1.7 10–3 1 A / ampere / amps 1 2(d) RB = 1290 OR 1292 OR 1292.5 OR 1293 OR 1294 OR 1300 () OR 2.2 candidate’s (c) 1 2(e)(i) RD = 9086.6 OR 9086.7 OR 9087 OR 9090 OR 9100 () 1 2(e)(ii) reading / voltage / p.d. decreases (as the distance increases) 1 after 15 cm / from 20 cm the reading becomes constant 1 2(f) VXY + VYZ remains constant / values are nearly equal / increases 1 values quoted to confirm statement 1
Q3 · A student investigates the image formed by a converging lens
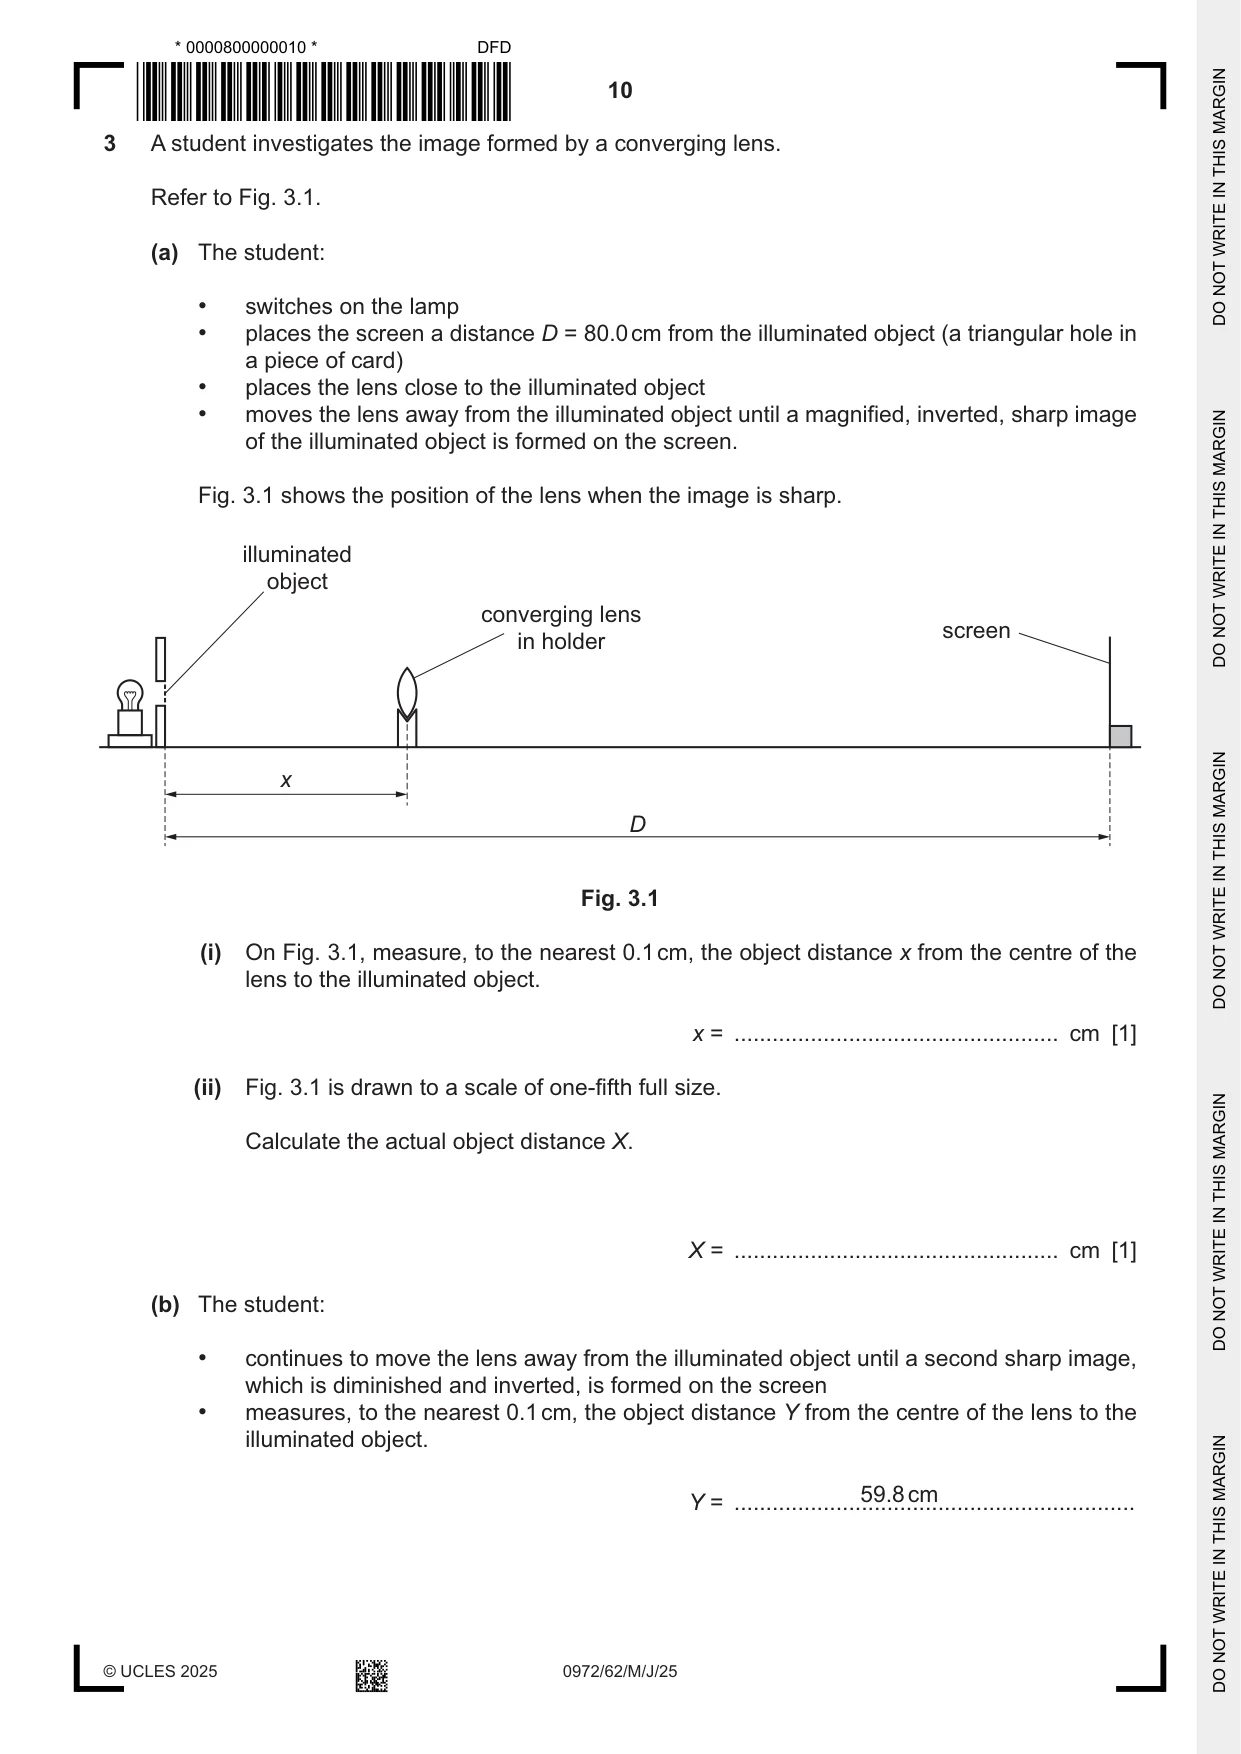
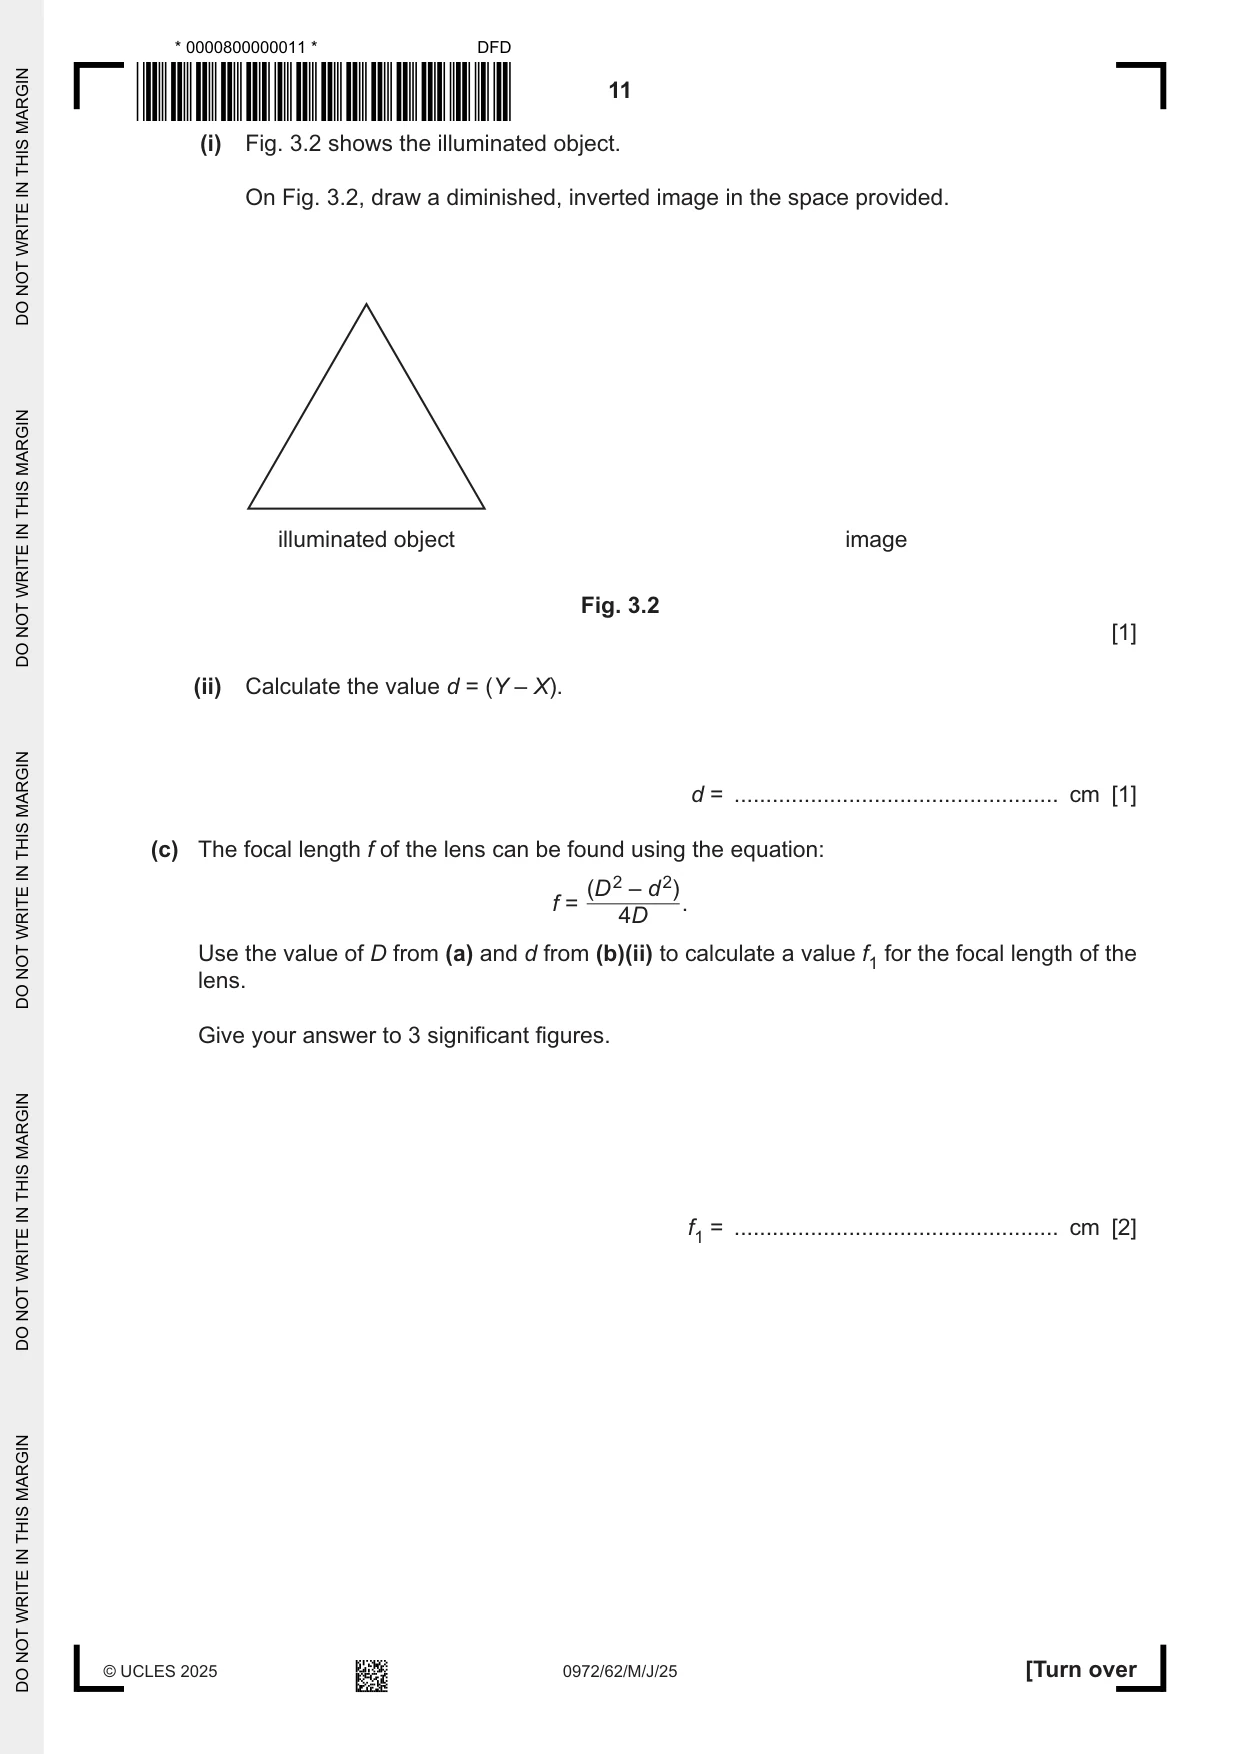
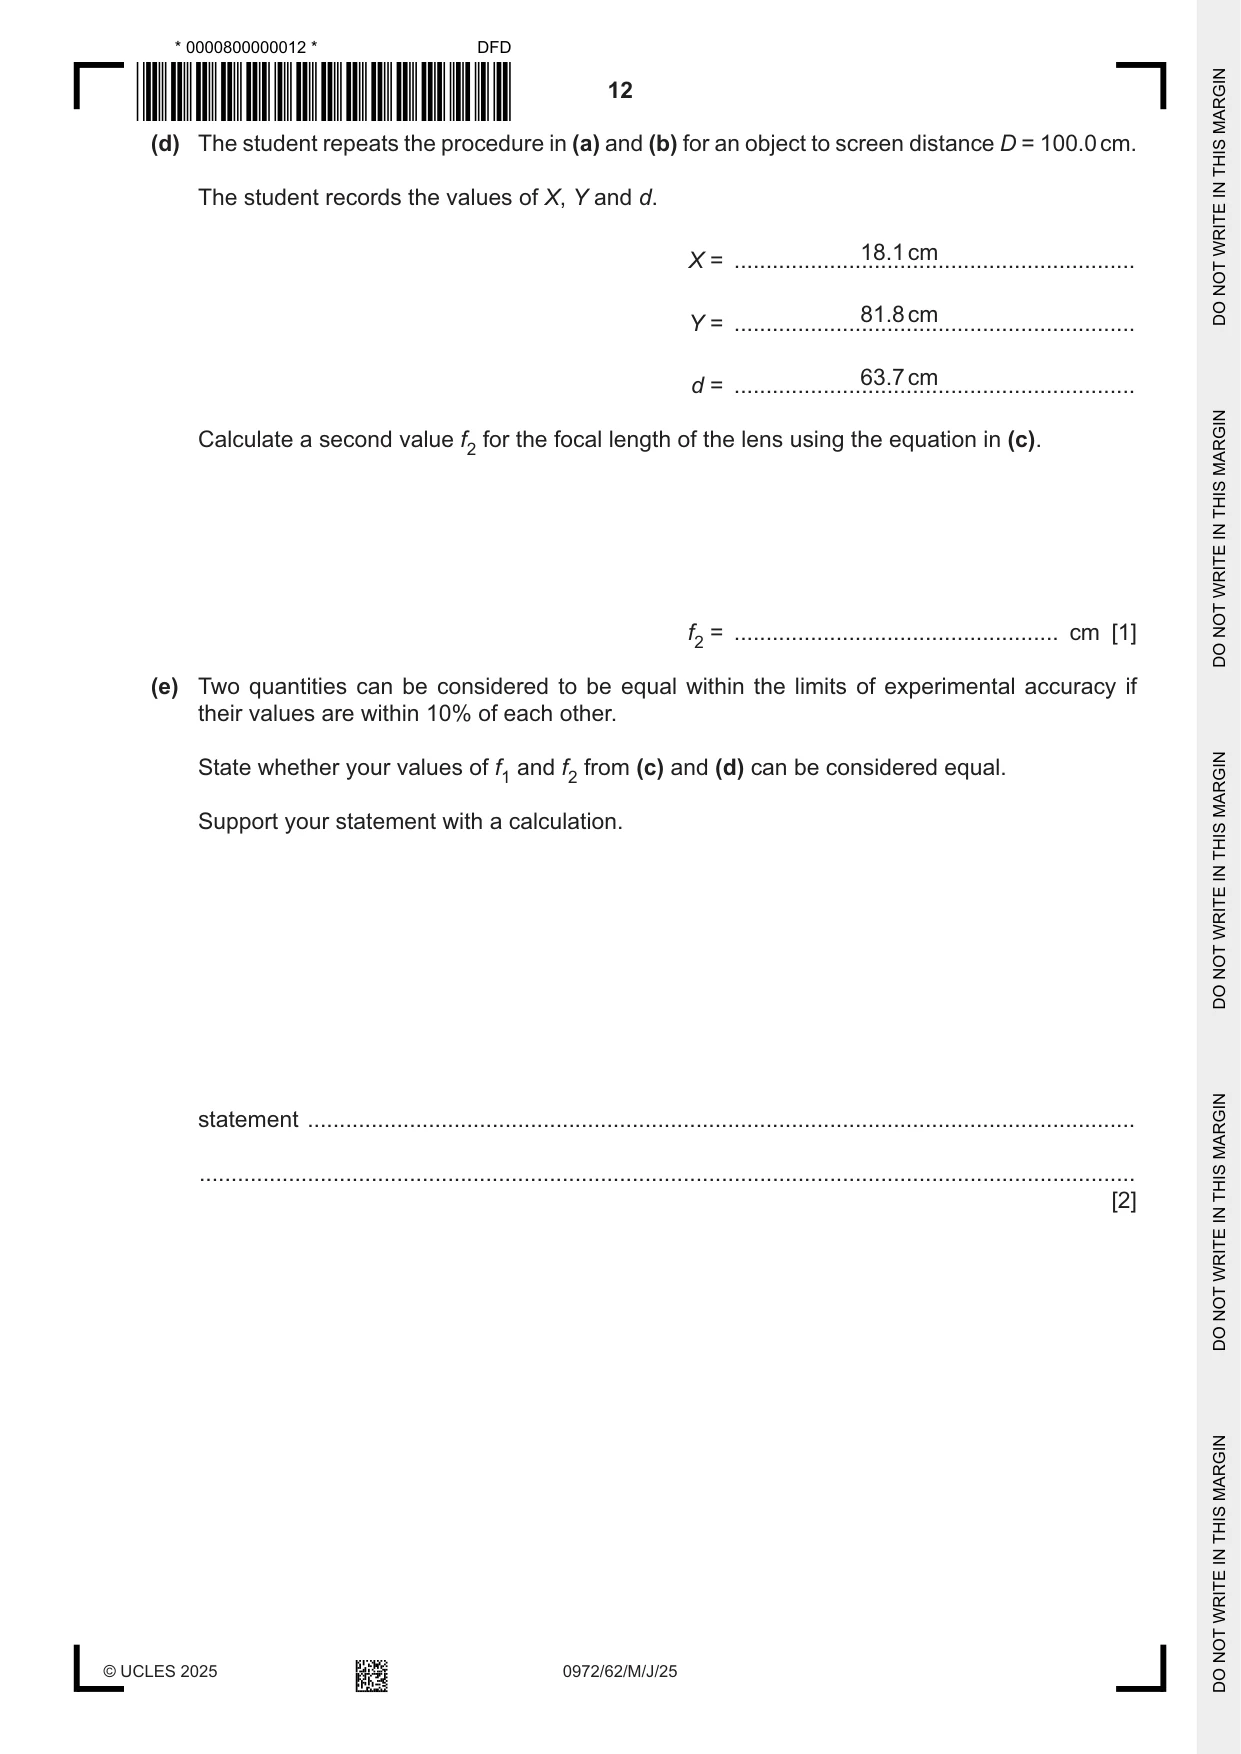
3 A student investigates the image formed by a converging lens. Refer to Fig. 3.1. (a) The student: • switches on the lamp • places the screen a distance D = 80.0 cm from the illuminated object (a triangular hole in a piece of card) • places the lens close to the illuminated object • moves the lens away from the illuminated object until a magnified, inverted, sharp image of the illuminated object is formed on the screen. Fig. 3.1 shows the position of the lens when the image is sharp. illuminated object converging lens screen in holder x D Fig. 3.1 (i) On Fig. 3.1, measure, to the nearest 0.1 cm, the object distance x from the centre of the lens to the illuminated object. x = ................................................... cm [1] (ii) Fig. 3.1 is drawn to a scale of one-fifth full size. Calculate the actual object distance X. X = ................................................... cm [1] (b) The student: • continues to move the lens away from the illuminated object until a second sharp image, which is diminished and inverted, is formed on the screen • measures, to the nearest 0.1 cm, the object distance Y from the centre of the lens to the illuminated object. 59.8 cm Y = ............................................................... (i) Fig. 3.2 shows the illuminated object. On Fig. 3.2, draw a diminished, inverted image in the space provided. illuminated object image Fig. 3.2 [1] (ii) Calculate the value d = (Y – X). d = ................................................... cm [1] (c) The focal length f of the lens can be found using the equation: (D 2 – d 2) f = . 4D Use the value of D from (a) and d from (b)(ii) to calculate a value f1 for the focal length of the lens. Give your answer to 3 significant figures. f1 = ................................................... cm [2] (d) The student repeats the procedure in (a) and (b) for an object to screen distance D = 100.0 cm. The student records the values of X, Y and d. 18.1 cm X = ............................................................... 81.8 cm Y = ............................................................... 63.7 cm d = ............................................................... Calculate a second value f2 for the focal length of the lens using the equation in (c). f2 = ................................................... cm [1] (e) Two quantities can be considered to be equal within the limits of experimental accuracy if their values are within 10% of each other. State whether your values of f1 and f2 from (c) and (d) can be considered equal. Support your statement with a calculation. statement .................................................................................................................................. ................................................................................................................................................... [2] (f) (i) State one technique to use when doing this type of experiment to ensure that the image on the screen is focused as clearly as possible. ........................................................................................................................................... ........................................................................................................................................... ..................................................................................................................................... [1] (ii) This experiment is usually done in a darkened room. Explain how this makes it easier to see when the image is in focus. ........................................................................................................................................... ..................................................................................................................................... [1] [Total: 11]
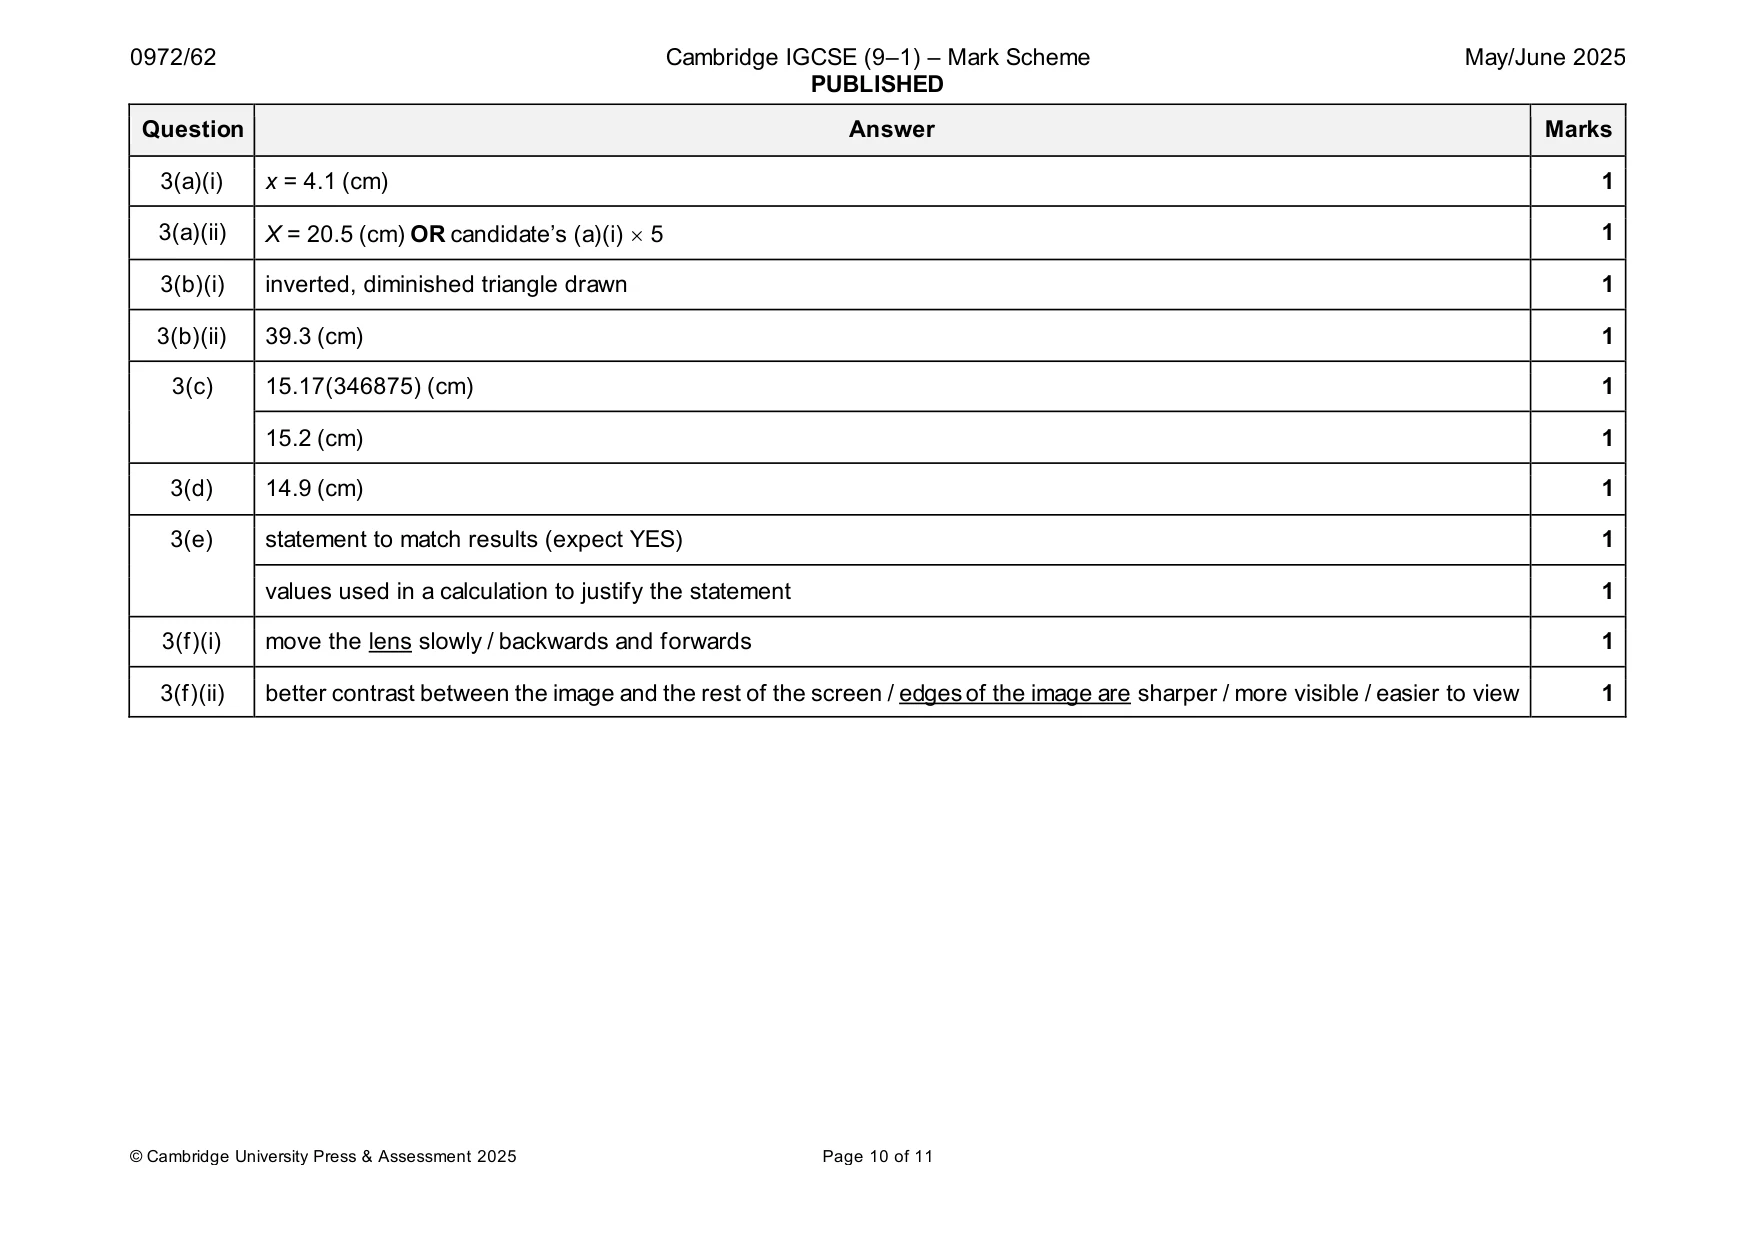
Mark scheme: 3(a)(i) x = 4.1 (cm) 1 3(a)(ii) X = 20.5 (cm) OR candidate’s (a)(i) 5 1 3(b)(i) inverted, diminished triangle drawn 1 3(b)(ii) 39.3 (cm) 1 3(c) 15.17(346875) (cm) 1 15.2 (cm) 1 3(d) 14.9 (cm) 1 3(e) statement to match results (expect YES) 1 values used in a calculation to justify the statement 1 3(f)(i) move the lens slowly / backwards and forwards 1 3(f)(ii) better contrast between the image and the rest of the screen / edges of the image are sharper / more visible / easier to view 1
Q4 · Hot water is poured into a glass beaker and allowed to cool down for 5 minutes
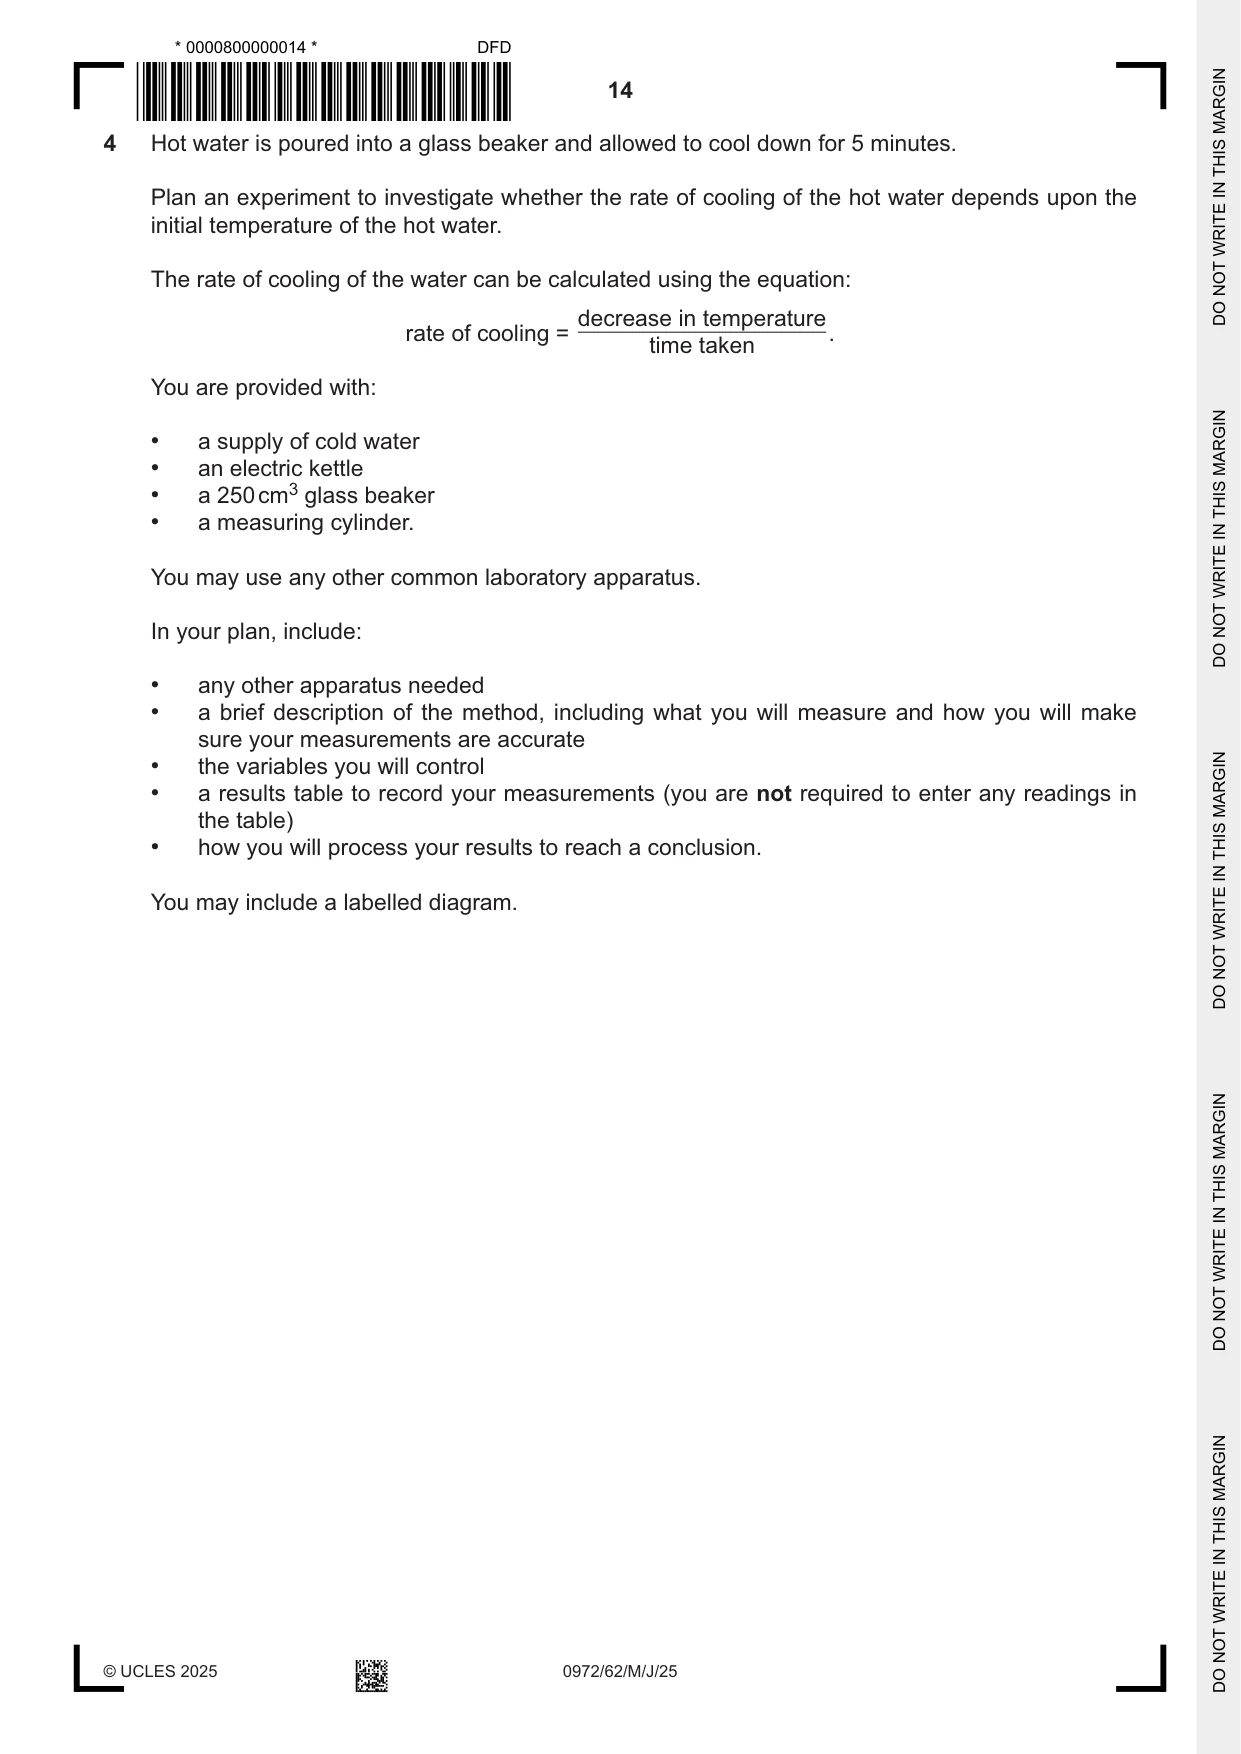
4 Hot water is poured into a glass beaker and allowed to cool down for 5 minutes. Plan an experiment to investigate whether the rate of cooling of the hot water depends upon the initial temperature of the hot water. The rate of cooling of the water can be calculated using the equation: decrease in temperature rate of cooling = . time taken You are provided with: • a supply of cold water • an electric kettle • a 250 cm3 glass beaker • a measuring cylinder. You may use any other common laboratory apparatus. In your plan, include: • any other apparatus needed • a brief description of the method, including what you will measure and how you will make sure your measurements are accurate • the variables you will control • a results table to record your measurements (you are not required to enter any readings in the table) • how you will process your results to reach a conclusion. You may include a labelled diagram. .......................................................................................................................................................... .......................................................................................................................................................... .......................................................................................................................................................... .......................................................................................................................................................... .......................................................................................................................................................... .......................................................................................................................................................... .......................................................................................................................................................... .......................................................................................................................................................... .......................................................................................................................................................... .......................................................................................................................................................... .......................................................................................................................................................... .......................................................................................................................................................... .......................................................................................................................................................... .......................................................................................................................................................... .......................................................................................................................................................... .......................................................................................................................................................... .......................................................................................................................................................... .......................................................................................................................................................... .......................................................................................................................................................... .................................................................................................................................................... [7]
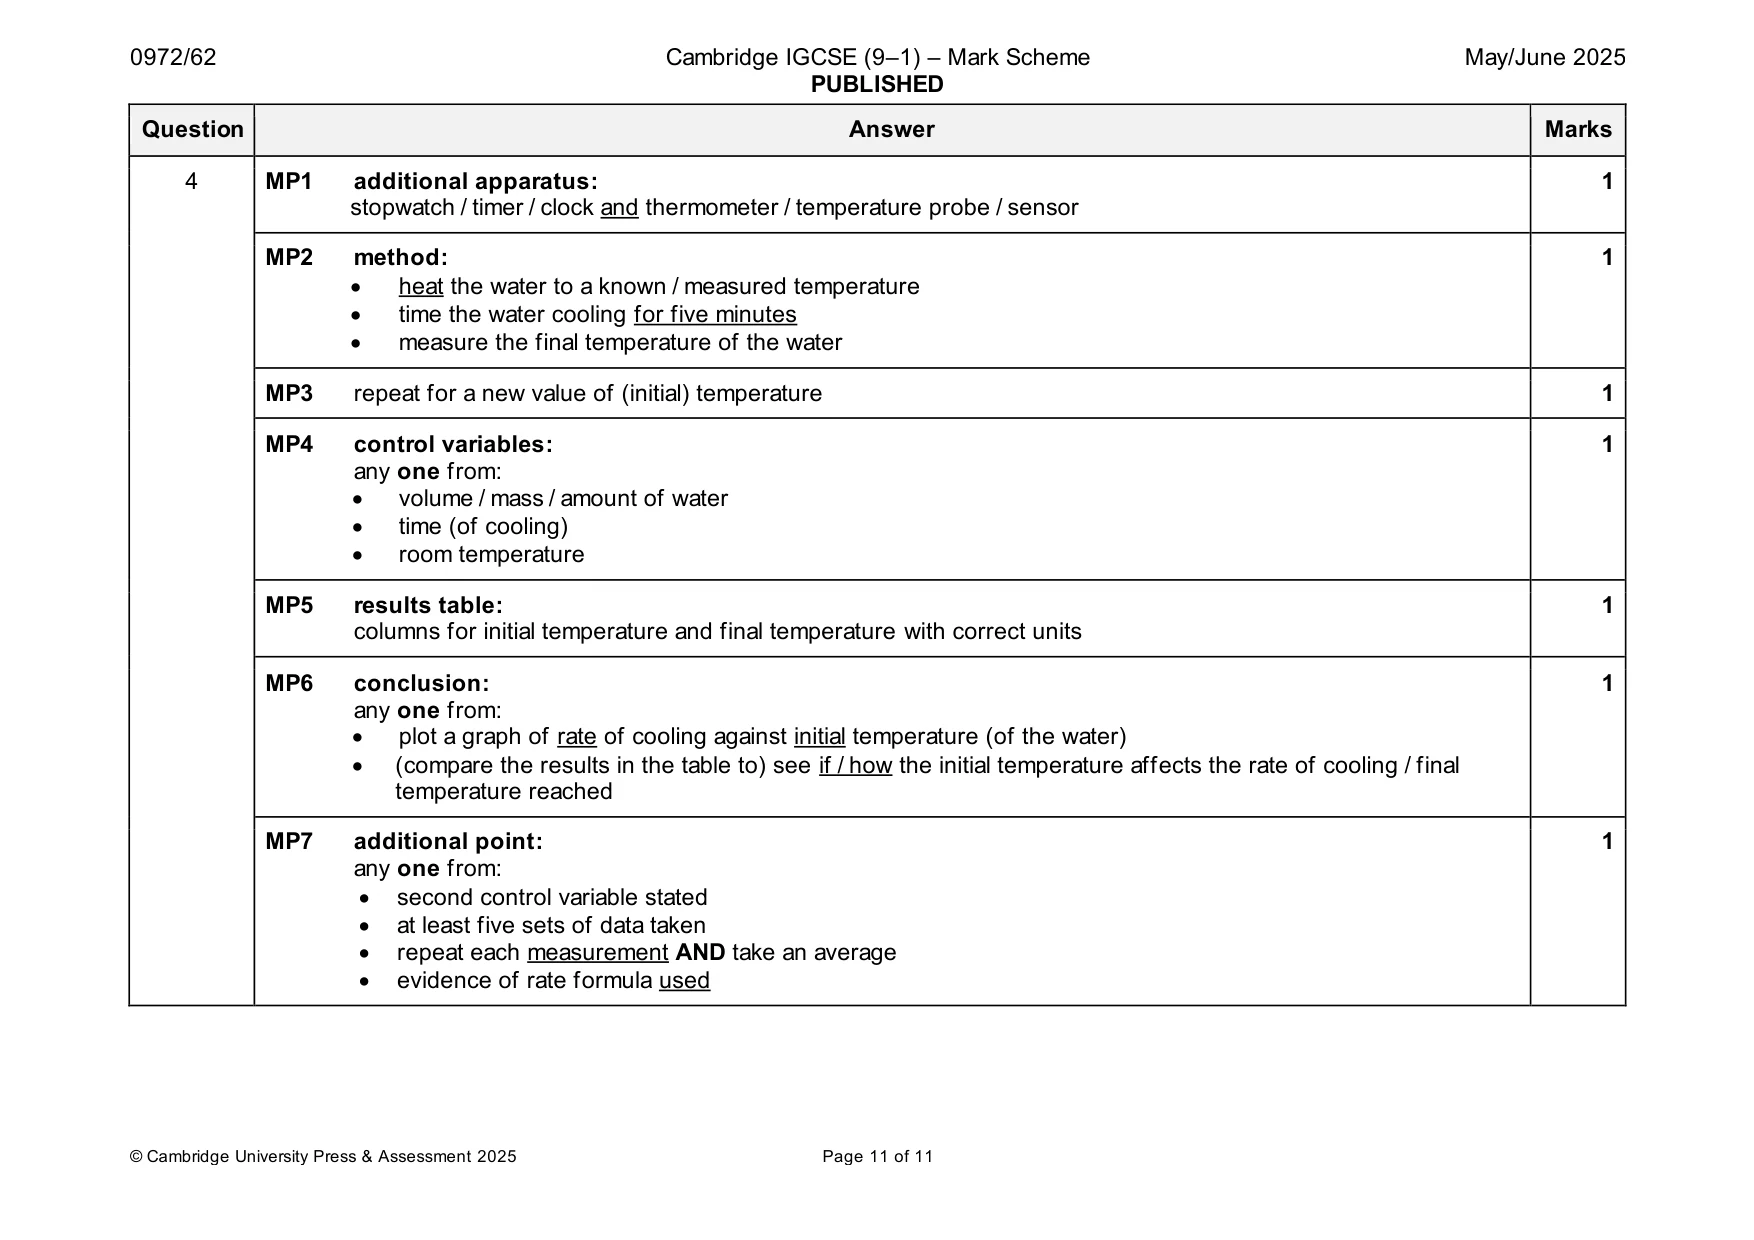
Mark scheme: 4 MP1 additional apparatus: 1 stopwatch / timer / clock and thermometer / temperature probe / sensor MP2 method: 1 • heat the water to a known / measured temperature • time the water cooling for five minutes • measure the final temperature of the water MP3 repeat for a new value of (initial) temperature 1 MP4 control variables: 1 any one from: • volume / mass / amount of water • time (of cooling) • room temperature MP5 results table: 1 columns for initial temperature and final temperature with correct units MP6 conclusion: 1 any one from: • plot a graph of rate of cooling against initial temperature (of the water) • (compare the results in the table to) see if / how the initial temperature affects the rate of cooling / final temperature reached MP7 additional point: 1 any one from: • second control variable stated • at least five sets of data taken • repeat each measurement AND take an average • evidence of rate formula used
What was in this paper
The subtopics covered by these 4 questions, and how many questions each got. Open one in a new tab to see every Cambridge question on it.
What you needed in this session
Cambridge’s own grade thresholds for 2025 May/June, Paper 6 · Variant 2. A higher threshold means an easier paper — the bar moves with how the cohort did.