Cambridge IGCSE Physics 0625 — 2022 Oct/Nov Paper 6 · Variant 2
0625/62/O/N/22 · 4 questions · 40 marks · ≈45 min
The question paper and its mark scheme, free to read here and free to download. This is Cambridge’s own paper, exactly as it was sat.
Question paper12 pages
Mark scheme9 pages
Answers below. Sit the paper first if you are practising.
Questions as text
Q1 · A student investigates temperature changes when mixing hot and cold water
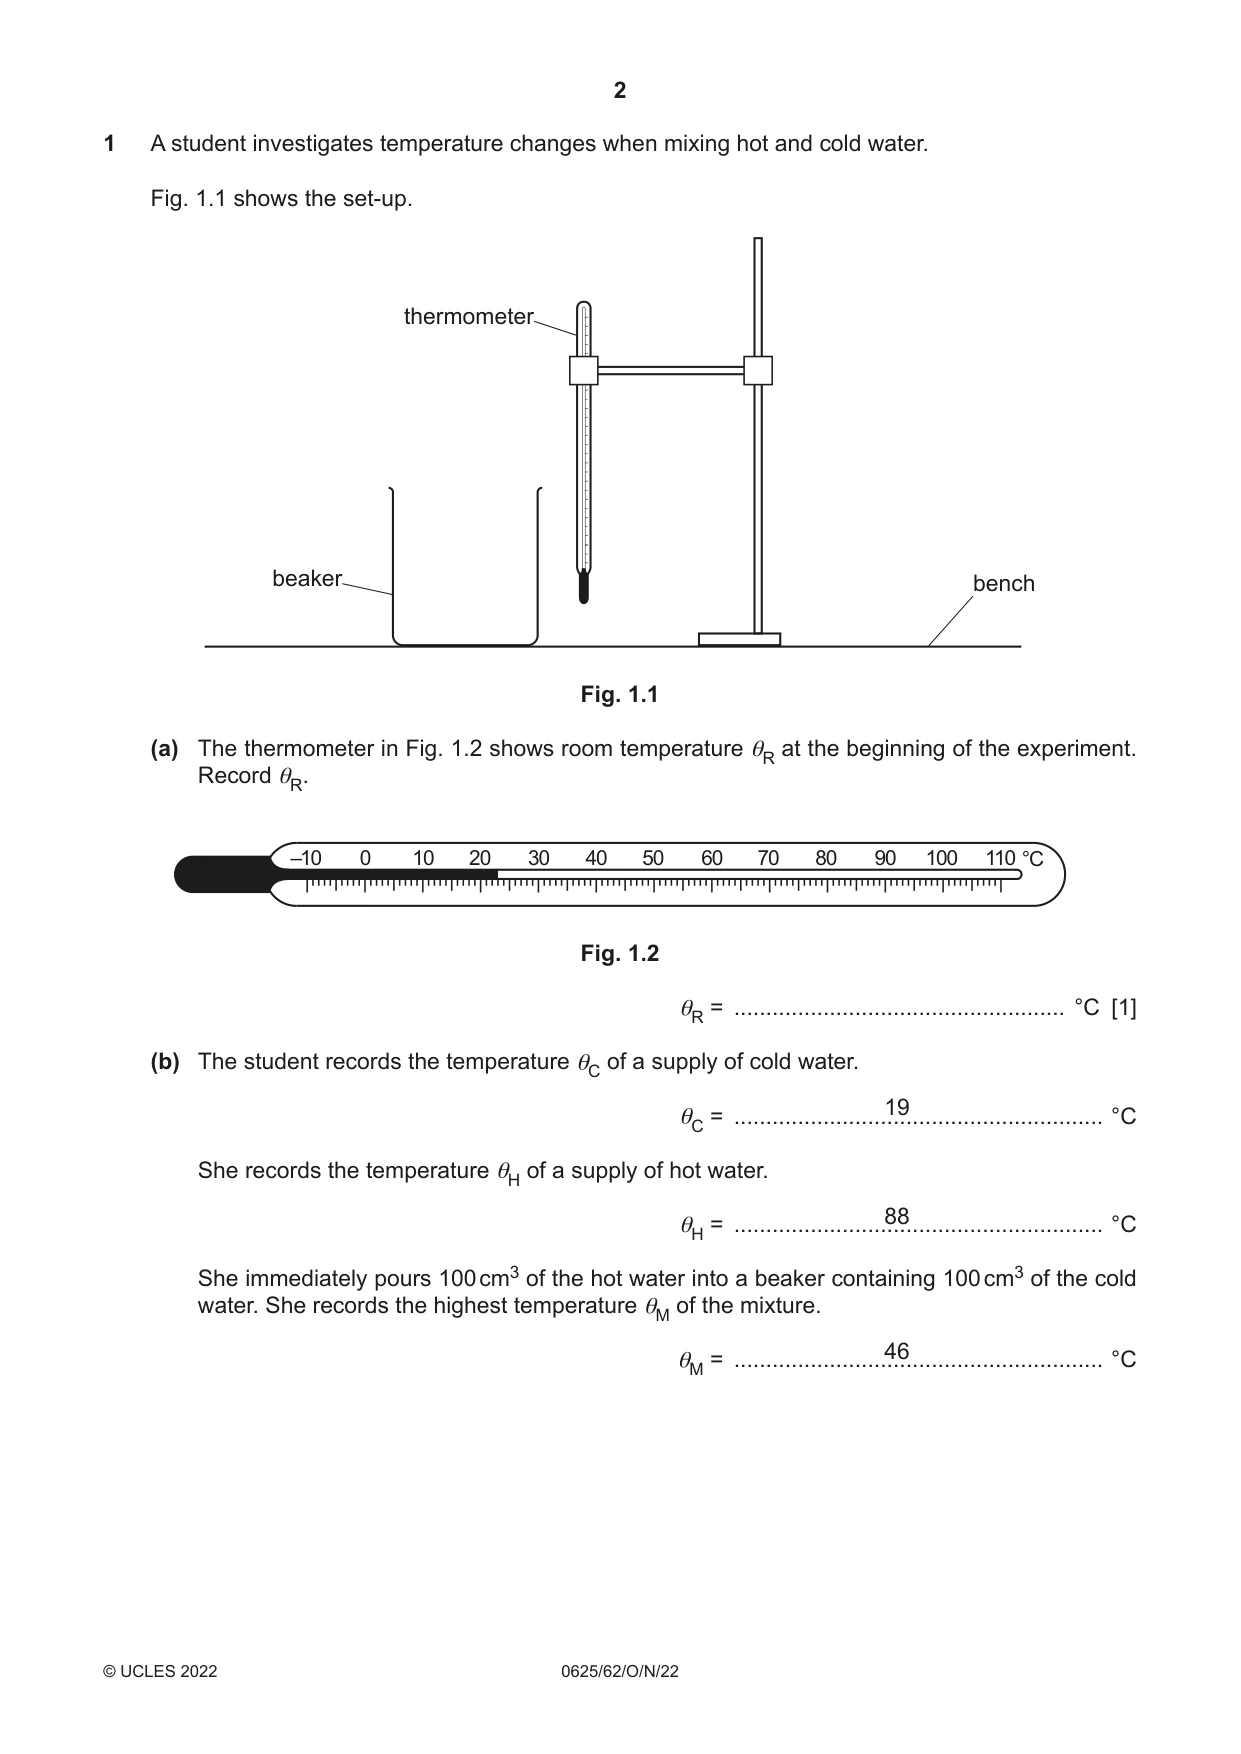
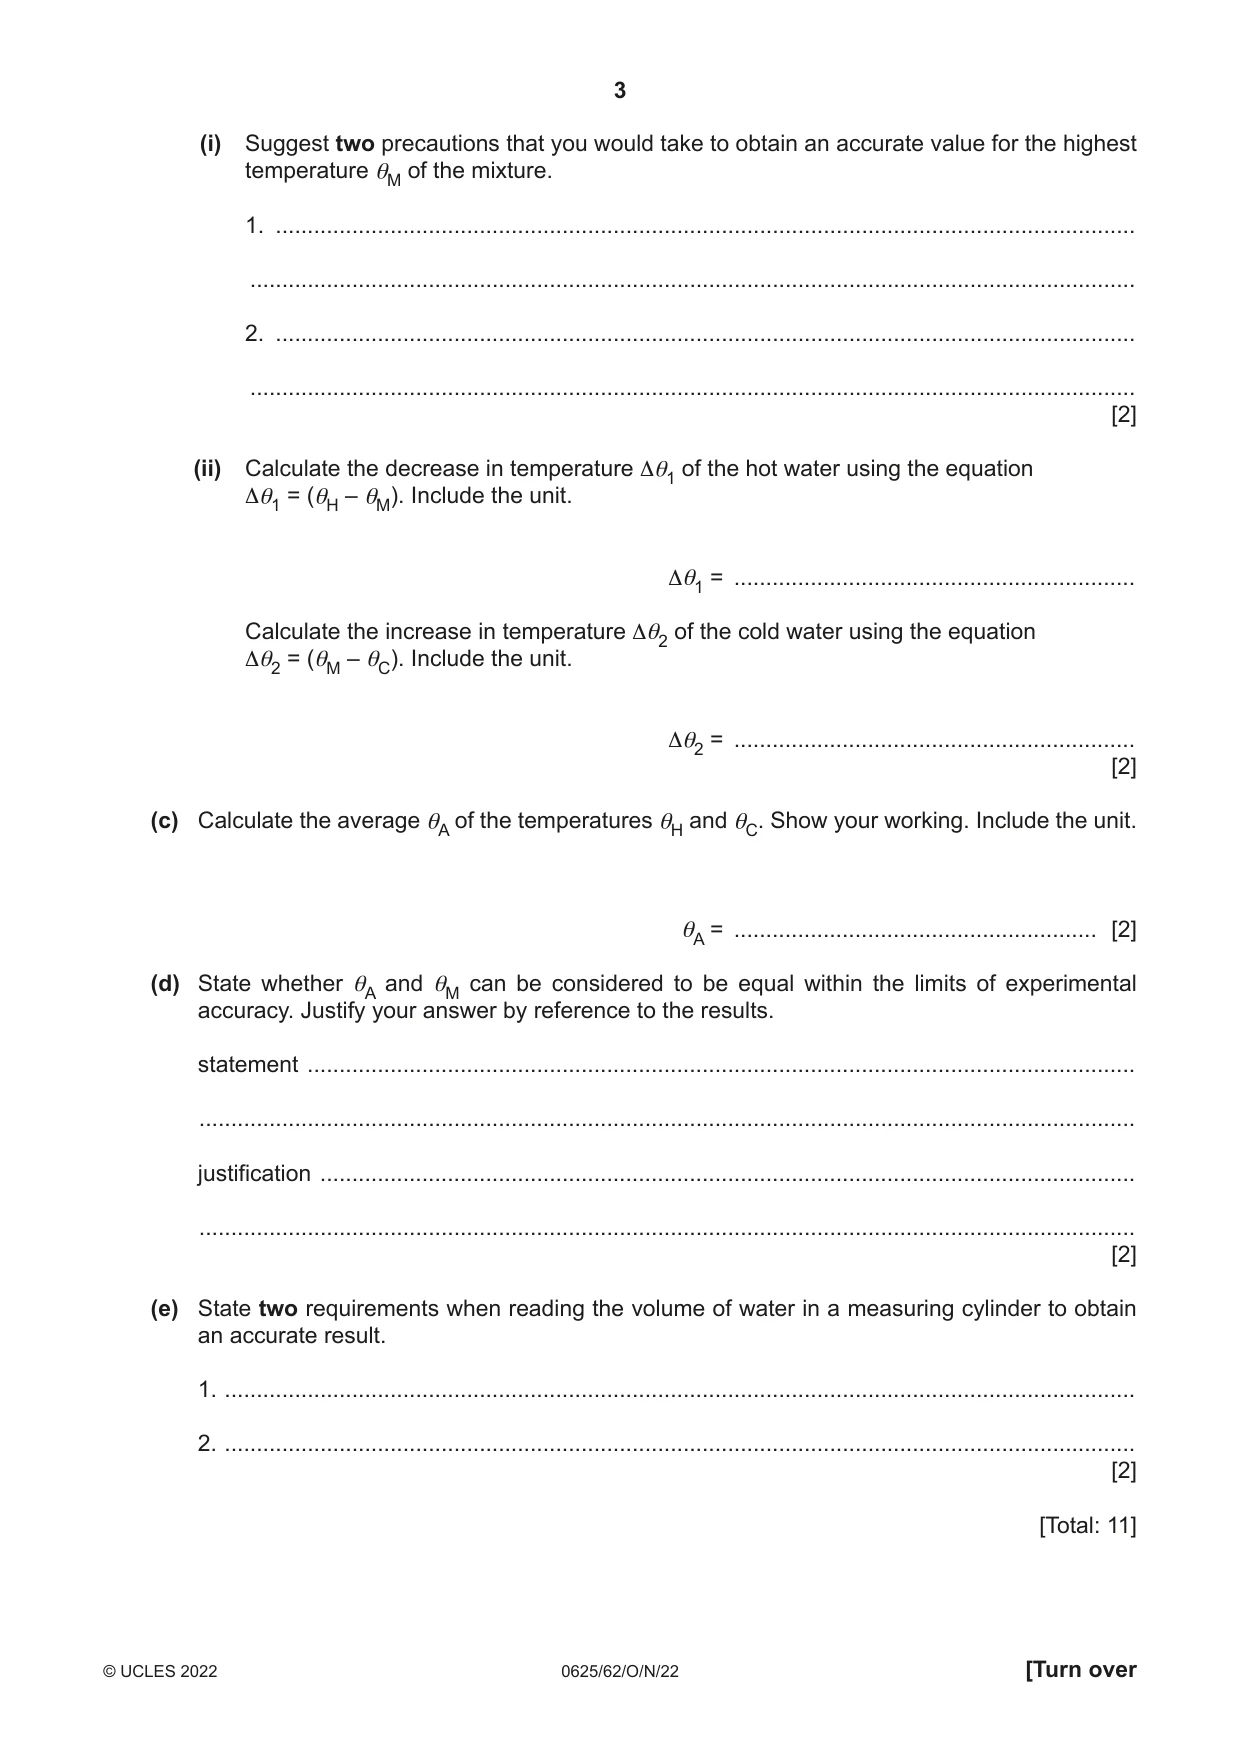
1 A student investigates temperature changes when mixing hot and cold water. Fig. 1.1 shows the set-up. thermometer beaker bench Fig. 1.1 (a) The thermometer in Fig. 1.2 shows room temperature θR at the beginning of the experiment. Record θR. –10 0 10 20 30 40 50 60 70 80 90 100 110 °C Fig. 1.2 θR = .................................................... °C [1] (b) The student records the temperature θC of a supply of cold water. 19 θC = .......................................................... °C She records the temperature θH of a supply of hot water. 88 θH = .......................................................... °C She immediately pours 100 cm3 of the hot water into a beaker containing 100 cm3 of the cold water. She records the highest temperature θM of the mixture. 46 θM = .......................................................... °C (i) Suggest two precautions that you would take to obtain an accurate value for the highest temperature θM of the mixture. 1. ....................................................................................................................................... ........................................................................................................................................... 2. ....................................................................................................................................... ........................................................................................................................................... [2] (ii) Calculate the decrease in temperature Δθ1 of the hot water using the equation Δθ1 = (θH – θM). Include the unit. Δθ1 = ............................................................... Calculate the increase in temperature Δθ2 of the cold water using the equation Δθ2 = (θM – θC). Include the unit. Δθ2 = ............................................................... [2] (c) Calculate the average θA of the temperatures θH and θC. Show your working. Include the unit. θA = ......................................................... [2] (d) State whether θA and θM can be considered to be equal within the limits of experimental accuracy. Justify your answer by reference to the results. statement .................................................................................................................................. ................................................................................................................................................... justification ................................................................................................................................ ................................................................................................................................................... [2] (e) State two requirements when reading the volume of water in a measuring cylinder to obtain an accurate result. 1. ............................................................................................................................................... 2. ............................................................................................................................................... [2] [Total: 11]
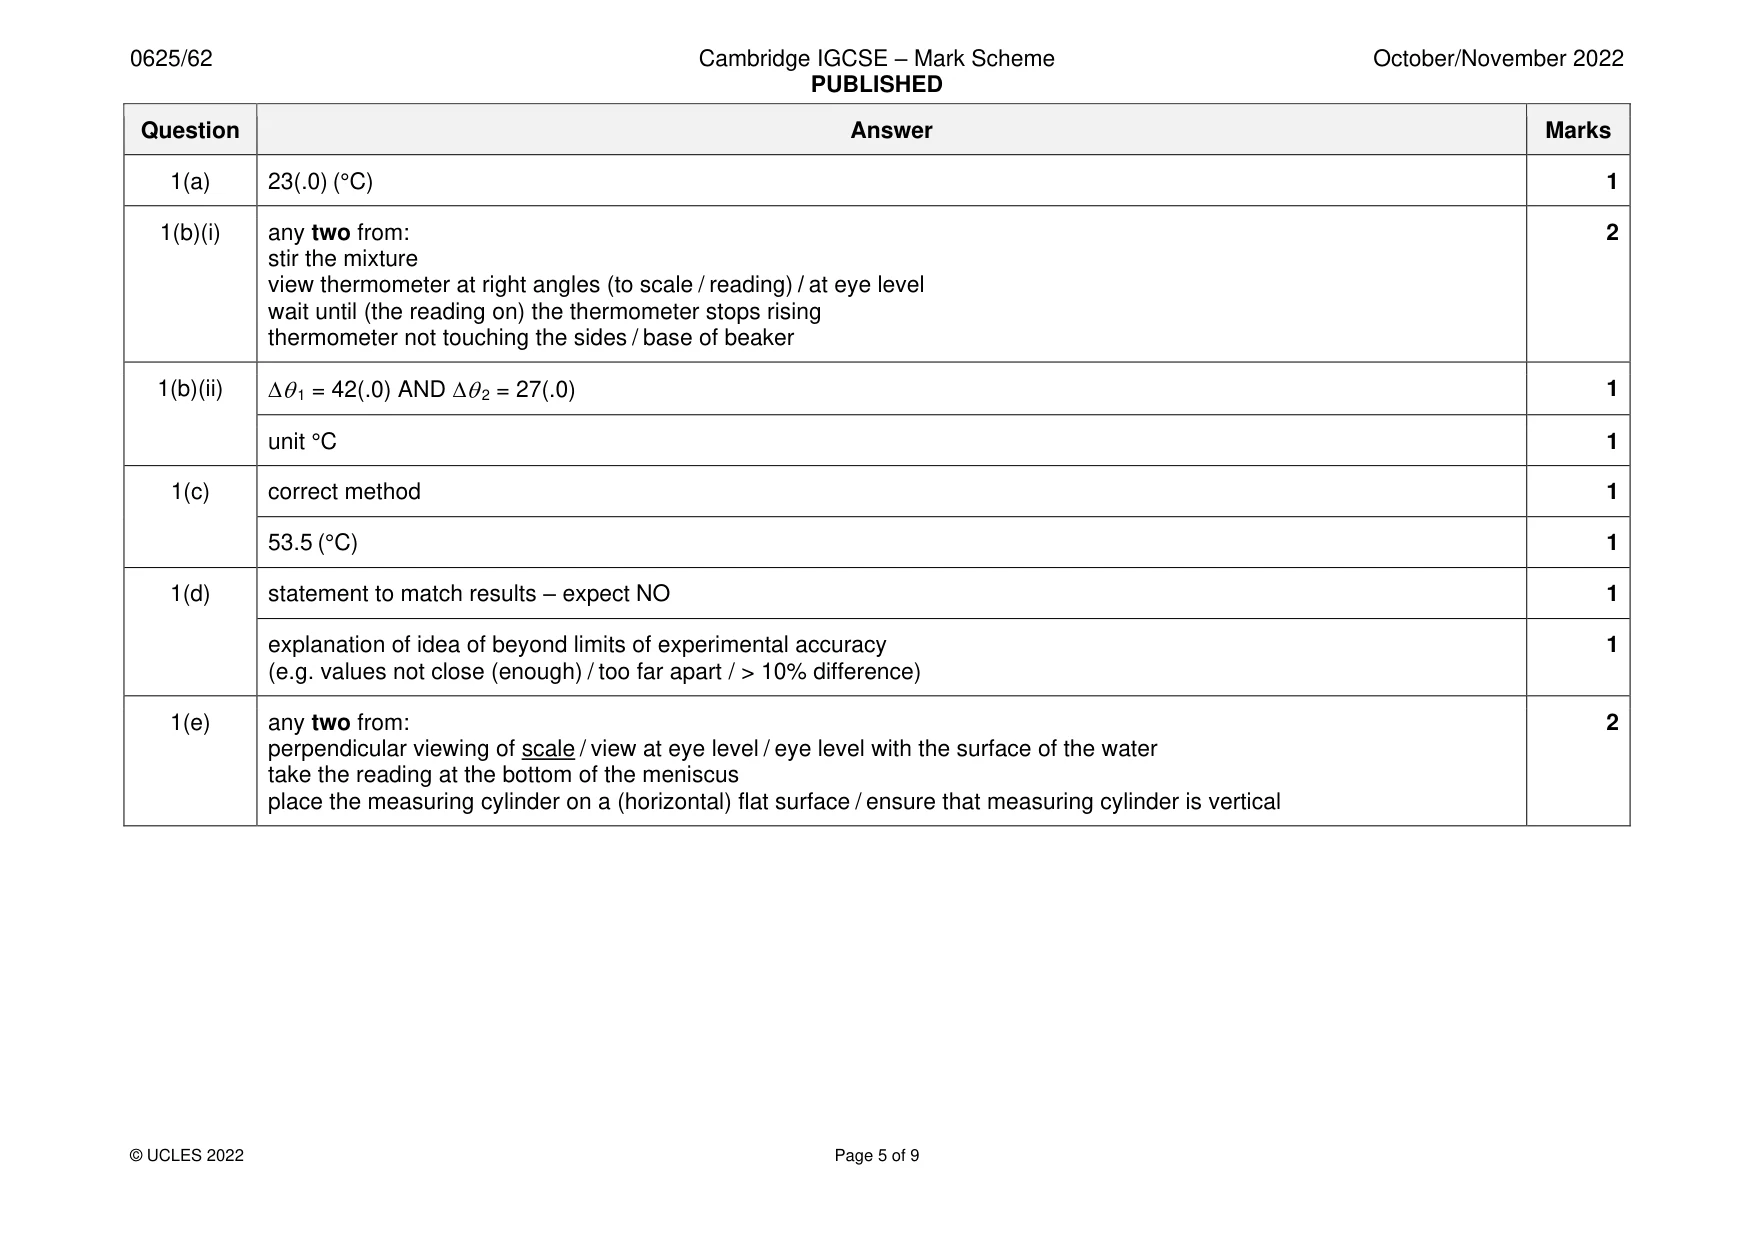
Mark scheme: Question Answer Marks 1(a) 23(.0) (°C) 1 1(b)(i) any two from: 2 stir the mixture view thermometer at right angles (to scale / reading) / at eye level wait until (the reading on) the thermometer stops rising thermometer not touching the sides / base of beaker 1(b)(ii) 1 = 42(.0) AND 2 = 27(.0) 1 unit °C 1 1(c) correct method 1 53.5 (°C) 1 1(d) statement to match results – expect NO 1 explanation of idea of beyond limits of experimental accuracy 1 (e.g. values not close (enough) / too far apart / > 10% difference) 1(e) any two from: 2 perpendicular viewing of scale / view at eye level / eye level with the surface of the water take the reading at the bottom of the meniscus place the measuring cylinder on a (horizontal) flat surface / ensure that measuring cylinder is vertical
Q2 · A student investigates the position of the image in a plane mirror
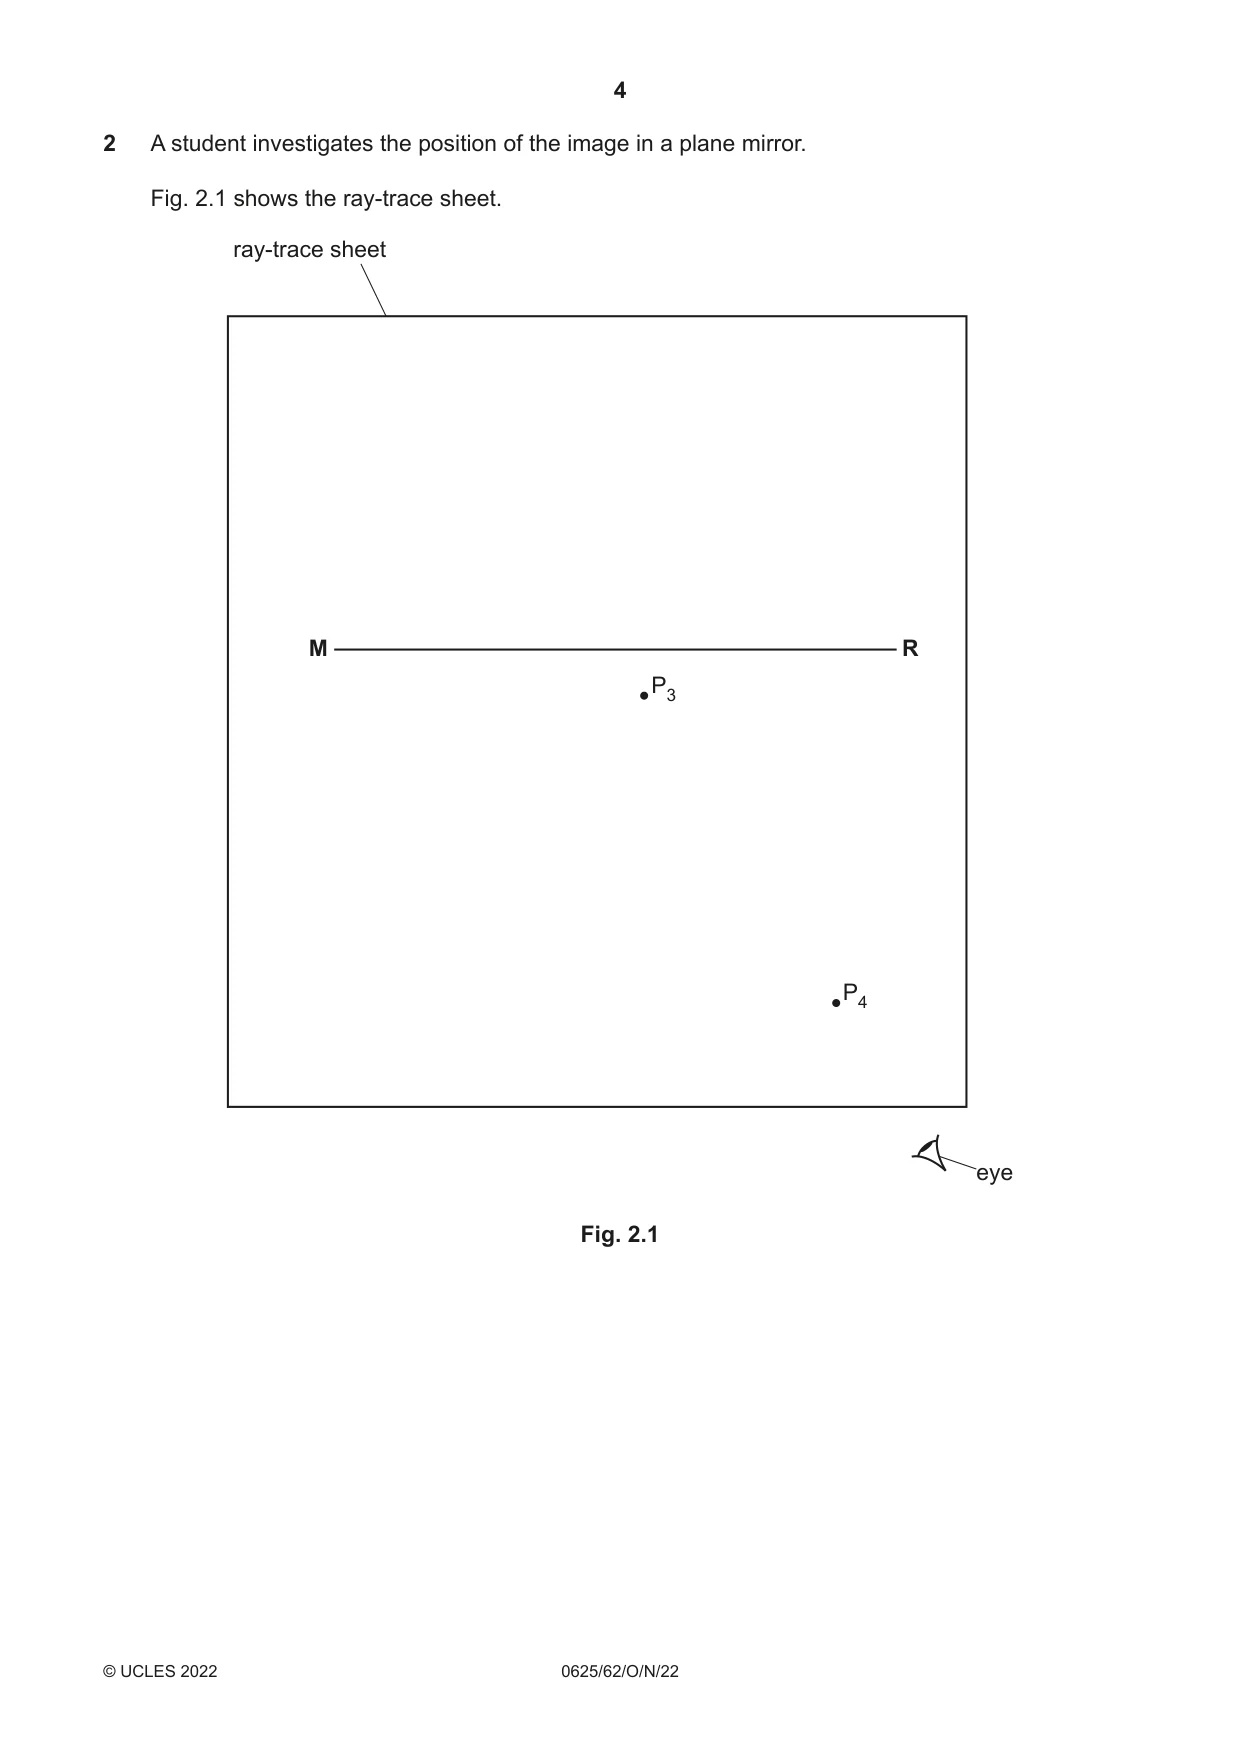
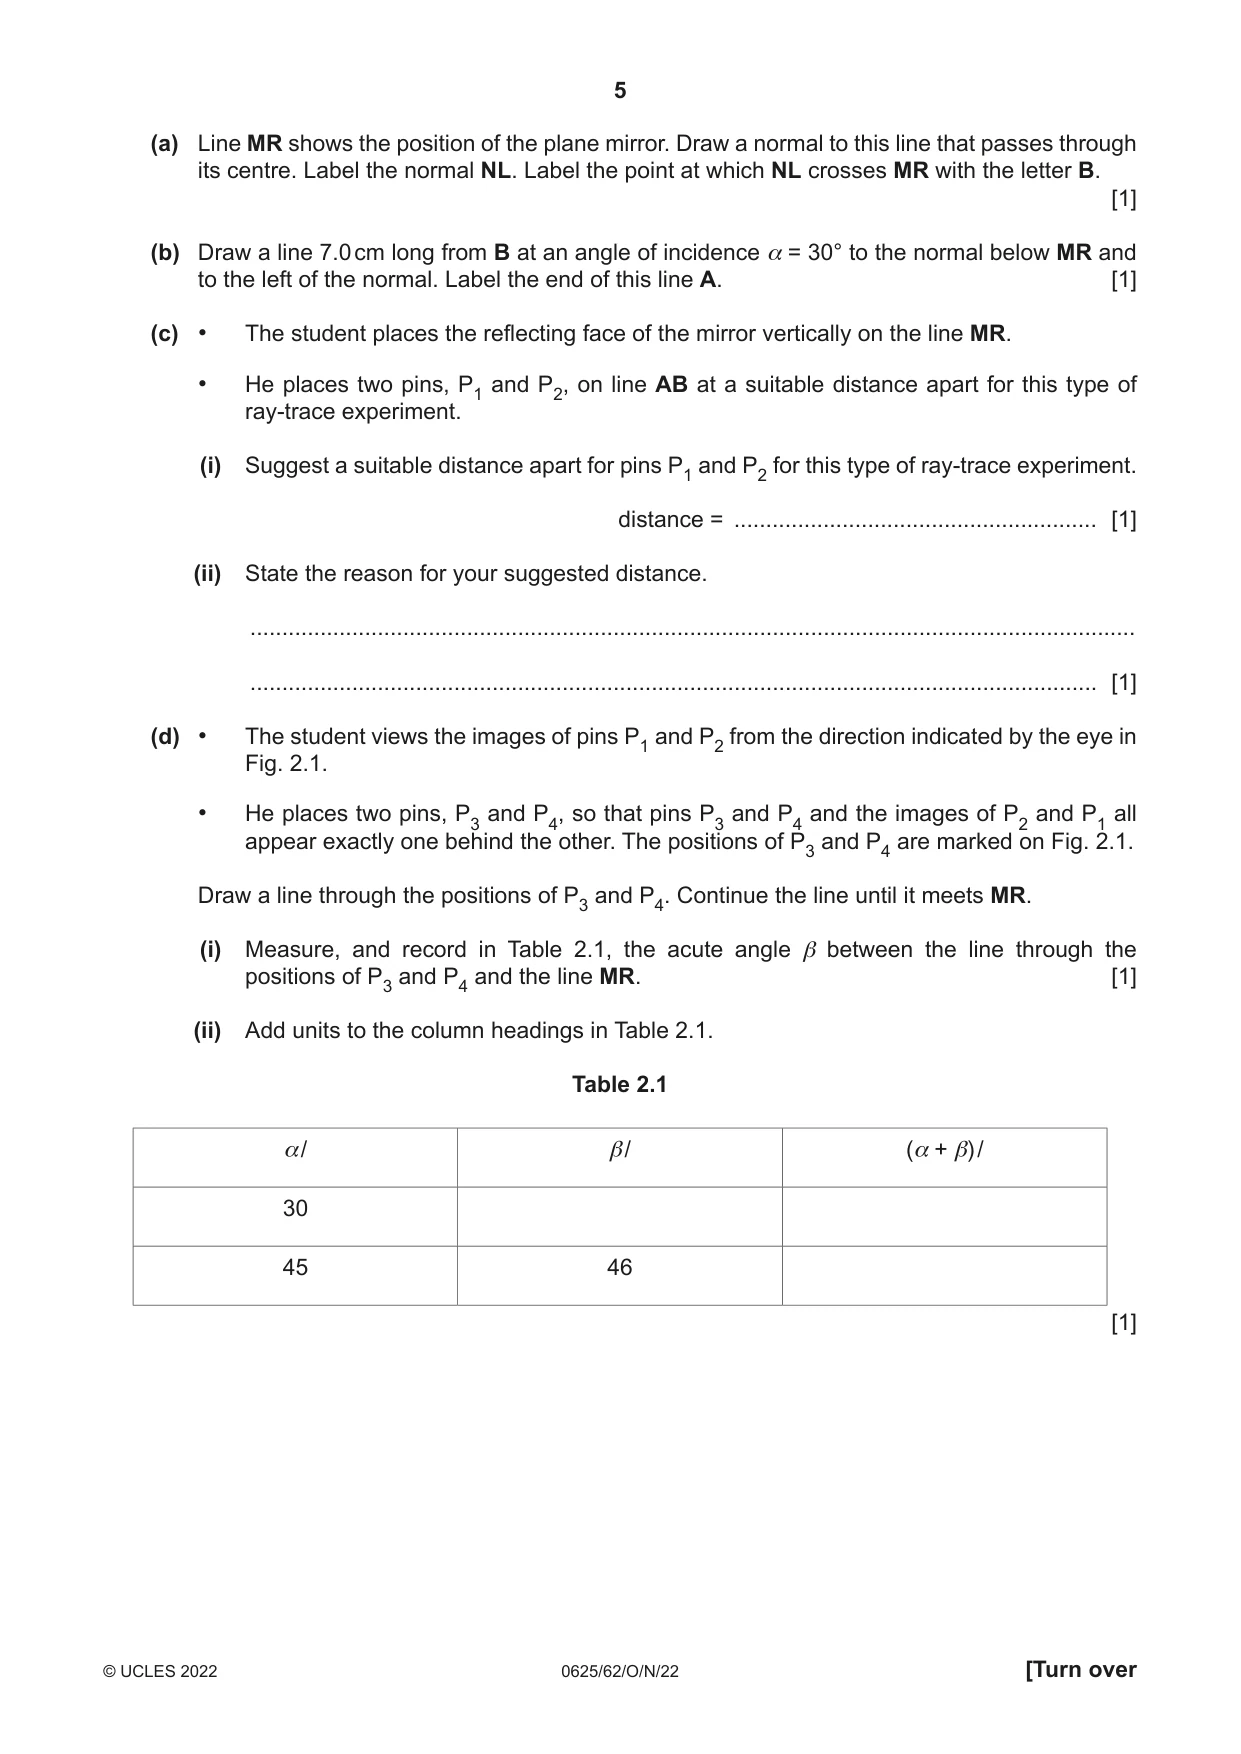
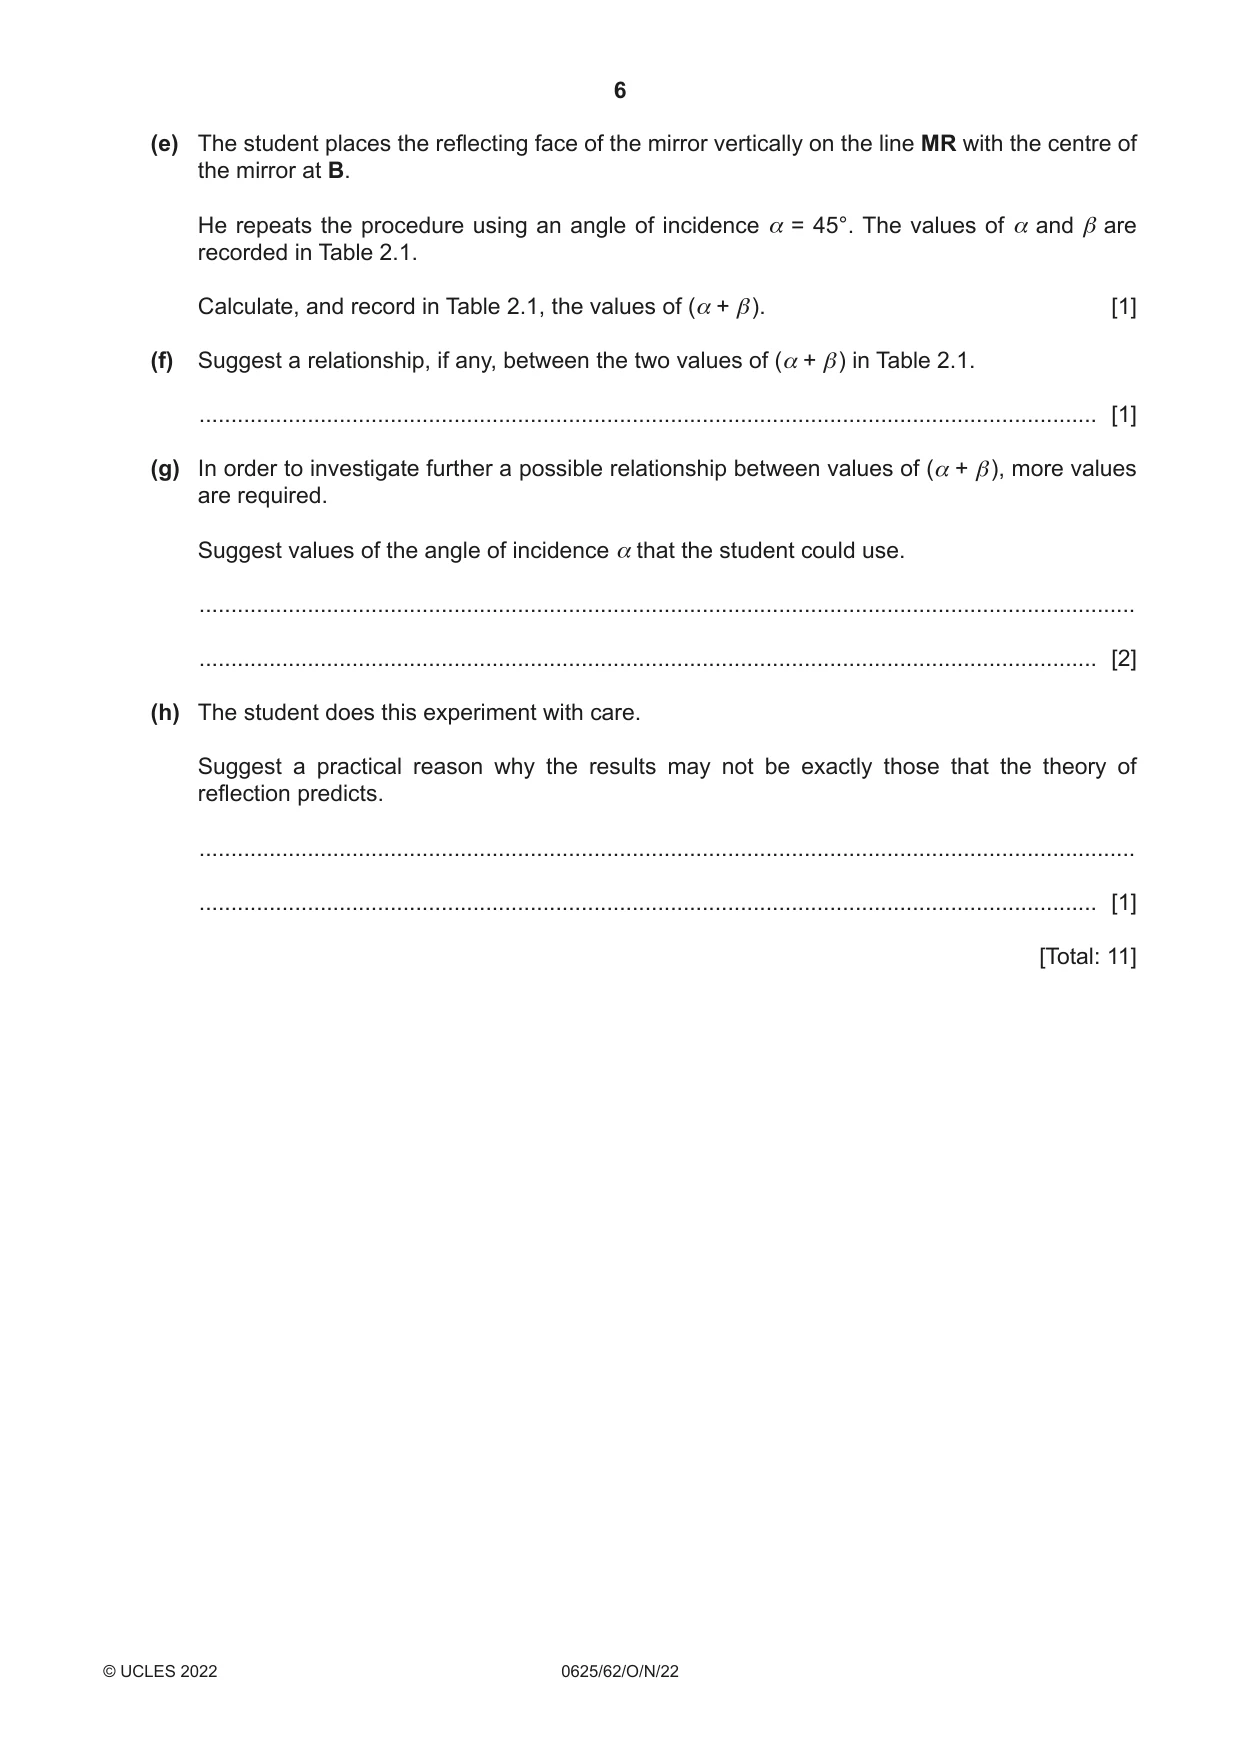
2 A student investigates the position of the image in a plane mirror. Fig. 2.1 shows the ray-trace sheet. ray-trace sheet M R P3 P4 eye Fig. 2.1 (a) Line MR shows the position of the plane mirror. Draw a normal to this line that passes through its centre. Label the normal NL. Label the point at which NL crosses MR with the letter B. [1] (b) Draw a line 7.0 cm long from B at an angle of incidence α = 30° to the normal below MR and to the left of the normal. Label the end of this line A. [1] (c) • The student places the reflecting face of the mirror vertically on the line MR. • He places two pins, P1 and P2, on line AB at a suitable distance apart for this type of ray-trace experiment. (i) Suggest a suitable distance apart for pins P1 and P2 for this type of ray-trace experiment. distance = ......................................................... [1] (ii) State the reason for your suggested distance. ........................................................................................................................................... ..................................................................................................................................... [1] (d) • The student views the images of pins P1 and P2 from the direction indicated by the eye in Fig. 2.1. • He places two pins, P3 and P4, so that pins P3 and P4 and the images of P2 and P1 all appear exactly one behind the other. The positions of P3 and P4 are marked on Fig. 2.1. Draw a line through the positions of P3 and P4. Continue the line until it meets MR. (i) Measure, and record in Table 2.1, the acute angle β between the line through the positions of P3 and P4 and the line MR. [1] (ii) Add units to the column headings in Table 2.1. Table 2.1 α/ β/ (α + β) / 30 45 46 [1] (e) The student places the reflecting face of the mirror vertically on the line MR with the centre of the mirror at B. He repeats the procedure using an angle of incidence α = 45°. The values of α and β are recorded in Table 2.1. Calculate, and record in Table 2.1, the values of (α + β). [1] (f) Suggest a relationship, if any, between the two values of (α + β) in Table 2.1. ............................................................................................................................................. [1] (g) In order to investigate further a possible relationship between values of (α + β), more values are required. Suggest values of the angle of incidence α that the student could use. ................................................................................................................................................... ............................................................................................................................................. [2] (h) The student does this experiment with care. Suggest a practical reason why the results may not be exactly those that the theory of reflection predicts. ................................................................................................................................................... ............................................................................................................................................. [1] [Total: 11]
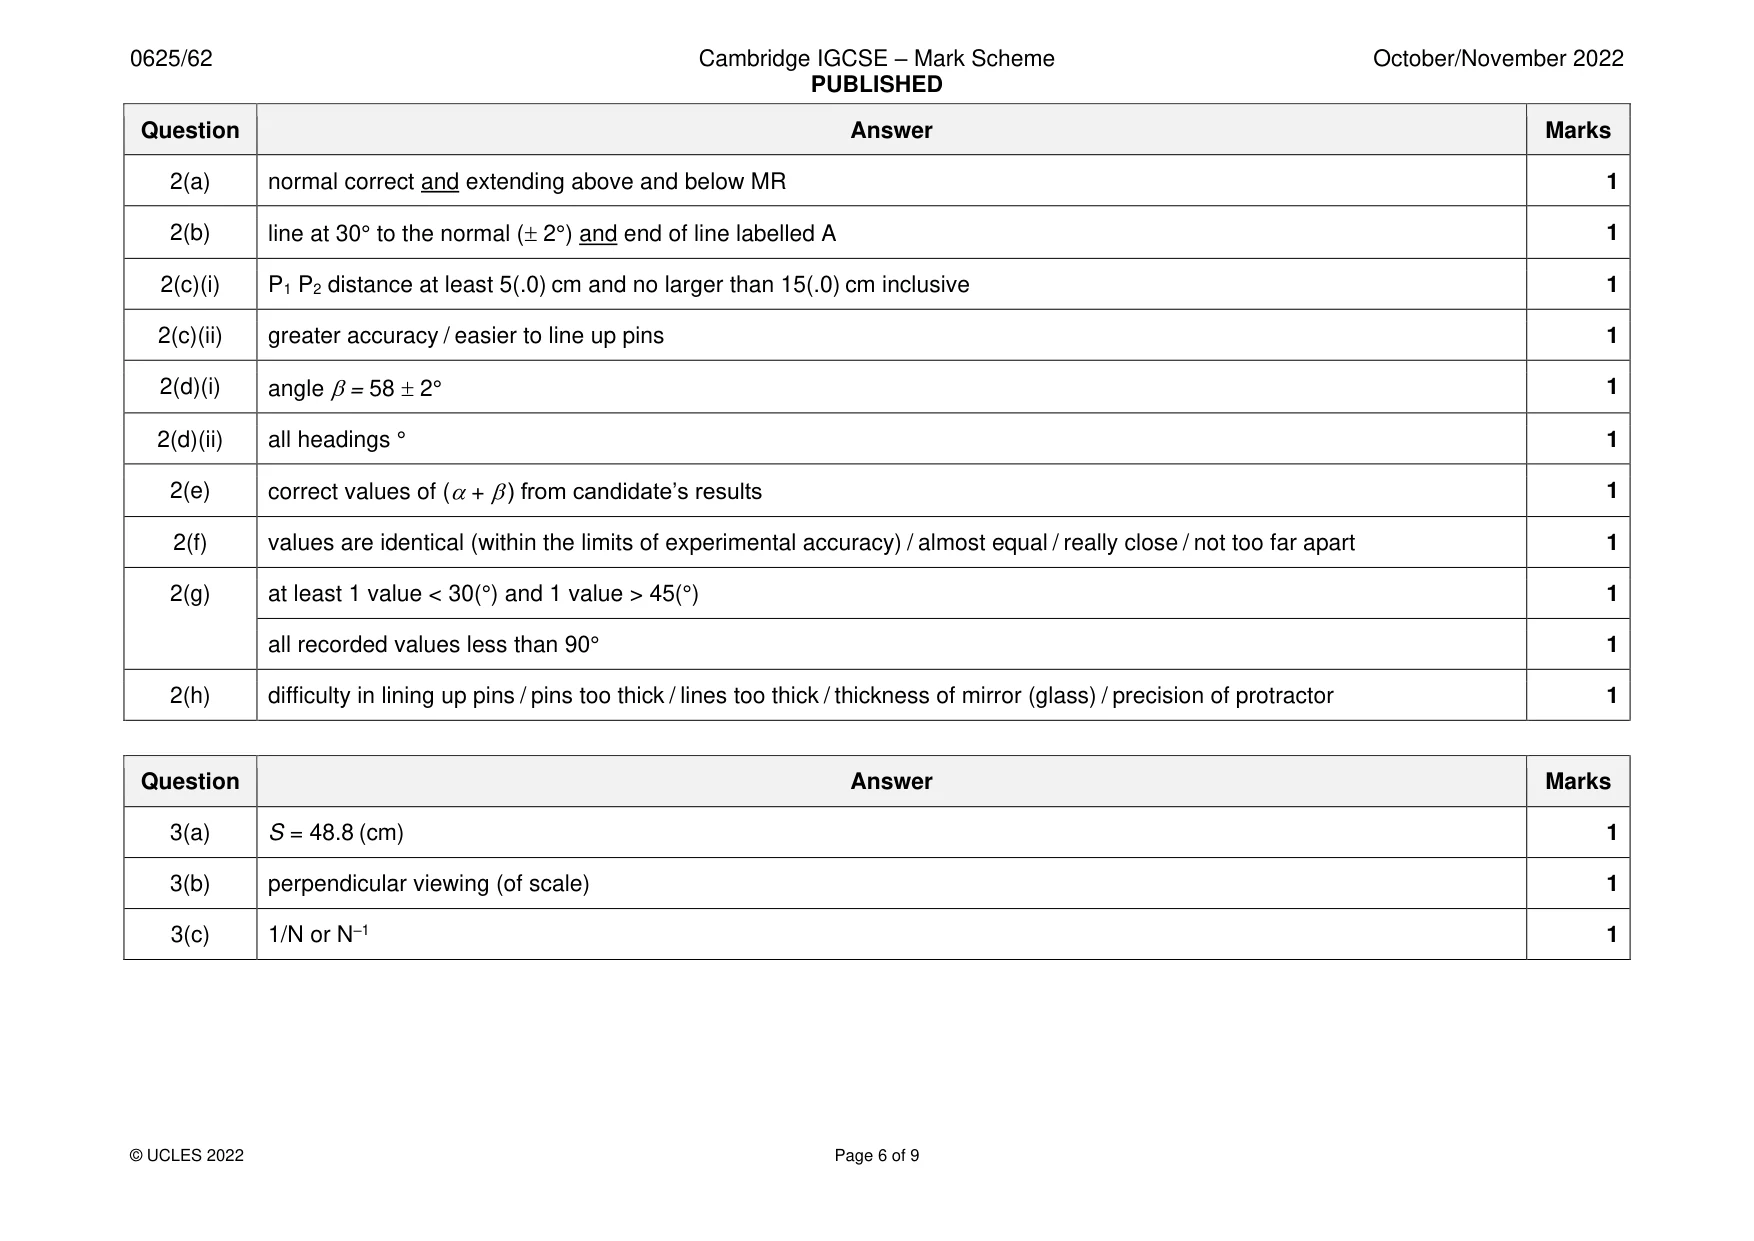
Mark scheme: 2(a) normal correct and extending above and below MR 1 2(b) line at 30° to the normal ( 2°) and end of line labelled A 1 2(c)(i) P1 P2 distance at least 5(.0) cm and no larger than 15(.0) cm inclusive 1 2(c)(ii) greater accuracy / easier to line up pins 1 2(d)(i) angle = 58 2° 1 2(d)(ii) all headings ° 1 2(e) correct values of (+ ) from candidate’s results 1 2(f) values are identical (within the limits of experimental accuracy) / almost equal / really close / not too far apart 1 2(g) at least 1 value < 30(°) and 1 value > 45(°) 1 all recorded values less than 90° 1 2(h) difficulty in lining up pins / pins too thick / lines too thick / thickness of mirror (glass) / precision of protractor 1
Q3 · A student investigates the balancing of a metre rule
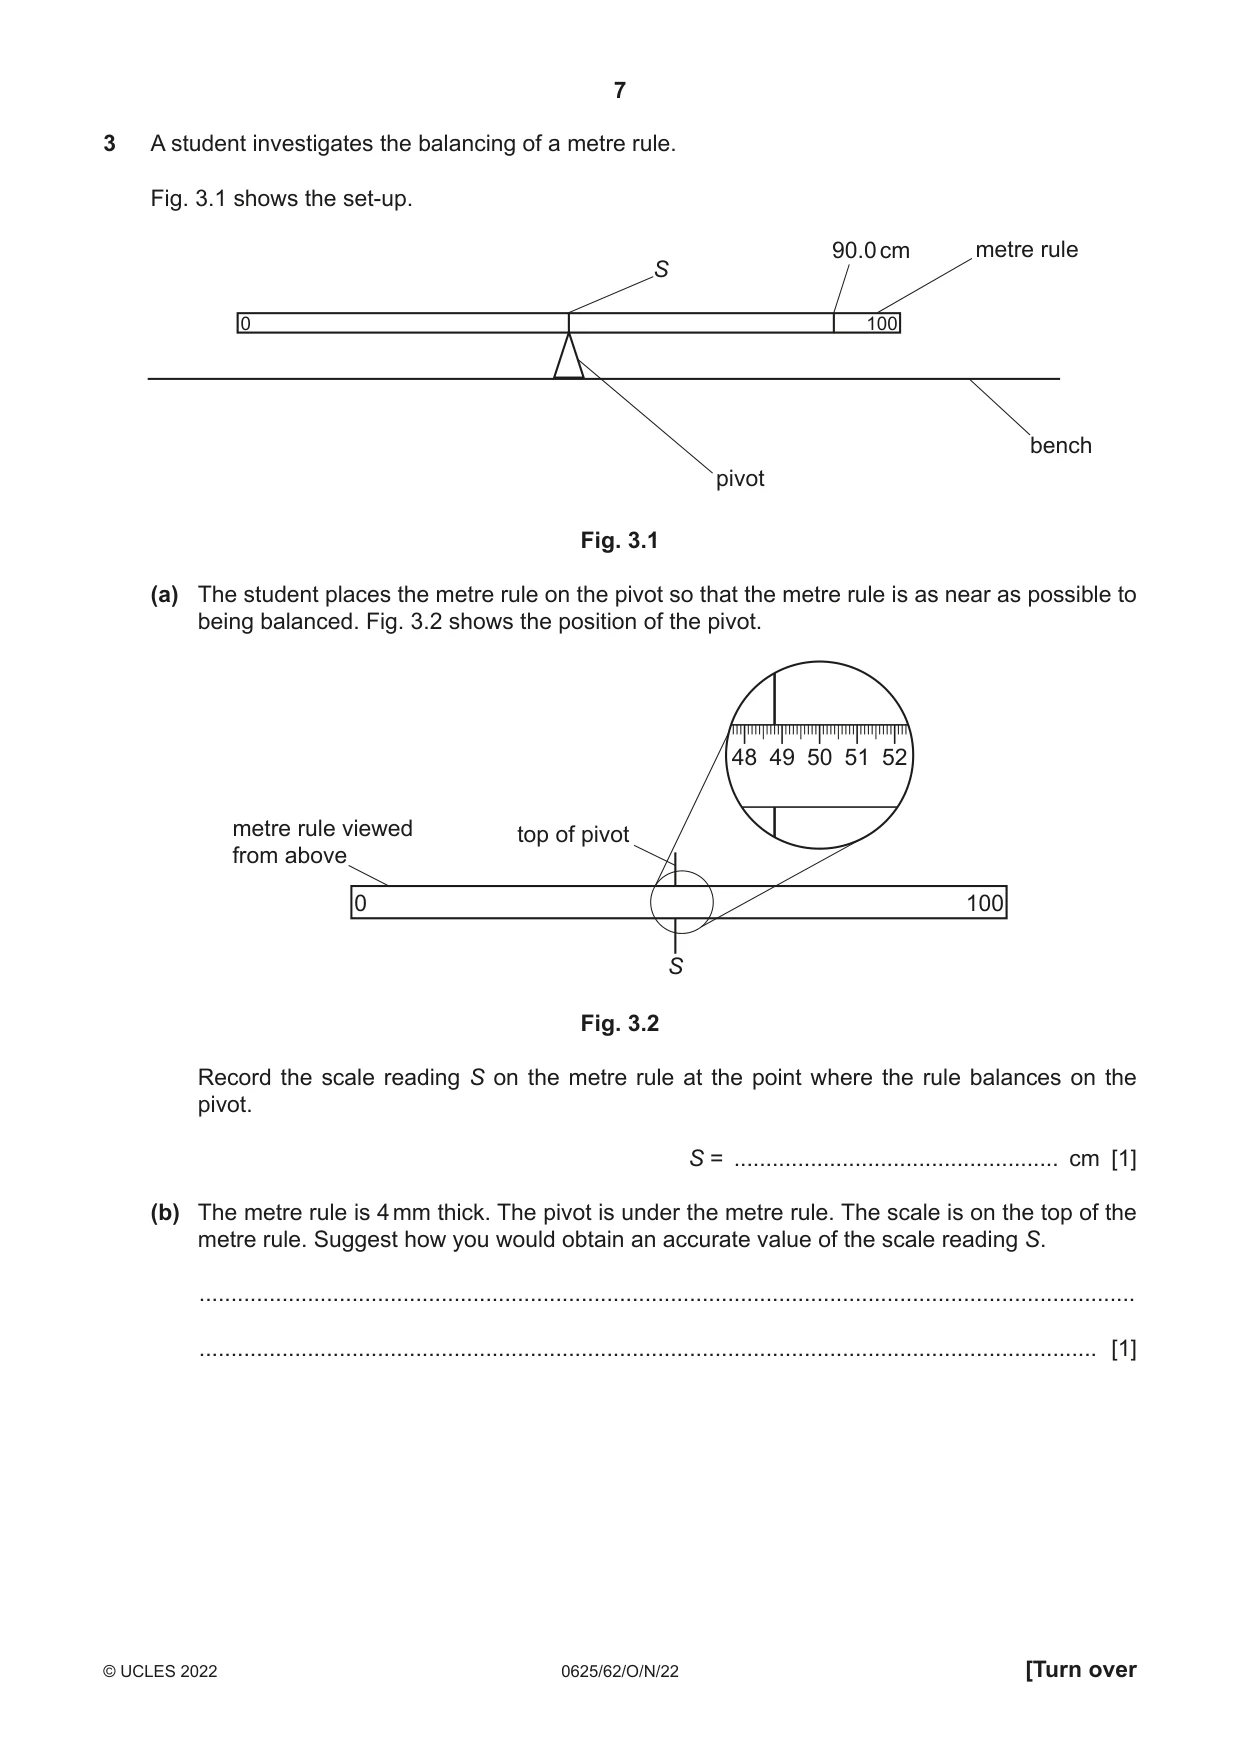
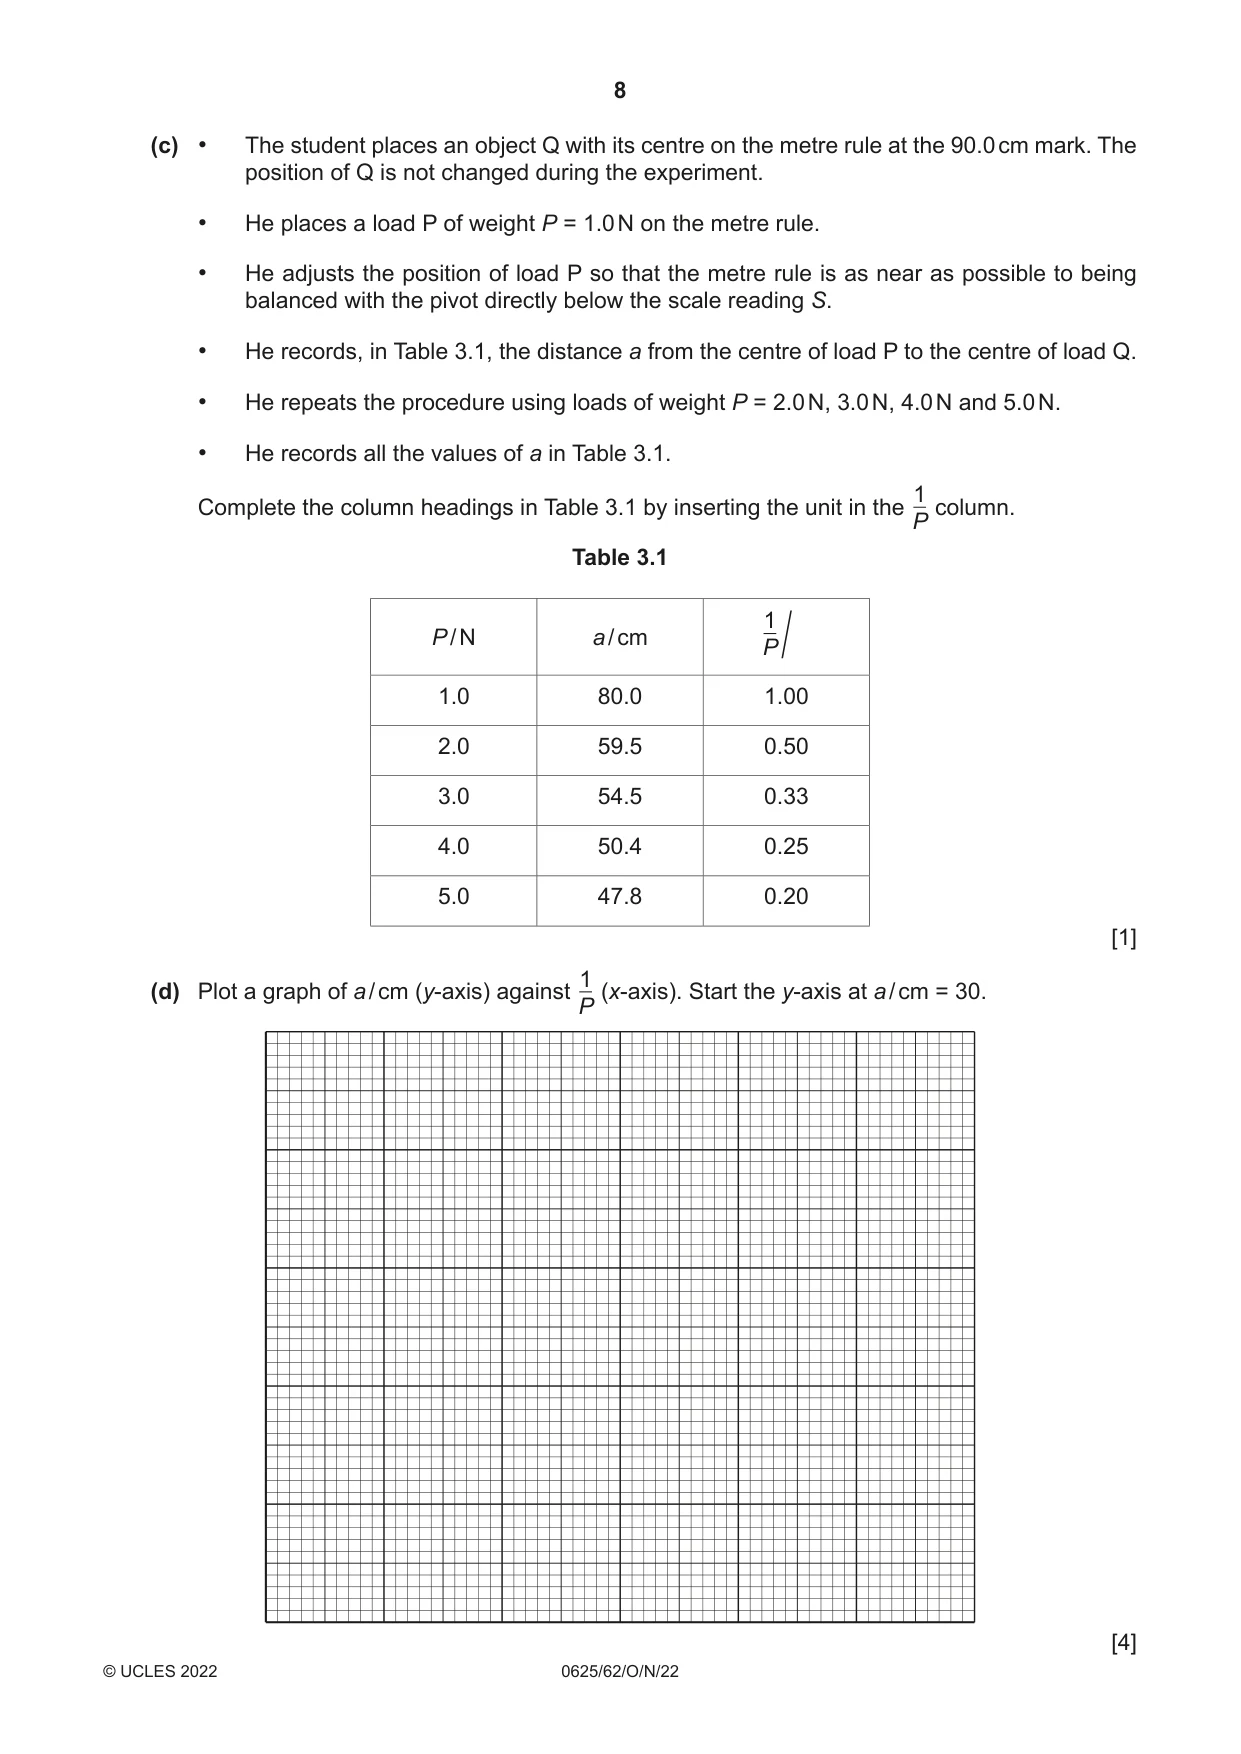
3 A student investigates the balancing of a metre rule. Fig. 3.1 shows the set-up. 90.0 cm metre rule S 0 100 bench pivot Fig. 3.1 (a) The student places the metre rule on the pivot so that the metre rule is as near as possible to being balanced. Fig. 3.2 shows the position of the pivot. 48 49 50 51 52 metre rule viewed top of pivot from above 0 100 S Fig. 3.2 Record the scale reading S on the metre rule at the point where the rule balances on the pivot. S = ................................................... cm [1] (b) The metre rule is 4 mm thick. The pivot is under the metre rule. The scale is on the top of the metre rule. Suggest how you would obtain an accurate value of the scale reading S. ................................................................................................................................................... ............................................................................................................................................. [1] (c) • The student places an object Q with its centre on the metre rule at the 90.0 cm mark. The position of Q is not changed during the experiment. • He places a load P of weight P = 1.0 N on the metre rule. • He adjusts the position of load P so that the metre rule is as near as possible to being balanced with the pivot directly below the scale reading S. • He records, in Table 3.1, the distance a from the centre of load P to the centre of load Q. • He repeats the procedure using loads of weight P = 2.0 N, 3.0 N, 4.0 N and 5.0 N. • He records all the values of a in Table 3.1. 1 Complete the column headings in Table 3.1 by inserting the unit in the column. P Table 3.1 1 P / N a / cm P / 1.0 80.0 1.00 2.0 59.5 0.50 3.0 54.5 0.33 4.0 50.4 0.25 5.0 47.8 0.20 [1] 1(d) Plot a graph of a / cm (y-axis) against (x-axis). Start the y-axis at a / cm = 30. P [4] (e) Determine the gradient G of the graph. Show clearly on the graph how you obtained the necessary information. G = ......................................................... [3] (f) The gradient G is numerically equal to the distance d between the pivot and the centre of load Q. Record the value of d to a suitable number of significant figures for this experiment. d = ................................................... cm [1] [Total: 11]
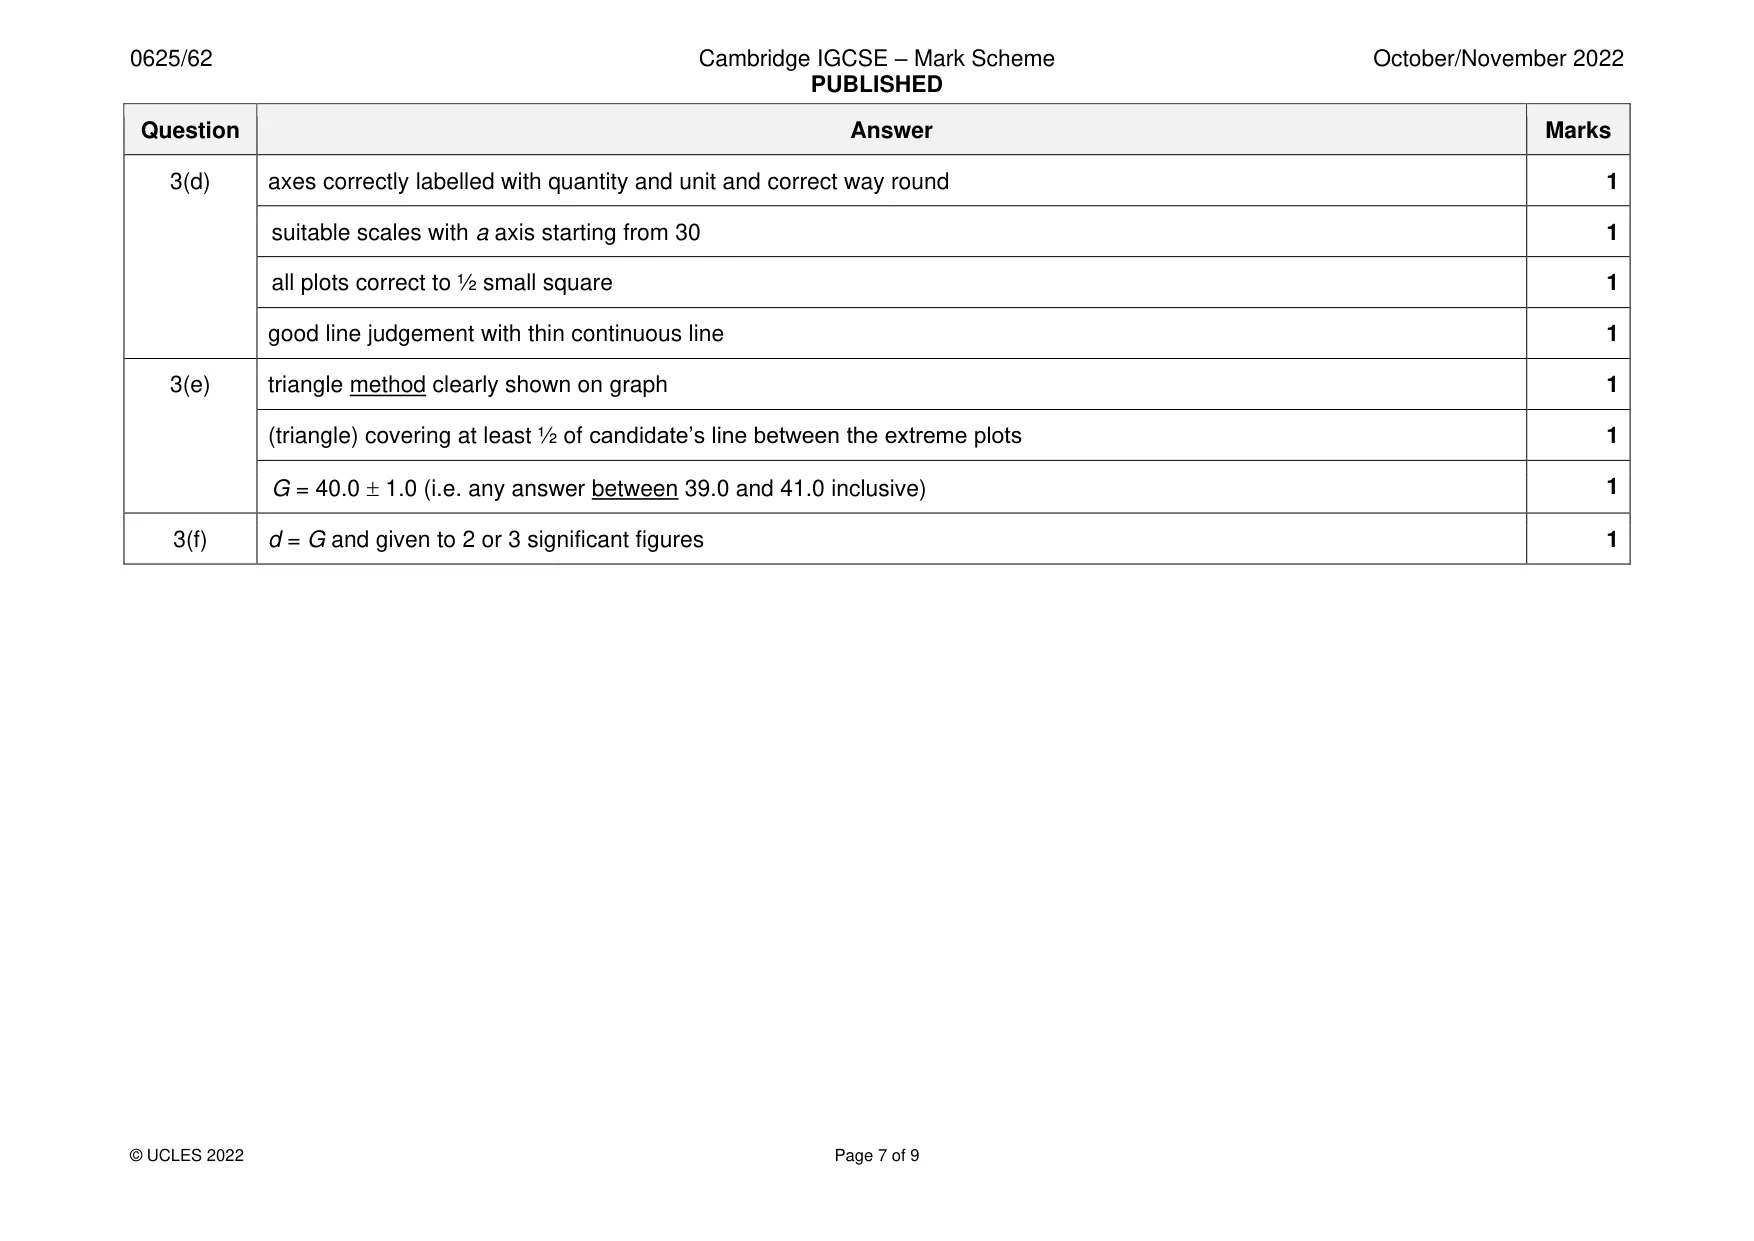
Mark scheme: 3(a) S = 48.8 (cm) 1 3(b) perpendicular viewing (of scale) 1 3(c) 1/N or N–1 1 3(d) axes correctly labelled with quantity and unit and correct way round 1 suitable scales with a axis starting from 30 1 all plots correct to ½ small square 1 good line judgement with thin continuous line 1 3(e) triangle method clearly shown on graph 1 (triangle) covering at least ½ of candidate’s line between the extreme plots 1 G = 40.0 1.0 (i.e. any answer between 39.0 and 41.0 inclusive) 1 3(f) d = G and given to 2 or 3 significant figures 1
More questions on Physical quantities and measurement techniques
Q4 · A student investigates the effect on the resistance of a wire when the tension in the…
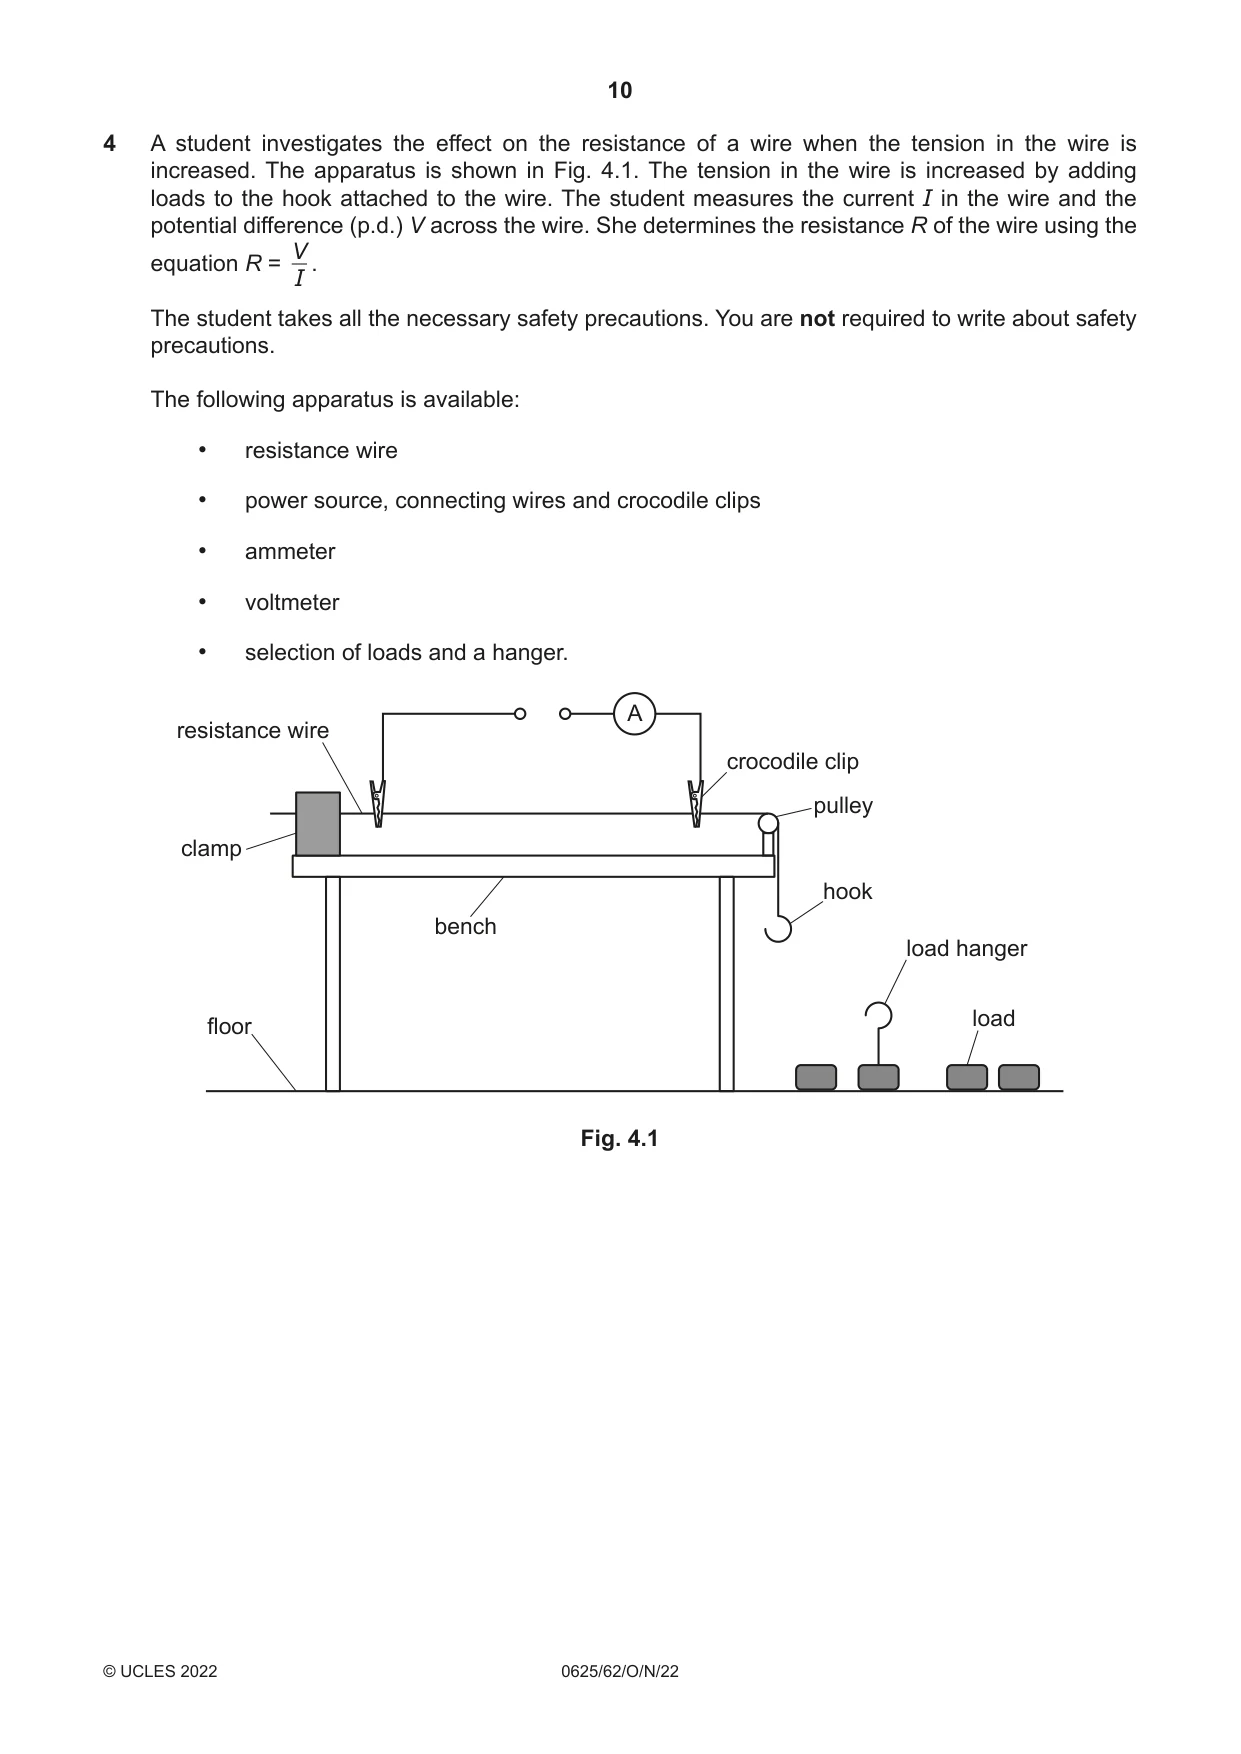
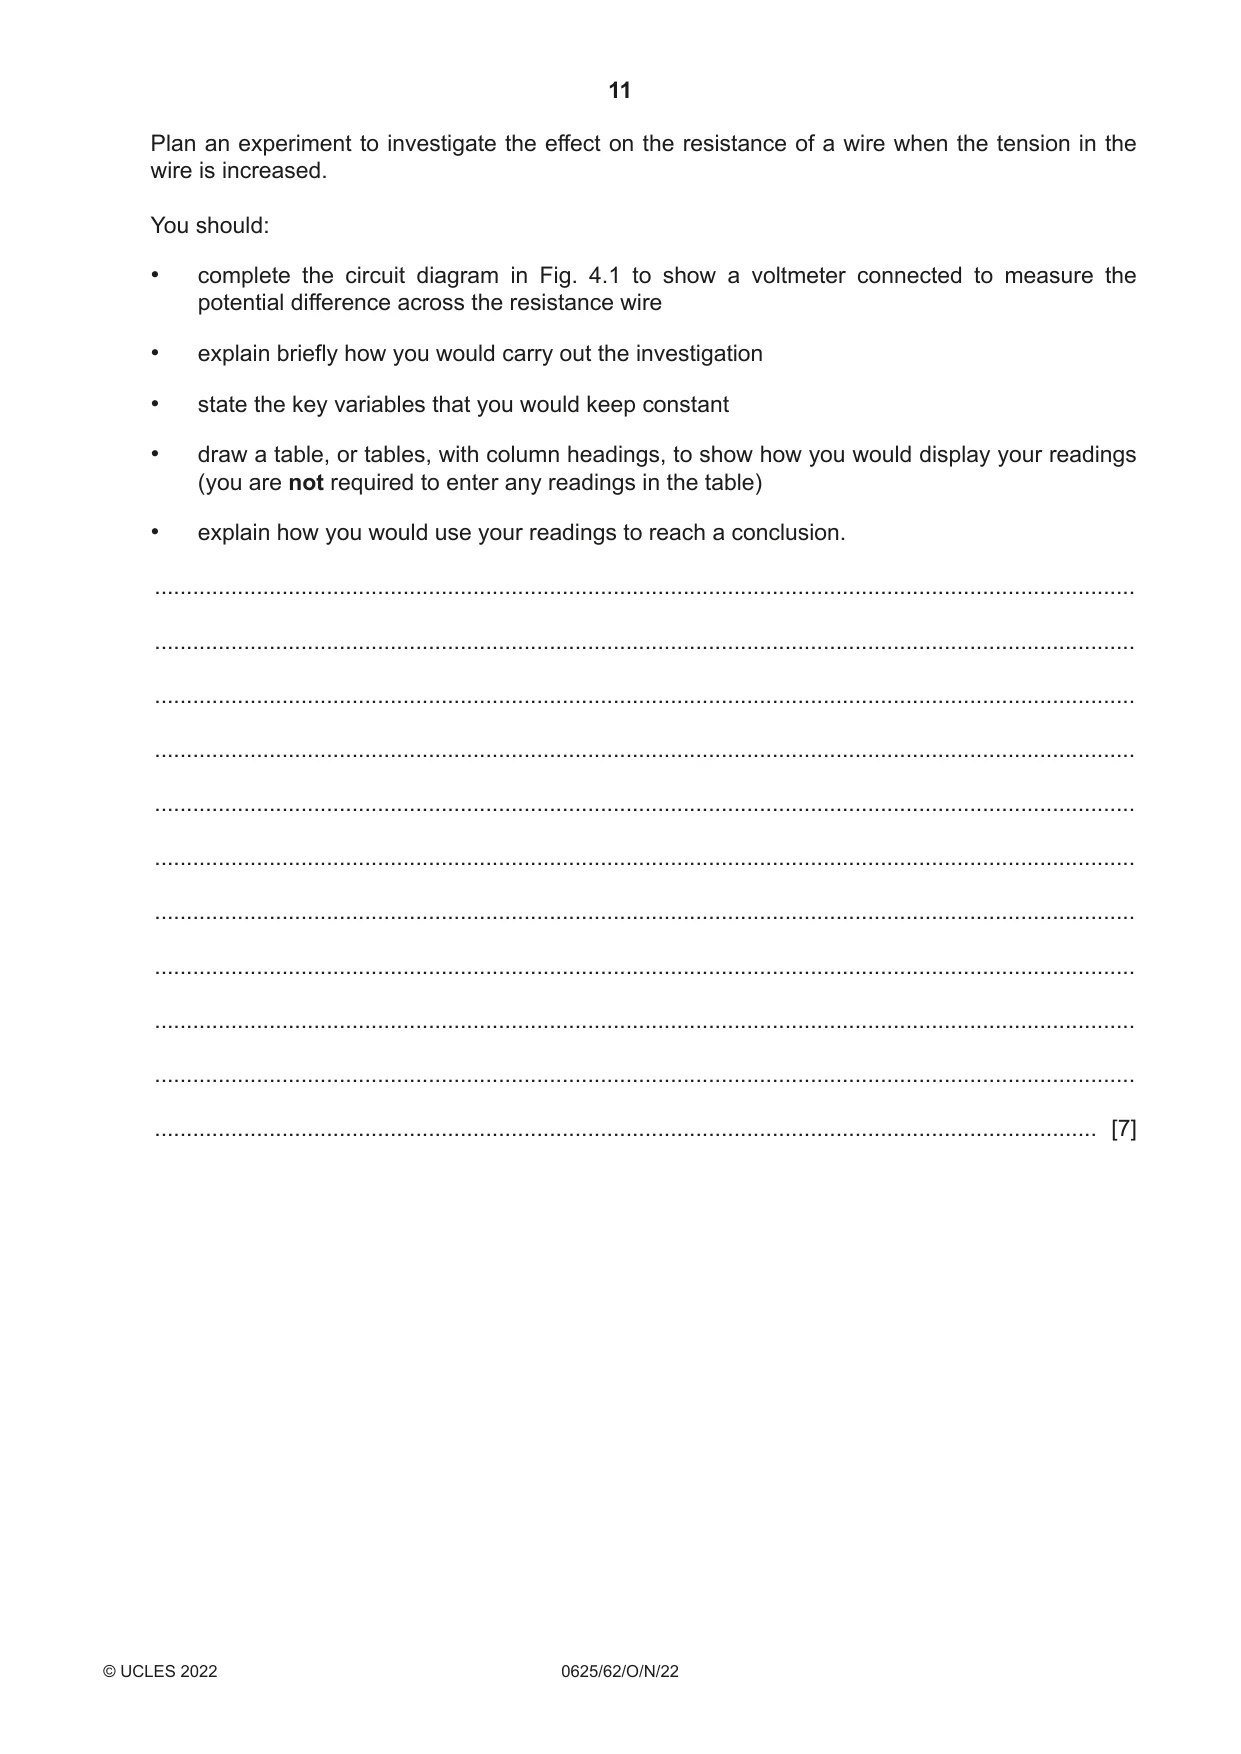
4 A student investigates the effect on the resistance of a wire when the tension in the wire is increased. The apparatus is shown in Fig. 4.1. The tension in the wire is increased by adding loads to the hook attached to the wire. The student measures the current I in the wire and the potential difference (p.d.) V across the wire. She determines the resistance R of the wire using the V equation R = . I The student takes all the necessary safety precautions. You are not required to write about safety precautions. The following apparatus is available: • resistance wire • power source, connecting wires and crocodile clips • ammeter • voltmeter • selection of loads and a hanger. A resistance wire crocodile clip pulley clamp hook bench load hanger load floor Fig. 4.1 Plan an experiment to investigate the effect on the resistance of a wire when the tension in the wire is increased. You should: • complete the circuit diagram in Fig. 4.1 to show a voltmeter connected to measure the potential difference across the resistance wire • explain briefly how you would carry out the investigation • state the key variables that you would keep constant • draw a table, or tables, with column headings, to show how you would display your readings (you are not required to enter any readings in the table) • explain how you would use your readings to reach a conclusion. .......................................................................................................................................................... .......................................................................................................................................................... .......................................................................................................................................................... .......................................................................................................................................................... .......................................................................................................................................................... .......................................................................................................................................................... .......................................................................................................................................................... .......................................................................................................................................................... .......................................................................................................................................................... .......................................................................................................................................................... .................................................................................................................................................... [7]
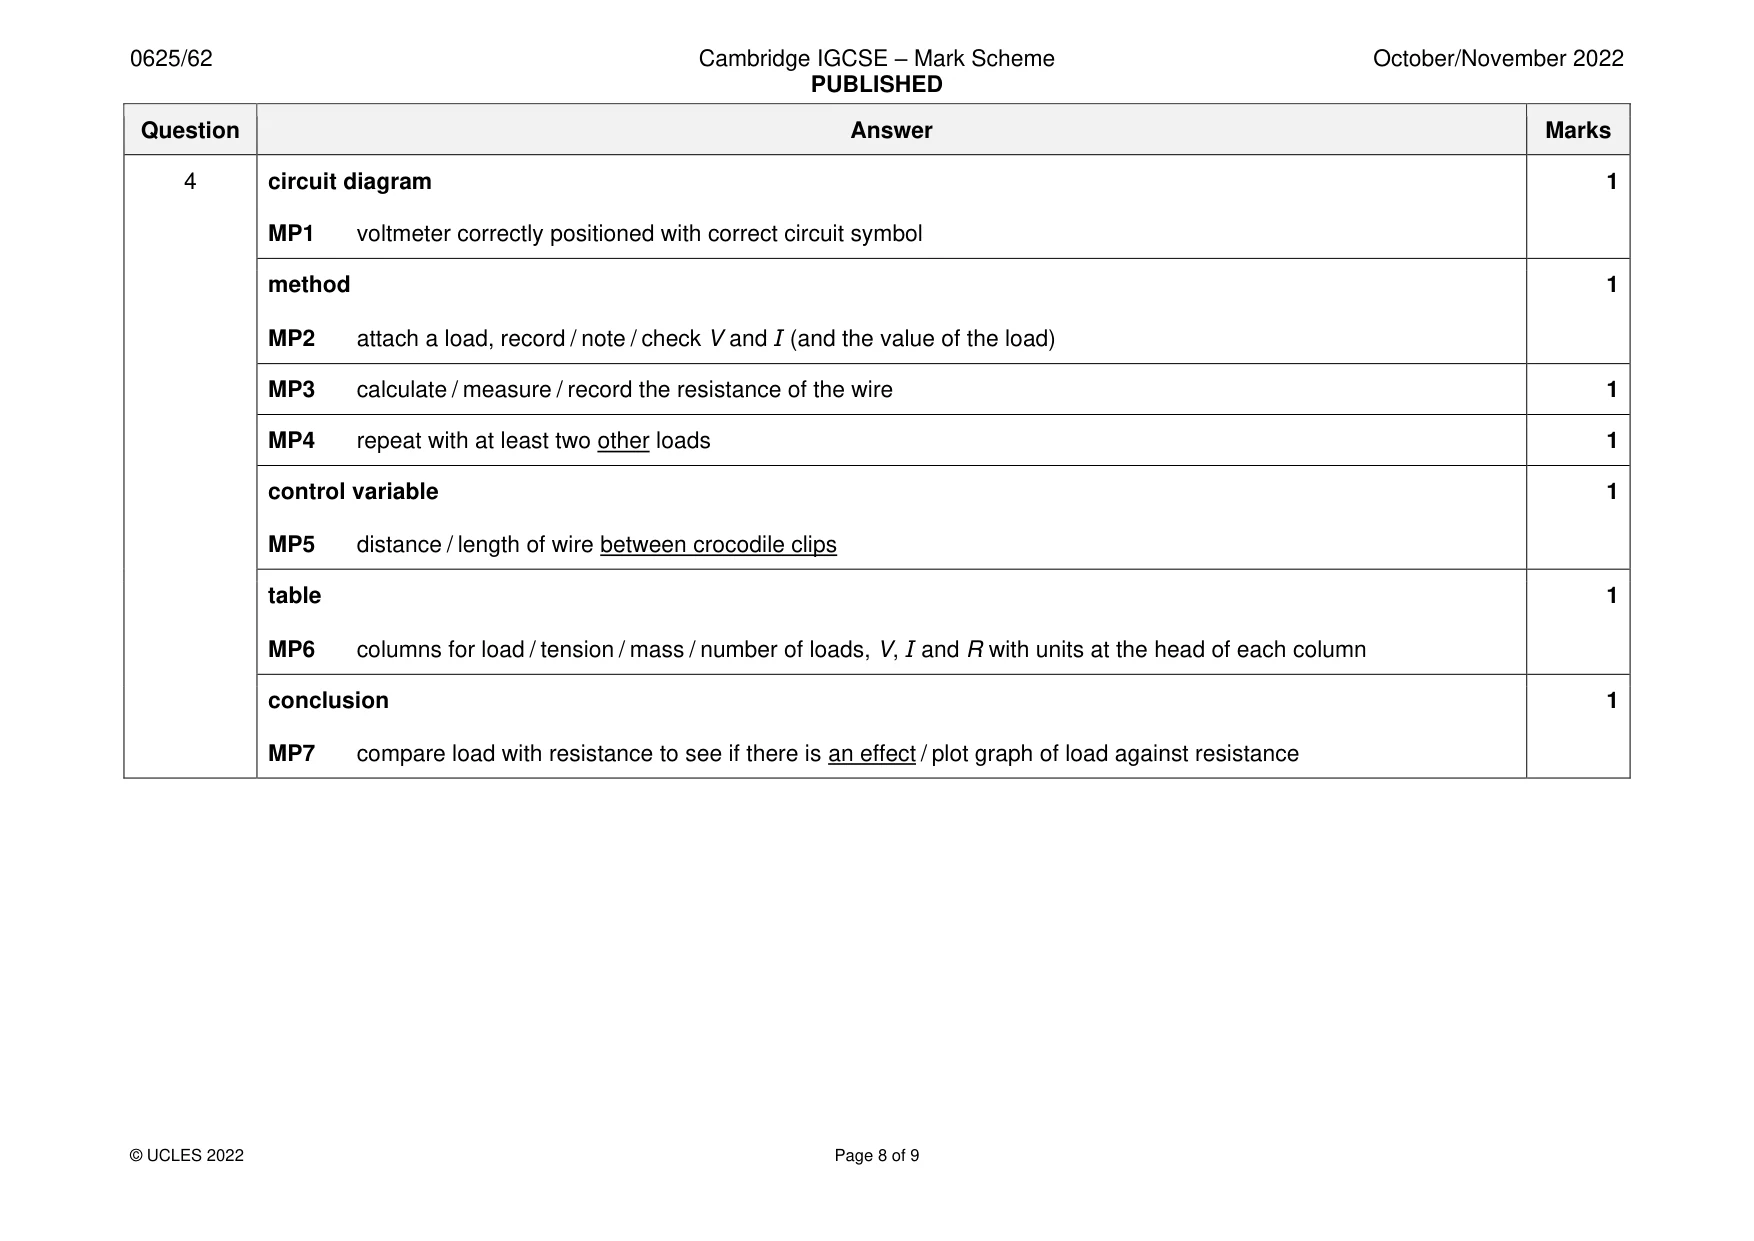
Mark scheme: 4 circuit diagram 1 MP1 voltmeter correctly positioned with correct circuit symbol method 1 MP2 attach a load, record / note / check V and I (and the value of the load) MP3 calculate / measure / record the resistance of the wire 1 MP4 repeat with at least two other loads 1 control variable 1 MP5 distance / length of wire between crocodile clips table 1 MP6 columns for load / tension / mass / number of loads, V, I and R with units at the head of each column conclusion 1 MP7 compare load with resistance to see if there is an effect / plot graph of load against resistance Additional graph notes: NOTE: The principle to apply here is ‘could I draw a significantly better line, using these points, under examination conditions?’ If the answer is definitely ‘yes’, do not award the mark. NOTE: – If candidate’s scale consists of actual readings at equal intervals this will produce a perfect straight line. The only mark available in this case is the first (axes right way round and labelled) So maximum 1. – If axes are wrong way round, the other 3 marks are still available.
What was in this paper
The subtopics covered by these 4 questions, and how many questions each got. Open one in a new tab to see every Cambridge question on it.
What you needed in this session
Cambridge’s own grade thresholds for 2022 Oct/Nov, Paper 6 · Variant 2. A higher threshold means an easier paper — the bar moves with how the cohort did.