Cambridge IGCSE Physics 0625 — 2022 Feb/March Paper 6 · Variant 2
0625/62/F/M/22 · 4 questions · 40 marks · ≈45 min
The question paper and its mark scheme, free to read here and free to download. This is Cambridge’s own paper, exactly as it was sat.
Question paper16 pages



Mark scheme8 pages
Answers below. Sit the paper first if you are practising.
Questions as text
Q1 · A student investigates the extension of a spring and uses it to determine the weight of a…
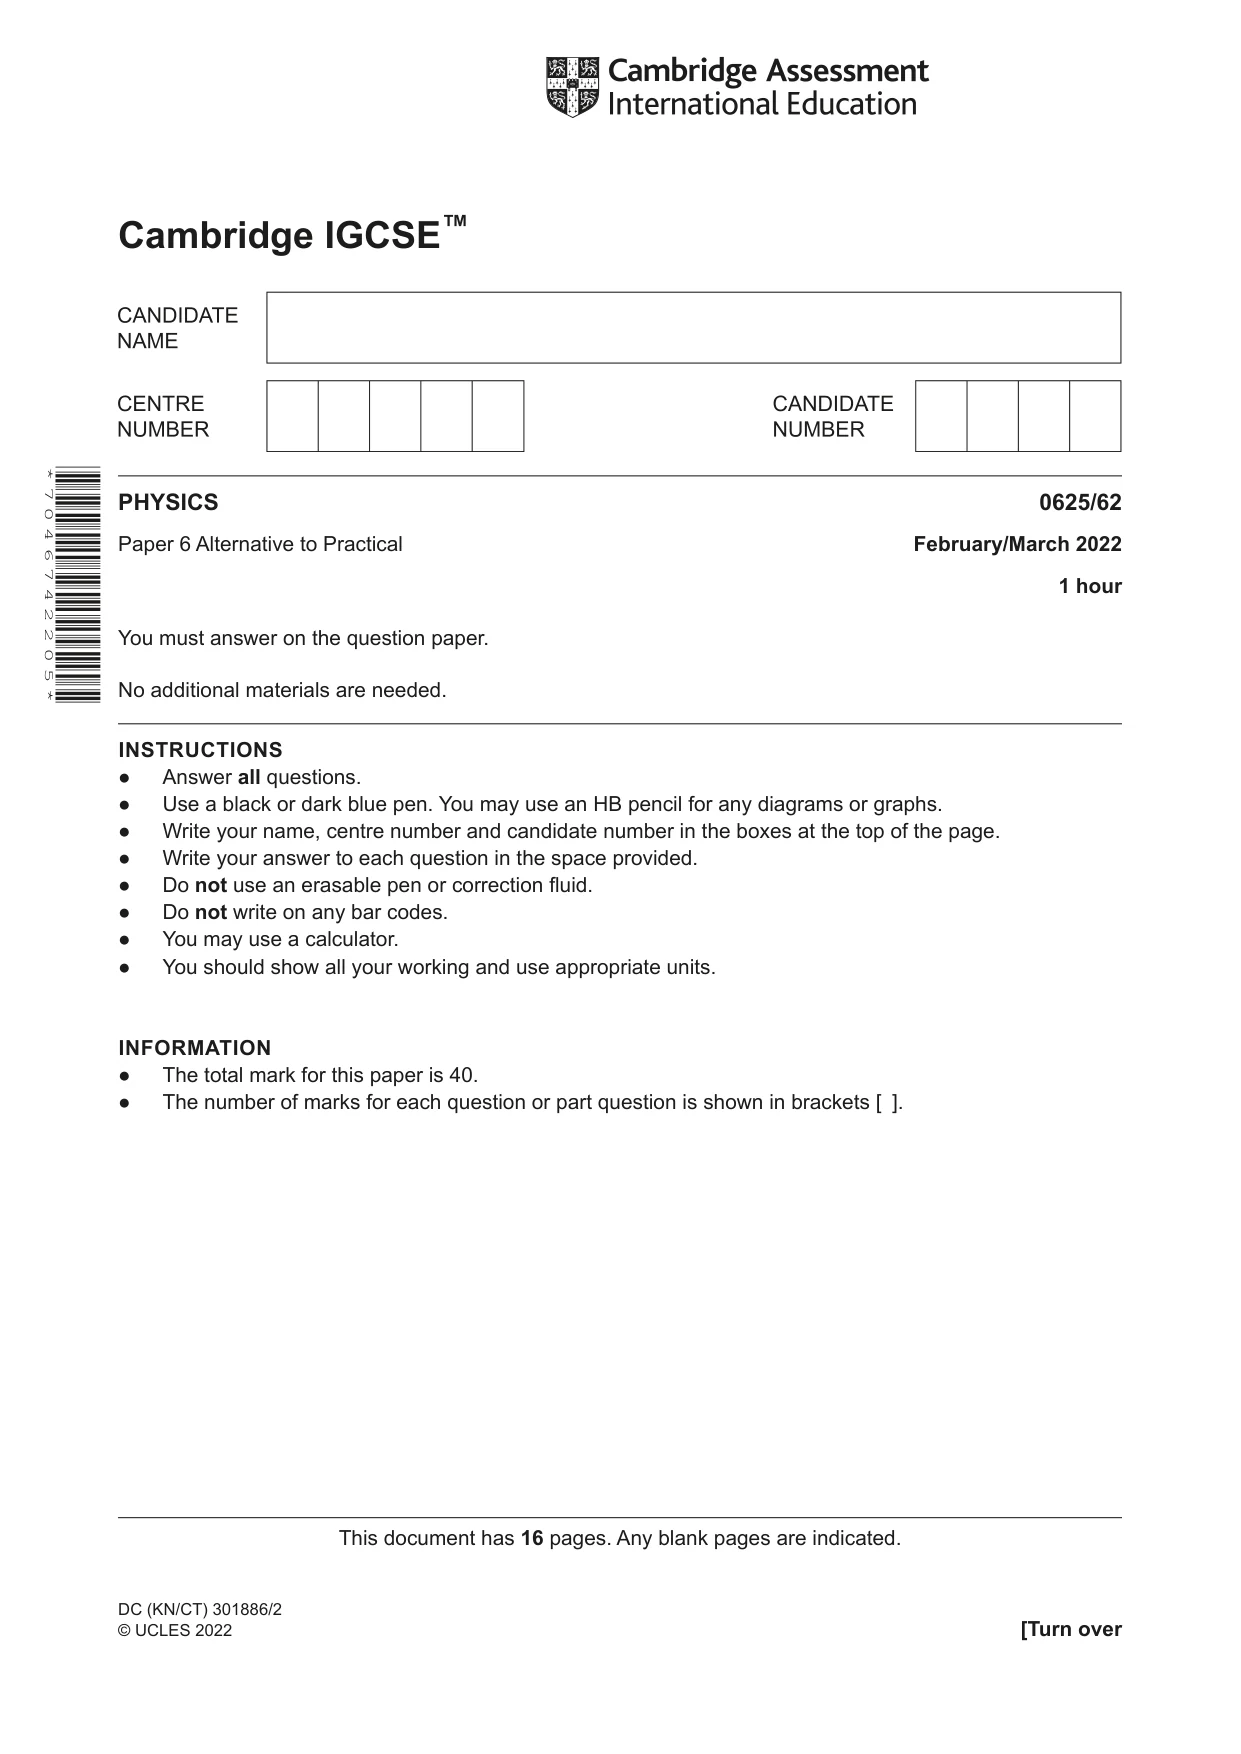
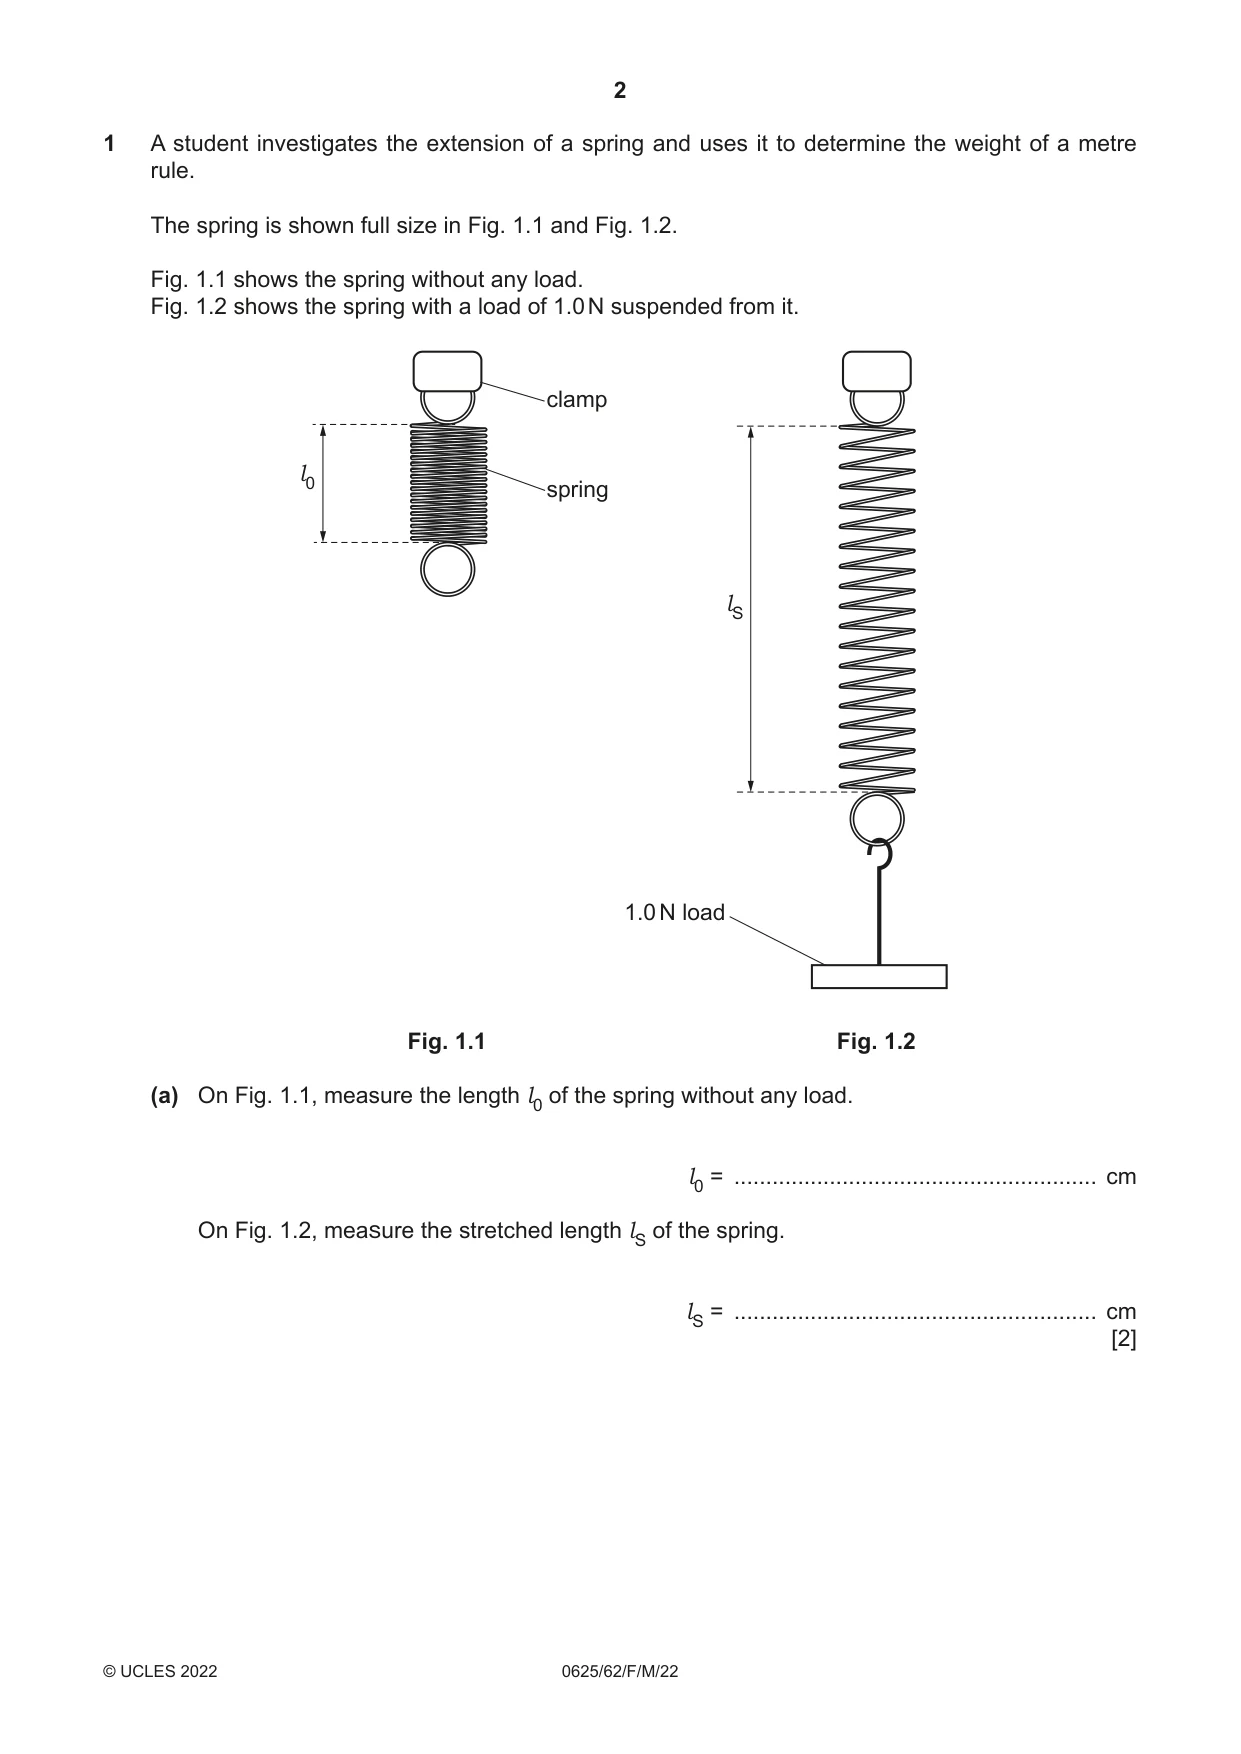
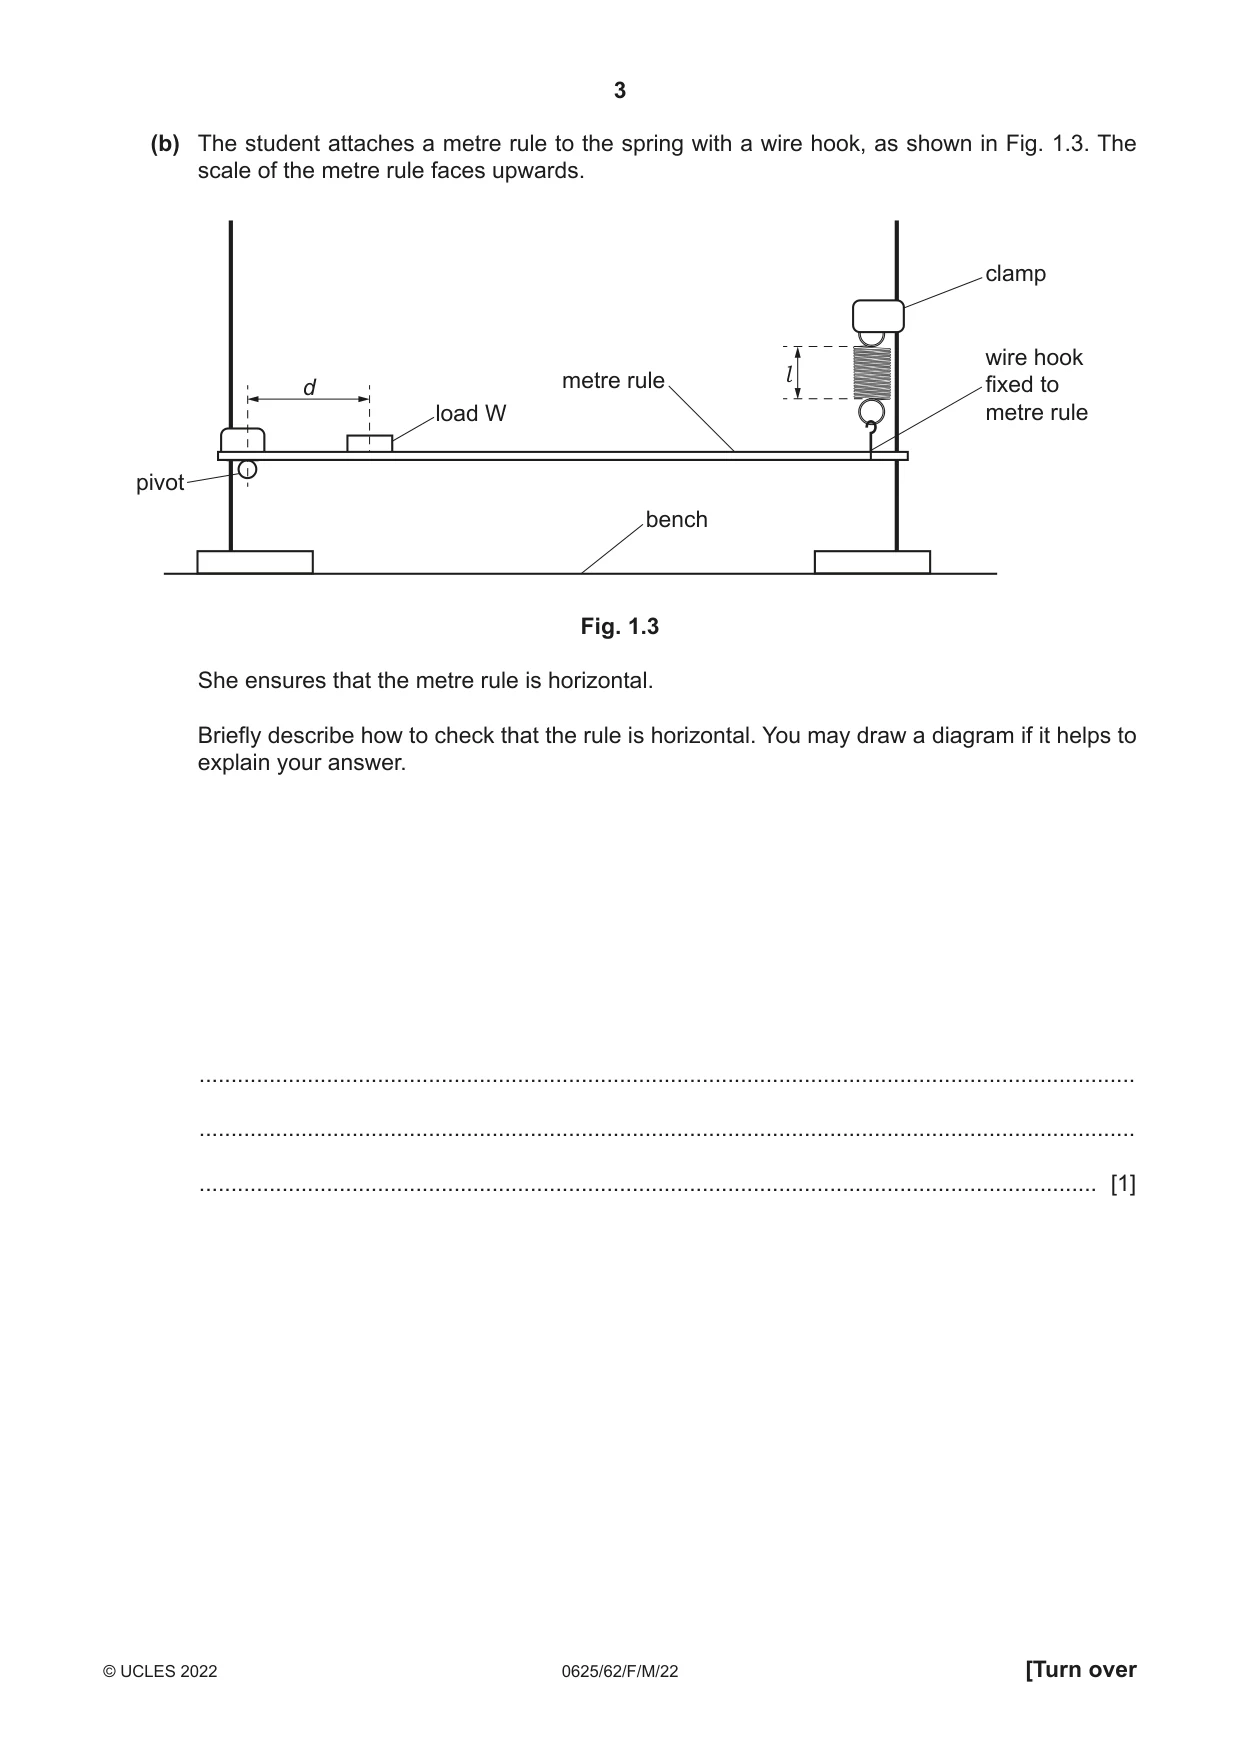
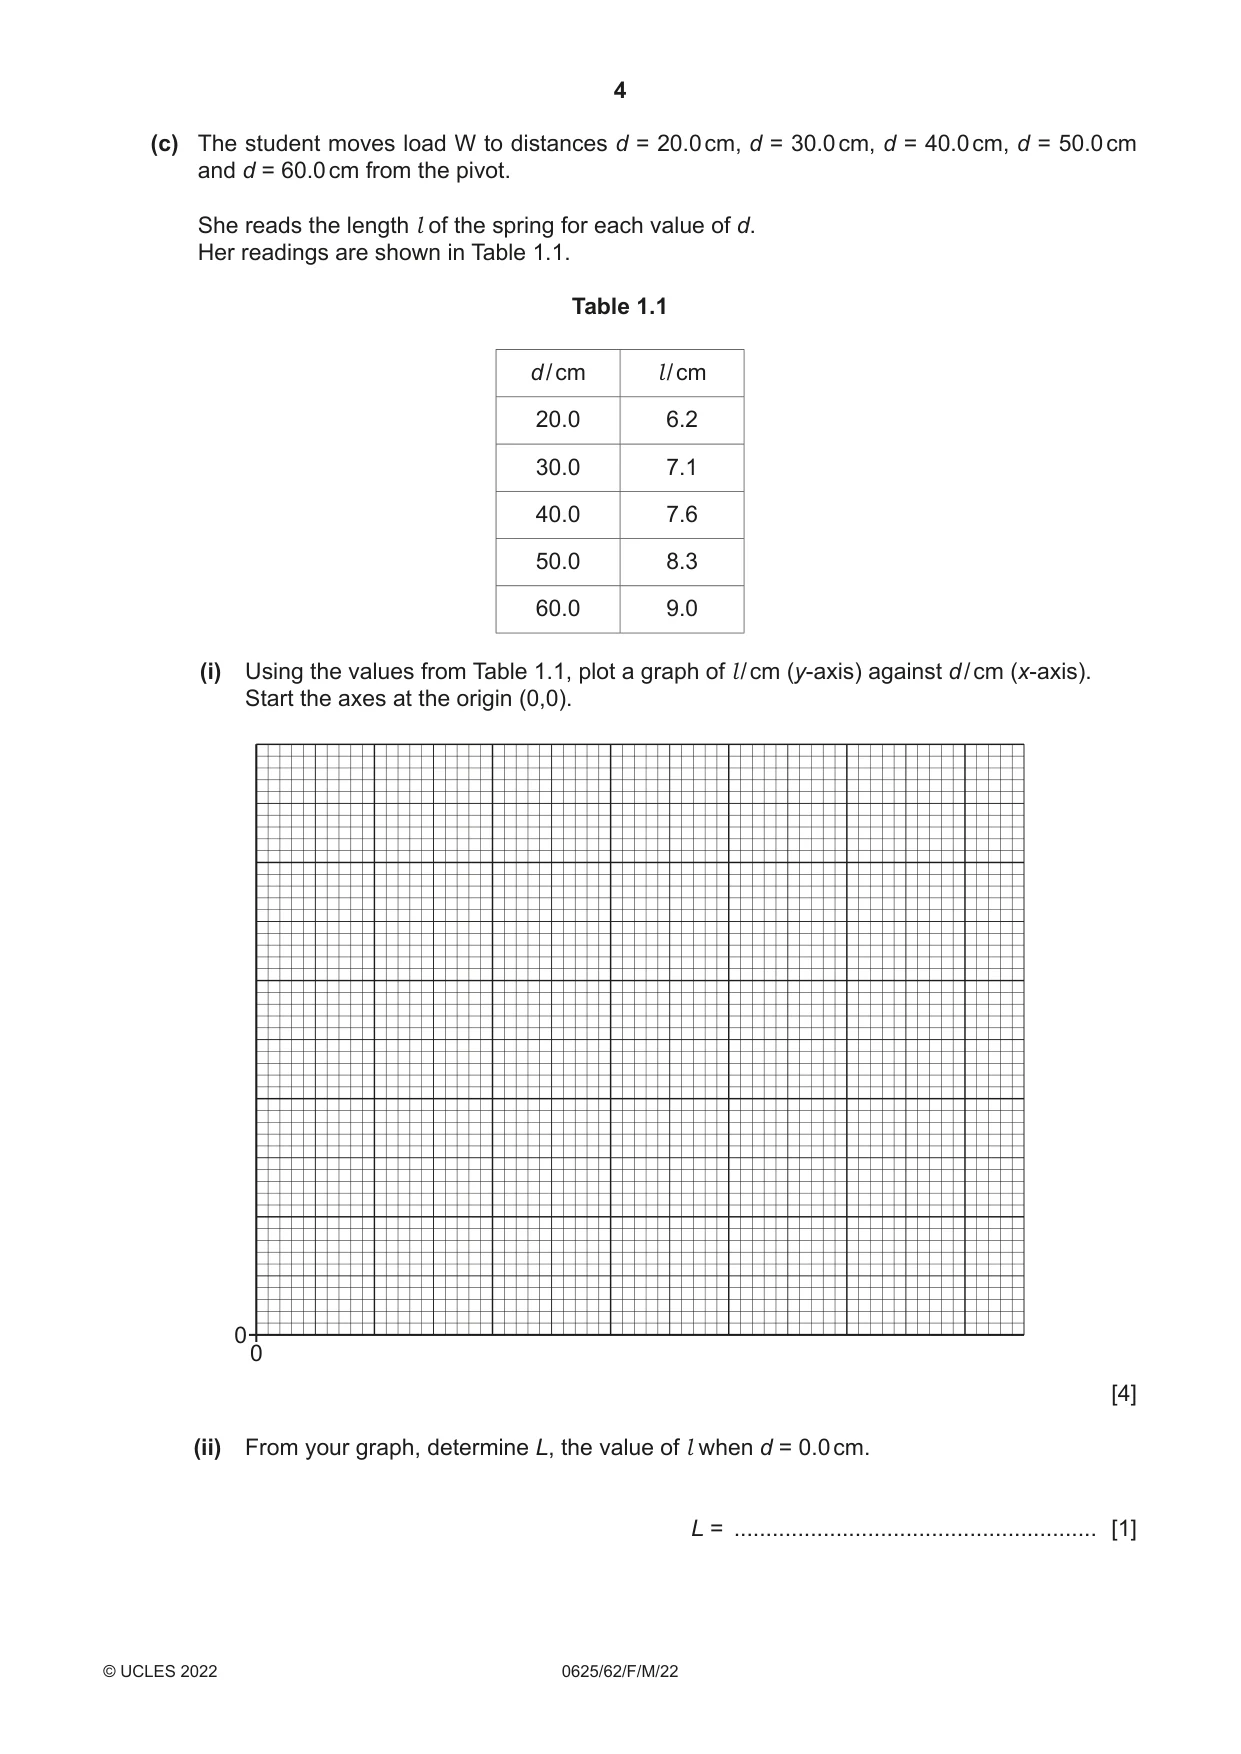
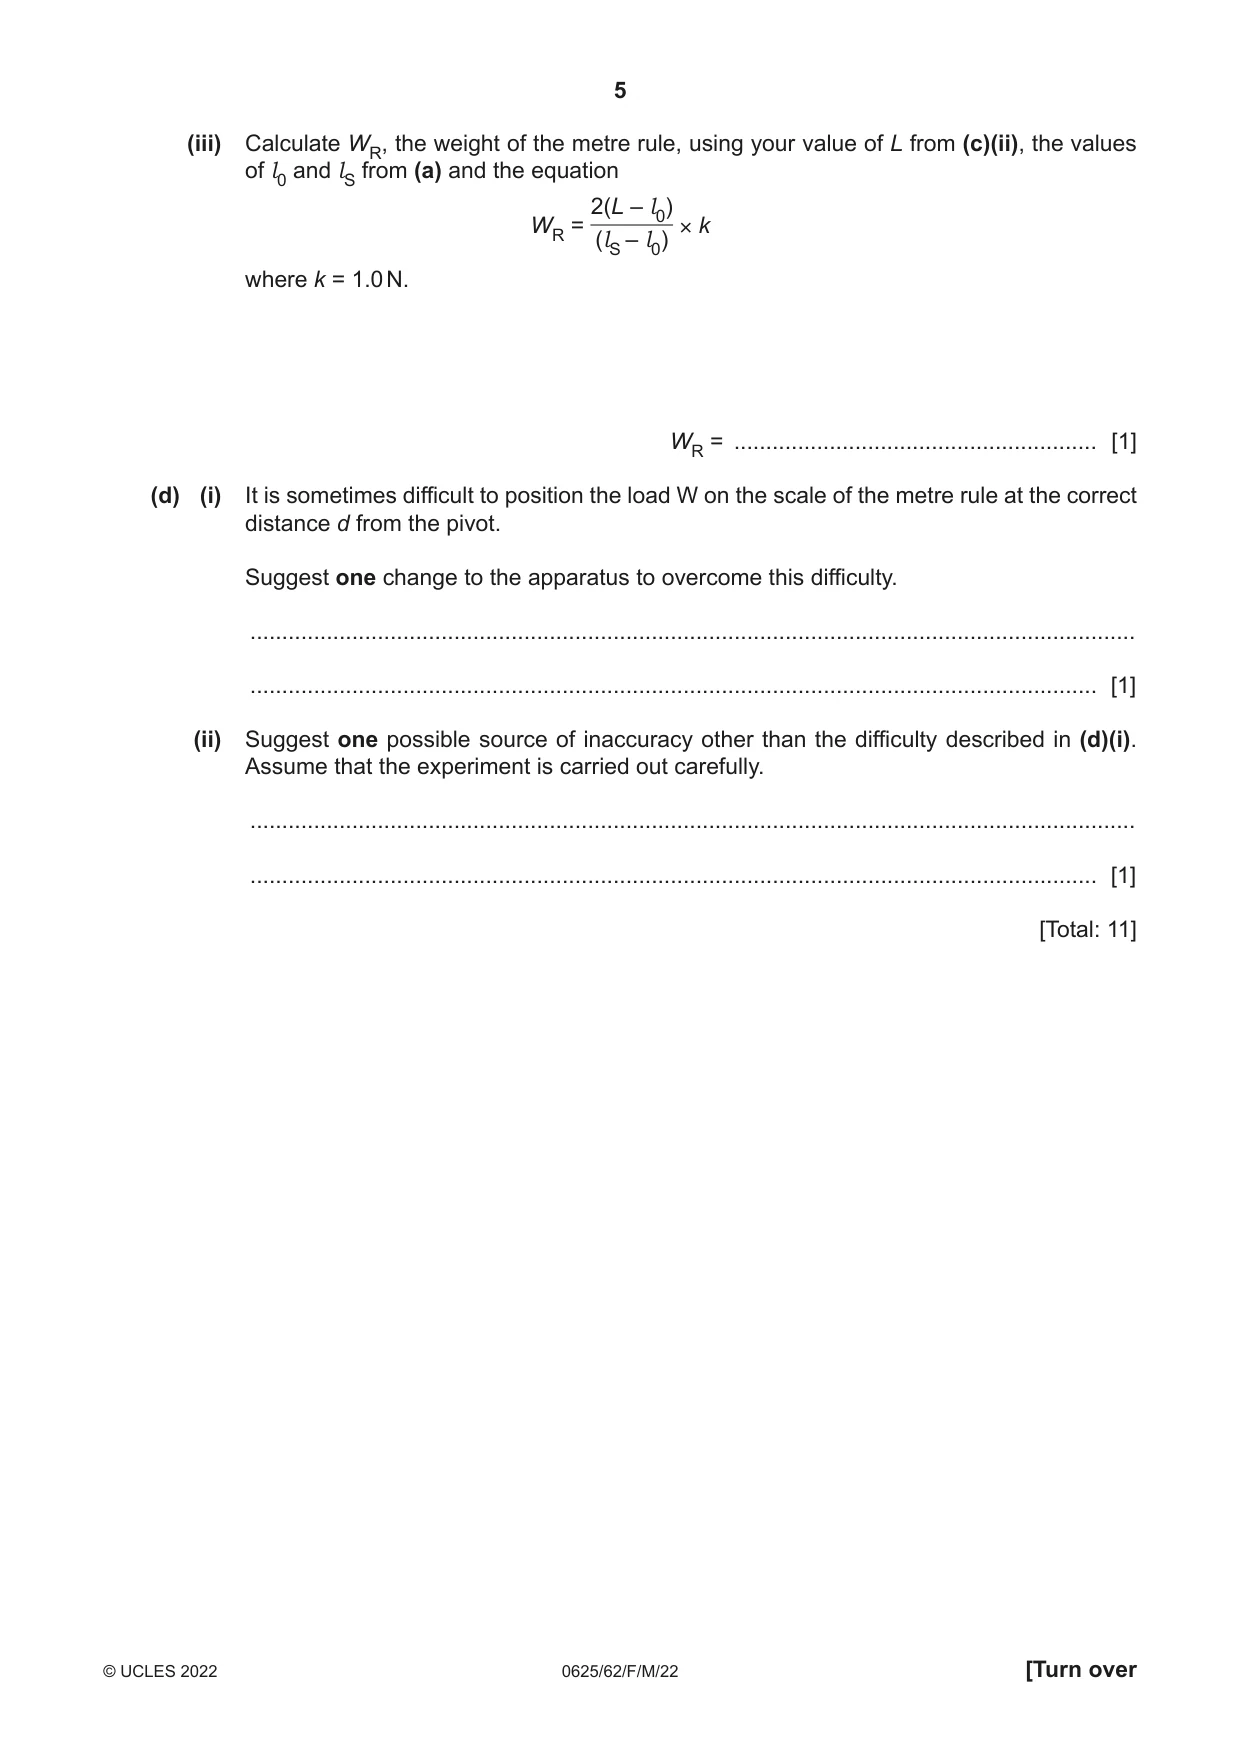
1 A student investigates the extension of a spring and uses it to determine the weight of a metre rule. The spring is shown full size in Fig. 1.1 and Fig. 1.2. Fig. 1.1 shows the spring without any load. Fig. 1.2 shows the spring with a load of 1.0 N suspended from it. clamp l0 spring lS 1.0 N load Fig. 1.1 Fig. 1.2 (a) On Fig. 1.1, measure the length l0 of the spring without any load. l0 = ......................................................... cm On Fig. 1.2, measure the stretched length lS of the spring. lS = ......................................................... cm [2] (b) The student attaches a metre rule to the spring with a wire hook, as shown in Fig. 1.3. The scale of the metre rule faces upwards. clamp wire hook l metre rule fixed to d load W metre rule pivot bench Fig. 1.3 She ensures that the metre rule is horizontal. Briefly describe how to check that the rule is horizontal. You may draw a diagram if it helps to explain your answer. ................................................................................................................................................... ................................................................................................................................................... ............................................................................................................................................. [1] (c) The student moves load W to distances d = 20.0 cm, d = 30.0 cm, d = 40.0 cm, d = 50.0 cm and d = 60.0 cm from the pivot. She reads the length l of the spring for each value of d. Her readings are shown in Table 1.1. Table 1.1 d / cm l / cm 20.0 6.2 30.0 7.1 40.0 7.6 50.0 8.3 60.0 9.0 (i) Using the values from Table 1.1, plot a graph of l / cm (y-axis) against d / cm (x-axis). Start the axes at the origin (0,0). 00 [4] (ii) From your graph, determine L, the value of l when d = 0.0 cm. L = ......................................................... [1] (iii) Calculate WR, the weight of the metre rule, using your value of L from (c)(ii), the values of l0 and lS from (a) and the equation 2(L – l0) WR = × k (lS – l0) where k = 1.0 N. WR = ......................................................... [1] (d) (i) It is sometimes difficult to position the load W on the scale of the metre rule at the correct distance d from the pivot. Suggest one change to the apparatus to overcome this difficulty. ........................................................................................................................................... ..................................................................................................................................... [1] (ii) Suggest one possible source of inaccuracy other than the difficulty described in (d)(i). Assume that the experiment is carried out carefully. ........................................................................................................................................... ..................................................................................................................................... [1] [Total: 11]
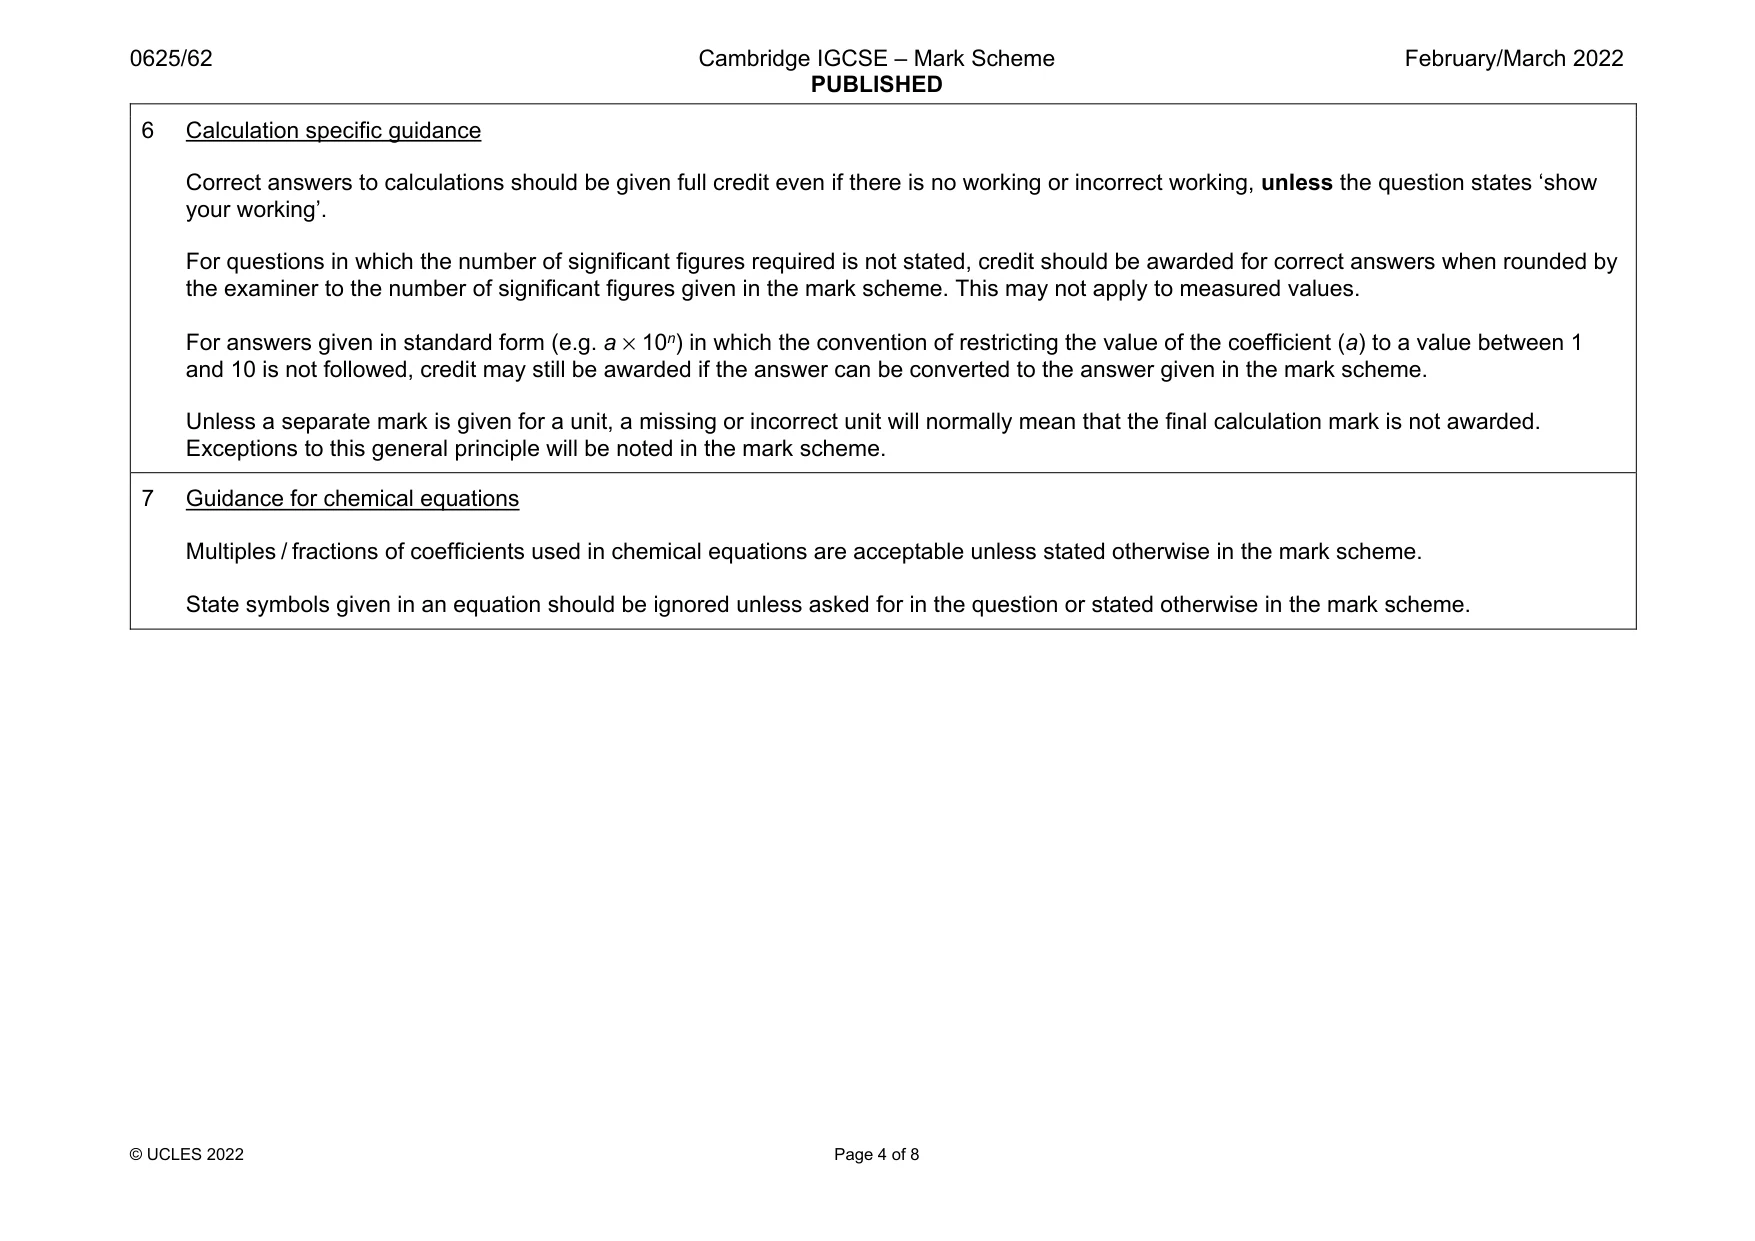
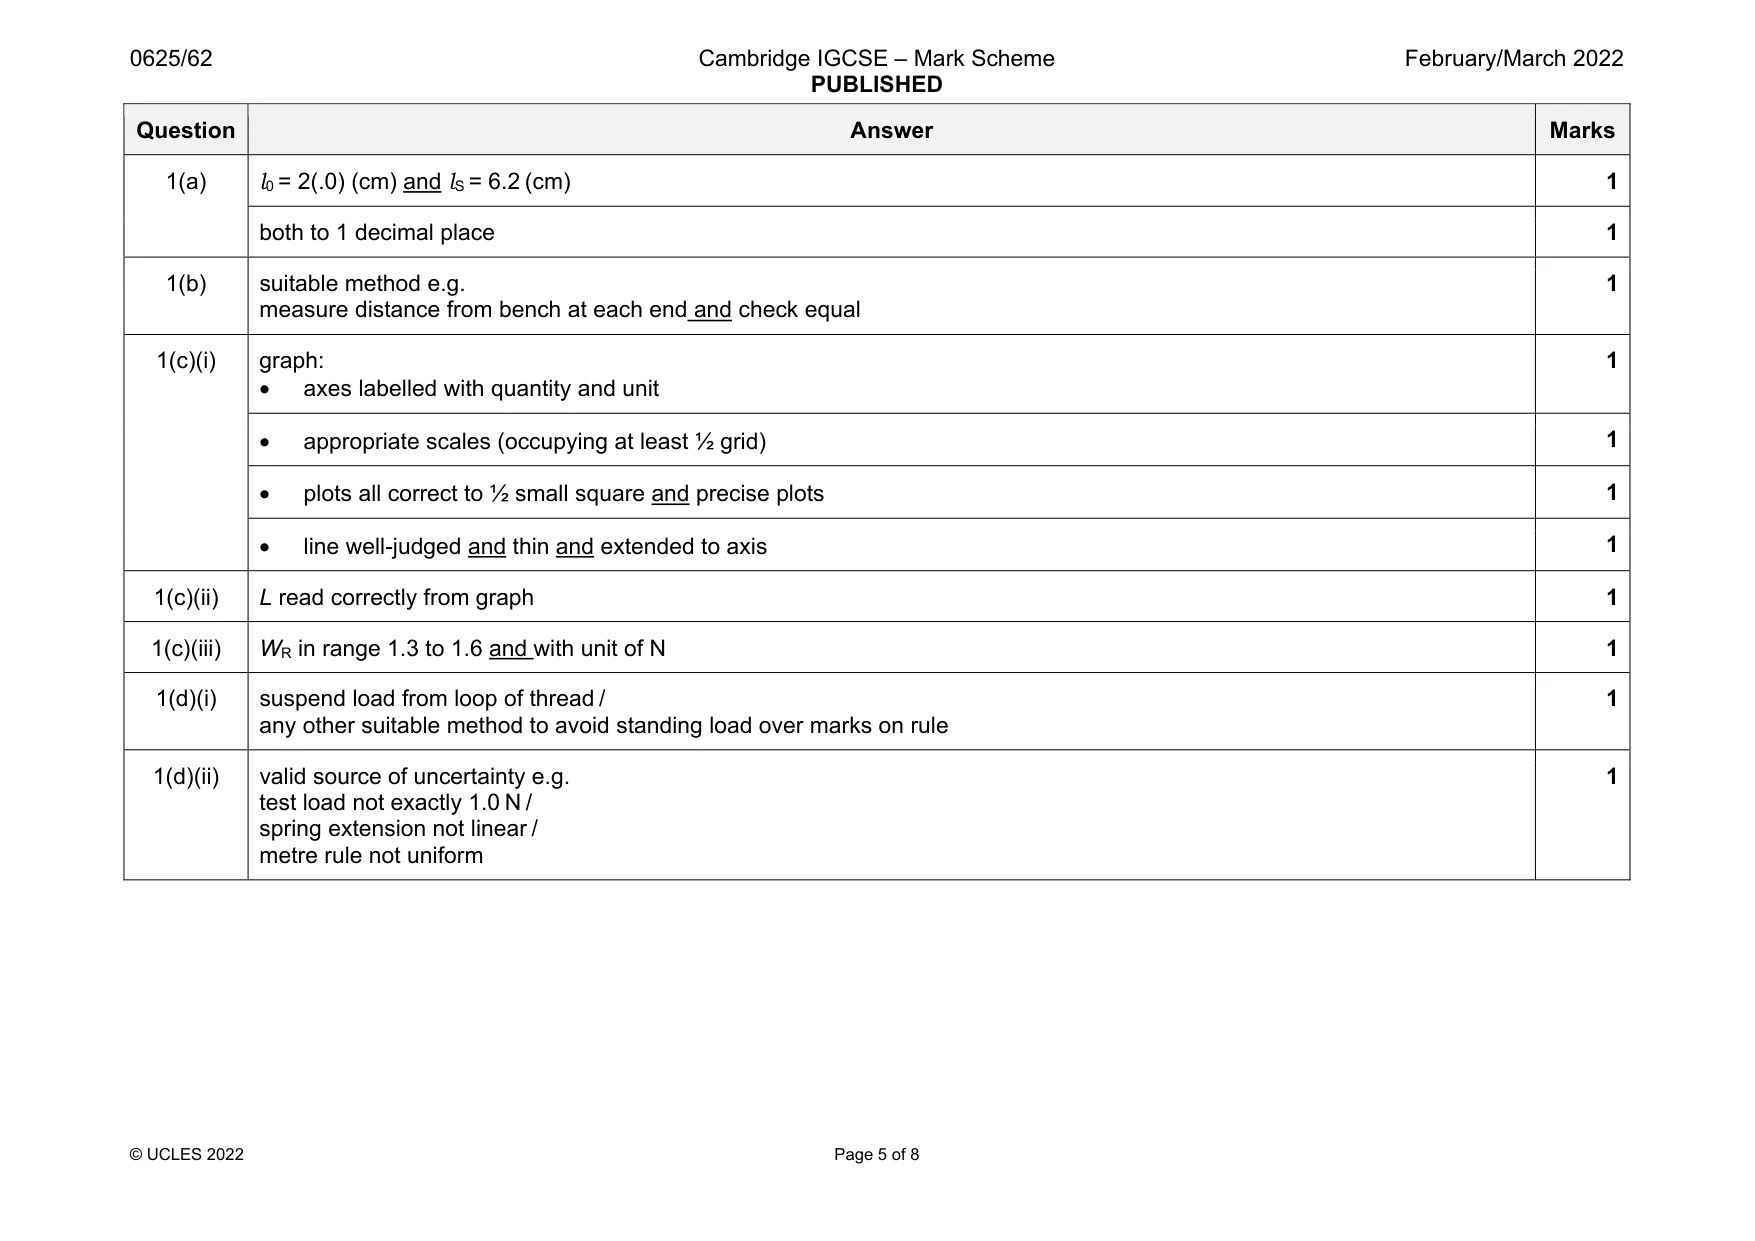
Mark scheme: 1(a) 1 both to 1 decimal place 1 1(b) suitable method e.g. measure distance from bench at each end and check equal 1 1(c)(i) graph: • axes labelled with quantity and unit 1 • appropriate scales (occupying at least ½ grid) 1 • plots all correct to ½ small square and precise plots 1 • line well-judged and thin and extended to axis 1 1(c)(ii) L read correctly from graph 1 1(c)(iii) WR in range 1.3 to 1.6 and with unit of N 1 1(d)(i) suspend load from loop of thread / any other suitable method to avoid standing load over marks on rule 1 1(d)(ii) valid source of uncertainty e.g. test load not exactly 1.0 N / spring extension not linear / metre rule not uniform 1
More questions on Physical quantities and measurement techniques
Q2 · A student investigates the thermal insulation properties of air
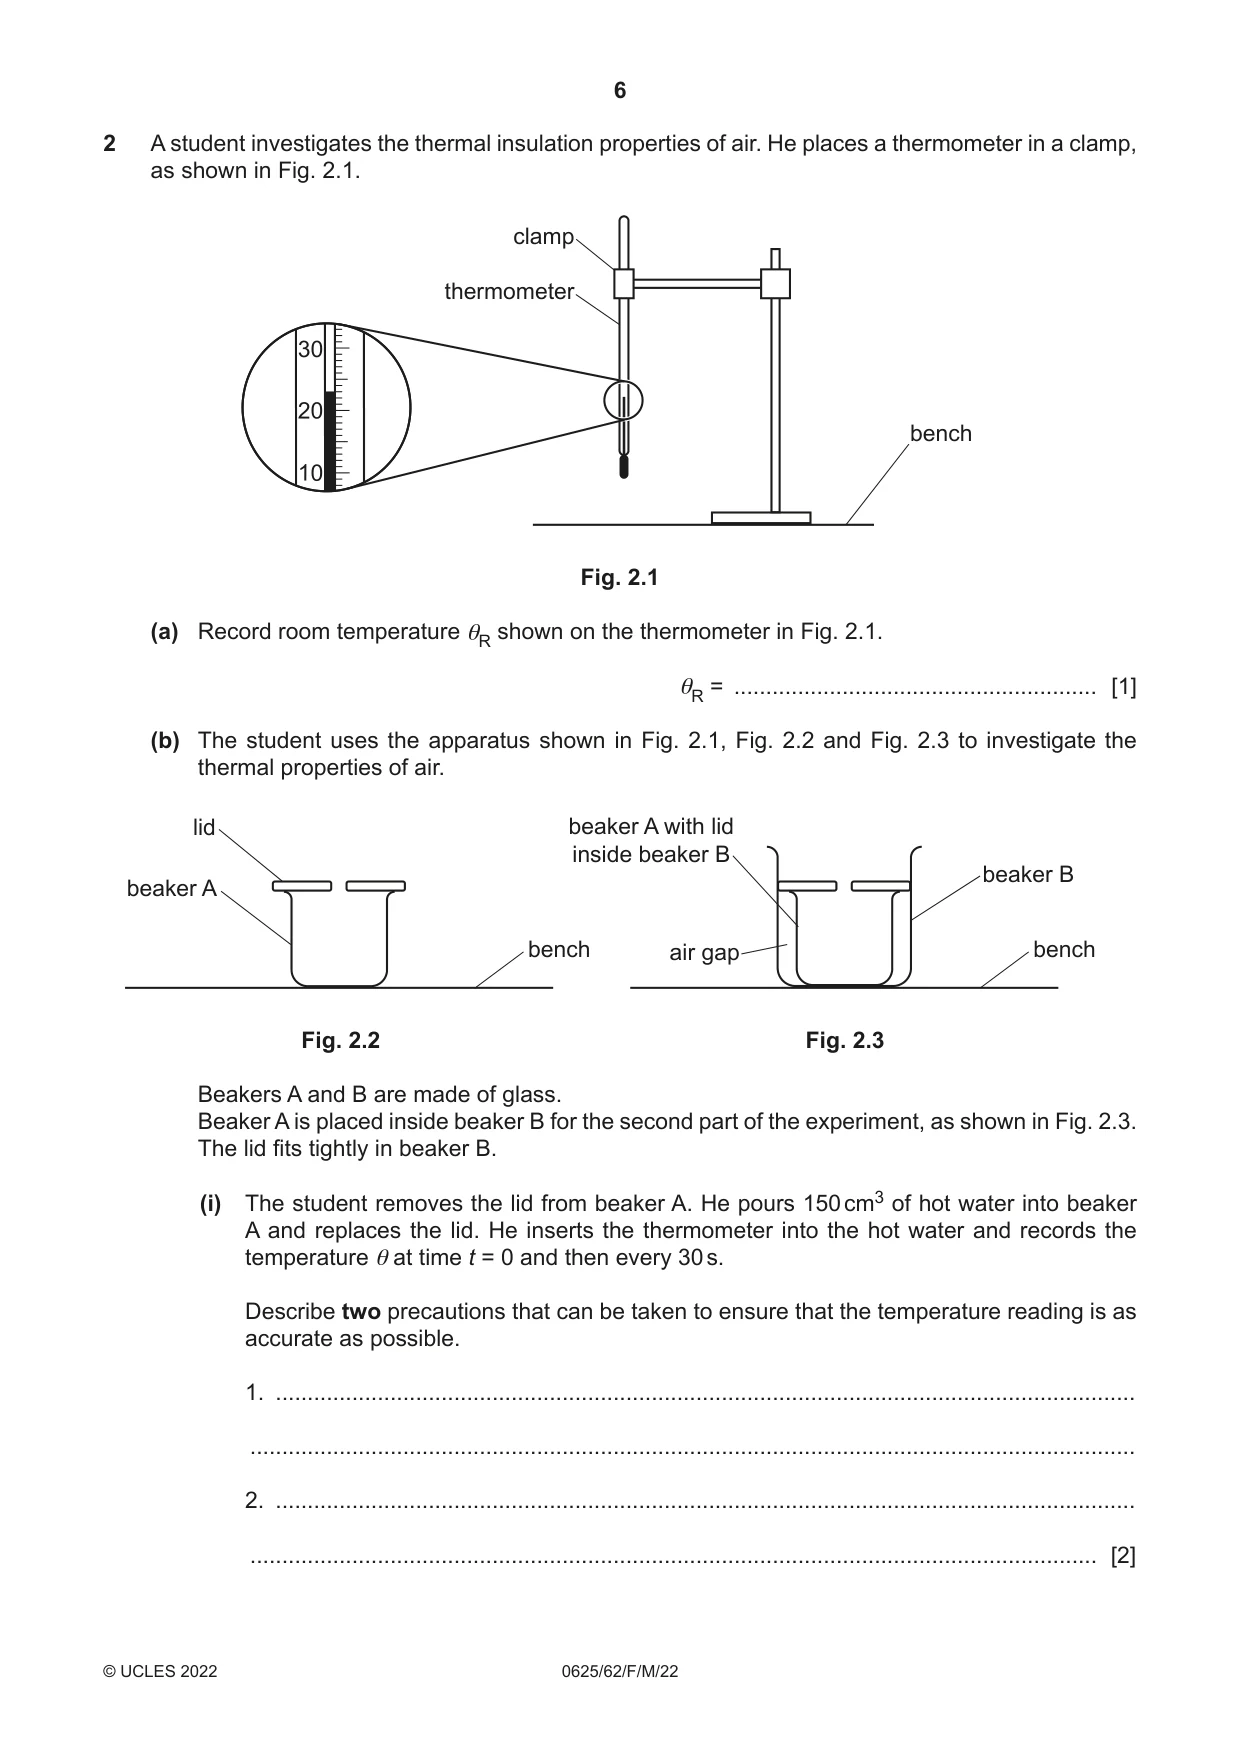
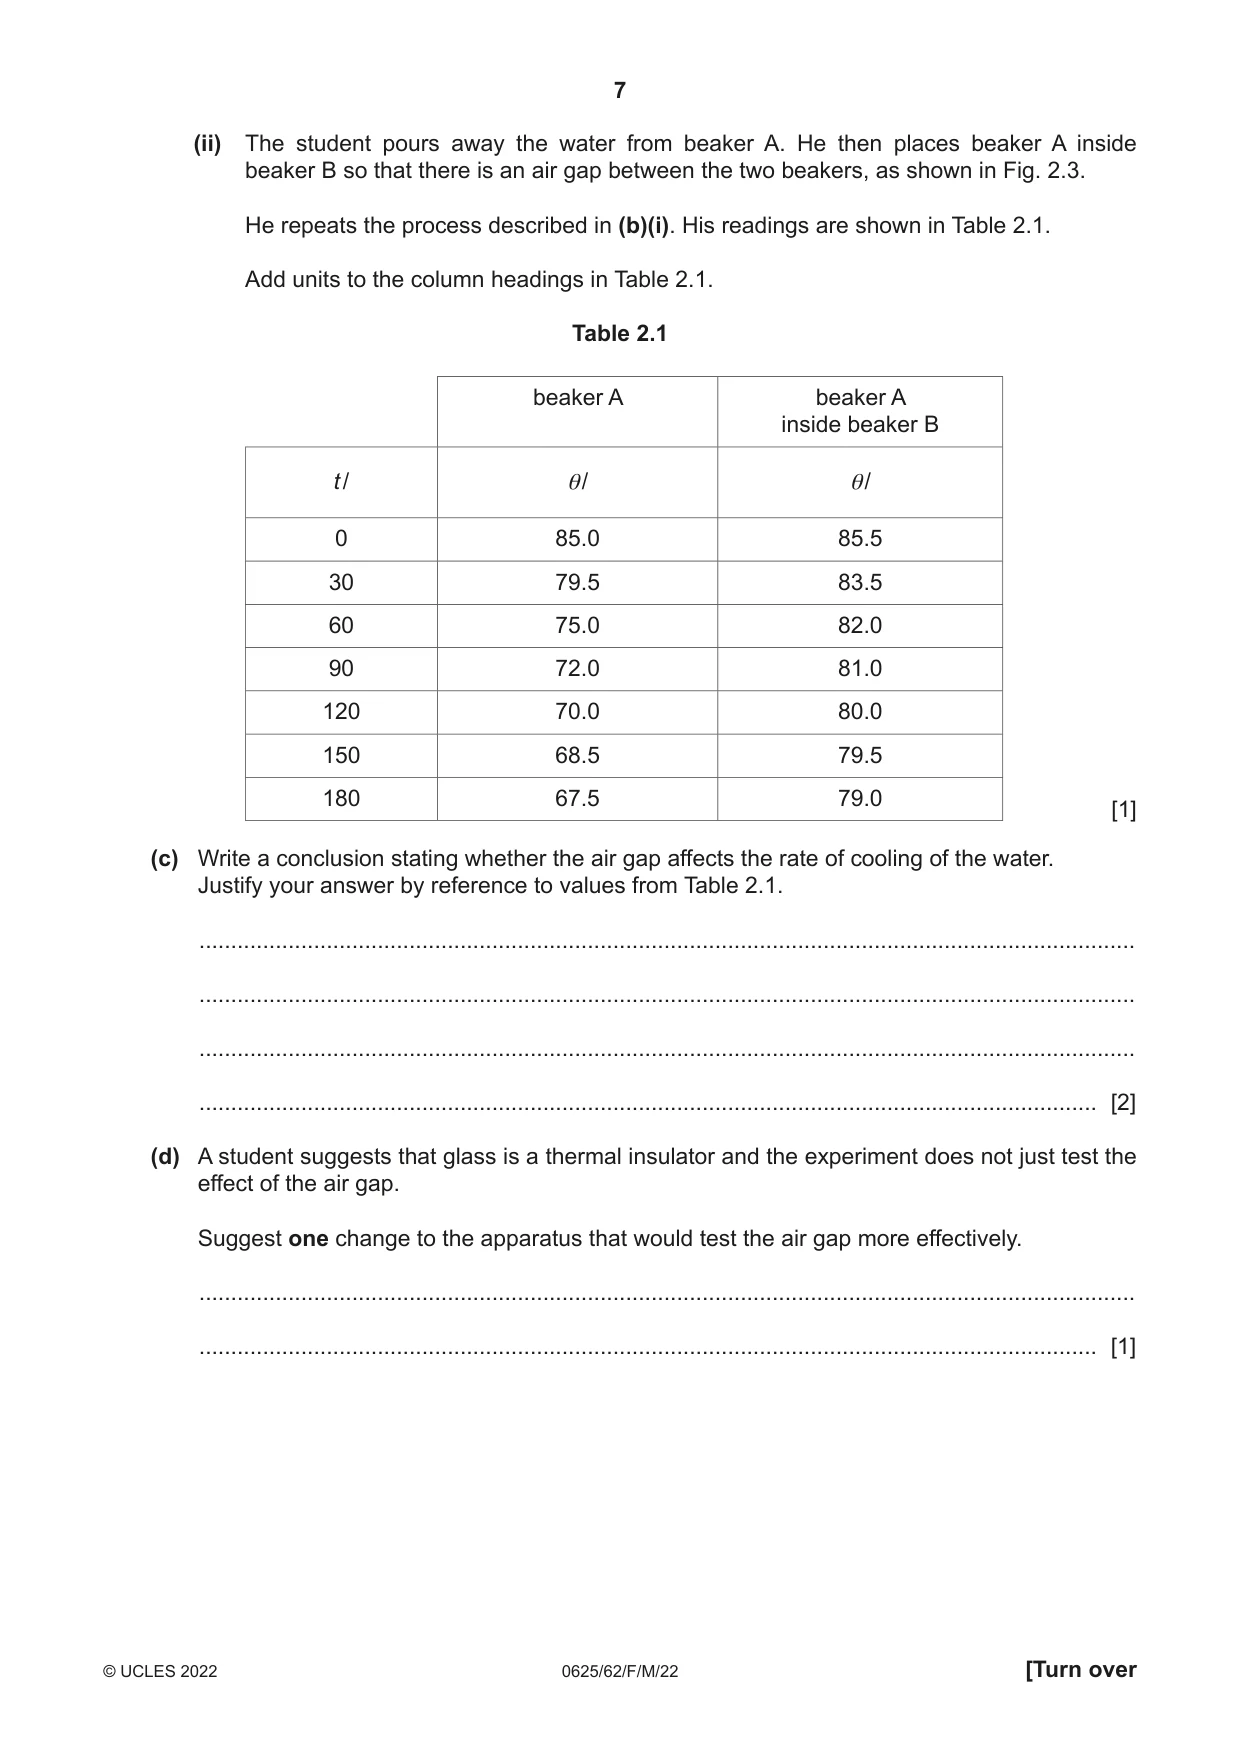
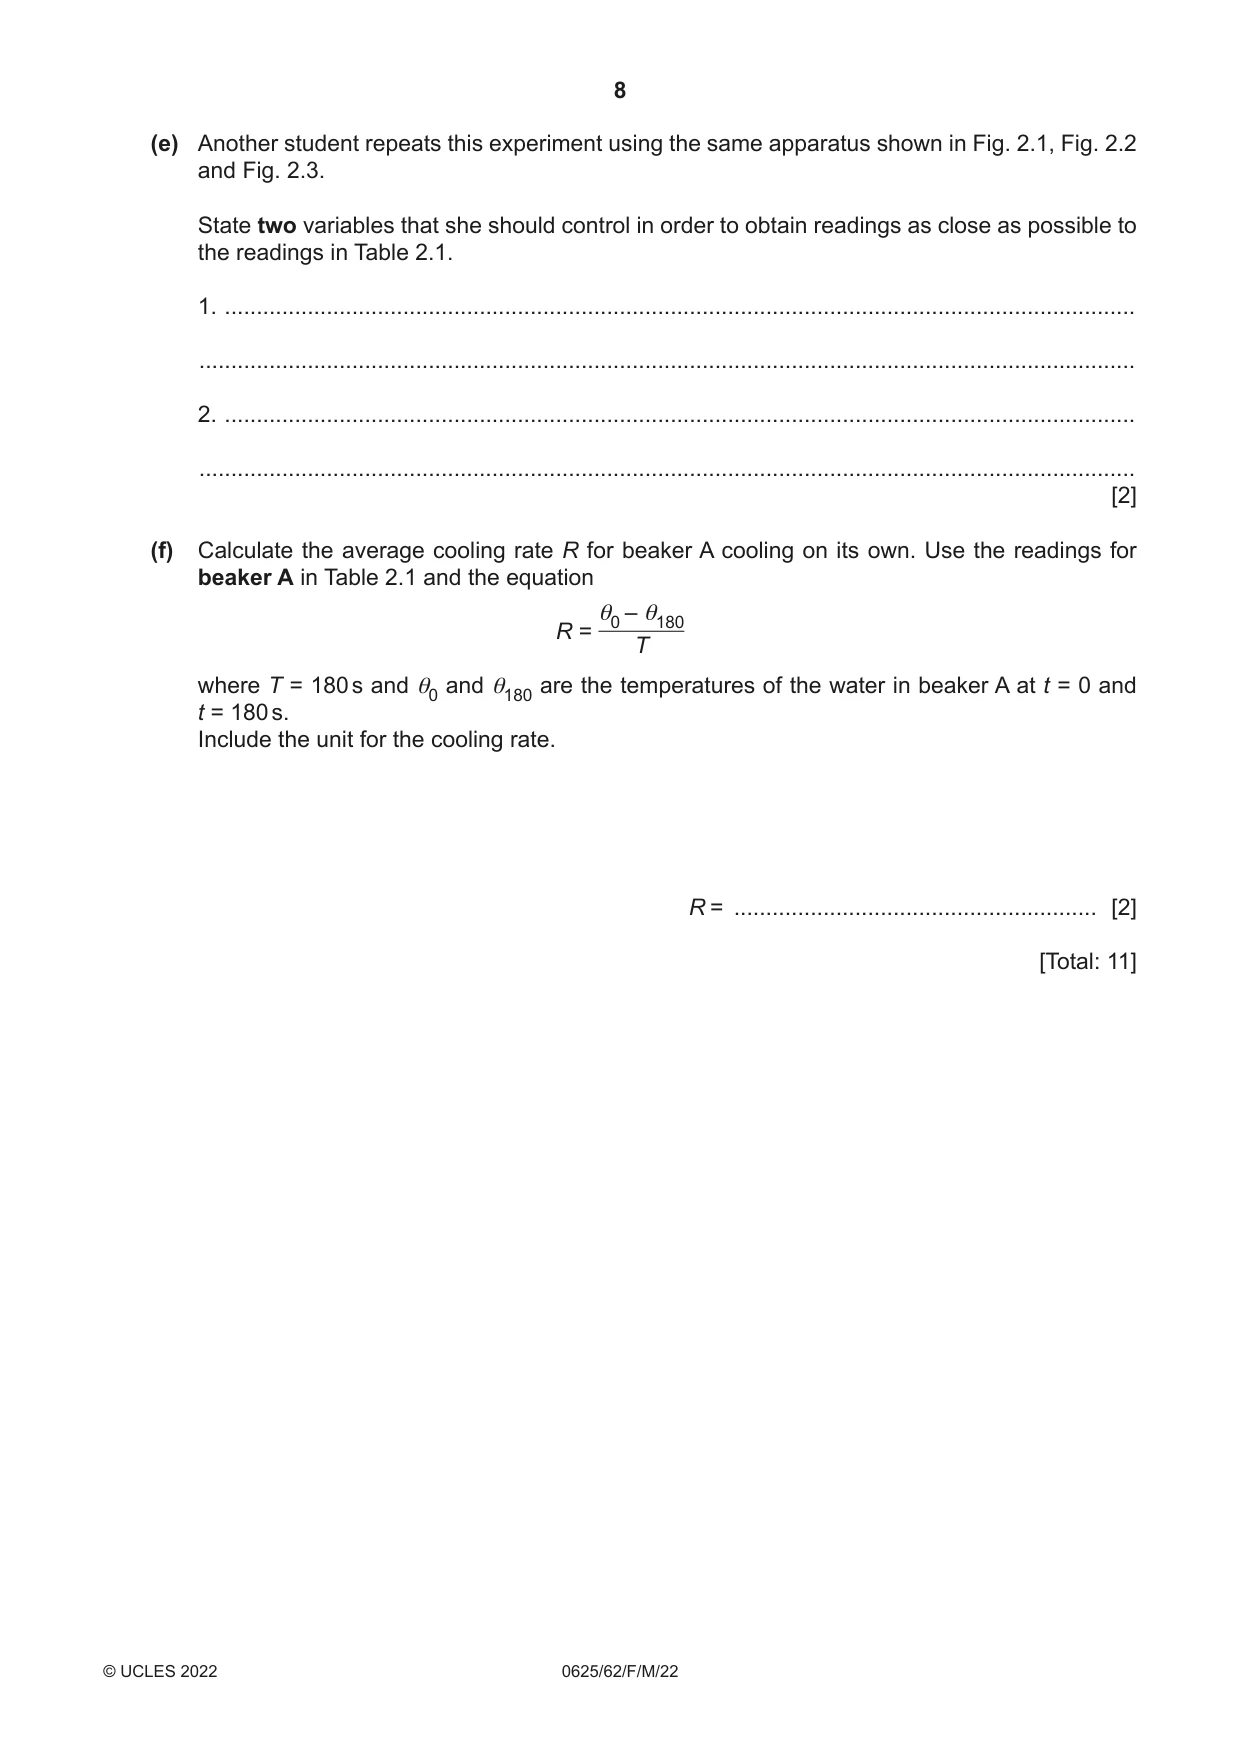
2 A student investigates the thermal insulation properties of air. He places a thermometer in a clamp, as shown in Fig. 2.1. clamp thermometer 30 20 bench 10 Fig. 2.1 (a) Record room temperature θR shown on the thermometer in Fig. 2.1. θR = ......................................................... [1] (b) The student uses the apparatus shown in Fig. 2.1, Fig. 2.2 and Fig. 2.3 to investigate the thermal properties of air. lid beaker A with lid inside beaker B beaker B beaker A bench air gap bench Fig. 2.2 Fig. 2.3 Beakers A and B are made of glass. Beaker A is placed inside beaker B for the second part of the experiment, as shown in Fig. 2.3. The lid fits tightly in beaker B. (i) The student removes the lid from beaker A. He pours 150 cm3 of hot water into beaker A and replaces the lid. He inserts the thermometer into the hot water and records the temperature θ at time t = 0 and then every 30 s. Describe two precautions that can be taken to ensure that the temperature reading is as accurate as possible. 1. ....................................................................................................................................... ........................................................................................................................................... 2. ....................................................................................................................................... ..................................................................................................................................... [2] (ii) The student pours away the water from beaker A. He then places beaker A inside beaker B so that there is an air gap between the two beakers, as shown in Fig. 2.3. He repeats the process described in (b)(i). His readings are shown in Table 2.1. Add units to the column headings in Table 2.1. Table 2.1 beaker A beaker A inside beaker B t / θ/ θ/ 0 85.0 85.5 30 79.5 83.5 60 75.0 82.0 90 72.0 81.0 120 70.0 80.0 150 68.5 79.5 180 67.5 79.0 [1] (c) Write a conclusion stating whether the air gap affects the rate of cooling of the water. Justify your answer by reference to values from Table 2.1. ................................................................................................................................................... ................................................................................................................................................... ................................................................................................................................................... ............................................................................................................................................. [2] (d) A student suggests that glass is a thermal insulator and the experiment does not just test the effect of the air gap. Suggest one change to the apparatus that would test the air gap more effectively. ................................................................................................................................................... ............................................................................................................................................. [1] (e) Another student repeats this experiment using the same apparatus shown in Fig. 2.1, Fig. 2.2 and Fig. 2.3. State two variables that she should control in order to obtain readings as close as possible to the readings in Table 2.1. 1. ............................................................................................................................................... ................................................................................................................................................... 2. ............................................................................................................................................... ................................................................................................................................................... [2] (f) Calculate the average cooling rate R for beaker A cooling on its own. Use the readings for beaker A in Table 2.1 and the equation θ0 – θ180 R = T where T = 180 s and θ0 and θ180 are the temperatures of the water in beaker A at t = 0 and t = 180 s. Include the unit for the cooling rate. R = ......................................................... [2] [Total: 11]
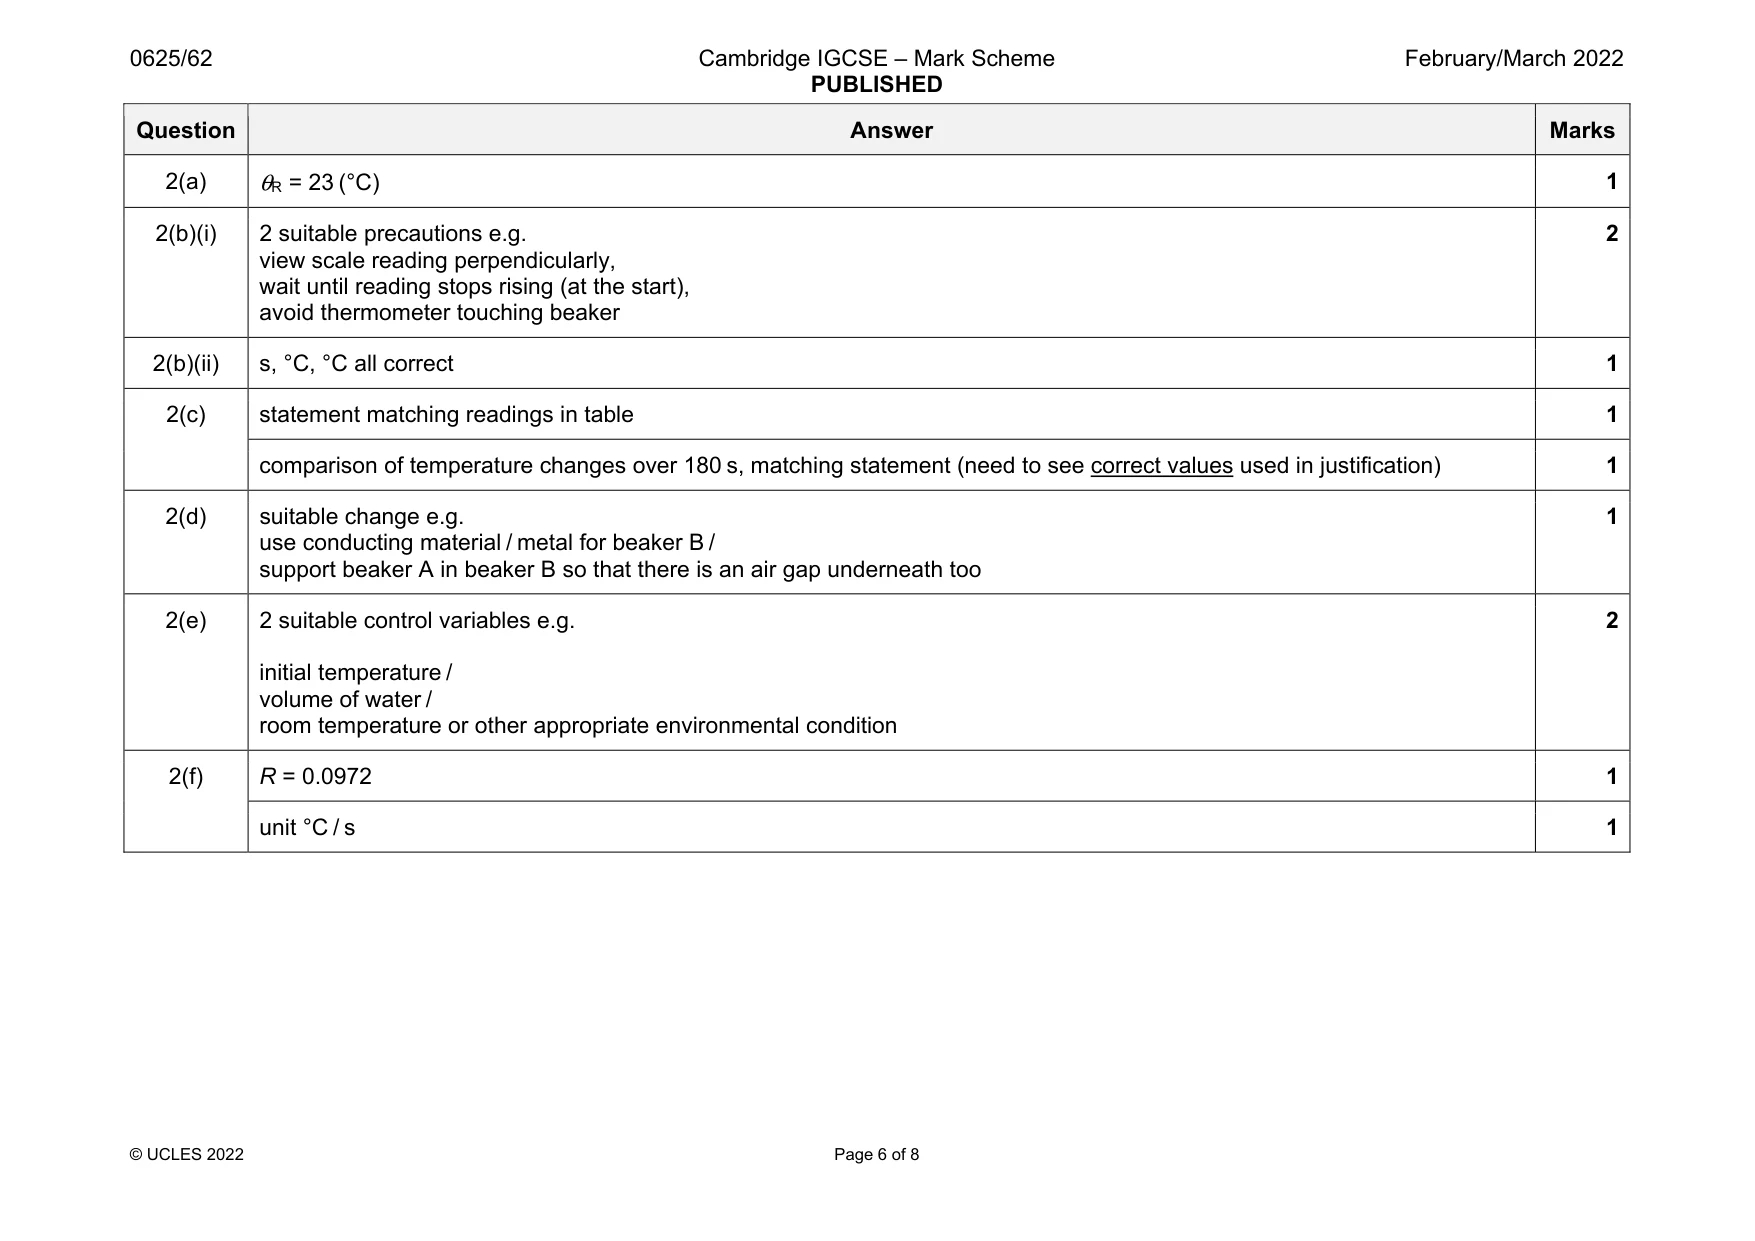
Mark scheme: 2(a) θR = 23 (°C) 1 2(b)(i) 2 suitable precautions e.g. view scale reading perpendicularly, wait until reading stops rising (at the start), avoid thermometer touching beaker 2 2(b)(ii) s, °C, °C all correct 1 2(c) statement matching readings in table 1 comparison of temperature changes over 180 s, matching statement (need to see correct values used in justification) 1 2(d) suitable change e.g. use conducting material / metal for beaker B / support beaker A in beaker B so that there is an air gap underneath too 1 2(e) 2 suitable control variables e.g. initial temperature / volume of water / room temperature or other appropriate environmental condition 2 2(f) R = 0.0972 1 unit °C / s 1
Q3 · A student investigates the refraction of light by a transparent block
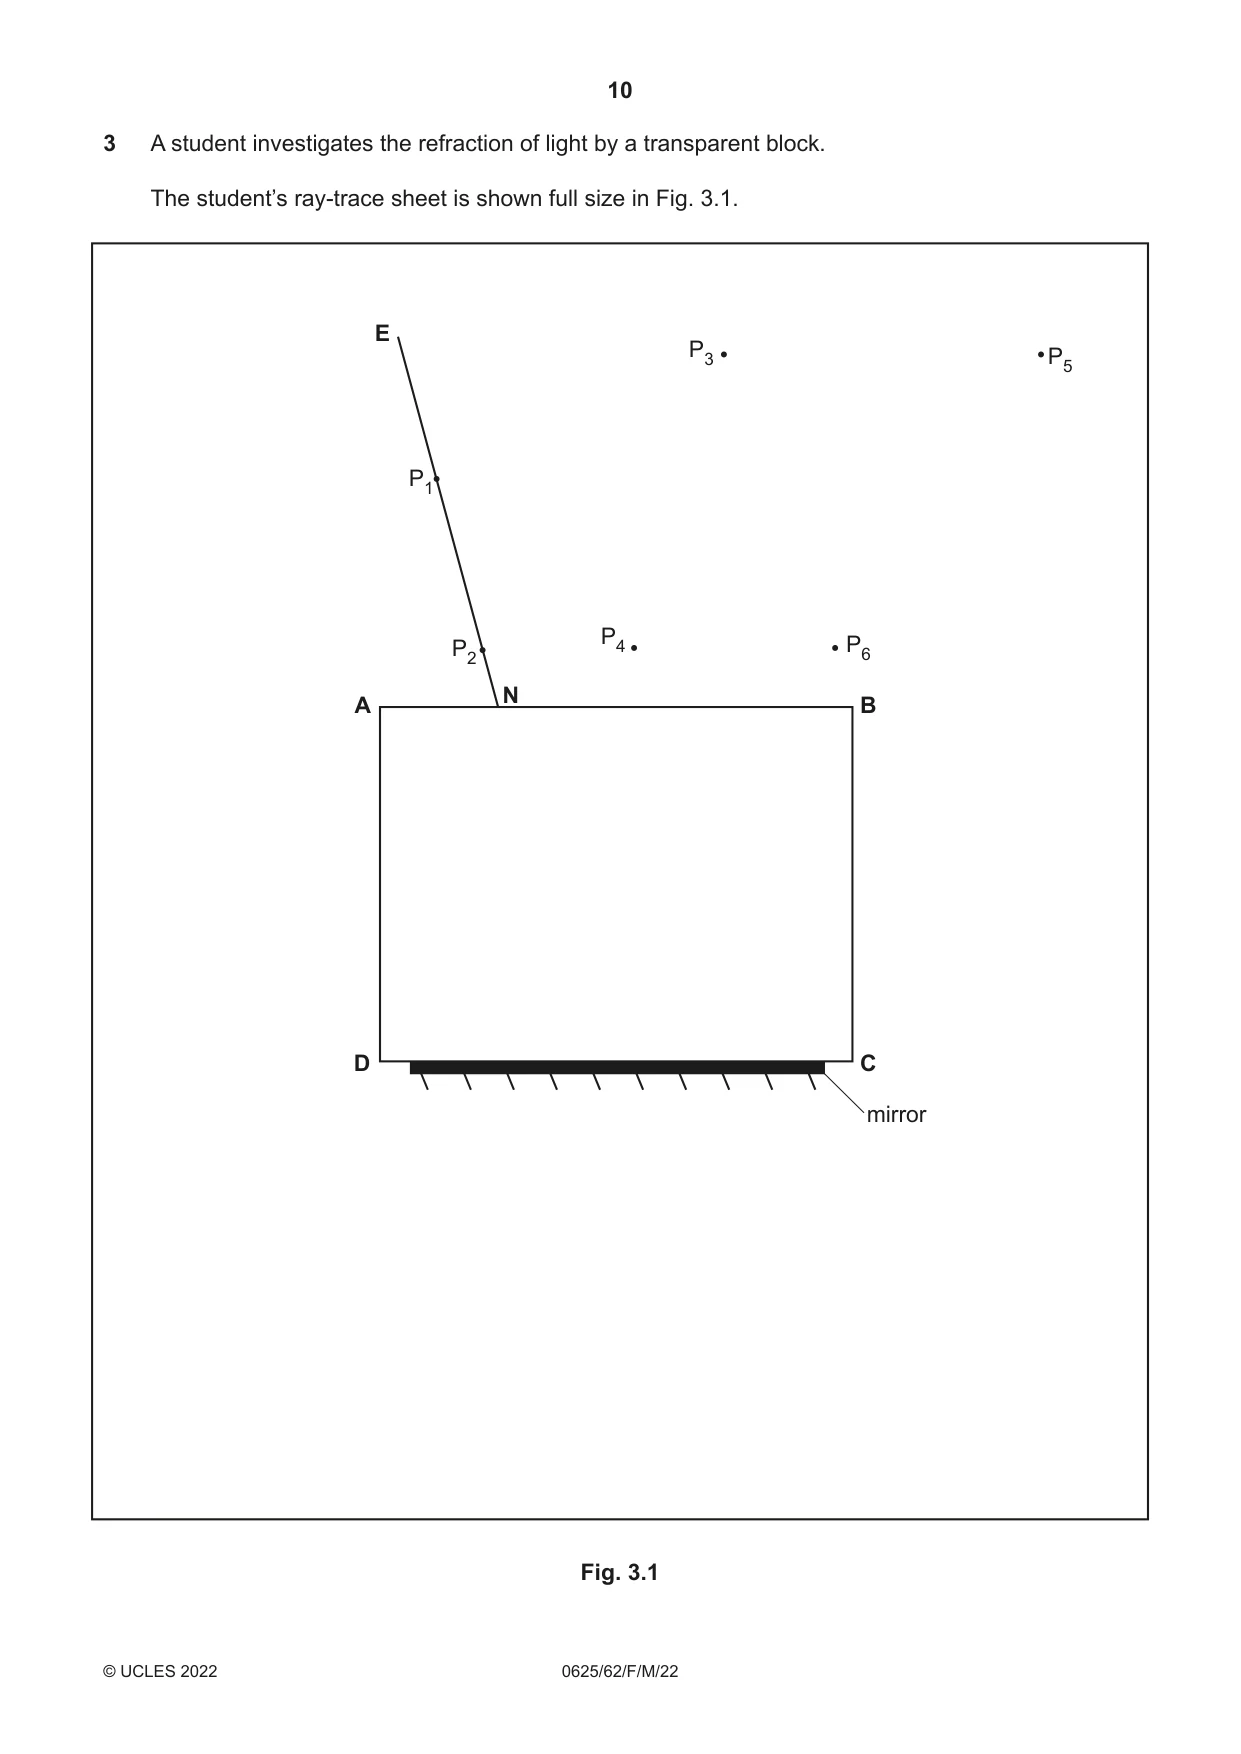
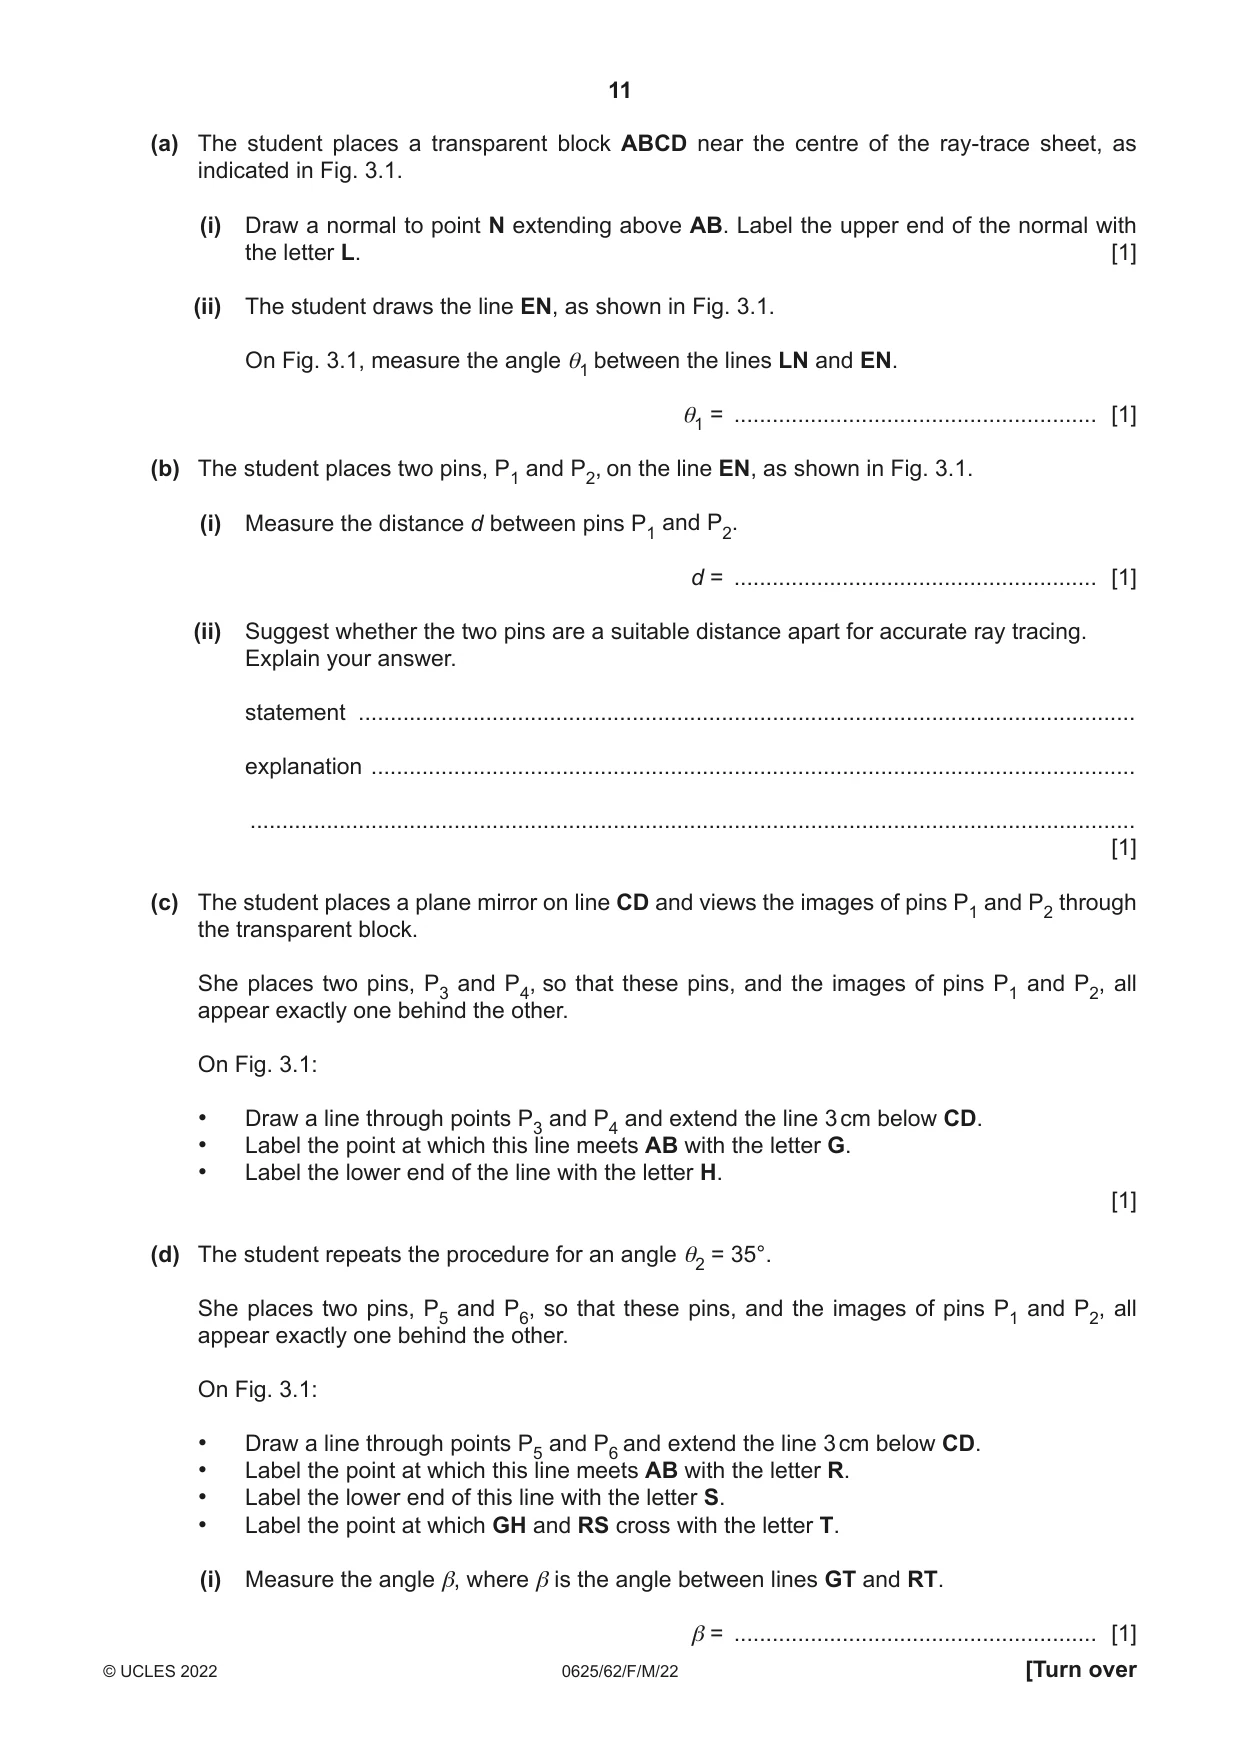
3 A student investigates the refraction of light by a transparent block. The student’s ray-trace sheet is shown full size in Fig. 3.1. E P3 P5 P1 P4 P2 P6 N A B D C mirror Fig. 3.1 (a) The student places a transparent block ABCD near the centre of the ray-trace sheet, as indicated in Fig. 3.1. (i) Draw a normal to point N extending above AB. Label the upper end of the normal with the letter L. [1] (ii) The student draws the line EN, as shown in Fig. 3.1. On Fig. 3.1, measure the angle θ1 between the lines LN and EN. θ1 = ......................................................... [1] (b) The student places two pins, P1 and P2, on the line EN, as shown in Fig. 3.1. (i) Measure the distance d between pins P1 and P2. d = ......................................................... [1] (ii) Suggest whether the two pins are a suitable distance apart for accurate ray tracing. Explain your answer. statement .......................................................................................................................... explanation ........................................................................................................................ ........................................................................................................................................... [1] (c) The student places a plane mirror on line CD and views the images of pins P1 and P2 through the transparent block. She places two pins, P3 and P4, so that these pins, and the images of pins P1 and P2, all appear exactly one behind the other. On Fig. 3.1: • Draw a line through points P3 and P4 and extend the line 3 cm below CD. • Label the point at which this line meets AB with the letter G. • Label the lower end of the line with the letter H. [1] (d) The student repeats the procedure for an angle θ2 = 35°. She places two pins, P5 and P6, so that these pins, and the images of pins P1 and P2, all appear exactly one behind the other. On Fig. 3.1: • Draw a line through points P5 and P6 and extend the line 3 cm below CD. • Label the point at which this line meets AB with the letter R. • Label the lower end of this line with the letter S. • Label the point at which GH and RS cross with the letter T. (i) Measure the angle β, where β is the angle between lines GT and RT. β = ......................................................... [1] (ii) A student suggests that the angle β should be equal to θs, where θs is calculated using the equation θs = θ2 – θ1. State whether your results from (a)(ii) and (d) support this suggestion. Justify your answer by reference to values from your results. statement .......................................................................................................................... justification ........................................................................................................................ ........................................................................................................................................... [2] (e) Suggest two precautions to take in this type of experiment to ensure accurate results. 1. ............................................................................................................................................... ................................................................................................................................................... 2. ............................................................................................................................................... ................................................................................................................................................... [2] (f) Suggest one reason why different students, all carrying out this experiment carefully, may not obtain identical results. ................................................................................................................................................... ............................................................................................................................................. [1] [Total: 11]
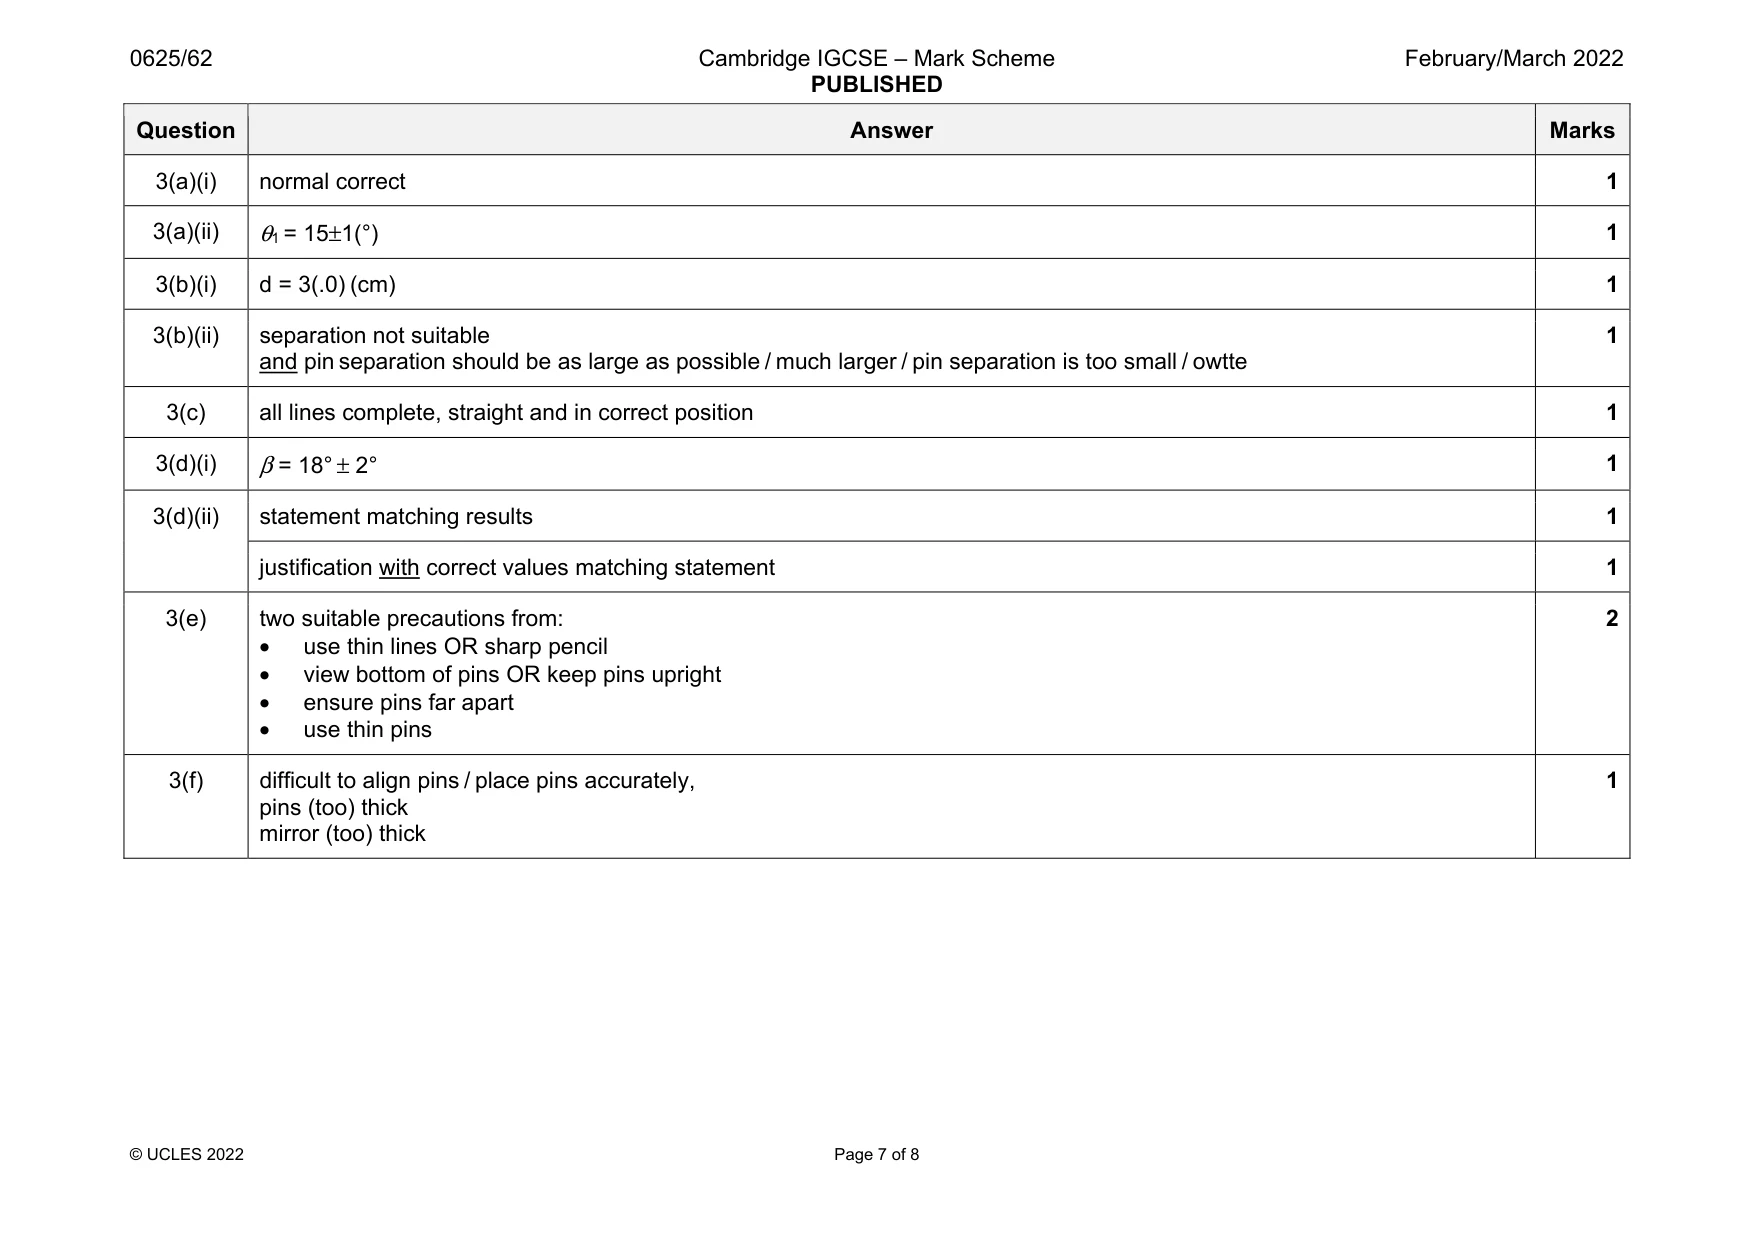
Mark scheme: 3(a)(i) normal correct 1 3(a)(ii) θ1 = 15±1(°) 1 3(b)(i) d = 3(.0) (cm) 1 3(b)(ii) separation not suitable and pin separation should be as large as possible / much larger / pin separation is too small / owtte 1 3(c) all lines complete, straight and in correct position 1 3(d)(i) β = 18° ± 2° 1 3(d)(ii) statement matching results 1 justification with correct values matching statement 1 3(e) two suitable precautions from: • use thin lines OR sharp pencil • view bottom of pins OR keep pins upright • ensure pins far apart • use thin pins 2 3(f) difficult to align pins / place pins accurately, pins (too) thick mirror (too) thick 1
Q4 · A student investigates the heating of water using an immersion heater
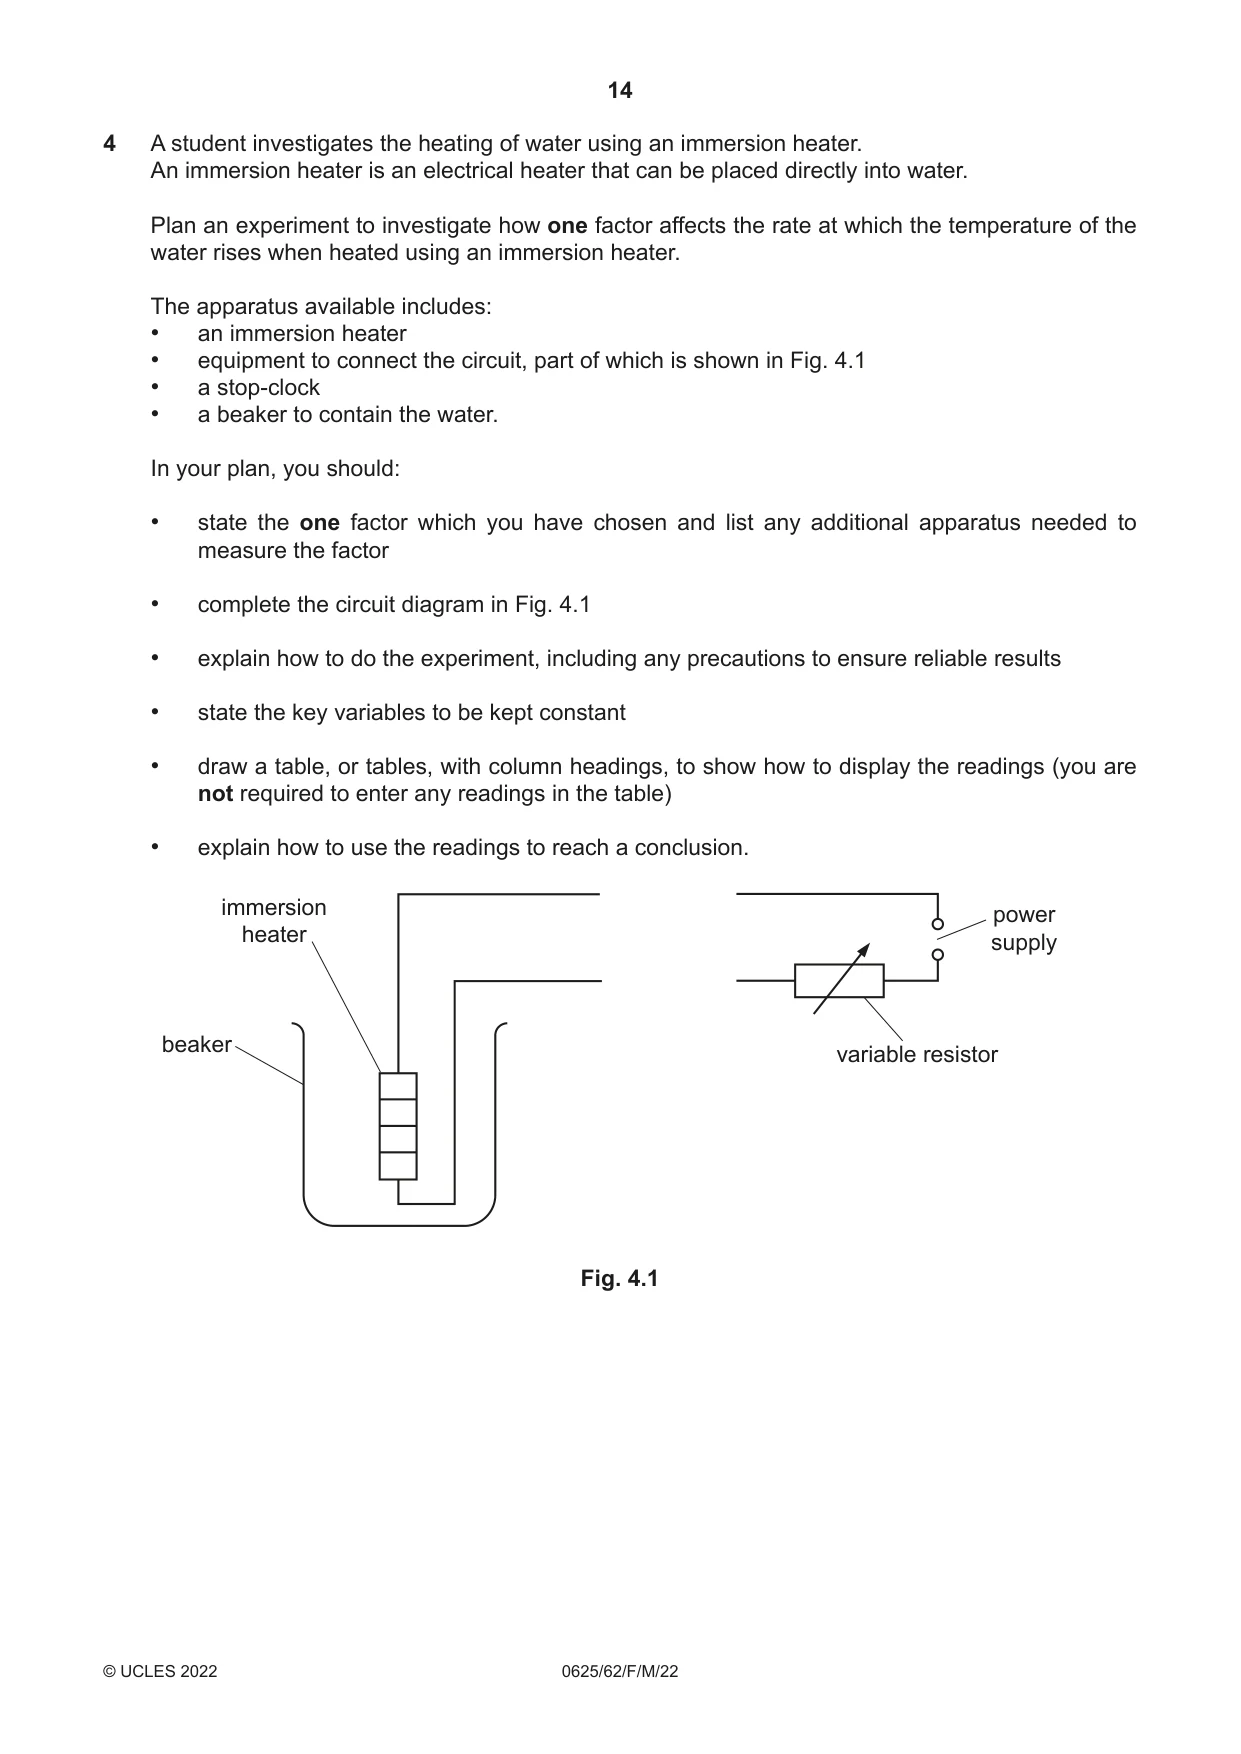
4 A student investigates the heating of water using an immersion heater. An immersion heater is an electrical heater that can be placed directly into water. Plan an experiment to investigate how one factor affects the rate at which the temperature of the water rises when heated using an immersion heater. The apparatus available includes: • an immersion heater • equipment to connect the circuit, part of which is shown in Fig. 4.1 • a stop-clock • a beaker to contain the water. In your plan, you should: • state the one factor which you have chosen and list any additional apparatus needed to measure the factor • complete the circuit diagram in Fig. 4.1 • explain how to do the experiment, including any precautions to ensure reliable results • state the key variables to be kept constant • draw a table, or tables, with column headings, to show how to display the readings (you are not required to enter any readings in the table) • explain how to use the readings to reach a conclusion. immersion power heater supply beaker variable resistor Fig. 4.1 .................................................................................................................................................................. .................................................................................................................................................................. .................................................................................................................................................................. .................................................................................................................................................................. .................................................................................................................................................................. .................................................................................................................................................................. .................................................................................................................................................................. .................................................................................................................................................................. .................................................................................................................................................................. .................................................................................................................................................................. .................................................................................................................................................................. .................................................................................................................................................................. .................................................................................................................................................................. .................................................................................................................................................................. .................................................................................................................................................................. .................................................................................................................................................................. .................................................................................................................................................................. .................................................................................................................................................................. .................................................................................................................................................................. .................................................................................................................................................................. .................................................................................................................................................................. .................................................................................................................................................................. ............................................................................................................................................................ [7]
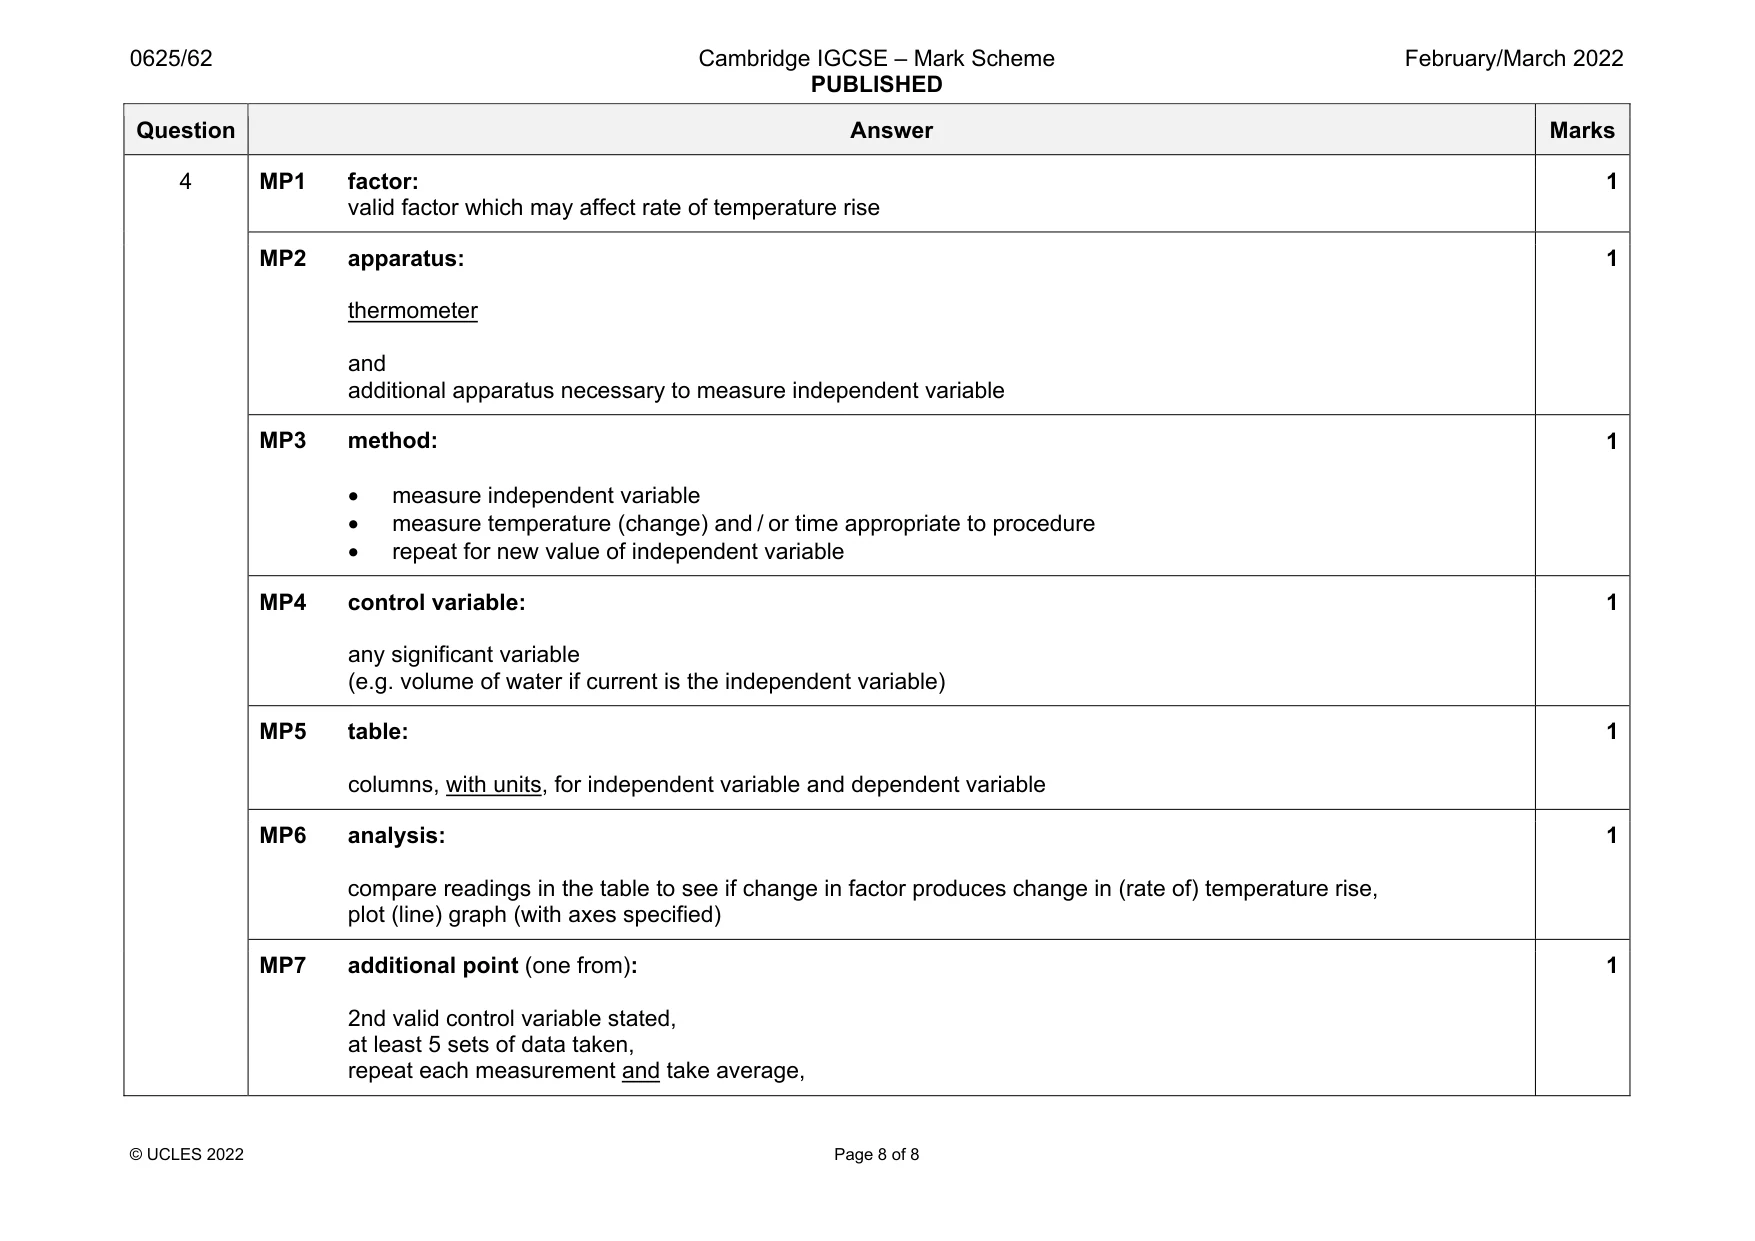
Mark scheme: 4 MP1 factor: valid factor which may affect rate of temperature rise 1 MP2 apparatus: thermometer and additional apparatus necessary to measure independent variable 1 MP3 method: • measure independent variable • measure temperature (change) and / or time appropriate to procedure • repeat for new value of independent variable 1 MP4 control variable: any significant variable (e.g. volume of water if current is the independent variable) 1 MP5 table: columns, with units, for independent variable and dependent variable 1 MP6 analysis: compare readings in the table to see if change in factor produces change in (rate of) temperature rise, plot (line) graph (with axes specified) 1 MP7 additional point (one from): 2nd valid control variable stated, at least 5 sets of data taken, repeat each measurement and take average, 1
What was in this paper
The subtopics covered by these 4 questions, and how many questions each got. Open one in a new tab to see every Cambridge question on it.
What you needed in this session
Cambridge’s own grade thresholds for 2022 Feb/March, Paper 6 · Variant 2. A higher threshold means an easier paper — the bar moves with how the cohort did.