Cambridge IGCSE Physics 0625 — 2021 Feb/March Paper 6 · Variant 2
0625/62/F/M/21 · 4 questions · 40 marks · ≈45 min
The question paper and its mark scheme, free to read here and free to download. This is Cambridge’s own paper, exactly as it was sat.
Question paper16 pages



Mark scheme8 pages
Answers below. Sit the paper first if you are practising.
Questions as text
Q1 · A student investigates the motion of an oscillating metre rule
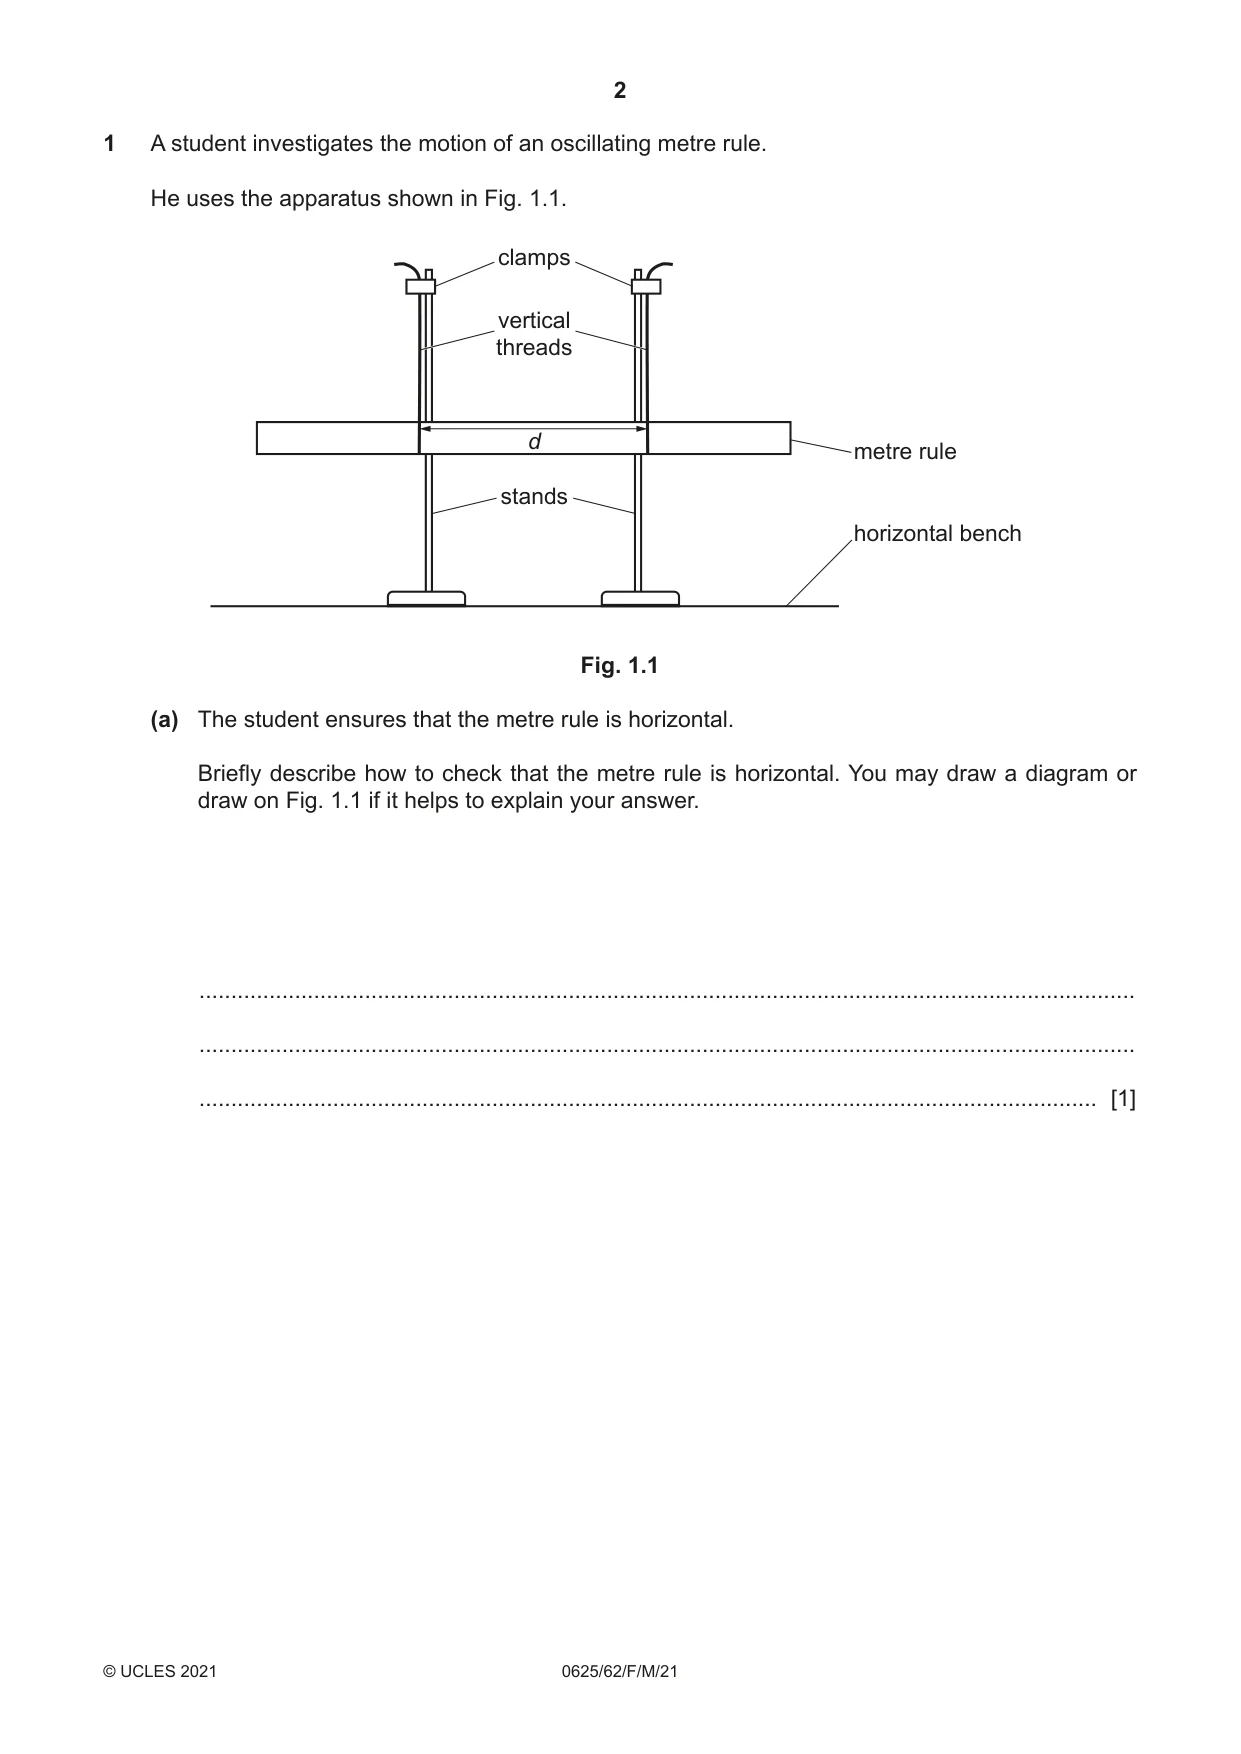
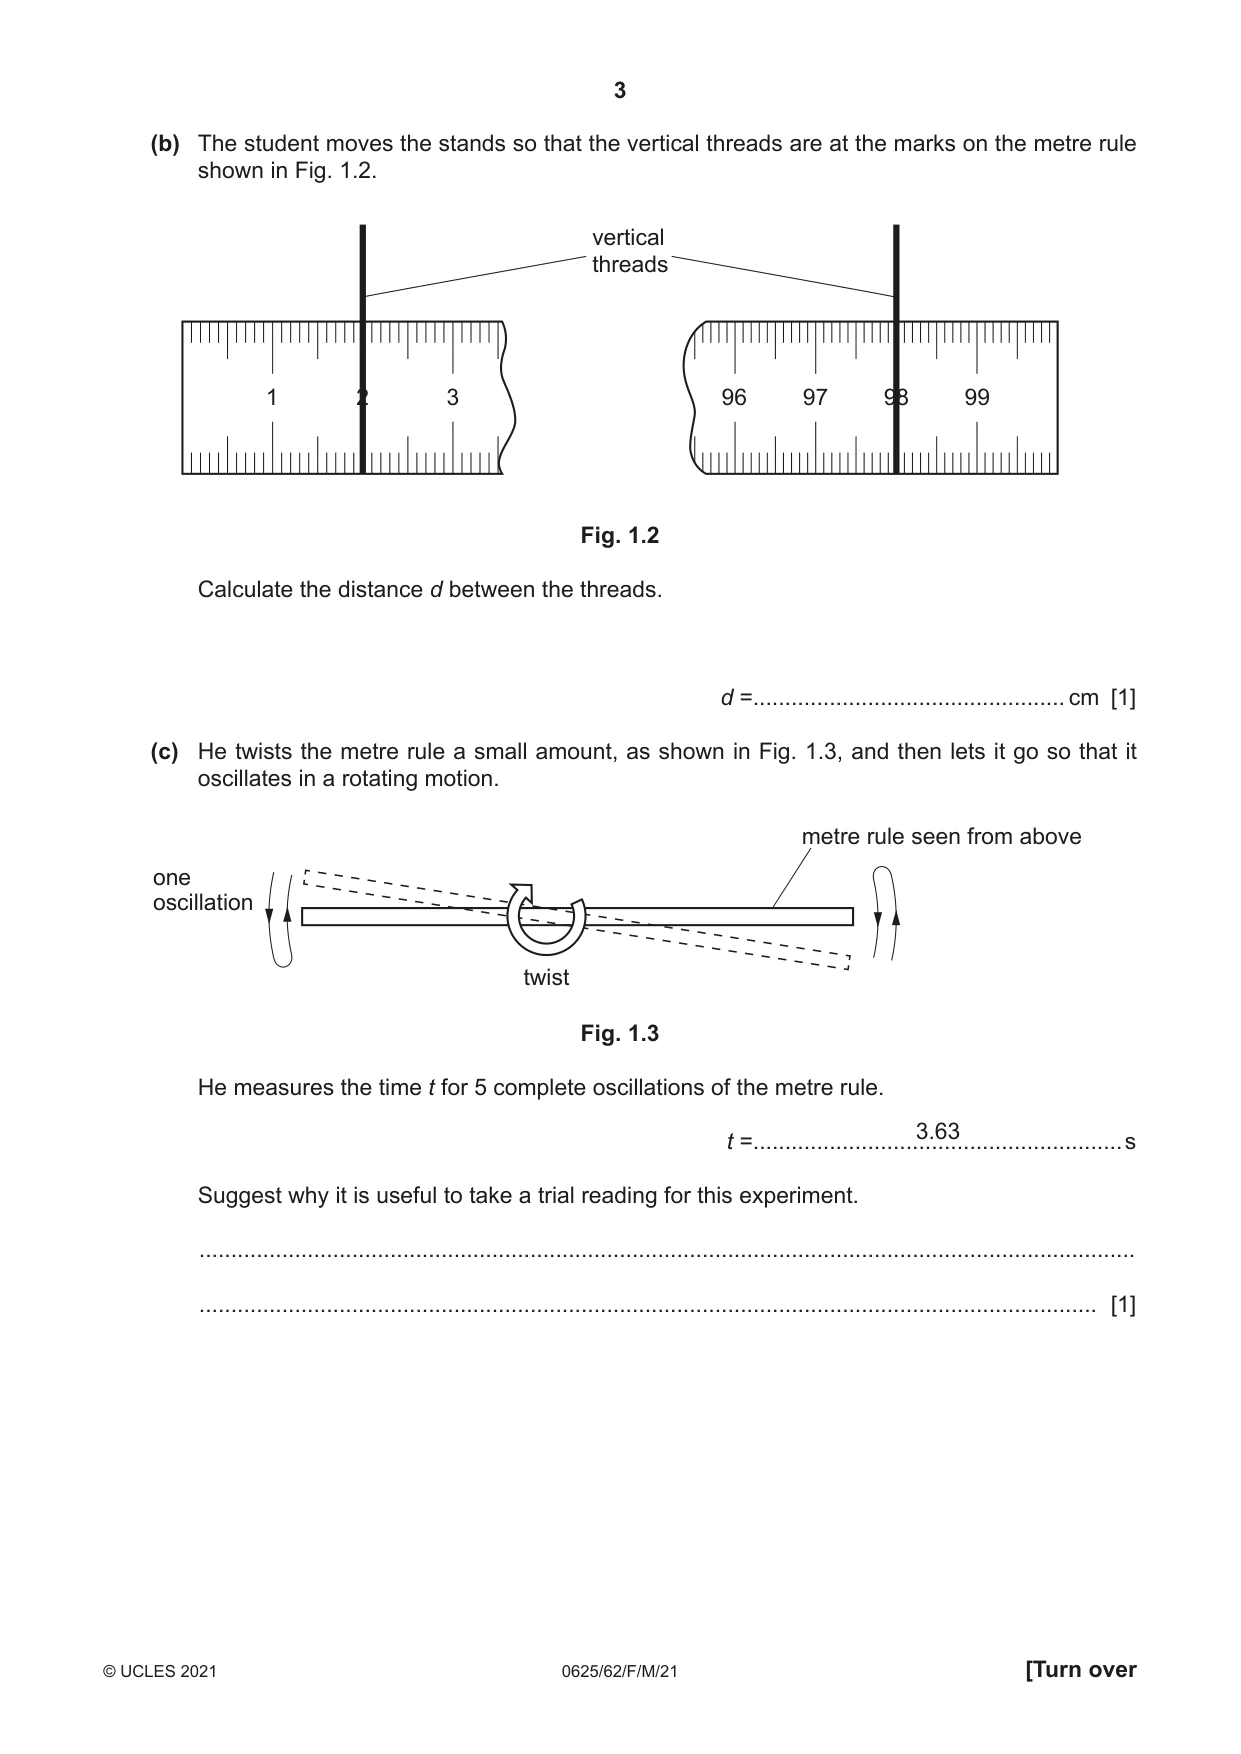
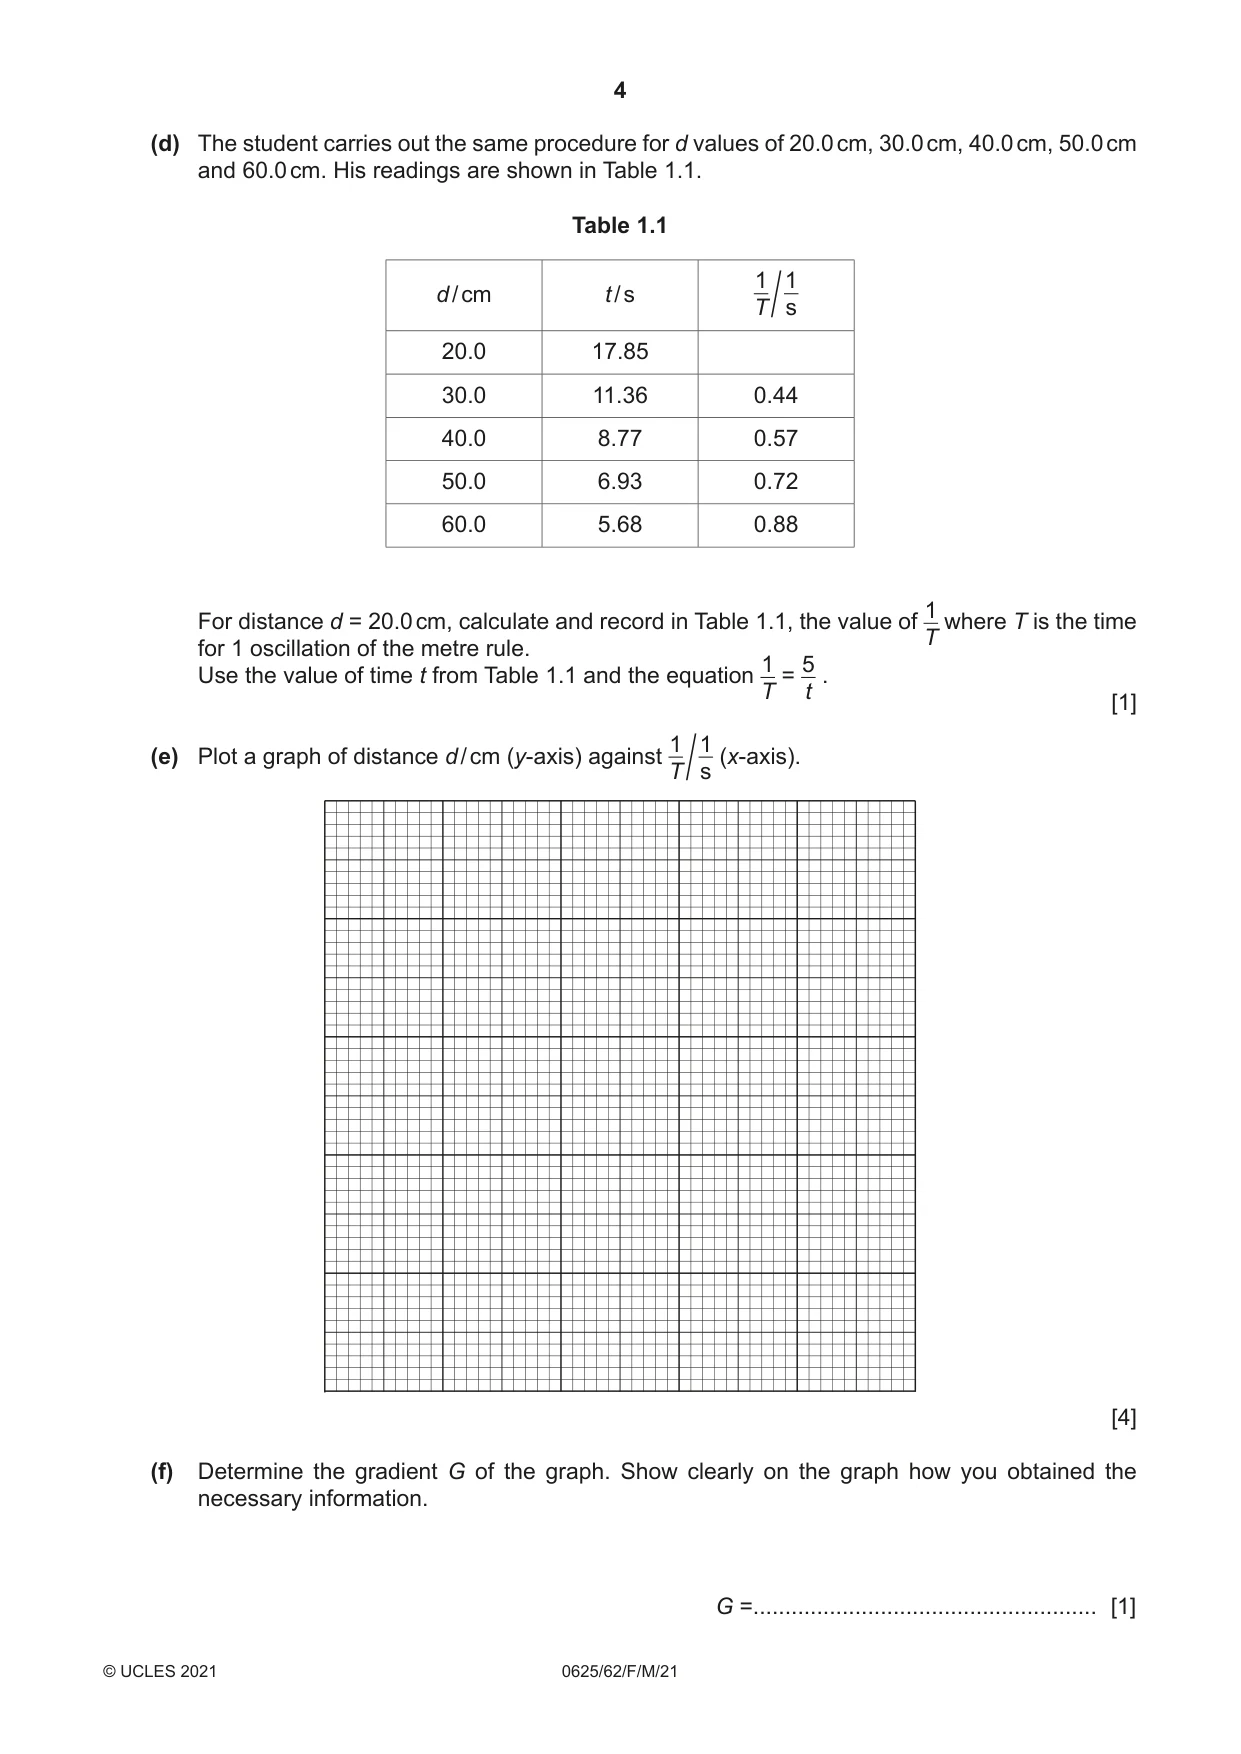
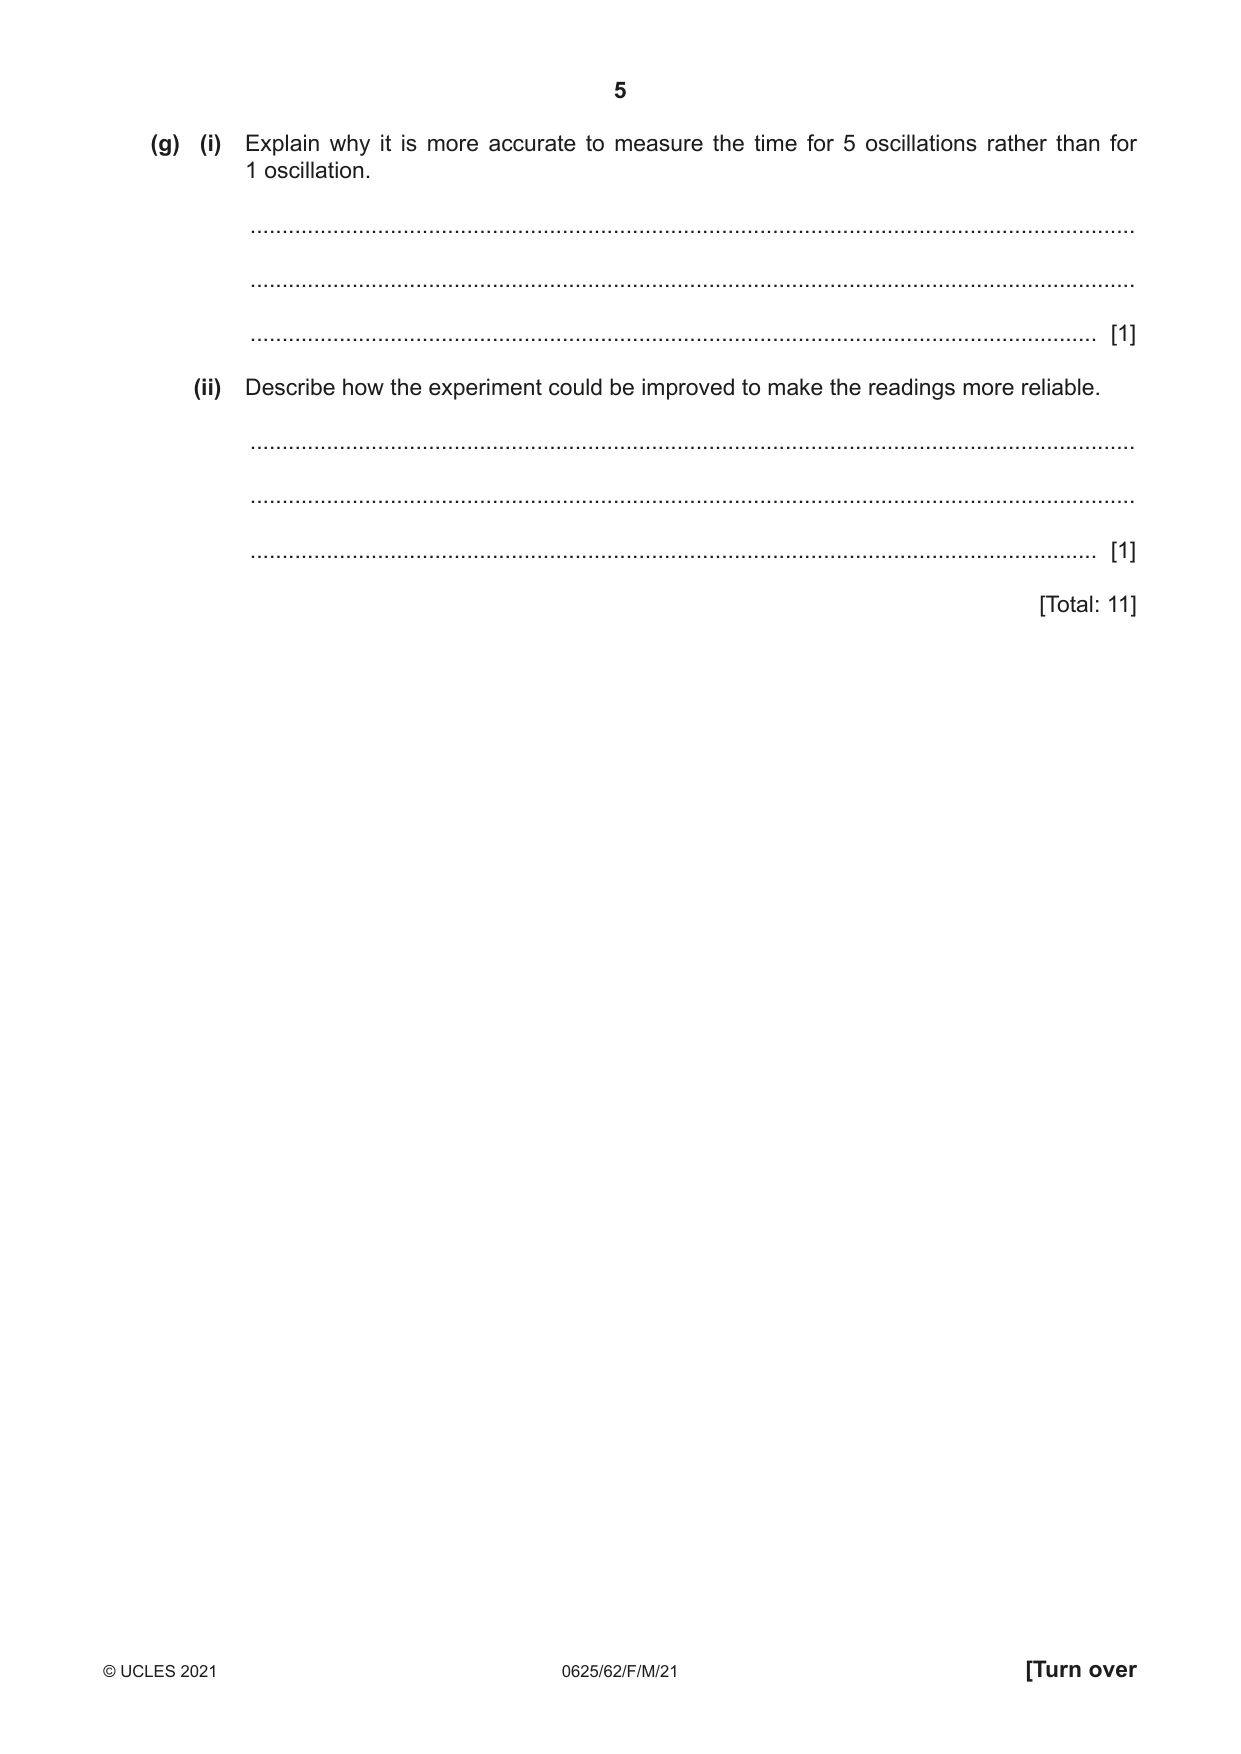
1 A student investigates the motion of an oscillating metre rule. He uses the apparatus shown in Fig. 1.1. clamps vertical threads d metre rule stands horizontal bench Fig. 1.1 (a) The student ensures that the metre rule is horizontal. Briefly describe how to check that the metre rule is horizontal. You may draw a diagram or draw on Fig. 1.1 if it helps to explain your answer. ................................................................................................................................................... ................................................................................................................................................... ............................................................................................................................................. [1] (b) The student moves the stands so that the vertical threads are at the marks on the metre rule shown in Fig. 1.2. vertical threads 1 2 3 96 97 98 99 Fig. 1.2 Calculate the distance d between the threads. d =................................................. cm [1] (c) He twists the metre rule a small amount, as shown in Fig. 1.3, and then lets it go so that it oscillates in a rotating motion. metre rule seen from above one oscillation twist Fig. 1.3 He measures the time t for 5 complete oscillations of the metre rule. 3.63 t =..........................................................s Suggest why it is useful to take a trial reading for this experiment. ................................................................................................................................................... ............................................................................................................................................. [1] (d) The student carries out the same procedure for d values of 20.0 cm, 30.0 cm, 40.0 cm, 50.0 cm and 60.0 cm. His readings are shown in Table 1.1. Table 1.1 1 1 d / cm t / s T s / 20.0 17.85 30.0 11.36 0.44 40.0 8.77 0.57 50.0 6.93 0.72 60.0 5.68 0.88 1 For distance d = 20.0 cm, calculate and record in Table 1.1, the value of where T is the time T for 1 oscillation of the metre rule. 1 5 Use the value of time t from Table 1.1 and the equation = . T t [1] 1 1(e) Plot a graph of distance d / cm (y-axis) against (x-axis). T s / [4] (f) Determine the gradient G of the graph. Show clearly on the graph how you obtained the necessary information. G =...................................................... [1] (g) (i) Explain why it is more accurate to measure the time for 5 oscillations rather than for 1 oscillation. ........................................................................................................................................... ........................................................................................................................................... ..................................................................................................................................... [1] (ii) Describe how the experiment could be improved to make the readings more reliable. ........................................................................................................................................... ........................................................................................................................................... ..................................................................................................................................... [1] [Total: 11]
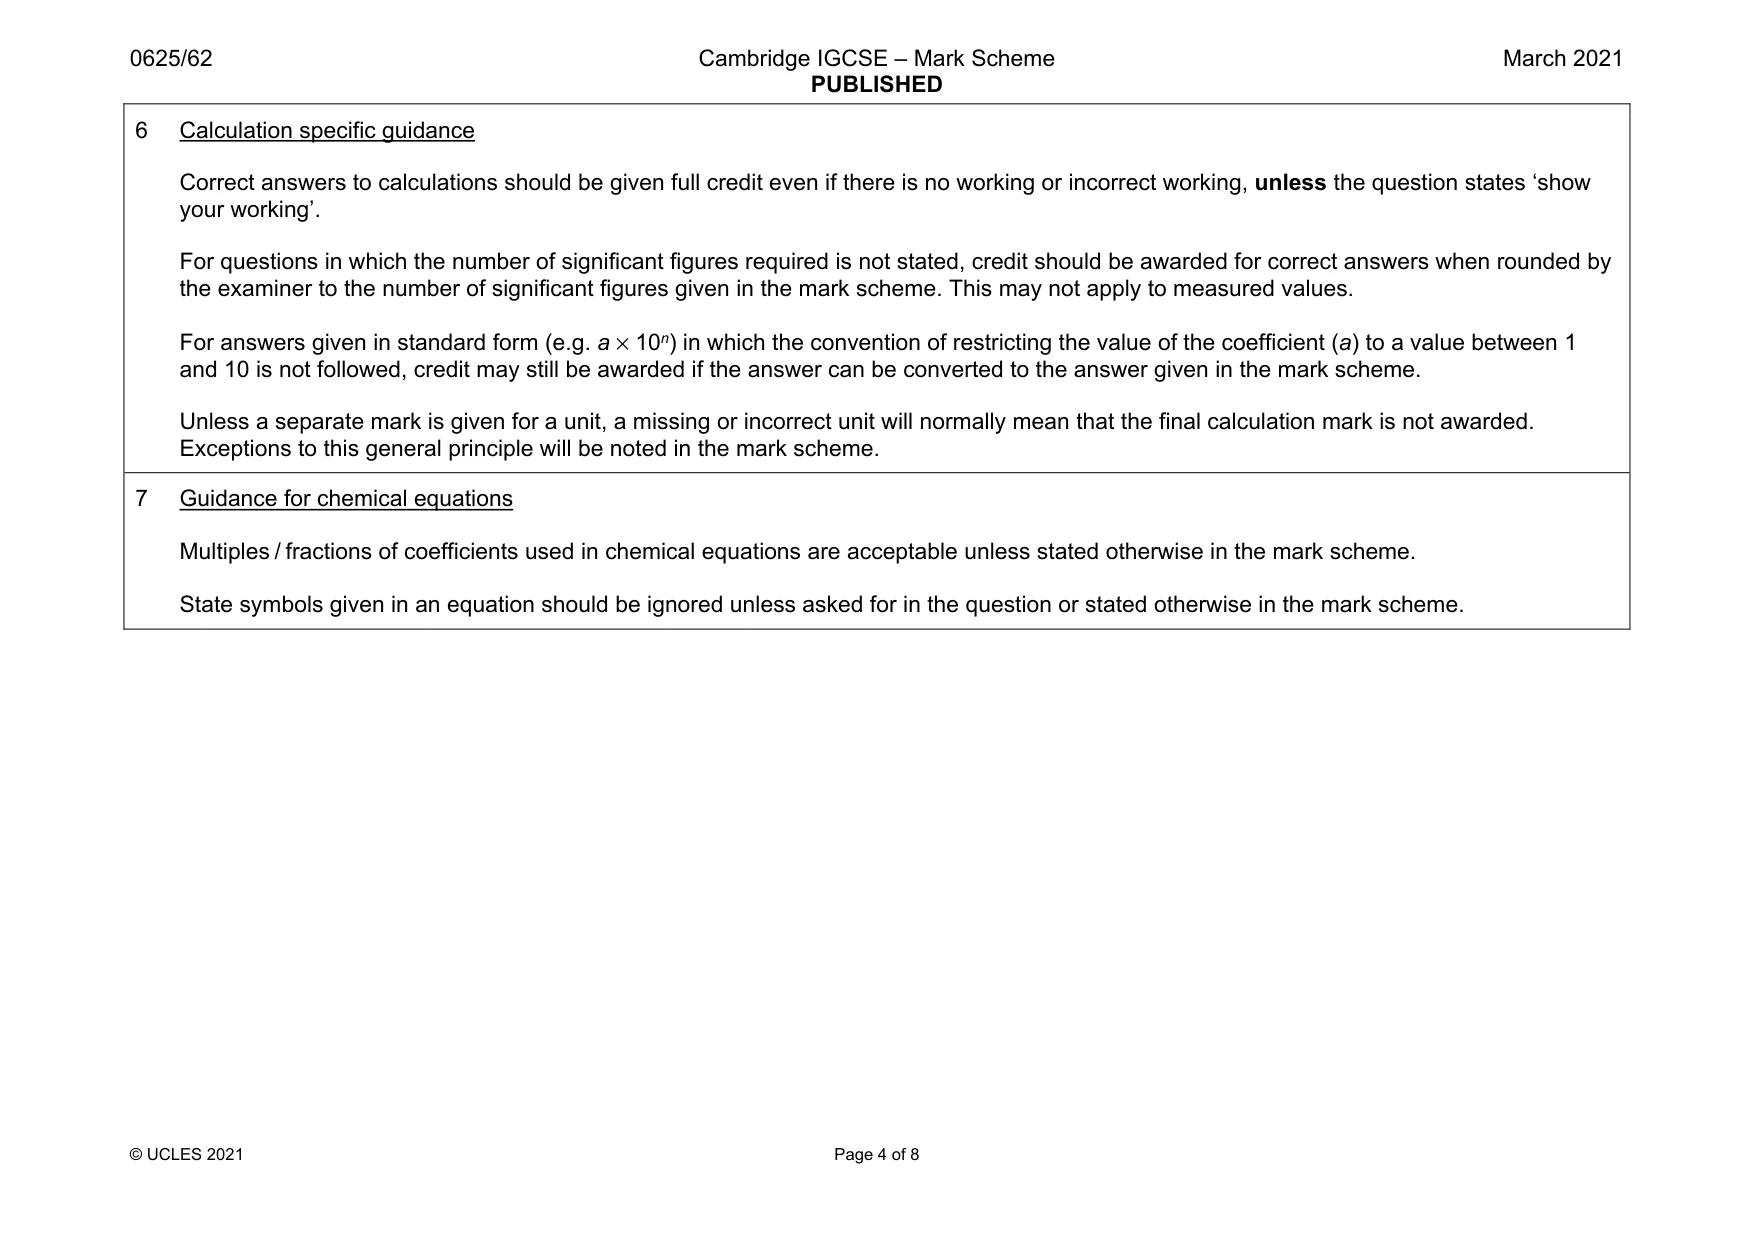
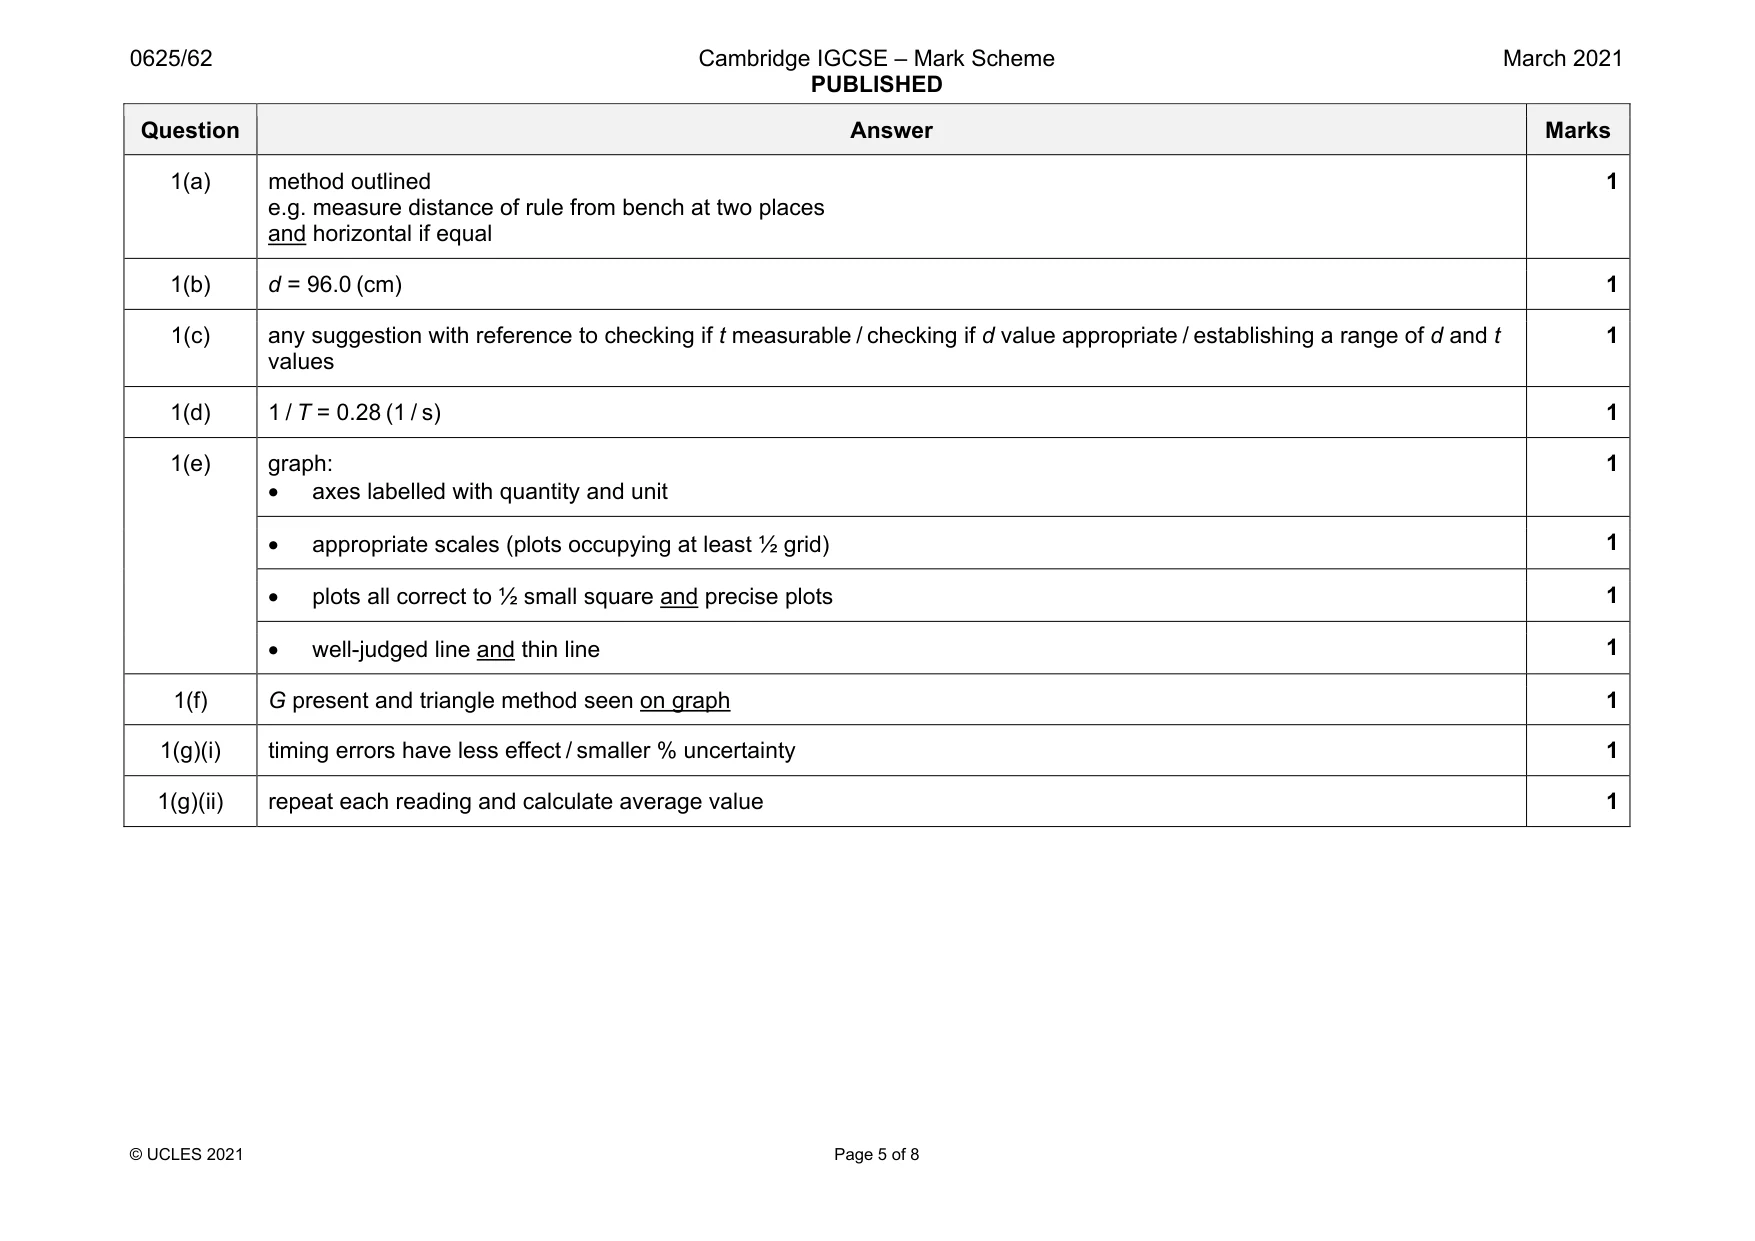
Mark scheme: 1(a) method outlined e.g. measure distance of rule from bench at two places and horizontal if equal 1 1(b) d = 96.0 (cm) 1 1(c) any suggestion with reference to checking if t measurable / checking if d value appropriate / establishing a range of d and t values 1 1(d) 1 / T = 0.28 (1 / s) 1 1(e) graph: • axes labelled with quantity and unit 1 • appropriate scales (plots occupying at least ½ grid) 1 • plots all correct to ½ small square and precise plots 1 • well-judged line and thin line 1 1(f) G present and triangle method seen on graph 1 1(g)(i) timing errors have less effect / smaller % uncertainty 1 1(g)(ii) repeat each reading and calculate average value 1
More questions on Physical quantities and measurement techniques
Q2 · Students investigate the cooling of hot water in two different cups
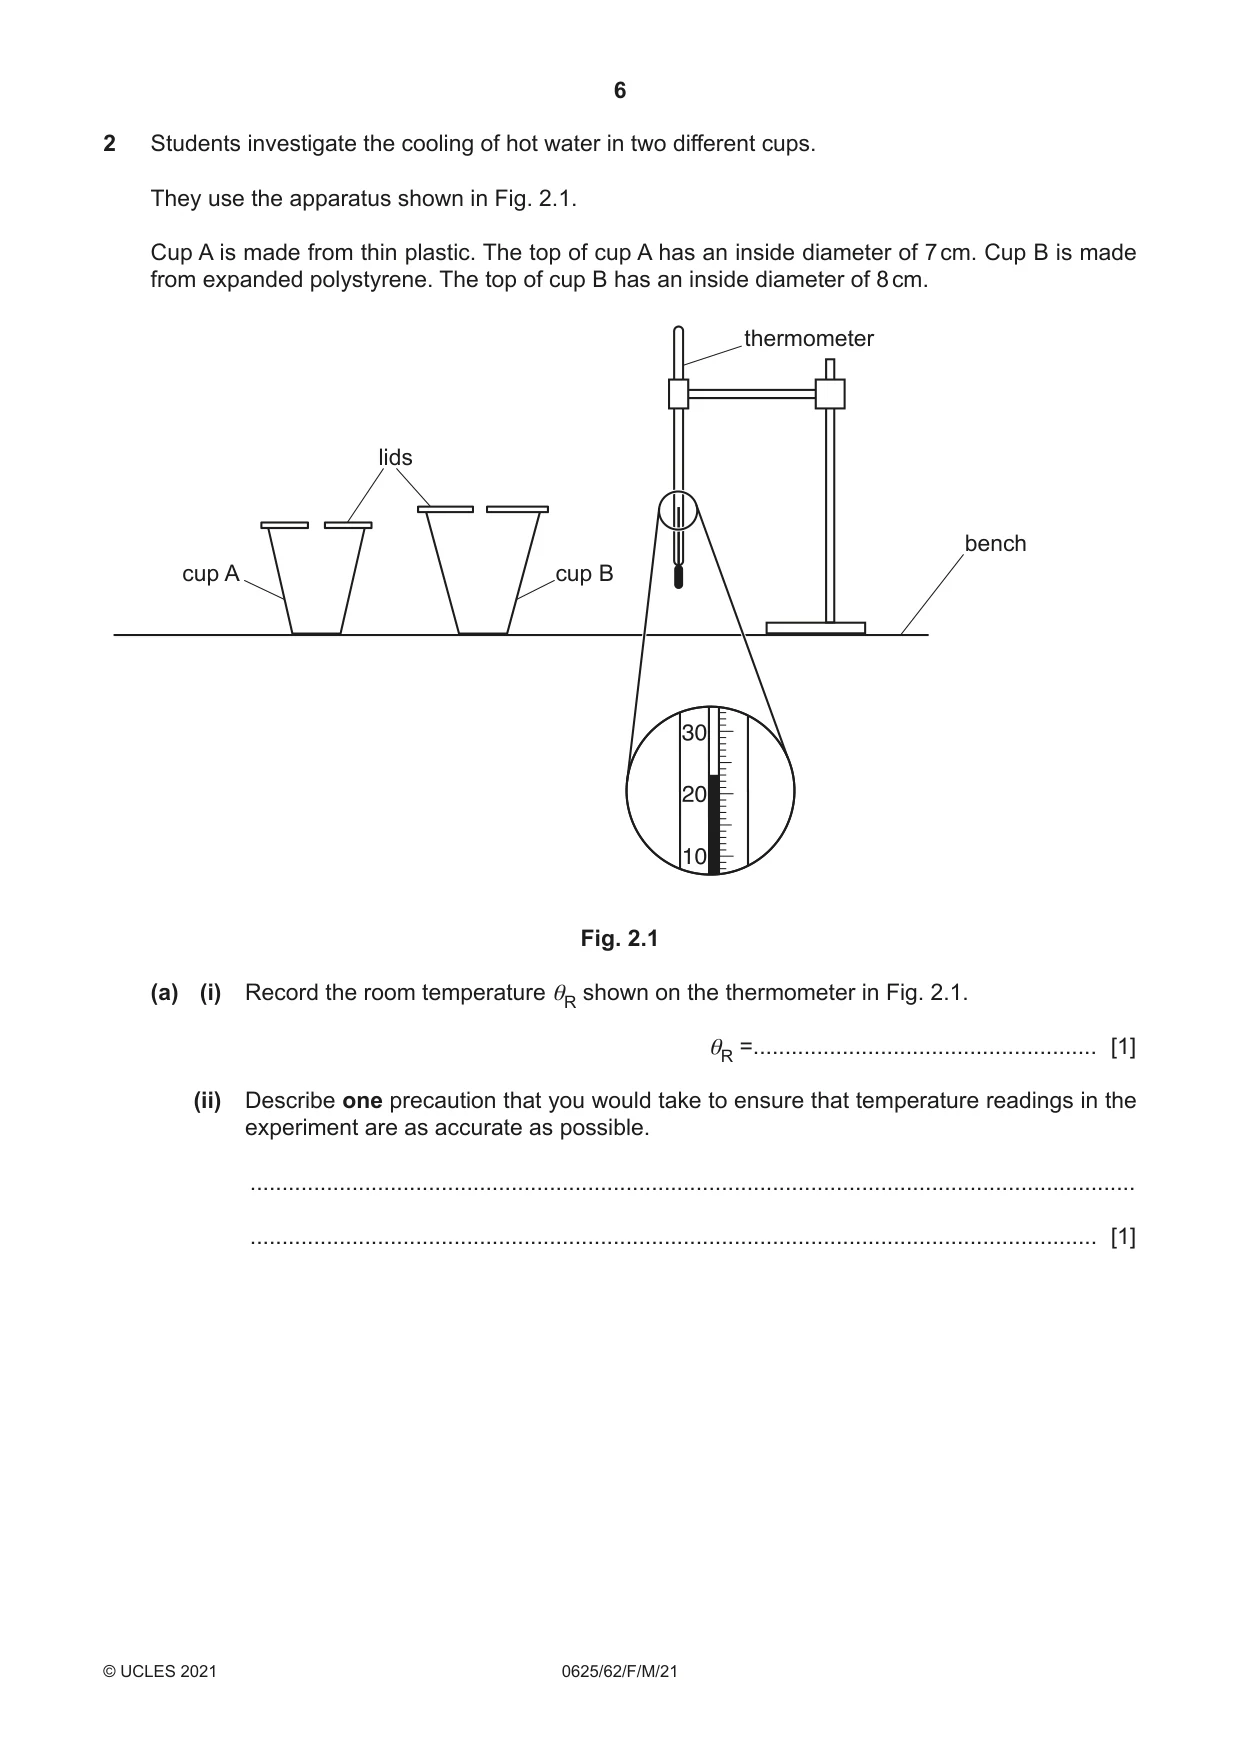
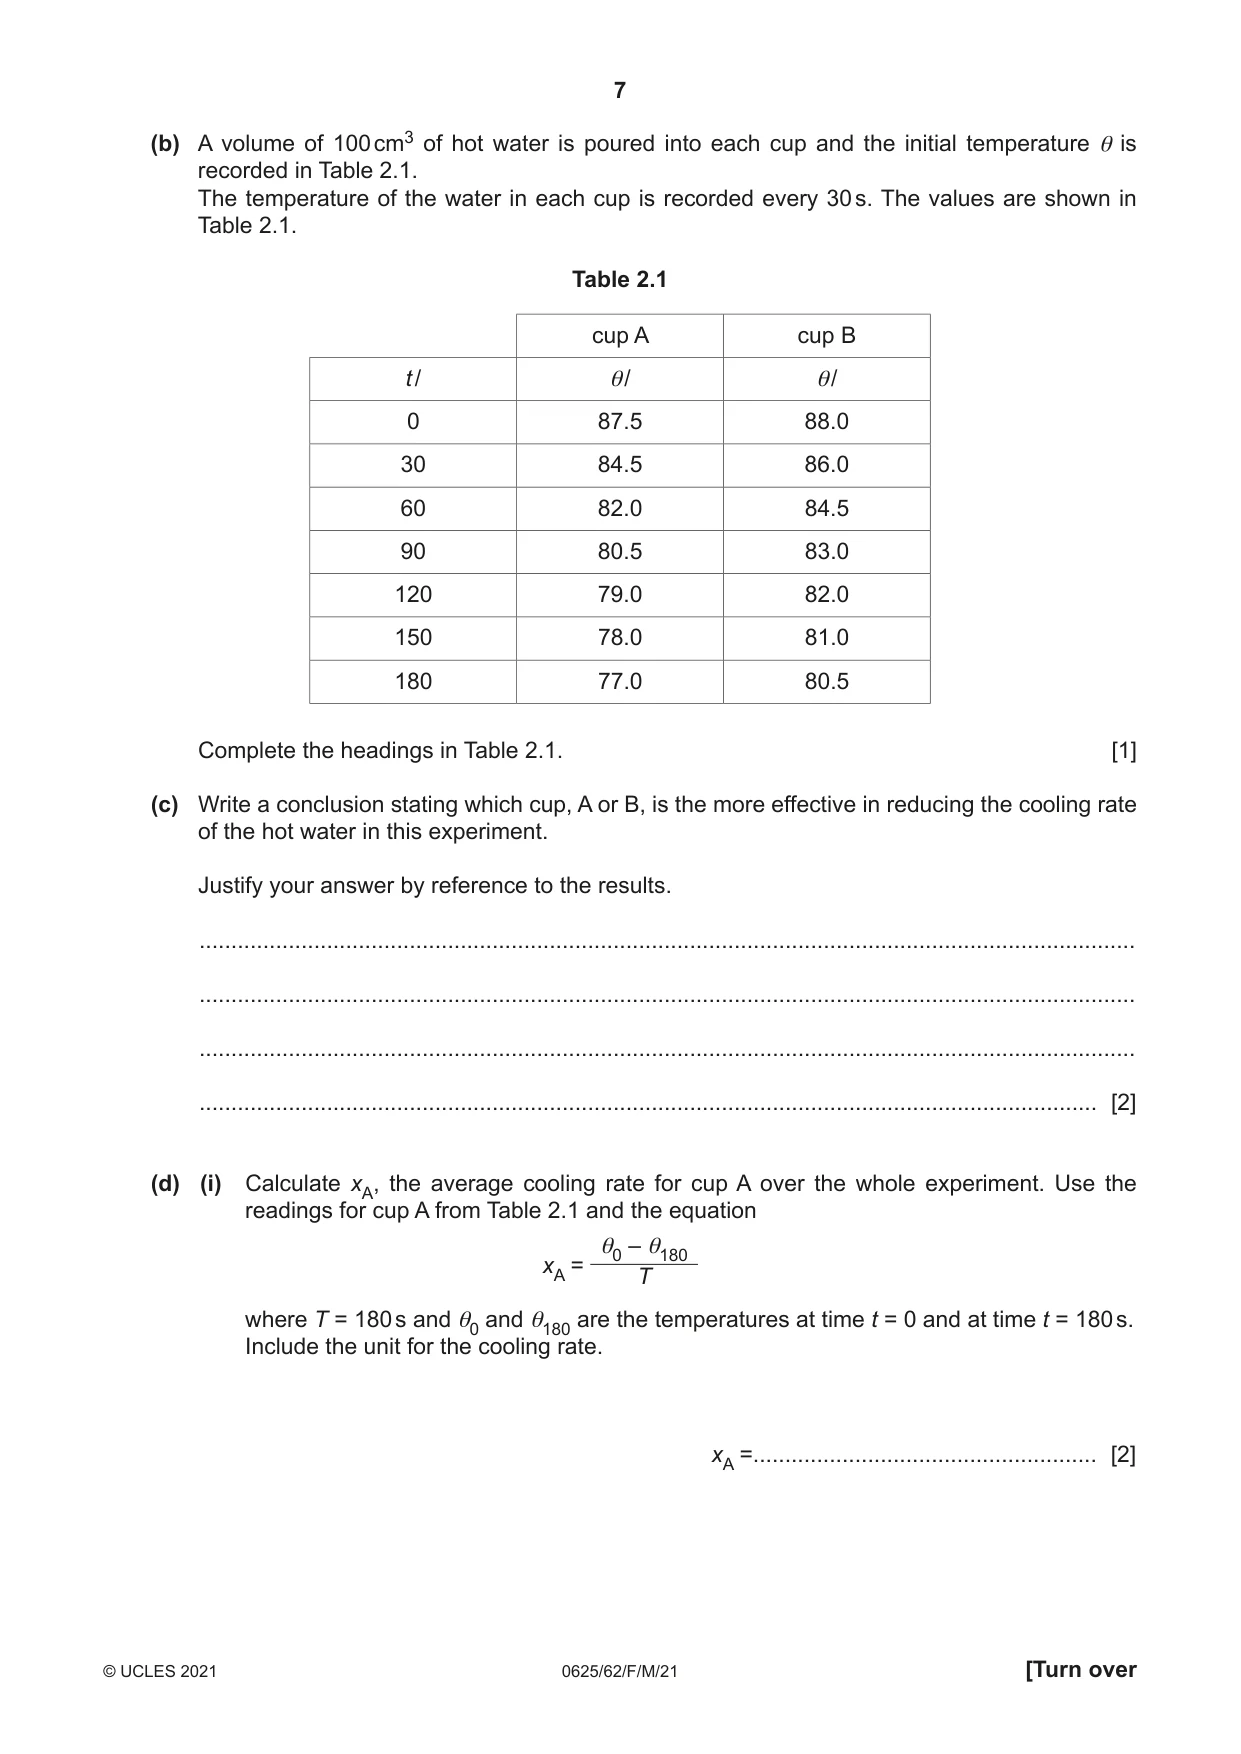
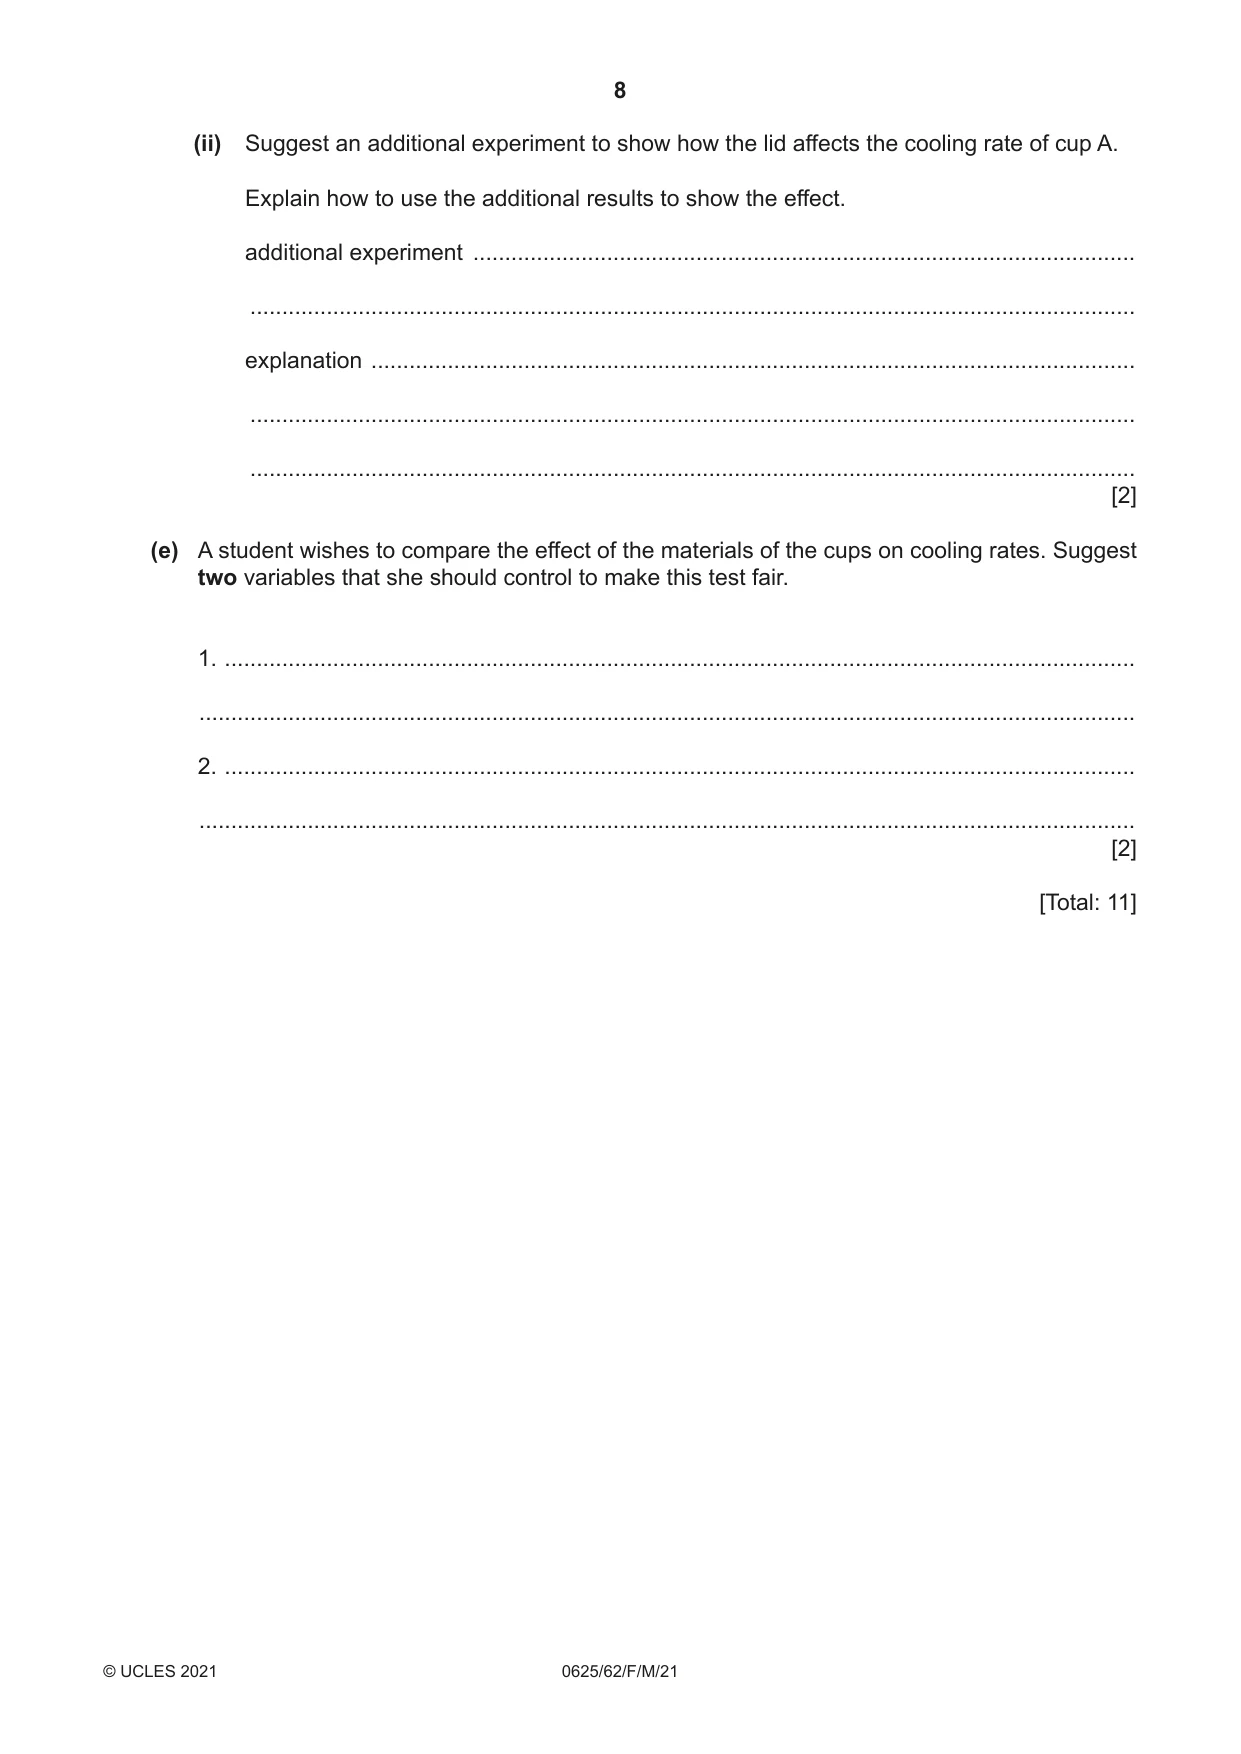
2 Students investigate the cooling of hot water in two different cups. They use the apparatus shown in Fig. 2.1. Cup A is made from thin plastic. The top of cup A has an inside diameter of 7 cm. Cup B is made from expanded polystyrene. The top of cup B has an inside diameter of 8 cm. thermometer lids bench cup A cup B 30 20 10 Fig. 2.1 (a) (i) Record the room temperature θR shown on the thermometer in Fig. 2.1. θR =...................................................... [1] (ii) Describe one precaution that you would take to ensure that temperature readings in the experiment are as accurate as possible. ........................................................................................................................................... ..................................................................................................................................... [1] (b) A volume of 100 cm3 of hot water is poured into each cup and the initial temperature θ is recorded in Table 2.1. The temperature of the water in each cup is recorded every 30 s. The values are shown in Table 2.1. Table 2.1 cup A cup B t / θ/ θ/ 0 87.5 88.0 30 84.5 86.0 60 82.0 84.5 90 80.5 83.0 120 79.0 82.0 150 78.0 81.0 180 77.0 80.5 Complete the headings in Table 2.1. [1] (c) Write a conclusion stating which cup, A or B, is the more effective in reducing the cooling rate of the hot water in this experiment. Justify your answer by reference to the results. ................................................................................................................................................... ................................................................................................................................................... ................................................................................................................................................... ............................................................................................................................................. [2] (d) (i) Calculate xA, the average cooling rate for cup A over the whole experiment. Use the readings for cup A from Table 2.1 and the equation θ0 – θ180 xA = T where T = 180 s and θ0 and θ180 are the temperatures at time t = 0 and at time t = 180 s. Include the unit for the cooling rate. xA =...................................................... [2] (ii) Suggest an additional experiment to show how the lid affects the cooling rate of cup A. Explain how to use the additional results to show the effect. additional experiment ........................................................................................................ ........................................................................................................................................... explanation ........................................................................................................................ ........................................................................................................................................... ........................................................................................................................................... [2] (e) A student wishes to compare the effect of the materials of the cups on cooling rates. Suggest two variables that she should control to make this test fair. 1. ............................................................................................................................................... ................................................................................................................................................... 2. ............................................................................................................................................... ................................................................................................................................................... [2] [Total: 11]
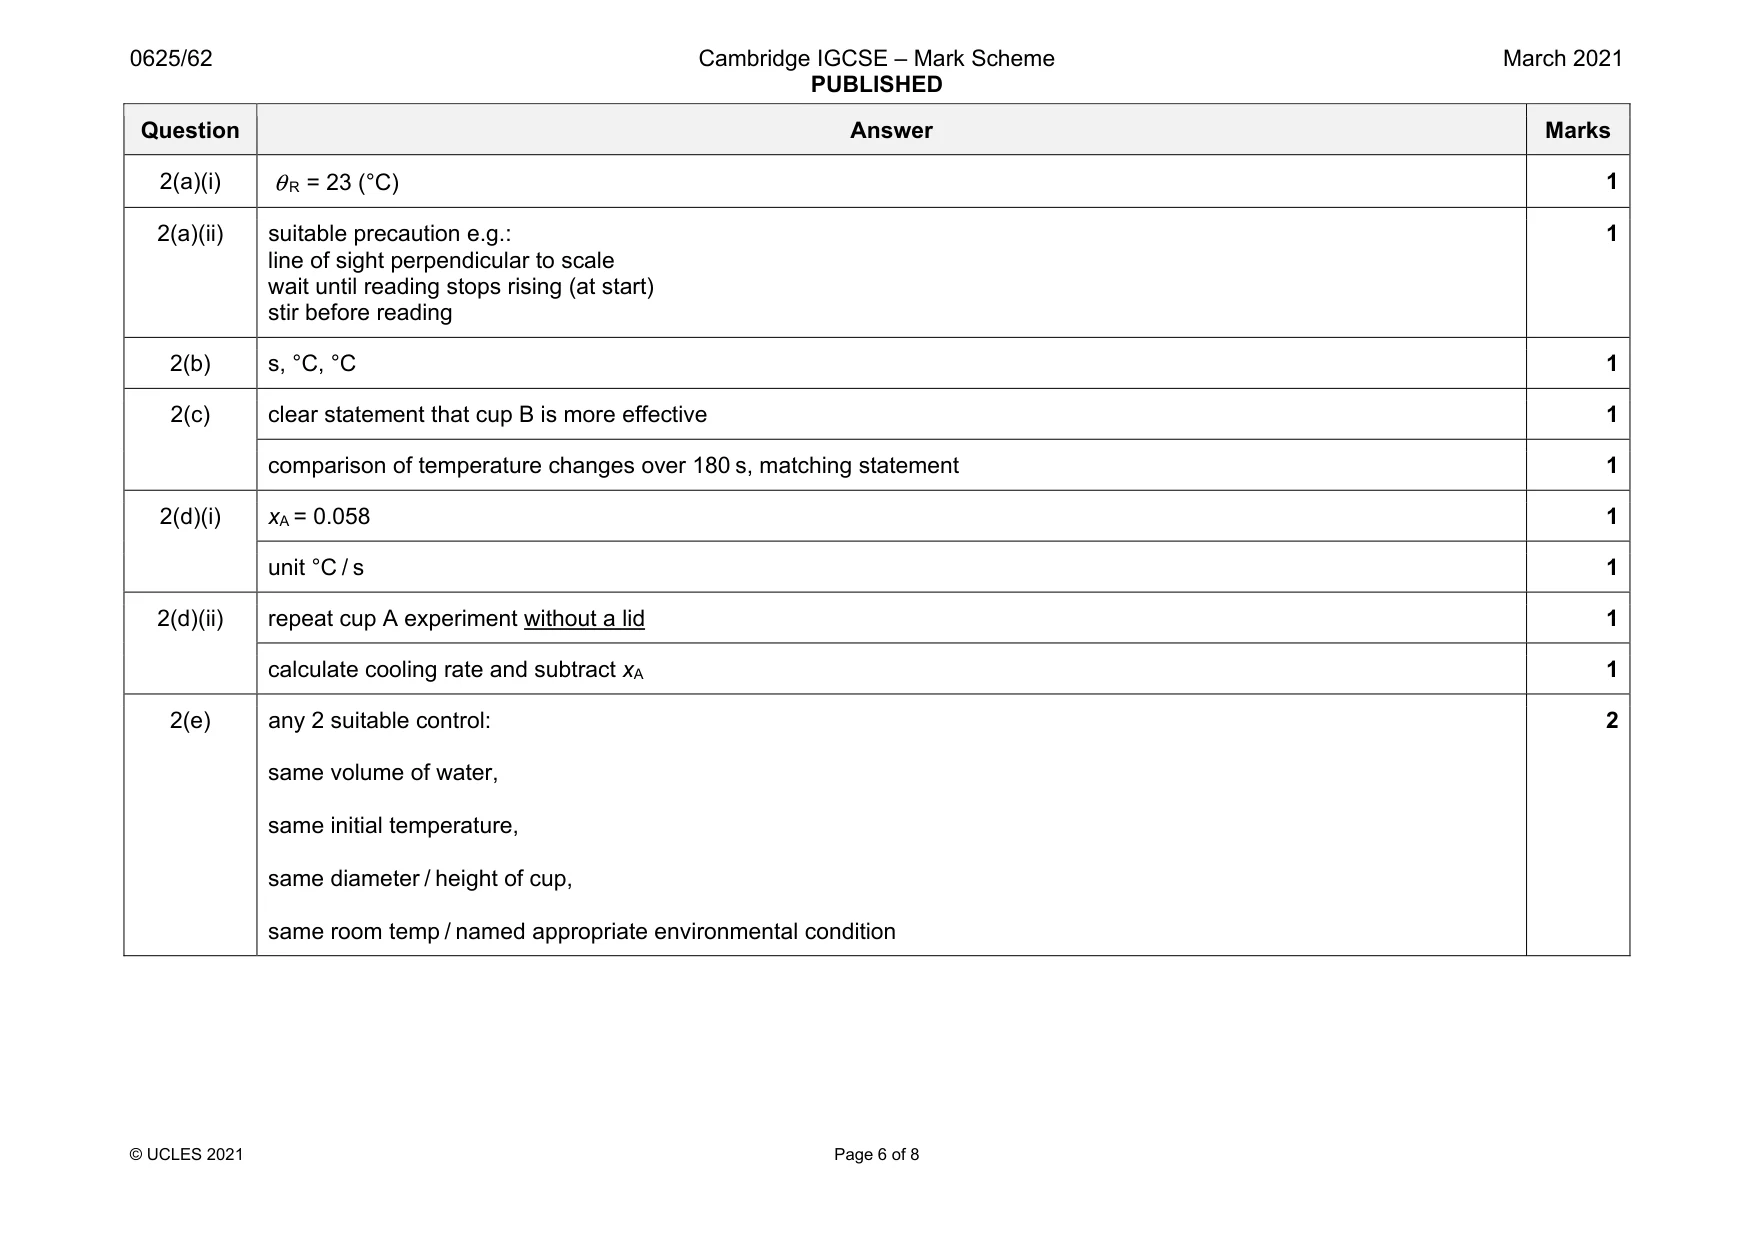
Mark scheme: 2(a)(i) θ R = 23 (°C) 1 2(a)(ii) suitable precaution e.g.: line of sight perpendicular to scale wait until reading stops rising (at start) stir before reading 1 2(b) s, °C, °C 1 2(c) clear statement that cup B is more effective 1 comparison of temperature changes over 180 s, matching statement 1 2(d)(i) xA = 0.058 1 unit °C / s 1 2(d)(ii) repeat cup A experiment without a lid 1 calculate cooling rate and subtract xA 1 2(e) any 2 suitable control: same volume of water, same initial temperature, same diameter / height of cup, same room temp / named appropriate environmental condition 2
Q3 · A student investigates a resistor and a lamp connected in series
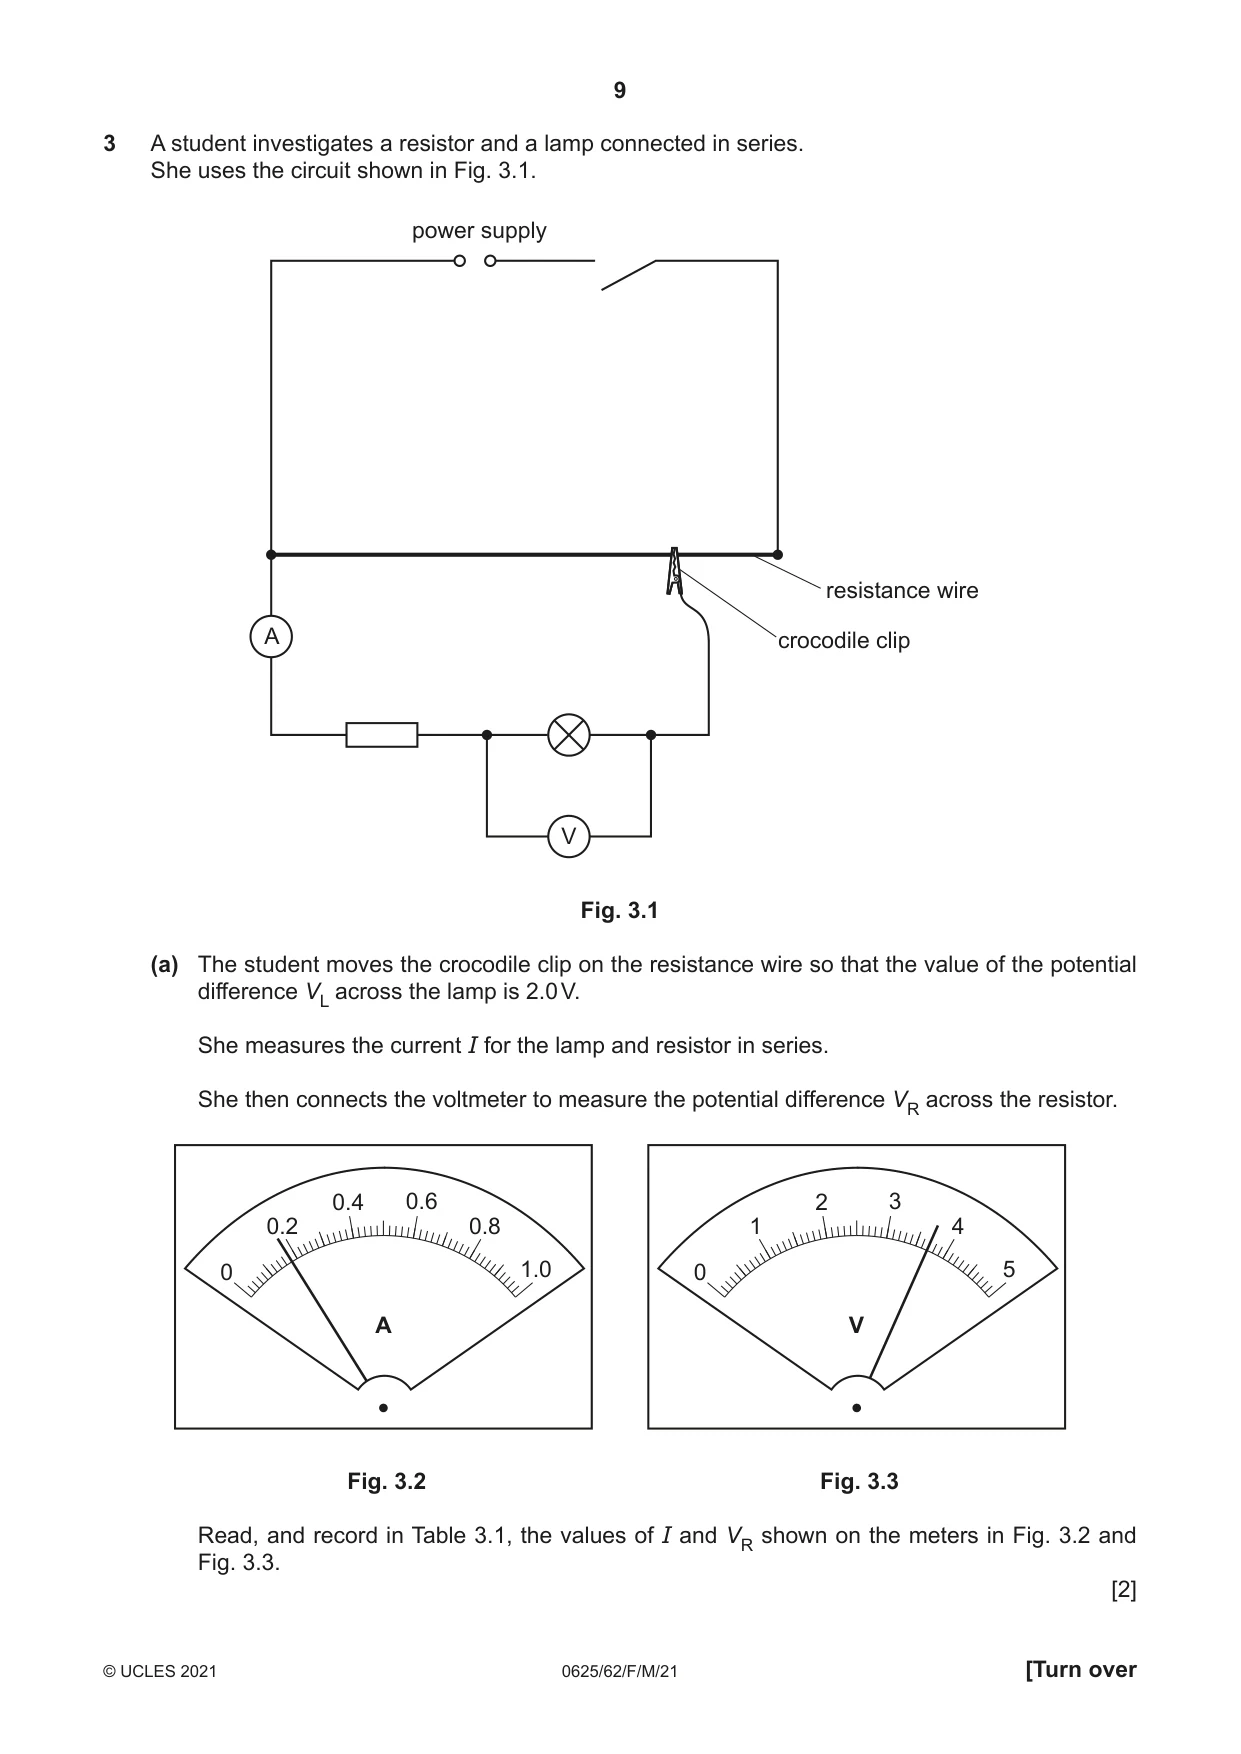
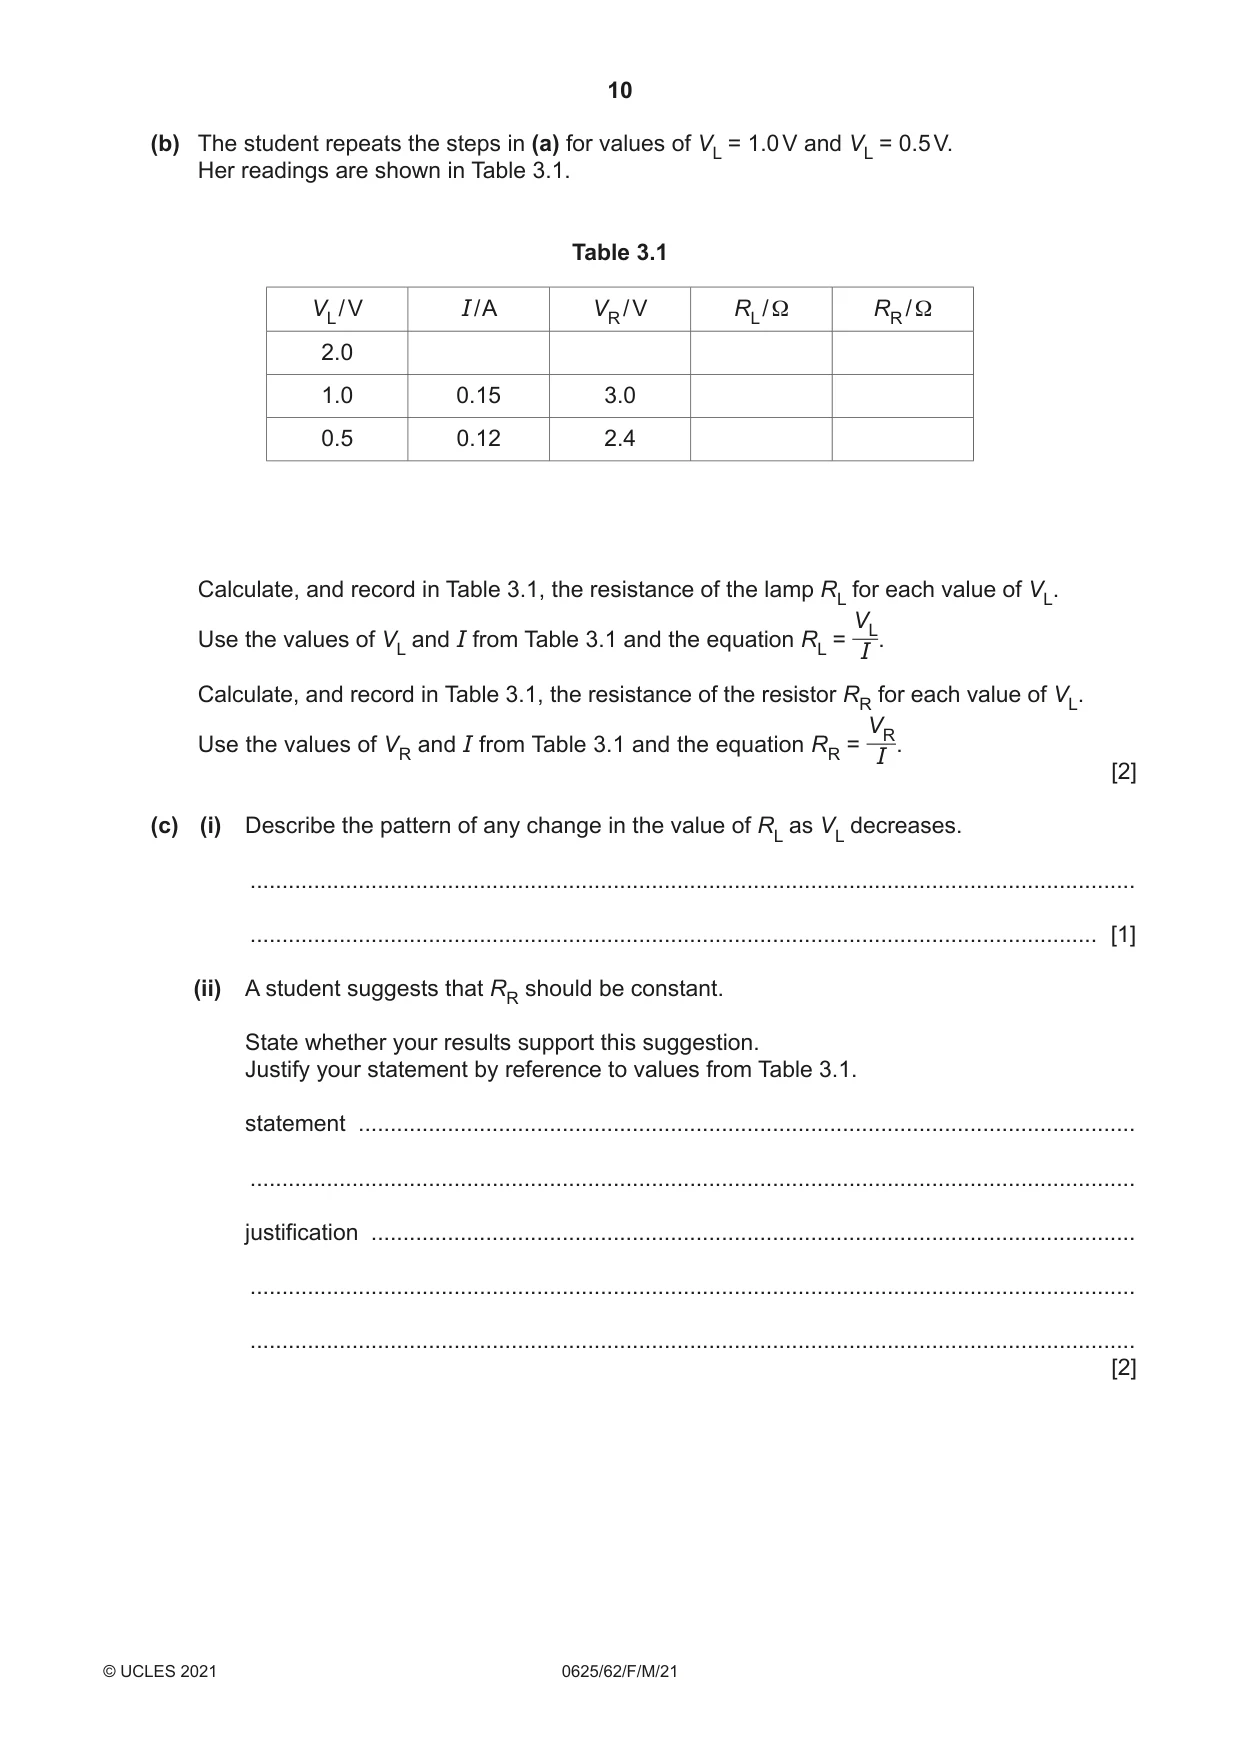
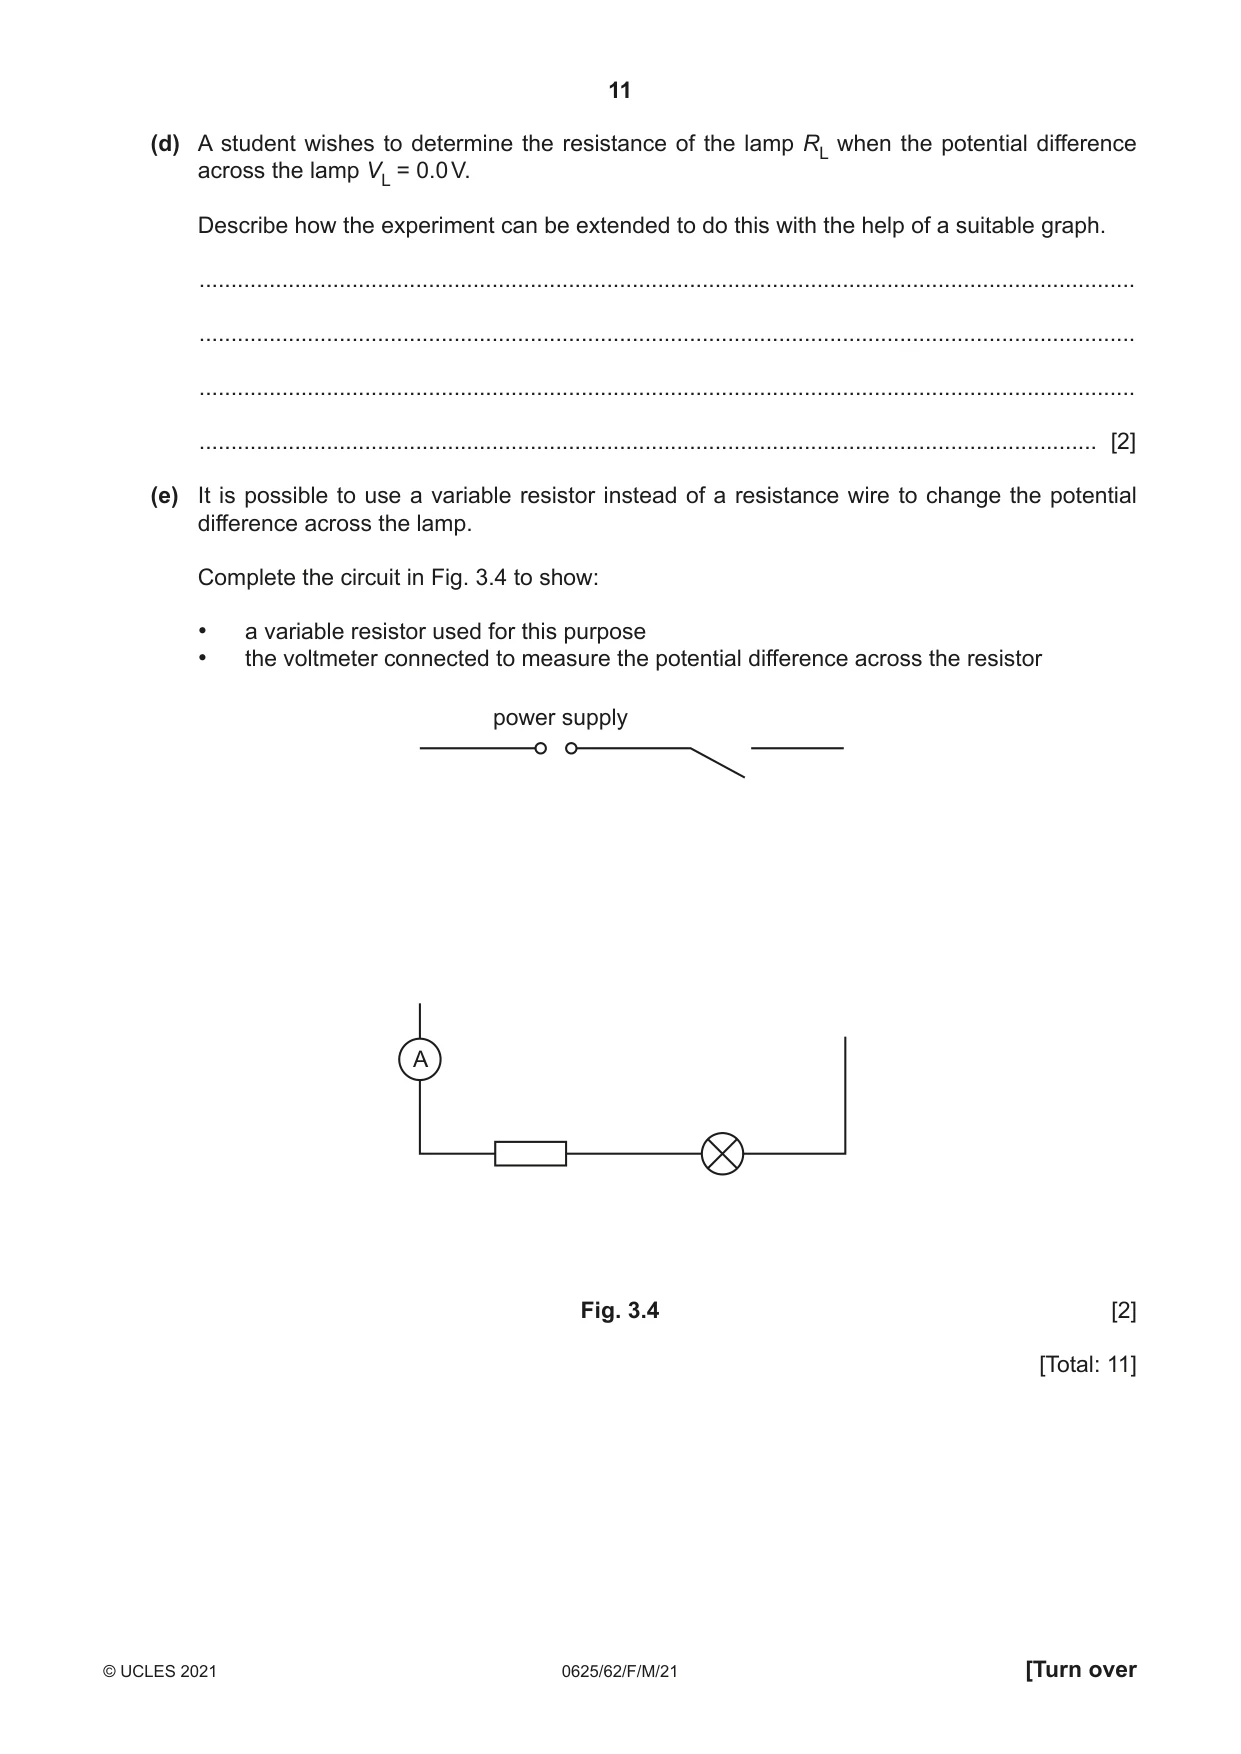
3 A student investigates a resistor and a lamp connected in series. She uses the circuit shown in Fig. 3.1. power supply resistance wire A crocodile clip V Fig. 3.1 (a) The student moves the crocodile clip on the resistance wire so that the value of the potential difference VL across the lamp is 2.0 V. She measures the current I for the lamp and resistor in series. She then connects the voltmeter to measure the potential difference VR across the resistor. 0.4 0.6 2 3 0.2 0.8 1 4 0 1.0 0 5 A V Fig. 3.2 Fig. 3.3 Read, and record in Table 3.1, the values of I and VR shown on the meters in Fig. 3.2 and Fig. 3.3. [2] (b) The student repeats the steps in (a) for values of VL = 1.0 V and VL = 0.5 V. Her readings are shown in Table 3.1. Table 3.1 VL / V I / A VR / V RL / Ω RR / Ω 2.0 1.0 0.15 3.0 0.5 0.12 2.4 Calculate, and record in Table 3.1, the resistance of the lamp RL for each value of VL. VL Use the values of VL and I from Table 3.1 and the equation RL = I . Calculate, and record in Table 3.1, the resistance of the resistor RR for each value of VL. VR Use the values of VR and I from Table 3.1 and the equation RR = I . [2] (c) (i) Describe the pattern of any change in the value of RL as VL decreases. ........................................................................................................................................... ..................................................................................................................................... [1] (ii) A student suggests that RR should be constant. State whether your results support this suggestion. Justify your statement by reference to values from Table 3.1. statement .......................................................................................................................... ........................................................................................................................................... justification ........................................................................................................................ ........................................................................................................................................... ........................................................................................................................................... [2] (d) A student wishes to determine the resistance of the lamp RL when the potential difference across the lamp VL = 0.0 V. Describe how the experiment can be extended to do this with the help of a suitable graph. ................................................................................................................................................... ................................................................................................................................................... ................................................................................................................................................... ............................................................................................................................................. [2] (e) It is possible to use a variable resistor instead of a resistance wire to change the potential difference across the lamp. Complete the circuit in Fig. 3.4 to show: • a variable resistor used for this purpose • the voltmeter connected to measure the potential difference across the resistor power supply A Fig. 3.4 [2] [Total: 11]
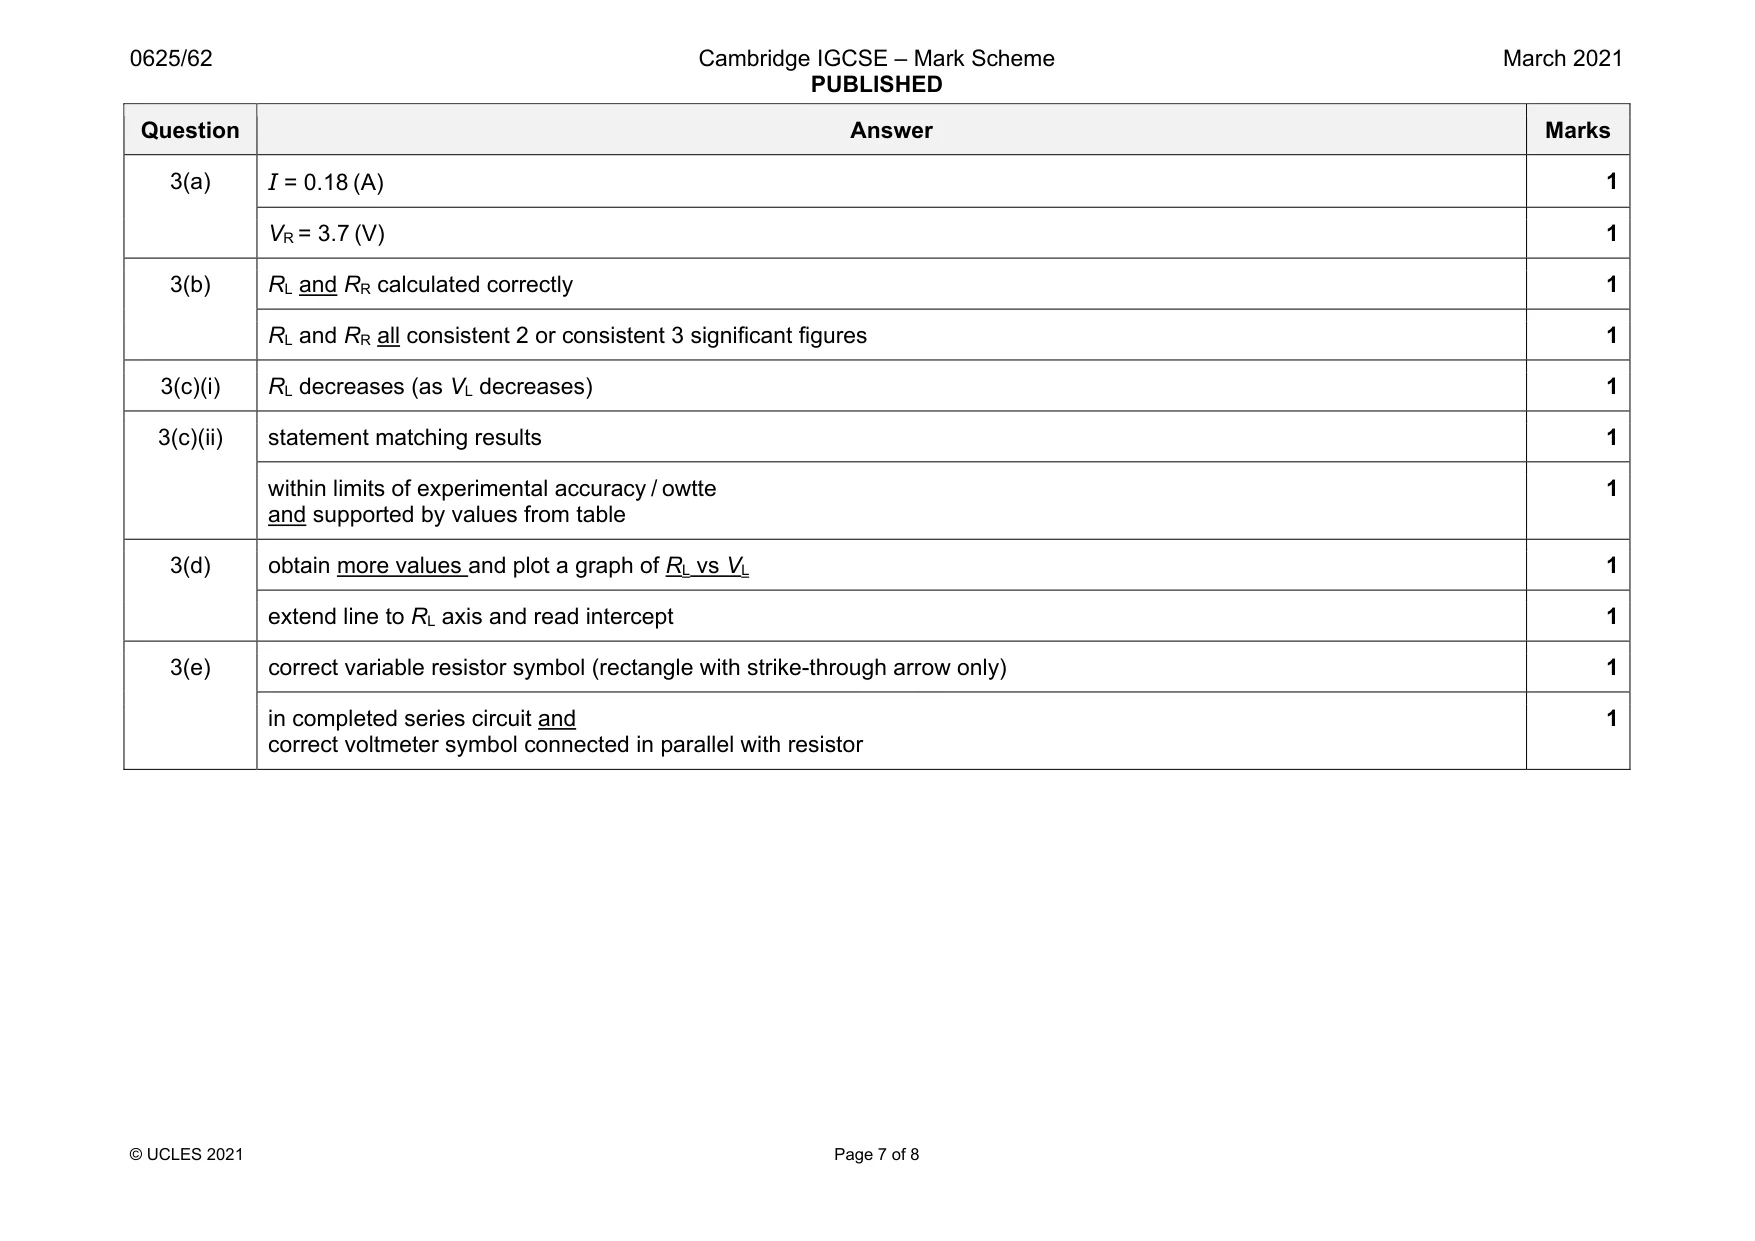
Mark scheme: 3(a) 1 VR = 3.7 (V) 1 3(b) RL and RR calculated correctly 1 RL and RR all consistent 2 or consistent 3 significant figures 1 3(c)(i) RL decreases (as VL decreases) 1 3(c)(ii) statement matching results 1 within limits of experimental accuracy / owtte and supported by values from table 1 3(d) obtain more values and plot a graph of RL vs VL 1 extend line to RL axis and read intercept 1 3(e) correct variable resistor symbol (rectangle with strike-through arrow only) 1 in completed series circuit and correct voltmeter symbol connected in parallel with resistor 1
Q4 · A student investigates the motion of a ball rolling down a slope
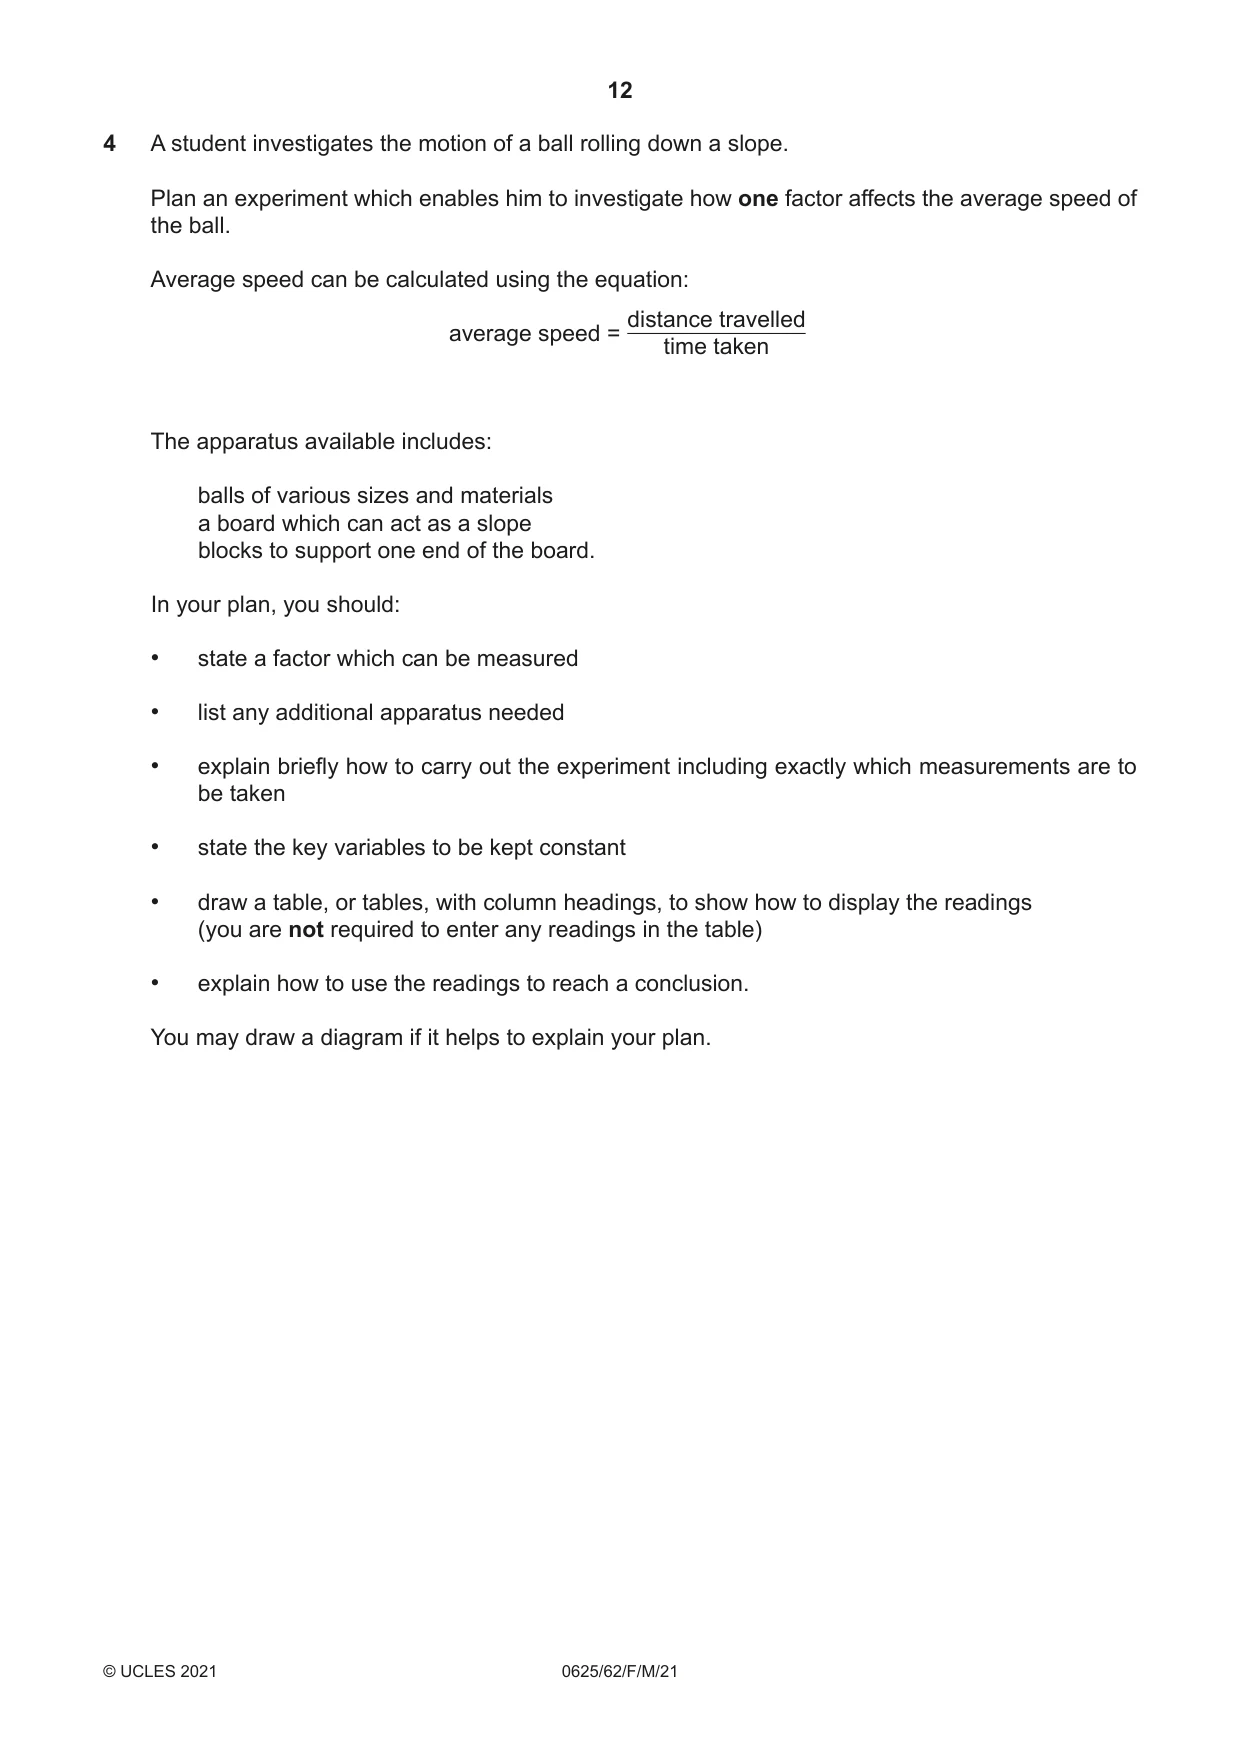
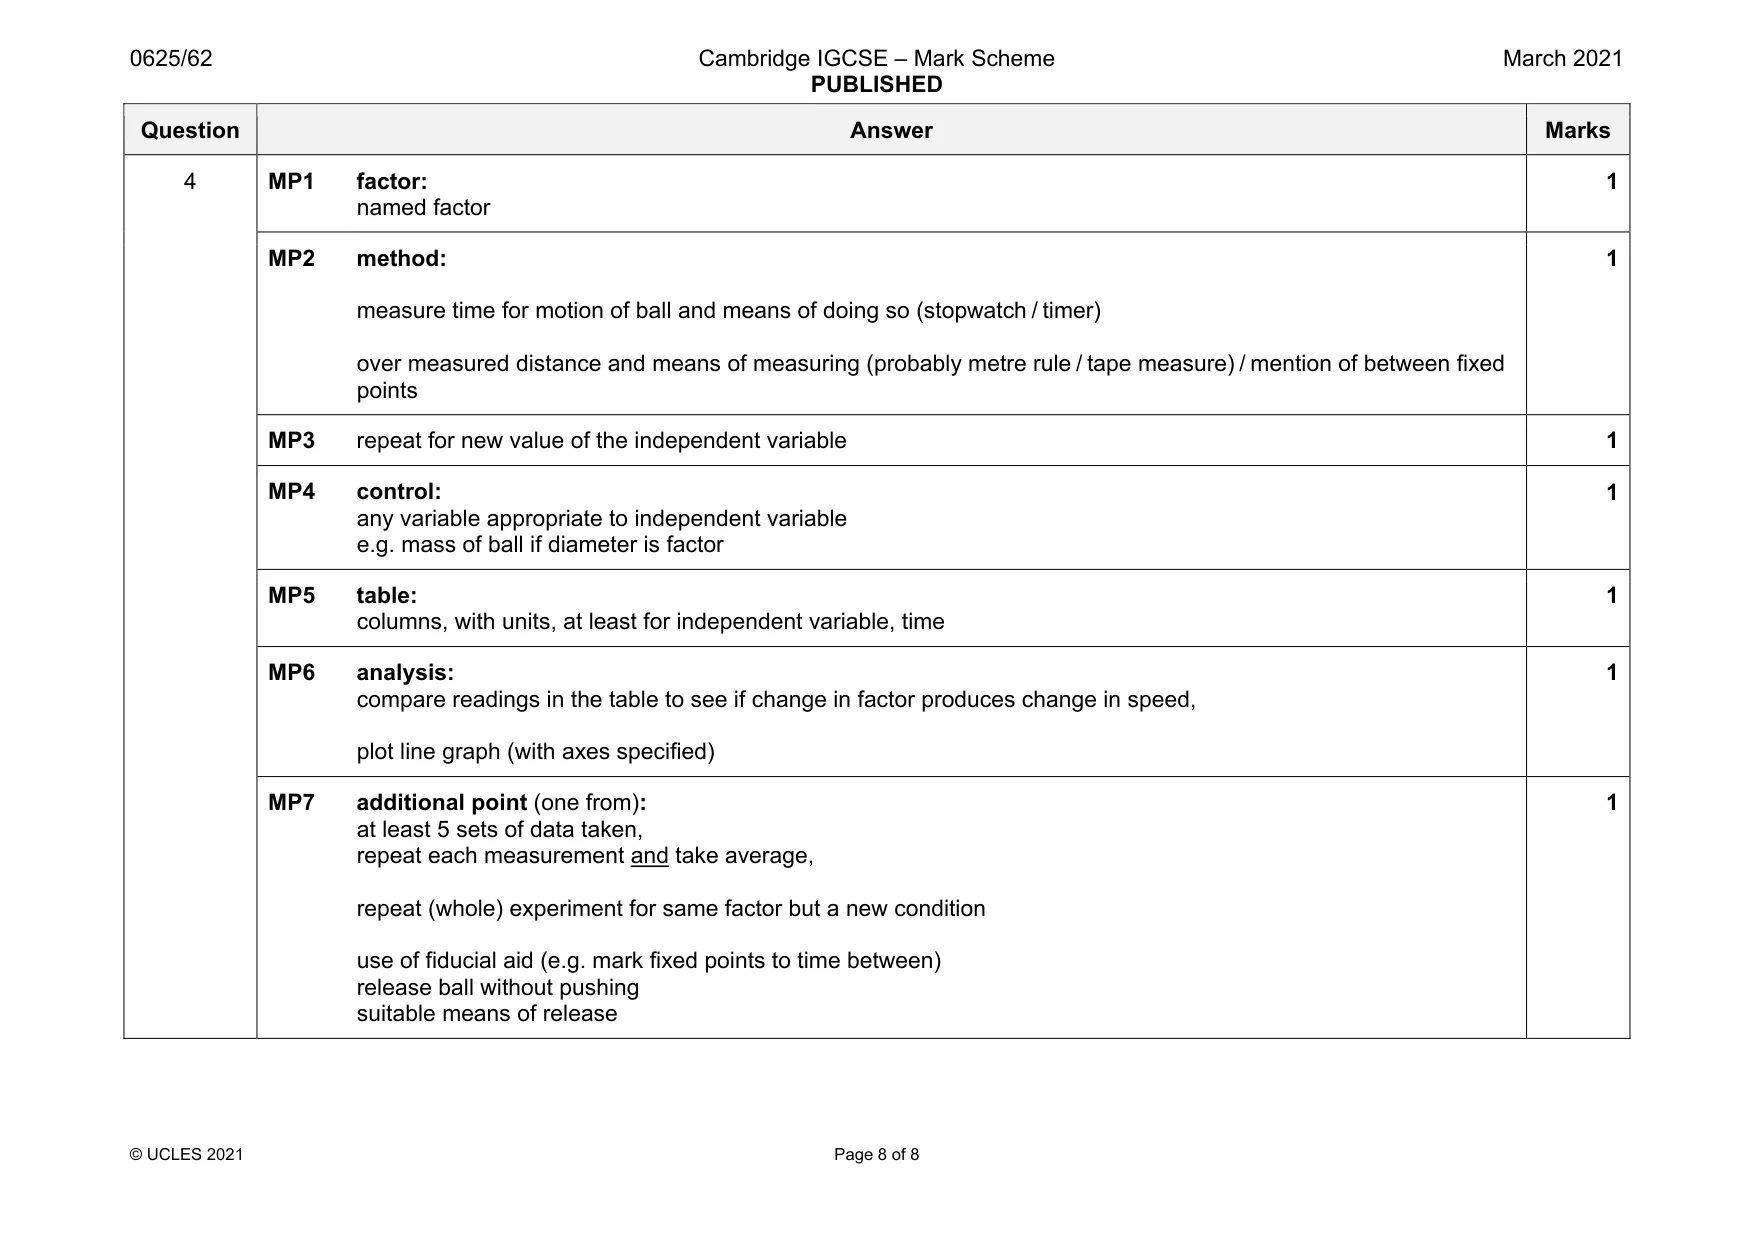
4 A student investigates the motion of a ball rolling down a slope. Plan an experiment which enables him to investigate how one factor affects the average speed of the ball. Average speed can be calculated using the equation: distance travelled average speed = time taken The apparatus available includes: balls of various sizes and materials a board which can act as a slope blocks to support one end of the board. In your plan, you should: • state a factor which can be measured • list any additional apparatus needed • explain briefly how to carry out the experiment including exactly which measurements are to be taken • state the key variables to be kept constant • draw a table, or tables, with column headings, to show how to display the readings (you are not required to enter any readings in the table) • explain how to use the readings to reach a conclusion. You may draw a diagram if it helps to explain your plan. .................................................................................................................................................................. .................................................................................................................................................................. .................................................................................................................................................................. .................................................................................................................................................................. .................................................................................................................................................................. .................................................................................................................................................................. .................................................................................................................................................................. .................................................................................................................................................................. .................................................................................................................................................................. .................................................................................................................................................................. .................................................................................................................................................................. .................................................................................................................................................................. .................................................................................................................................................................. .................................................................................................................................................................. .................................................................................................................................................................. .................................................................................................................................................................. .................................................................................................................................................................. .................................................................................................................................................................. .................................................................................................................................................................. .................................................................................................................................................................. .................................................................................................................................................................. .................................................................................................................................................................. .................................................................................................................................................................. .................................................................................................................................................................. .................................................................................................................................................................. .................................................................................................................................................................. ............................................................................................................................................................ [7]
Mark scheme: 4 MP1 factor: named factor 1 MP2 method: measure time for motion of ball and means of doing so (stopwatch / timer) over measured distance and means of measuring (probably metre rule / tape measure) / mention of between fixed points 1 MP3 repeat for new value of the independent variable 1 MP4 control: any variable appropriate to independent variable e.g. mass of ball if diameter is factor 1 MP5 table: columns, with units, at least for independent variable, time 1 MP6 analysis: compare readings in the table to see if change in factor produces change in speed, plot line graph (with axes specified) 1 MP7 additional point (one from): at least 5 sets of data taken, repeat each measurement and take average, repeat (whole) experiment for same factor but a new condition use of fiducial aid (e.g. mark fixed points to time between) release ball without pushing suitable means of release 1
What was in this paper
The subtopics covered by these 4 questions, and how many questions each got. Open one in a new tab to see every Cambridge question on it.
What you needed in this session
Cambridge’s own grade thresholds for 2021 Feb/March, Paper 6 · Variant 2. A higher threshold means an easier paper — the bar moves with how the cohort did.