Cambridge IGCSE Physics 0625 — 2020 Feb/March Paper 6 · Variant 2
0625/62/F/M/20 · 4 questions · 40 marks · ≈45 min
The question paper and its mark scheme, free to read here and free to download. This is Cambridge’s own paper, exactly as it was sat.
Question paper16 pages
Mark scheme10 pages
Answers below. Sit the paper first if you are practising.
Questions as text
Q1 · A student is determining the density of wood by two methods
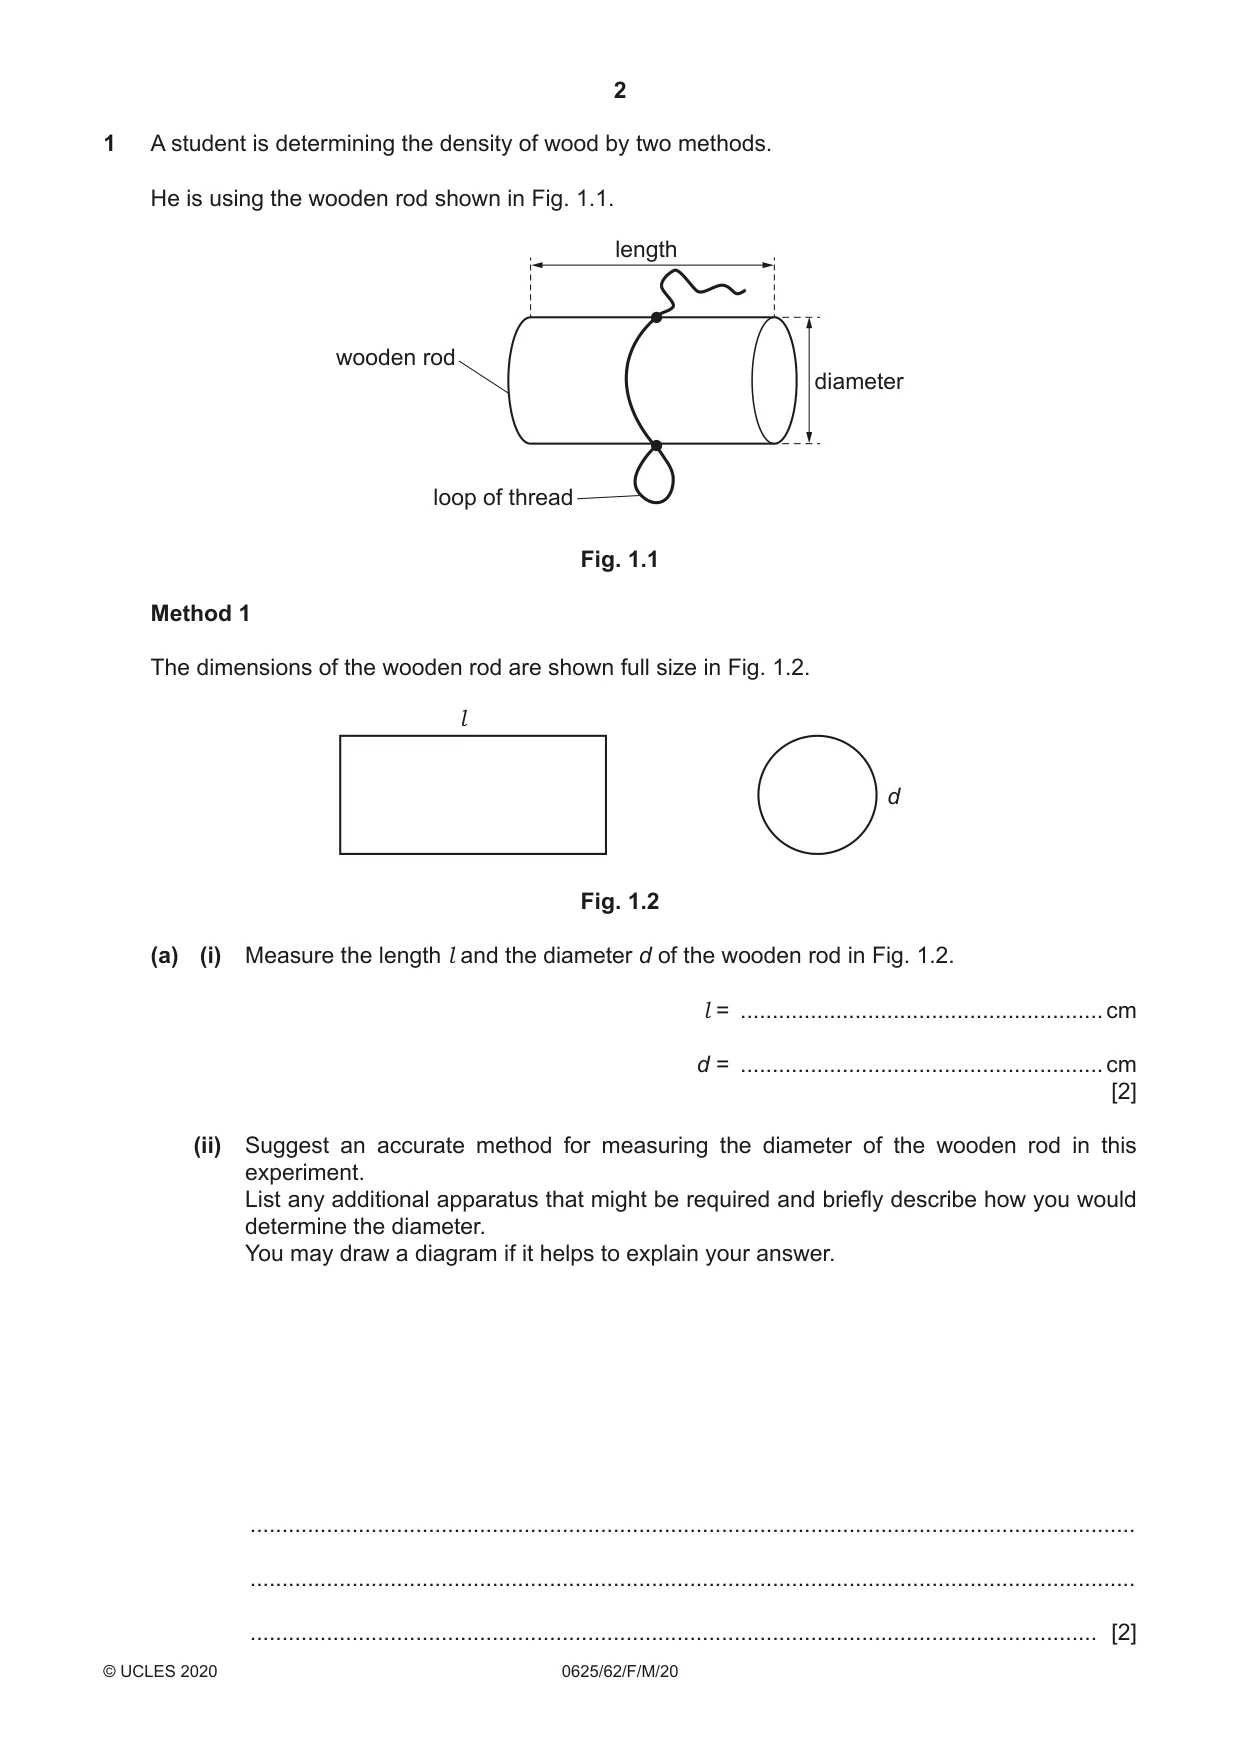
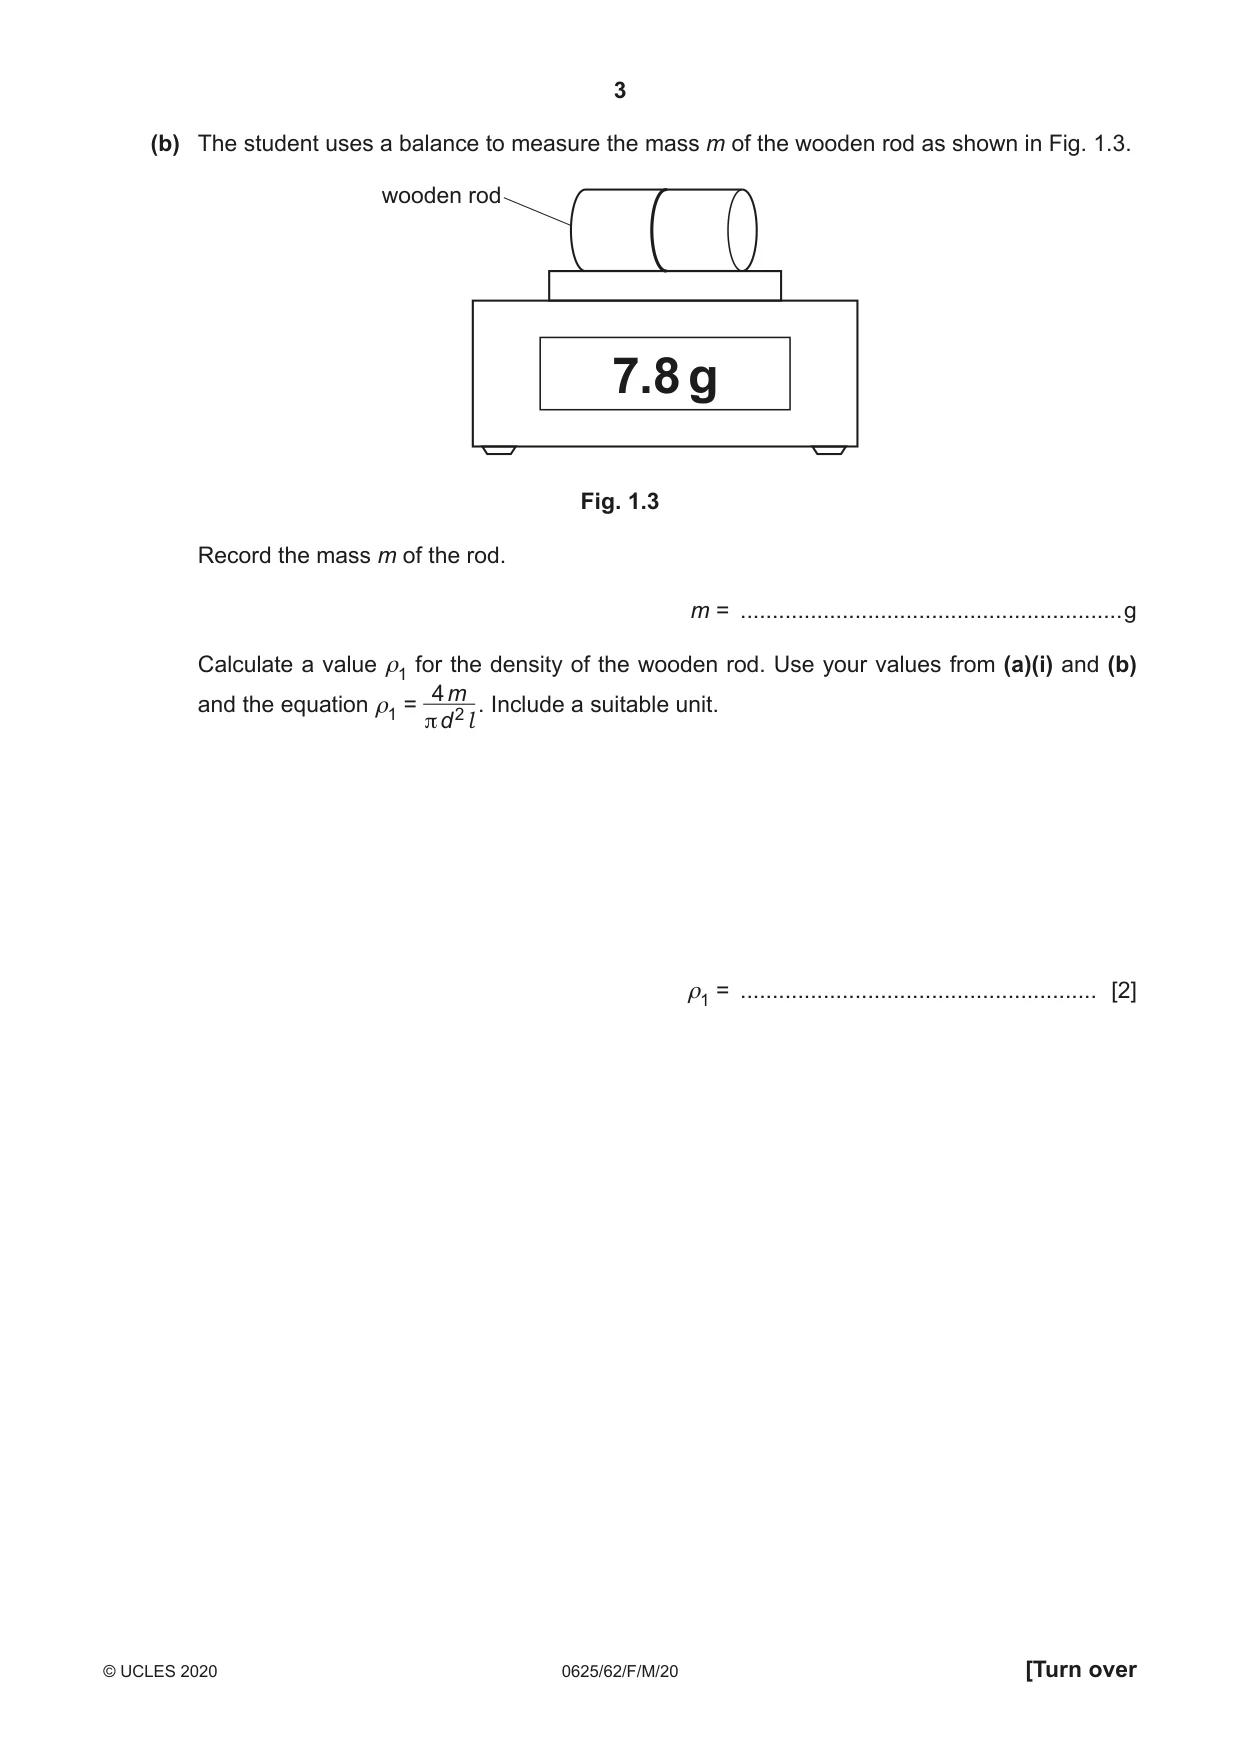
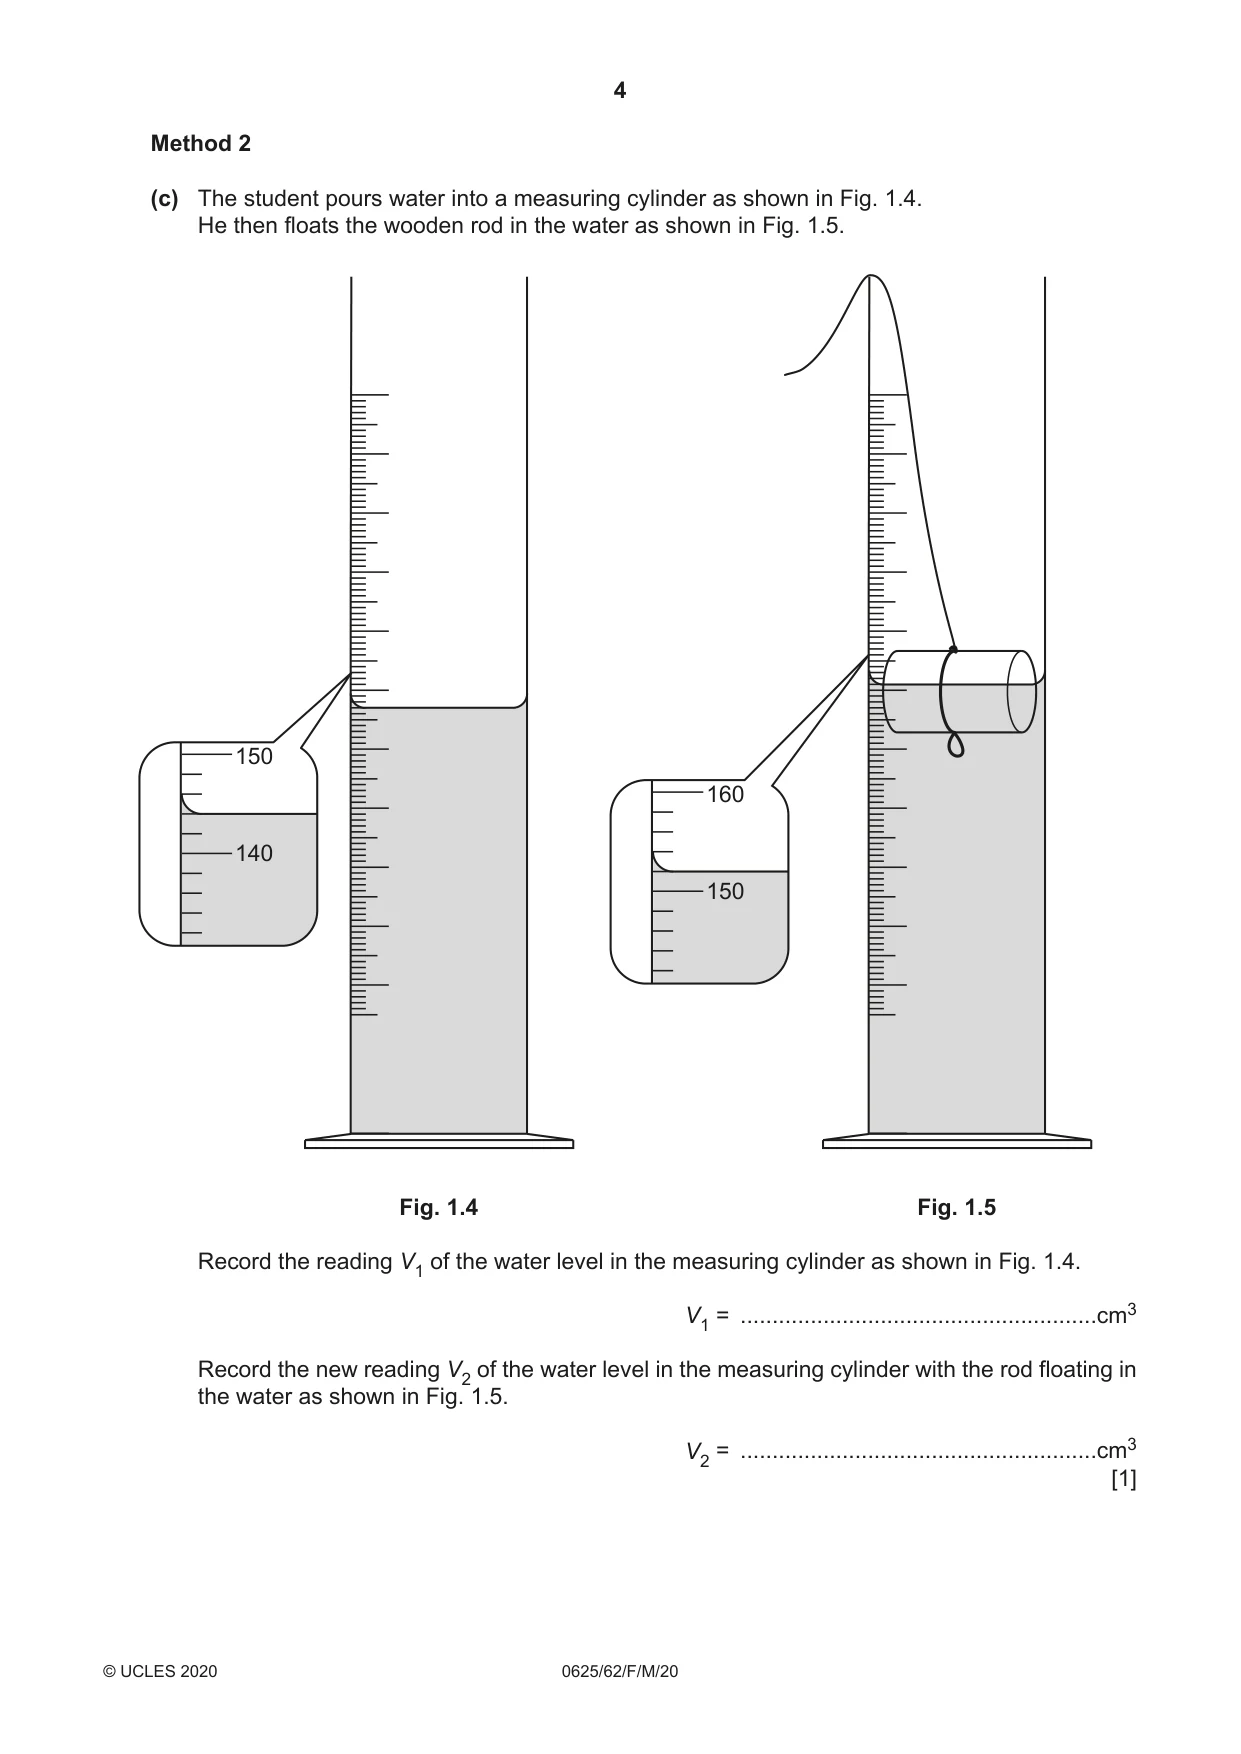
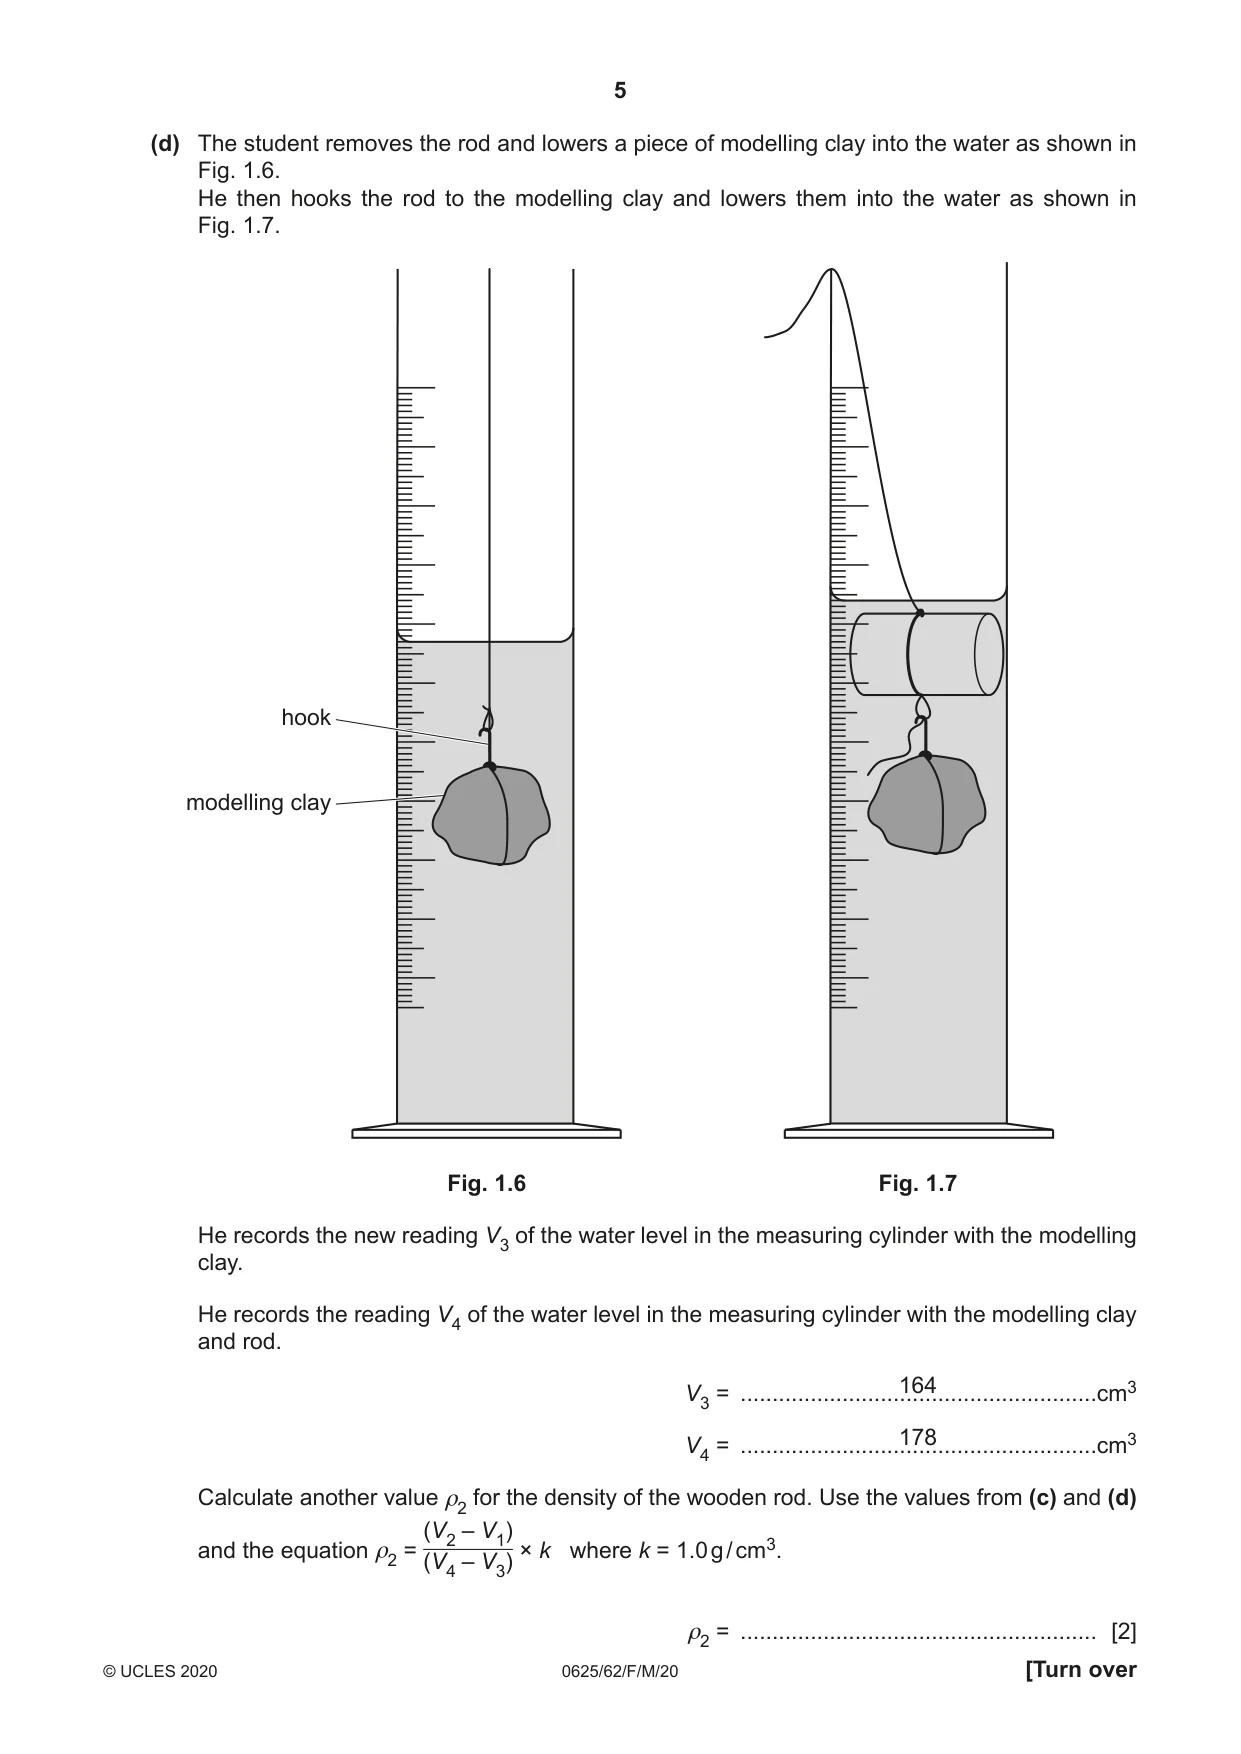
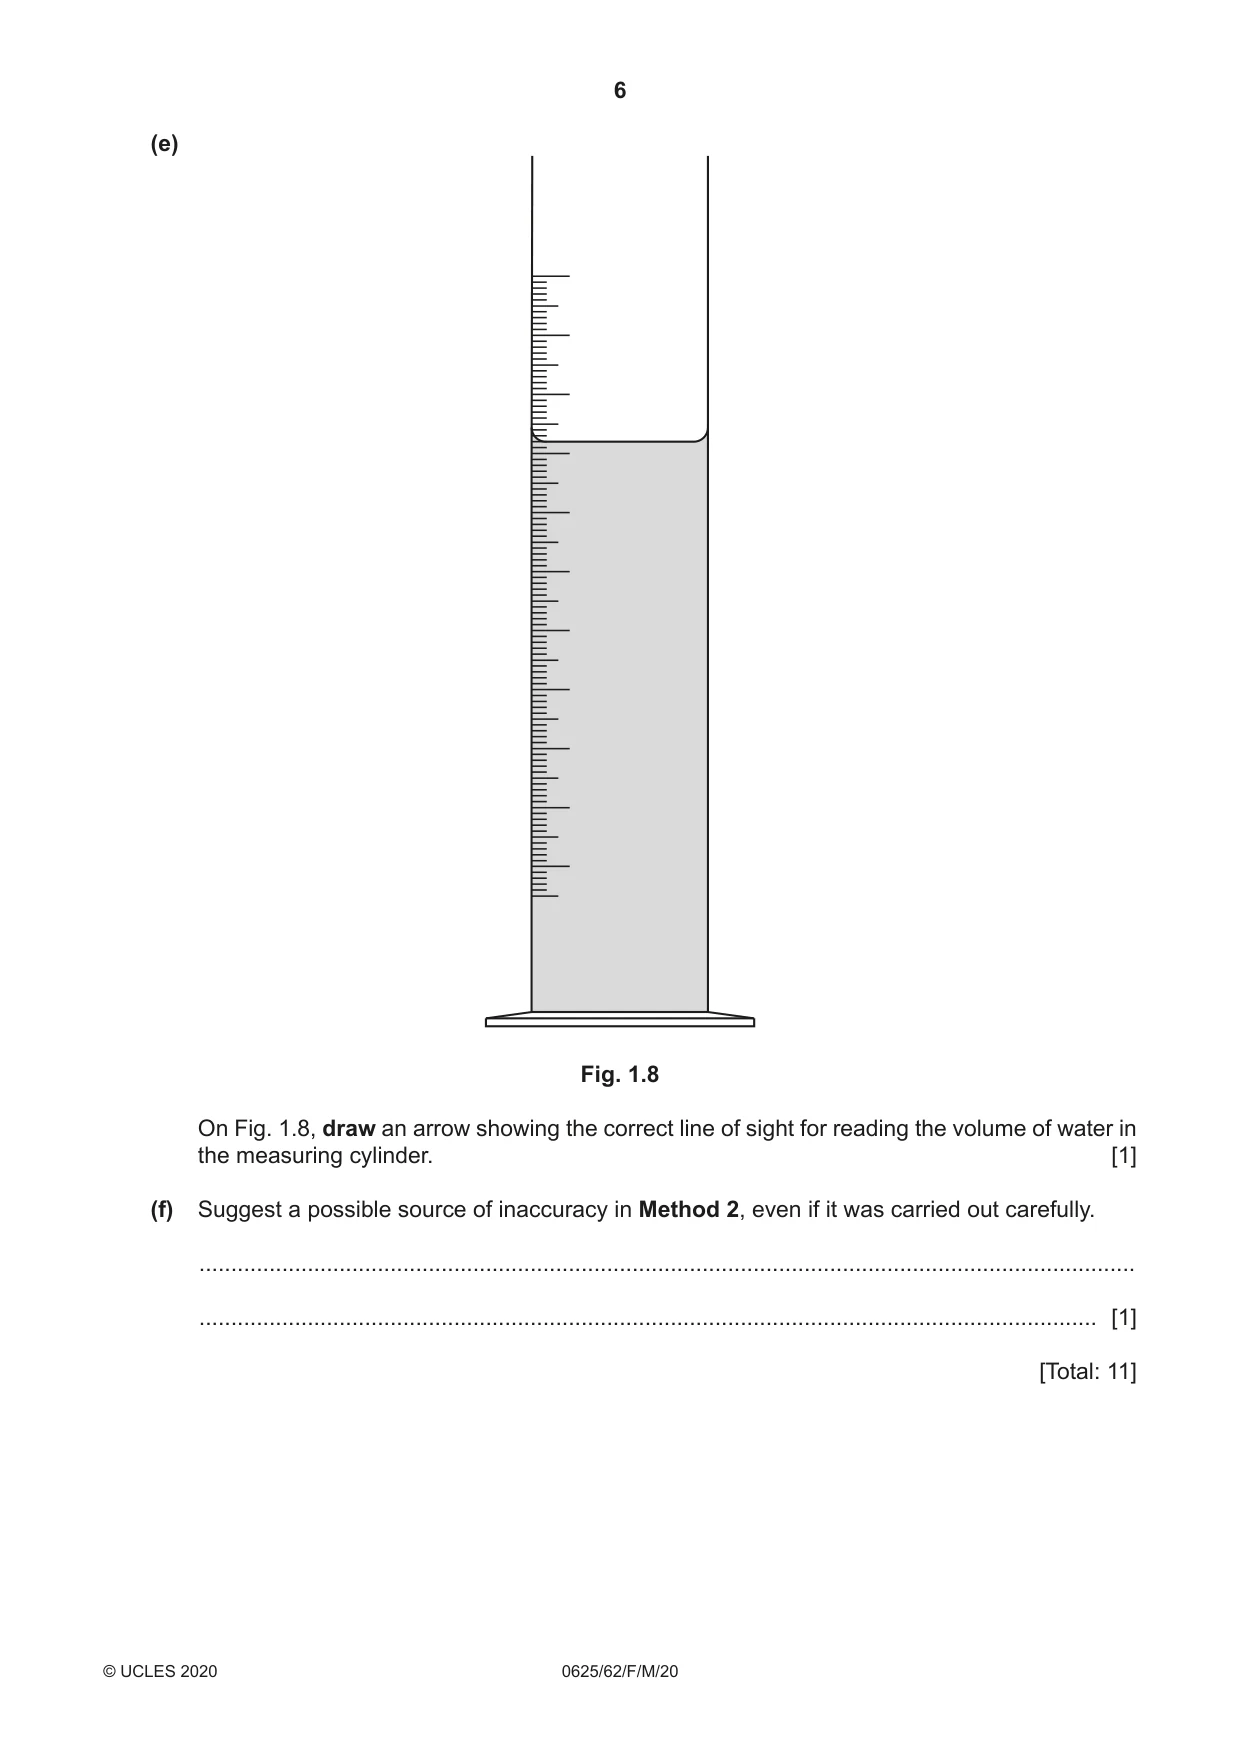
1 A student is determining the density of wood by two methods. He is using the wooden rod shown in Fig. 1.1. length wooden rod diameter loop of thread Fig. 1.1 Method 1 The dimensions of the wooden rod are shown full size in Fig. 1.2. l d Fig. 1.2 (a) (i) Measure the length l and the diameter d of the wooden rod in Fig. 1.2. l = .........................................................cm d = .........................................................cm [2] (ii) Suggest an accurate method for measuring the diameter of the wooden rod in this experiment. List any additional apparatus that might be required and briefly describe how you would determine the diameter. You may draw a diagram if it helps to explain your answer. ........................................................................................................................................... ........................................................................................................................................... ..................................................................................................................................... [2] (b) The student uses a balance to measure the mass m of the wooden rod as shown in Fig. 1.3. wooden rod 7.8 g Fig. 1.3 Record the mass m of the rod. m = ............................................................g Calculate a value ρ1 for the density of the wooden rod. Use your values from (a)(i) and (b) 4 m and the equation ρ1 = . Include a suitable unit. π d 2 l ρ1 = ........................................................ [2] Method 2 (c) The student pours water into a measuring cylinder as shown in Fig. 1.4. He then floats the wooden rod in the water as shown in Fig. 1.5. 150 160 140 150 Fig. 1.4 Fig. 1.5 Record the reading V1 of the water level in the measuring cylinder as shown in Fig. 1.4. V1 = ........................................................cm3 Record the new reading V2 of the water level in the measuring cylinder with the rod floating in the water as shown in Fig. 1.5. V2 = ........................................................cm3 [1] (d) The student removes the rod and lowers a piece of modelling clay into the water as shown in Fig. 1.6. He then hooks the rod to the modelling clay and lowers them into the water as shown in Fig. 1.7. hook modelling clay Fig. 1.6 Fig. 1.7 He records the new reading V3 of the water level in the measuring cylinder with the modelling clay. He records the reading V4 of the water level in the measuring cylinder with the modelling clay and rod. 164 V3 = ........................................................cm3 178 V4 = ........................................................cm3 Calculate another value ρ2 for the density of the wooden rod. Use the values from (c) and (d) (V2 – V1) × k where k = 1.0 g / cm3. and the equation ρ2 = (V4 – V3) ρ2 = ........................................................ [2] (e) Fig. 1.8 On Fig. 1.8, draw an arrow showing the correct line of sight for reading the volume of water in the measuring cylinder. [1] (f) Suggest a possible source of inaccuracy in Method 2, even if it was carried out carefully. ................................................................................................................................................... ............................................................................................................................................. [1] [Total: 11]
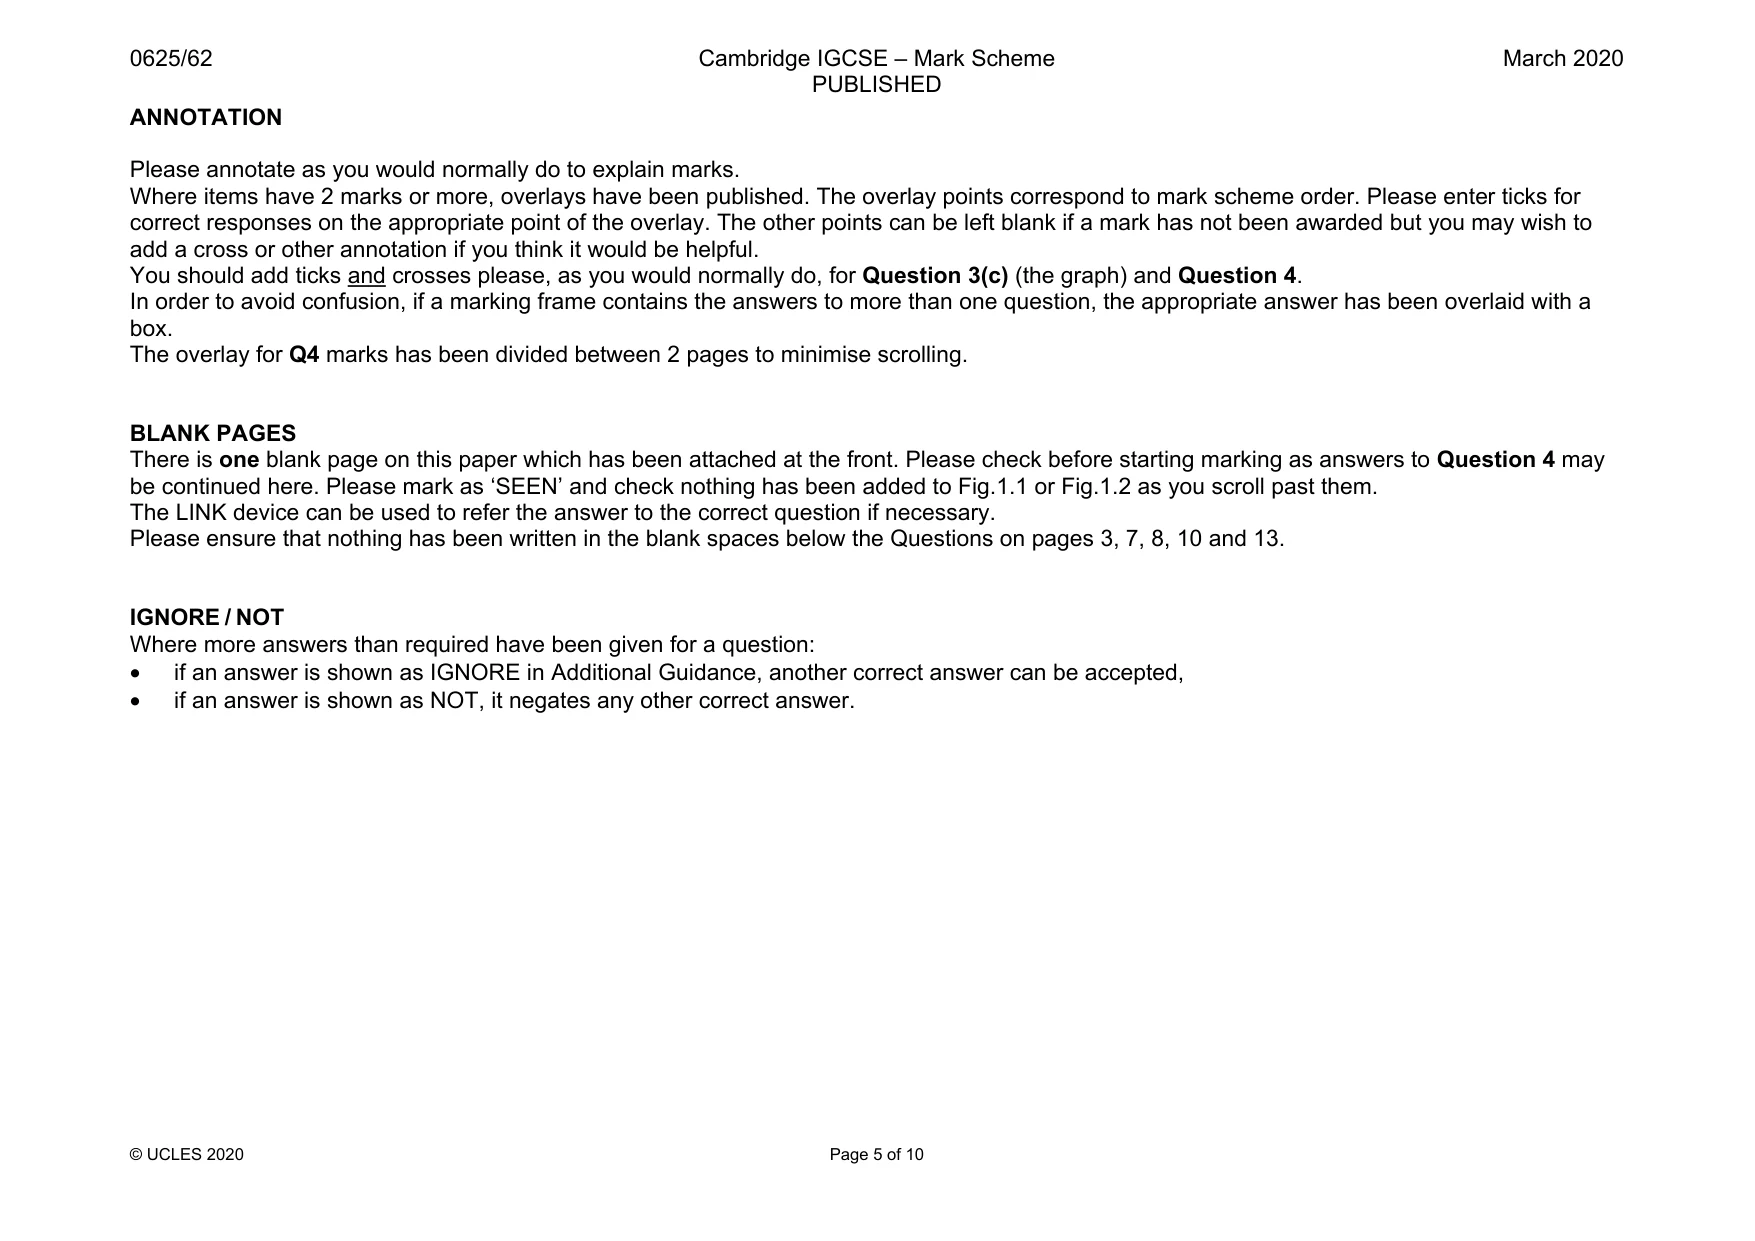
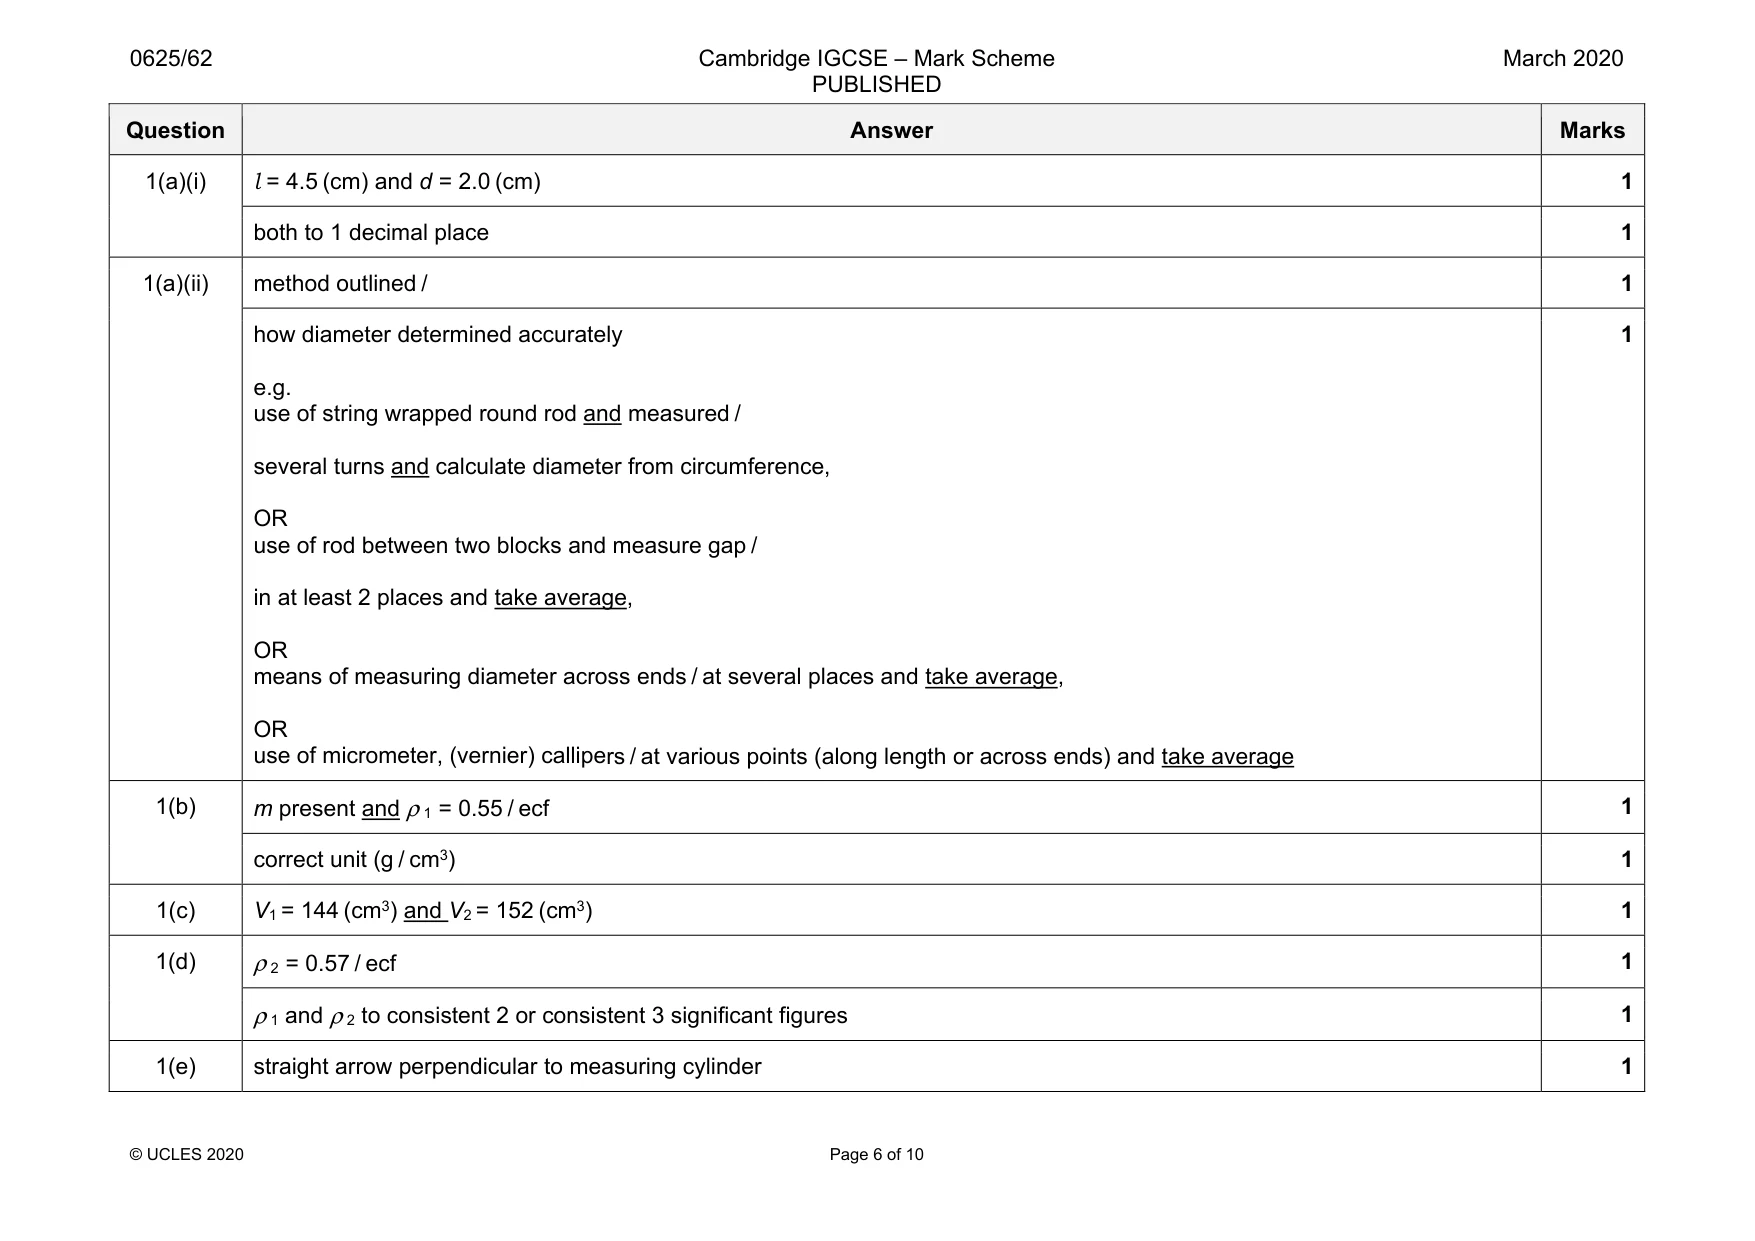
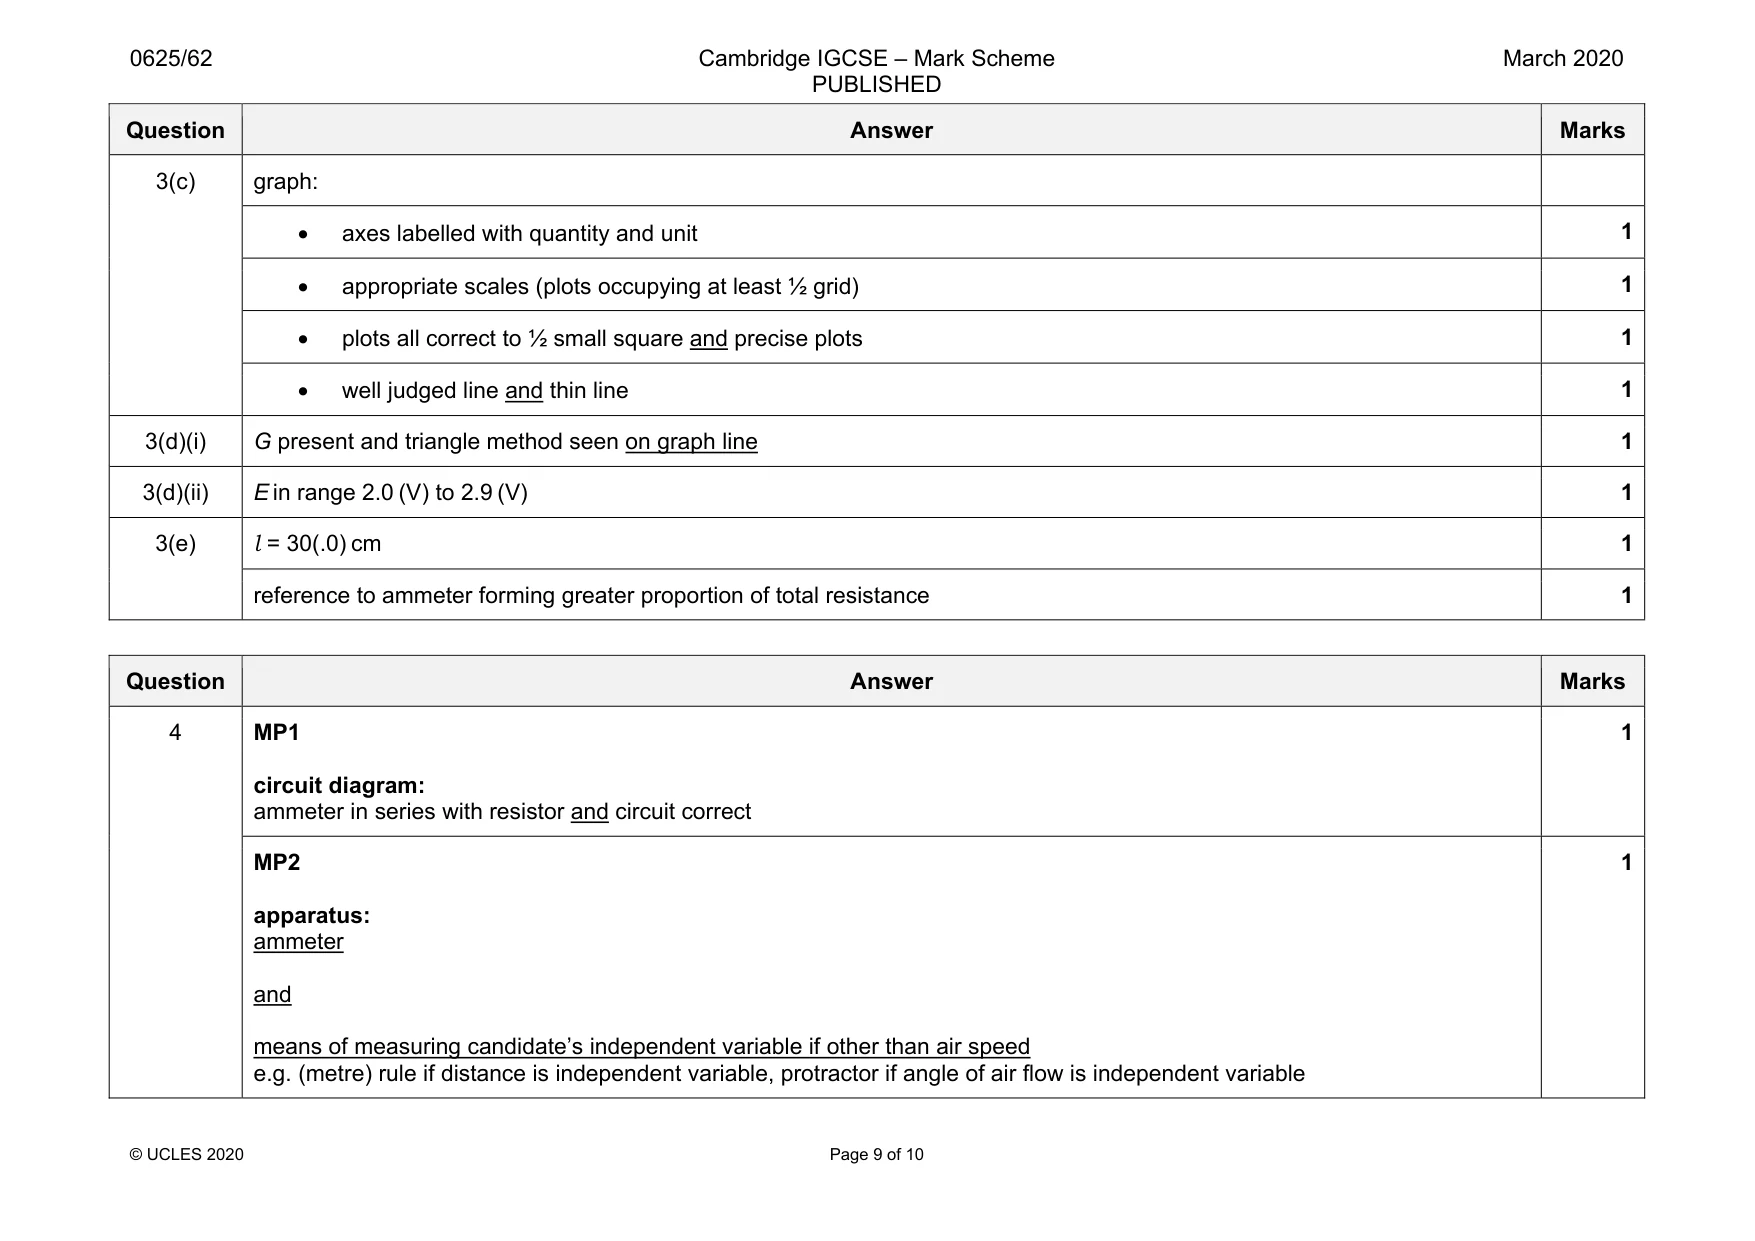
Mark scheme: 1(a)(i) 1 both to 1 decimal place 1 1(a)(ii) method outlined / 1 how diameter determined accurately e.g. use of string wrapped round rod and measured / several turns and calculate diameter from circumference, OR use of rod between two blocks and measure gap / in at least 2 places and take average, OR means of measuring diameter across ends / at several places and take average, OR use of micrometer, (vernier) callipers / at various points (along length or across ends) and take average 1 1(b) m present and ρ 1 = 0.55 / ecf 1 correct unit (g / cm3) 1 1(c) V1 = 144 (cm3) and V2 = 152 (cm3) 1 1(d) ρ 2 = 0.57 / ecf 1 ρ 1 and ρ 2 to consistent 2 or consistent 3 significant figures 1 1(e) straight arrow perpendicular to measuring cylinder 1 Question Answer Marks 1(f) suitable source of inaccuracy e.g.: measuring cylinder scales less precise / accurate, water lost on transfer / droplets on clay, wood might absorb water 1
More questions on Physical quantities and measurement techniques
Q2 · Students are investigating the cooling of hot water in a beaker
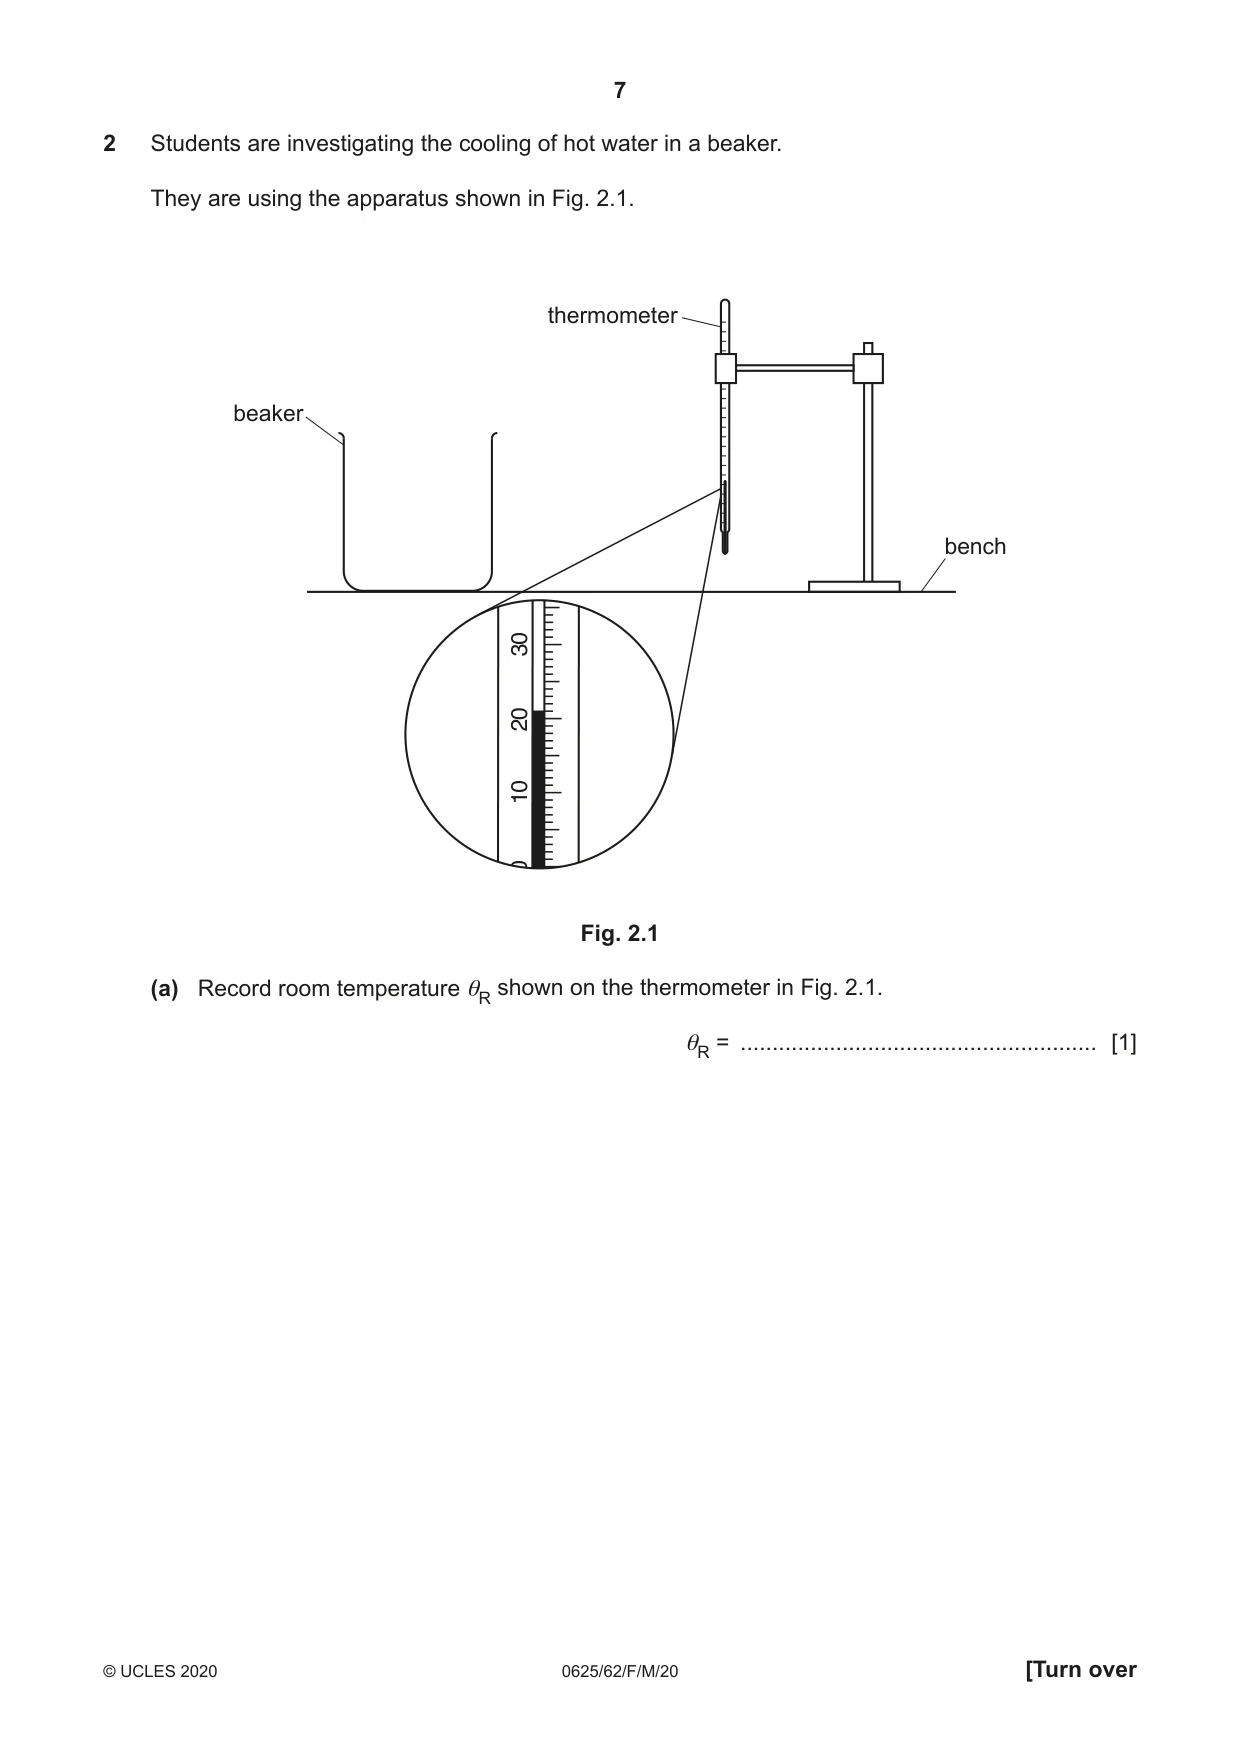
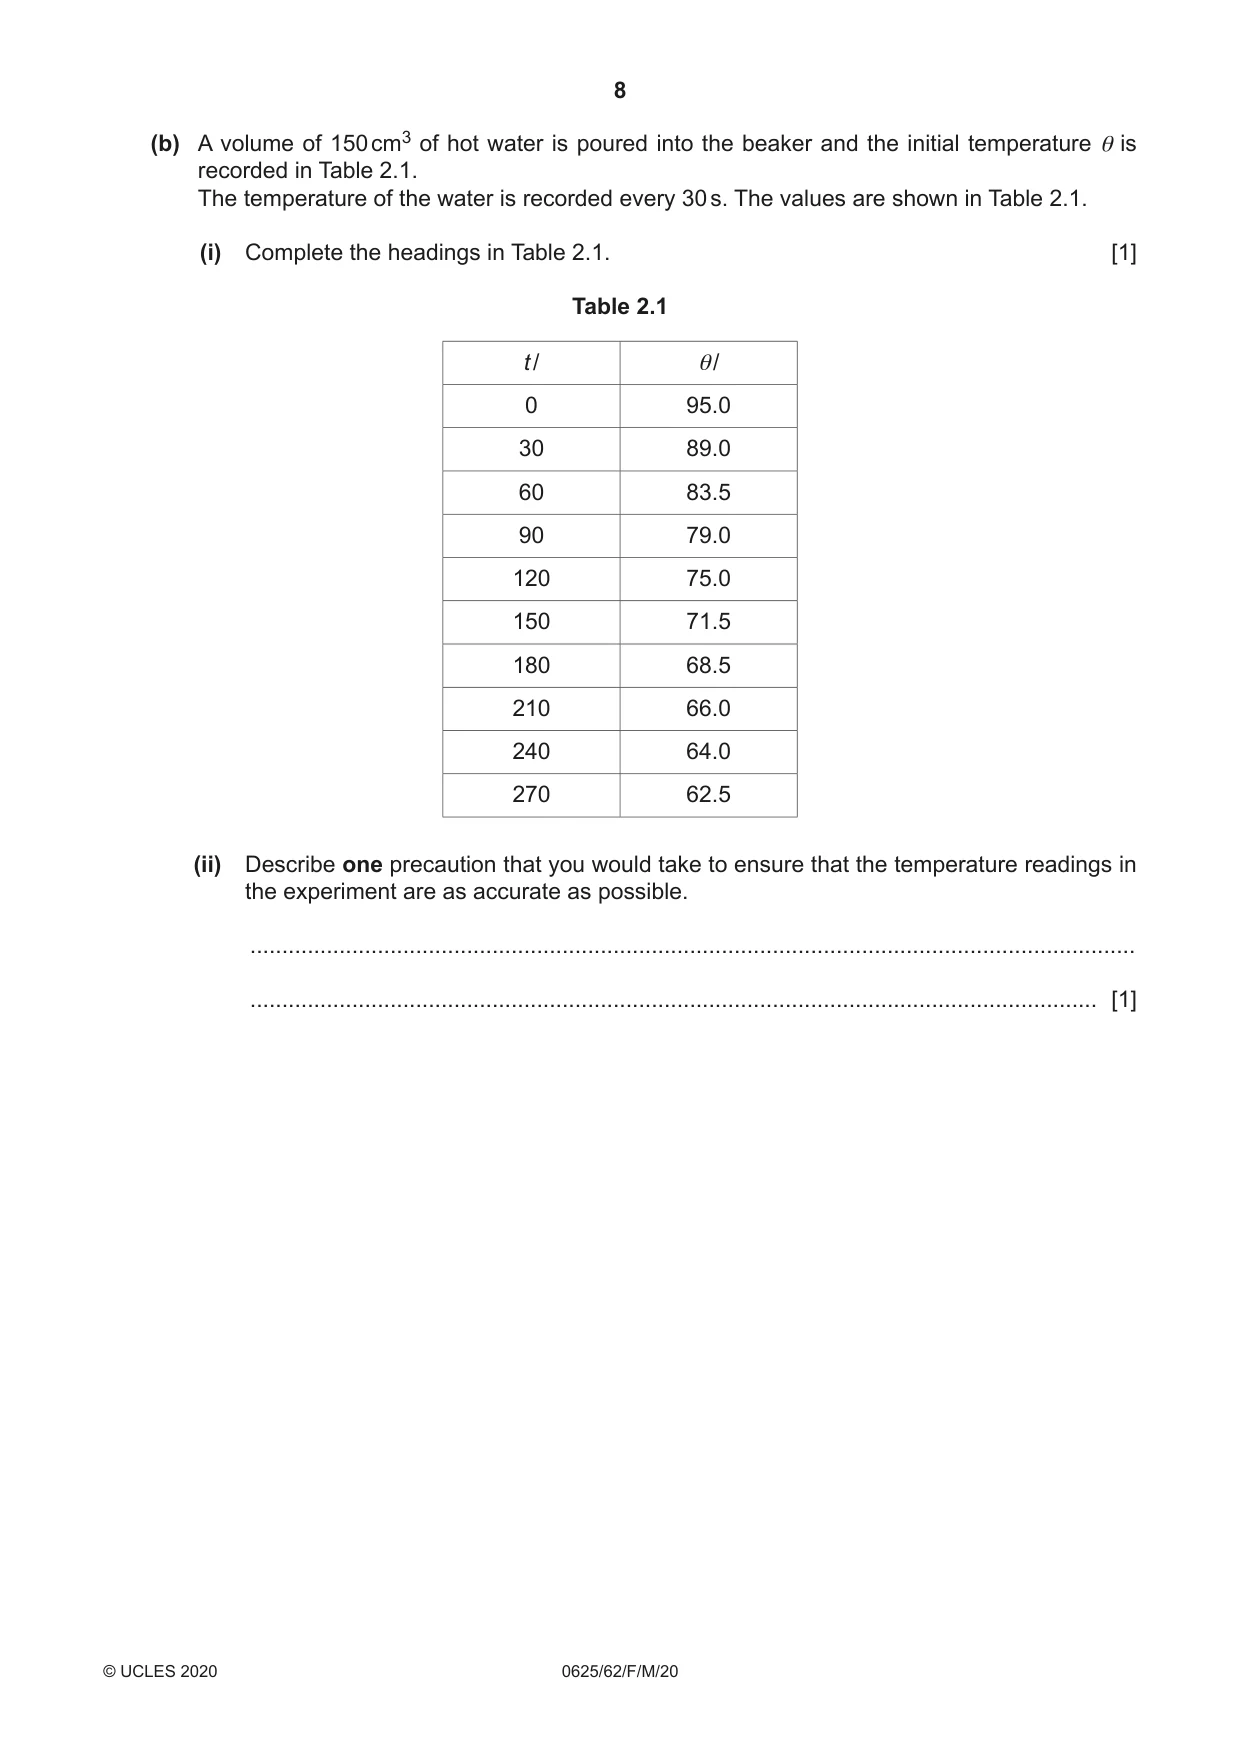
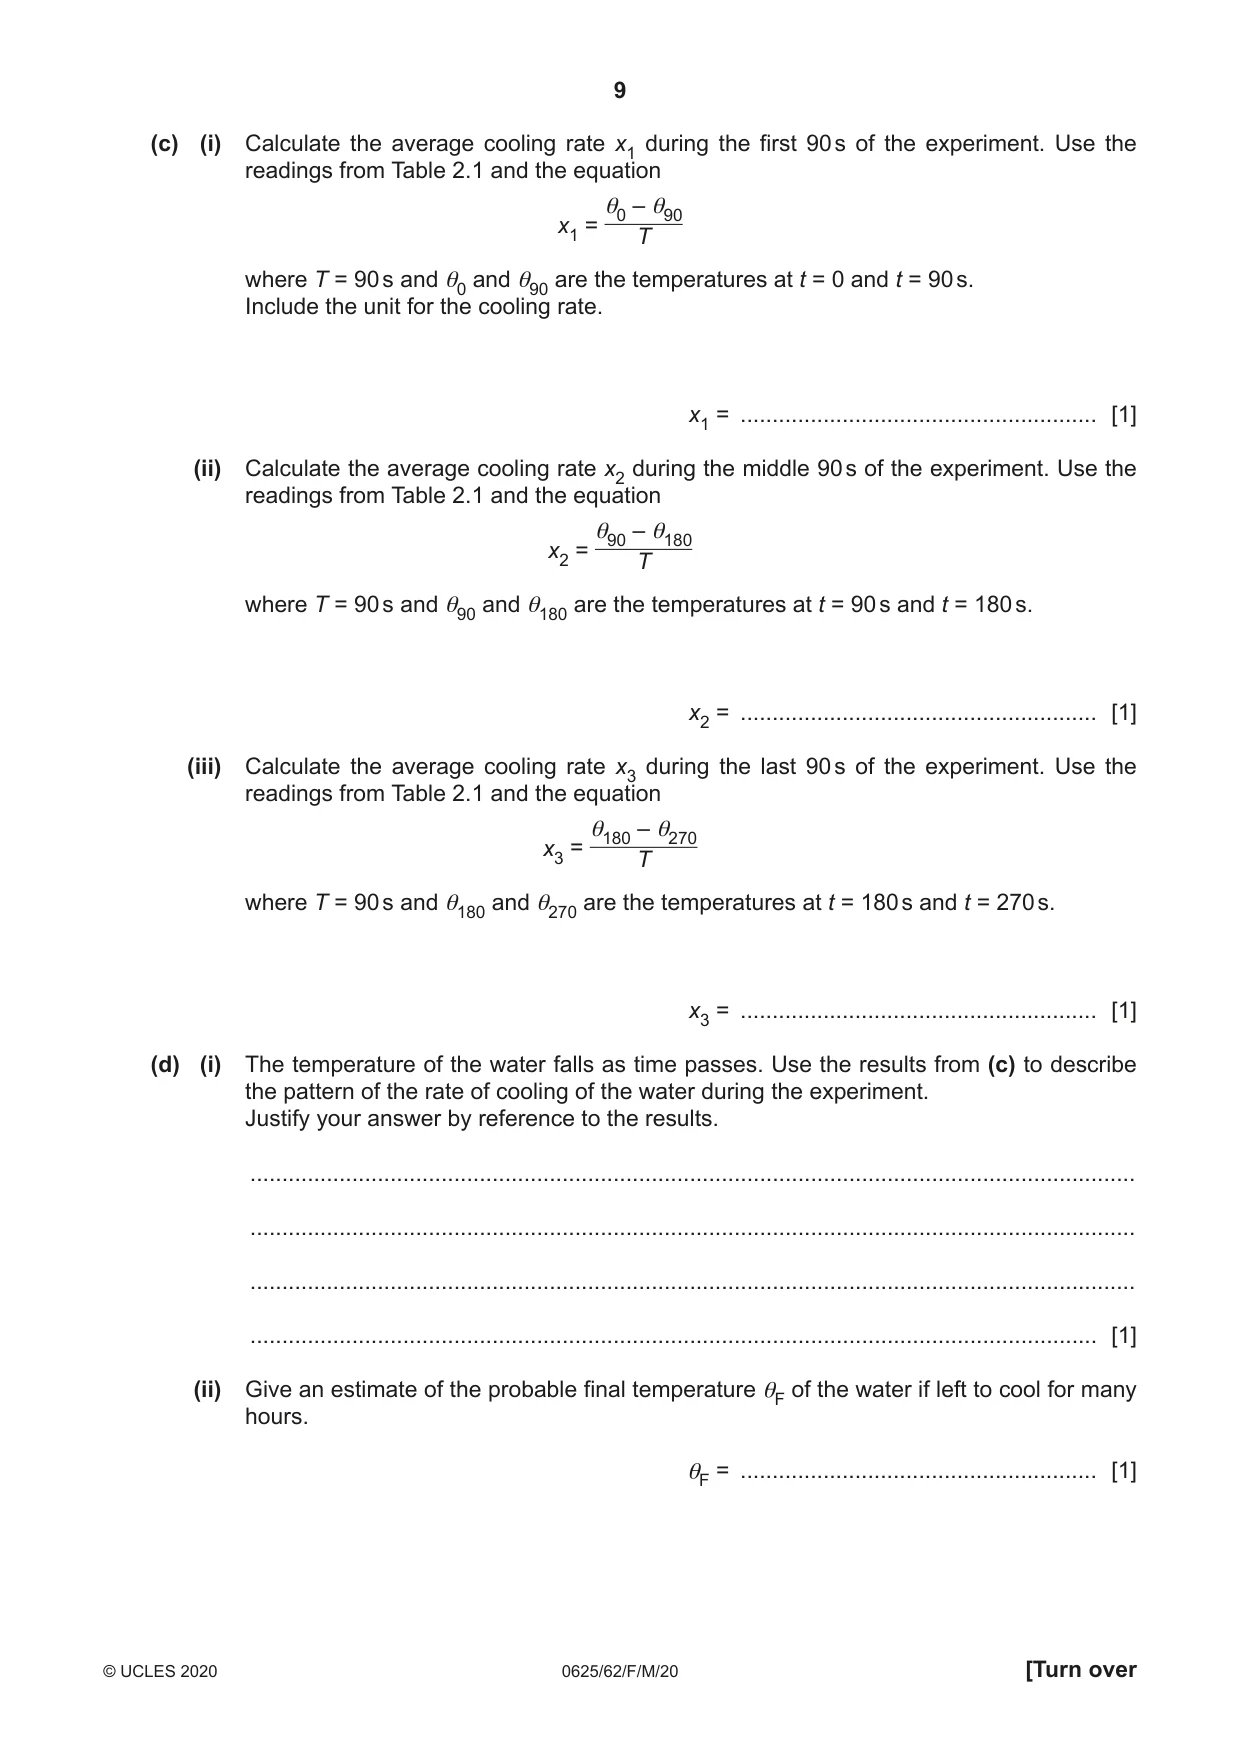
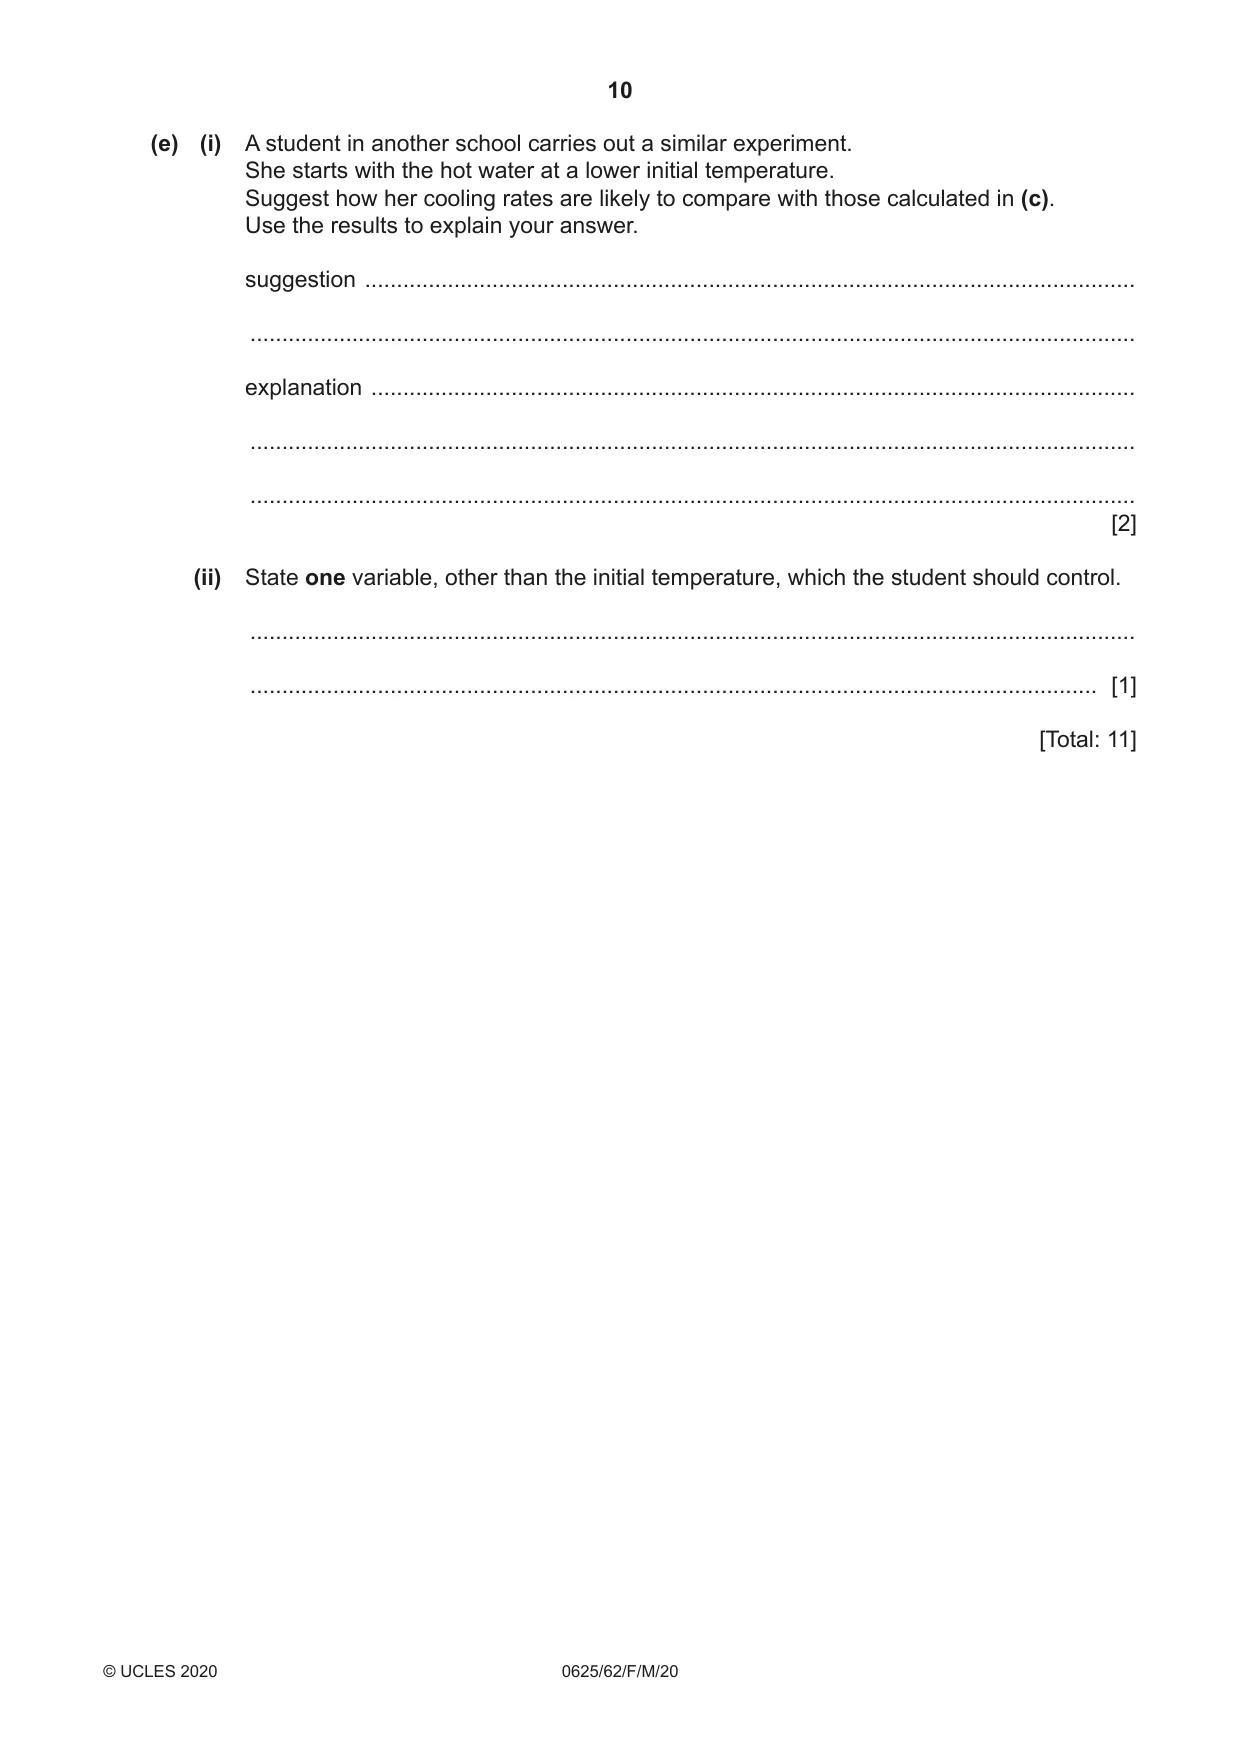
2 Students are investigating the cooling of hot water in a beaker. They are using the apparatus shown in Fig. 2.1. thermometer beaker bench 30 20 10 0 Fig. 2.1 (a) Record room temperature θR shown on the thermometer in Fig. 2.1. θR = ........................................................ [1] (b) A volume of 150 cm3 of hot water is poured into the beaker and the initial temperature θ is recorded in Table 2.1. The temperature of the water is recorded every 30 s. The values are shown in Table 2.1. (i) Complete the headings in Table 2.1. [1] Table 2.1 t / θ/ 0 95.0 30 89.0 60 83.5 90 79.0 120 75.0 150 71.5 180 68.5 210 66.0 240 64.0 270 62.5 (ii) Describe one precaution that you would take to ensure that the temperature readings in the experiment are as accurate as possible. ........................................................................................................................................... ..................................................................................................................................... [1] (c) (i) Calculate the average cooling rate x1 during the first 90 s of the experiment. Use the readings from Table 2.1 and the equation θ0 – θ90 x1 = T where T = 90 s and θ0 and θ90 are the temperatures at t = 0 and t = 90 s. Include the unit for the cooling rate. x1 = ........................................................ [1] (ii) Calculate the average cooling rate x2 during the middle 90 s of the experiment. Use the readings from Table 2.1 and the equation θ90 – θ180 x2 = T where T = 90 s and θ90 and θ180 are the temperatures at t = 90 s and t = 180 s. x2 = ........................................................ [1] (iii) Calculate the average cooling rate x3 during the last 90 s of the experiment. Use the readings from Table 2.1 and the equation θ180 – θ270 x3 = T where T = 90 s and θ180 and θ270 are the temperatures at t = 180 s and t = 270 s. x3 = ........................................................ [1] (d) (i) The temperature of the water falls as time passes. Use the results from (c) to describe the pattern of the rate of cooling of the water during the experiment. Justify your answer by reference to the results. ........................................................................................................................................... ........................................................................................................................................... ........................................................................................................................................... ..................................................................................................................................... [1] (ii) Give an estimate of the probable final temperature θF of the water if left to cool for many hours. θF = ........................................................ [1] (e) (i) A student in another school carries out a similar experiment. She starts with the hot water at a lower initial temperature. Suggest how her cooling rates are likely to compare with those calculated in (c). Use the results to explain your answer. suggestion ......................................................................................................................... ........................................................................................................................................... explanation ........................................................................................................................ ........................................................................................................................................... ........................................................................................................................................... [2] (ii) State one variable, other than the initial temperature, which the student should control. ........................................................................................................................................... ..................................................................................................................................... [1] [Total: 11]
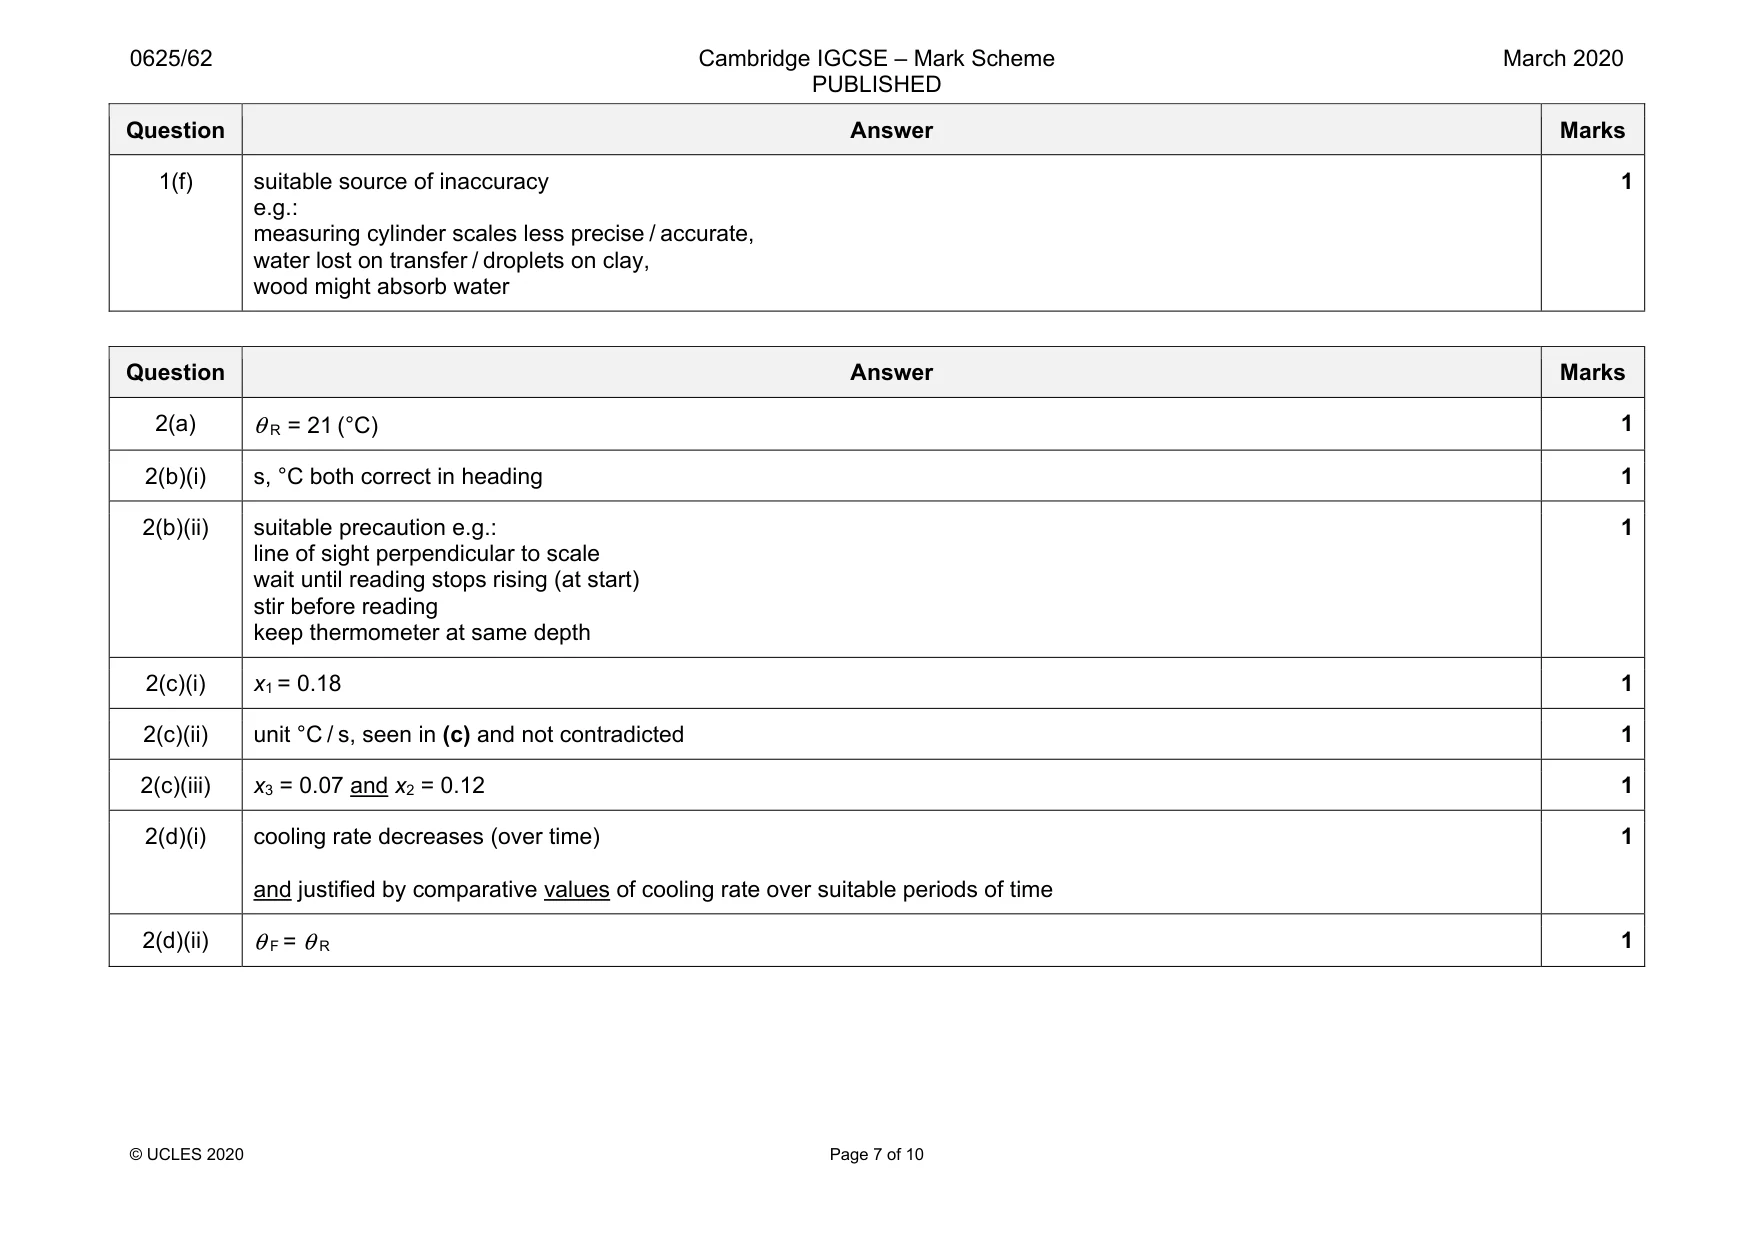
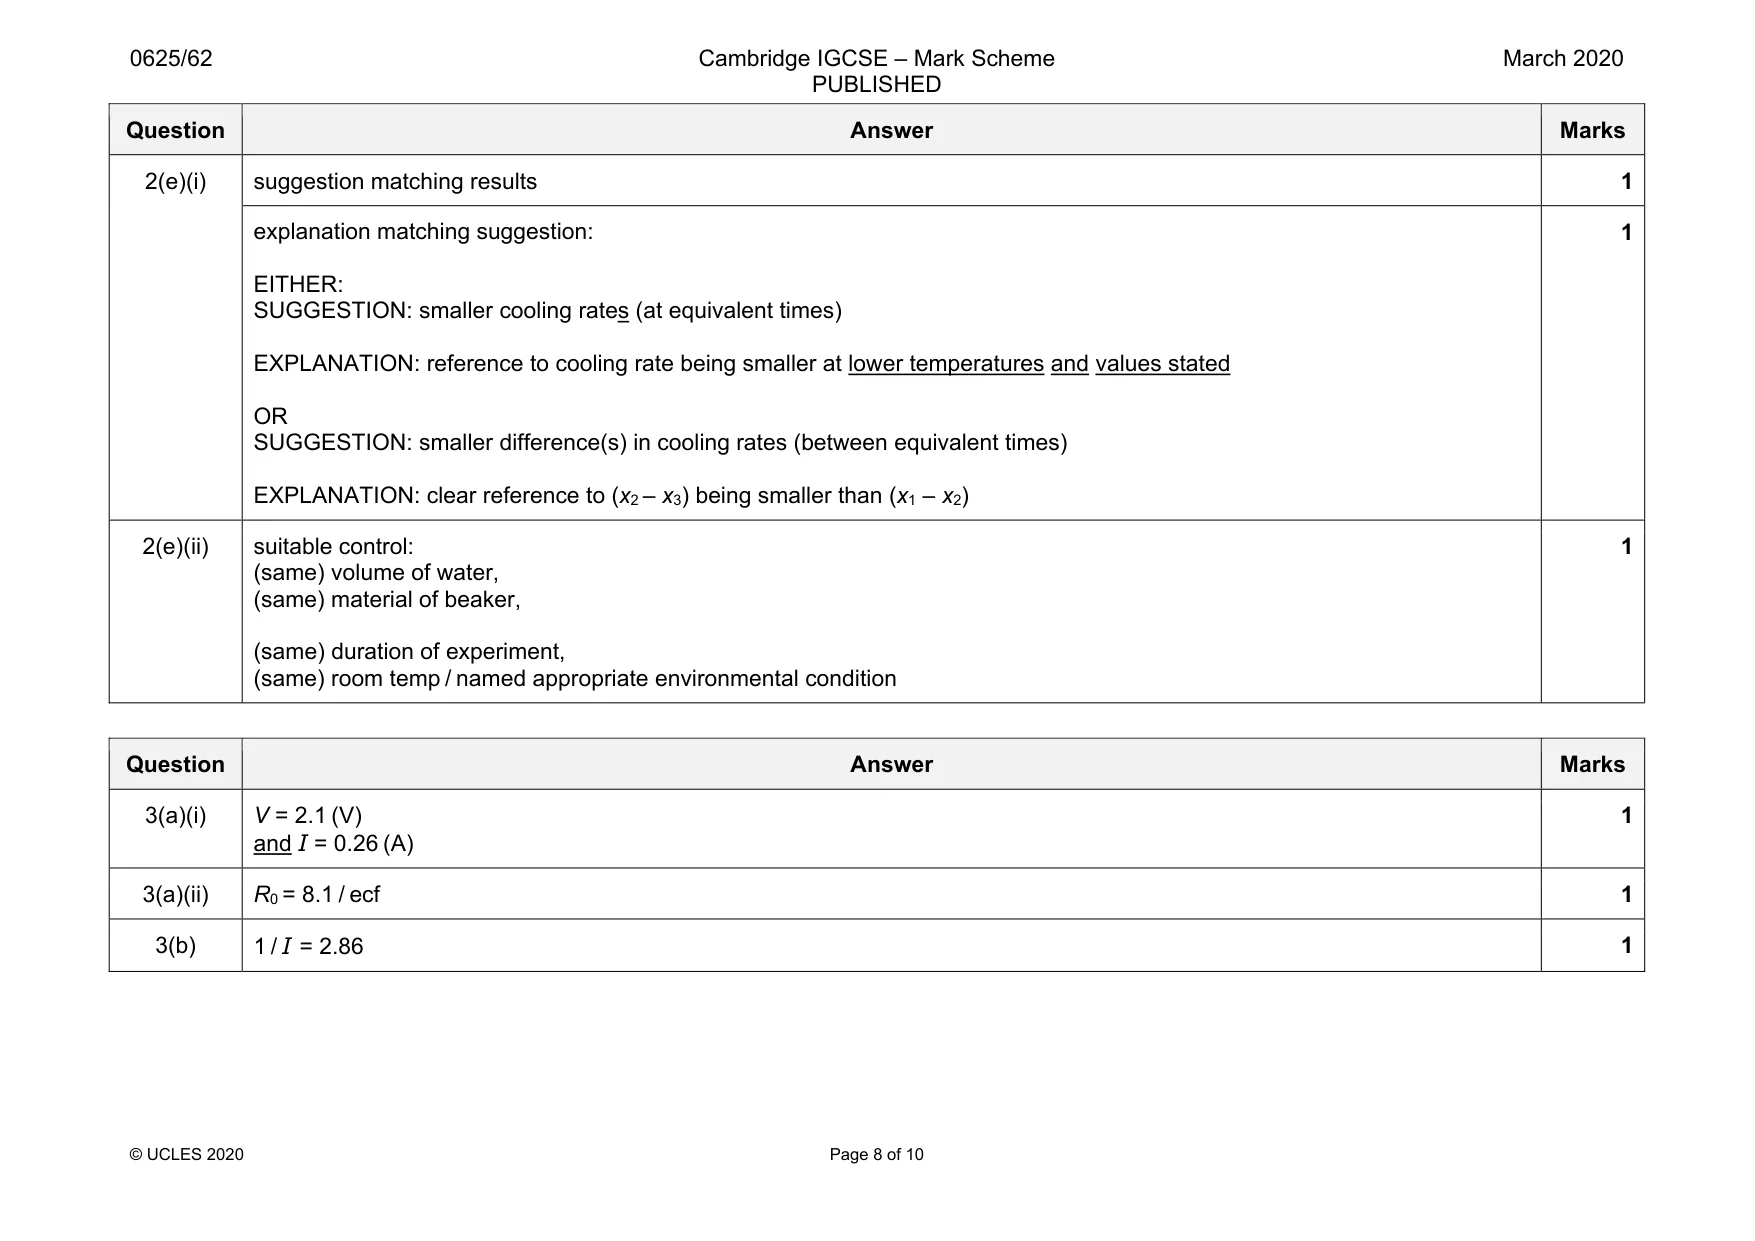
Mark scheme: 2(a) θ R = 21 (°C) 1 2(b)(i) s, °C both correct in heading 1 2(b)(ii) suitable precaution e.g.: line of sight perpendicular to scale wait until reading stops rising (at start) stir before reading keep thermometer at same depth 1 2(c)(i) x1 = 0.18 1 2(c)(ii) unit °C / s, seen in (c) and not contradicted 1 2(c)(iii) x3 = 0.07 and x2 = 0.12 1 2(d)(i) cooling rate decreases (over time) and justified by comparative values of cooling rate over suitable periods of time 1 2(d)(ii) θ F = θ R 1 Question Answer Marks 2(e)(i) suggestion matching results 1 explanation matching suggestion: EITHER: SUGGESTION: smaller cooling rates (at equivalent times) EXPLANATION: reference to cooling rate being smaller at lower temperatures and values stated OR SUGGESTION: smaller difference(s) in cooling rates (between equivalent times) EXPLANATION: clear reference to (x2 – x3) being smaller than (x1 – x2) 1 2(e)(ii) suitable control: (same) volume of water, (same) material of beaker, (same) duration of experiment, (same) room temp / named appropriate environmental condition 1
Q3 · A student is investigating a power supply
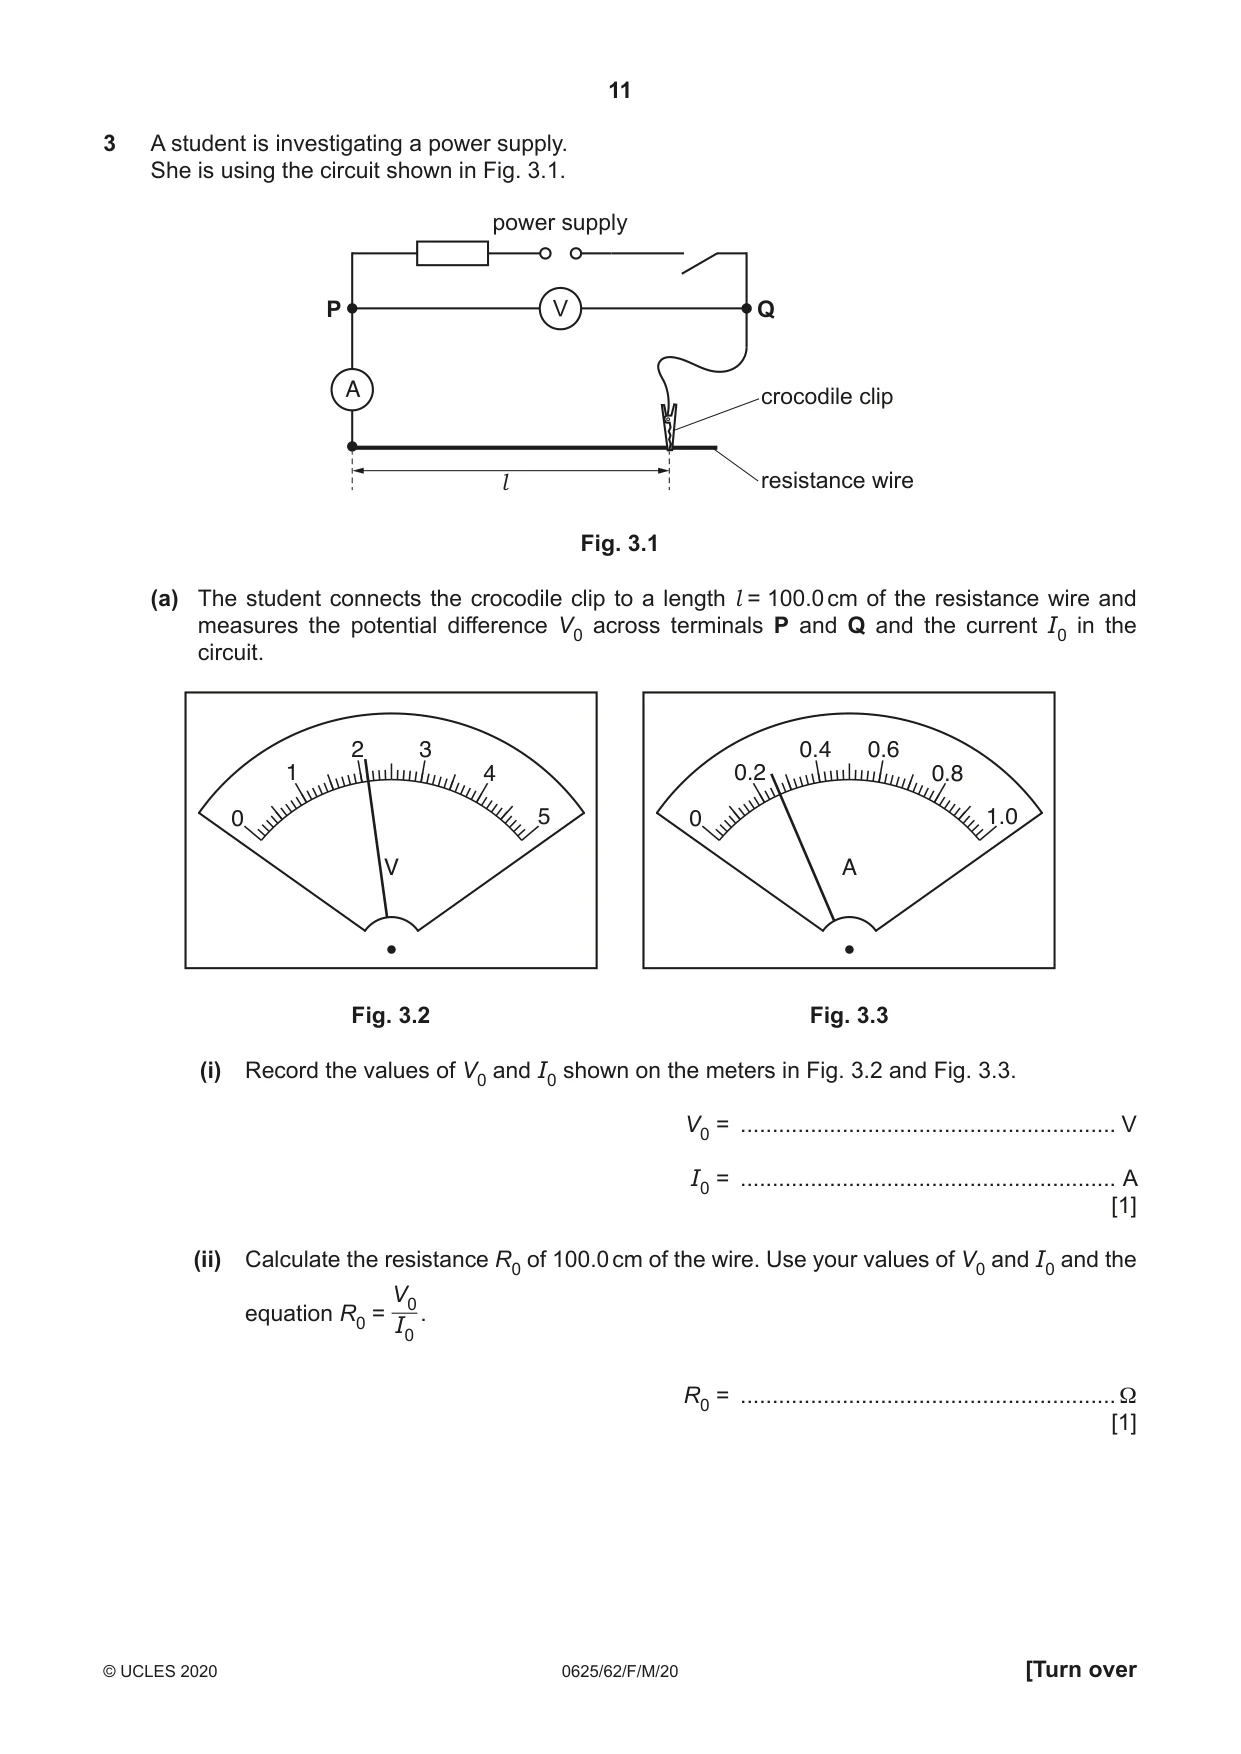
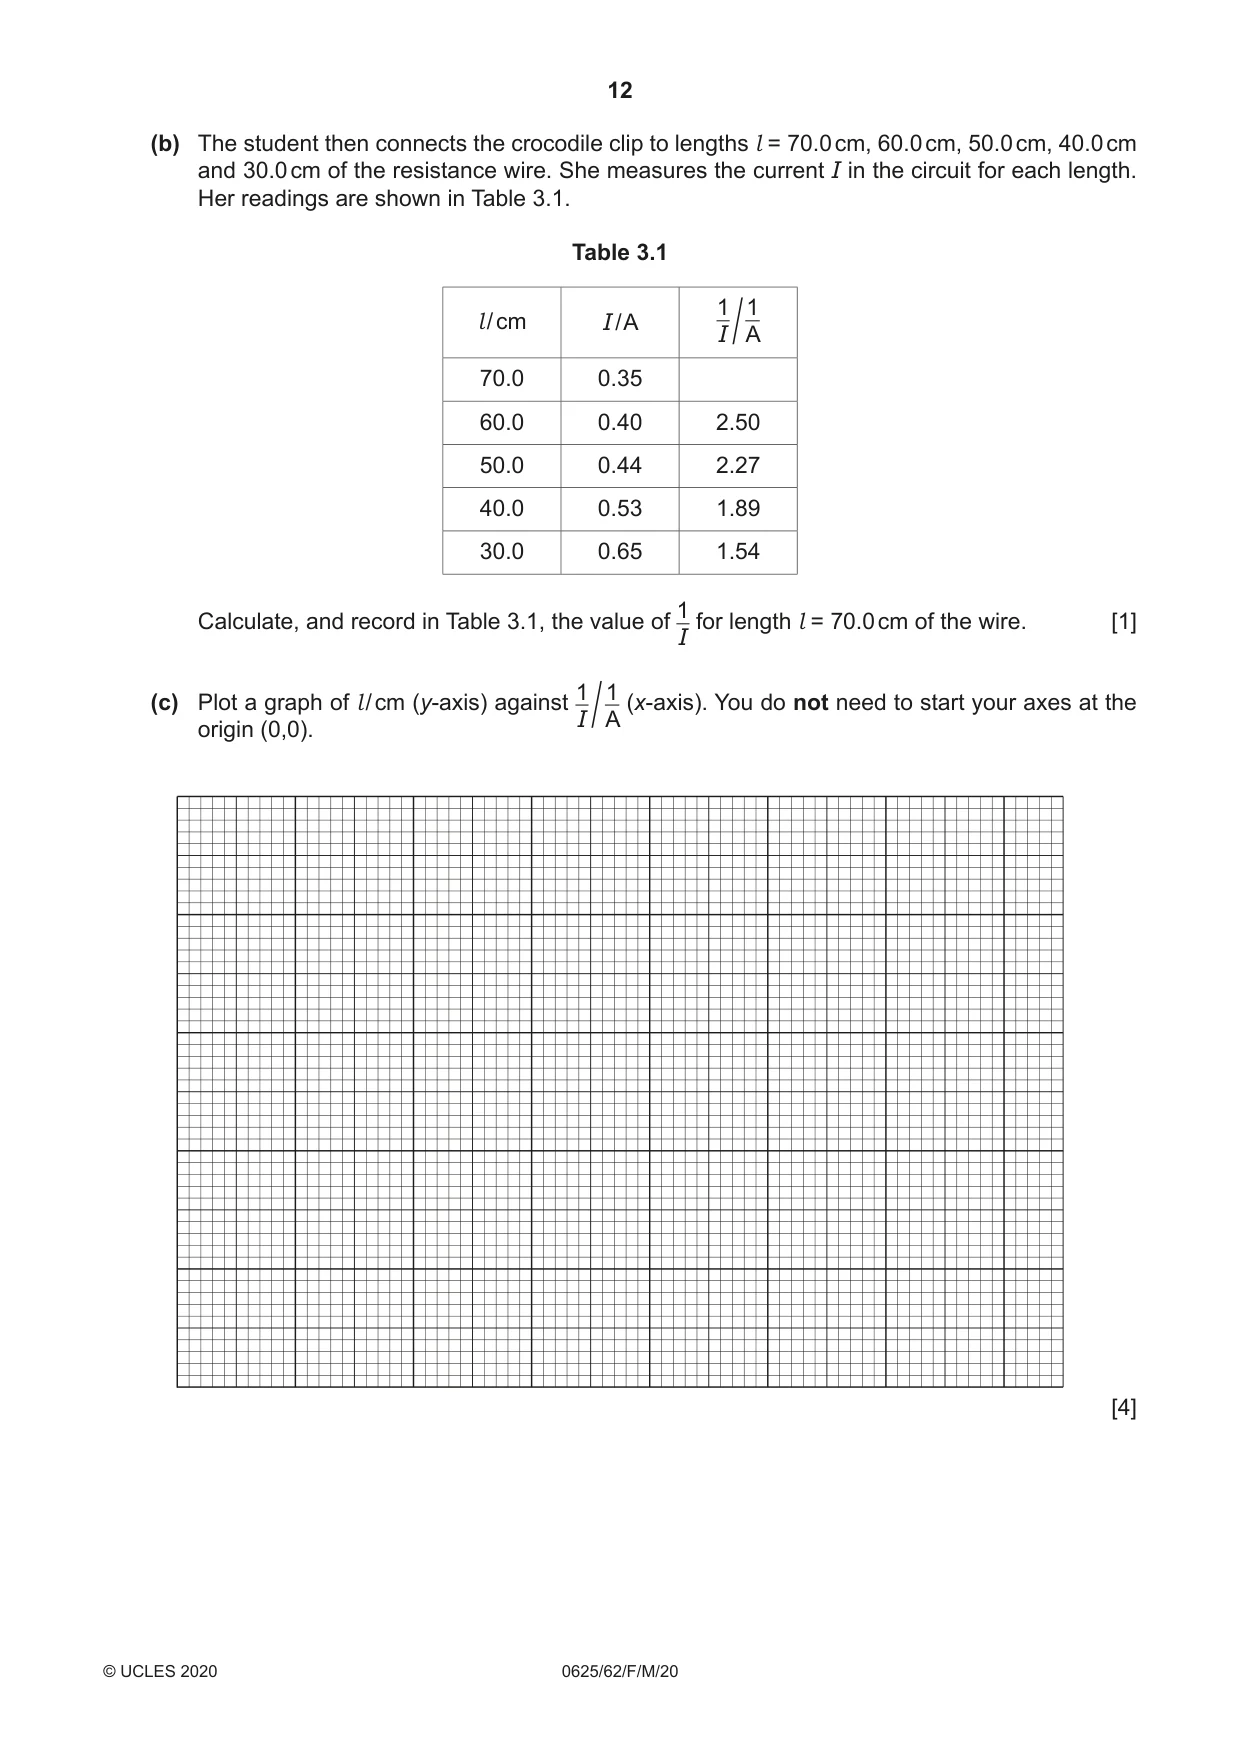
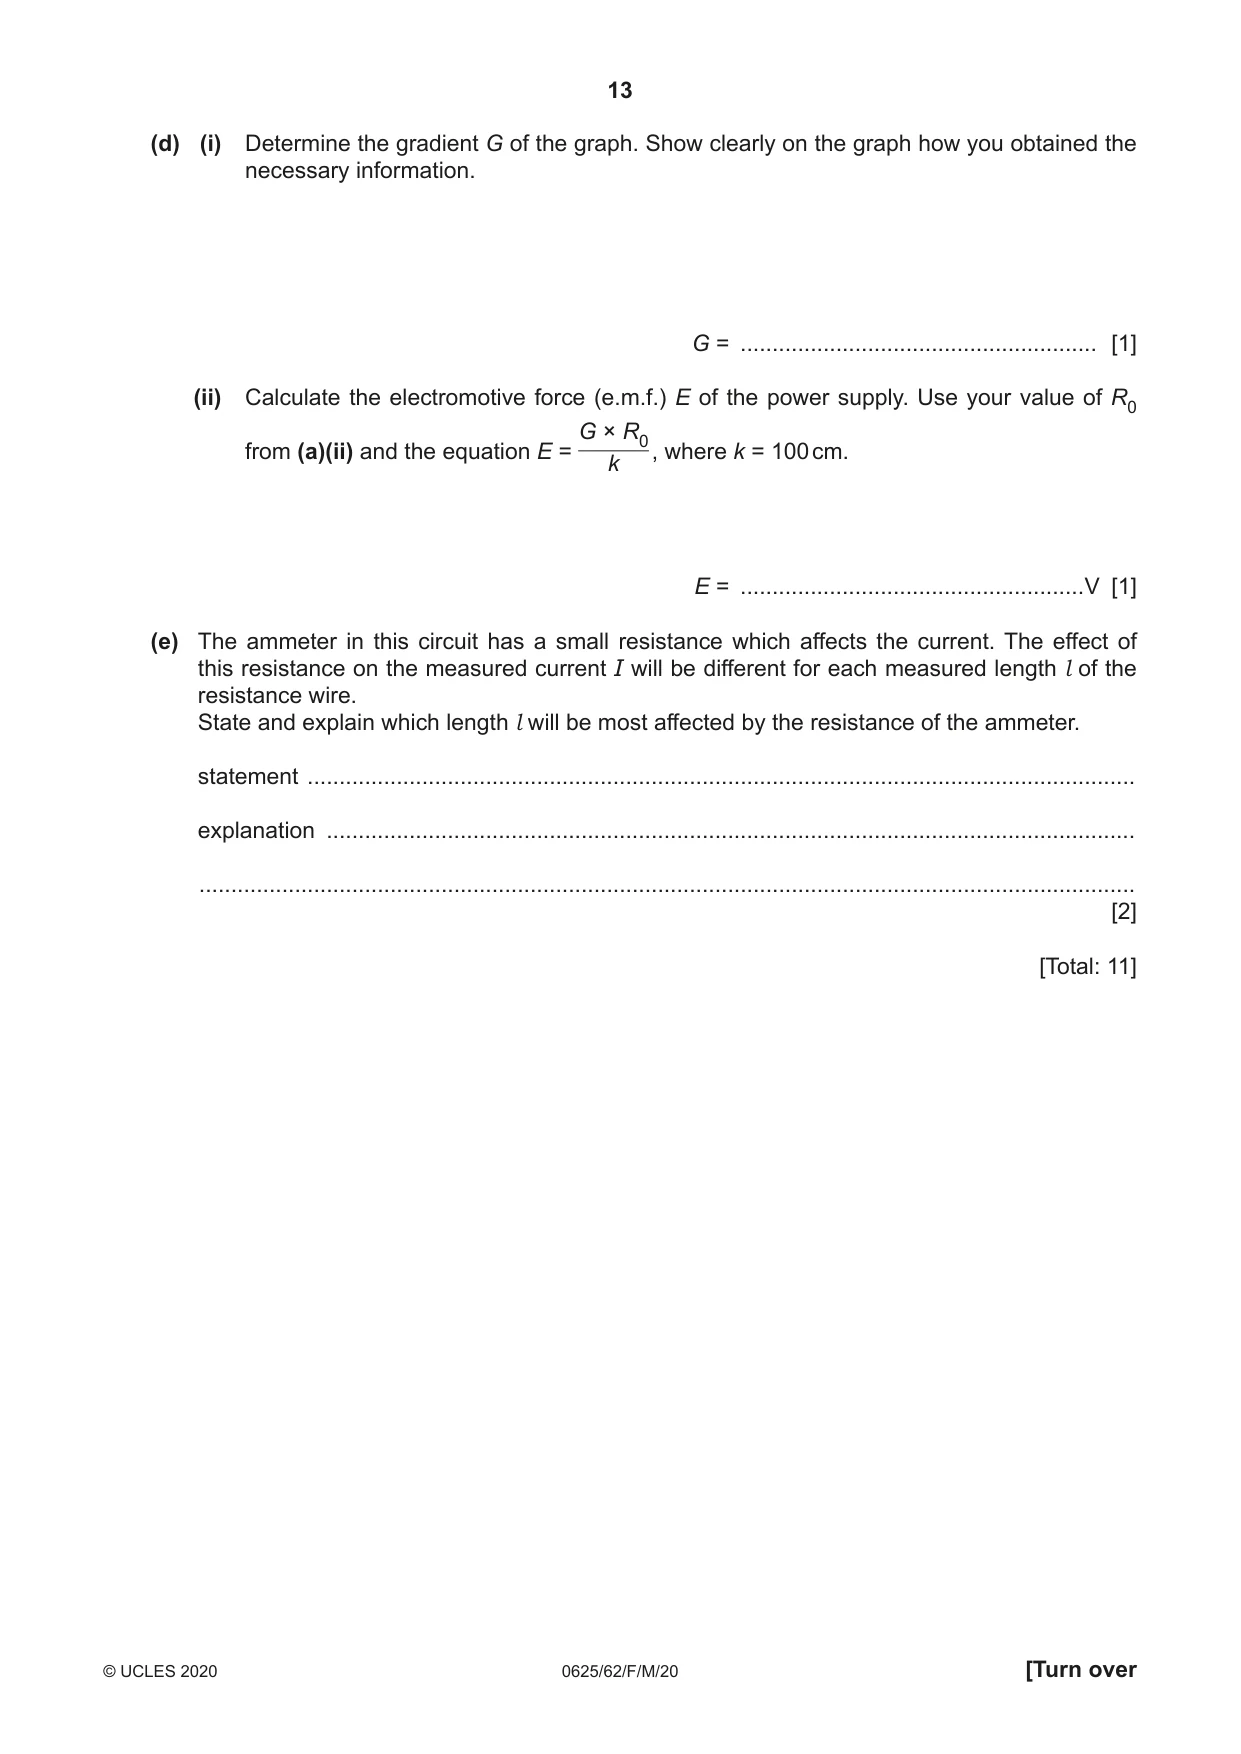
3 A student is investigating a power supply. She is using the circuit shown in Fig. 3.1. power supply P Q crocodile clip l resistance wire Fig. 3.1 (a) The student connects the crocodile clip to a length l = 100.0 cm of the resistance wire and measures the potential difference V0 across terminals P and Q and the current I0 in the circuit. 2 3 0.4 0.6 1 4 0.2 0.8 0 5 0 1.0 V A Fig. 3.2 Fig. 3.3 (i) Record the values of V0 and I0 shown on the meters in Fig. 3.2 and Fig. 3.3. V0 = ........................................................... V I0 = ........................................................... A [1] (ii) Calculate the resistance R0 of 100.0 cm of the wire. Use your values of V0 and I0 and the V0 equation R0 = . I0 R0 = ...........................................................Ω [1] (b) The student then connects the crocodile clip to lengths l = 70.0 cm, 60.0 cm, 50.0 cm, 40.0 cm and 30.0 cm of the resistance wire. She measures the current I in the circuit for each length. Her readings are shown in Table 3.1. Table 3.1 1 1 l / cm I / A I A / 70.0 0.35 60.0 0.40 2.50 50.0 0.44 2.27 40.0 0.53 1.89 30.0 0.65 1.54 1 Calculate, and record in Table 3.1, the value of for length l = 70.0 cm of the wire. [1] I 1 1(c) Plot a graph of l / cm (y-axis) against (x-axis). You do not need to start your axes at the I A origin (0,0). / [4] (d) (i) Determine the gradient G of the graph. Show clearly on the graph how you obtained the necessary information. G = ........................................................ [1] (ii) Calculate the electromotive force (e.m.f.) E of the power supply. Use your value of R0 G × R0 from (a)(ii) and the equation E = , where k = 100 cm. k E = ......................................................V [1] (e) The ammeter in this circuit has a small resistance which affects the current. The effect of this resistance on the measured current I will be different for each measured length l of the resistance wire. State and explain which length l will be most affected by the resistance of the ammeter. statement .................................................................................................................................. explanation ............................................................................................................................... ................................................................................................................................................... [2] [Total: 11]
Mark scheme: 3(a)(i) V = 2.1 (V) and I = 0.26 (A) 1 3(a)(ii) R0 = 8.1 / ecf 1 3(b) 1 / I = 2.86 1 Question Answer Marks 3(c) graph: • axes labelled with quantity and unit 1 • appropriate scales (plots occupying at least ½ grid) 1 • plots all correct to ½ small square and precise plots 1 • well judged line and thin line 1 3(d)(i) G present and triangle method seen on graph line 1 3(d)(ii) E in range 2.0 (V) to 2.9 (V) 1 3(e) l = 30(.0) cm 1 reference to ammeter forming greater proportion of total resistance 1
Q4 · A student investigates a wind turbine, which is an electrical generator driven by a…
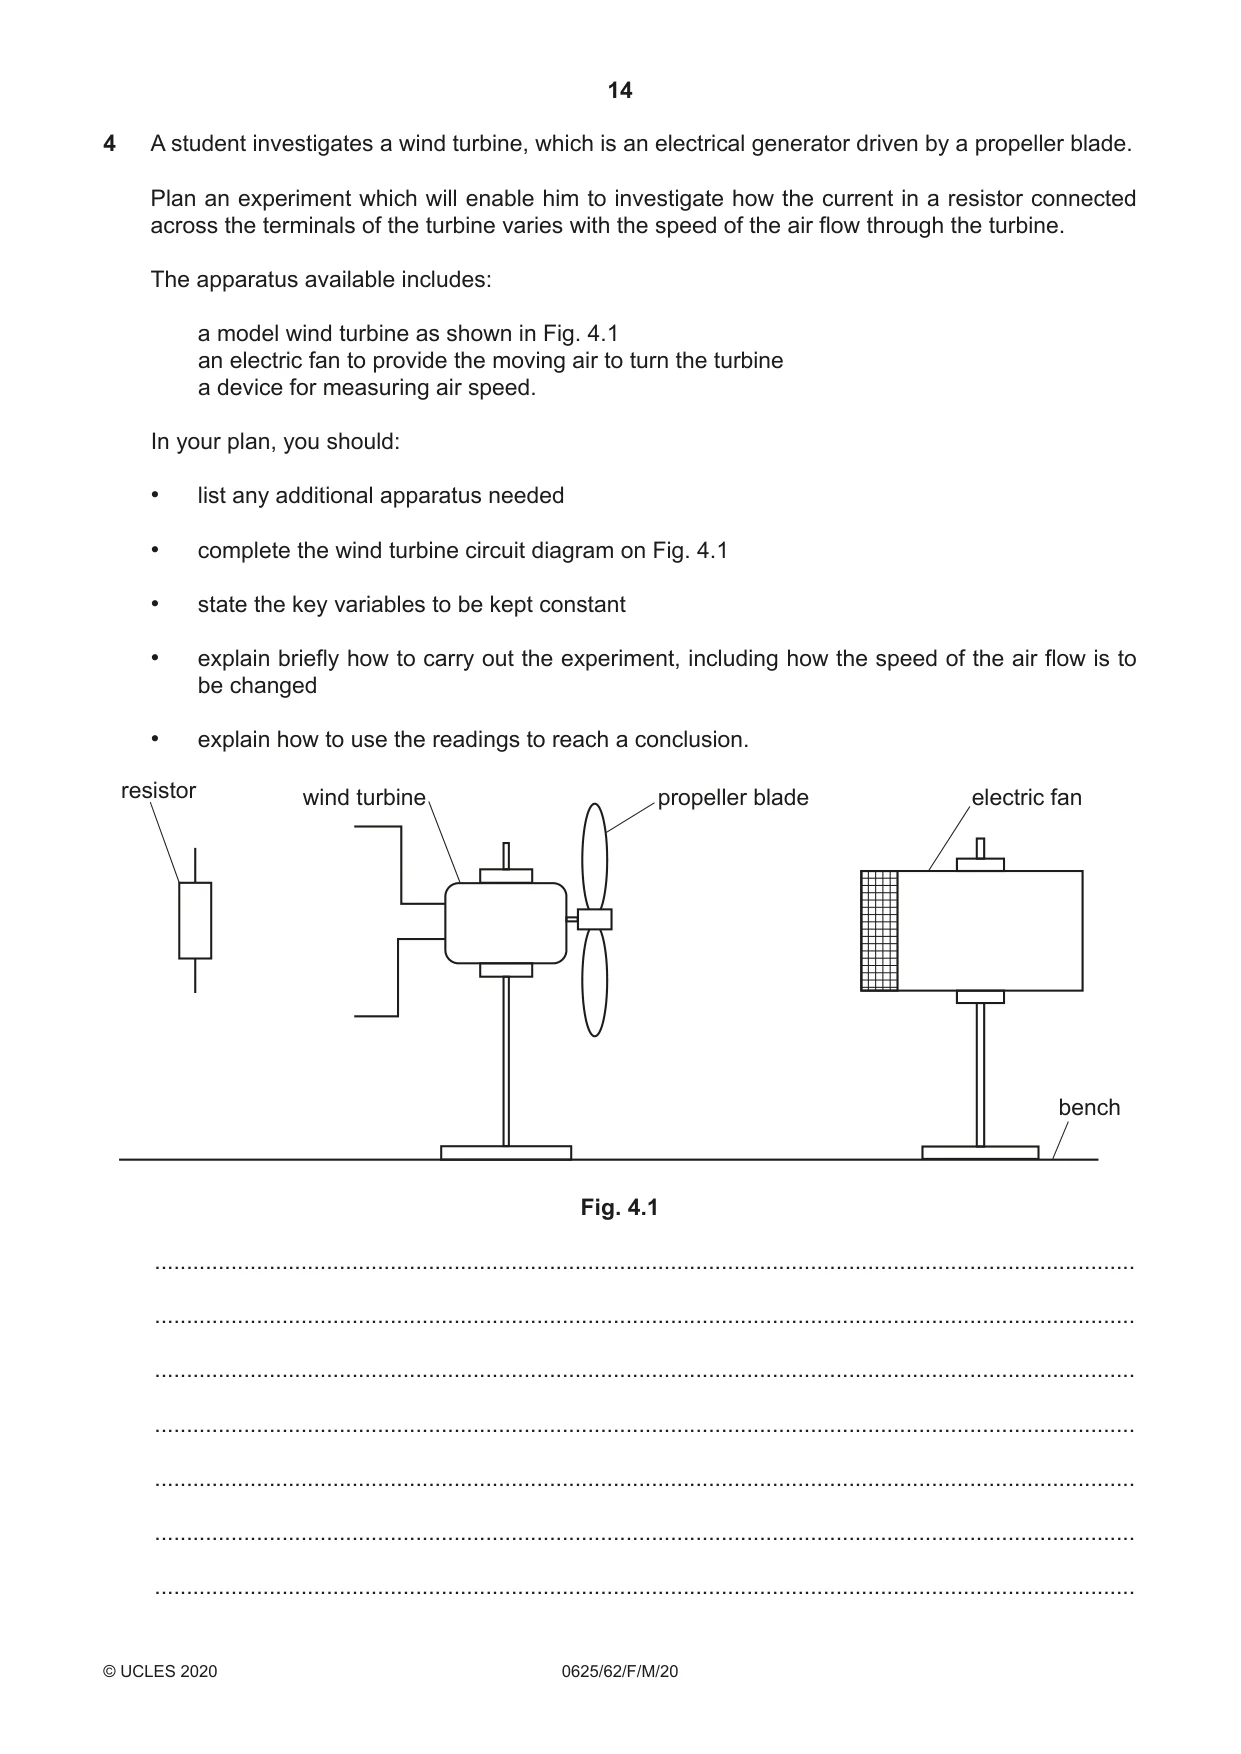
4 A student investigates a wind turbine, which is an electrical generator driven by a propeller blade. Plan an experiment which will enable him to investigate how the current in a resistor connected across the terminals of the turbine varies with the speed of the air flow through the turbine. The apparatus available includes: a model wind turbine as shown in Fig. 4.1 an electric fan to provide the moving air to turn the turbine a device for measuring air speed. In your plan, you should: • list any additional apparatus needed • complete the wind turbine circuit diagram on Fig. 4.1 • state the key variables to be kept constant • explain briefly how to carry out the experiment, including how the speed of the air flow is to be changed • explain how to use the readings to reach a conclusion. resistor wind turbine propeller blade electric fan bench Fig. 4.1 .......................................................................................................................................................... .......................................................................................................................................................... .......................................................................................................................................................... .......................................................................................................................................................... .......................................................................................................................................................... .......................................................................................................................................................... .......................................................................................................................................................... .......................................................................................................................................................... .......................................................................................................................................................... .......................................................................................................................................................... .......................................................................................................................................................... .......................................................................................................................................................... .......................................................................................................................................................... .......................................................................................................................................................... .......................................................................................................................................................... .......................................................................................................................................................... .......................................................................................................................................................... .......................................................................................................................................................... .......................................................................................................................................................... .......................................................................................................................................................... .......................................................................................................................................................... ......................................................................................................................................................... .................................................................................................................................................... [7] [Total: 7]
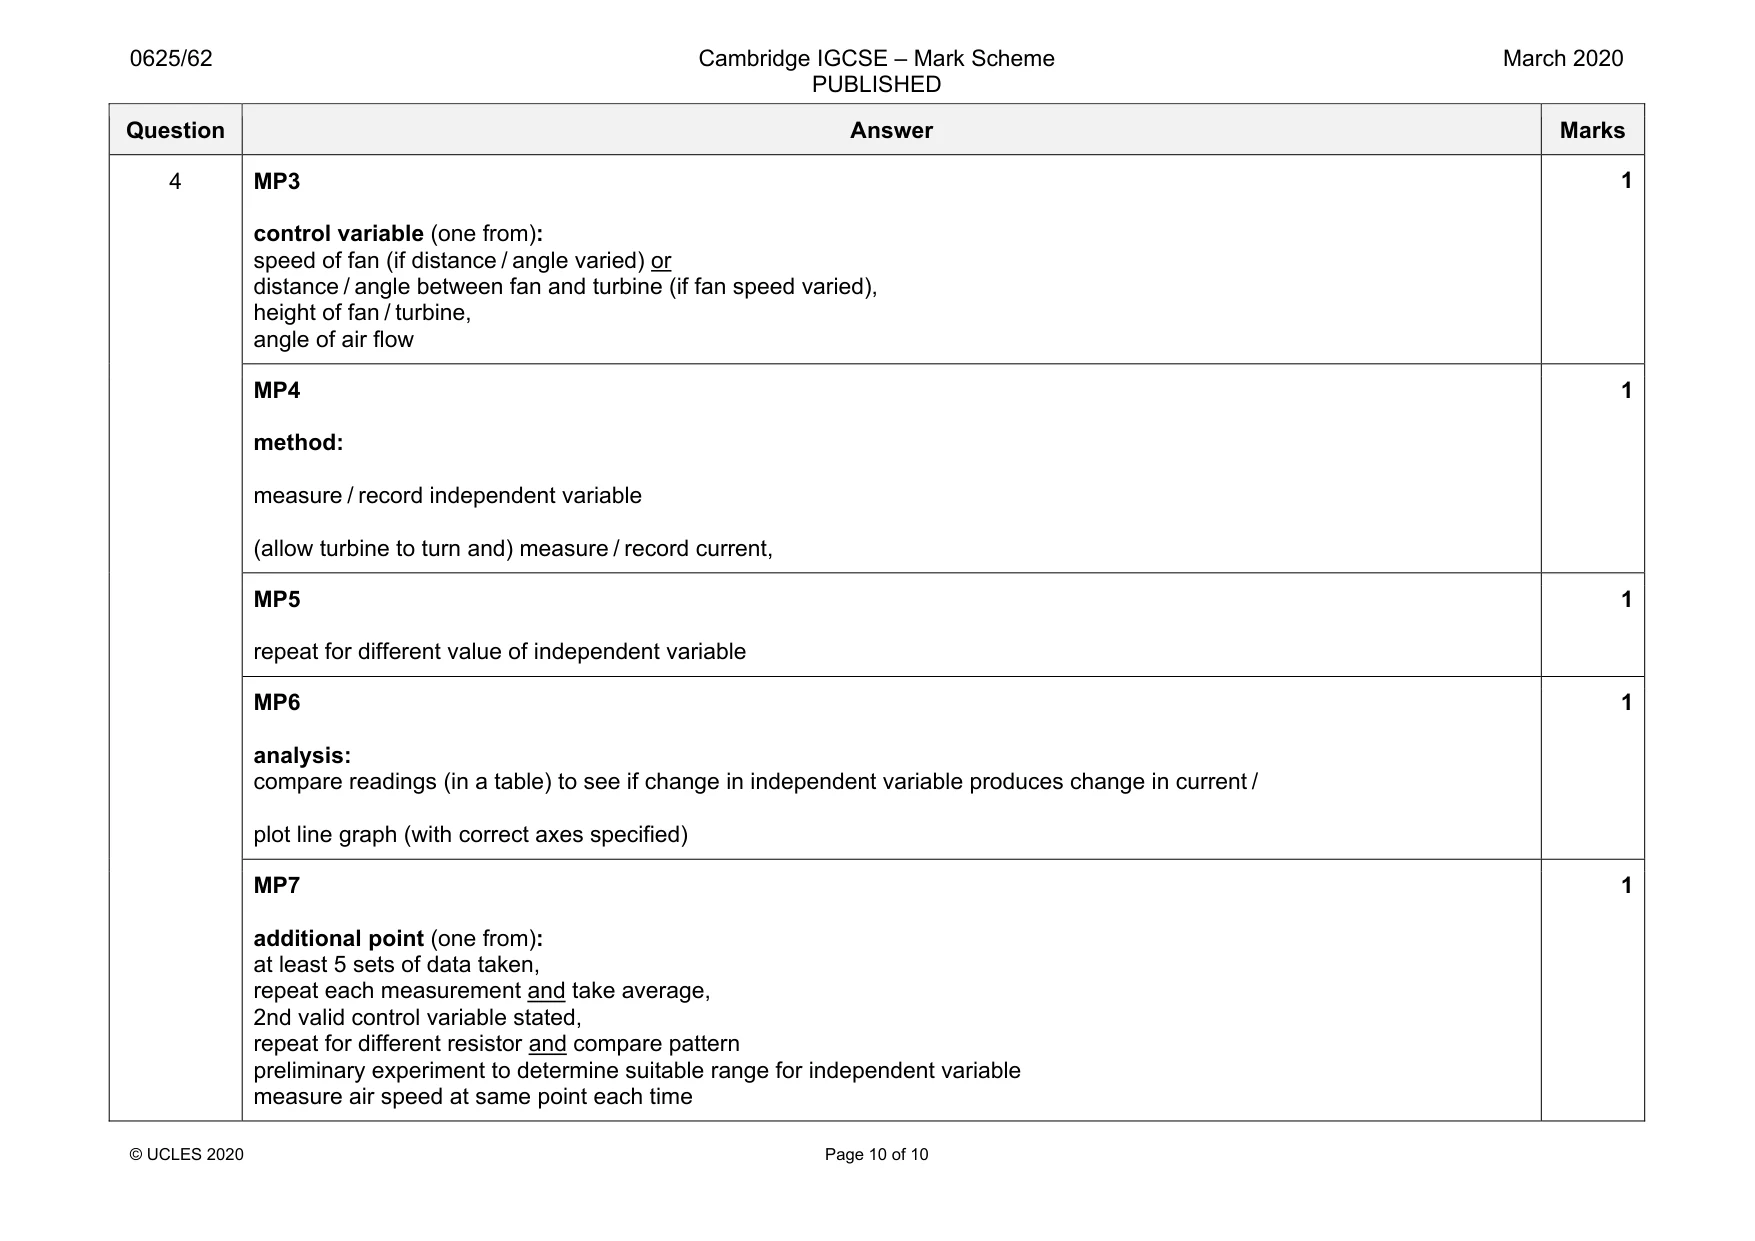
Mark scheme: 4 MP1 circuit diagram: ammeter in series with resistor and circuit correct 1 MP2 apparatus: ammeter and means of measuring candidate’s independent variable if other than air speed e.g. (metre) rule if distance is independent variable, protractor if angle of air flow is independent variable 1 Question Answer Marks 4 MP3 control variable (one from): speed of fan (if distance / angle varied) or distance / angle between fan and turbine (if fan speed varied), height of fan / turbine, angle of air flow 1 MP4 method: measure / record independent variable (allow turbine to turn and) measure / record current, 1 MP5 repeat for different value of independent variable 1 MP6 analysis: compare readings (in a table) to see if change in independent variable produces change in current / plot line graph (with correct axes specified) 1 MP7 additional point (one from): at least 5 sets of data taken, repeat each measurement and take average, 2nd valid control variable stated, repeat for different resistor and compare pattern preliminary experiment to determine suitable range for independent variable measure air speed at same point each time 1
What was in this paper
The subtopics covered by these 4 questions, and how many questions each got. Open one in a new tab to see every Cambridge question on it.
What you needed in this session
Cambridge’s own grade thresholds for 2020 Feb/March, Paper 6 · Variant 2. A higher threshold means an easier paper — the bar moves with how the cohort did.