Cambridge IGCSE Physics 0625 — 2019 Oct/Nov Paper 6 · Variant 2
0625/62/O/N/19 · 4 questions · 40 marks · ≈45 min
The question paper and its mark scheme, free to read here and free to download. This is Cambridge’s own paper, exactly as it was sat.
Question paper12 pages
Mark scheme7 pages
Answers below. Sit the paper first if you are practising.
Questions as text
Q1 · A student investigates a pendulum
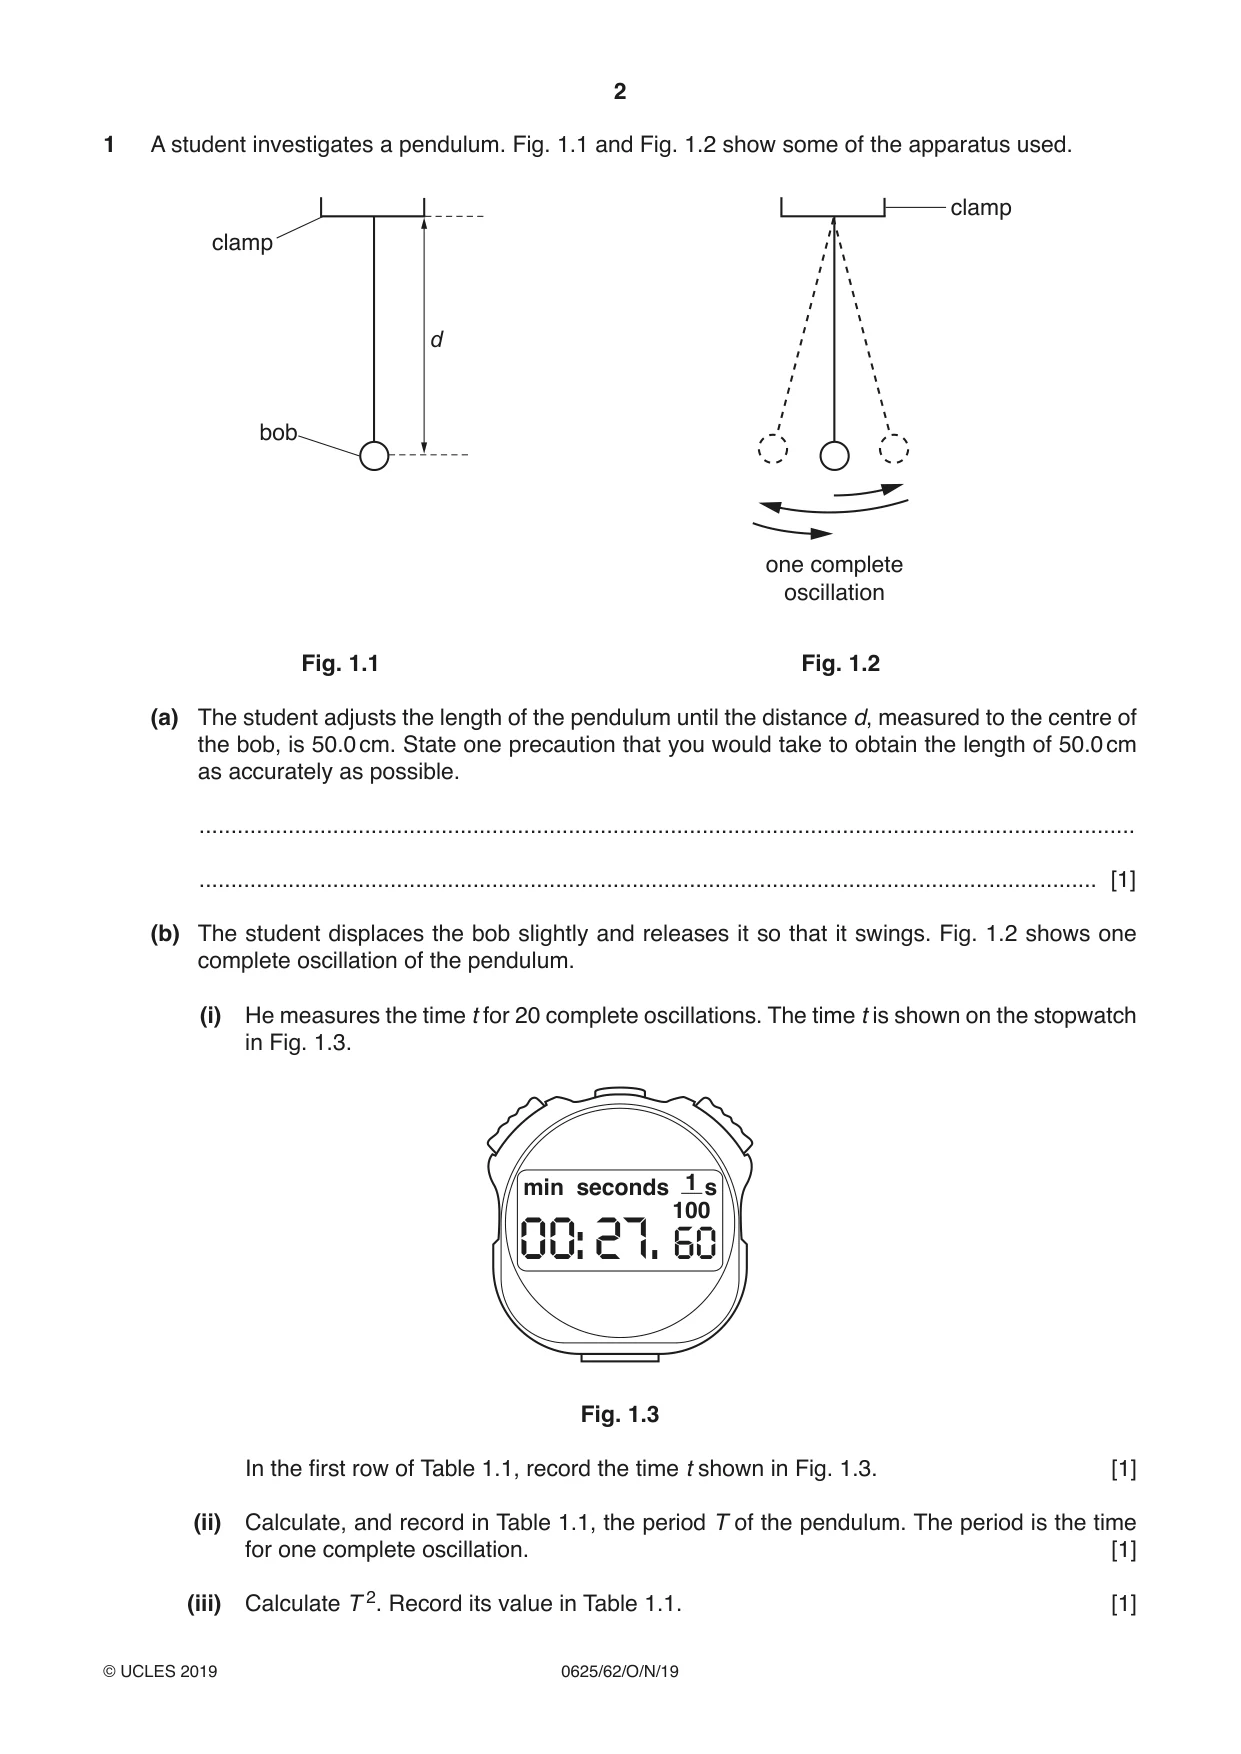
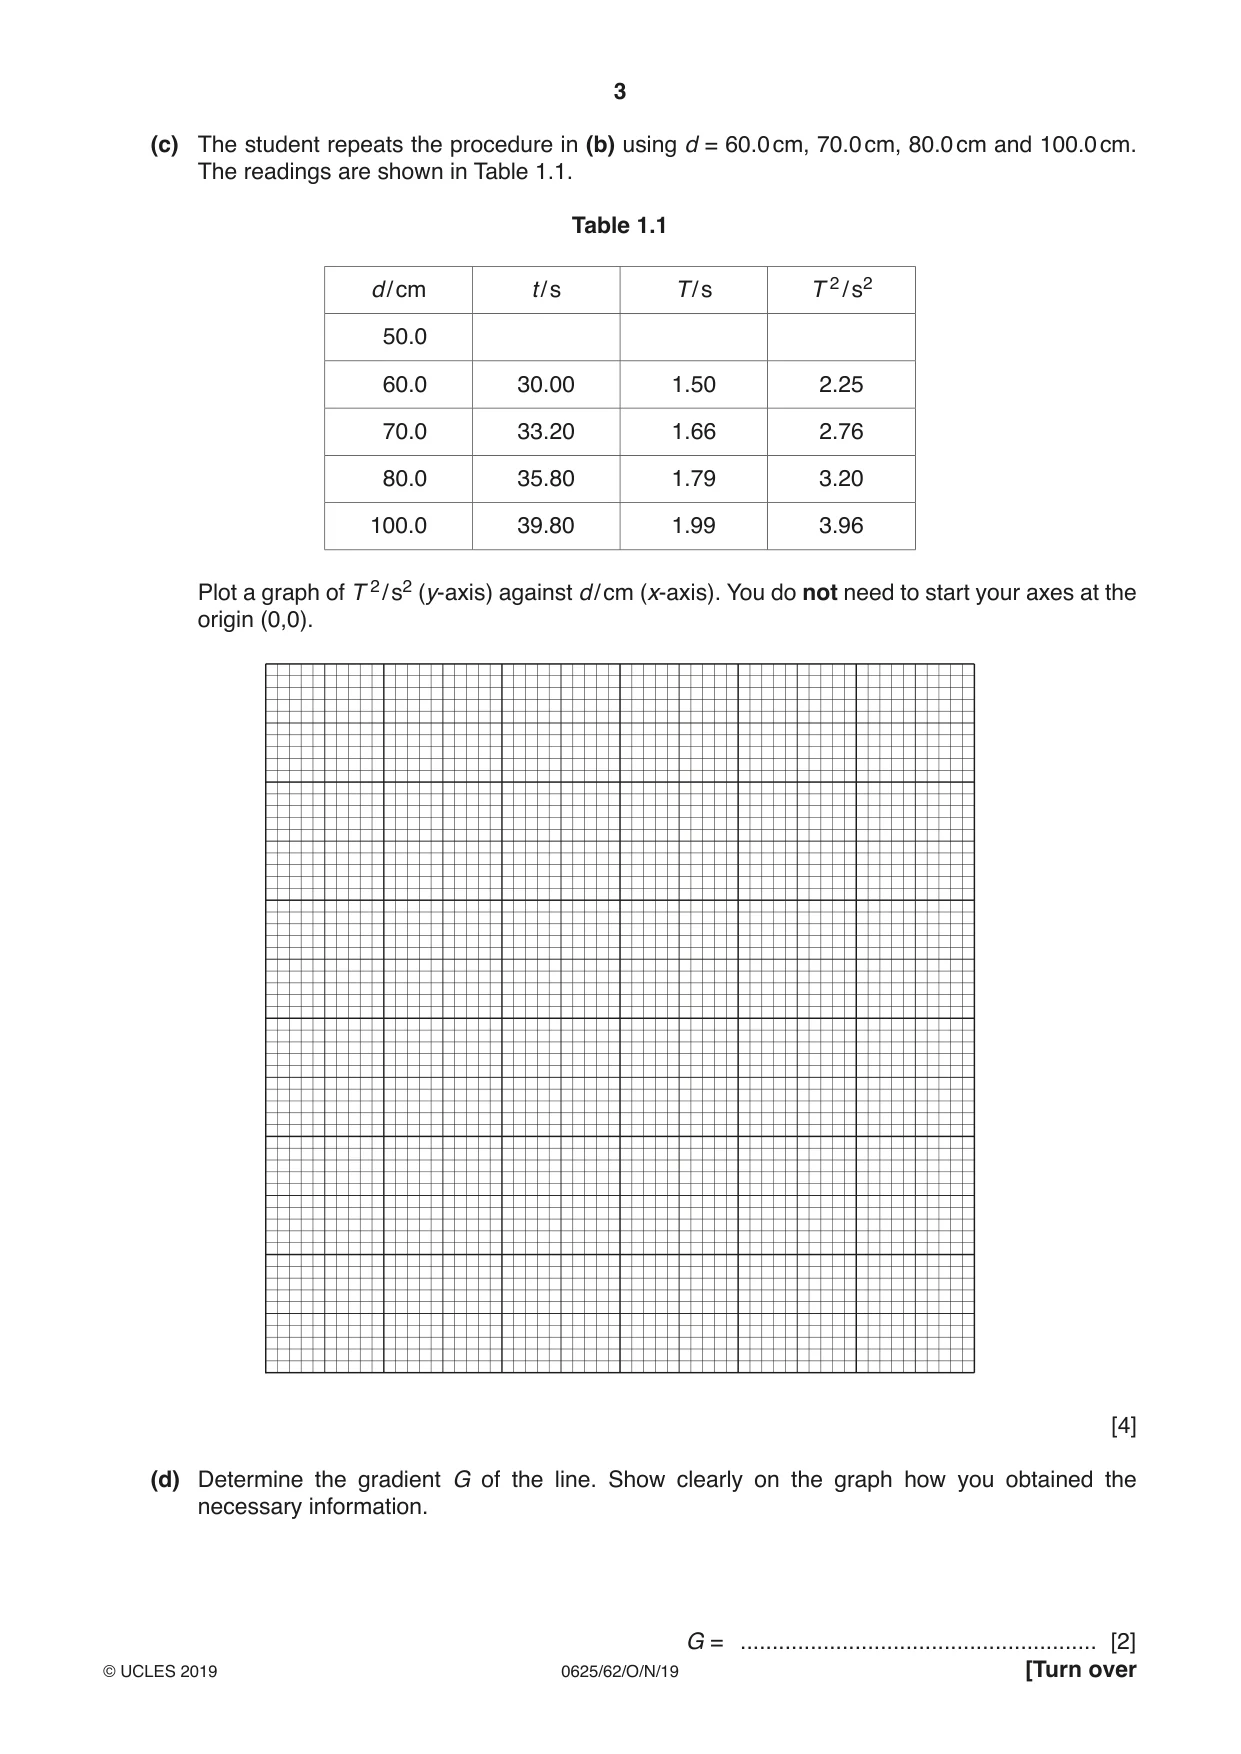
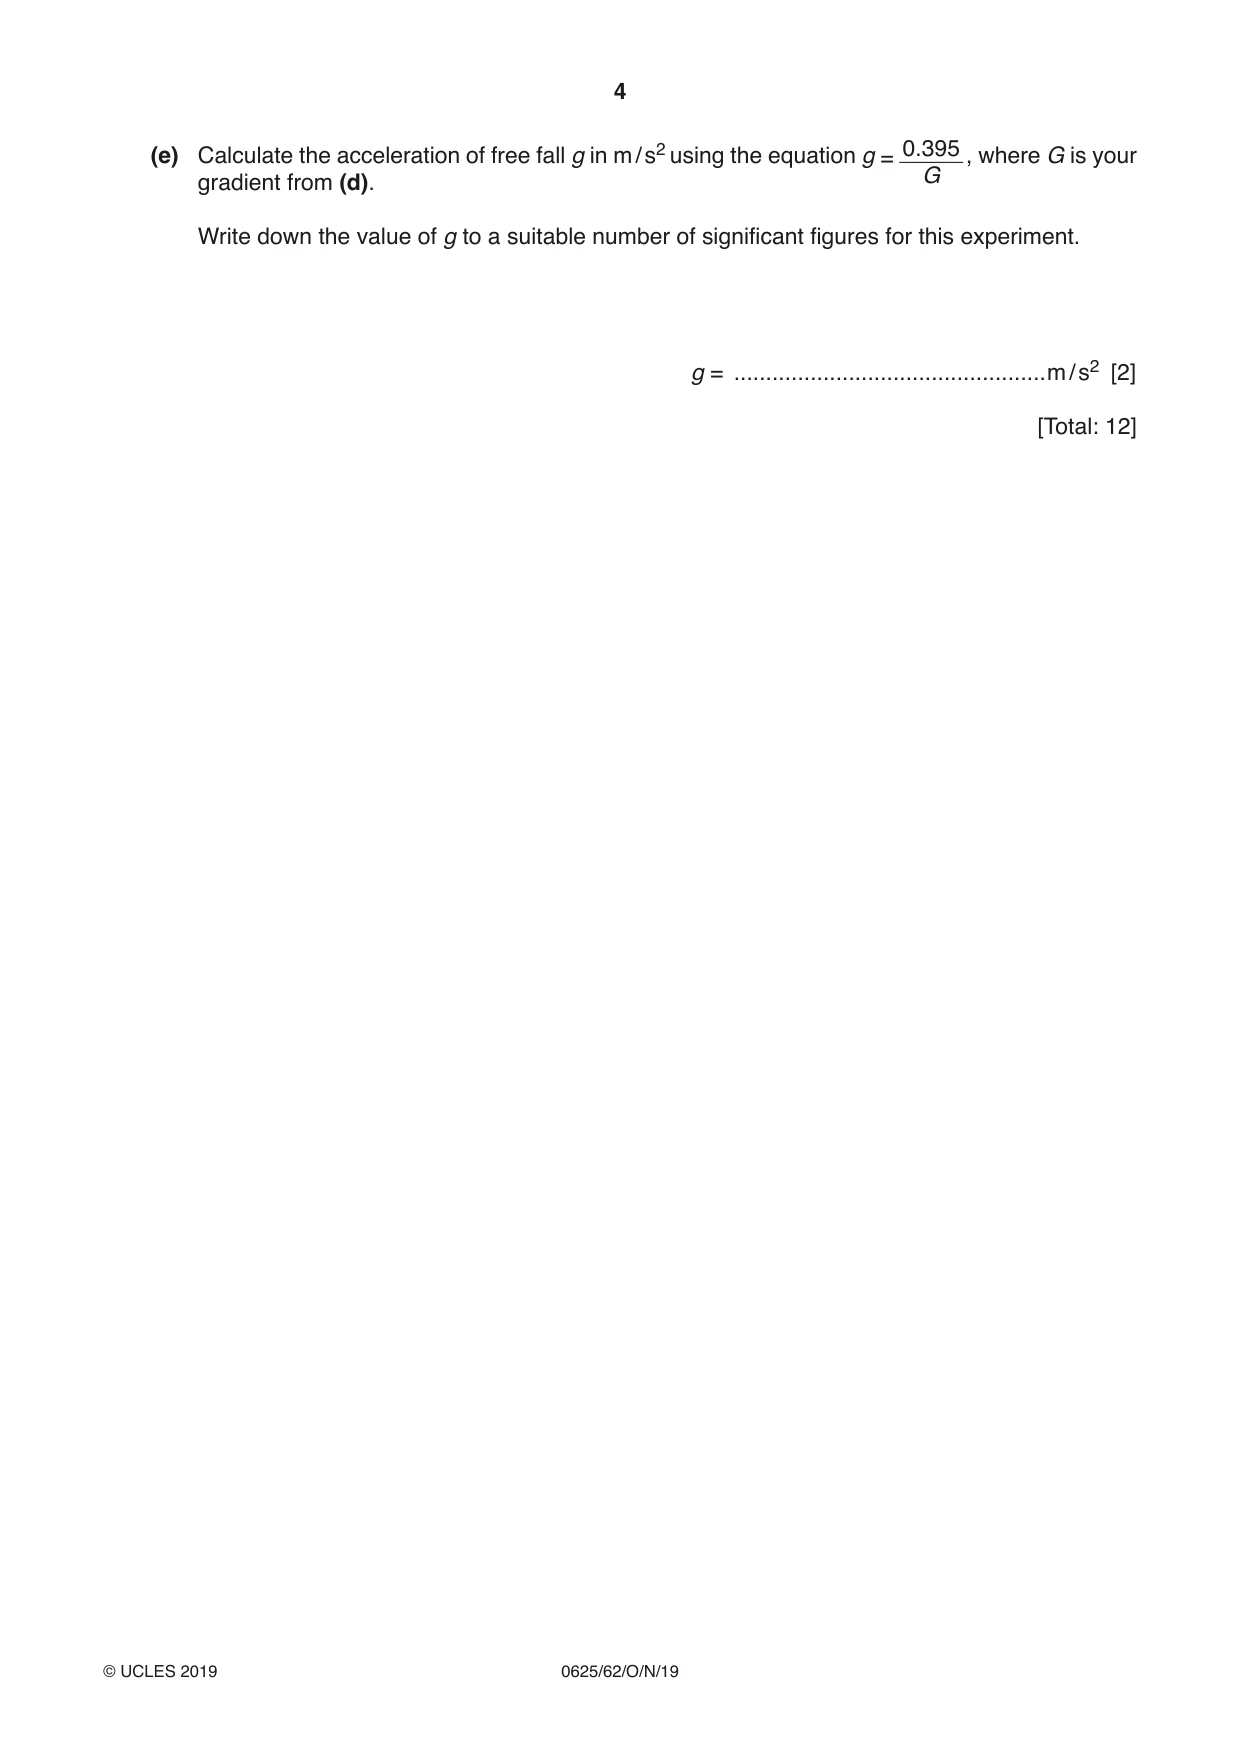
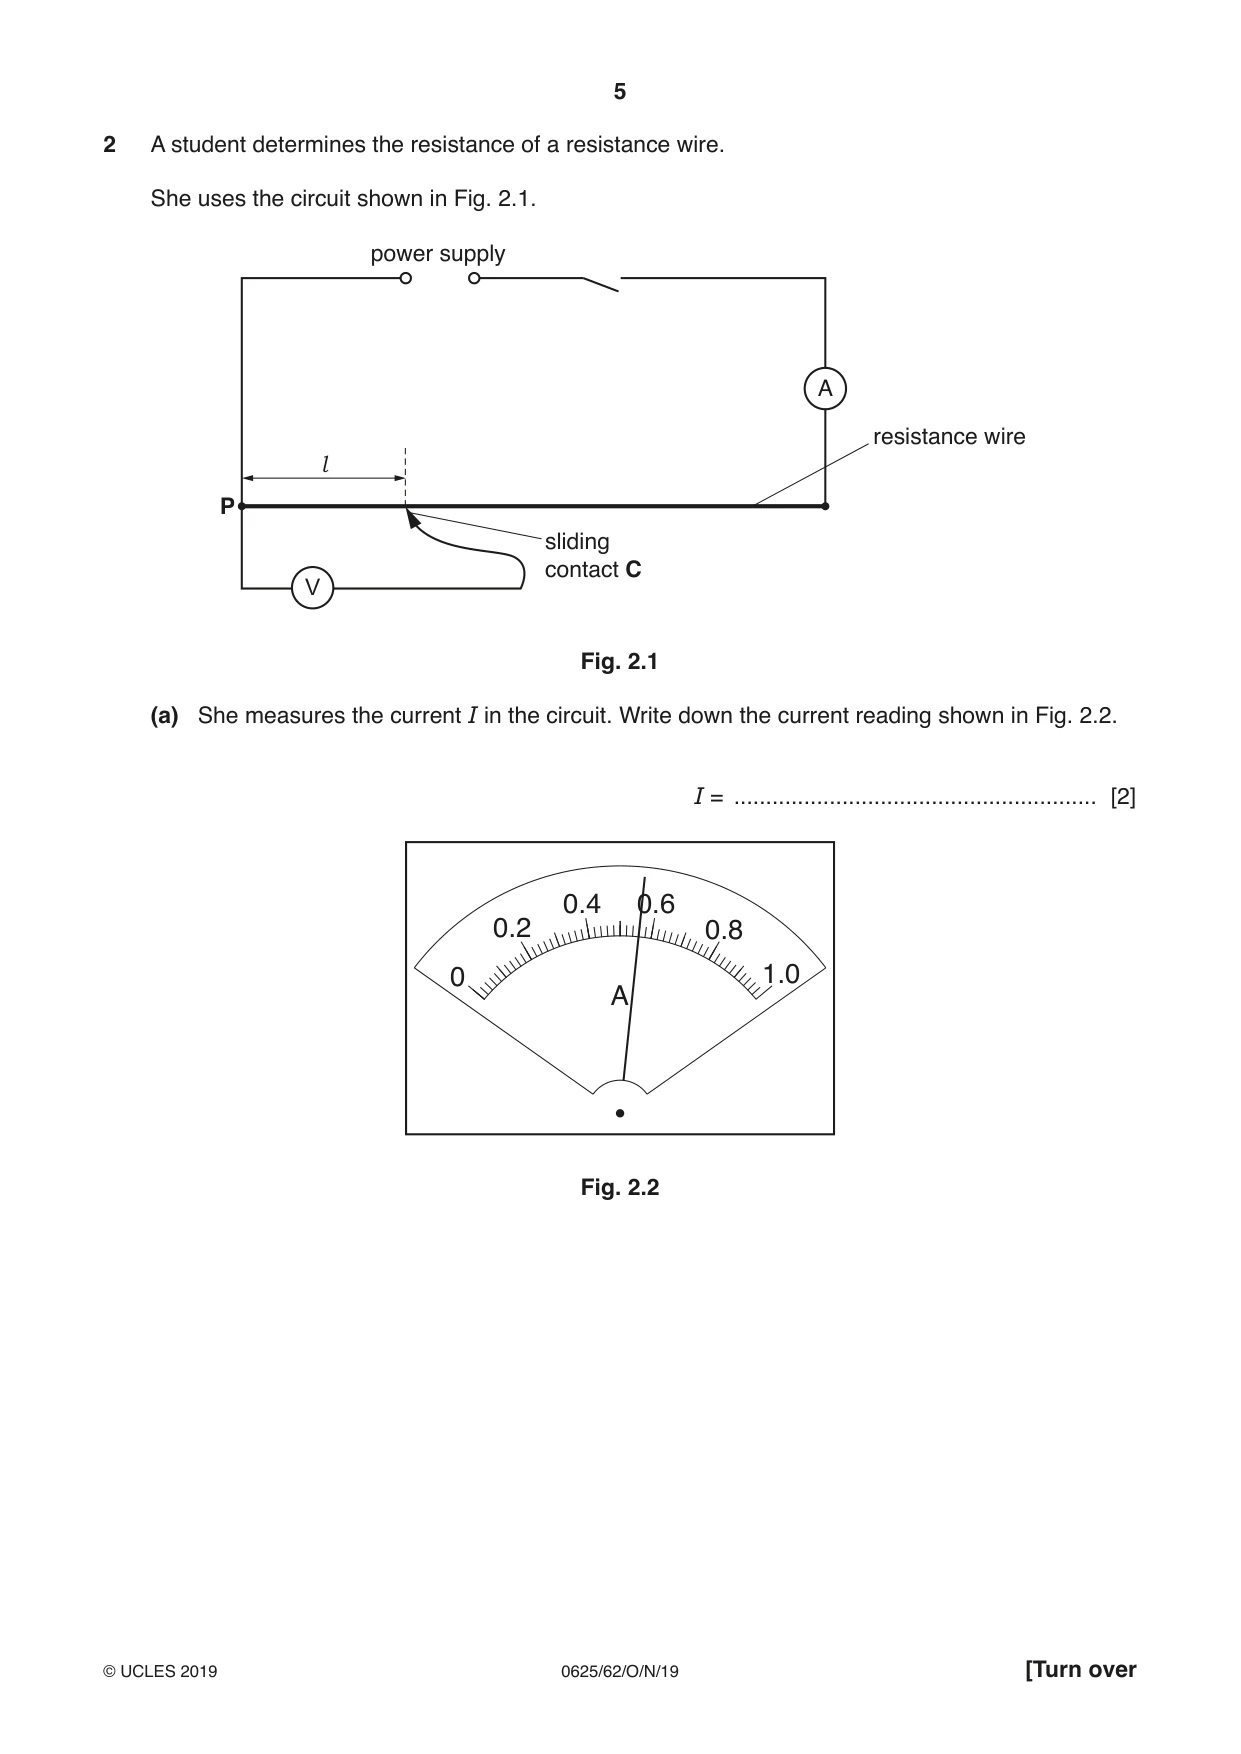
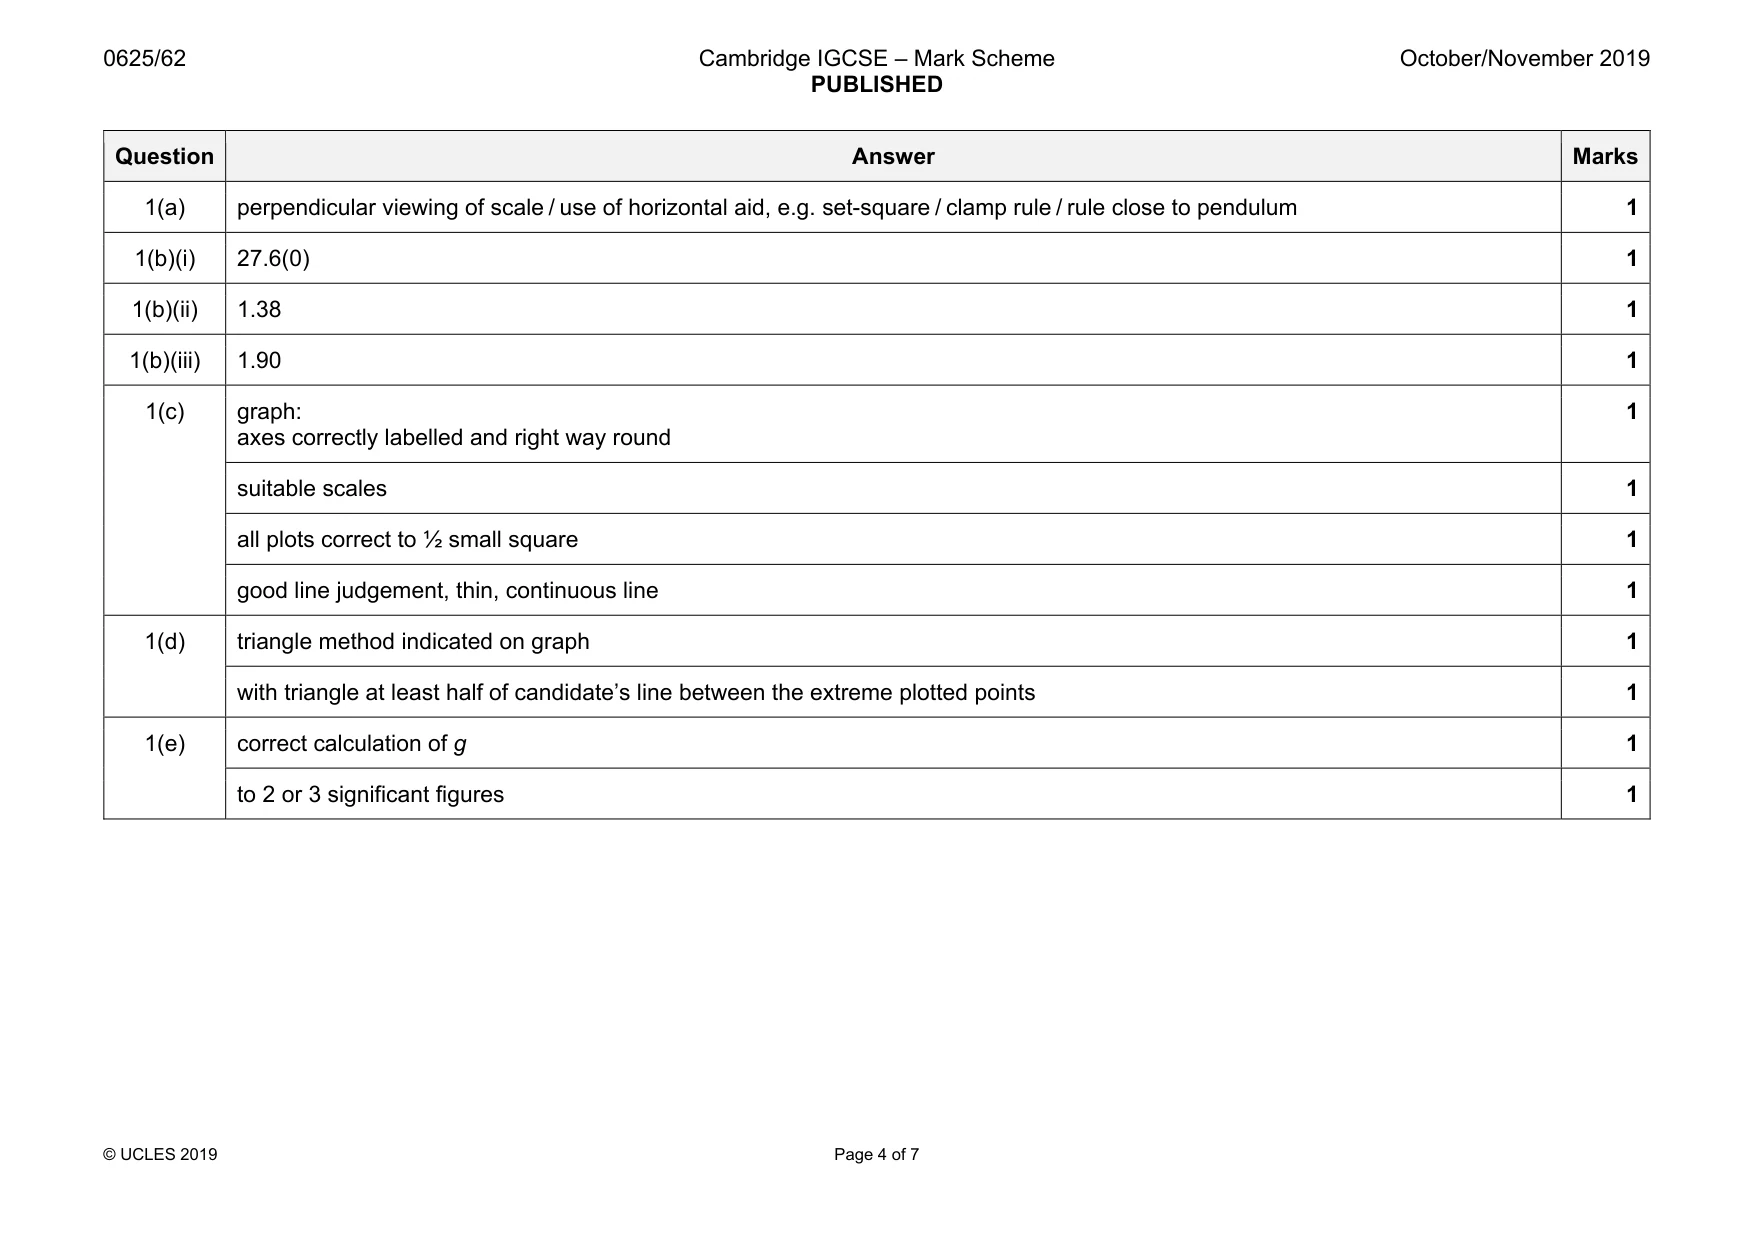
1 A student investigates a pendulum. Fig. 1.1 and Fig. 1.2 show some of the apparatus used. clamp clamp d bob one complete oscillation Fig. 1.1 Fig. 1.2 (a) The student adjusts the length of the pendulum until the distance d, measured to the centre of the bob, is 50.0 cm. State one precaution that you would take to obtain the length of 50.0 cm as accurately as possible. ................................................................................................................................................... ............................................................................................................................................. [1] (b) The student displaces the bob slightly and releases it so that it swings. Fig. 1.2 shows one complete oscillation of the pendulum. (i) He measures the time t for 20 complete oscillations. The time t is shown on the stopwatch in Fig. 1.3. min seconds 1 s 100 00: 27. 60 Fig. 1.3 In the first row of Table 1.1, record the time t shown in Fig. 1.3. [1] (ii) Calculate, and record in Table 1.1, the period T of the pendulum. The period is the time for one complete oscillation. [1] (iii) Calculate T 2. Record its value in Table 1.1. [1] (c) The student repeats the procedure in (b) using d = 60.0 cm, 70.0 cm, 80.0 cm and 100.0 cm. The readings are shown in Table 1.1. Table 1.1 d / cm t / s T / s T 2 / s2 50.0 60.0 30.00 1.50 2.25 70.0 33.20 1.66 2.76 80.0 35.80 1.79 3.20 100.0 39.80 1.99 3.96 Plot a graph of T 2 / s2 (y-axis) against d / cm (x-axis). You do not need to start your axes at the origin (0,0). [4] (d) Determine the gradient G of the line. Show clearly on the graph how you obtained the necessary information. 0.395(e) Calculate the acceleration of free fall g in m / s2 using the equation g = , where G is your G gradient from (d). Write down the value of g to a suitable number of significant figures for this experiment. g = .................................................m / s2 [2] [Total: 12]
Mark scheme: 1(a) perpendicular viewing of scale / use of horizontal aid, e.g. set-square / clamp rule / rule close to pendulum 1 1(b)(i) 27.6(0) 1 1(b)(ii) 1.38 1 1(b)(iii) 1.90 1 1(c) graph: axes correctly labelled and right way round 1 suitable scales 1 all plots correct to ½ small square 1 good line judgement, thin, continuous line 1 1(d) triangle method indicated on graph 1 with triangle at least half of candidate’s line between the extreme plotted points 1 1(e) correct calculation of g 1 to 2 or 3 significant figures 1
Q2 · A student determines the resistance of a resistance wire
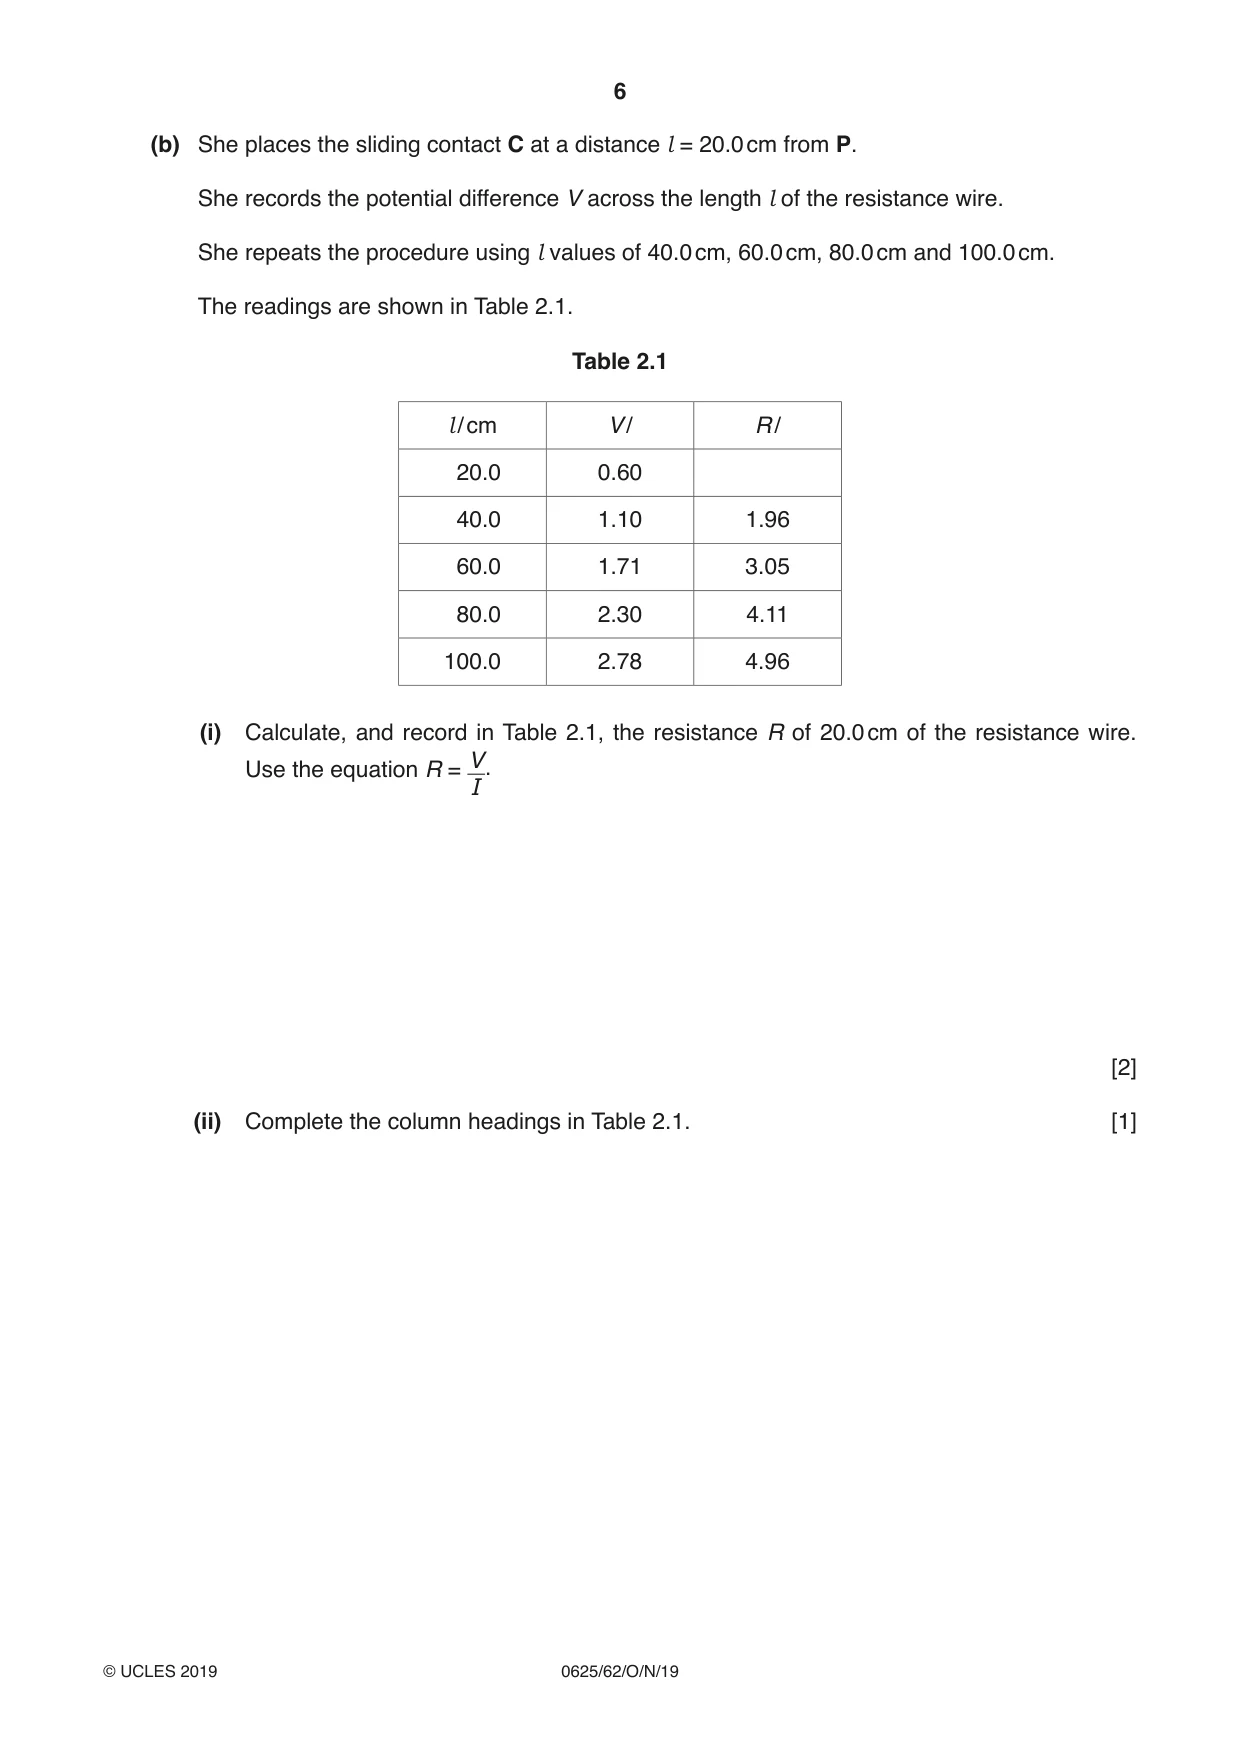
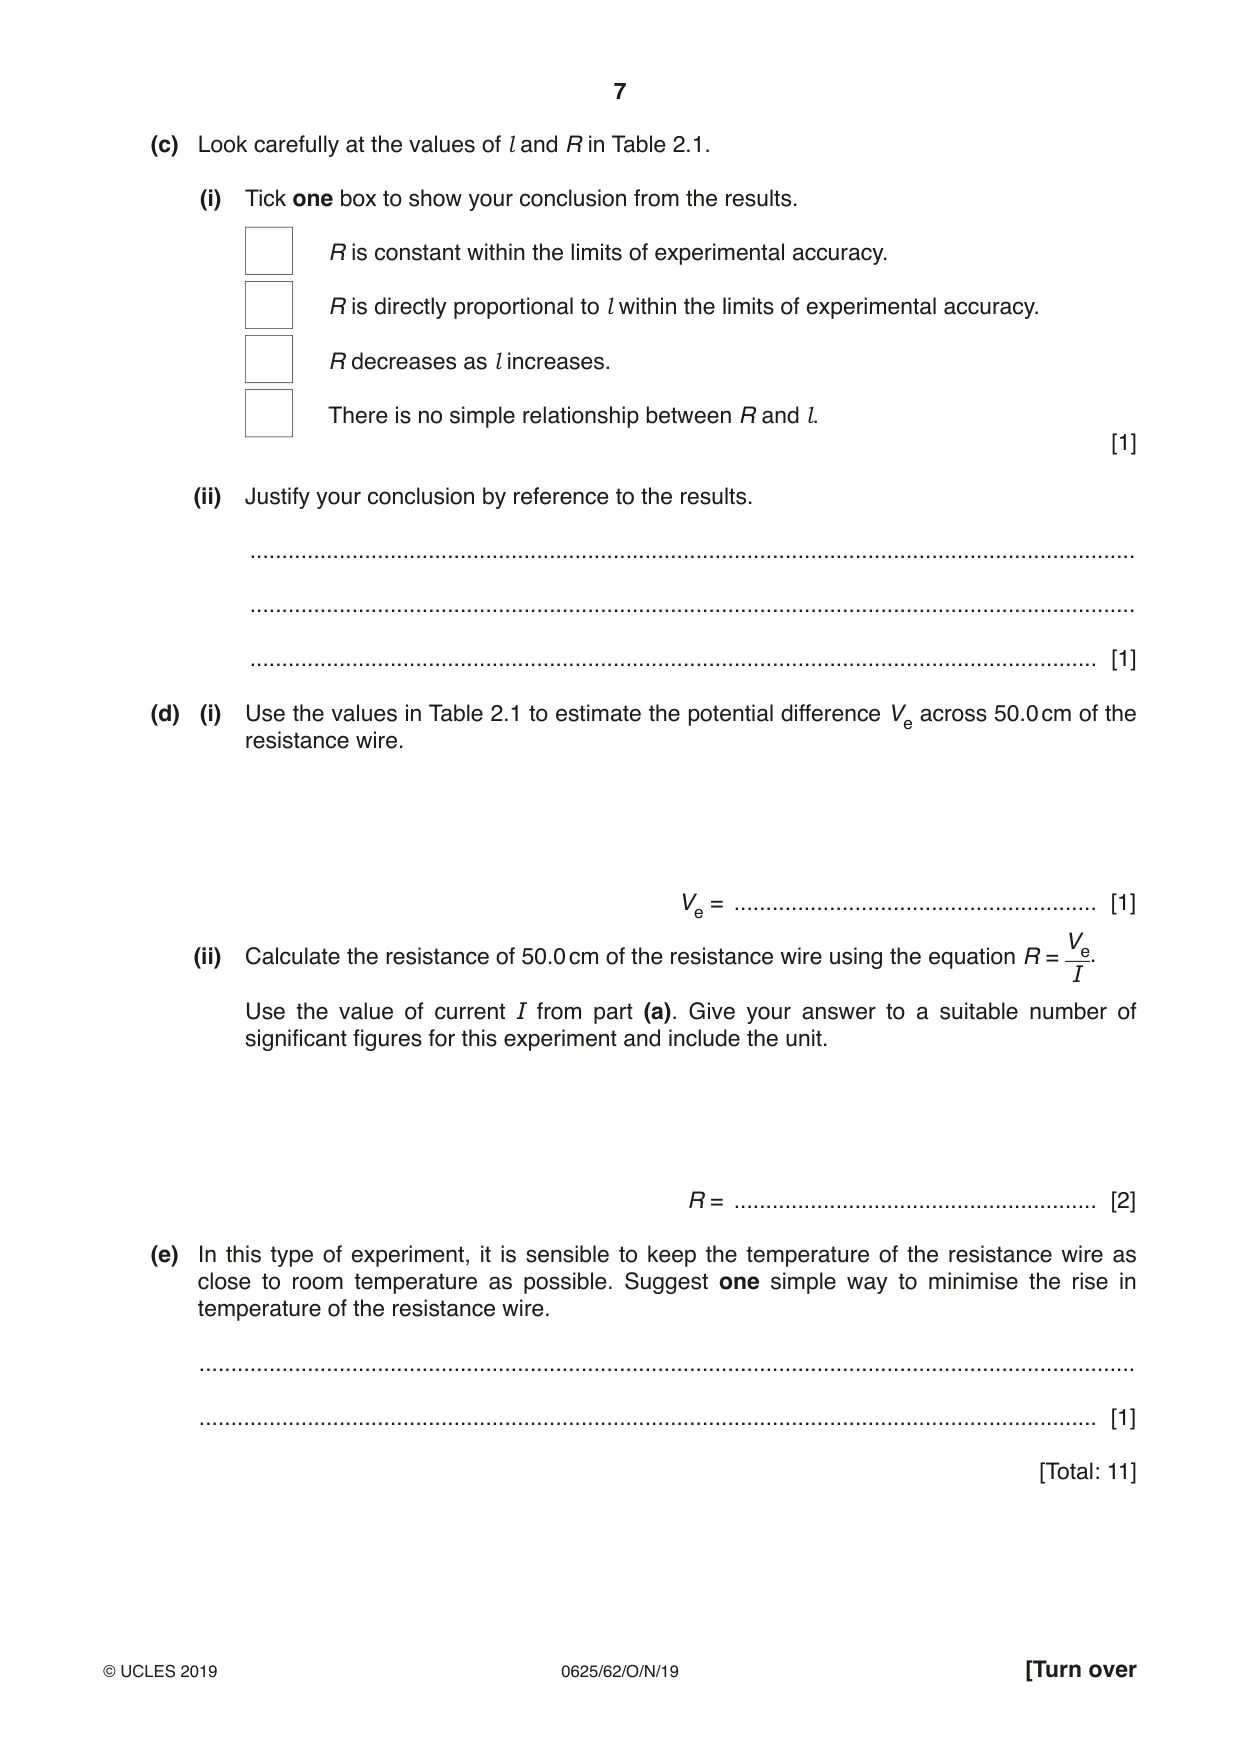
2 A student determines the resistance of a resistance wire. She uses the circuit shown in Fig. 2.1. power supply A resistance wire l P sliding contact C V Fig. 2.1 (a) She measures the current I in the circuit. Write down the current reading shown in Fig. 2.2. I = ......................................................... [2] 0.4 0.6 0.2 0.8 0 1.0 A Fig. 2.2 (b) She places the sliding contact C at a distance l = 20.0 cm from P. She records the potential difference V across the length l of the resistance wire. She repeats the procedure using l values of 40.0 cm, 60.0 cm, 80.0 cm and 100.0 cm. The readings are shown in Table 2.1. Table 2.1 l / cm V / R / 20.0 0.60 40.0 1.10 1.96 60.0 1.71 3.05 80.0 2.30 4.11 100.0 2.78 4.96 (i) Calculate, and record in Table 2.1, the resistance R of 20.0 cm of the resistance wire. V Use the equation R = . I [2] (ii) Complete the column headings in Table 2.1. [1] (c) Look carefully at the values of l and R in Table 2.1. (i) Tick one box to show your conclusion from the results. R is constant within the limits of experimental accuracy. R is directly proportional to l within the limits of experimental accuracy. R decreases as l increases. There is no simple relationship between R and l. [1] (ii) Justify your conclusion by reference to the results. ........................................................................................................................................... ........................................................................................................................................... ..................................................................................................................................... [1] (d) (i) Use the values in Table 2.1 to estimate the potential difference Ve across 50.0 cm of the resistance wire. Ve = ......................................................... [1] Ve (ii) Calculate the resistance of 50.0 cm of the resistance wire using the equation R = . I Use the value of current I from part (a). Give your answer to a suitable number of significant figures for this experiment and include the unit. R = ......................................................... [2] (e) In this type of experiment, it is sensible to keep the temperature of the resistance wire as close to room temperature as possible. Suggest one simple way to minimise the rise in temperature of the resistance wire. ................................................................................................................................................... ............................................................................................................................................. [1] [Total: 11]
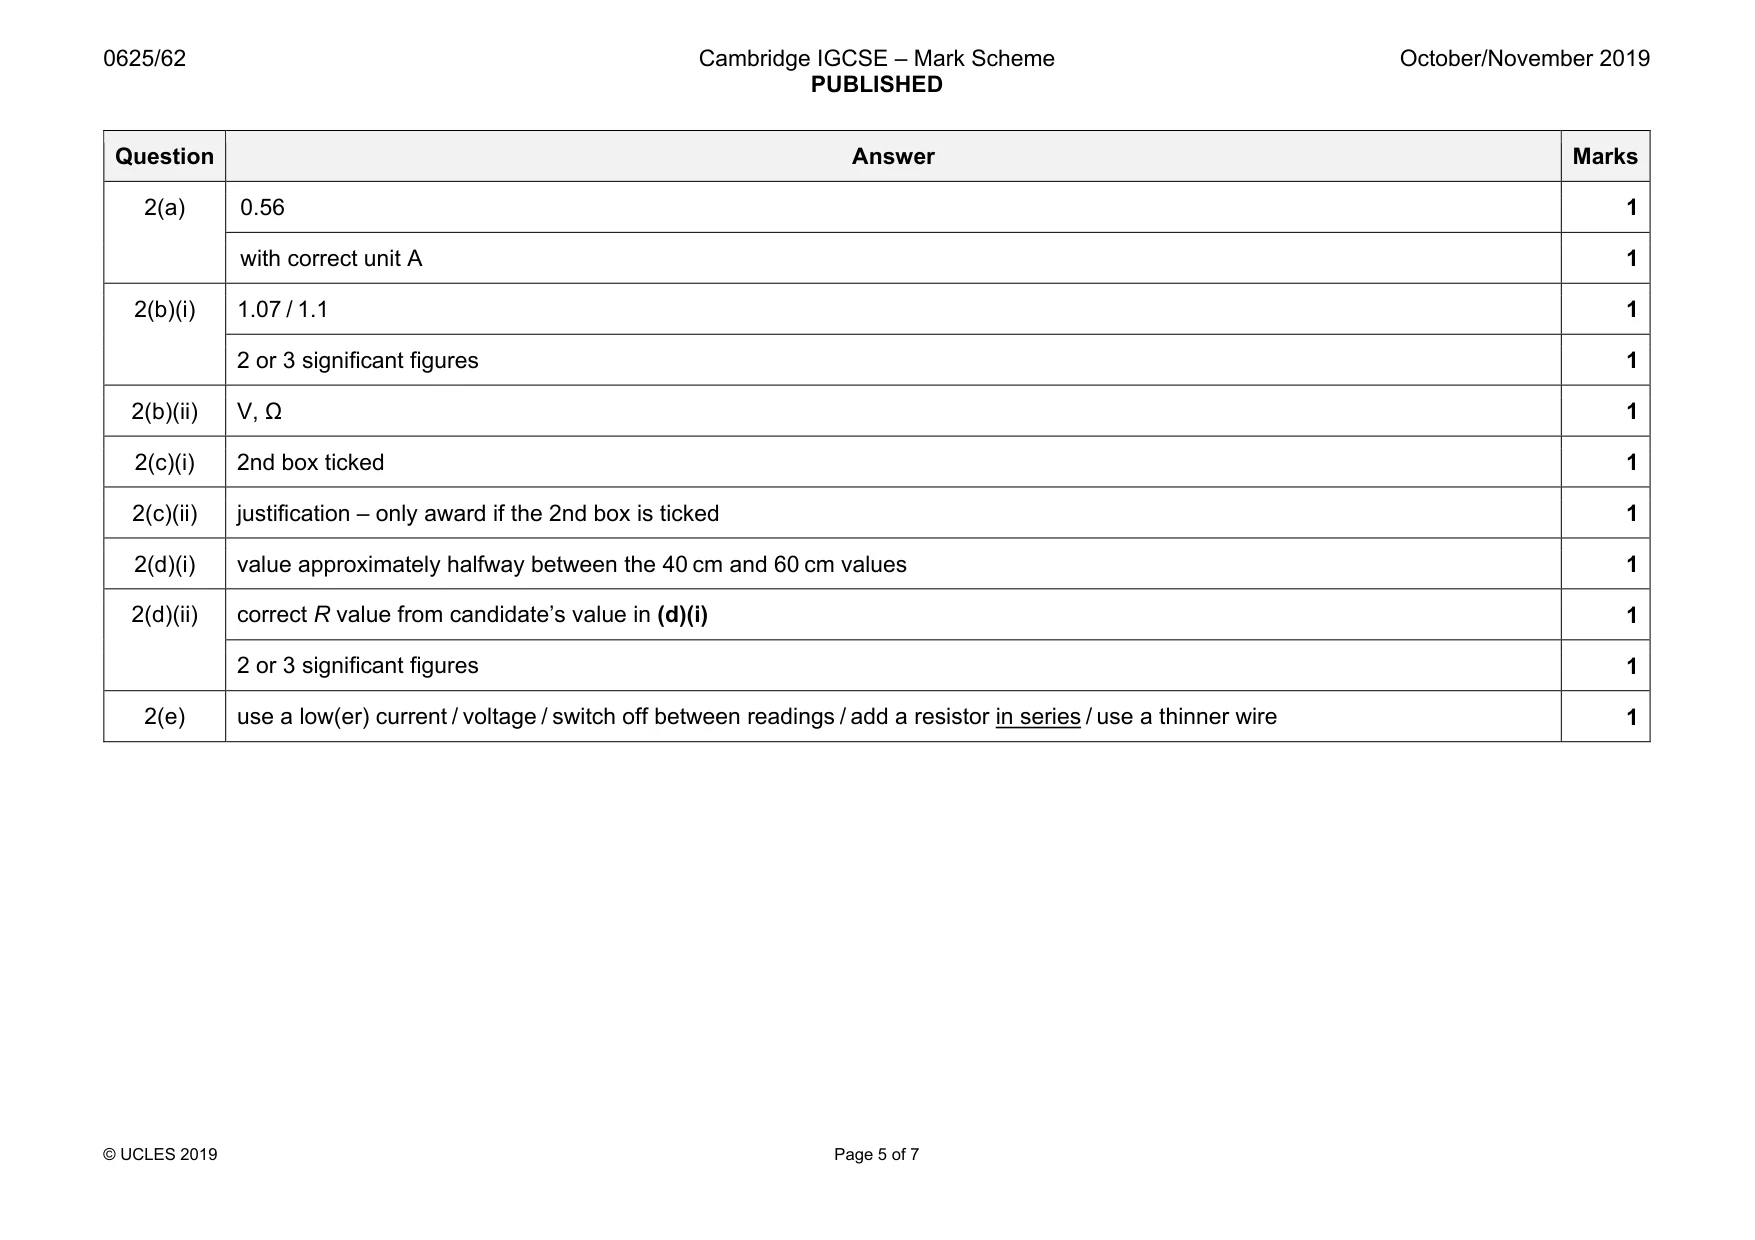
Mark scheme: 2(a) 0.56 1 with correct unit A 1 2(b)(i) 1.07 / 1.1 1 2 or 3 significant figures 1 2(b)(ii) V, Ω 1 2(c)(i) 2nd box ticked 1 2(c)(ii) justification – only award if the 2nd box is ticked 1 2(d)(i) value approximately halfway between the 40 cm and 60 cm values 1 2(d)(ii) correct R value from candidate’s value in (d)(i) 1 2 or 3 significant figures 1 2(e) use a low(er) current / voltage / switch off between readings / add a resistor in series / use a thinner wire 1
Q3 · A student determines the focal length f of a lens
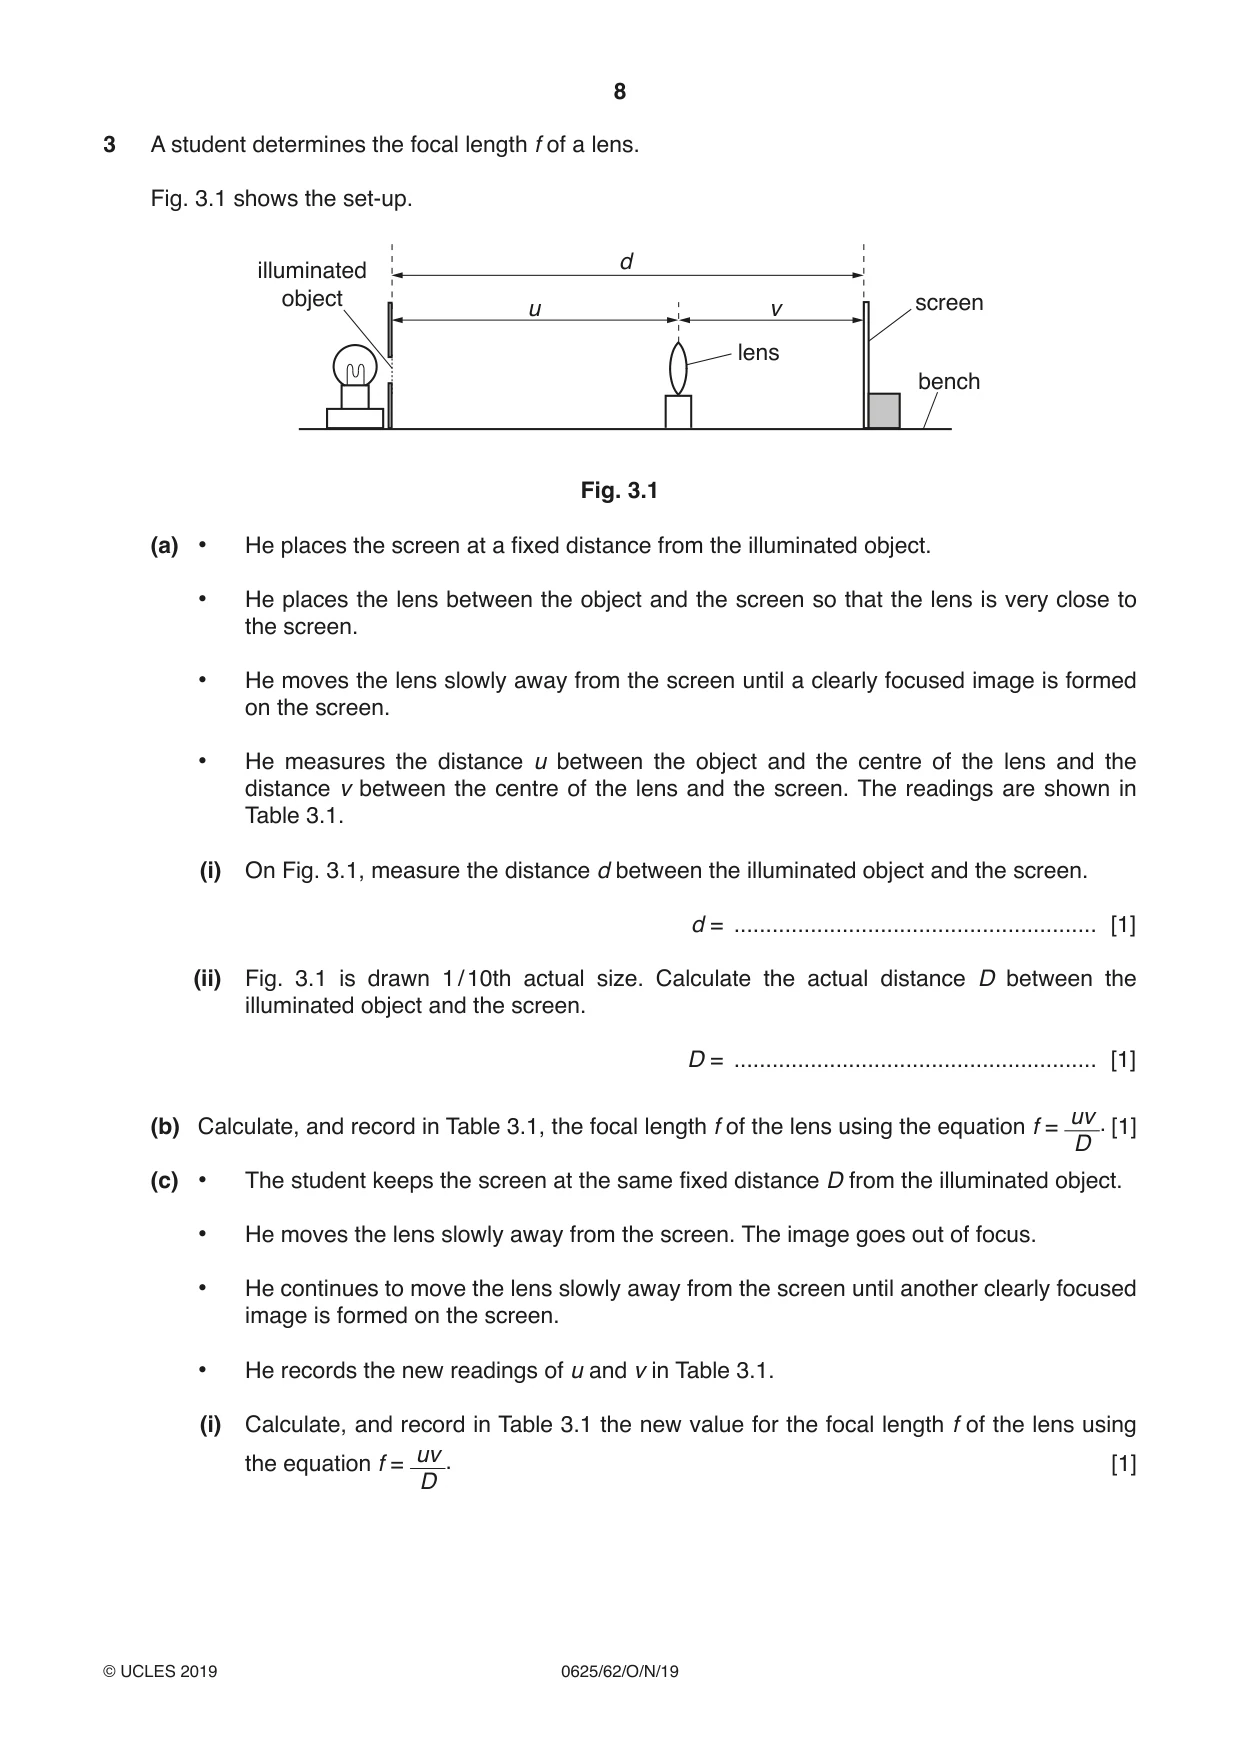
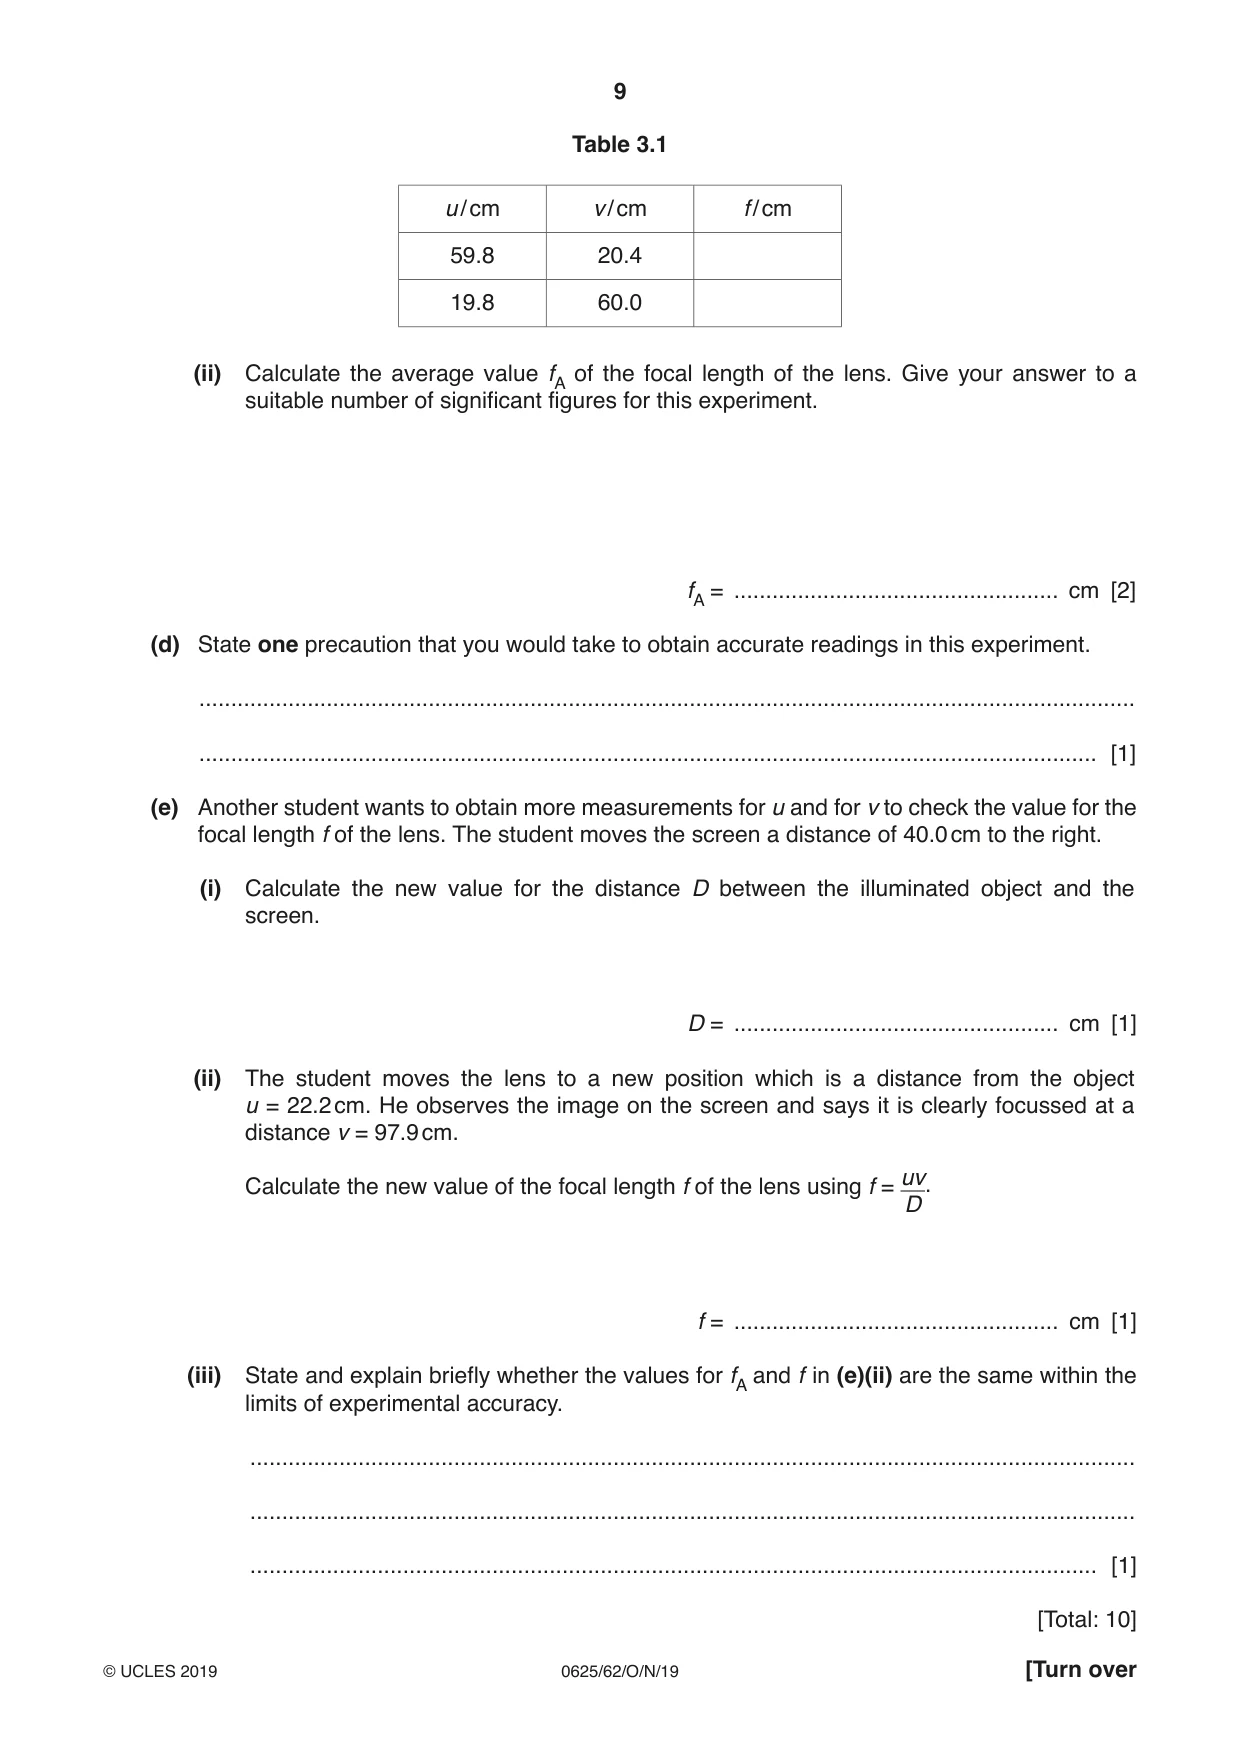
3 A student determines the focal length f of a lens. Fig. 3.1 shows the set-up. d illuminated object u v screen lens bench Fig. 3.1 (a) • He places the screen at a fixed distance from the illuminated object. • He places the lens between the object and the screen so that the lens is very close to the screen. • He moves the lens slowly away from the screen until a clearly focused image is formed on the screen. • He measures the distance u between the object and the centre of the lens and the distance v between the centre of the lens and the screen. The readings are shown in Table 3.1. (i) On Fig. 3.1, measure the distance d between the illuminated object and the screen. d = ......................................................... [1] (ii) Fig. 3.1 is drawn 1 / 10th actual size. Calculate the actual distance D between the illuminated object and the screen. D = ......................................................... [1] uv (b) Calculate, and record in Table 3.1, the focal length f of the lens using the equation f = . [1] D (c) • The student keeps the screen at the same fixed distance D from the illuminated object. • He moves the lens slowly away from the screen. The image goes out of focus. • He continues to move the lens slowly away from the screen until another clearly focused image is formed on the screen. • He records the new readings of u and v in Table 3.1. (i) Calculate, and record in Table 3.1 the new value for the focal length f of the lens using uv the equation f = . [1] D Table 3.1 u / cm v / cm f / cm 59.8 20.4 19.8 60.0 (ii) Calculate the average value fA of the focal length of the lens. Give your answer to a suitable number of significant figures for this experiment. fA = ................................................... cm [2] (d) State one precaution that you would take to obtain accurate readings in this experiment. ................................................................................................................................................... ............................................................................................................................................. [1] (e) Another student wants to obtain more measurements for u and for v to check the value for the focal length f of the lens. The student moves the screen a distance of 40.0 cm to the right. (i) Calculate the new value for the distance D between the illuminated object and the screen. D = ................................................... cm [1] (ii) The student moves the lens to a new position which is a distance from the object u = 22.2 cm. He observes the image on the screen and says it is clearly focussed at a distance v = 97.9 cm. uv Calculate the new value of the focal length f of the lens using f = . D f = ................................................... cm [1] (iii) State and explain briefly whether the values for fA and f in (e)(ii) are the same within the limits of experimental accuracy. ........................................................................................................................................... ........................................................................................................................................... ..................................................................................................................................... [1] [Total: 10]
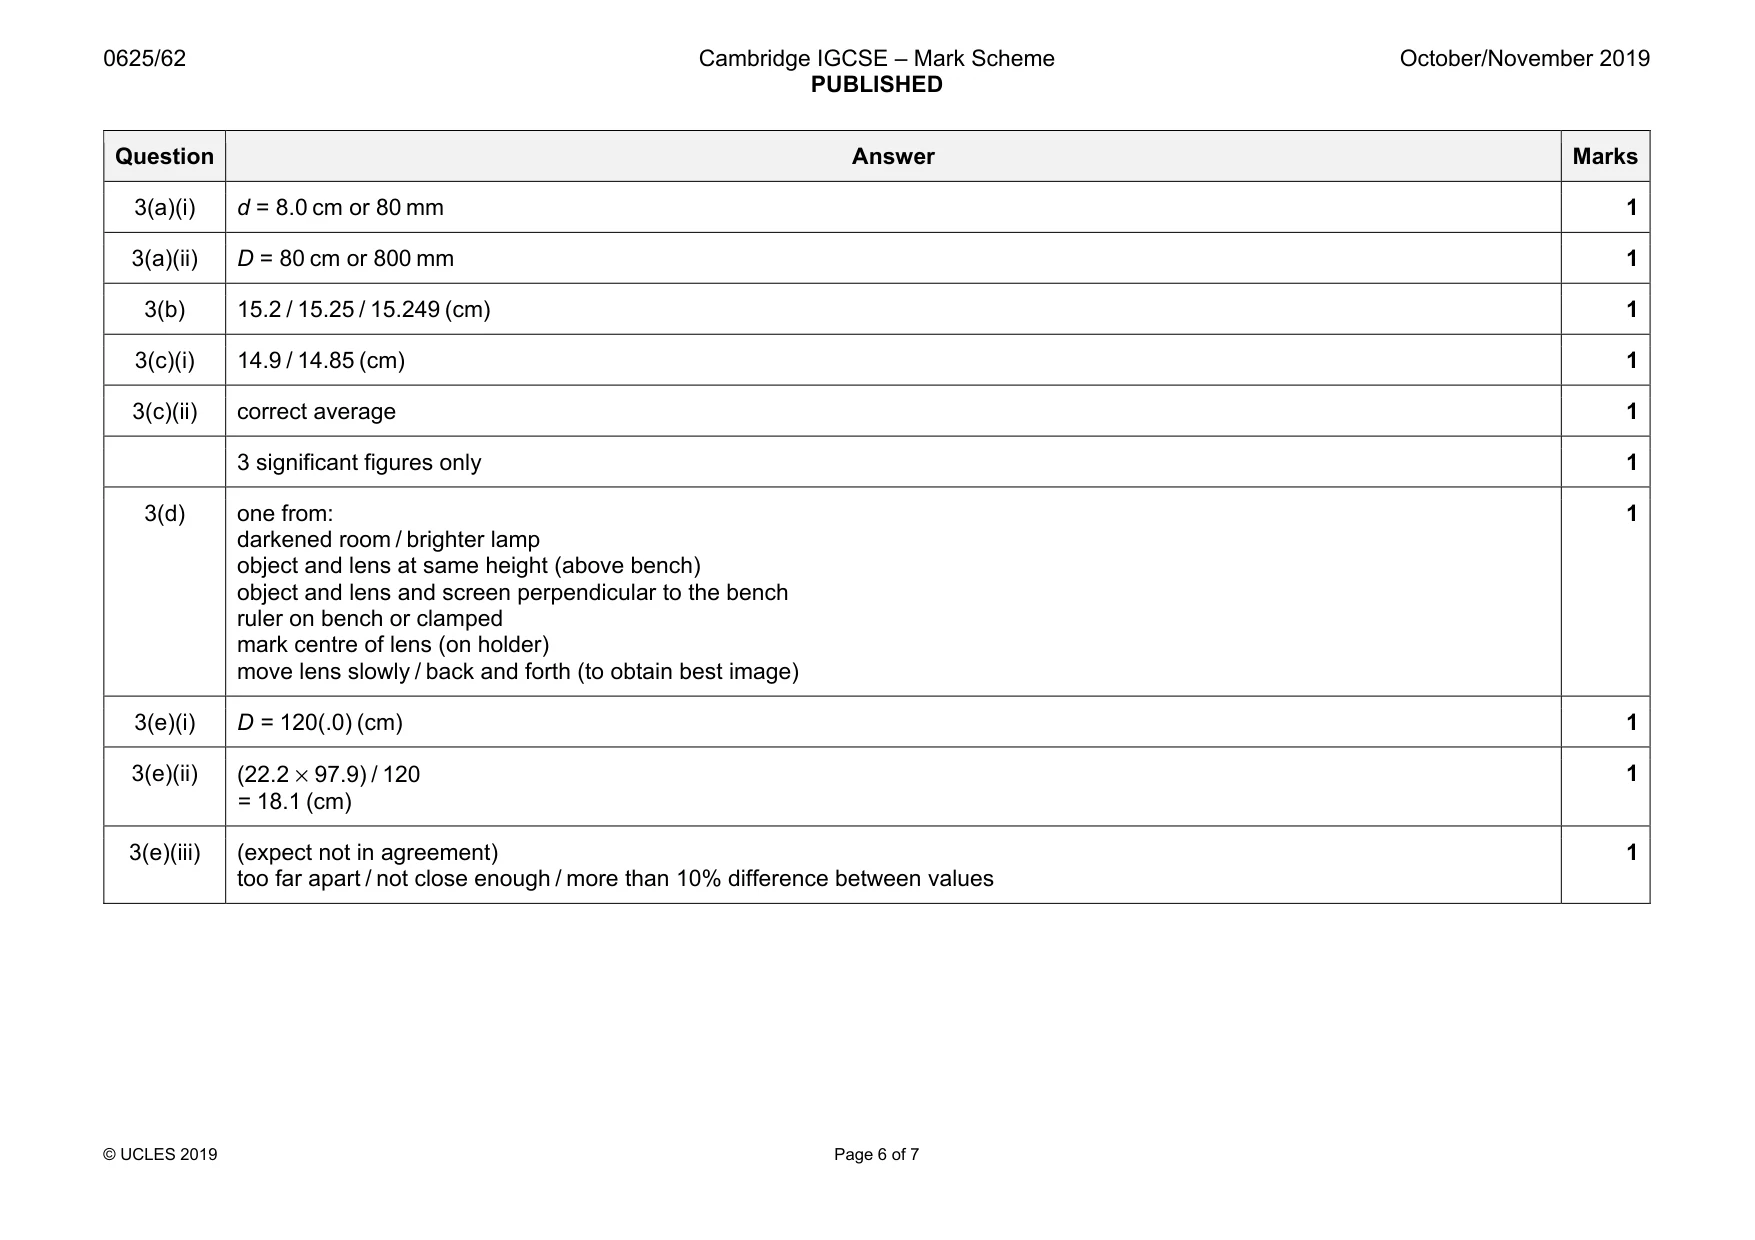
Mark scheme: 3(a)(i) d = 8.0 cm or 80 mm 1 3(a)(ii) D = 80 cm or 800 mm 1 3(b) 15.2 / 15.25 / 15.249 (cm) 1 3(c)(i) 14.9 / 14.85 (cm) 1 3(c)(ii) correct average 1 3 significant figures only 1 3(d) one from: darkened room / brighter lamp object and lens at same height (above bench) object and lens and screen perpendicular to the bench ruler on bench or clamped mark centre of lens (on holder) move lens slowly / back and forth (to obtain best image) 1 3(e)(i) D = 120(.0) (cm) 1 3(e)(ii) (22.2 × 97.9) / 120 = 18.1 (cm) 1 3(e)(iii) (expect not in agreement) too far apart / not close enough / more than 10% difference between values 1
Q4 · A student investigates the time taken for ice cubes in a container to melt using…
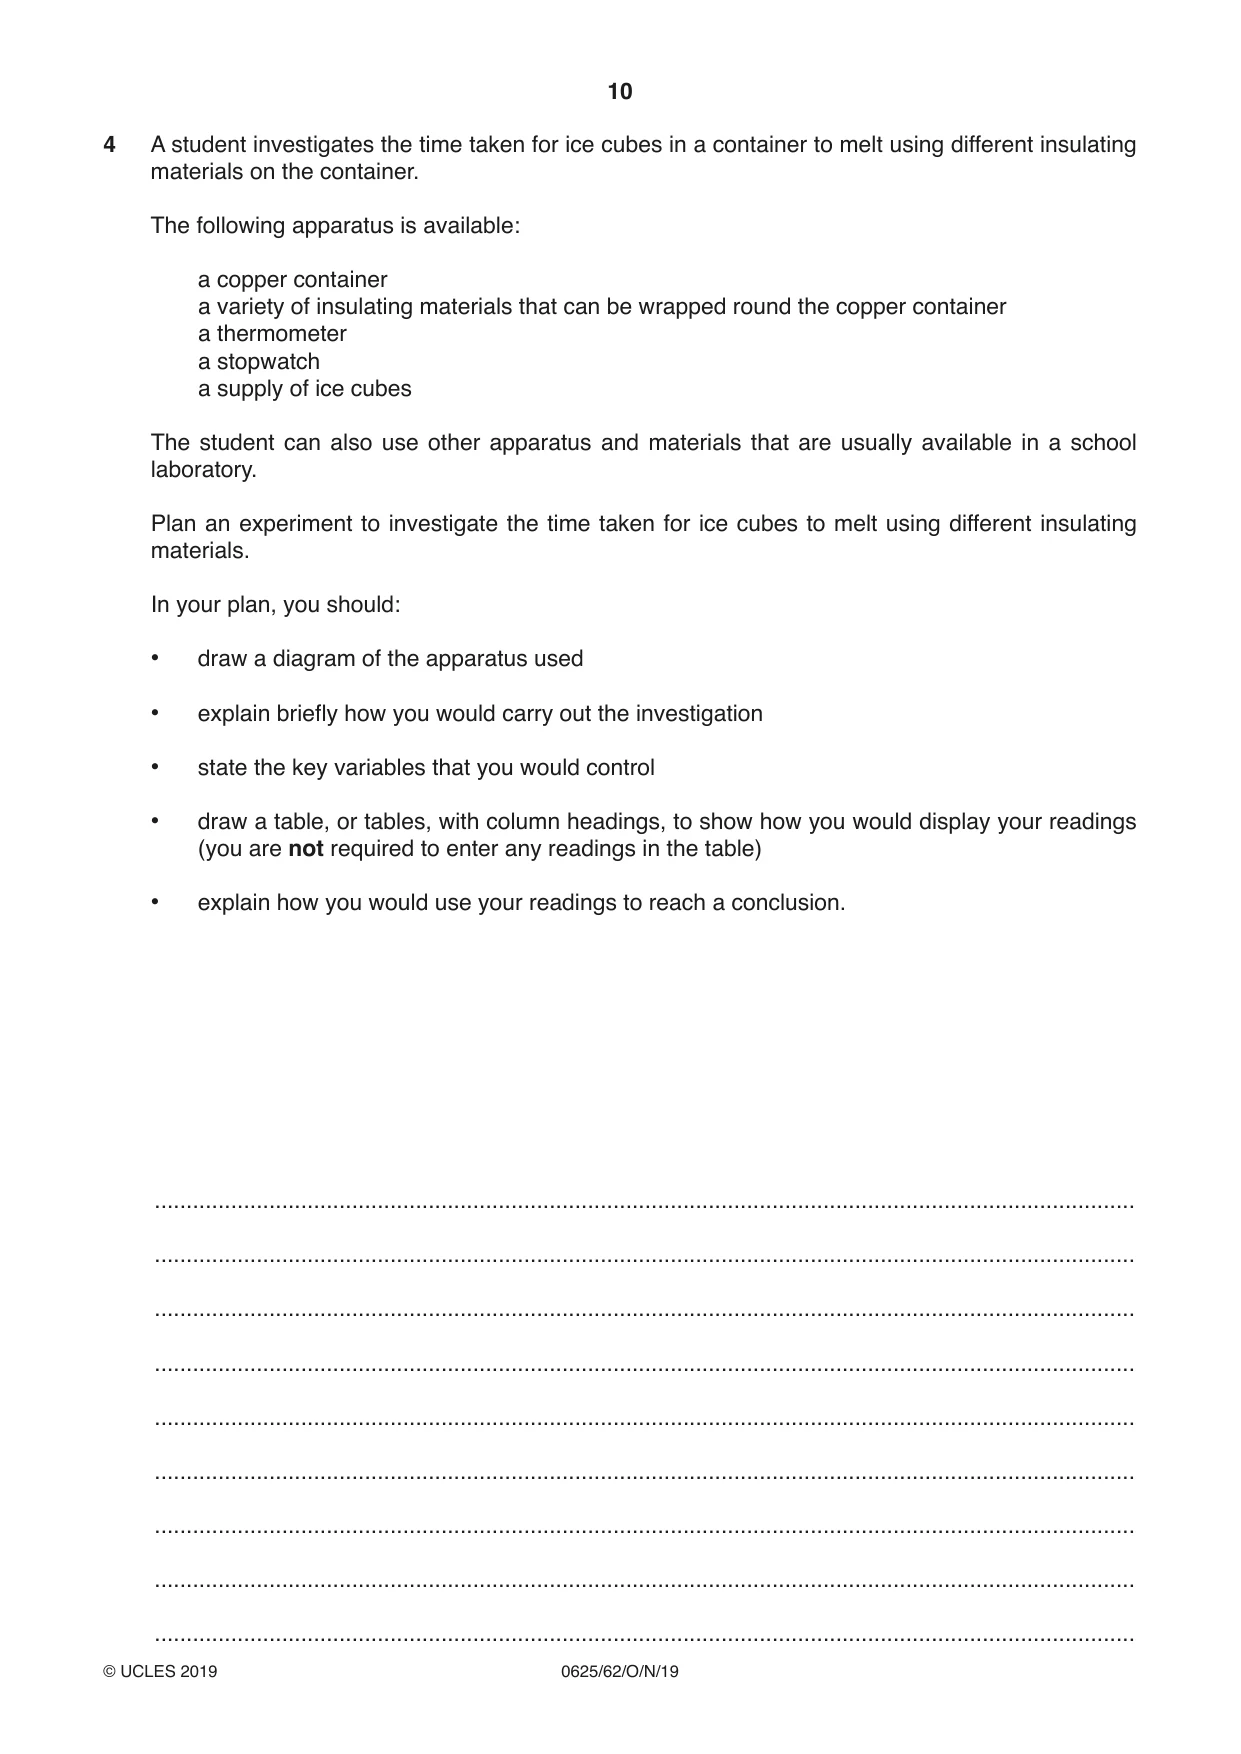
4 A student investigates the time taken for ice cubes in a container to melt using different insulating materials on the container. The following apparatus is available: a copper container a variety of insulating materials that can be wrapped round the copper container a thermometer a stopwatch a supply of ice cubes The student can also use other apparatus and materials that are usually available in a school laboratory. Plan an experiment to investigate the time taken for ice cubes to melt using different insulating materials. In your plan, you should: • draw a diagram of the apparatus used • explain briefly how you would carry out the investigation • state the key variables that you would control • draw a table, or tables, with column headings, to show how you would display your readings (you are not required to enter any readings in the table) • explain how you would use your readings to reach a conclusion. .......................................................................................................................................................... .......................................................................................................................................................... .......................................................................................................................................................... .......................................................................................................................................................... .......................................................................................................................................................... .......................................................................................................................................................... .......................................................................................................................................................... .......................................................................................................................................................... .......................................................................................................................................................... .......................................................................................................................................................... .......................................................................................................................................................... .......................................................................................................................................................... .......................................................................................................................................................... .......................................................................................................................................................... .......................................................................................................................................................... .......................................................................................................................................................... .......................................................................................................................................................... .................................................................................................................................................... [7] [Total: 7]
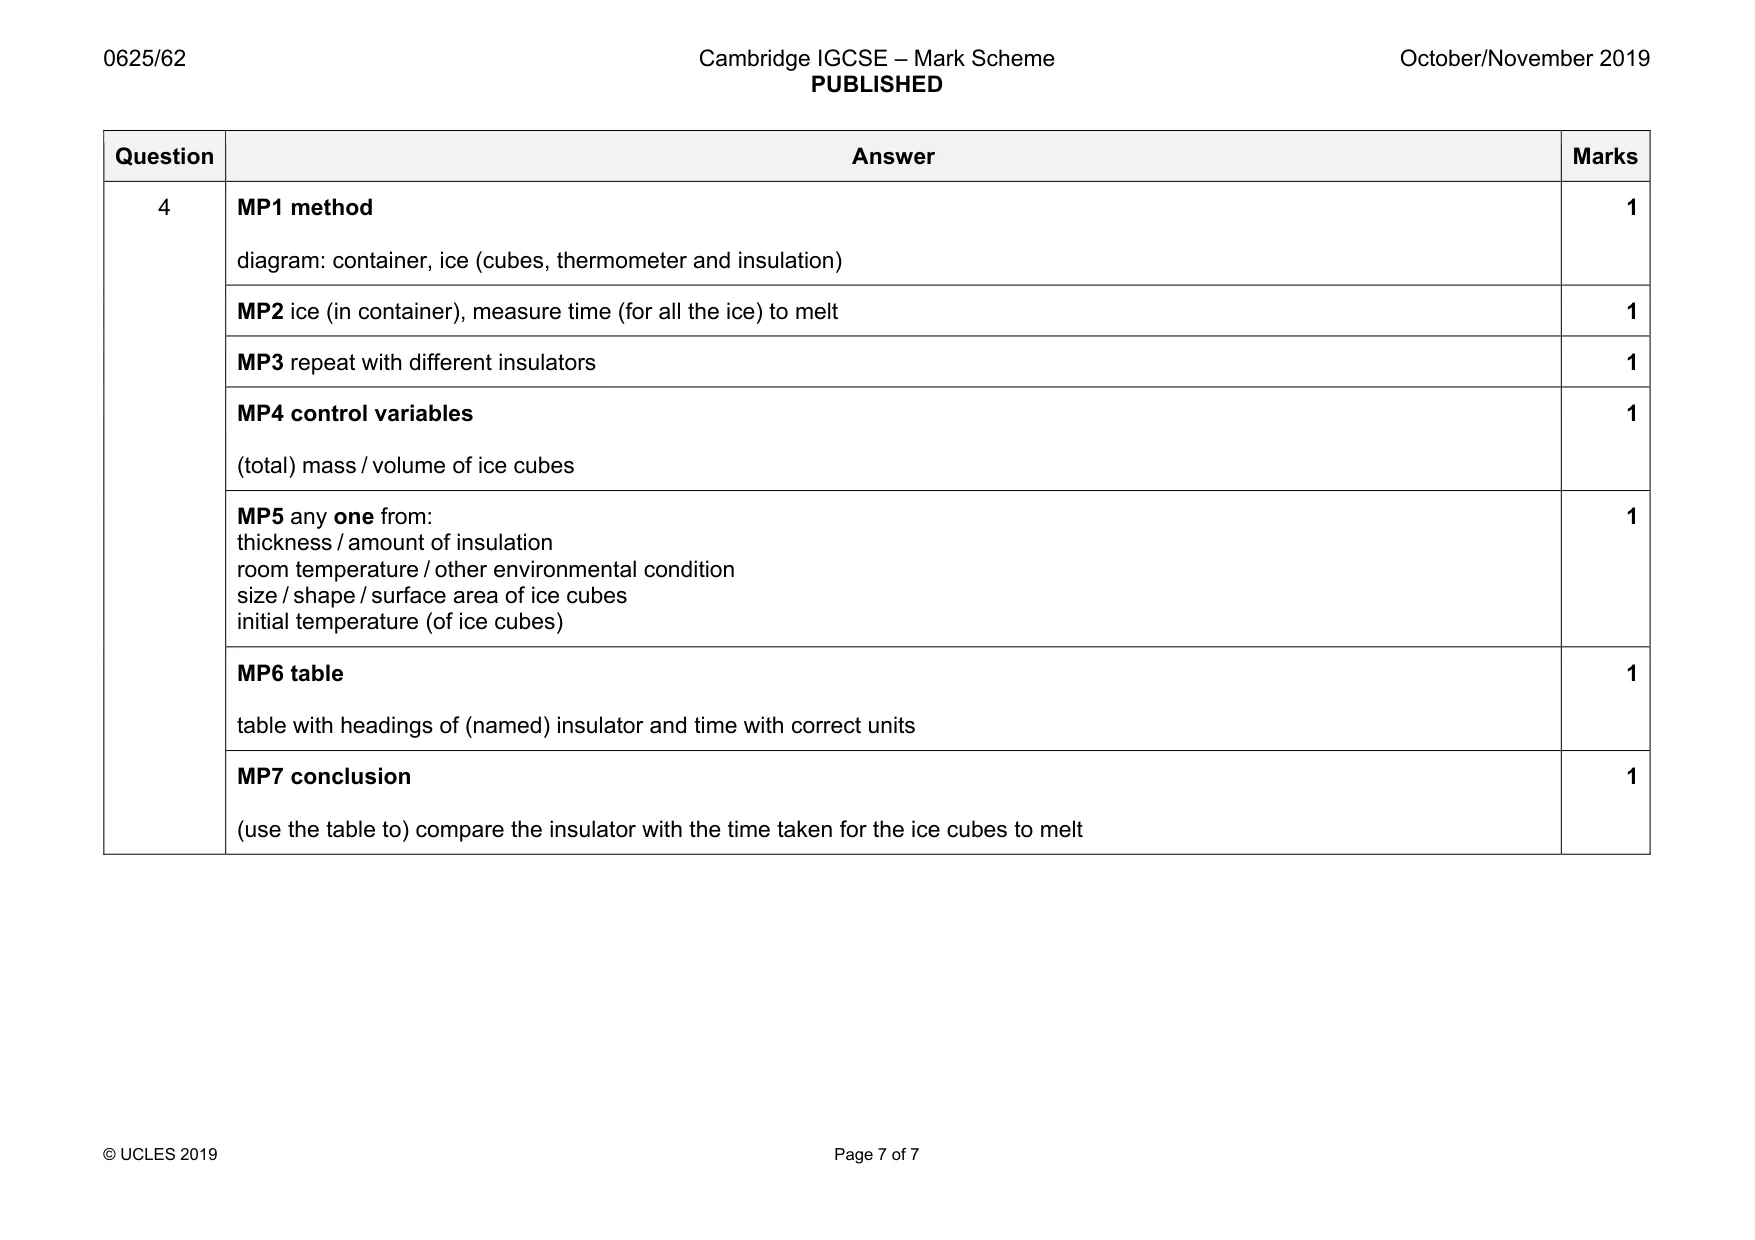
Mark scheme: 4 MP1 method diagram: container, ice (cubes, thermometer and insulation) 1 MP2 ice (in container), measure time (for all the ice) to melt 1 MP3 repeat with different insulators 1 MP4 control variables (total) mass / volume of ice cubes 1 MP5 any one from: thickness / amount of insulation room temperature / other environmental condition size / shape / surface area of ice cubes initial temperature (of ice cubes) 1 MP6 table table with headings of (named) insulator and time with correct units 1 MP7 conclusion (use the table to) compare the insulator with the time taken for the ice cubes to melt 1
What was in this paper
The subtopics covered by these 4 questions, and how many questions each got. Open one in a new tab to see every Cambridge question on it.
What you needed in this session
Cambridge’s own grade thresholds for 2019 Oct/Nov, Paper 6 · Variant 2. A higher threshold means an easier paper — the bar moves with how the cohort did.