Cambridge IGCSE Physics 0625 — 2019 Feb/March Paper 6 · Variant 2
0625/62/F/M/19 · 4 questions · 40 marks · ≈45 min
The question paper and its mark scheme, free to read here and free to download. This is Cambridge’s own paper, exactly as it was sat.
Question paper12 pages
Mark scheme8 pages
Answers below. Sit the paper first if you are practising.
Questions as text
Q1 · A student is investigating the reflection of light by a plane mirror
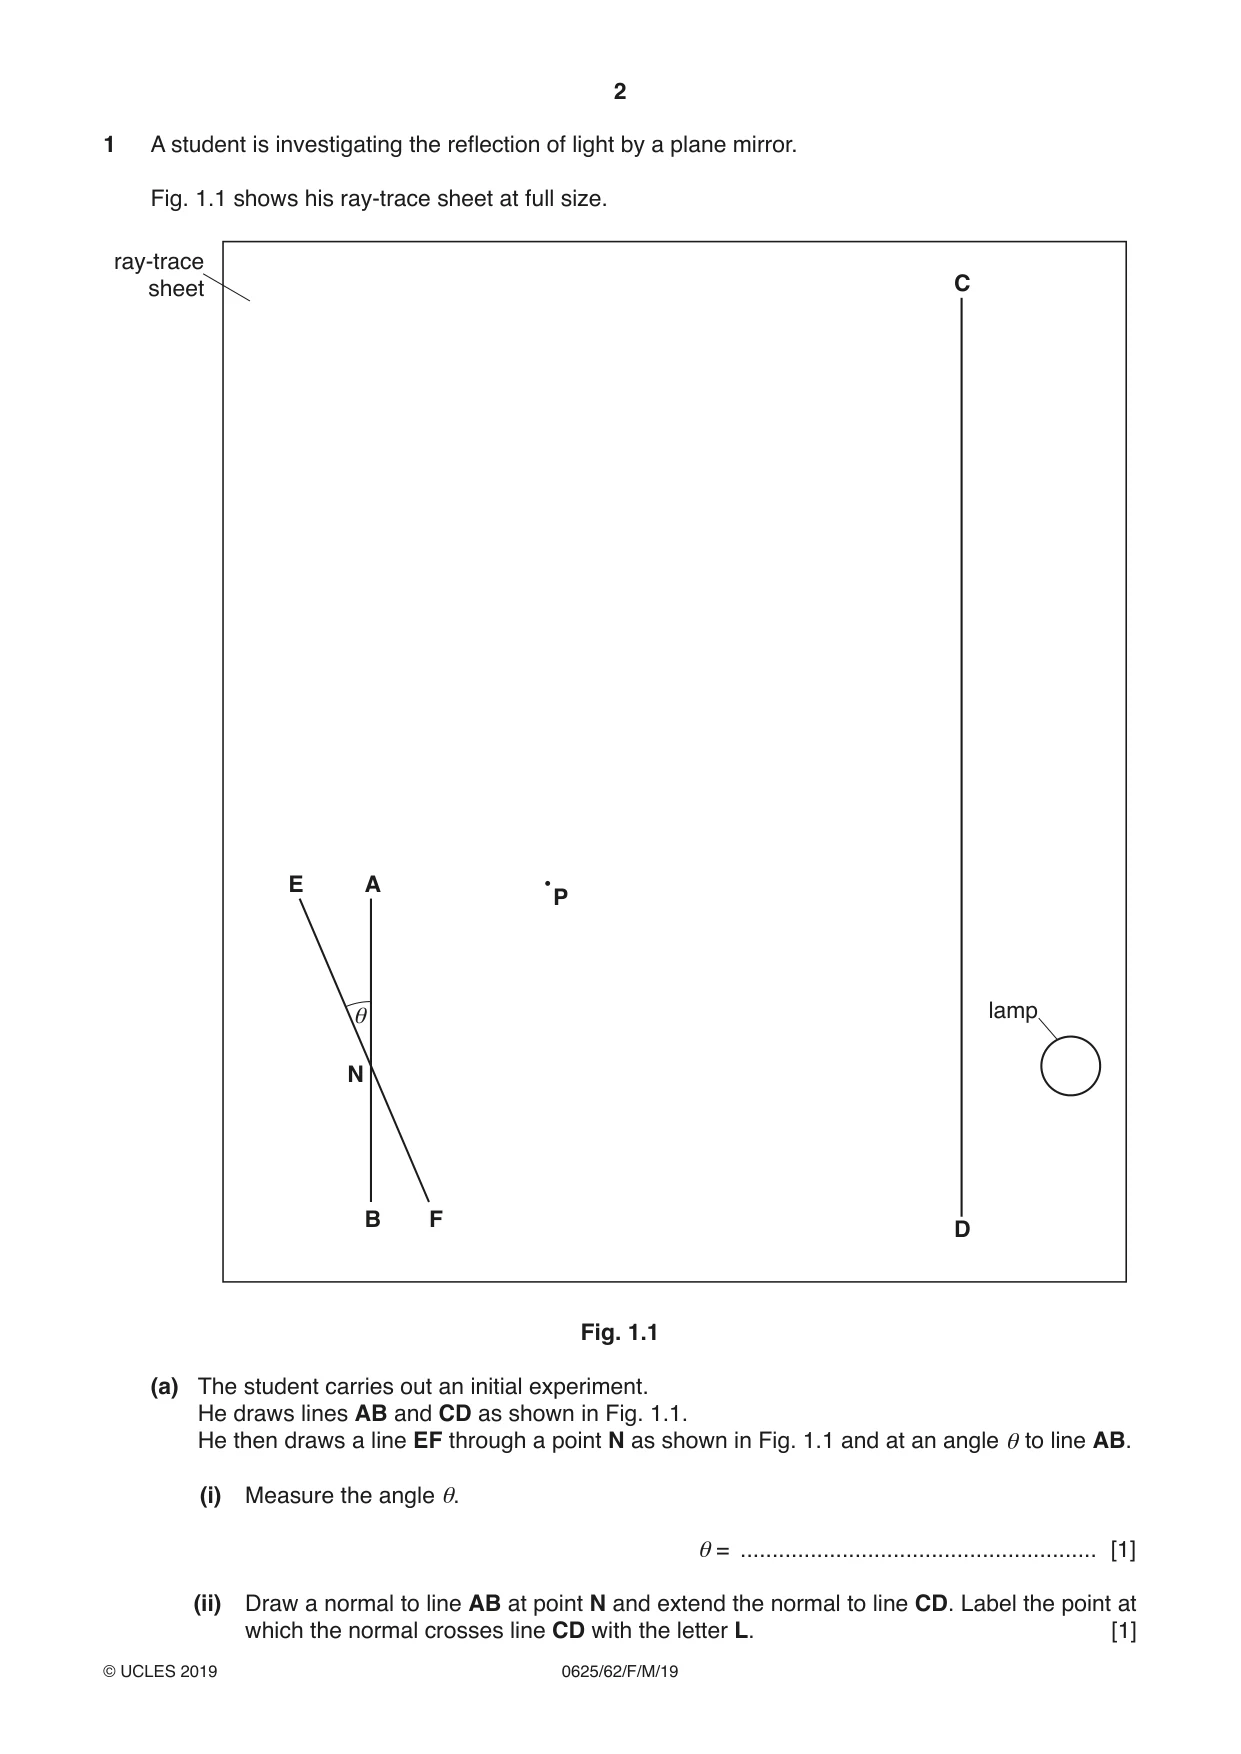
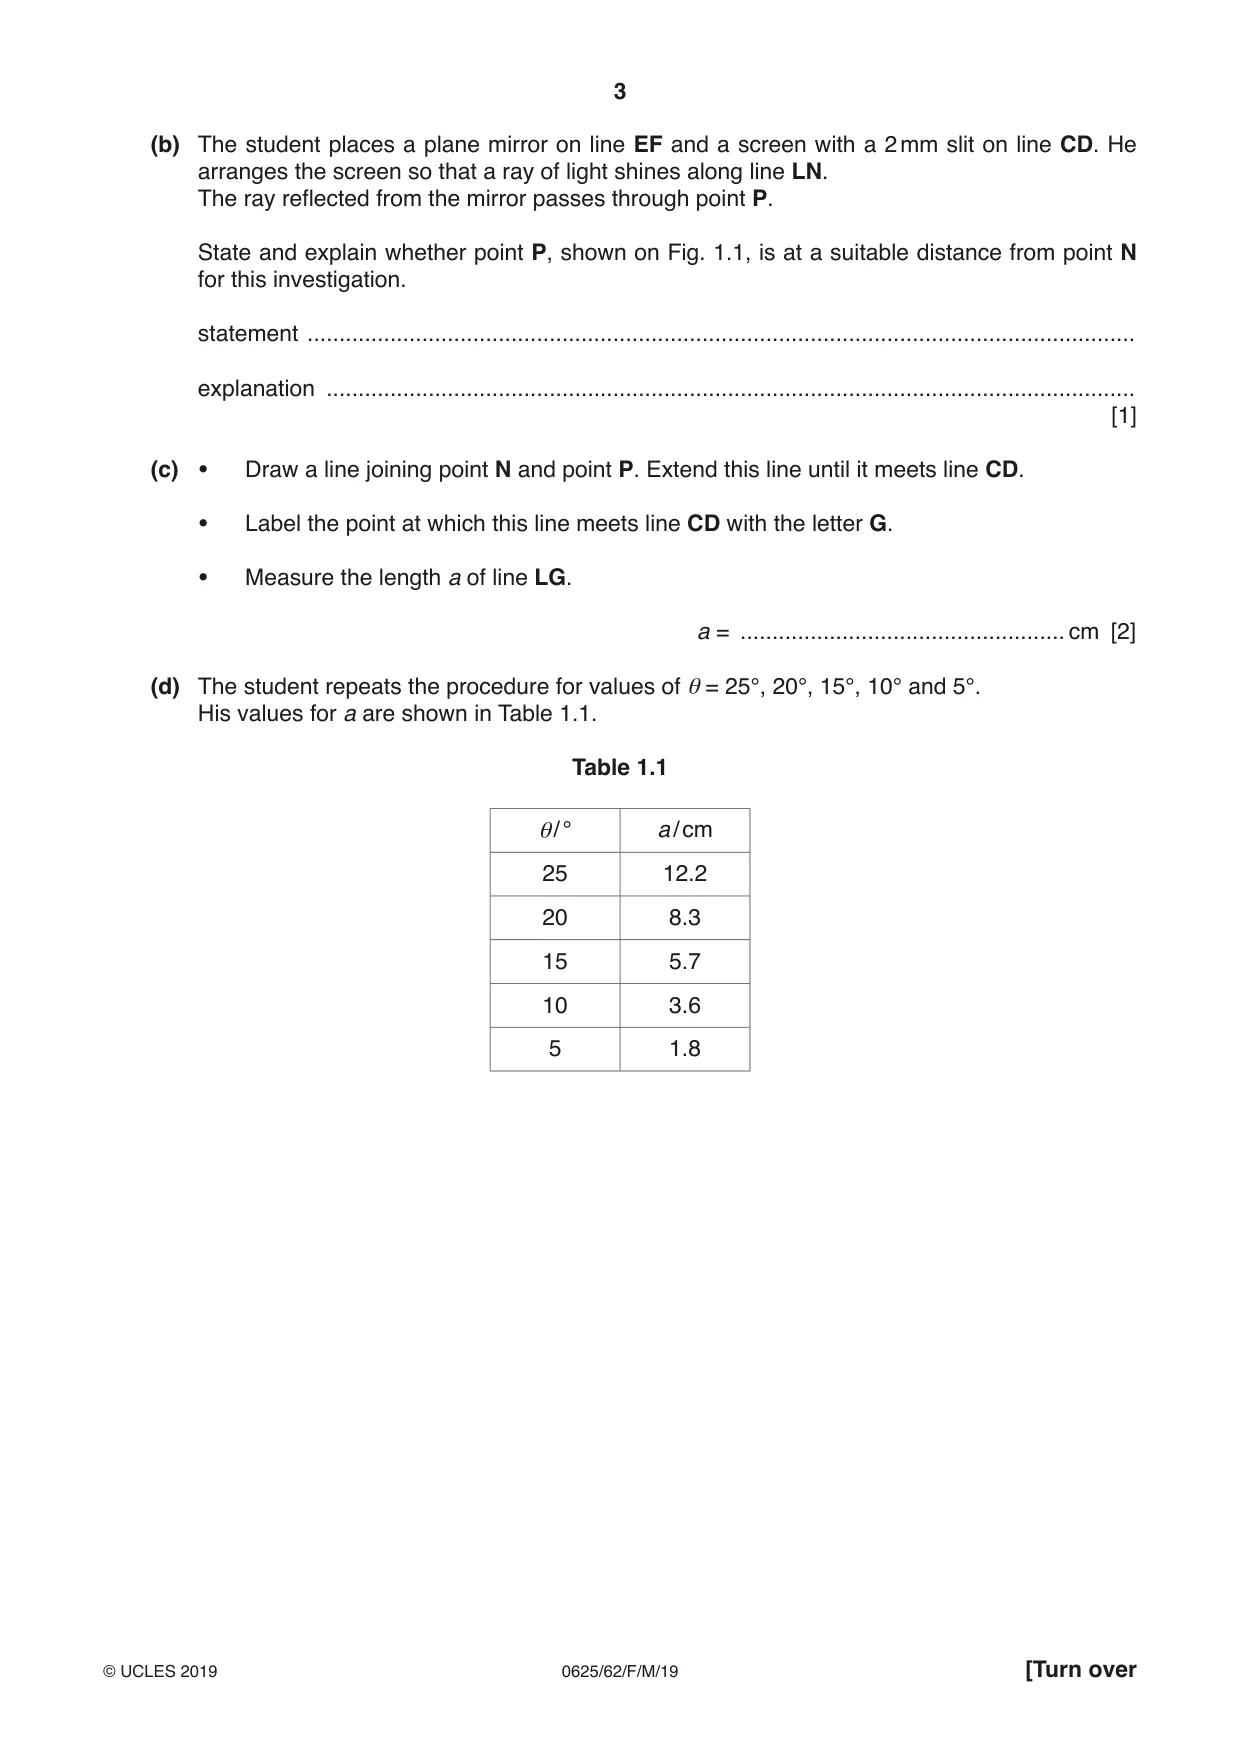
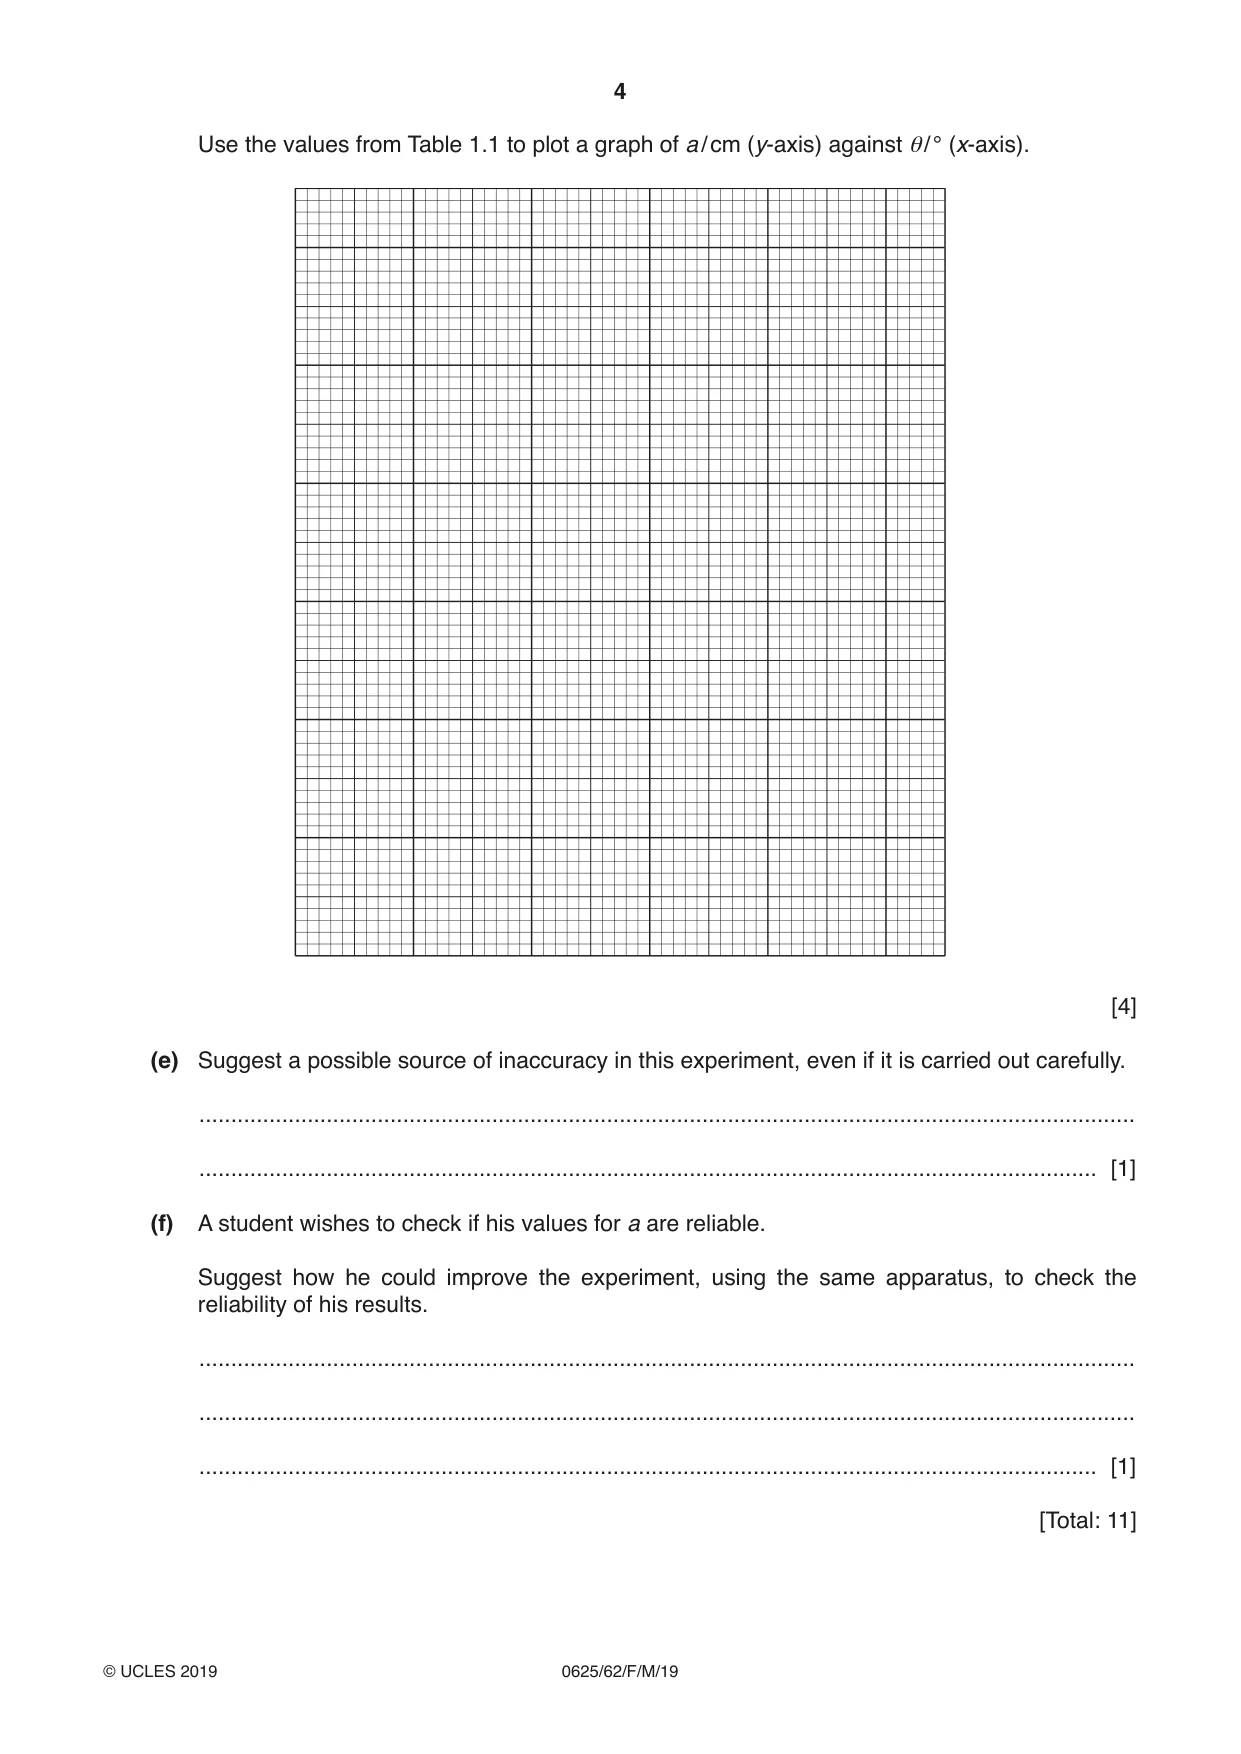
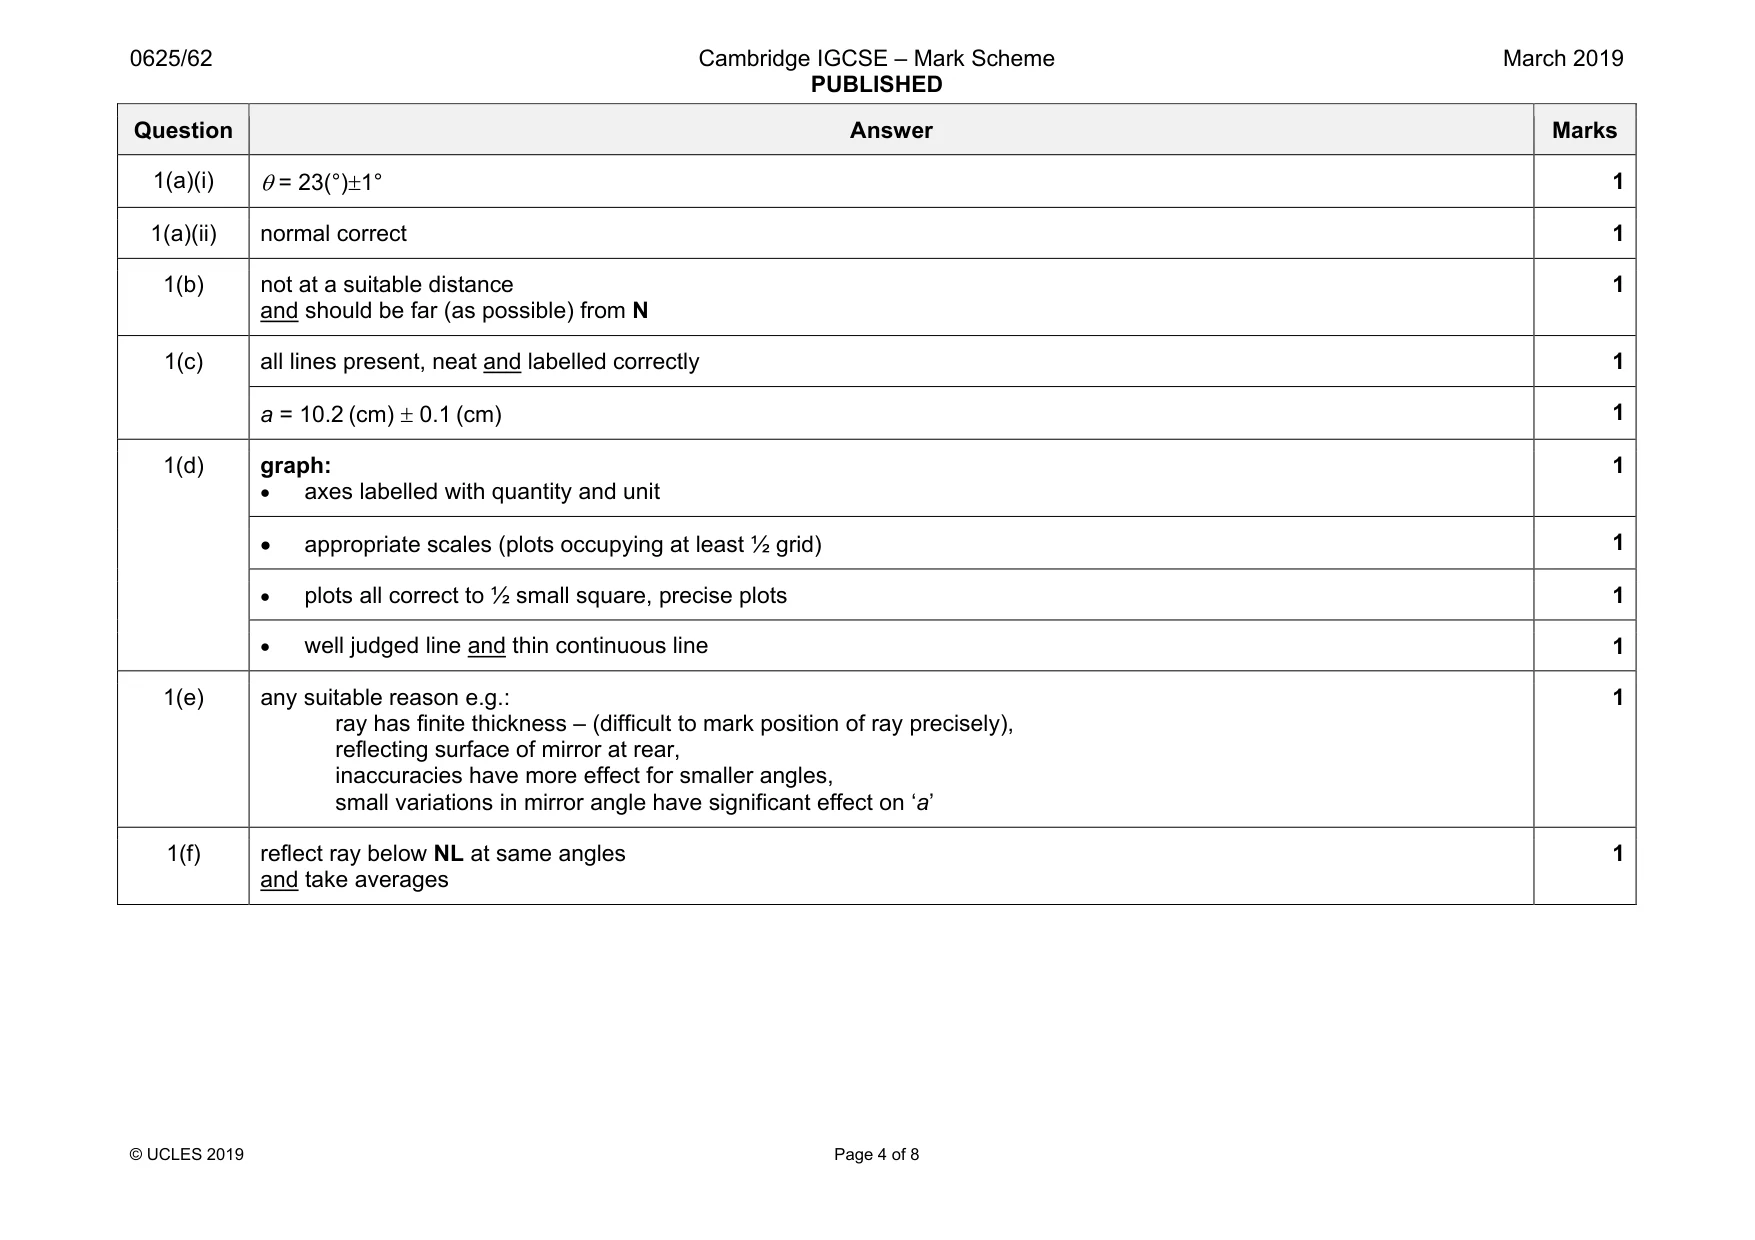
1 A student is investigating the reflection of light by a plane mirror. Fig. 1.1 shows his ray-trace sheet at full size. ray-trace sheet C E A P θ lamp N B F D Fig. 1.1 (a) The student carries out an initial experiment. He draws lines AB and CD as shown in Fig. 1.1. He then draws a line EF through a point N as shown in Fig. 1.1 and at an angle θ to line AB. (i) Measure the angle θ. θ = ........................................................ [1] (ii) Draw a normal to line AB at point N and extend the normal to line CD. Label the point at which the normal crosses line CD with the letter L. [1] (b) The student places a plane mirror on line EF and a screen with a 2 mm slit on line CD. He arranges the screen so that a ray of light shines along line LN. The ray reflected from the mirror passes through point P. State and explain whether point P, shown on Fig. 1.1, is at a suitable distance from point N for this investigation. statement .................................................................................................................................. explanation ............................................................................................................................... [1] (c) • Draw a line joining point N and point P. Extend this line until it meets line CD. • Label the point at which this line meets line CD with the letter G. • Measure the length a of line LG. a = ................................................... cm [2] (d) The student repeats the procedure for values of θ = 25°, 20°, 15°, 10° and 5°. His values for a are shown in Table 1.1. Table 1.1 θ/ ° a / cm 25 12.2 20 8.3 15 5.7 10 3.6 5 1.8 Use the values from Table 1.1 to plot a graph of a / cm (y-axis) against θ/ ° (x-axis). [4] (e) Suggest a possible source of inaccuracy in this experiment, even if it is carried out carefully. ................................................................................................................................................... ............................................................................................................................................. [1] (f) A student wishes to check if his values for a are reliable. Suggest how he could improve the experiment, using the same apparatus, to check the reliability of his results. ................................................................................................................................................... ................................................................................................................................................... ............................................................................................................................................. [1] [Total: 11]
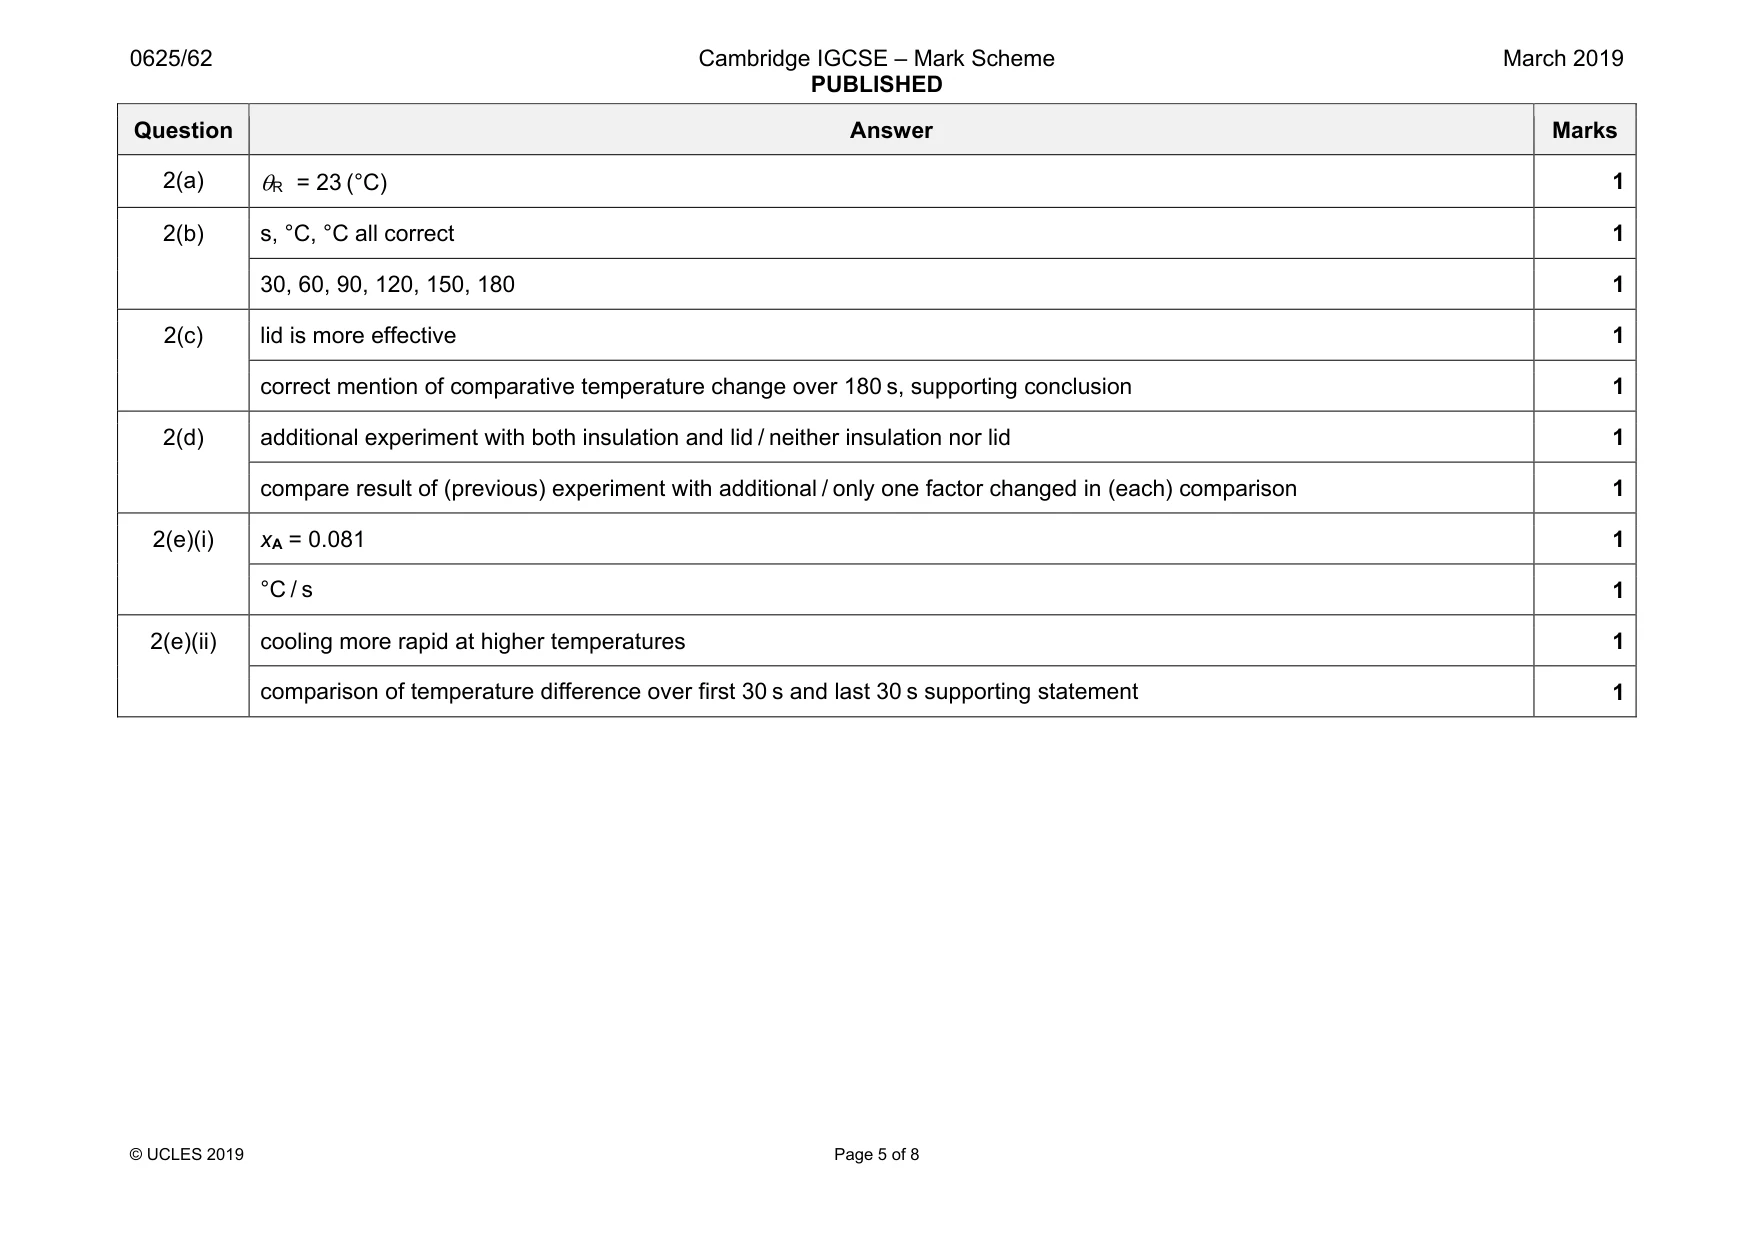
Mark scheme: 1(a)(i) 1 1(a)(ii) normal correct 1 1(b) not at a suitable distance and should be far (as possible) from N 1 1(c) all lines present, neat and labelled correctly 1 a = 10.2 (cm) ± 0.1 (cm) 1 1(d) graph: • axes labelled with quantity and unit 1 • appropriate scales (plots occupying at least ½ grid) 1 • plots all correct to ½ small square, precise plots 1 • well judged line and thin continuous line 1 1(e) any suitable reason e.g.: ray has finite thickness – (difficult to mark position of ray precisely), reflecting surface of mirror at rear, inaccuracies have more effect for smaller angles, small variations in mirror angle have significant effect on ‘a’ 1 1(f) reflect ray below NL at same angles and take averages 1
Q2 · Students are investigating how the use of a lid or insulation affects the rate of cooling…
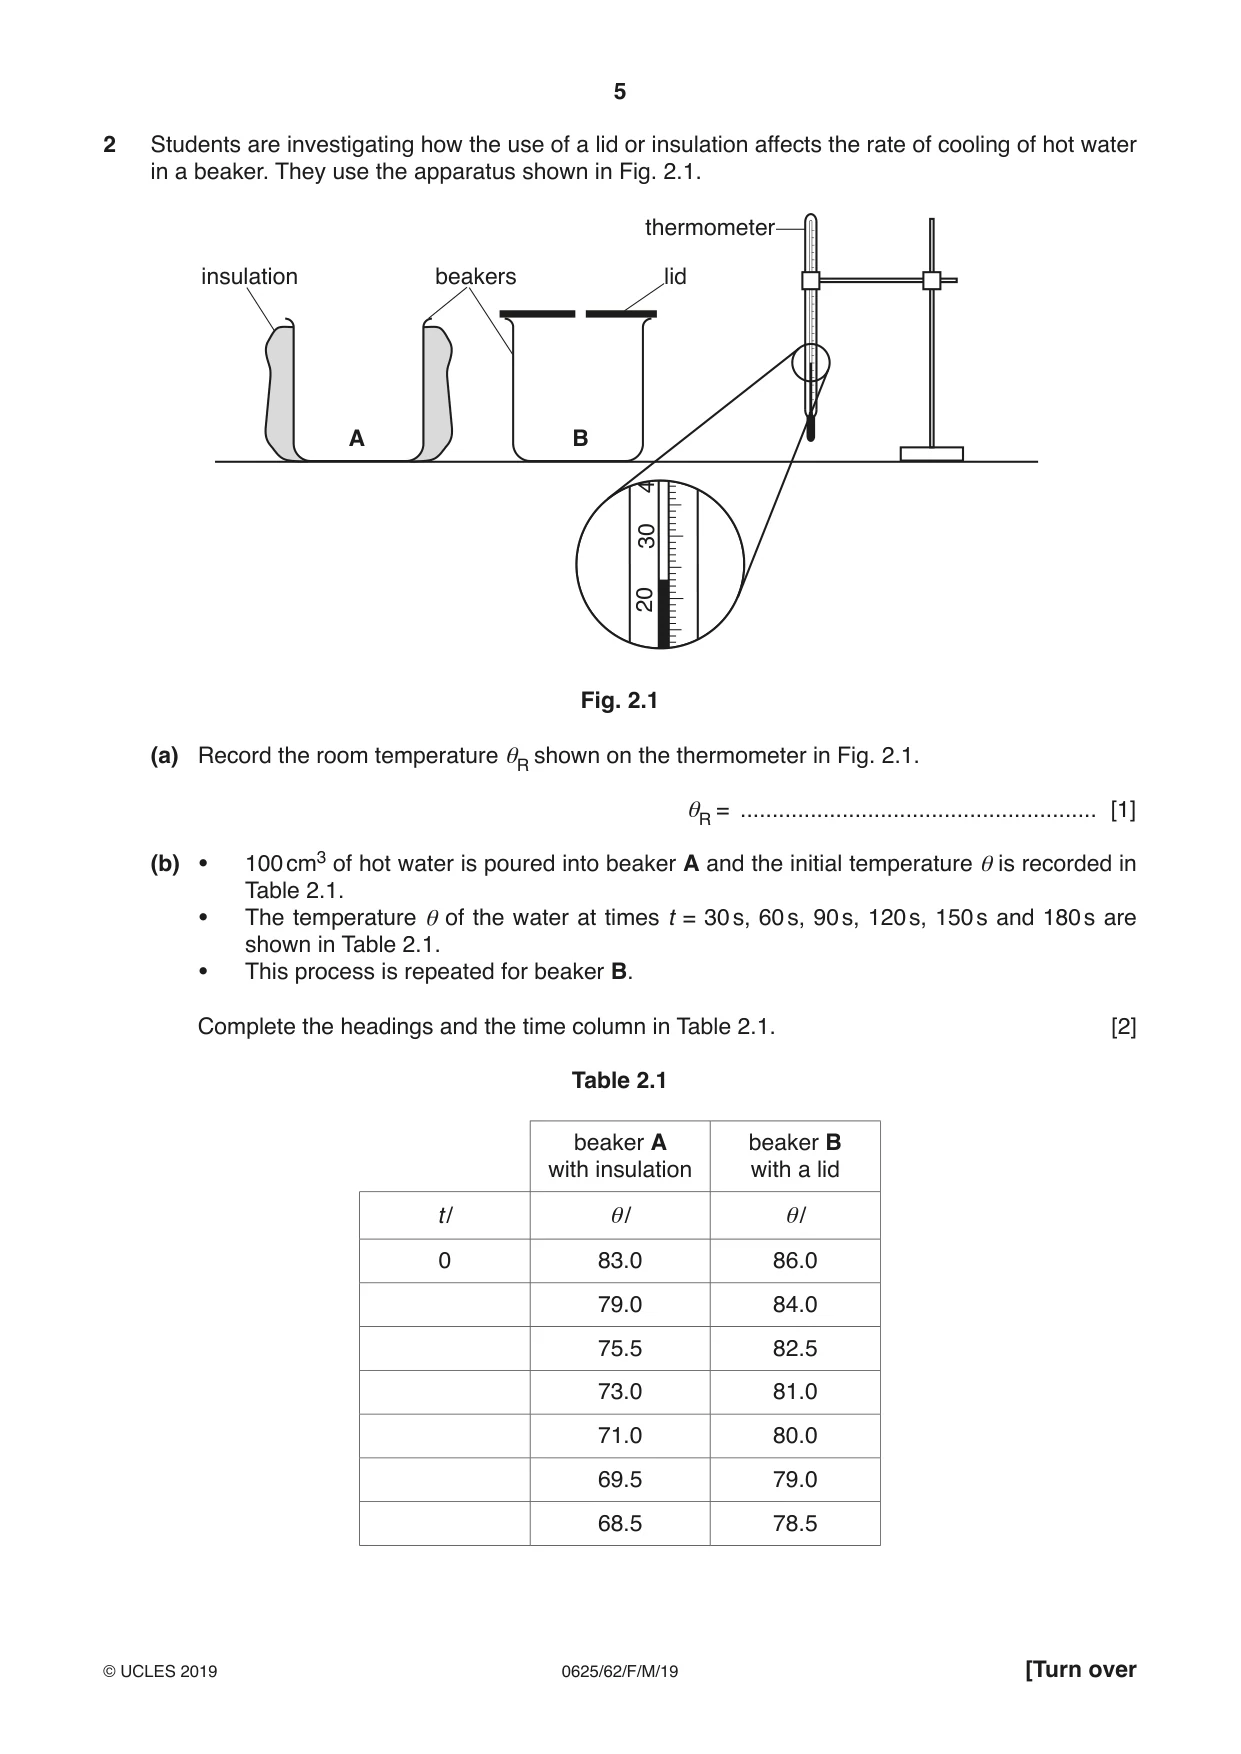
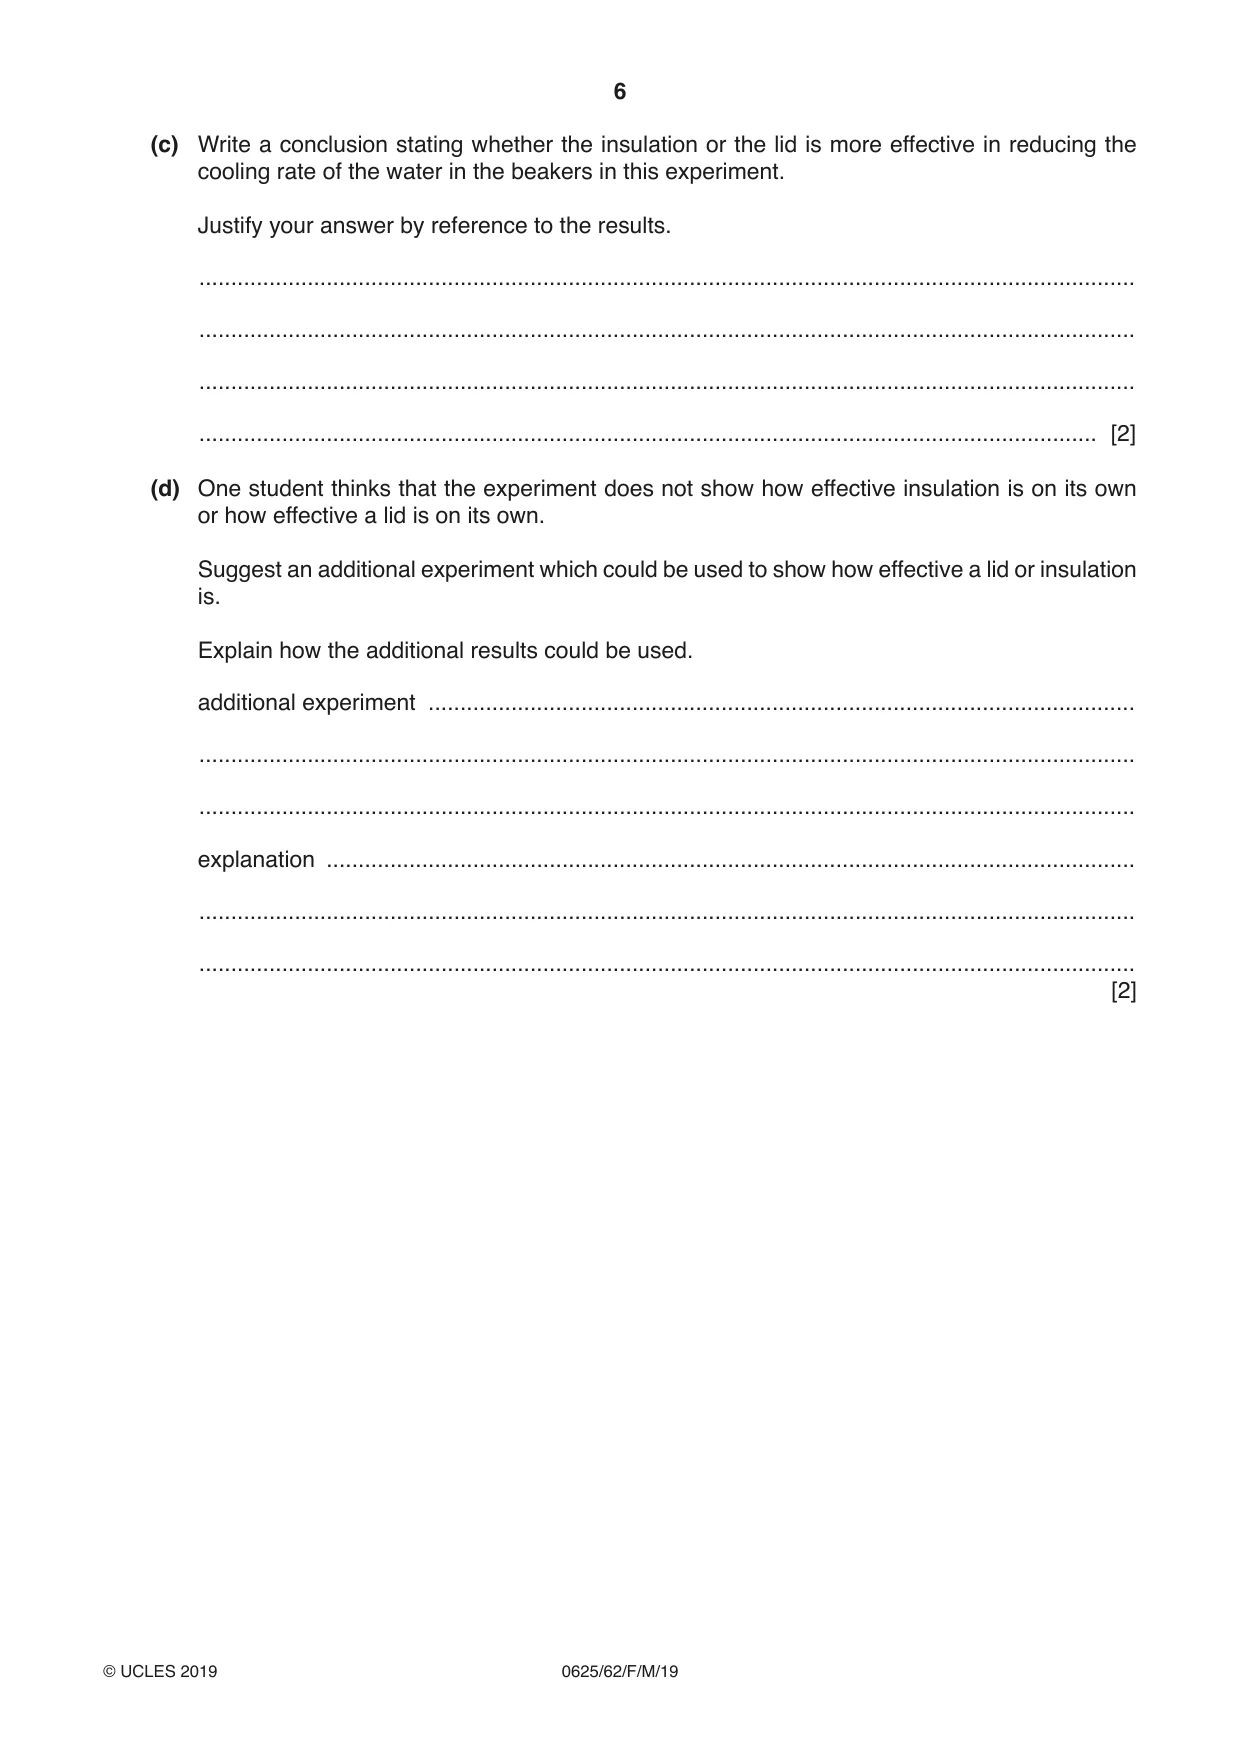
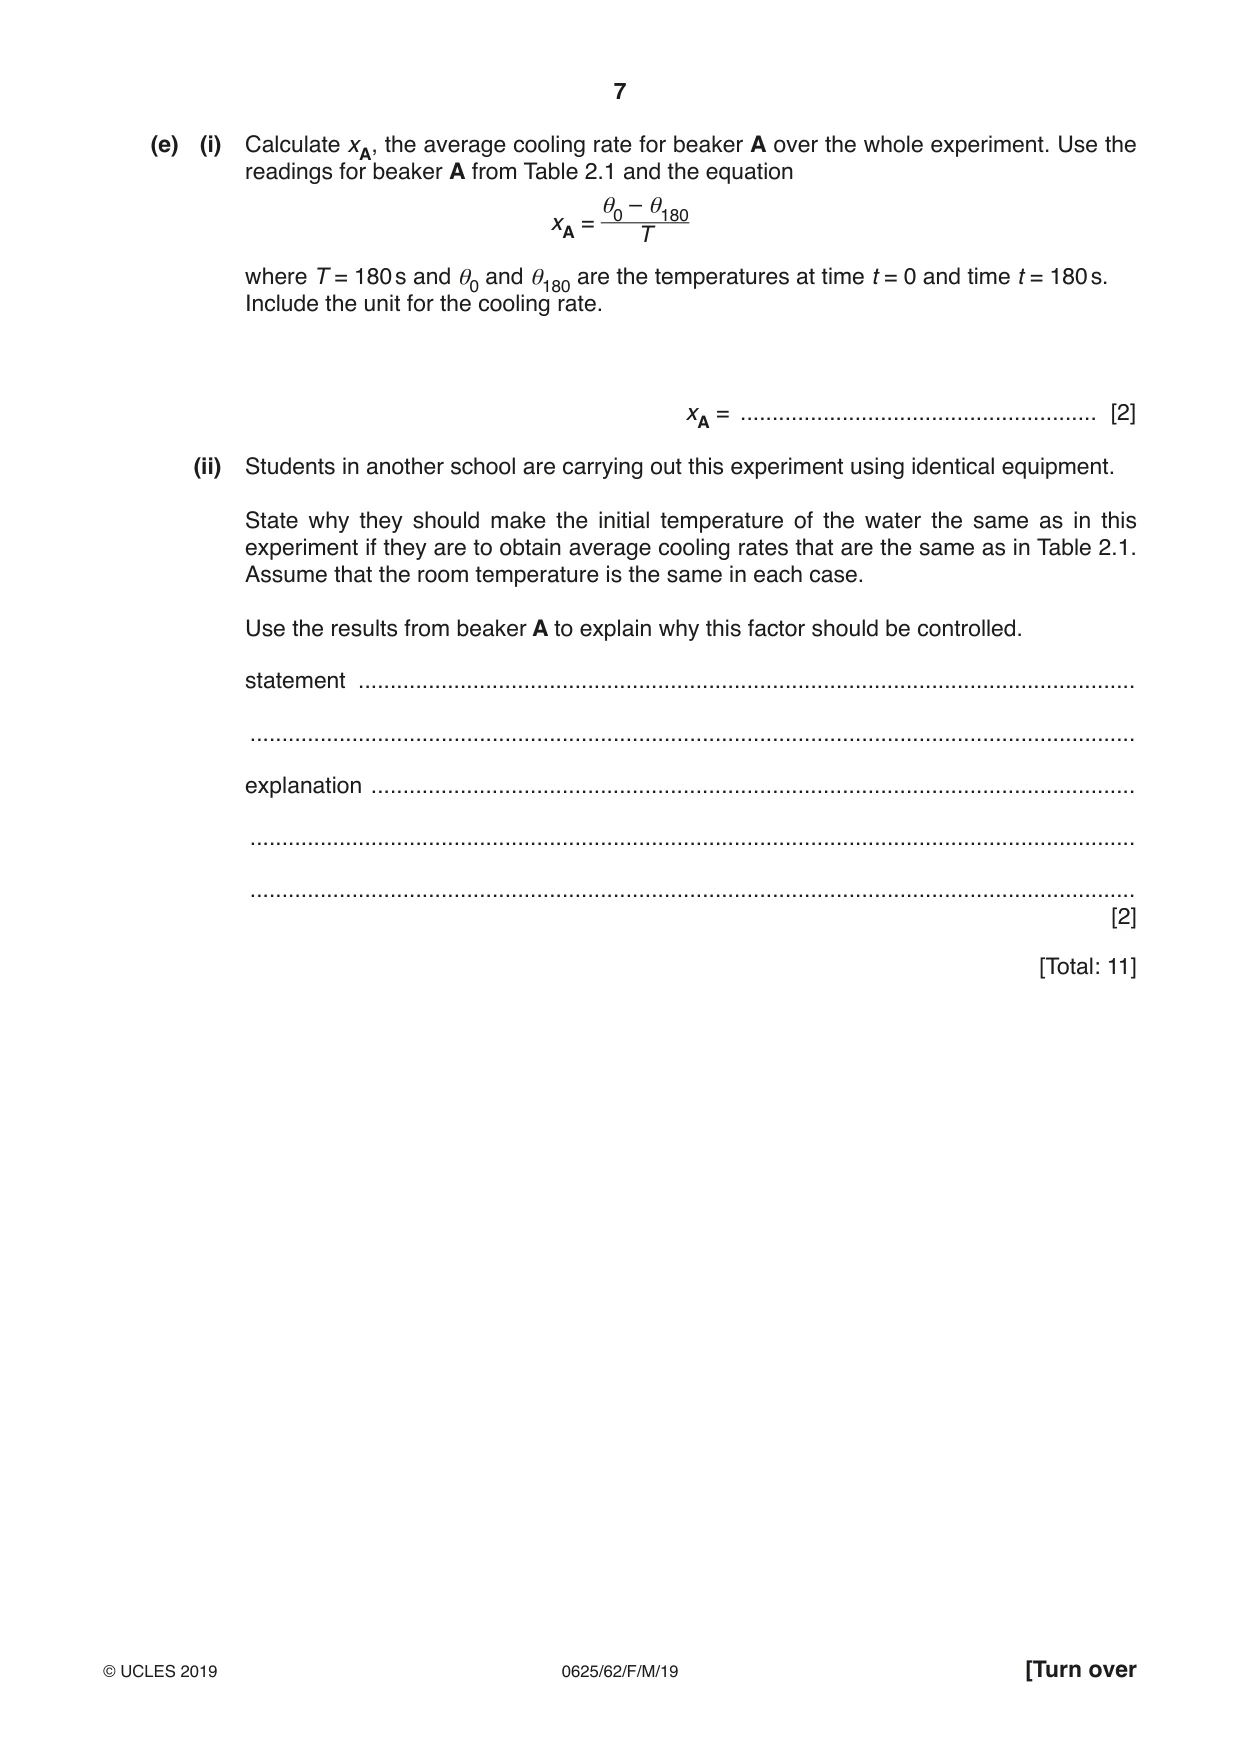
2 Students are investigating how the use of a lid or insulation affects the rate of cooling of hot water in a beaker. They use the apparatus shown in Fig. 2.1. thermometer insulation beakers lid A B 4 30 20 Fig. 2.1 (a) Record the room temperature θR shown on the thermometer in Fig. 2.1. θR = ........................................................ [1] (b) • 100 cm3 of hot water is poured into beaker A and the initial temperature θ is recorded in Table 2.1. • The temperature θ of the water at times t = 30 s, 60 s, 90 s, 120 s, 150 s and 180 s are shown in Table 2.1. • This process is repeated for beaker B. Complete the headings and the time column in Table 2.1. [2] Table 2.1 beaker A beaker B with insulation with a lid t / θ/ θ/ 0 83.0 86.0 79.0 84.0 75.5 82.5 73.0 81.0 71.0 80.0 69.5 79.0 68.5 78.5 (c) Write a conclusion stating whether the insulation or the lid is more effective in reducing the cooling rate of the water in the beakers in this experiment. Justify your answer by reference to the results. ................................................................................................................................................... ................................................................................................................................................... ................................................................................................................................................... ............................................................................................................................................. [2] (d) One student thinks that the experiment does not show how effective insulation is on its own or how effective a lid is on its own. Suggest an additional experiment which could be used to show how effective a lid or insulation is. Explain how the additional results could be used. additional experiment ............................................................................................................... ................................................................................................................................................... ................................................................................................................................................... explanation ............................................................................................................................... ................................................................................................................................................... ................................................................................................................................................... [2] (e) (i) Calculate xA, the average cooling rate for beaker A over the whole experiment. Use the readings for beaker A from Table 2.1 and the equation θ0 – θ180 xA = T where T = 180 s and θ0 and θ180 are the temperatures at time t = 0 and time t = 180 s. Include the unit for the cooling rate. xA = ........................................................ [2] (ii) Students in another school are carrying out this experiment using identical equipment. State why they should make the initial temperature of the water the same as in this experiment if they are to obtain average cooling rates that are the same as in Table 2.1. Assume that the room temperature is the same in each case. Use the results from beaker A to explain why this factor should be controlled. statement .......................................................................................................................... ........................................................................................................................................... explanation ........................................................................................................................ ........................................................................................................................................... ........................................................................................................................................... [2] [Total: 11]
Mark scheme: 2(a) 1 2(b) s, °C, °C all correct 1 30, 60, 90, 120, 150, 180 1 2(c) lid is more effective 1 correct mention of comparative temperature change over 180 s, supporting conclusion 1 2(d) additional experiment with both insulation and lid / neither insulation nor lid 1 compare result of (previous) experiment with additional / only one factor changed in (each) comparison 1 2(e)(i) xA = 0.081 1 °C / s 1 2(e)(ii) cooling more rapid at higher temperatures 1 comparison of temperature difference over first 30 s and last 30 s supporting statement 1
Q3 · A student is investigating a resistance wire
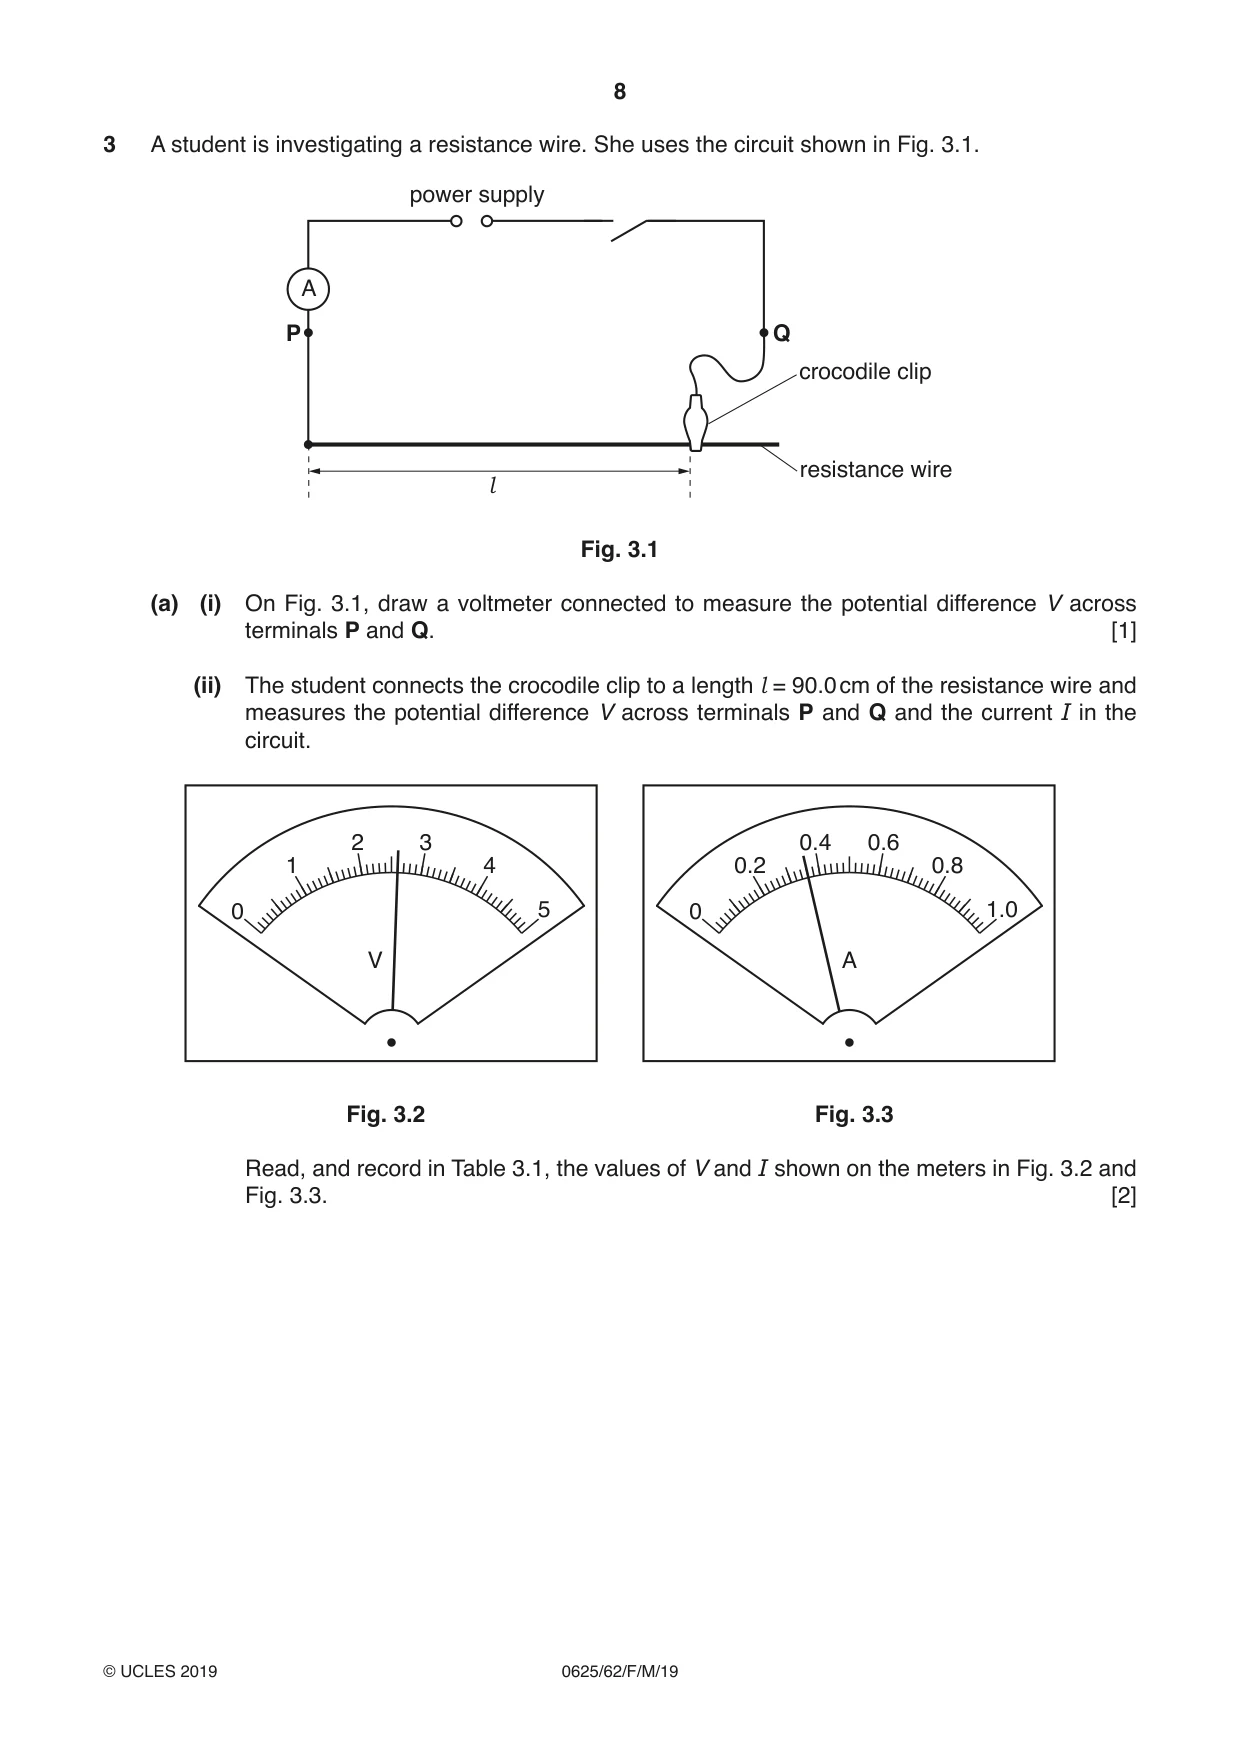
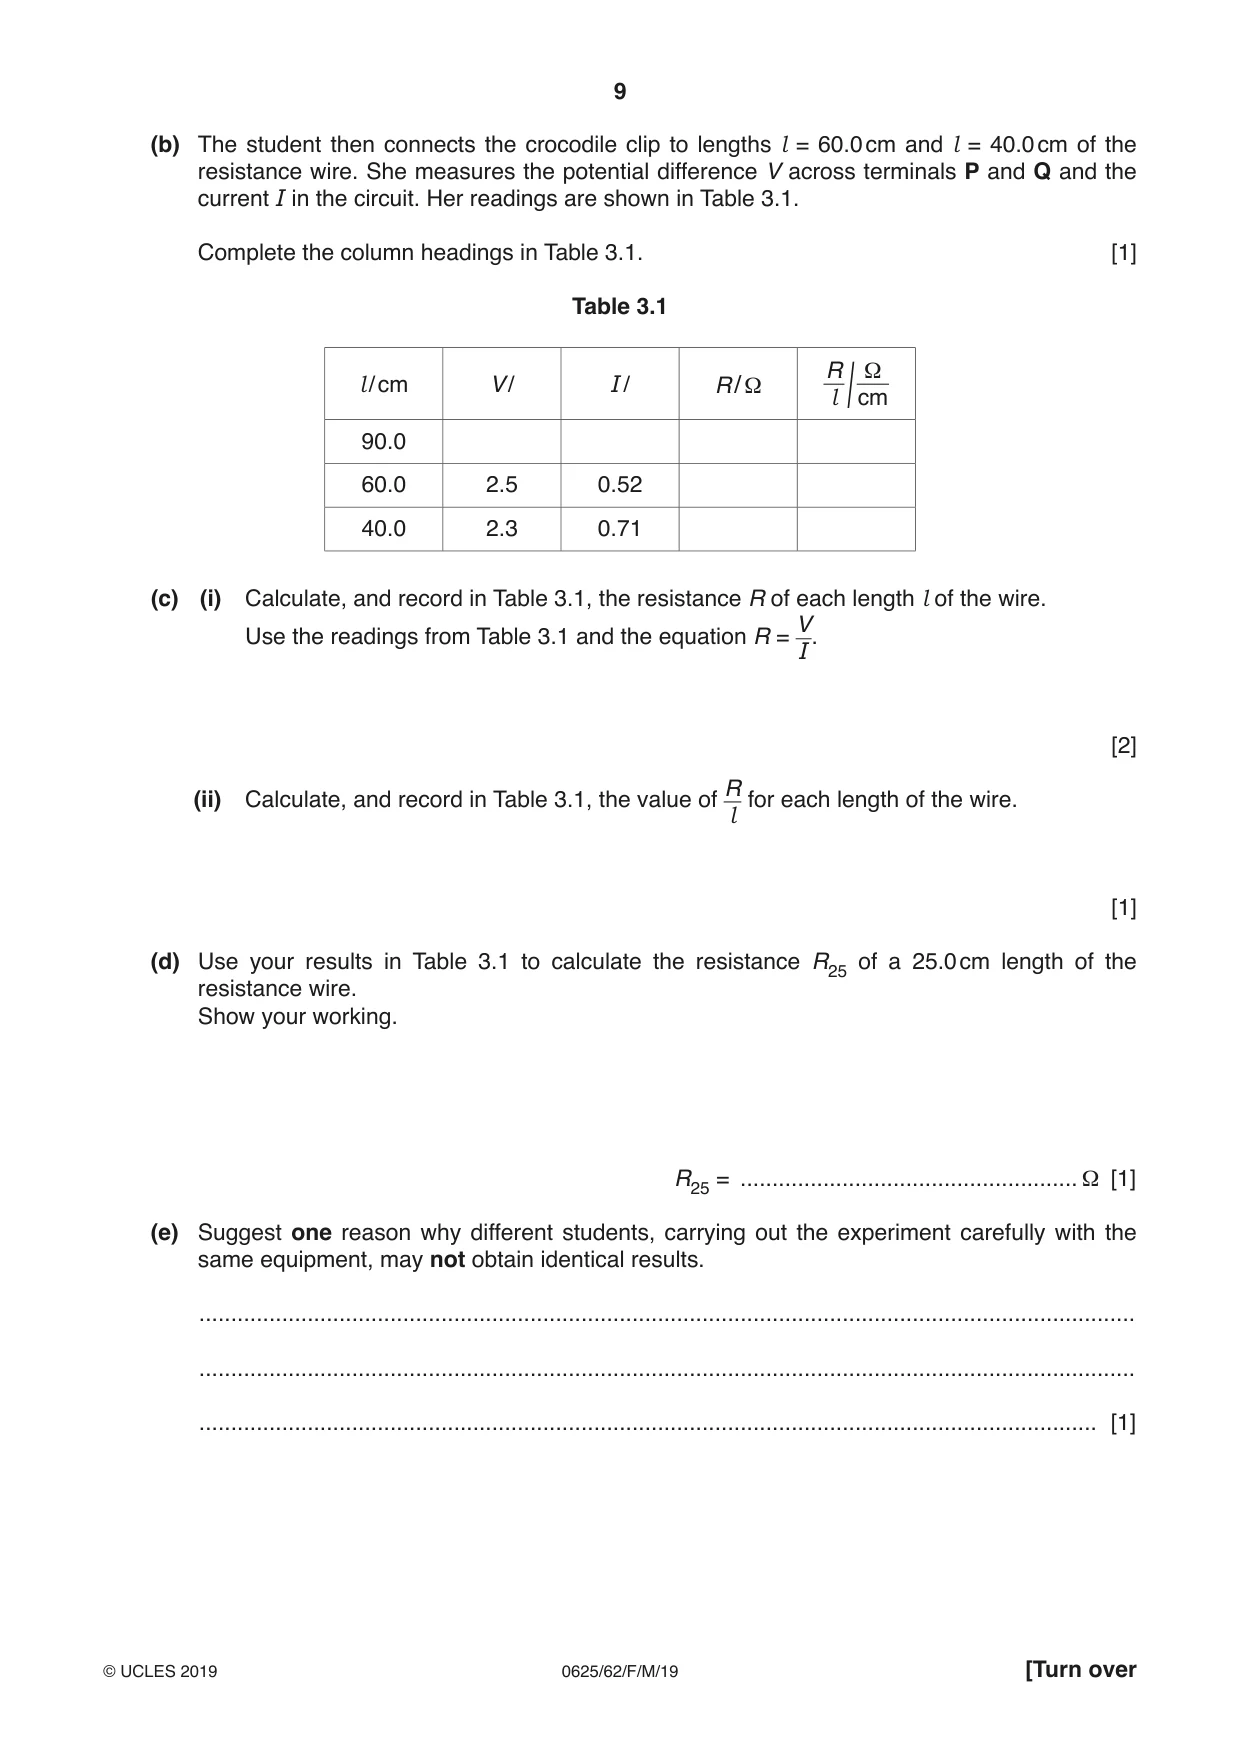
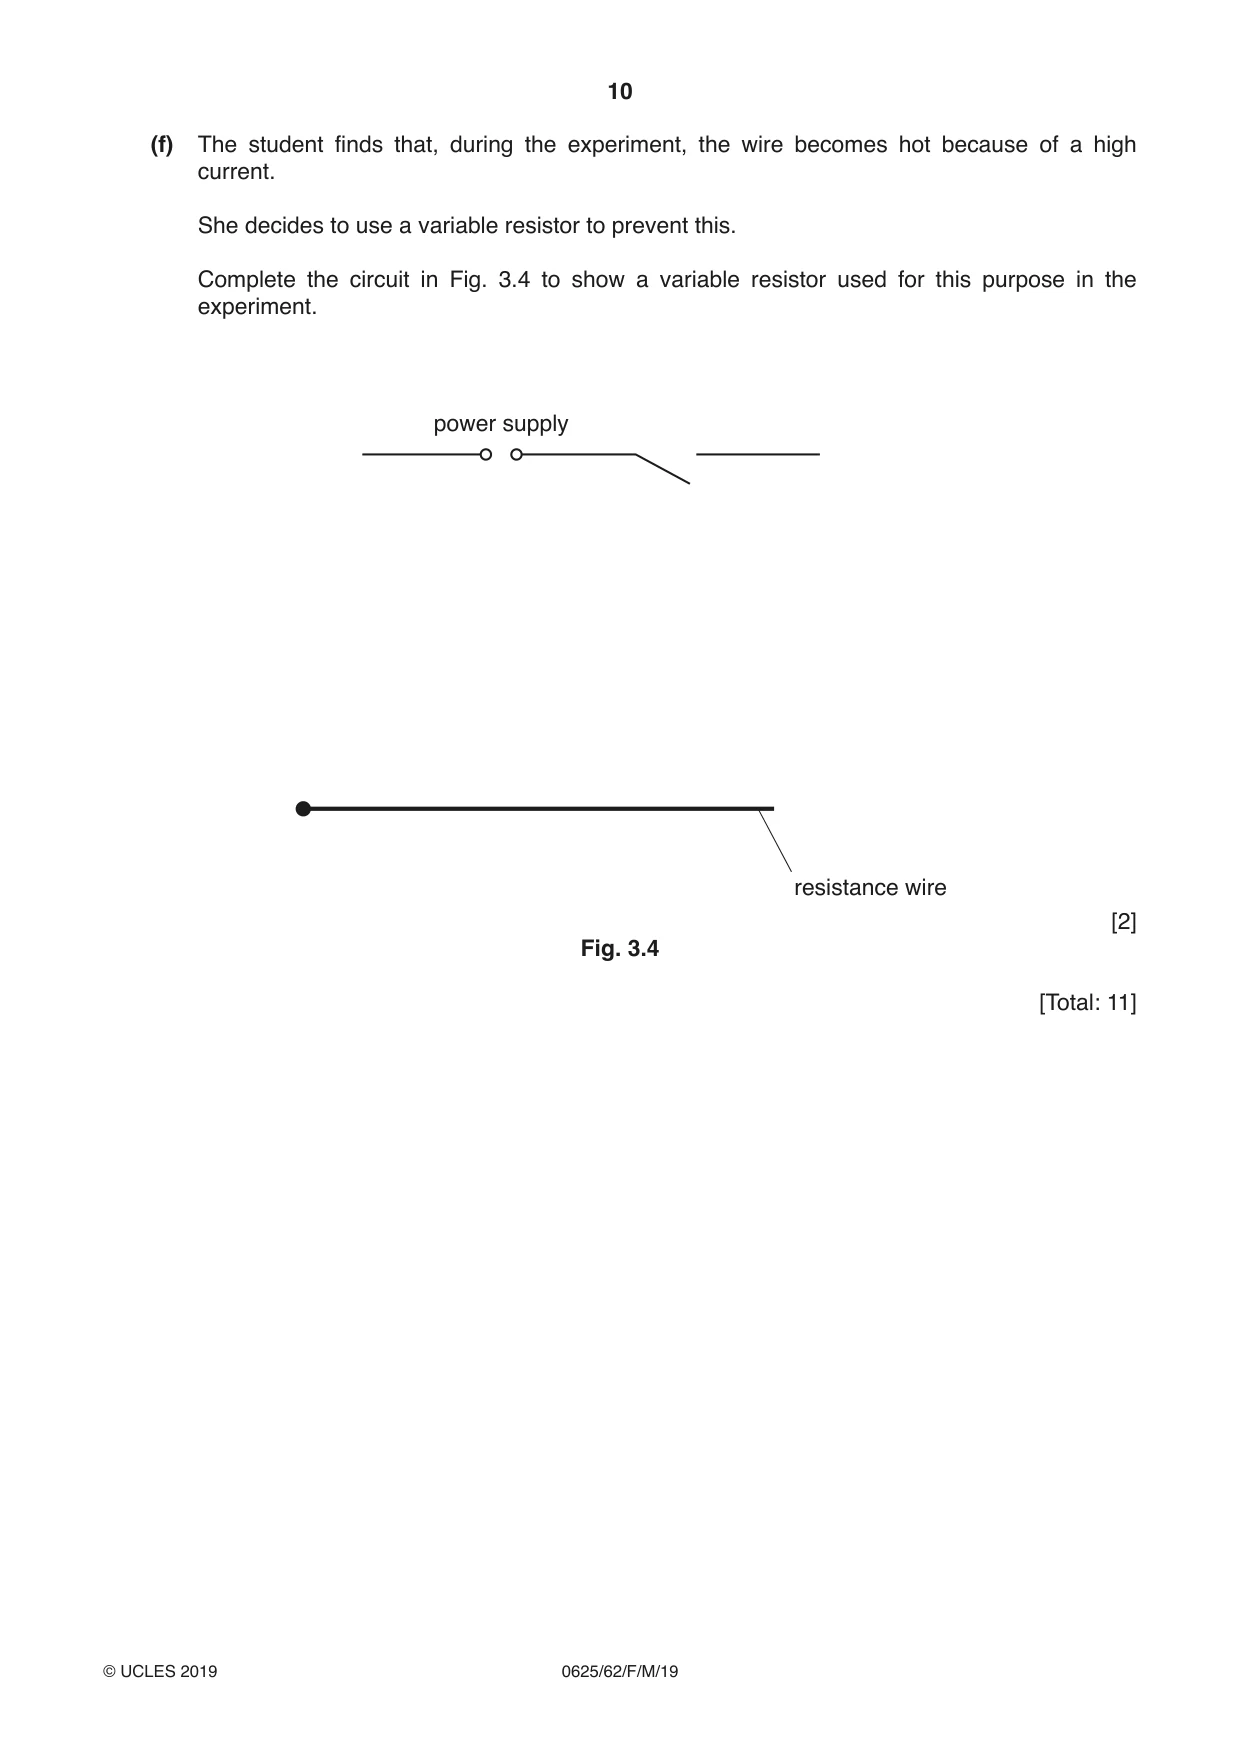
3 A student is investigating a resistance wire. She uses the circuit shown in Fig. 3.1. power supply A P Q crocodile clip resistance wire l Fig. 3.1 (a) (i) On Fig. 3.1, draw a voltmeter connected to measure the potential difference V across terminals P and Q. [1] (ii) The student connects the crocodile clip to a length l = 90.0 cm of the resistance wire and measures the potential difference V across terminals P and Q and the current I in the circuit. 2 3 0.4 0.6 1 4 0.2 0.8 0 5 0 1.0 V A Fig. 3.2 Fig. 3.3 Read, and record in Table 3.1, the values of V and I shown on the meters in Fig. 3.2 and Fig. 3.3. [2] (b) The student then connects the crocodile clip to lengths l = 60.0 cm and l = 40.0 cm of the resistance wire. She measures the potential difference V across terminals P and Q and the current I in the circuit. Her readings are shown in Table 3.1. Complete the column headings in Table 3.1. [1] Table 3.1 R Ω l / cm V / I / R / Ω l cm / 90.0 60.0 2.5 0.52 40.0 2.3 0.71 (c) (i) Calculate, and record in Table 3.1, the resistance R of each length l of the wire. V Use the readings from Table 3.1 and the equation R = I. [2] R (ii) Calculate, and record in Table 3.1, the value of for each length of the wire. l [1] (d) Use your results in Table 3.1 to calculate the resistance R25 of a 25.0 cm length of the resistance wire. Show your working. Ω [1] R25 = ..................................................... (e) Suggest one reason why different students, carrying out the experiment carefully with the same equipment, may not obtain identical results. ................................................................................................................................................... ................................................................................................................................................... ............................................................................................................................................. [1] (f) The student finds that, during the experiment, the wire becomes hot because of a high current. She decides to use a variable resistor to prevent this. Complete the circuit in Fig. 3.4 to show a variable resistor used for this purpose in the experiment. power supply resistance wire [2] Fig. 3.4 [Total: 11]
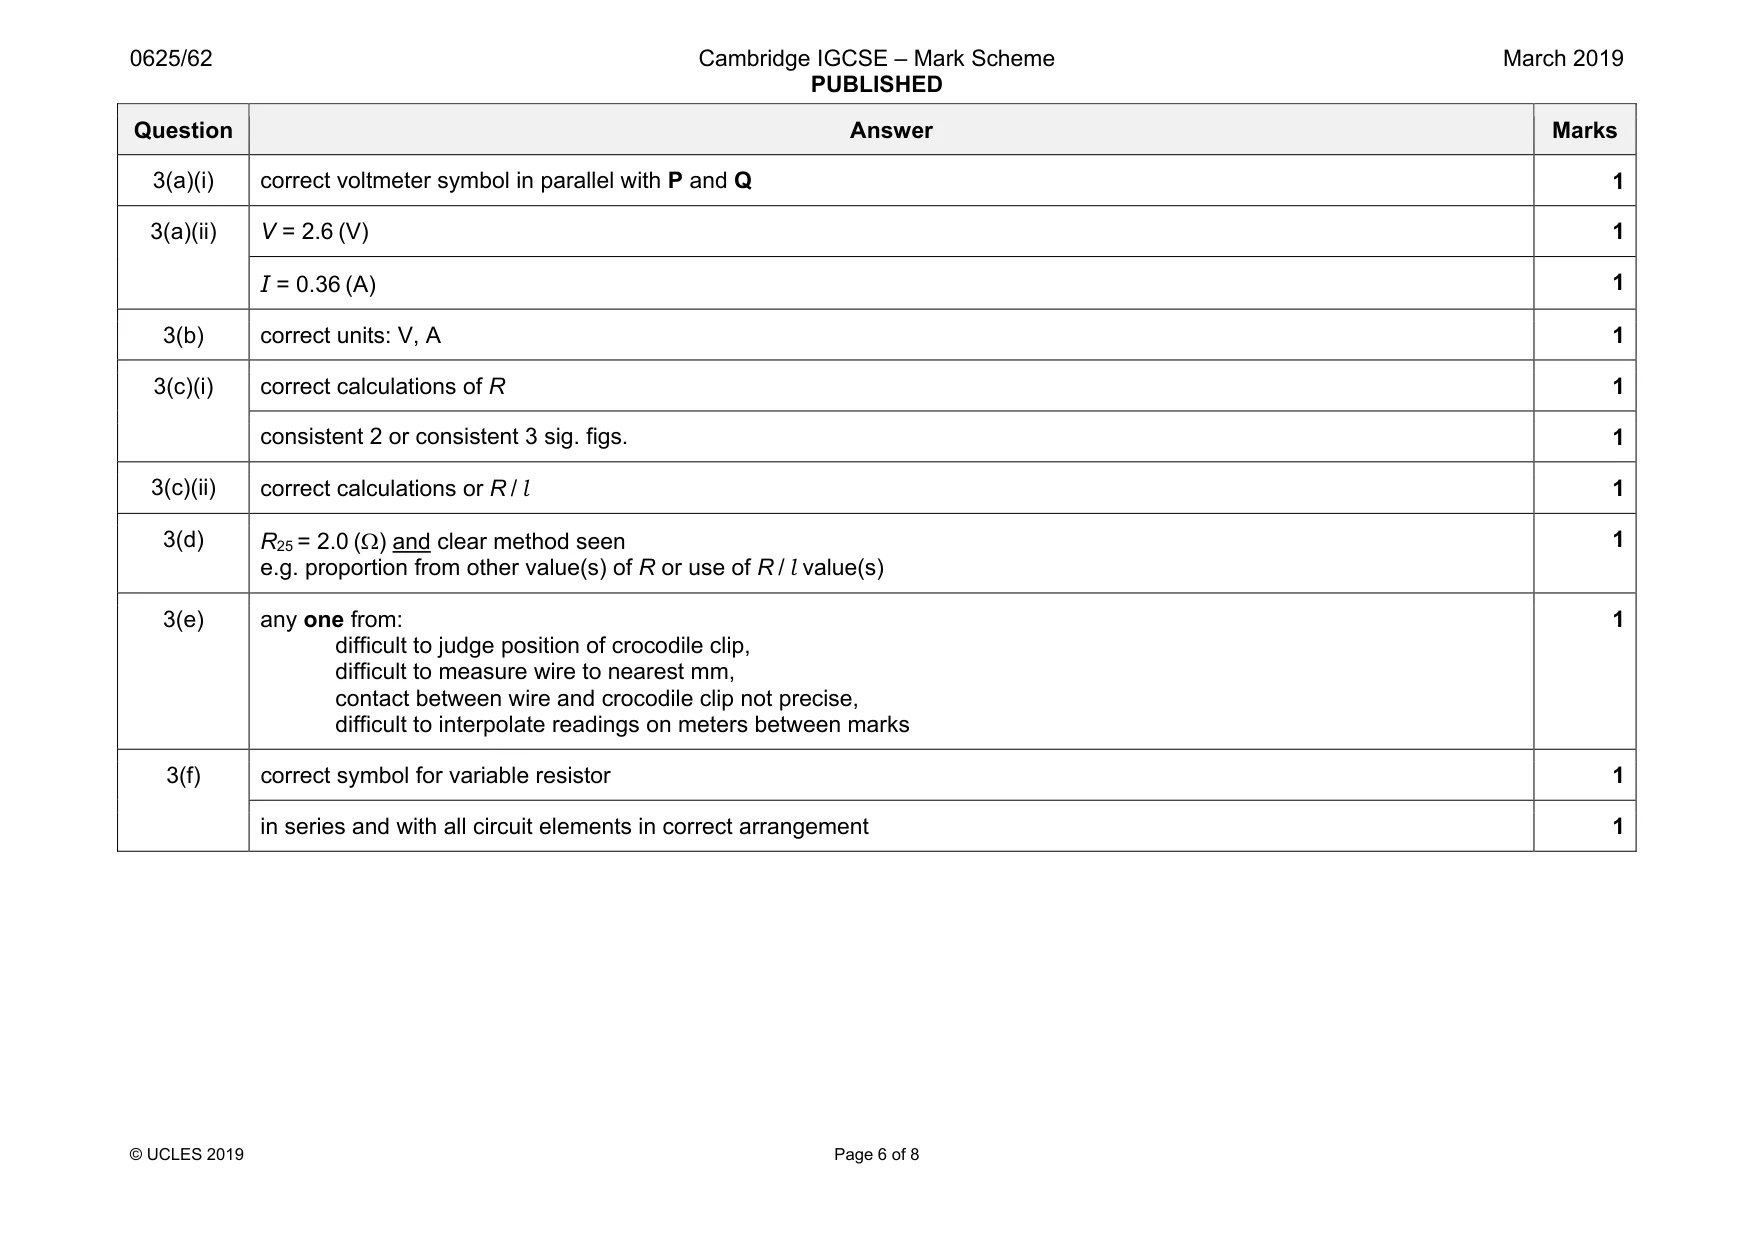
Mark scheme: 3(a)(i) correct voltmeter symbol in parallel with P and Q 1 3(a)(ii) V = 2.6 (V) 1 I = 0.36 (A) 1 3(b) correct units: V, A 1 3(c)(i) correct calculations of R 1 consistent 2 or consistent 3 sig. figs. 1 3(c)(ii) correct calculations or R / l 1 3(d) R25 = 2.0 (Ω) and clear method seen e.g. proportion from other value(s) of R or use of R / l value(s) 1 3(e) any one from: difficult to judge position of crocodile clip, difficult to measure wire to nearest mm, contact between wire and crocodile clip not precise, difficult to interpolate readings on meters between marks 1 3(f) correct symbol for variable resistor 1 in series and with all circuit elements in correct arrangement 1
Q4 · A student wants to investigate the effect of air resistance on the swing of a pendulum
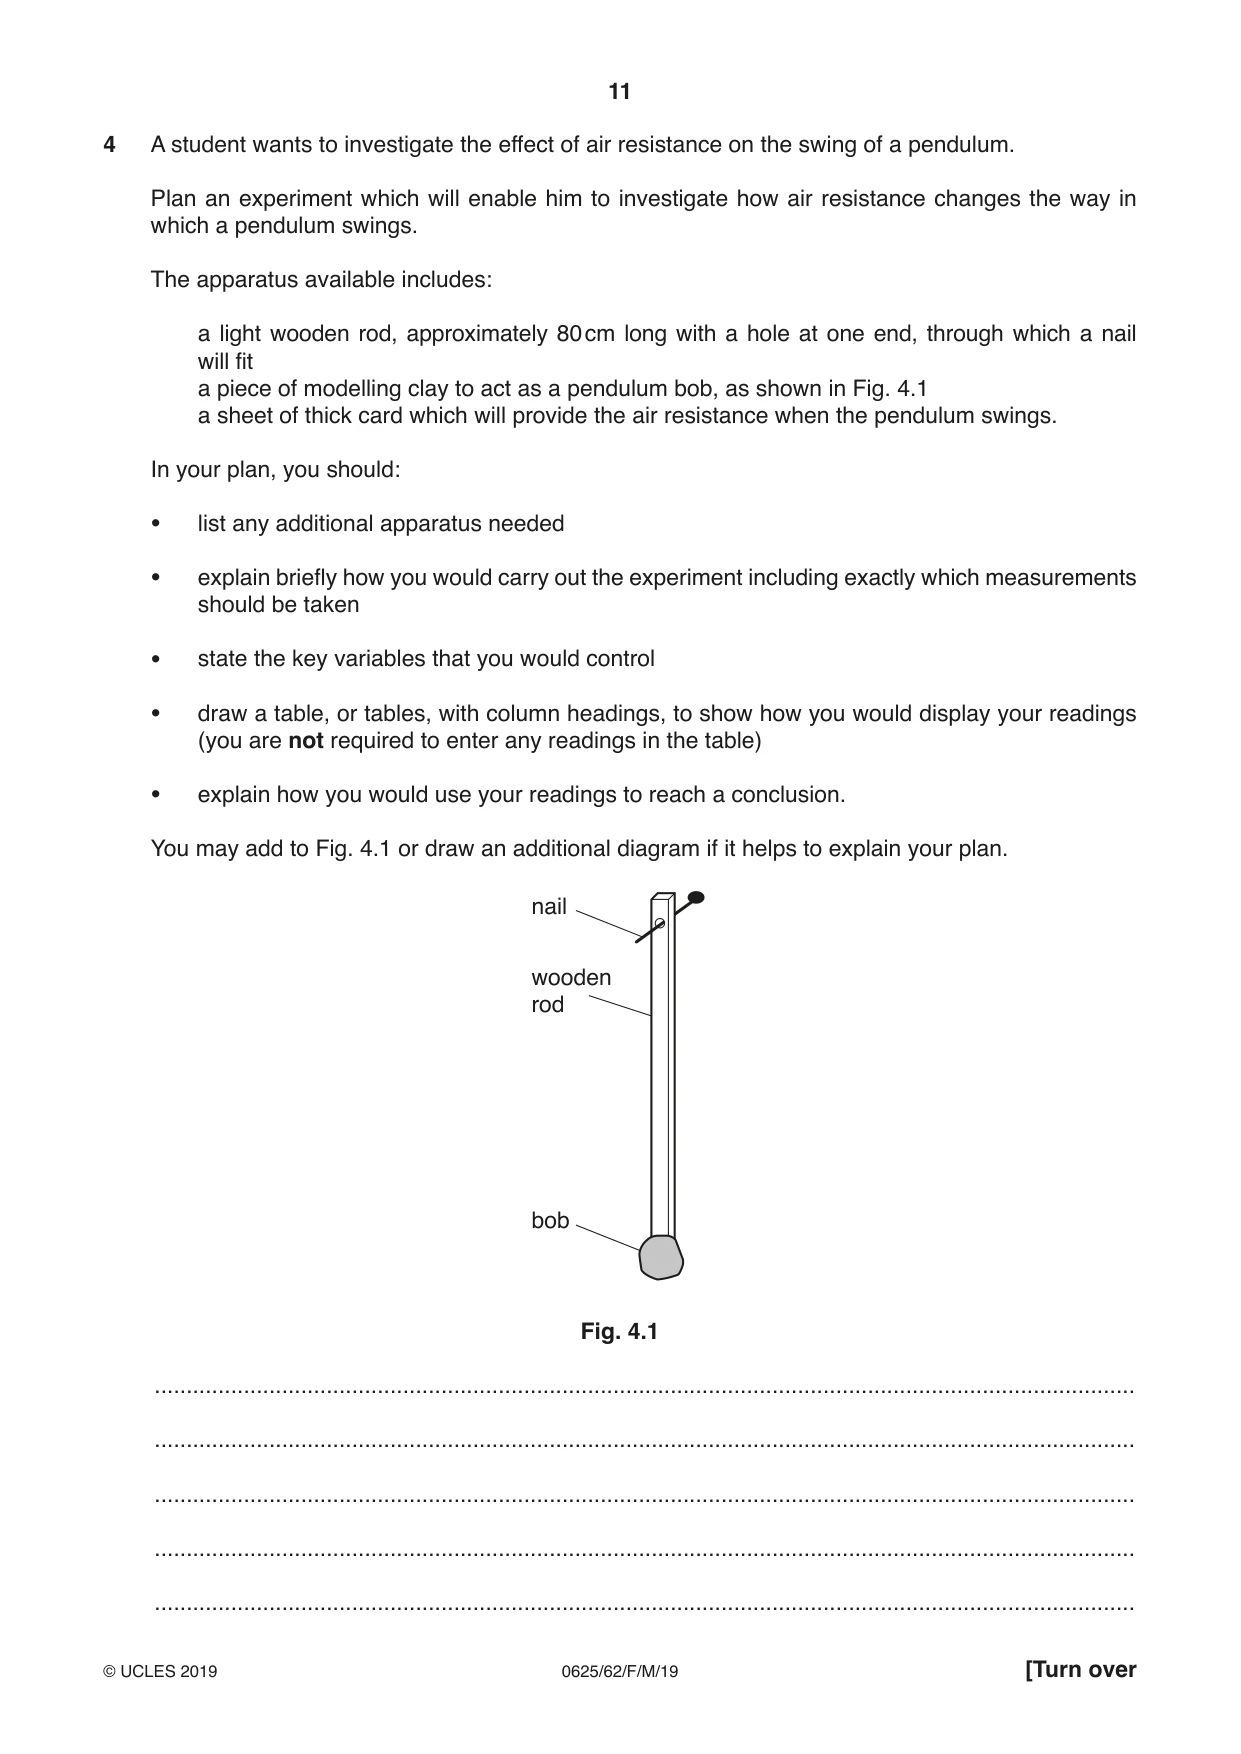
4 A student wants to investigate the effect of air resistance on the swing of a pendulum. Plan an experiment which will enable him to investigate how air resistance changes the way in which a pendulum swings. The apparatus available includes: a light wooden rod, approximately 80 cm long with a hole at one end, through which a nail will fit a piece of modelling clay to act as a pendulum bob, as shown in Fig. 4.1 a sheet of thick card which will provide the air resistance when the pendulum swings. In your plan, you should: • list any additional apparatus needed • explain briefly how you would carry out the experiment including exactly which measurements should be taken • state the key variables that you would control • draw a table, or tables, with column headings, to show how you would display your readings (you are not required to enter any readings in the table) • explain how you would use your readings to reach a conclusion. You may add to Fig. 4.1 or draw an additional diagram if it helps to explain your plan. nail wooden rod bob Fig. 4.1 .......................................................................................................................................................... .......................................................................................................................................................... .......................................................................................................................................................... .......................................................................................................................................................... .......................................................................................................................................................... .......................................................................................................................................................... .......................................................................................................................................................... .......................................................................................................................................................... .......................................................................................................................................................... .......................................................................................................................................................... .......................................................................................................................................................... .......................................................................................................................................................... .......................................................................................................................................................... .......................................................................................................................................................... .......................................................................................................................................................... .......................................................................................................................................................... .......................................................................................................................................................... .......................................................................................................................................................... .......................................................................................................................................................... .......................................................................................................................................................... .......................................................................................................................................................... .......................................................................................................................................................... .................................................................................................................................................... [7] [Total: 7]
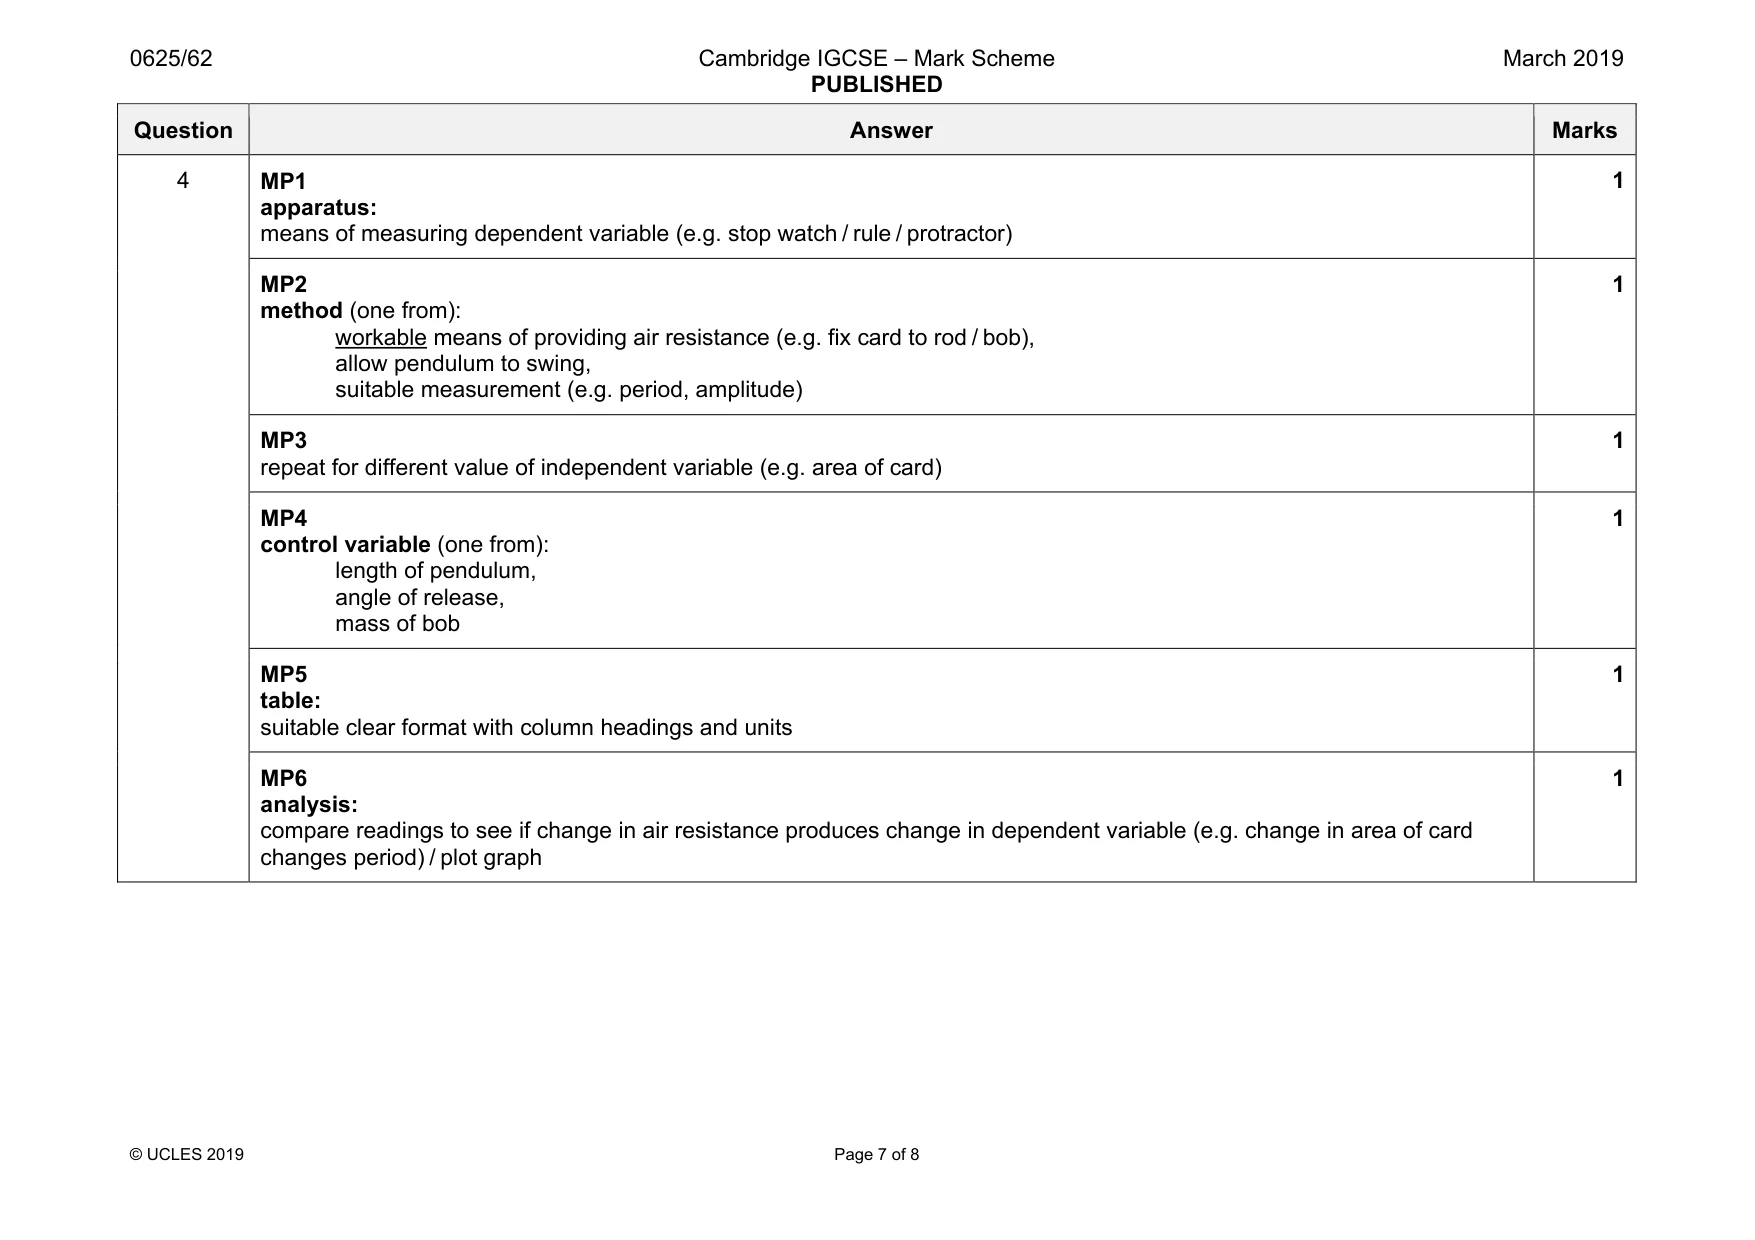
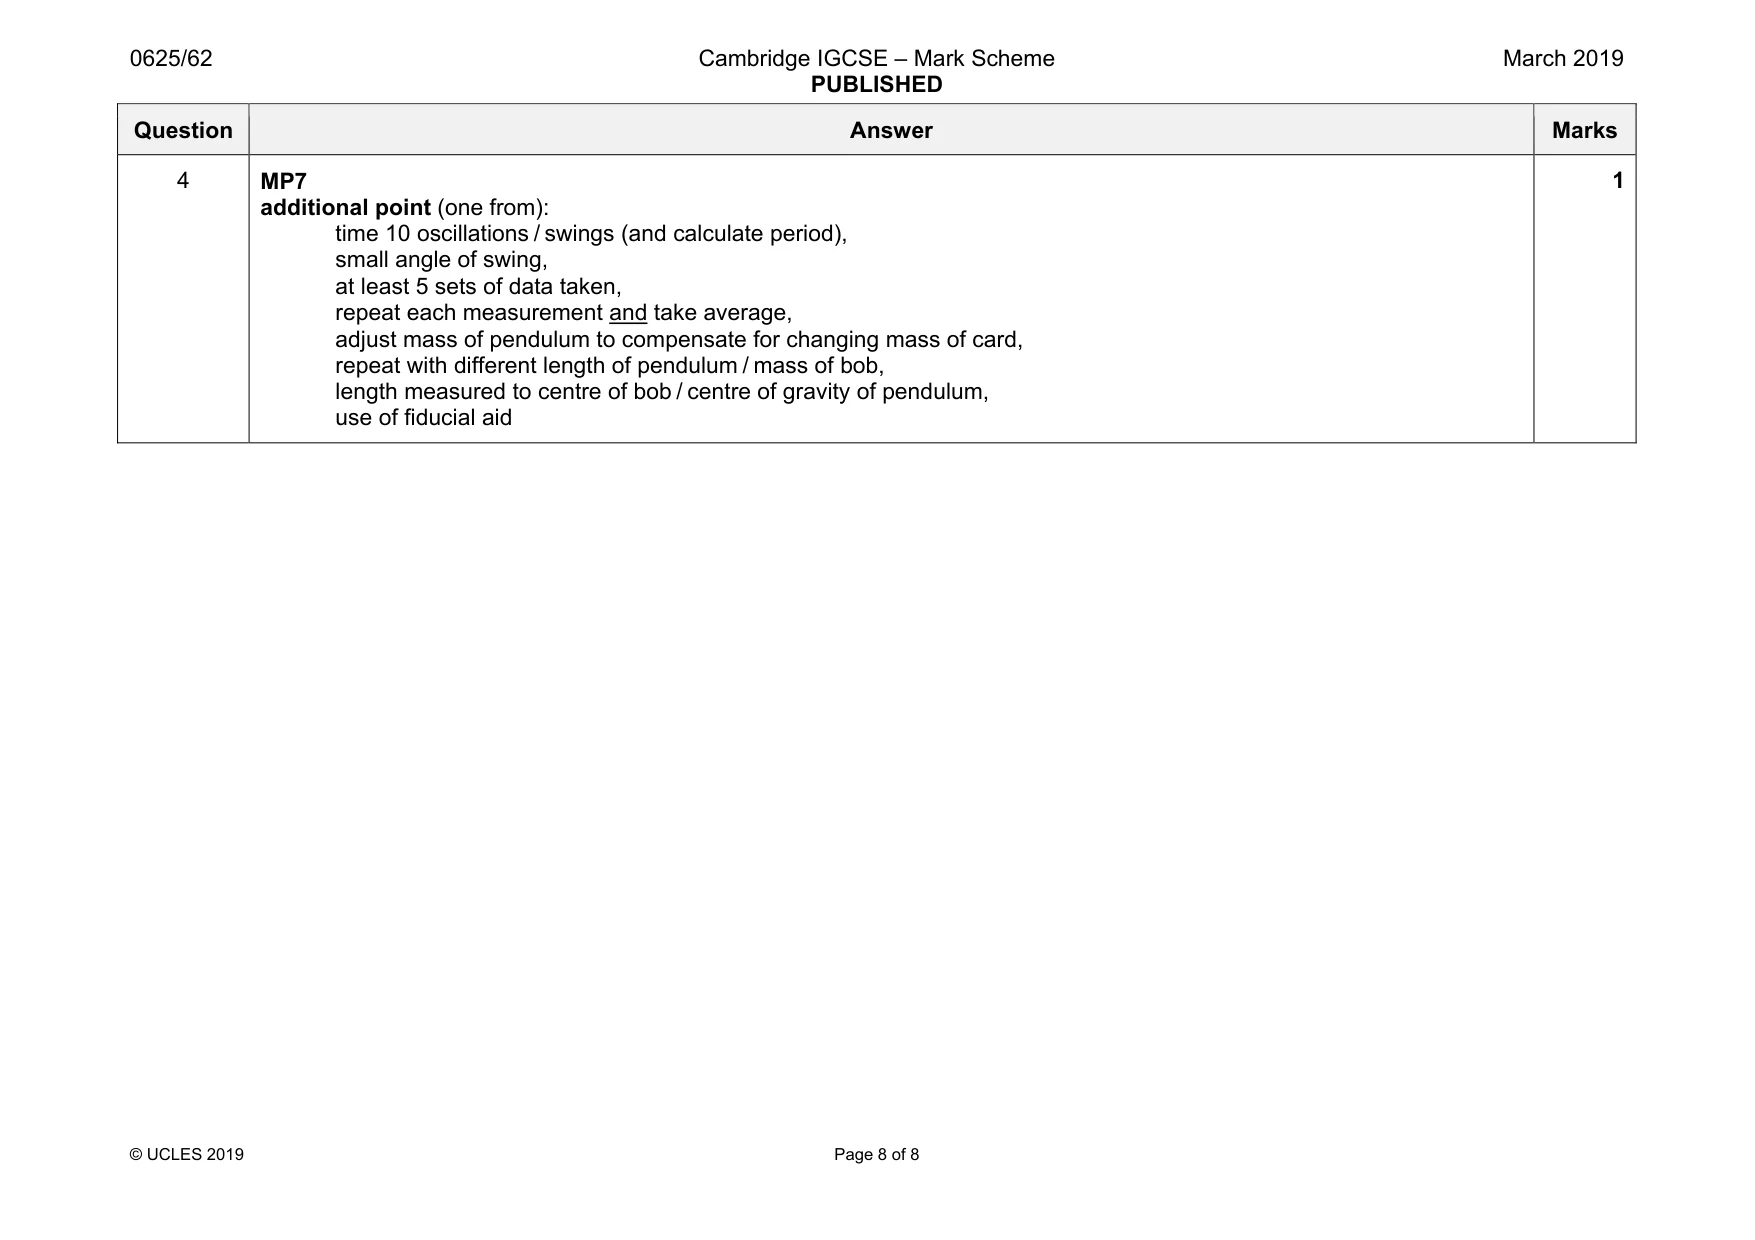
Mark scheme: 4 MP1 apparatus: means of measuring dependent variable (e.g. stop watch / rule / protractor) 1 MP2 method (one from): workable means of providing air resistance (e.g. fix card to rod / bob), allow pendulum to swing, suitable measurement (e.g. period, amplitude) 1 MP3 repeat for different value of independent variable (e.g. area of card) 1 MP4 control variable (one from): length of pendulum, angle of release, mass of bob 1 MP5 table: suitable clear format with column headings and units 1 MP6 analysis: compare readings to see if change in air resistance produces change in dependent variable (e.g. change in area of card changes period) / plot graph 1 Question Answer Marks 4 MP7 additional point (one from): time 10 oscillations / swings (and calculate period), small angle of swing, at least 5 sets of data taken, repeat each measurement and take average, adjust mass of pendulum to compensate for changing mass of card, repeat with different length of pendulum / mass of bob, length measured to centre of bob / centre of gravity of pendulum, use of fiducial aid 1
What was in this paper
The subtopics covered by these 4 questions, and how many questions each got. Open one in a new tab to see every Cambridge question on it.
What you needed in this session
Cambridge’s own grade thresholds for 2019 Feb/March, Paper 6 · Variant 2. A higher threshold means an easier paper — the bar moves with how the cohort did.