Cambridge IGCSE Physics 0625 — 2017 Oct/Nov Paper 6 · Variant 2
0625/62/O/N/17 · 4 questions · 40 marks · ≈45 min
The question paper and its mark scheme, free to read here and free to download. This is Cambridge’s own paper, exactly as it was sat.
Question paper12 pages
Mark scheme5 pages
Answers below. Sit the paper first if you are practising.
Questions as text
Q1 · A student is comparing the oscillations of two pendulums
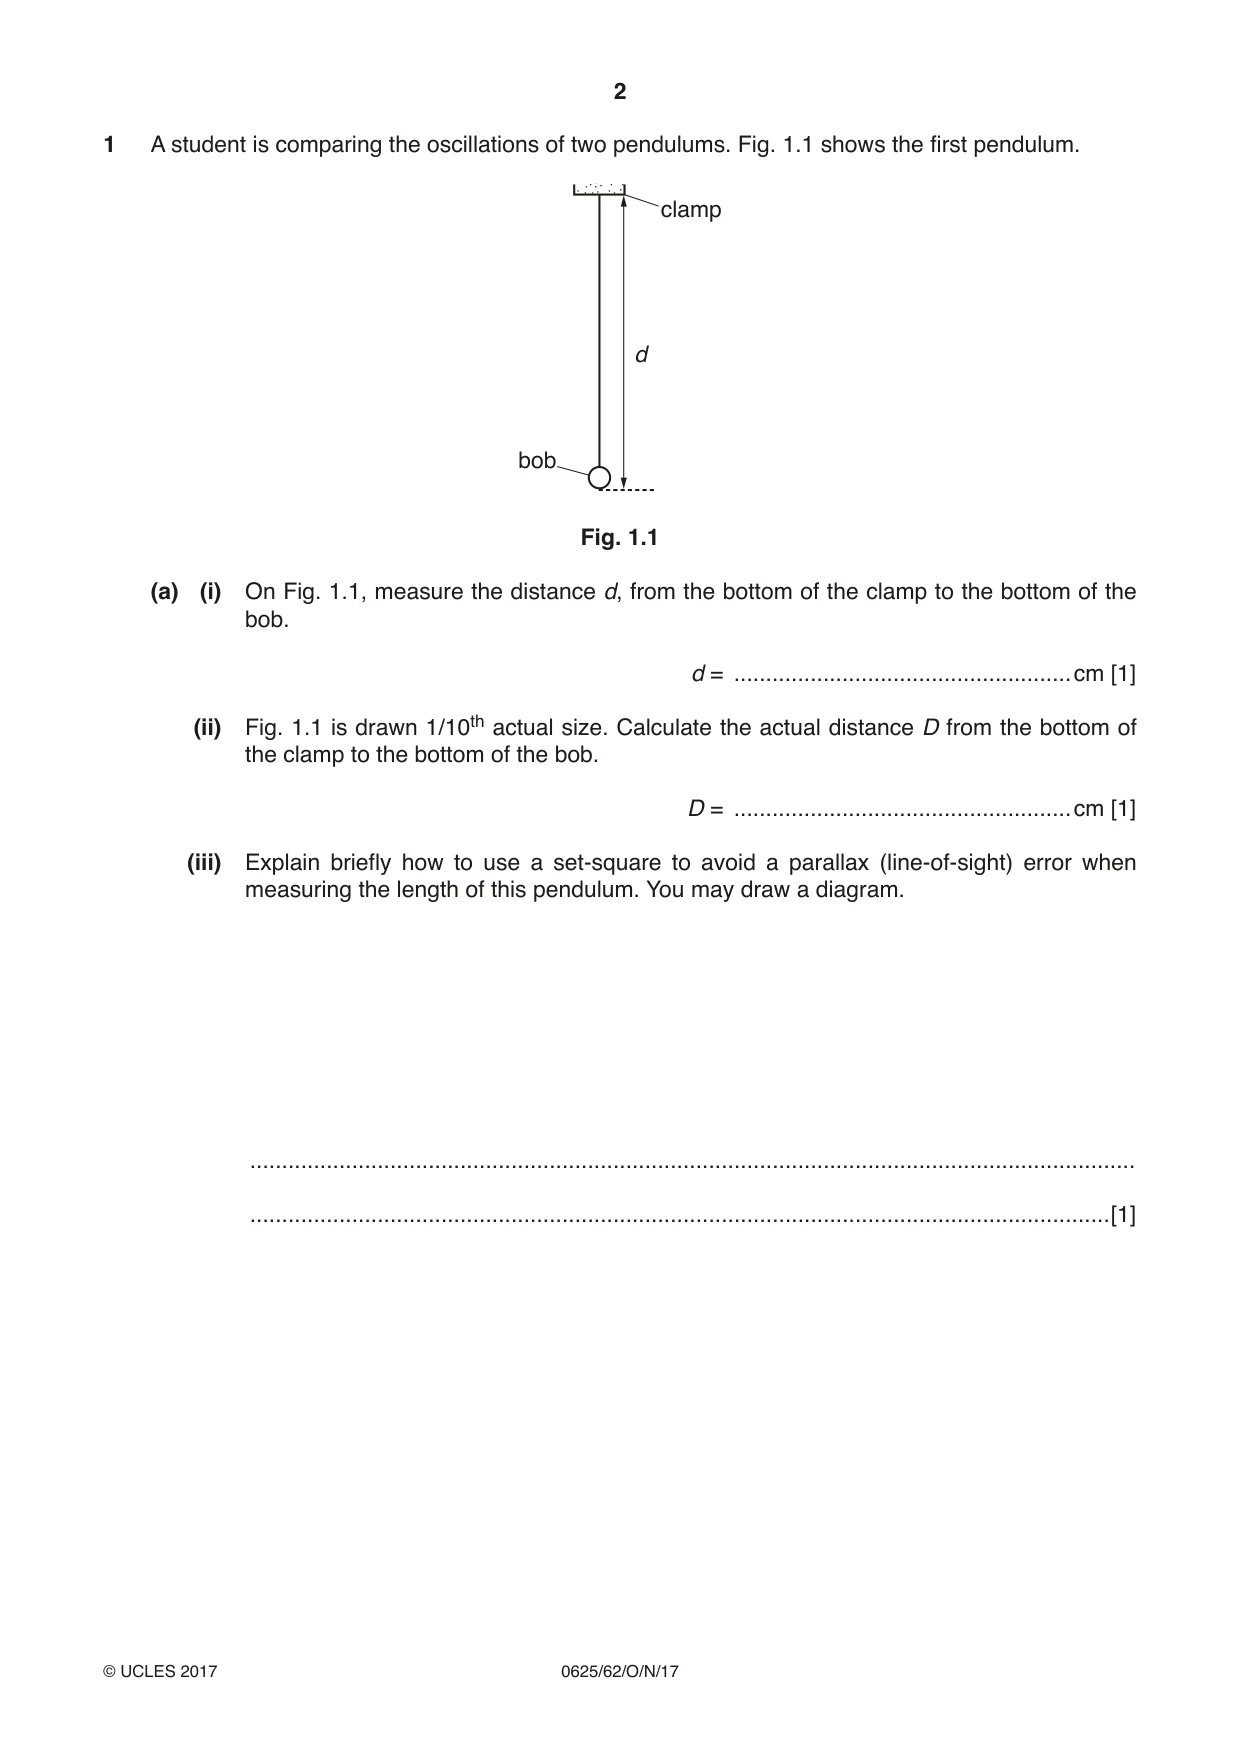
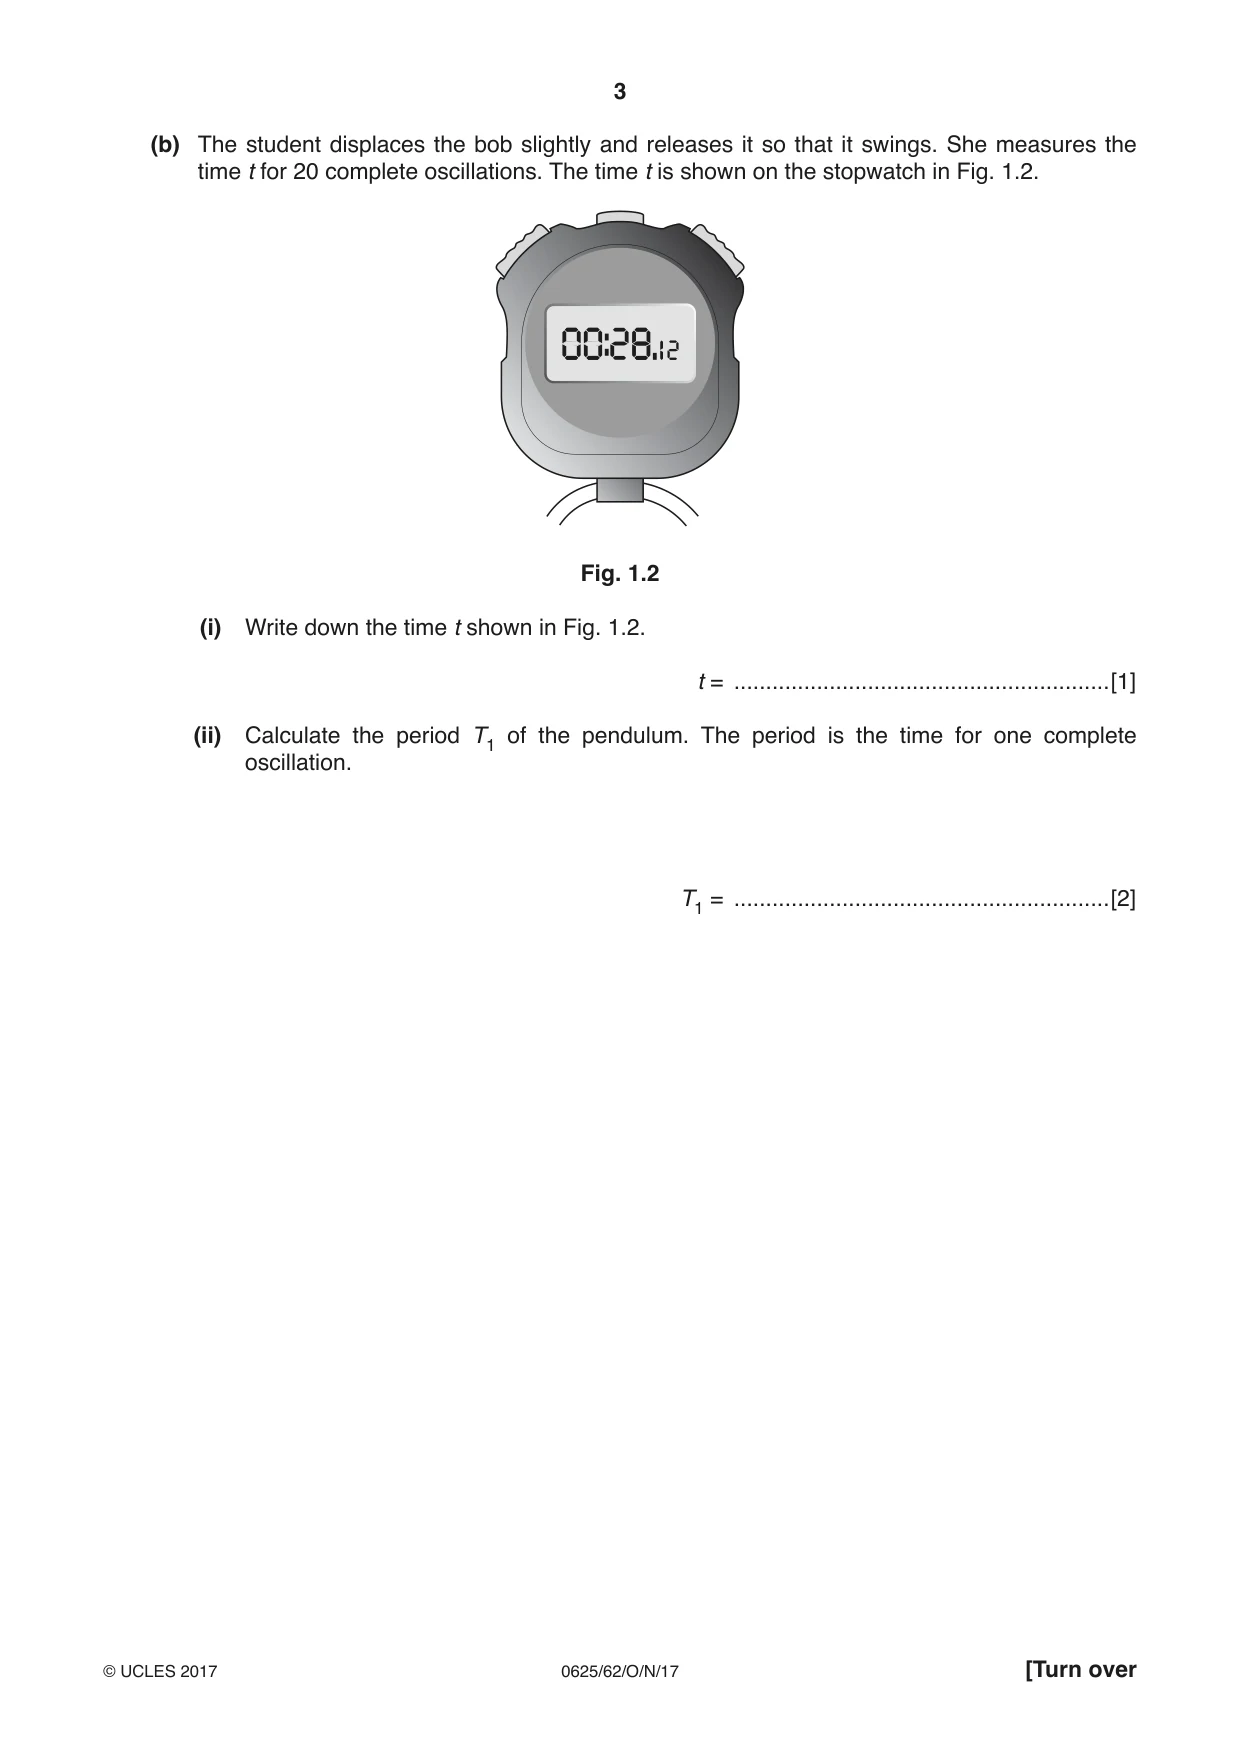
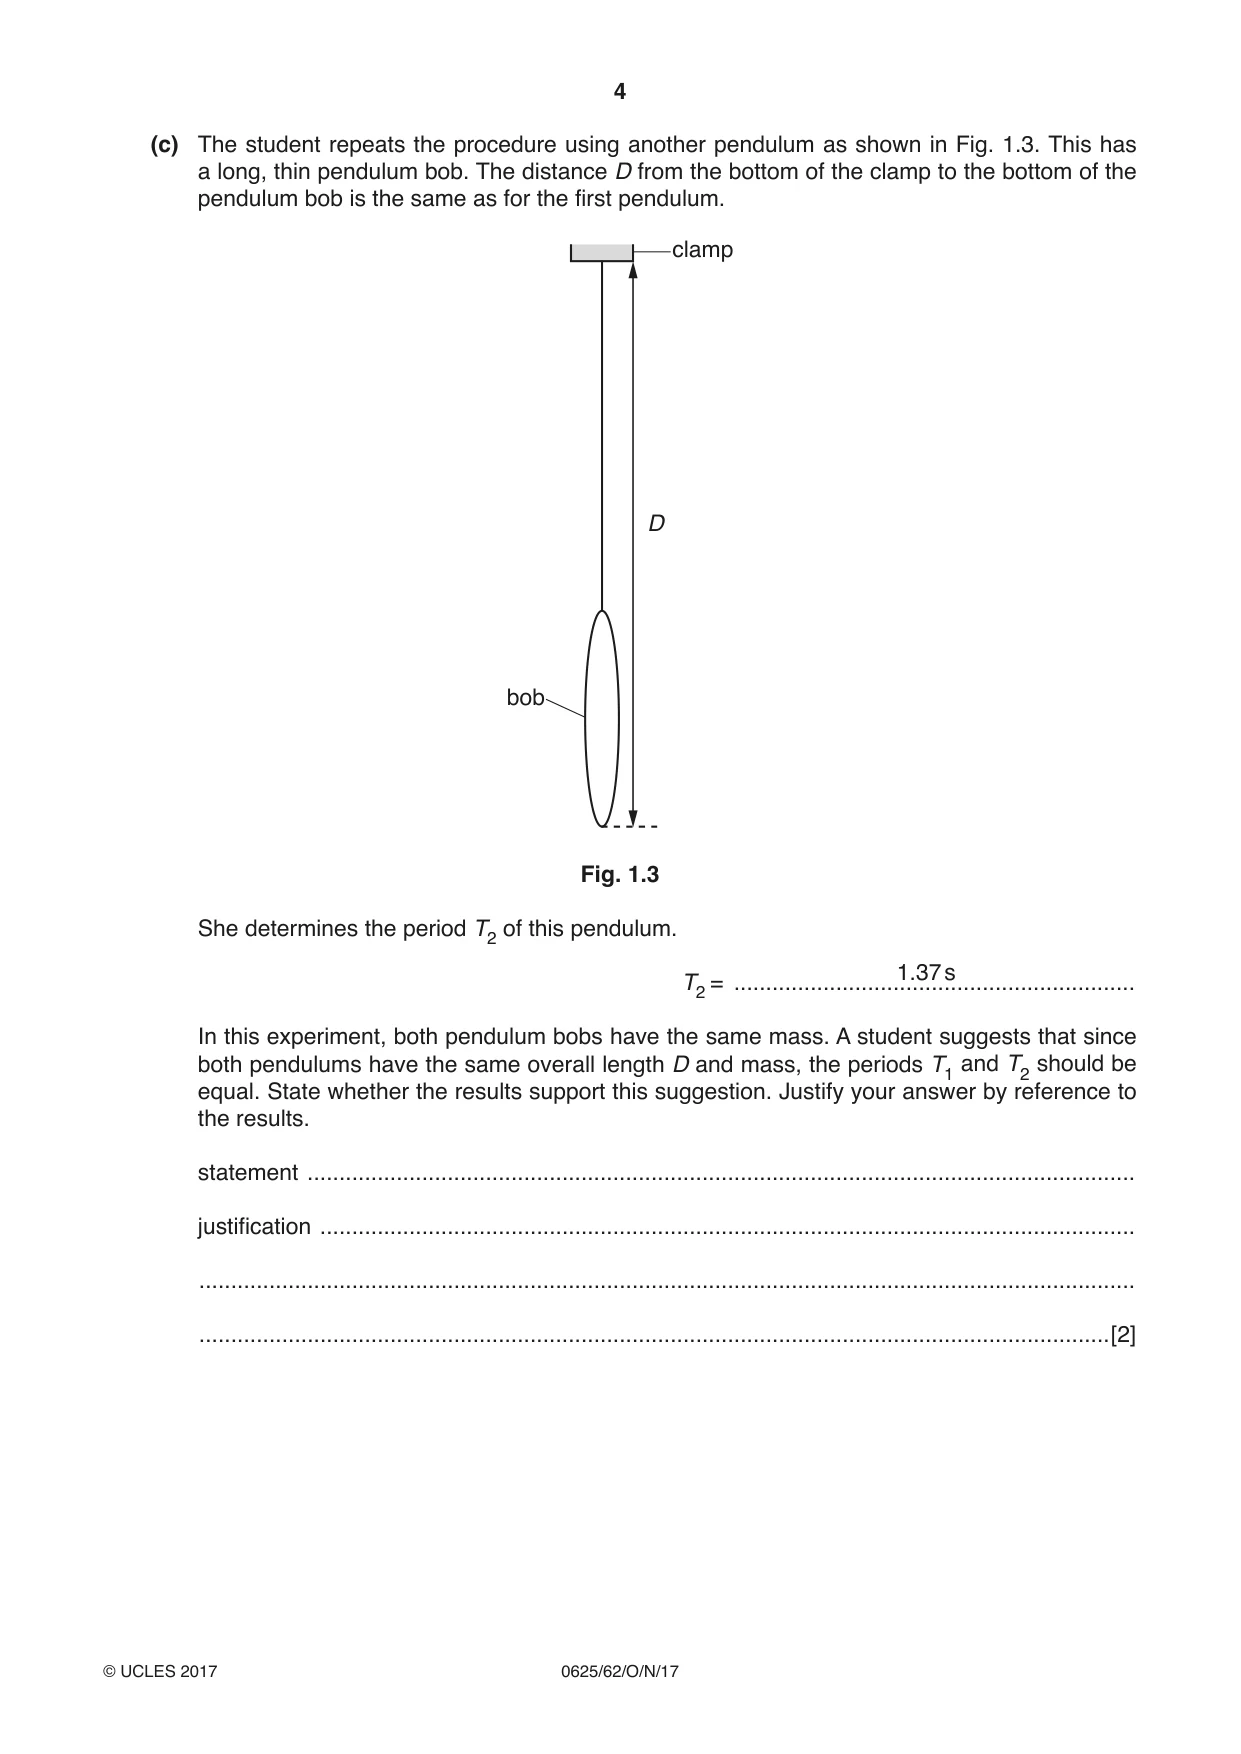
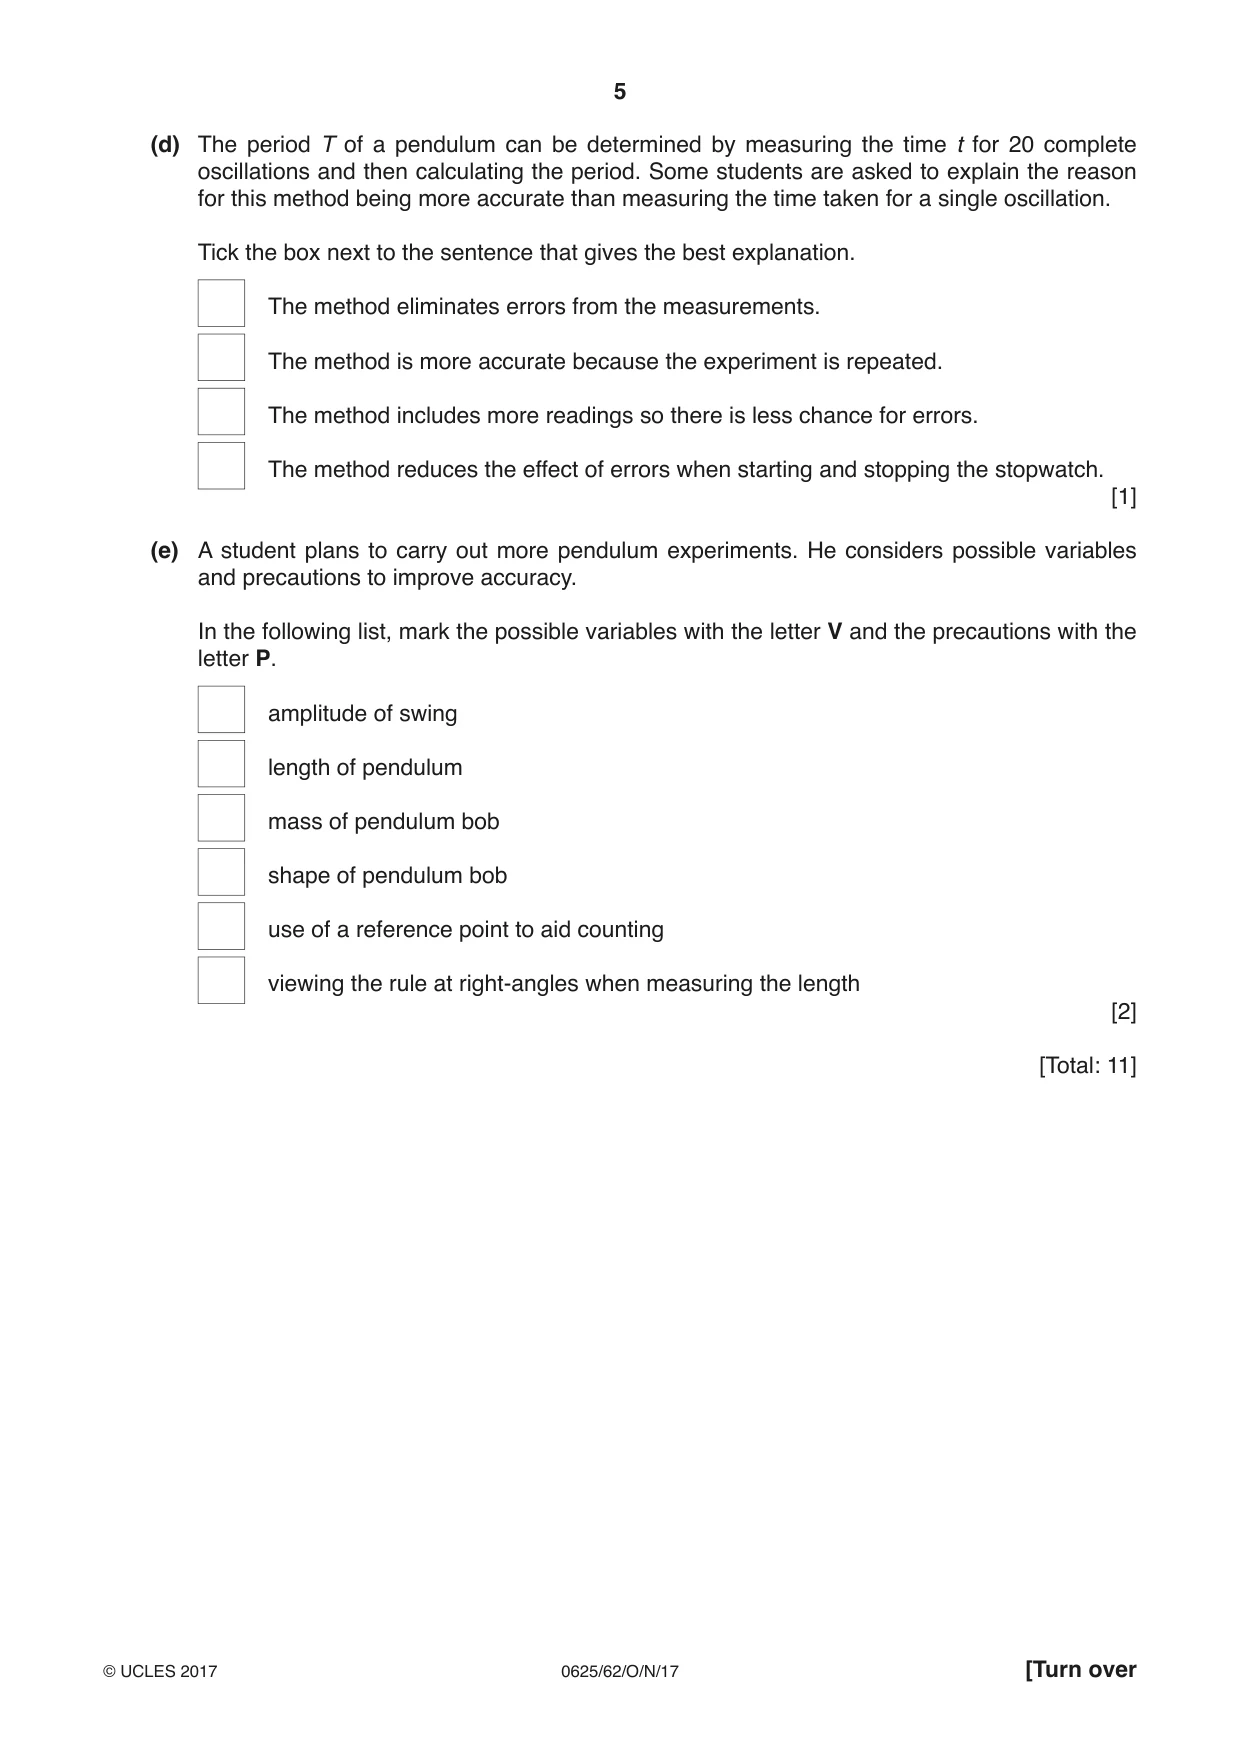
1 A student is comparing the oscillations of two pendulums. Fig. 1.1 shows the first pendulum. clamp d bob Fig. 1.1 (a) (i) On Fig. 1.1, measure the distance d, from the bottom of the clamp to the bottom of the bob. d = .....................................................cm [1] (ii) Fig. 1.1 is drawn 1/10th actual size. Calculate the actual distance D from the bottom of the clamp to the bottom of the bob. D = .....................................................cm [1] (iii) Explain briefly how to use a set-square to avoid a parallax (line-of-sight) error when measuring the length of this pendulum. You may draw a diagram. ........................................................................................................................................... .......................................................................................................................................[1] (b) The student displaces the bob slightly and releases it so that it swings. She measures the time t for 20 complete oscillations. The time t is shown on the stopwatch in Fig. 1.2. Fig. 1.2 (i) Write down the time t shown in Fig. 1.2. t = ...........................................................[1] (ii) Calculate the period T1 of the pendulum. The period is the time for one complete oscillation. T1 = ...........................................................[2] (c) The student repeats the procedure using another pendulum as shown in Fig. 1.3. This has a long, thin pendulum bob. The distance D from the bottom of the clamp to the bottom of the pendulum bob is the same as for the first pendulum. clamp D bob Fig. 1.3 She determines the period T2 of this pendulum. 1.37 s T2 = ............................................................... In this experiment, both pendulum bobs have the same mass. A student suggests that since both pendulums have the same overall length D and mass, the periods T1 and T2 should be equal. State whether the results support this suggestion. Justify your answer by reference to the results. statement .................................................................................................................................. justification ................................................................................................................................ ................................................................................................................................................... ...............................................................................................................................................[2] (d) The period T of a pendulum can be determined by measuring the time t for 20 complete oscillations and then calculating the period. Some students are asked to explain the reason for this method being more accurate than measuring the time taken for a single oscillation. Tick the box next to the sentence that gives the best explanation. The method eliminates errors from the measurements. The method is more accurate because the experiment is repeated. The method includes more readings so there is less chance for errors. The method reduces the effect of errors when starting and stopping the stopwatch. [1] (e) A student plans to carry out more pendulum experiments. He considers possible variables and precautions to improve accuracy. In the following list, mark the possible variables with the letter V and the precautions with the letter P. amplitude of swing length of pendulum mass of pendulum bob shape of pendulum bob use of a reference point to aid counting viewing the rule at right-angles when measuring the length [2] [Total: 11]
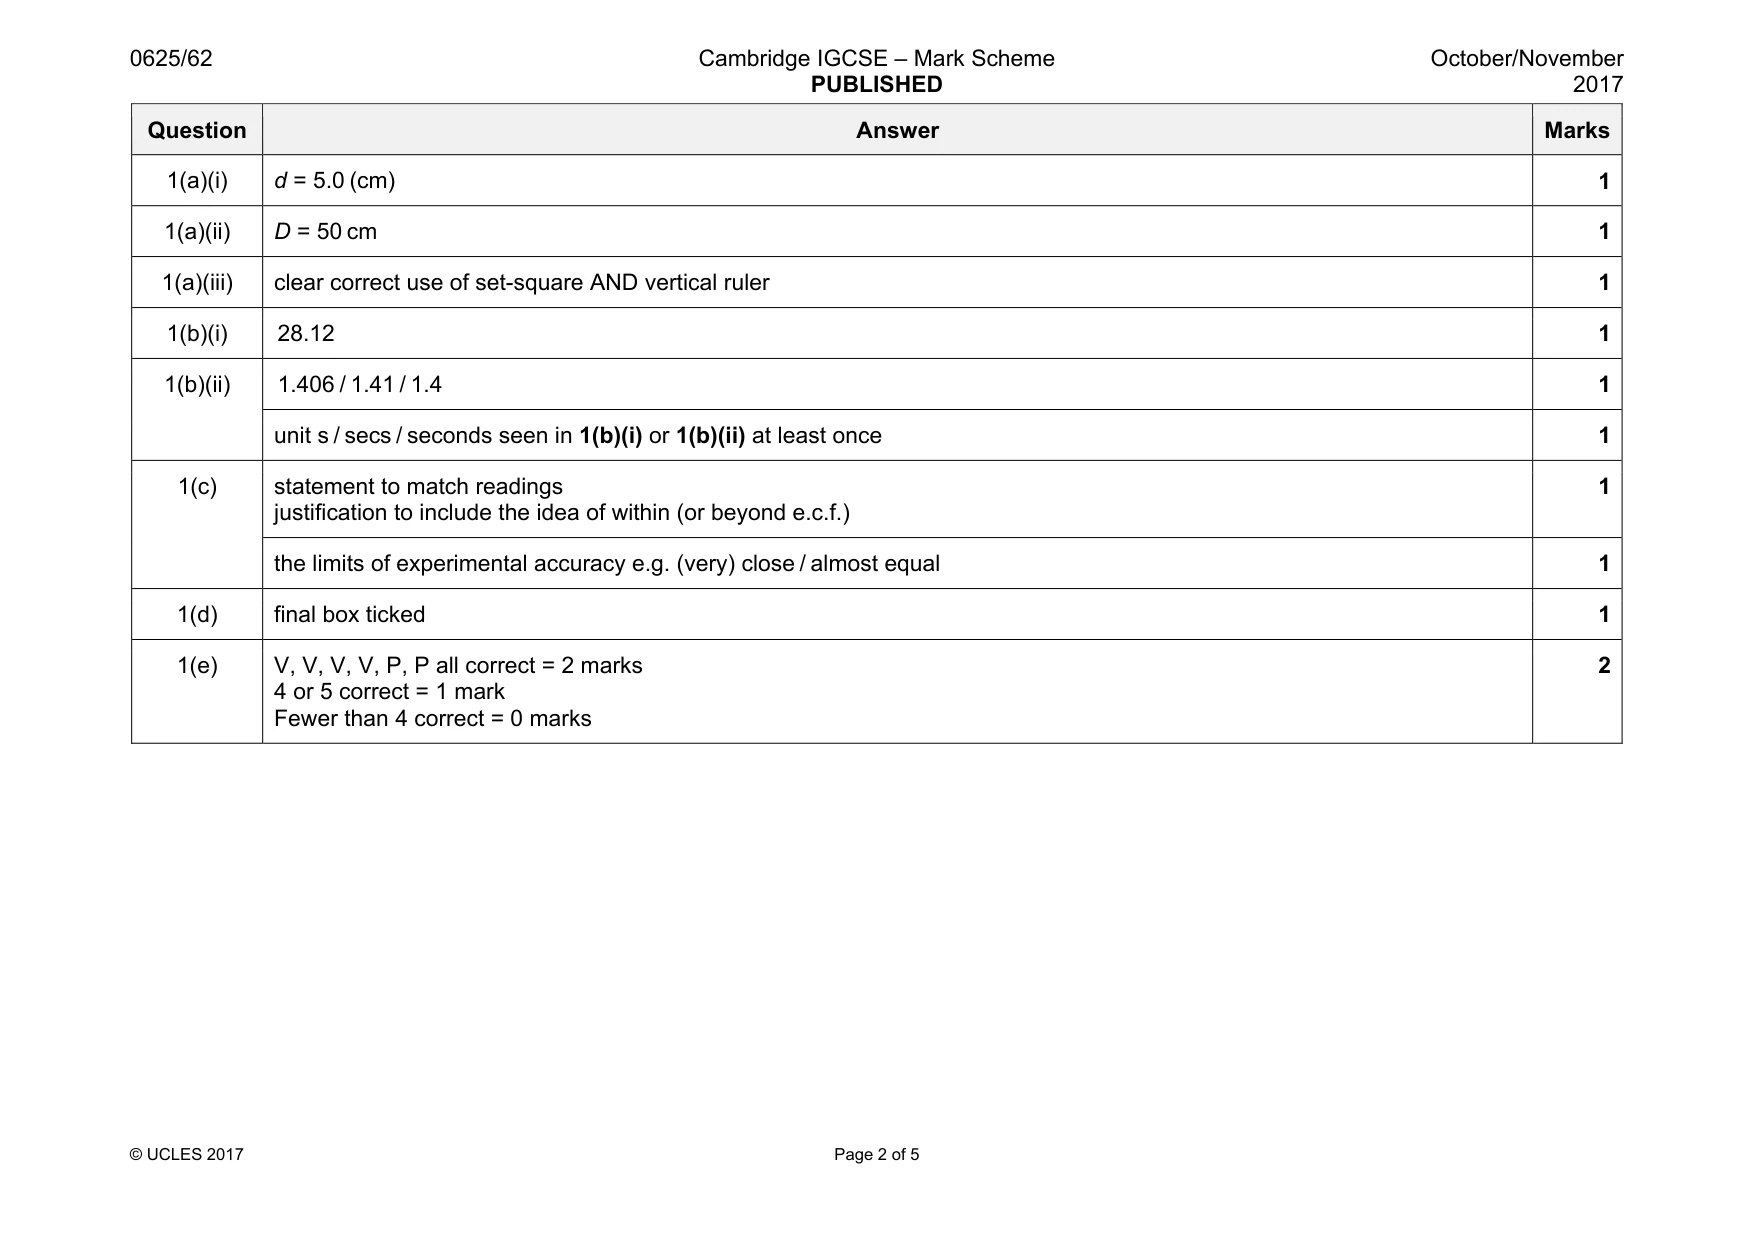
Mark scheme: 1(a)(i) d = 5.0 (cm) 1 1(a)(ii) D = 50 cm 1 1(a)(iii) clear correct use of set-square AND vertical ruler 1 1(b)(i) 28.12 1 1(b)(ii) 1.406 / 1.41 / 1.4 1 unit s / secs / seconds seen in 1(b)(i) or 1(b)(ii) at least once 1 1(c) statement to match readings justification to include the idea of within (or beyond e.c.f.) 1 the limits of experimental accuracy e.g. (very) close / almost equal 1 1(d) final box ticked 1 1(e) V, V, V, V, P, P all correct = 2 marks 4 or 5 correct = 1 mark Fewer than 4 correct = 0 marks 2
More questions on Physical quantities and measurement techniques
Q2 · A student is investigating the cooling of water
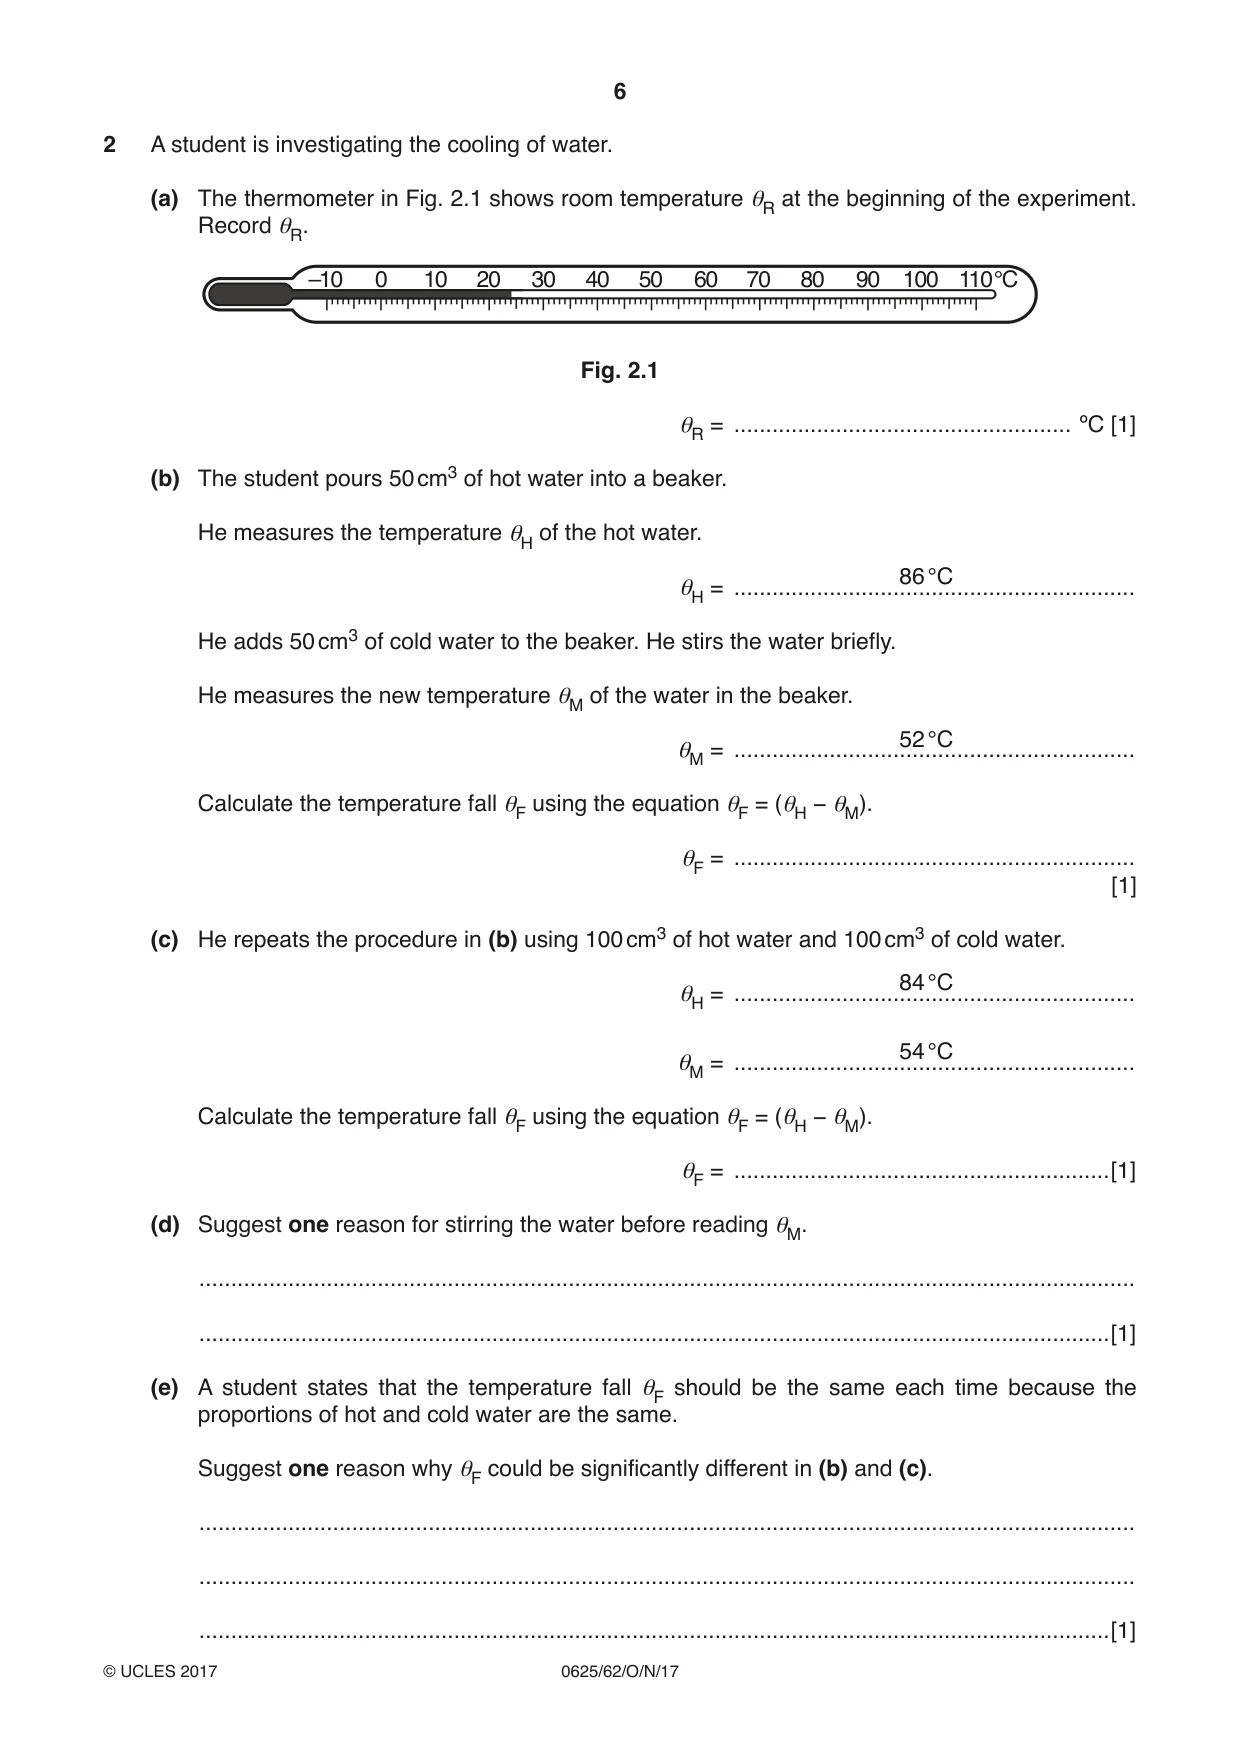
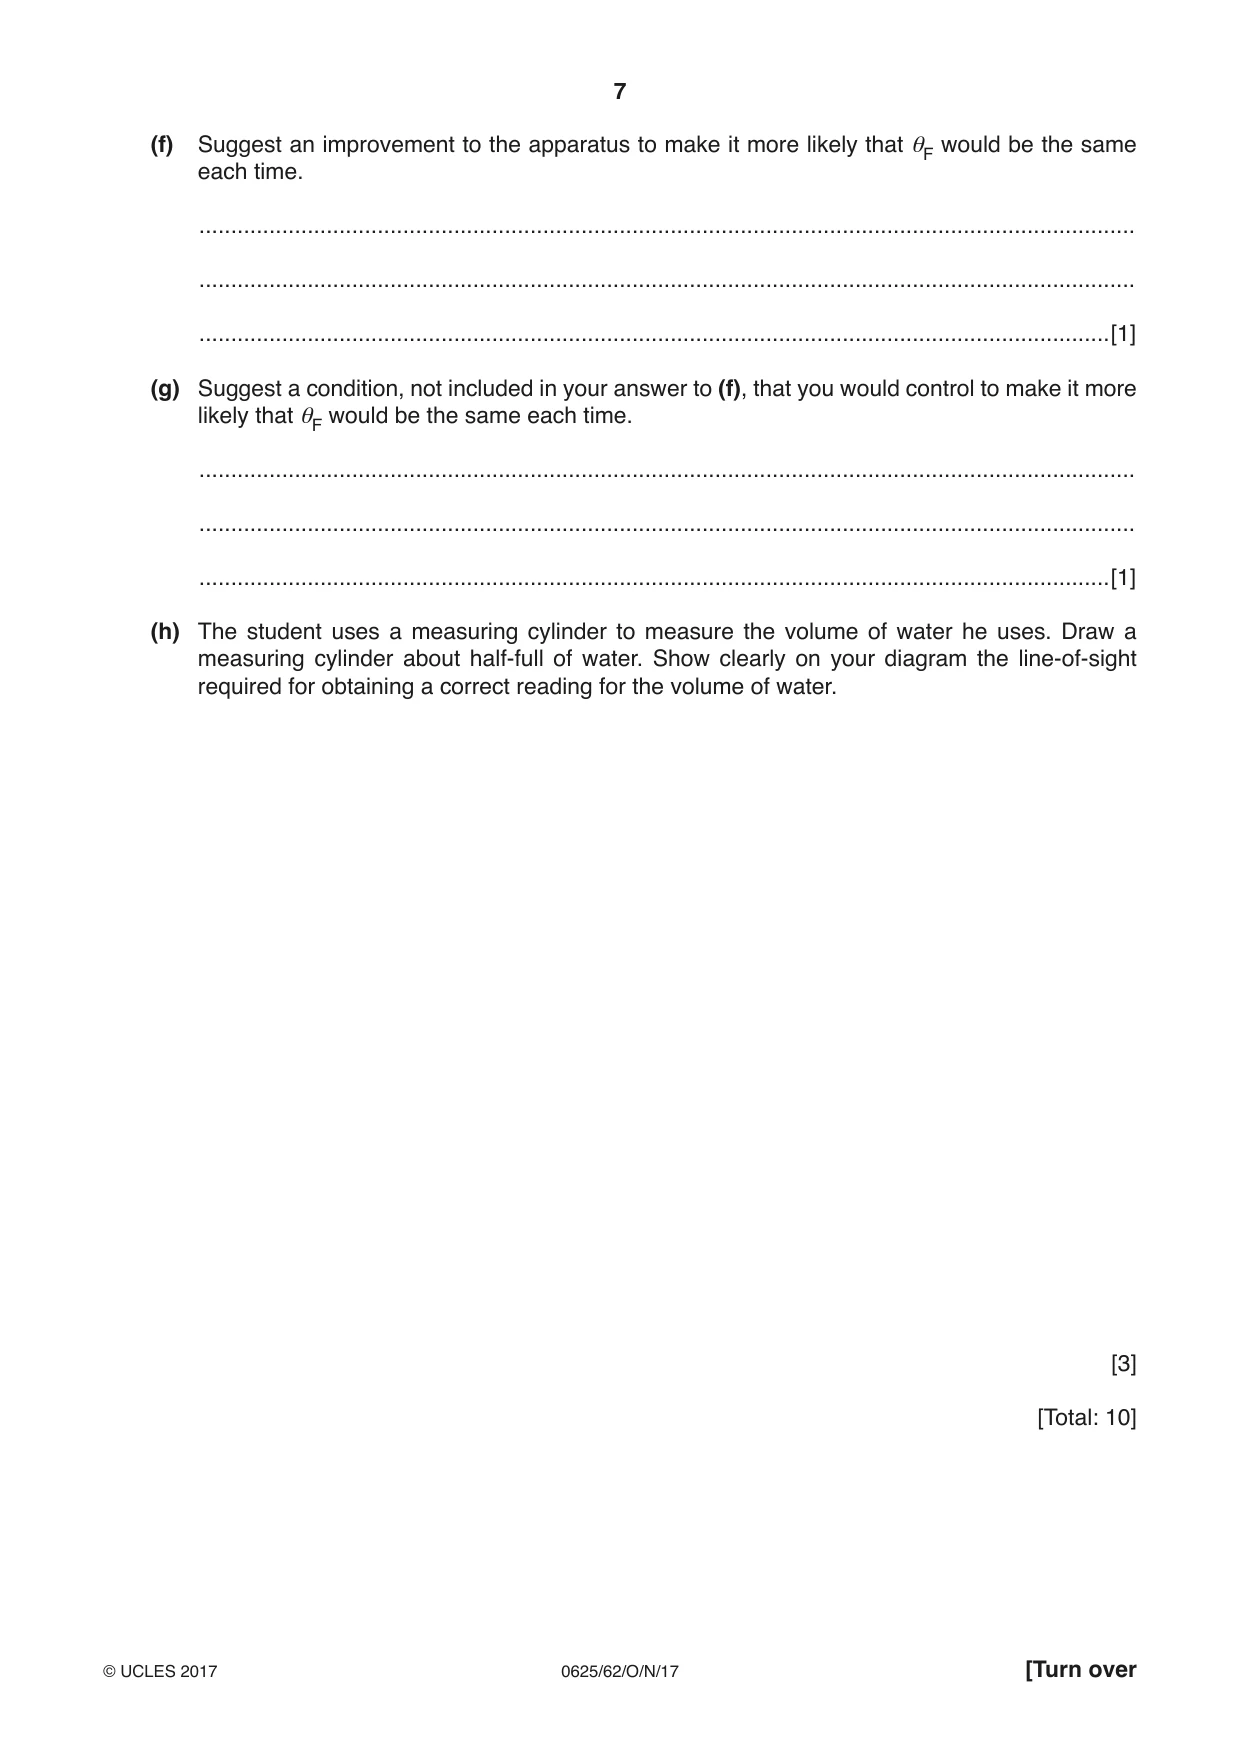
2 A student is investigating the cooling of water. (a) The thermometer in Fig. 2.1 shows room temperature θR at the beginning of the experiment. Record θR. –10 0 10 20 30 40 50 60 70 80 90 100 110°C Fig. 2.1 θR = ..................................................... ºC [1] (b) The student pours 50 cm3 of hot water into a beaker. He measures the temperature θH of the hot water. 86 °C θH = ............................................................... He adds 50 cm3 of cold water to the beaker. He stirs the water briefly. He measures the new temperature θM of the water in the beaker. 52 °C θM = ............................................................... Calculate the temperature fall θF using the equation θF = (θH − θM). θF = ............................................................... [1] (c) He repeats the procedure in (b) using 100 cm3 of hot water and 100 cm3 of cold water. 84 °C θH = ............................................................... 54 °C θM = ............................................................... Calculate the temperature fall θF using the equation θF = (θH − θM). θF = ...........................................................[1] (d) Suggest one reason for stirring the water before reading θM. ................................................................................................................................................... ...............................................................................................................................................[1] (e) A student states that the temperature fall θF should be the same each time because the proportions of hot and cold water are the same. Suggest one reason why θF could be significantly different in (b) and (c). ................................................................................................................................................... ................................................................................................................................................... ...............................................................................................................................................[1] (f) Suggest an improvement to the apparatus to make it more likely that θF would be the same each time. ................................................................................................................................................... ................................................................................................................................................... ...............................................................................................................................................[1] (g) Suggest a condition, not included in your answer to (f), that you would control to make it more likely that θF would be the same each time. ................................................................................................................................................... ................................................................................................................................................... ...............................................................................................................................................[1] (h) The student uses a measuring cylinder to measure the volume of water he uses. Draw a measuring cylinder about half-full of water. Show clearly on your diagram the line-of-sight required for obtaining a correct reading for the volume of water. [3] [Total: 10]
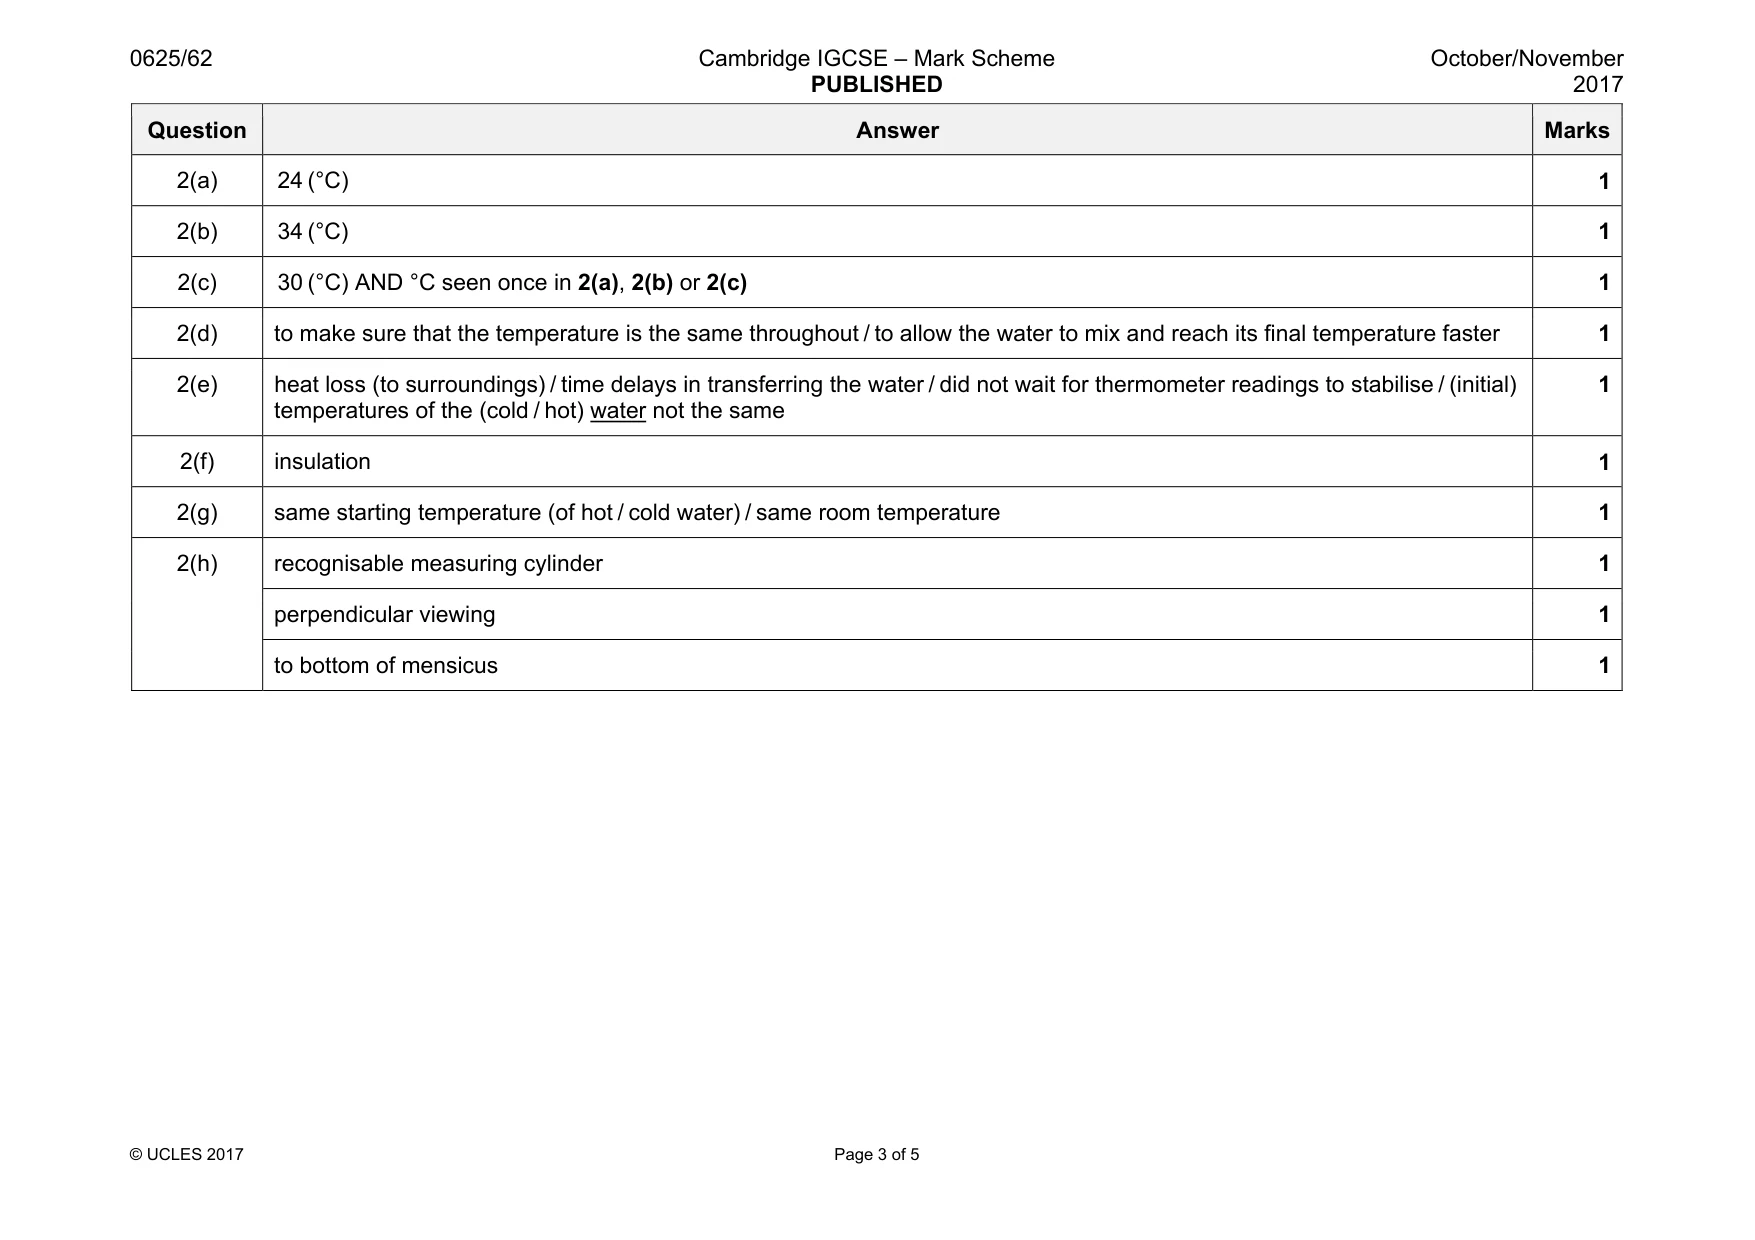
Mark scheme: 2(a) 24 (°C) 1 2(b) 34 (°C) 1 2(c) 30 (°C) AND °C seen once in 2(a), 2(b) or 2(c) 1 2(d) to make sure that the temperature is the same throughout / to allow the water to mix and reach its final temperature faster 1 2(e) heat loss (to surroundings) / time delays in transferring the water / did not wait for thermometer readings to stabilise / (initial) temperatures of the (cold / hot) water not the same 1 2(f) insulation 1 2(g) same starting temperature (of hot / cold water) / same room temperature 1 2(h) recognisable measuring cylinder 1 perpendicular viewing 1 to bottom of mensicus 1
Q3 · A student is determining the focal length f of a lens
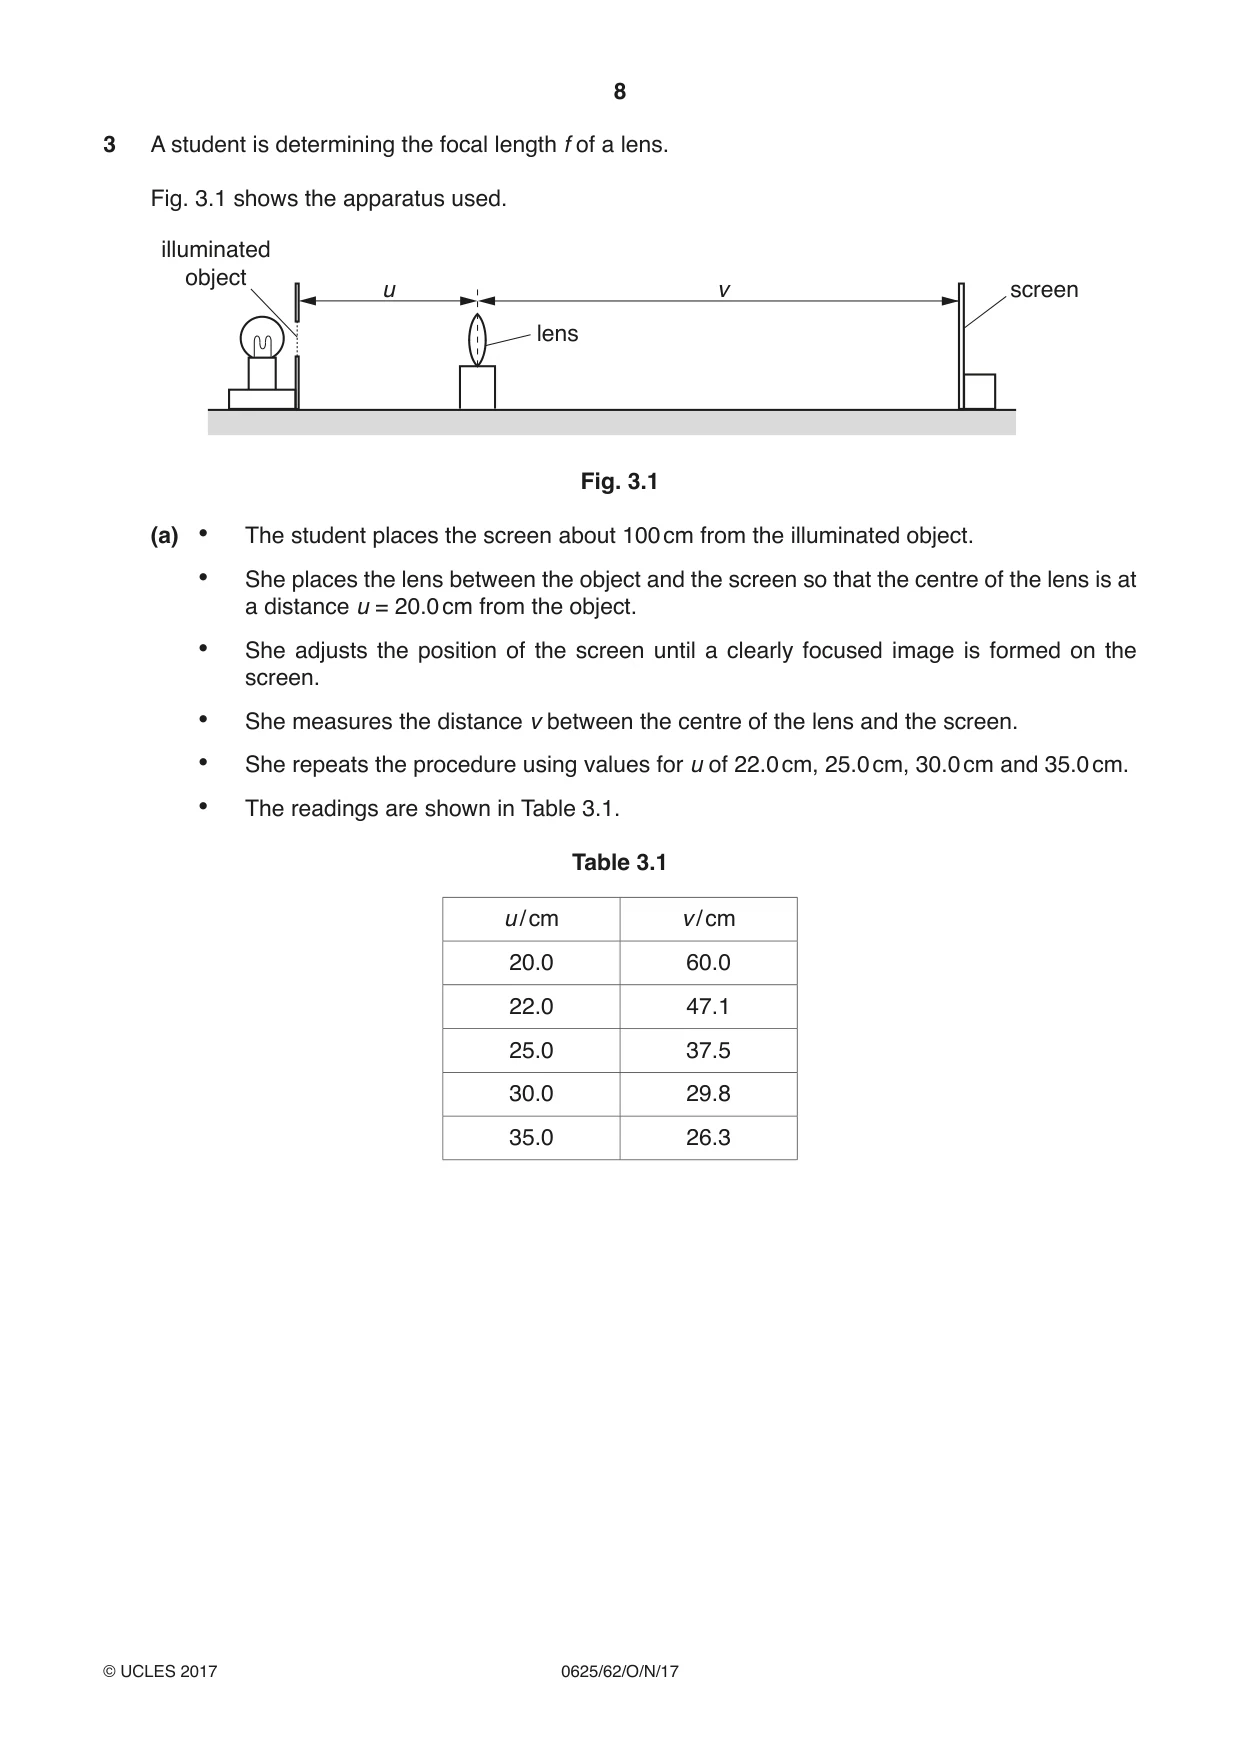
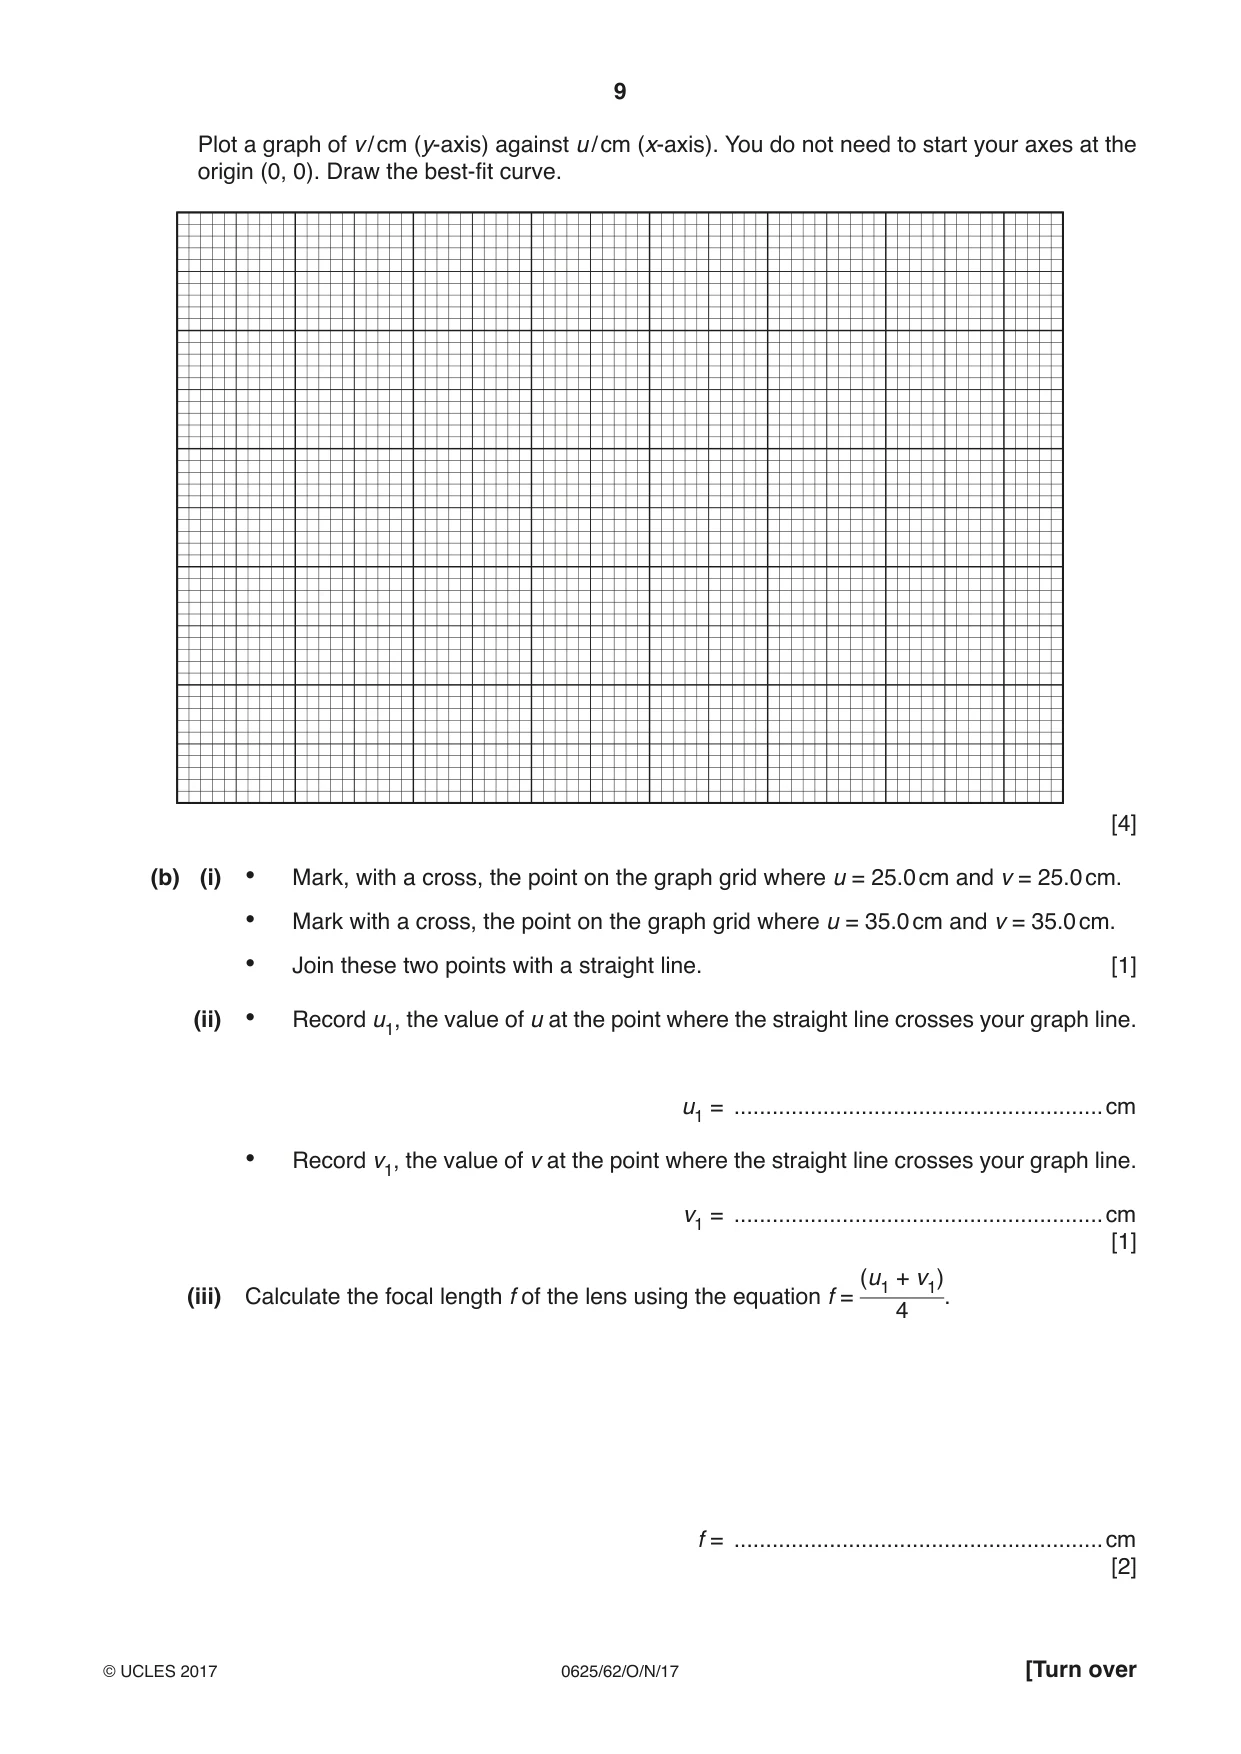
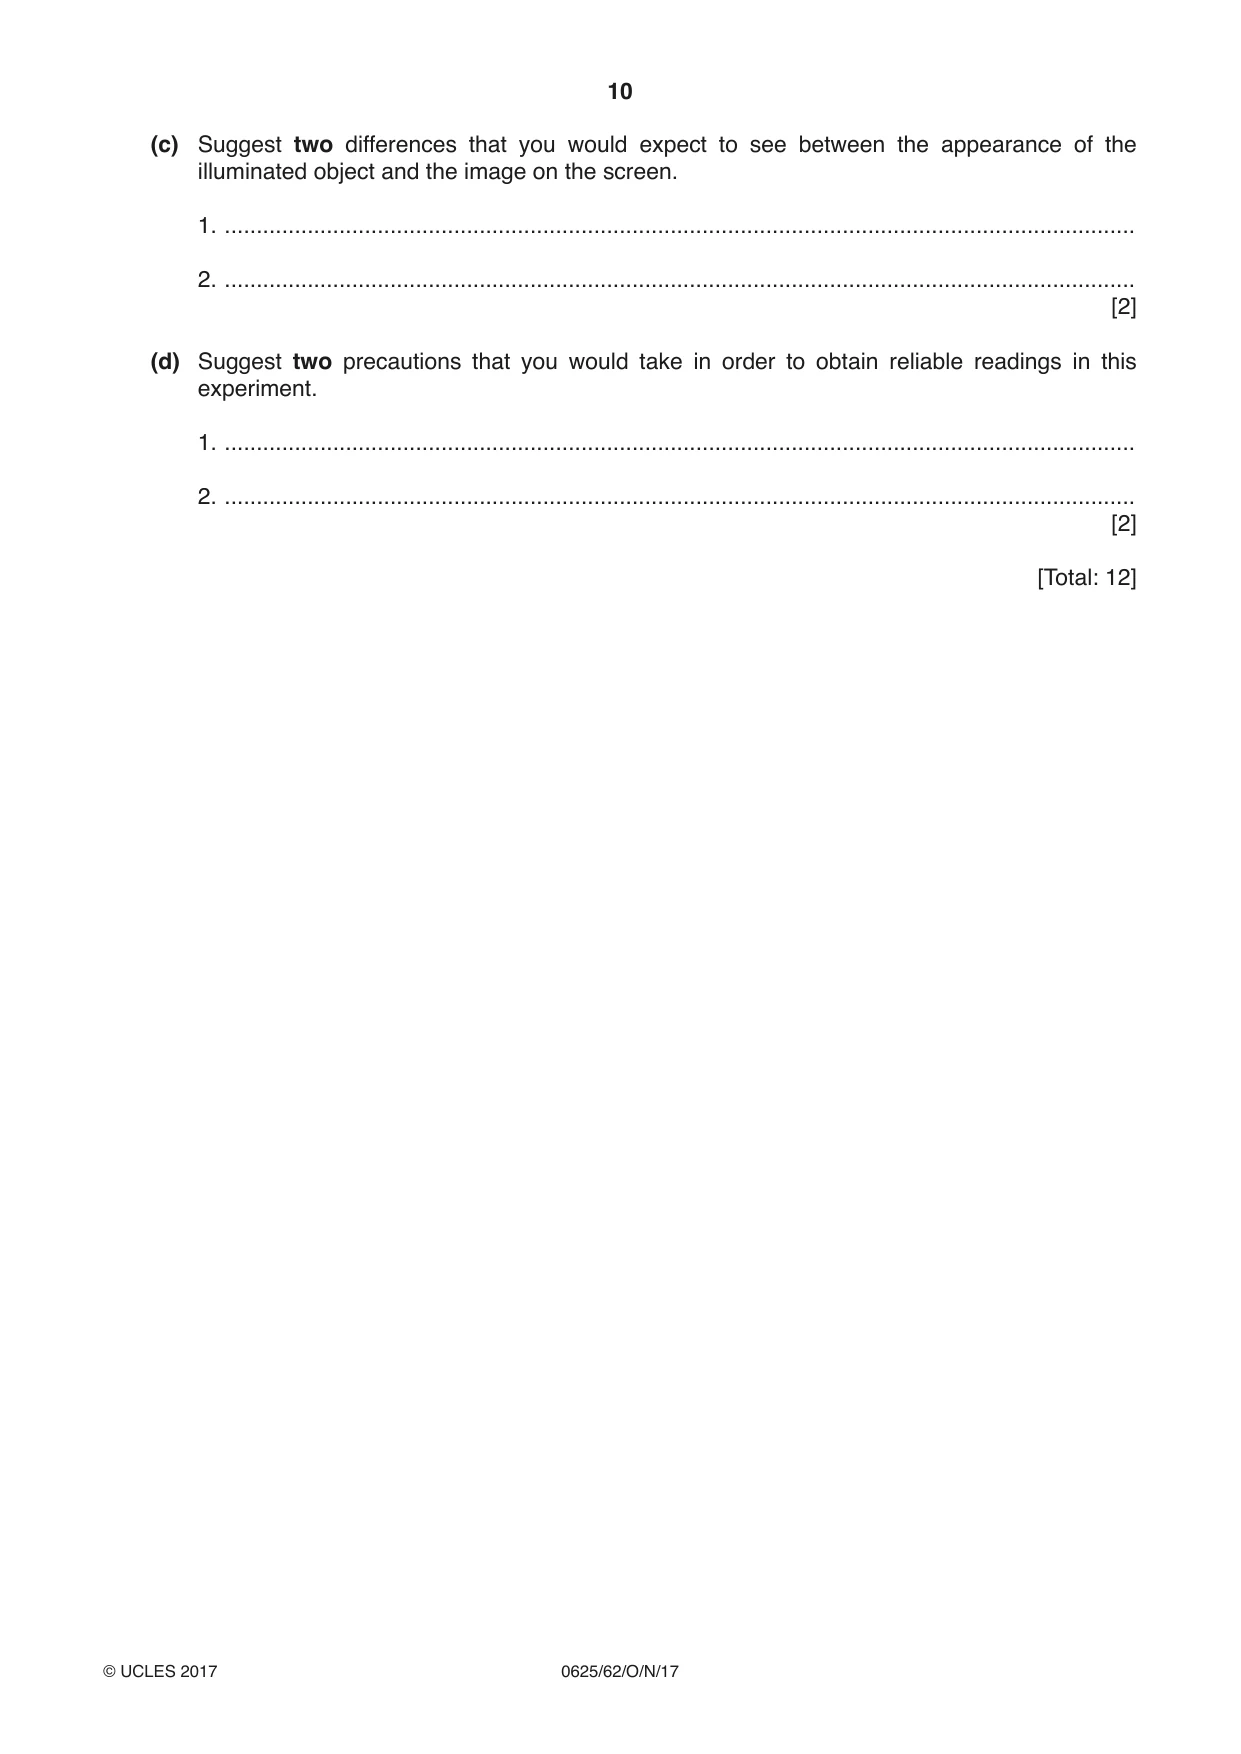
3 A student is determining the focal length f of a lens. Fig. 3.1 shows the apparatus used. illuminated object u v screen lens Fig. 3.1 (a) • The student places the screen about 100 cm from the illuminated object. • She places the lens between the object and the screen so that the centre of the lens is at a distance u = 20.0 cm from the object. • She adjusts the position of the screen until a clearly focused image is formed on the screen. • She measures the distance v between the centre of the lens and the screen. • She repeats the procedure using values for u of 22.0 cm, 25.0 cm, 30.0 cm and 35.0 cm. • The readings are shown in Table 3.1. Table 3.1 u / cm v / cm 20.0 60.0 22.0 47.1 25.0 37.5 30.0 29.8 35.0 26.3 Plot a graph of v / cm (y-axis) against u / cm (x-axis). You do not need to start your axes at the origin (0, 0). Draw the best-fit curve. [4] (b) (i) • Mark, with a cross, the point on the graph grid where u = 25.0 cm and v = 25.0 cm. • Mark with a cross, the point on the graph grid where u = 35.0 cm and v = 35.0 cm. • Join these two points with a straight line. [1] (ii) • Record u1, the value of u at the point where the straight line crosses your graph line. u1 = ..........................................................cm • Record v1, the value of v at the point where the straight line crosses your graph line. v1 = ..........................................................cm [1] (u1 + v1) (iii) Calculate the focal length f of the lens using the equation f = . 4 f = ..........................................................cm [2] (c) Suggest two differences that you would expect to see between the appearance of the illuminated object and the image on the screen. 1. ............................................................................................................................................... 2. ............................................................................................................................................... [2] (d) Suggest two precautions that you would take in order to obtain reliable readings in this experiment. 1. ............................................................................................................................................... 2. ............................................................................................................................................... [2] [Total: 12]
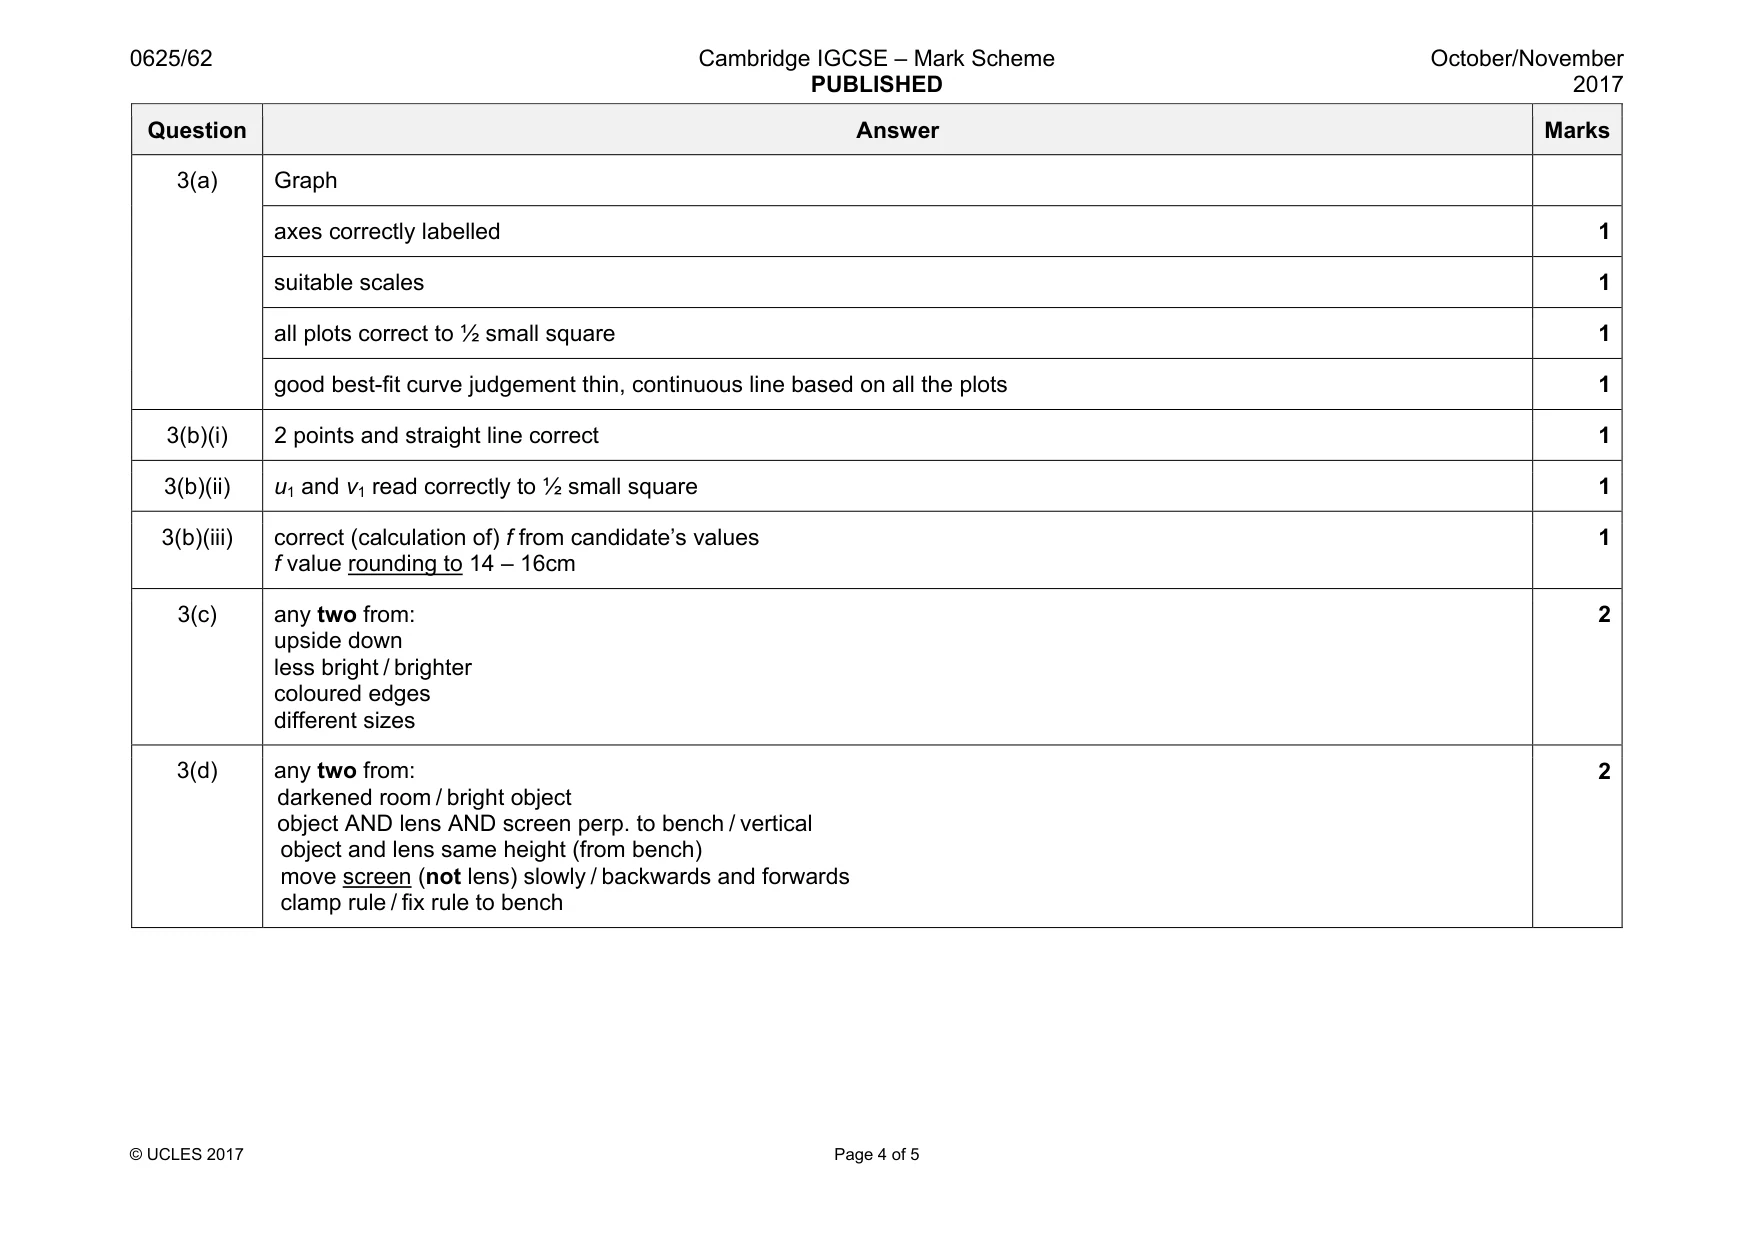
Mark scheme: 3(a) Graph axes correctly labelled 1 suitable scales 1 all plots correct to ½ small square 1 good best-fit curve judgement thin, continuous line based on all the plots 1 3(b)(i) 2 points and straight line correct 1 3(b)(ii) u1 and v1 read correctly to ½ small square 1 3(b)(iii) correct (calculation of) f from candidate’s values f value rounding to 14 – 16cm 1 3(c) any two from: upside down less bright / brighter coloured edges different sizes 2 3(d) any two from: darkened room / bright object object AND lens AND screen perp. to bench / vertical object and lens same height (from bench) move screen (not lens) slowly / backwards and forwards clamp rule / fix rule to bench 2
Q4 · A student has a selection of rubber bands of different widths
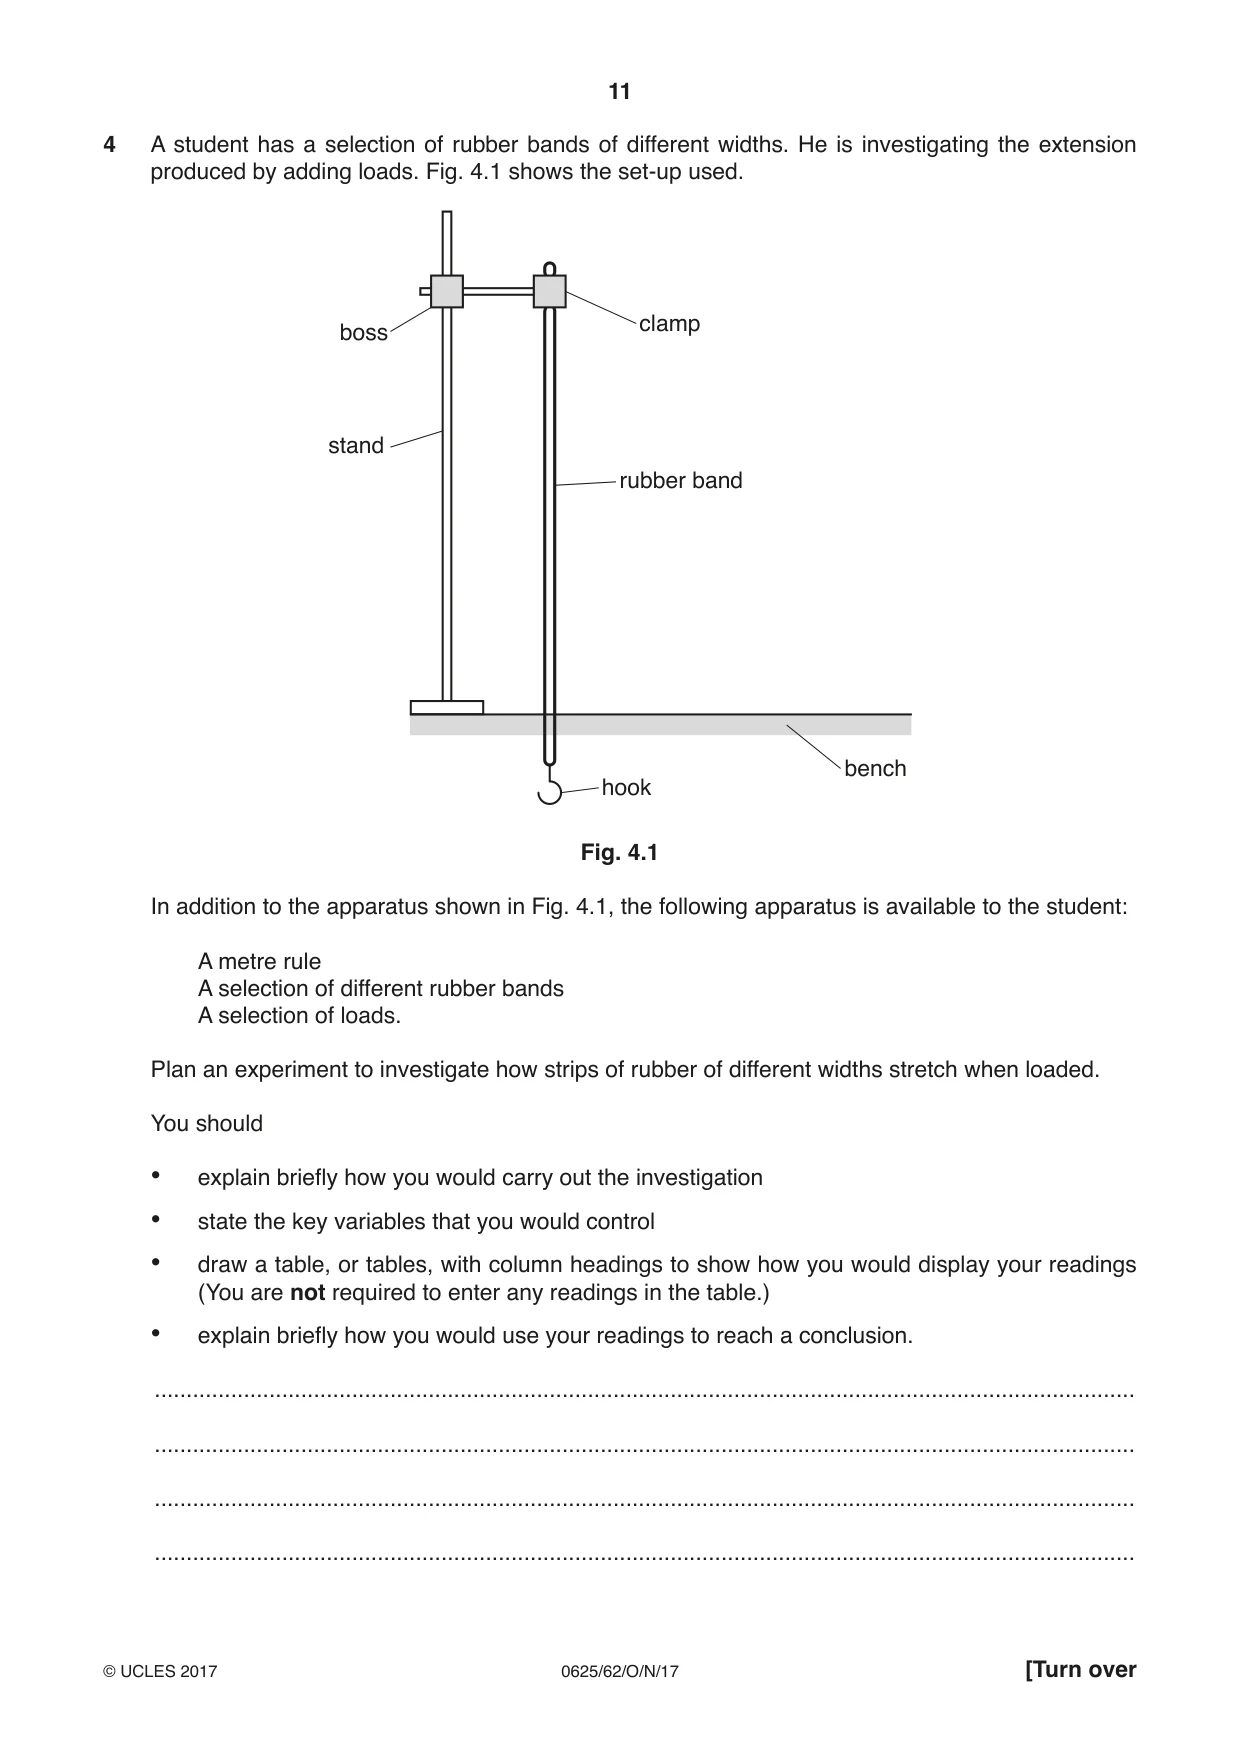
4 A student has a selection of rubber bands of different widths. He is investigating the extension produced by adding loads. Fig. 4.1 shows the set-up used. clamp boss stand rubber band bench hook Fig. 4.1 In addition to the apparatus shown in Fig. 4.1, the following apparatus is available to the student: A metre rule A selection of different rubber bands A selection of loads. Plan an experiment to investigate how strips of rubber of different widths stretch when loaded. You should • explain briefly how you would carry out the investigation • state the key variables that you would control • draw a table, or tables, with column headings to show how you would display your readings (You are not required to enter any readings in the table.) • explain briefly how you would use your readings to reach a conclusion. .......................................................................................................................................................... .......................................................................................................................................................... .......................................................................................................................................................... .......................................................................................................................................................... .......................................................................................................................................................... .......................................................................................................................................................... .......................................................................................................................................................... .......................................................................................................................................................... .......................................................................................................................................................... .......................................................................................................................................................... .......................................................................................................................................................... .......................................................................................................................................................... .......................................................................................................................................................... .......................................................................................................................................................... .......................................................................................................................................................... ......................................................................................................................................................[7] [Total: 7]
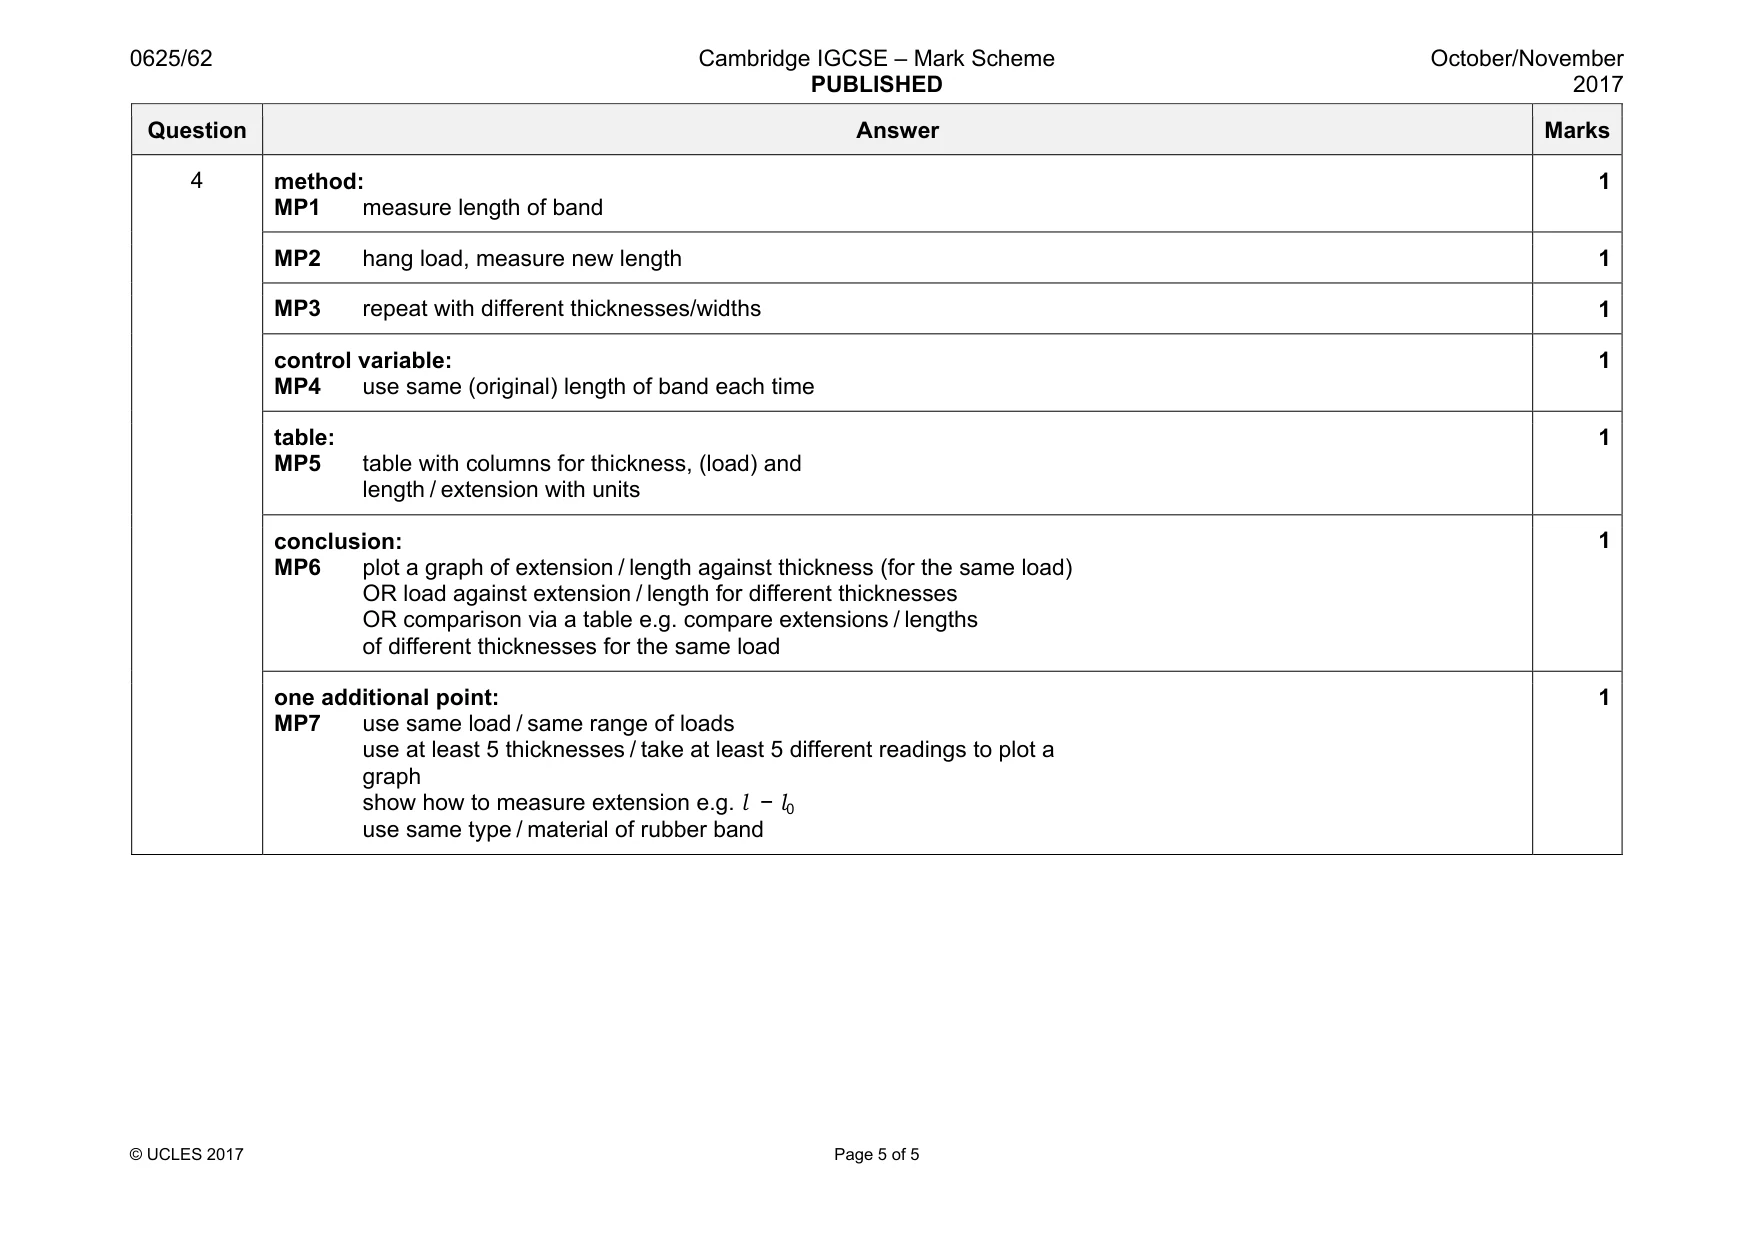
Mark scheme: 4 method: MP1 measure length of band 1 MP2 hang load, measure new length 1 MP3 repeat with different thicknesses/widths 1 control variable: MP4 use same (original) length of band each time 1 table: MP5 table with columns for thickness, (load) and length / extension with units 1 conclusion: MP6 plot a graph of extension / length against thickness (for the same load) OR load against extension / length for different thicknesses OR comparison via a table e.g. compare extensions / lengths of different thicknesses for the same load 1 one additional point: MP7 use same load / same range of loads use at least 5 thicknesses / take at least 5 different readings to plot a graph show how to measure extension e.g. l − l0 use same type / material of rubber band 1
What was in this paper
The subtopics covered by these 4 questions, and how many questions each got. Open one in a new tab to see every Cambridge question on it.
What you needed in this session
Cambridge’s own grade thresholds for 2017 Oct/Nov, Paper 6 · Variant 2. A higher threshold means an easier paper — the bar moves with how the cohort did.