Cambridge IGCSE Physics 0625 — 2017 Feb/March Paper 6 · Variant 2
0625/62/F/M/17 · 4 questions · 40 marks · ≈45 min
The question paper and its mark scheme, free to read here and free to download. This is Cambridge’s own paper, exactly as it was sat.
Question paper12 pages
Mark scheme6 pages
Answers below. Sit the paper first if you are practising.
Questions as text
Q1 · Some students are investigating how the surrounding temperature affects the rate at which…
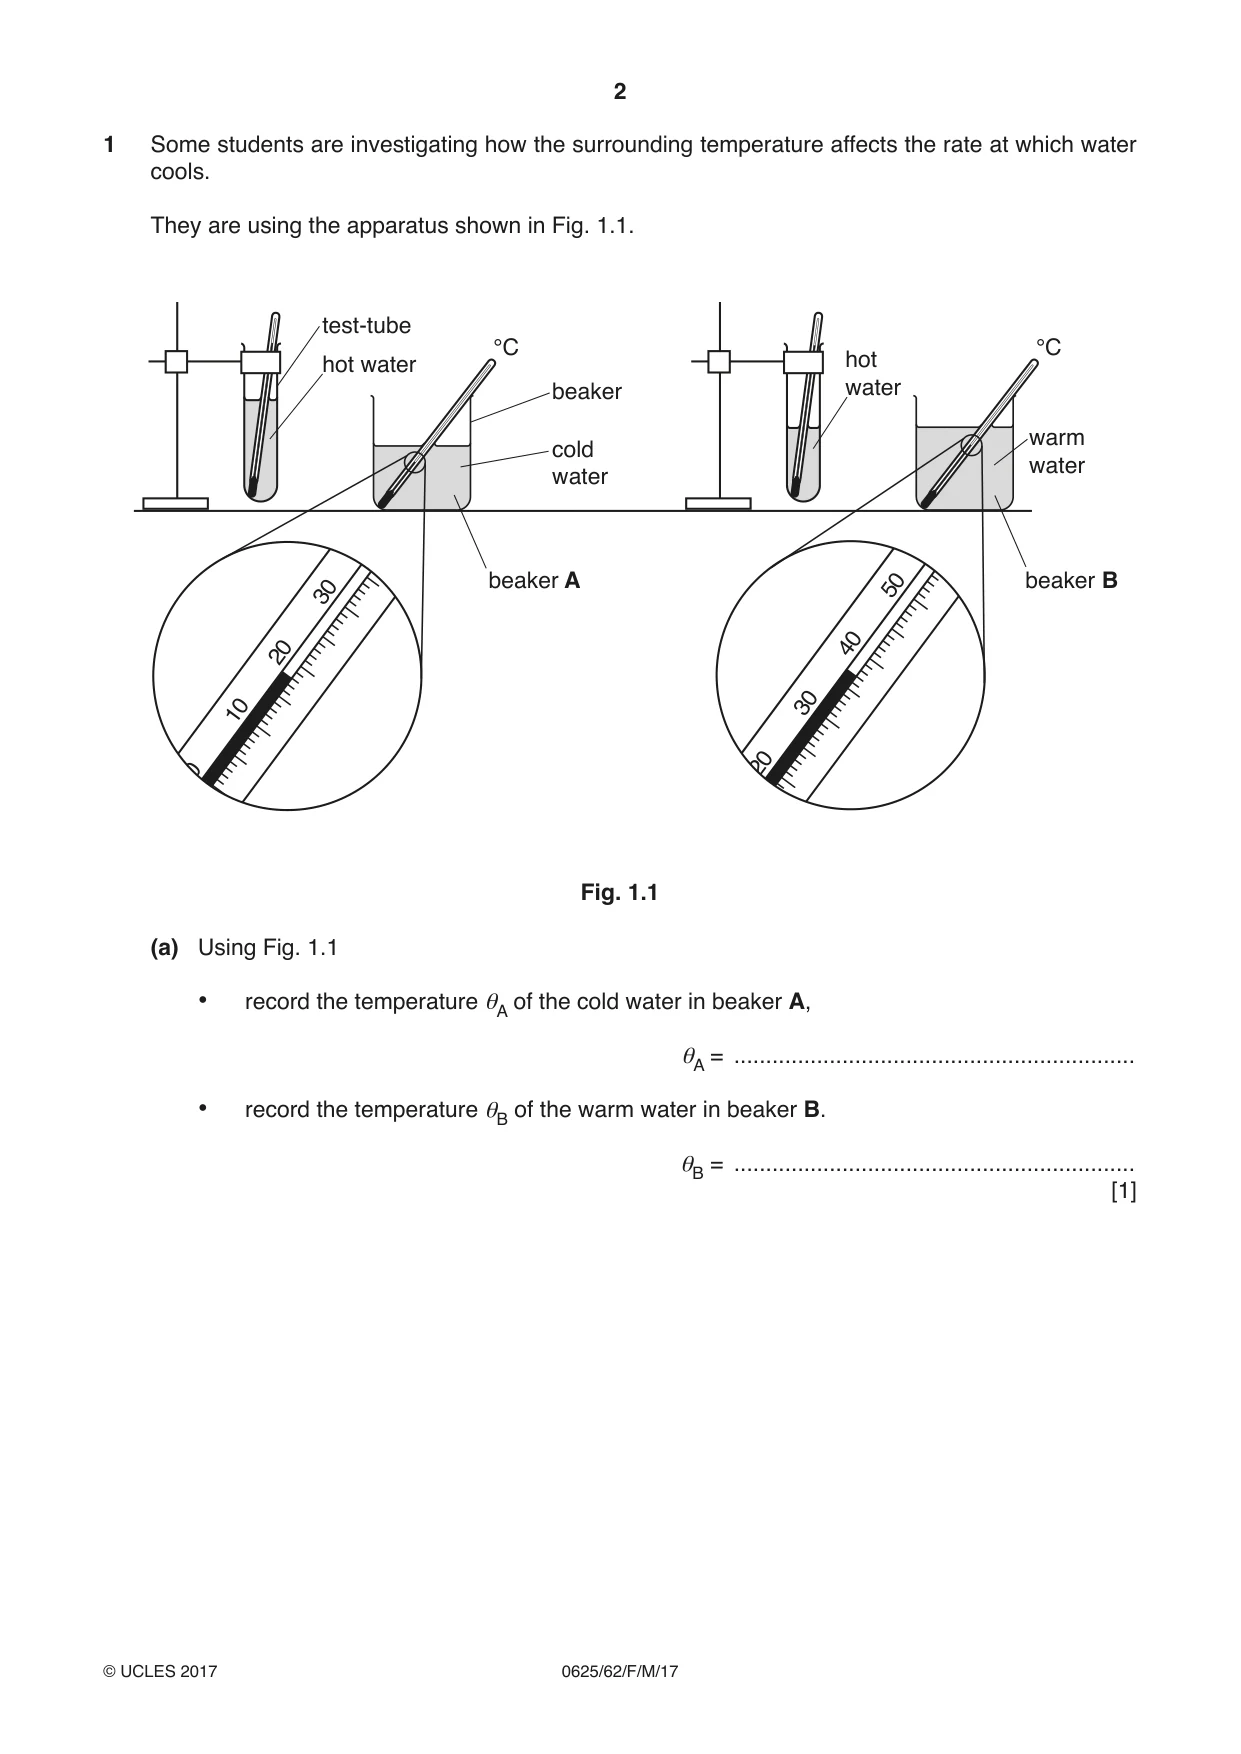
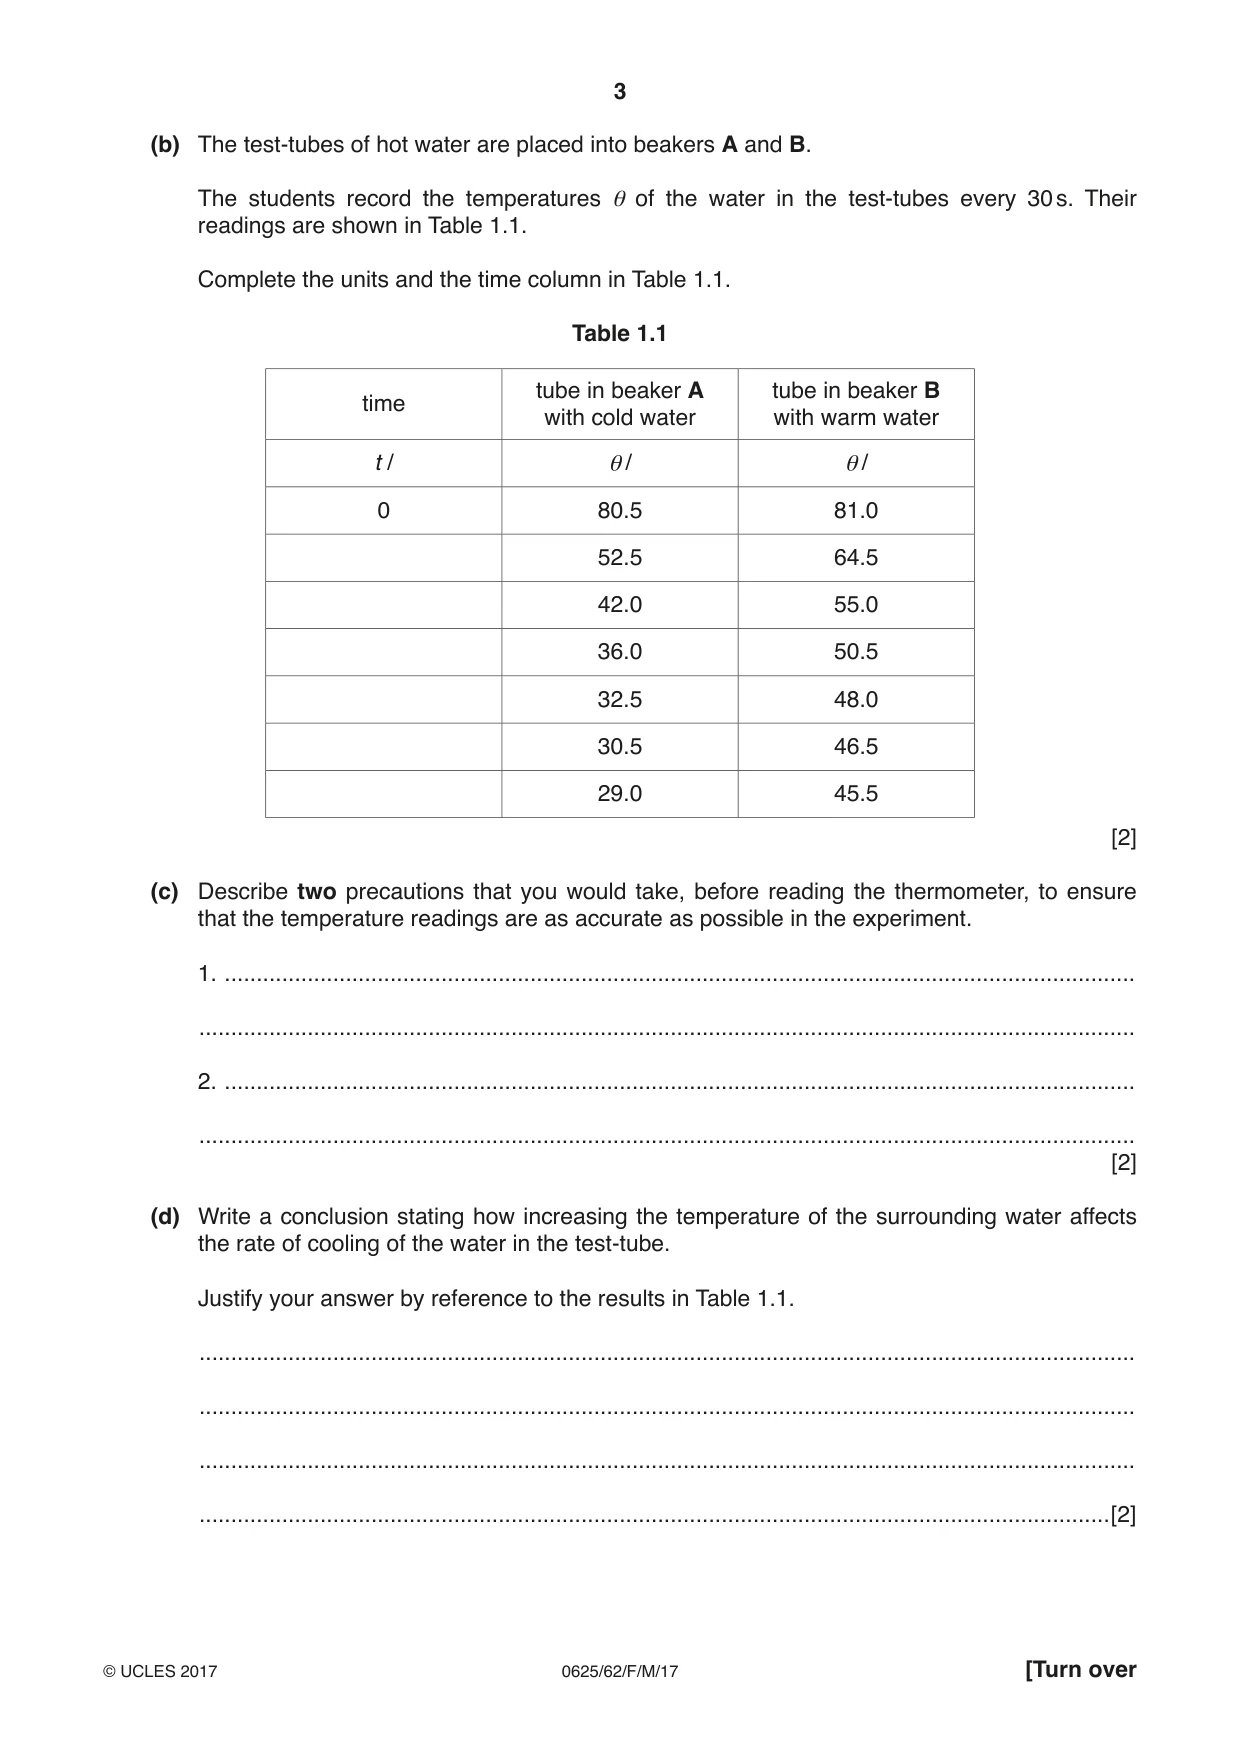
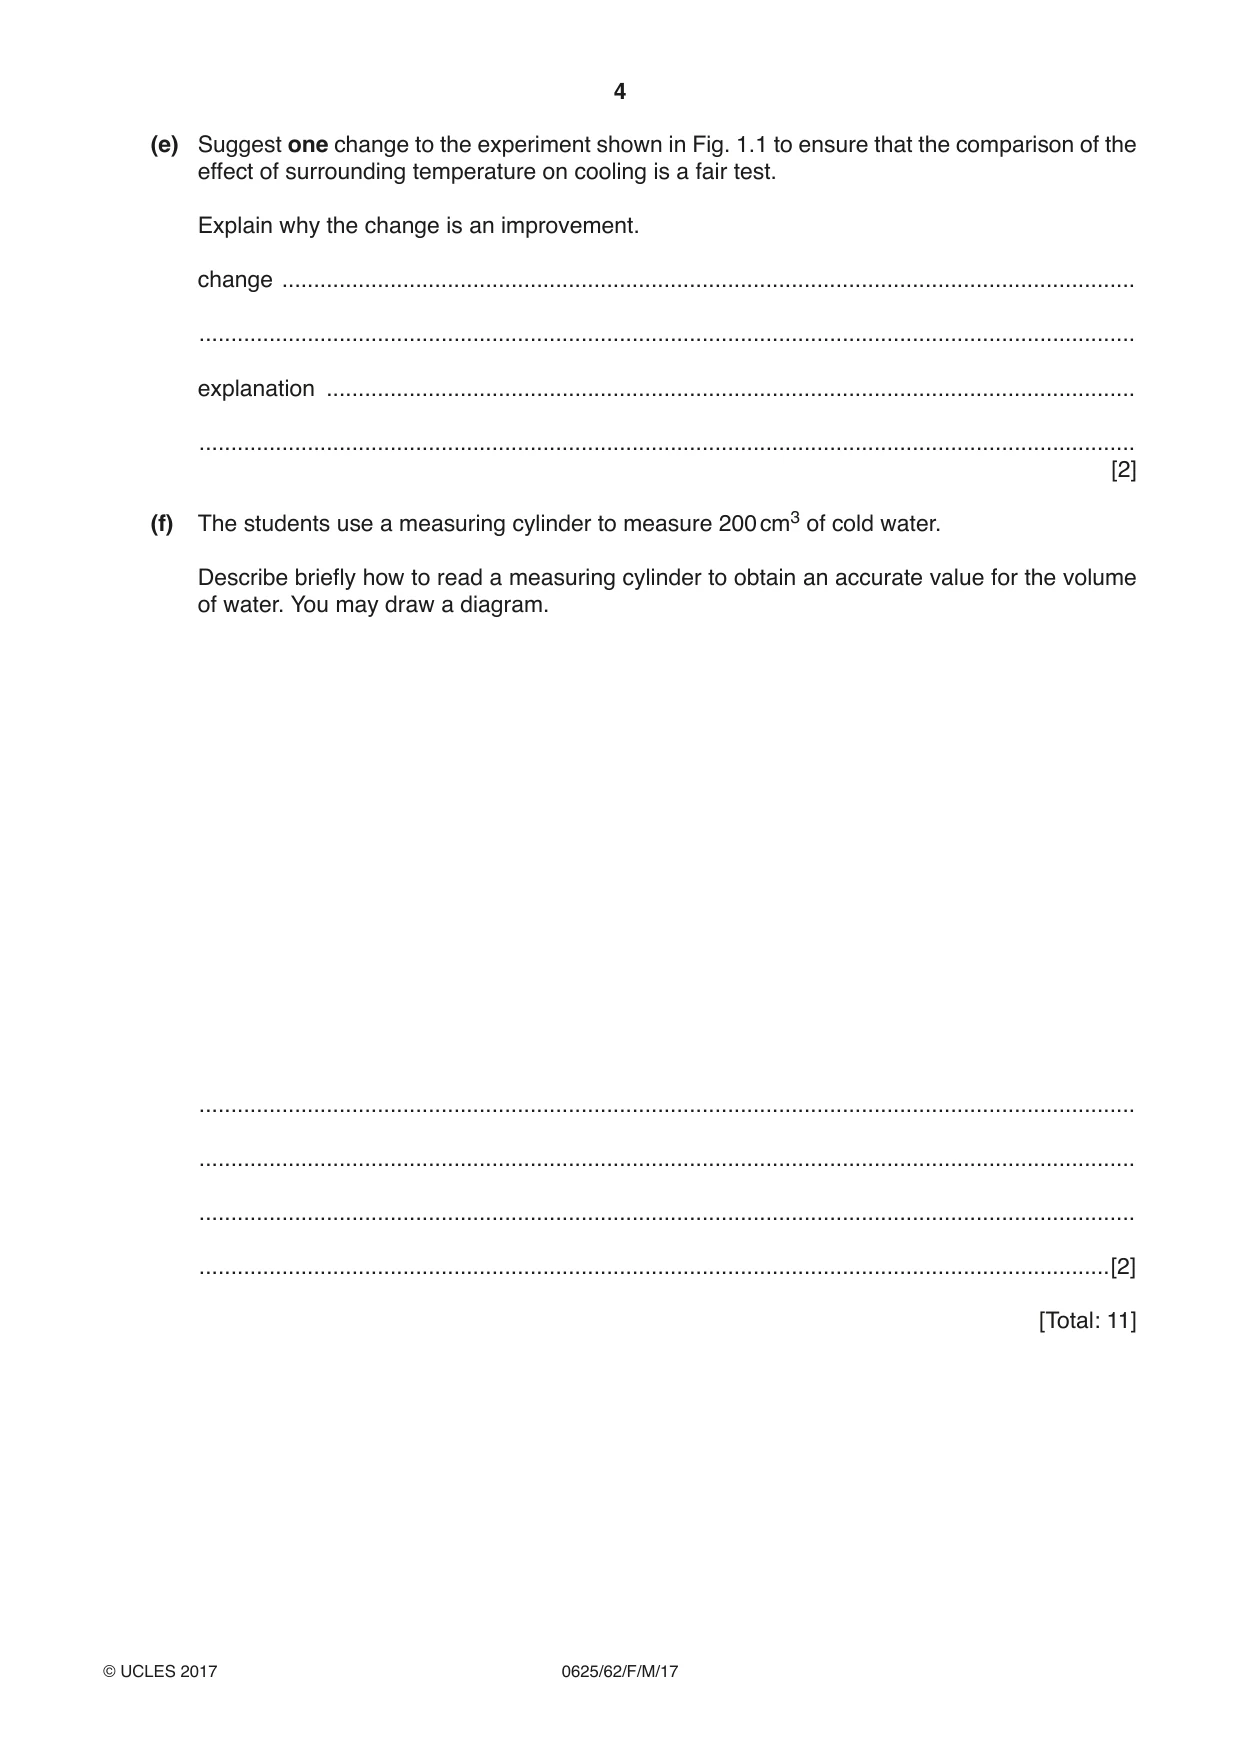
1 Some students are investigating how the surrounding temperature affects the rate at which water cools. They are using the apparatus shown in Fig. 1.1. test-tube °C °C hot water hot beaker water warm cold water water 4 beaker A 50 beaker B 30 40 20 30 10 0 20 0 Fig. 1.1 (a) Using Fig. 1.1 • record the temperature θA of the cold water in beaker A, θA = ............................................................... • record the temperature θB of the warm water in beaker B. θB = ............................................................... [1] (b) The test-tubes of hot water are placed into beakers A and B. The students record the temperatures θ of the water in the test-tubes every 30 s. Their readings are shown in Table 1.1. Complete the units and the time column in Table 1.1. Table 1.1 tube in beaker A tube in beaker B time with cold water with warm water t / θ/ θ/ 0 80.5 81.0 52.5 64.5 42.0 55.0 36.0 50.5 32.5 48.0 30.5 46.5 29.0 45.5 [2] (c) Describe two precautions that you would take, before reading the thermometer, to ensure that the temperature readings are as accurate as possible in the experiment. 1. ............................................................................................................................................... ................................................................................................................................................... 2. ............................................................................................................................................... ................................................................................................................................................... [2] (d) Write a conclusion stating how increasing the temperature of the surrounding water affects the rate of cooling of the water in the test-tube. Justify your answer by reference to the results in Table 1.1. ................................................................................................................................................... ................................................................................................................................................... ................................................................................................................................................... ...............................................................................................................................................[2] (e) Suggest one change to the experiment shown in Fig. 1.1 to ensure that the comparison of the effect of surrounding temperature on cooling is a fair test. Explain why the change is an improvement. change ...................................................................................................................................... ................................................................................................................................................... explanation ............................................................................................................................... ................................................................................................................................................... [2] (f) The students use a measuring cylinder to measure 200 cm3 of cold water. Describe briefly how to read a measuring cylinder to obtain an accurate value for the volume of water. You may draw a diagram. ................................................................................................................................................... ................................................................................................................................................... ................................................................................................................................................... ...............................................................................................................................................[2] [Total: 11]
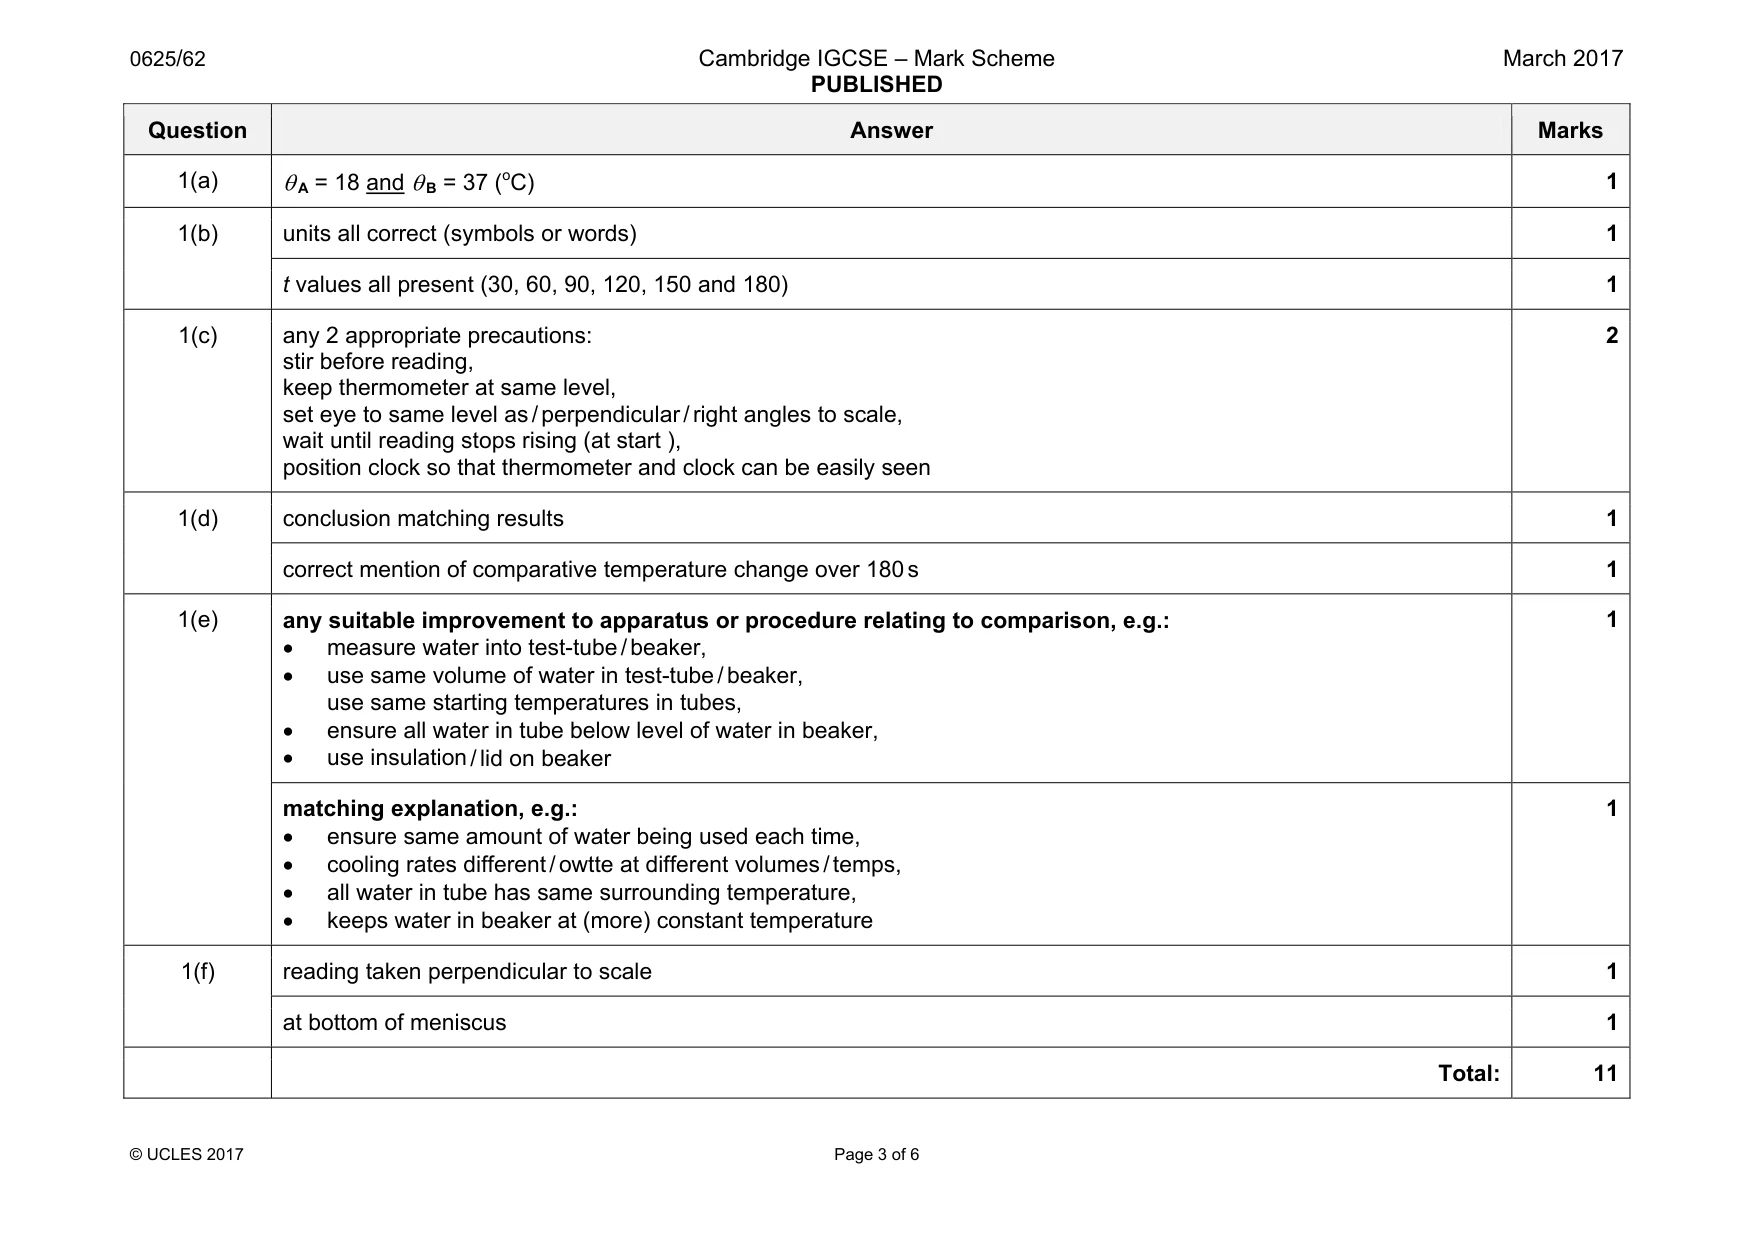
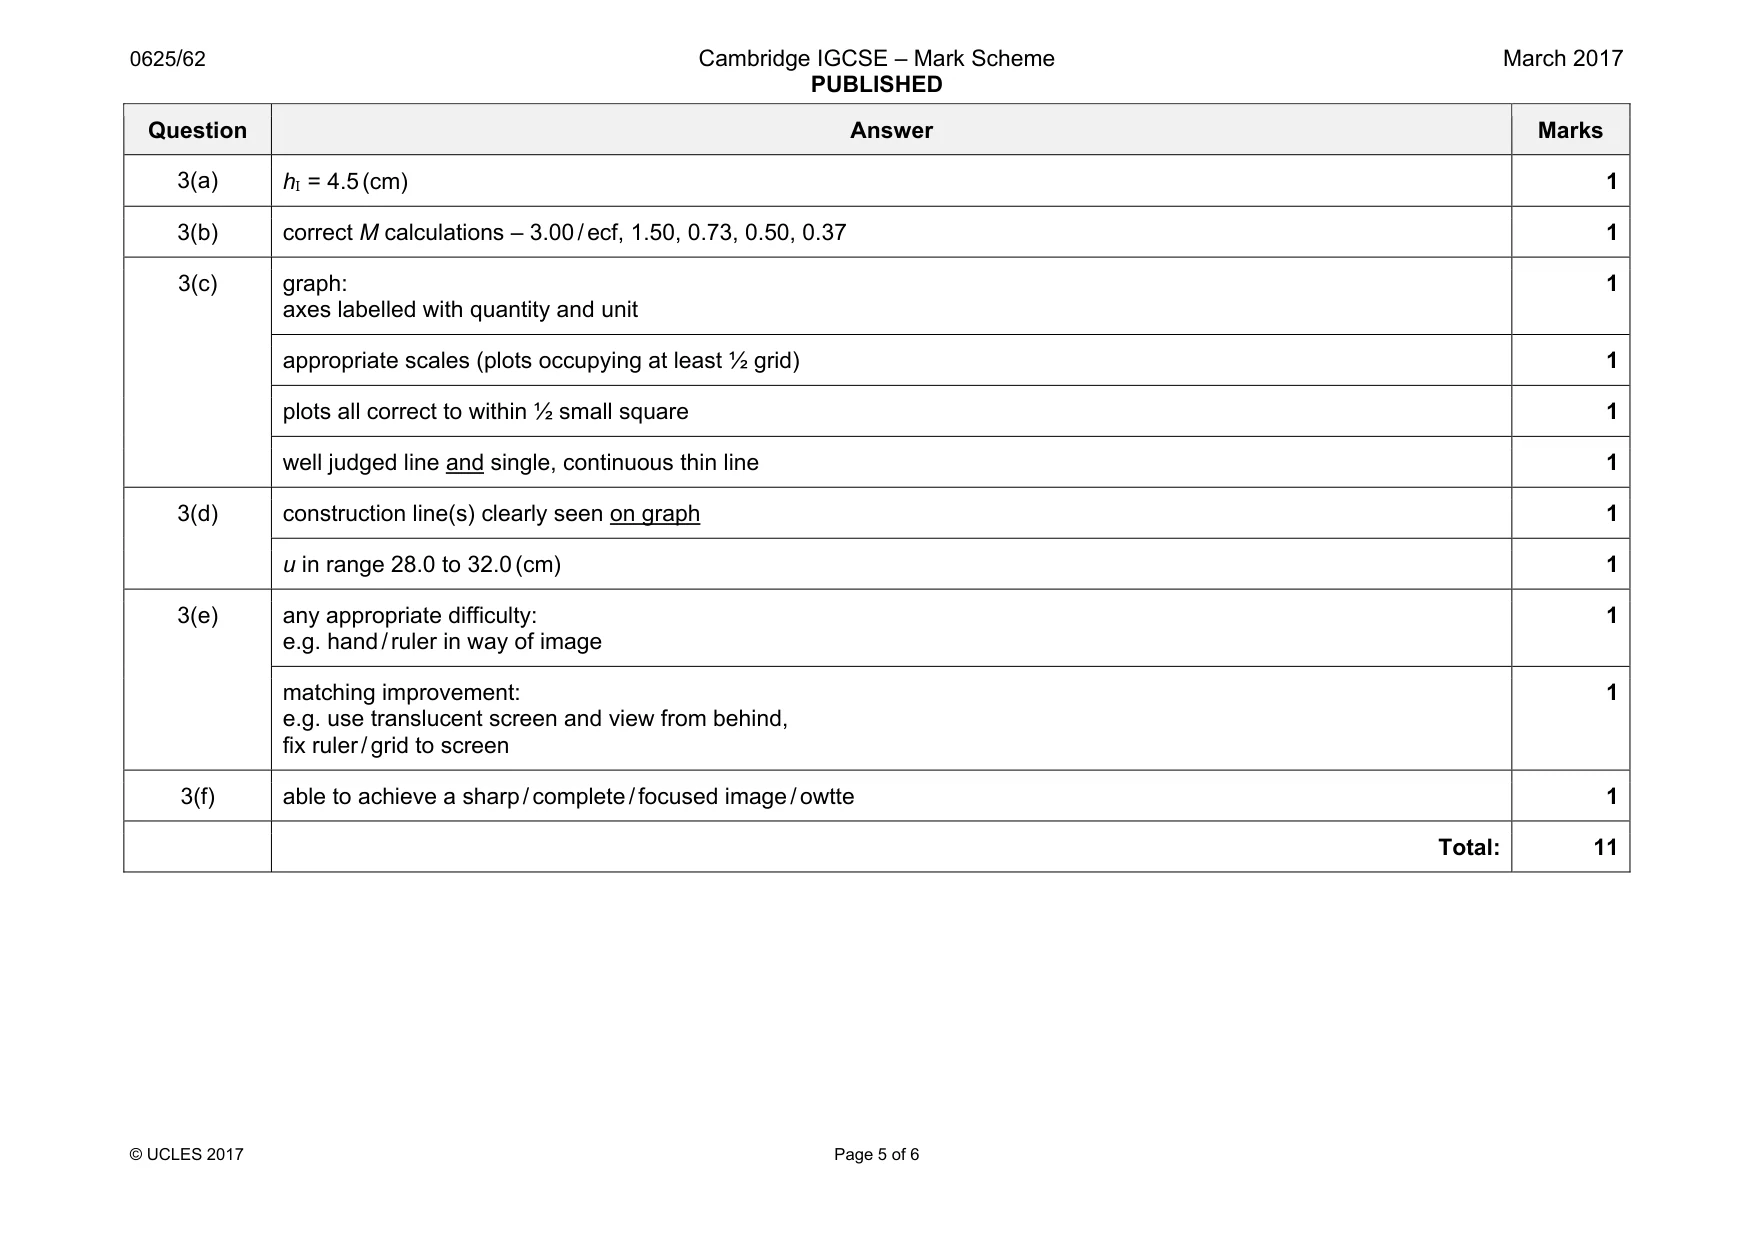
Mark scheme: 1(a) 1 1(b) units all correct (symbols or words) 1 t values all present (30, 60, 90, 120, 150 and 180) 1 1(c) any 2 appropriate precautions: stir before reading, keep thermometer at same level, set eye to same level as / perpendicular / right angles to scale, wait until reading stops rising (at start ), position clock so that thermometer and clock can be easily seen 2 1(d) conclusion matching results 1 correct mention of comparative temperature change over 180 s 1 1(e) any suitable improvement to apparatus or procedure relating to comparison, e.g.: • measure water into test-tube / beaker, • use same volume of water in test-tube / beaker, use same starting temperatures in tubes, • ensure all water in tube below level of water in beaker, • use insulation / lid on beaker 1 matching explanation, e.g.: • ensure same amount of water being used each time, • cooling rates different / owtte at different volumes / temps, • all water in tube has same surrounding temperature, • keeps water in beaker at (more) constant temperature 1 1(f) reading taken perpendicular to scale 1 at bottom of meniscus 1 Total: 11
Q2 · A student is investigating the resistance of three wires A, B and C
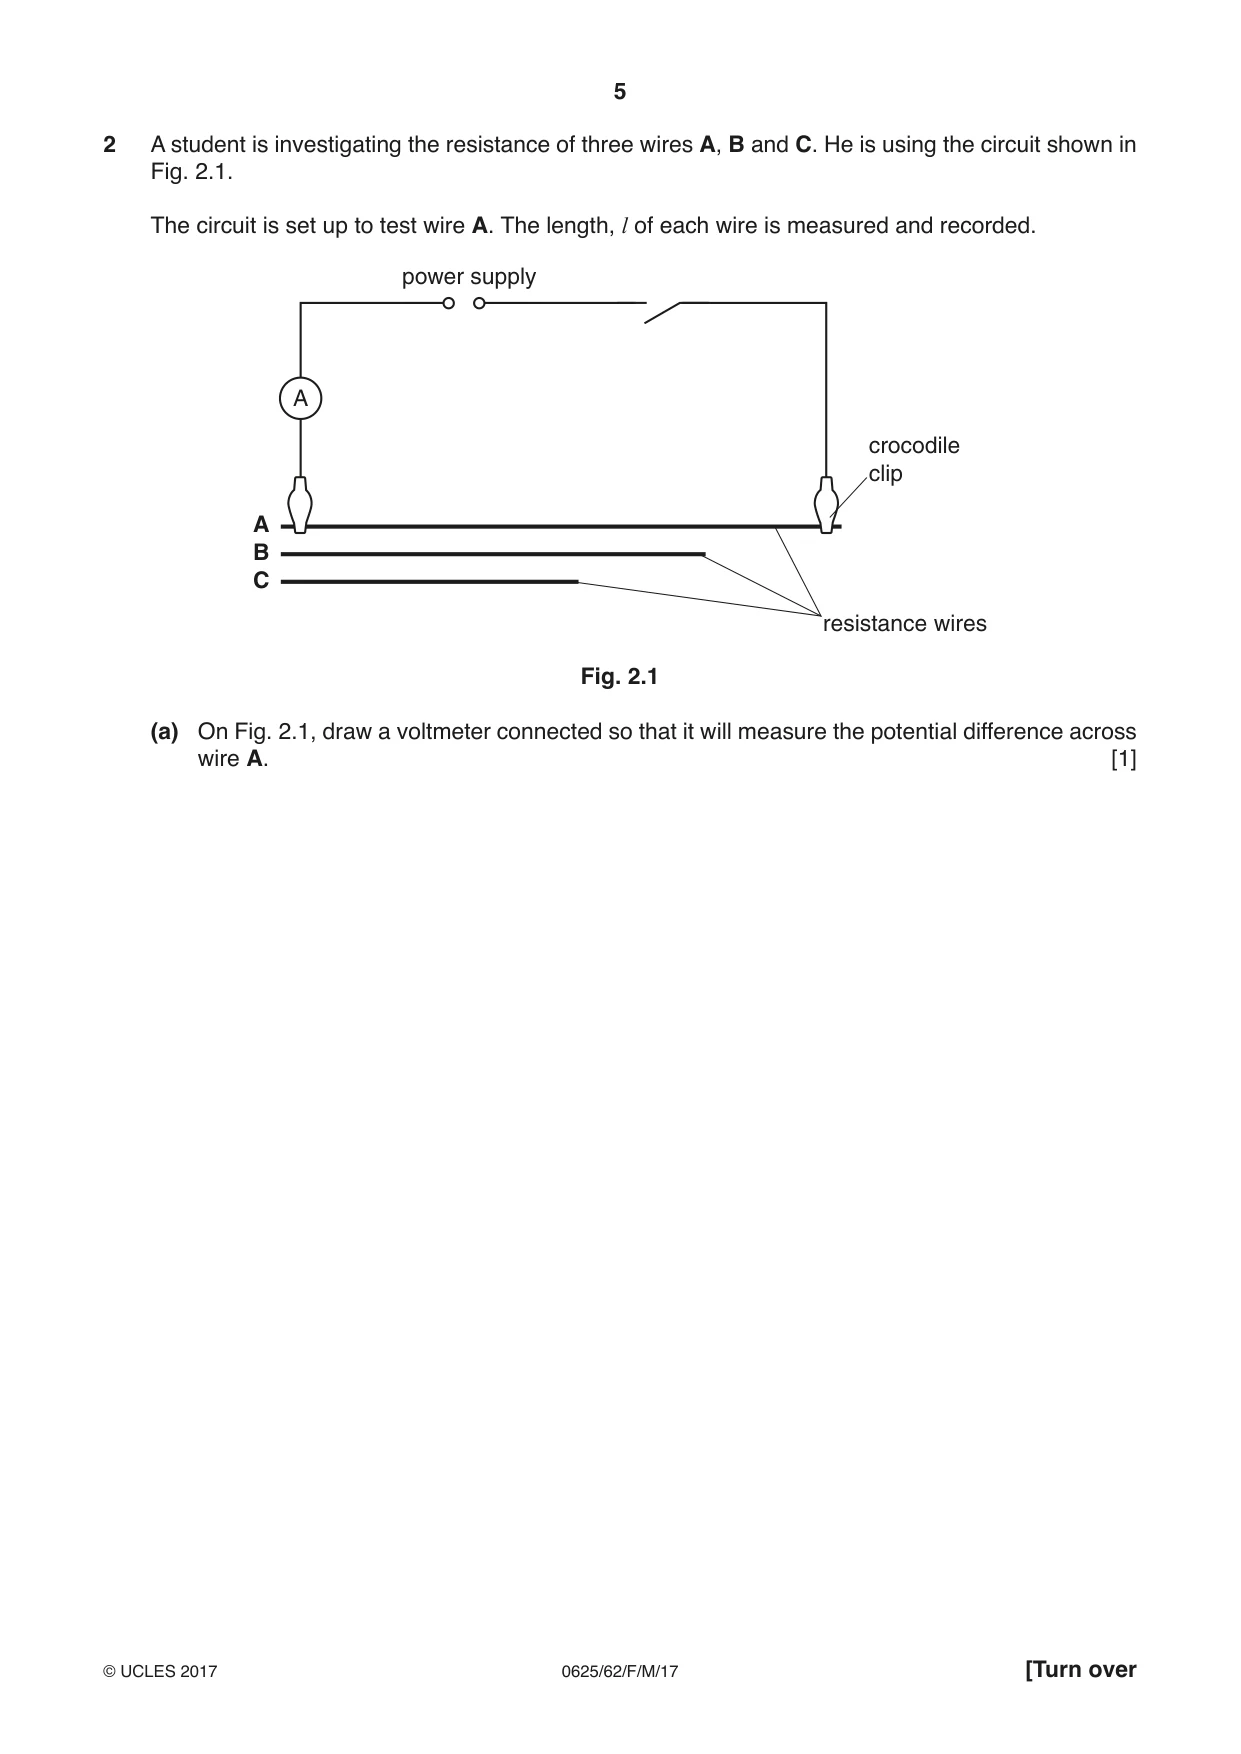
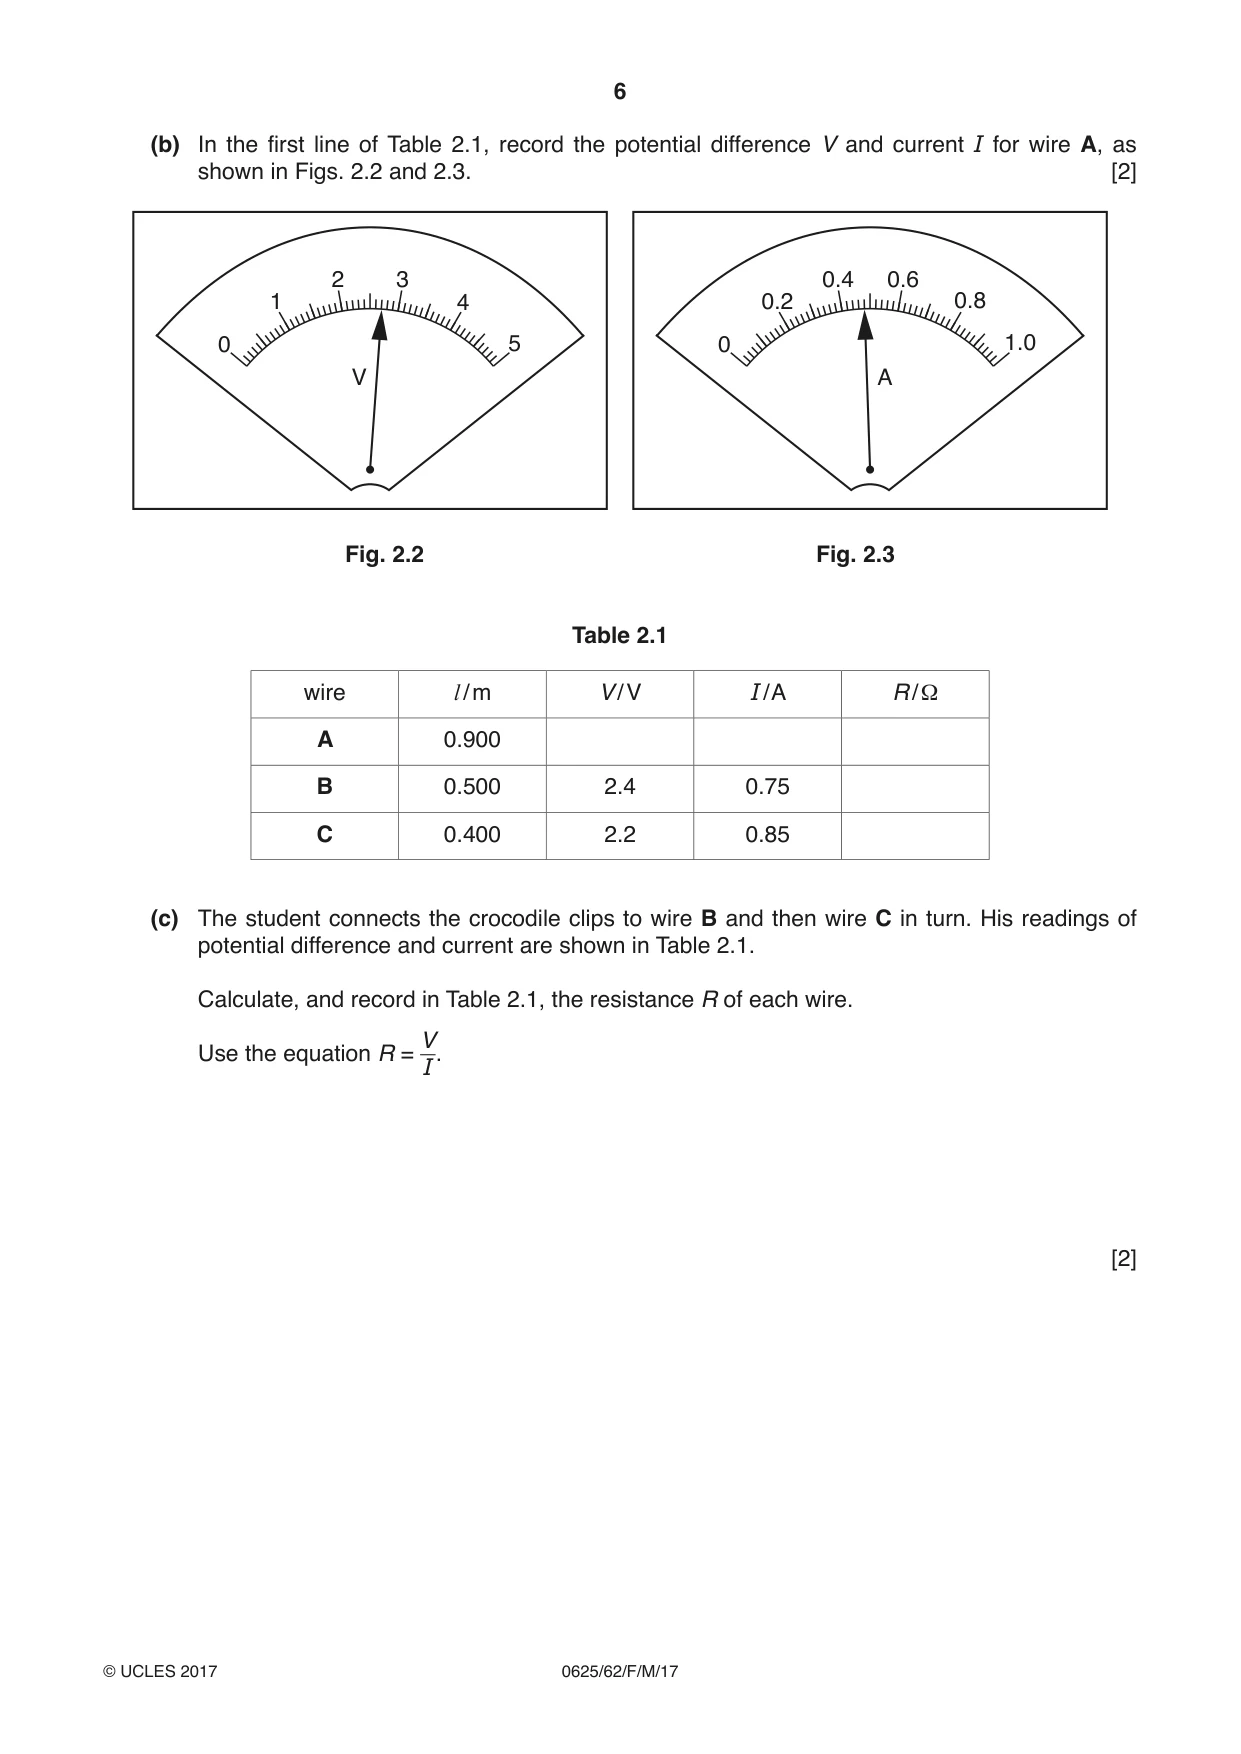
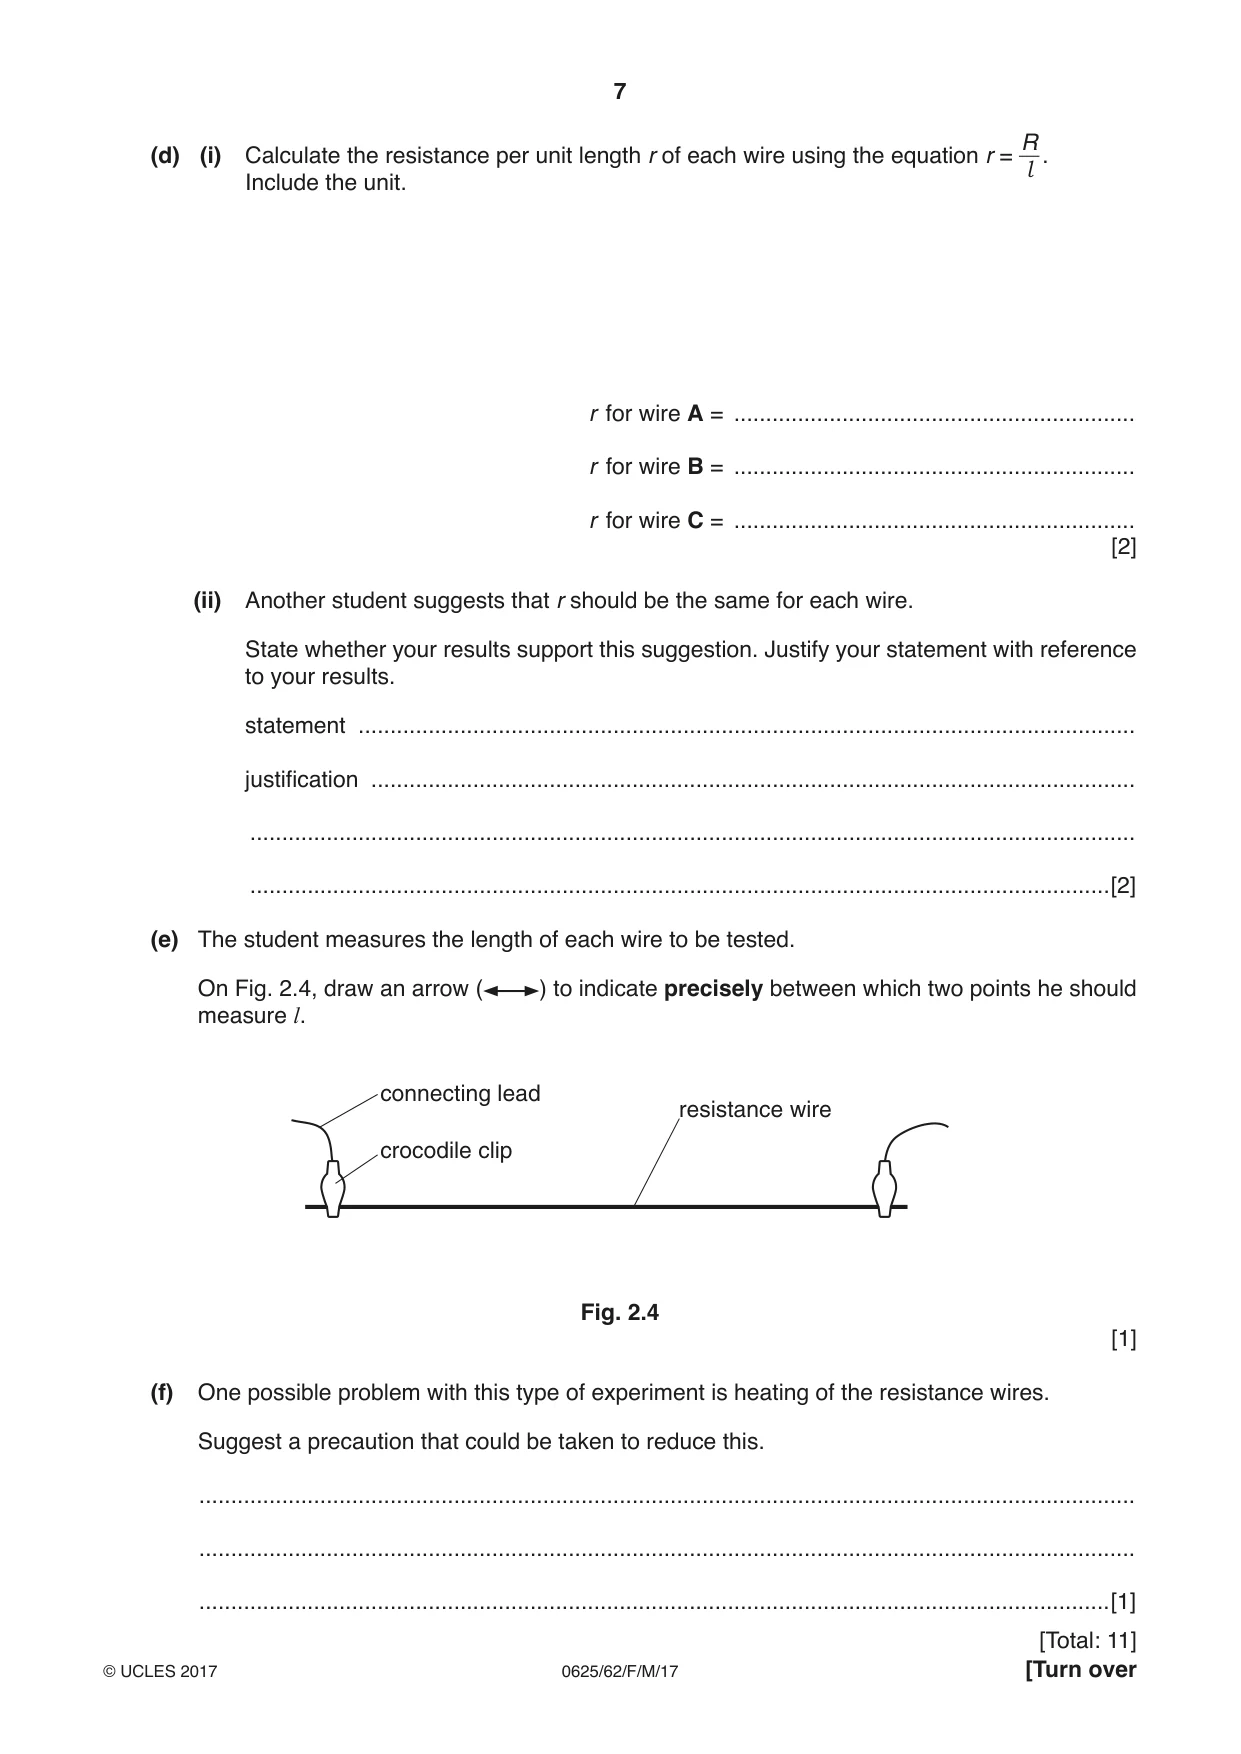
2 A student is investigating the resistance of three wires A, B and C. He is using the circuit shown in Fig. 2.1. The circuit is set up to test wire A. The length, l of each wire is measured and recorded. power supply A crocodile clip A B C resistance wires Fig. 2.1 (a) On Fig. 2.1, draw a voltmeter connected so that it will measure the potential difference across wire A. [1] (b) In the first line of Table 2.1, record the potential difference V and current I for wire A, as shown in Figs. 2.2 and 2.3. [2] 2 3 0.4 0.6 1 4 0.2 0.8 0 5 0 1.0 V A Fig. 2.2 Fig. 2.3 Table 2.1 wire l / m V / V I / A R / Ω A 0.900 B 0.500 2.4 0.75 C 0.400 2.2 0.85 (c) The student connects the crocodile clips to wire B and then wire C in turn. His readings of potential difference and current are shown in Table 2.1. Calculate, and record in Table 2.1, the resistance R of each wire. V Use the equation R = I. [2] R(d) (i) Calculate the resistance per unit length r of each wire using the equation r = . l Include the unit. r for wire A = ............................................................... r for wire B = ............................................................... r for wire C = ............................................................... [2] (ii) Another student suggests that r should be the same for each wire. State whether your results support this suggestion. Justify your statement with reference to your results. statement .......................................................................................................................... justification ........................................................................................................................ ........................................................................................................................................... .......................................................................................................................................[2] (e) The student measures the length of each wire to be tested. On Fig. 2.4, draw an arrow ( ) to indicate precisely between which two points he should measure l. connecting lead resistance wire crocodile clip Fig. 2.4 [1] (f) One possible problem with this type of experiment is heating of the resistance wires. Suggest a precaution that could be taken to reduce this. ................................................................................................................................................... ................................................................................................................................................... ...............................................................................................................................................[1]
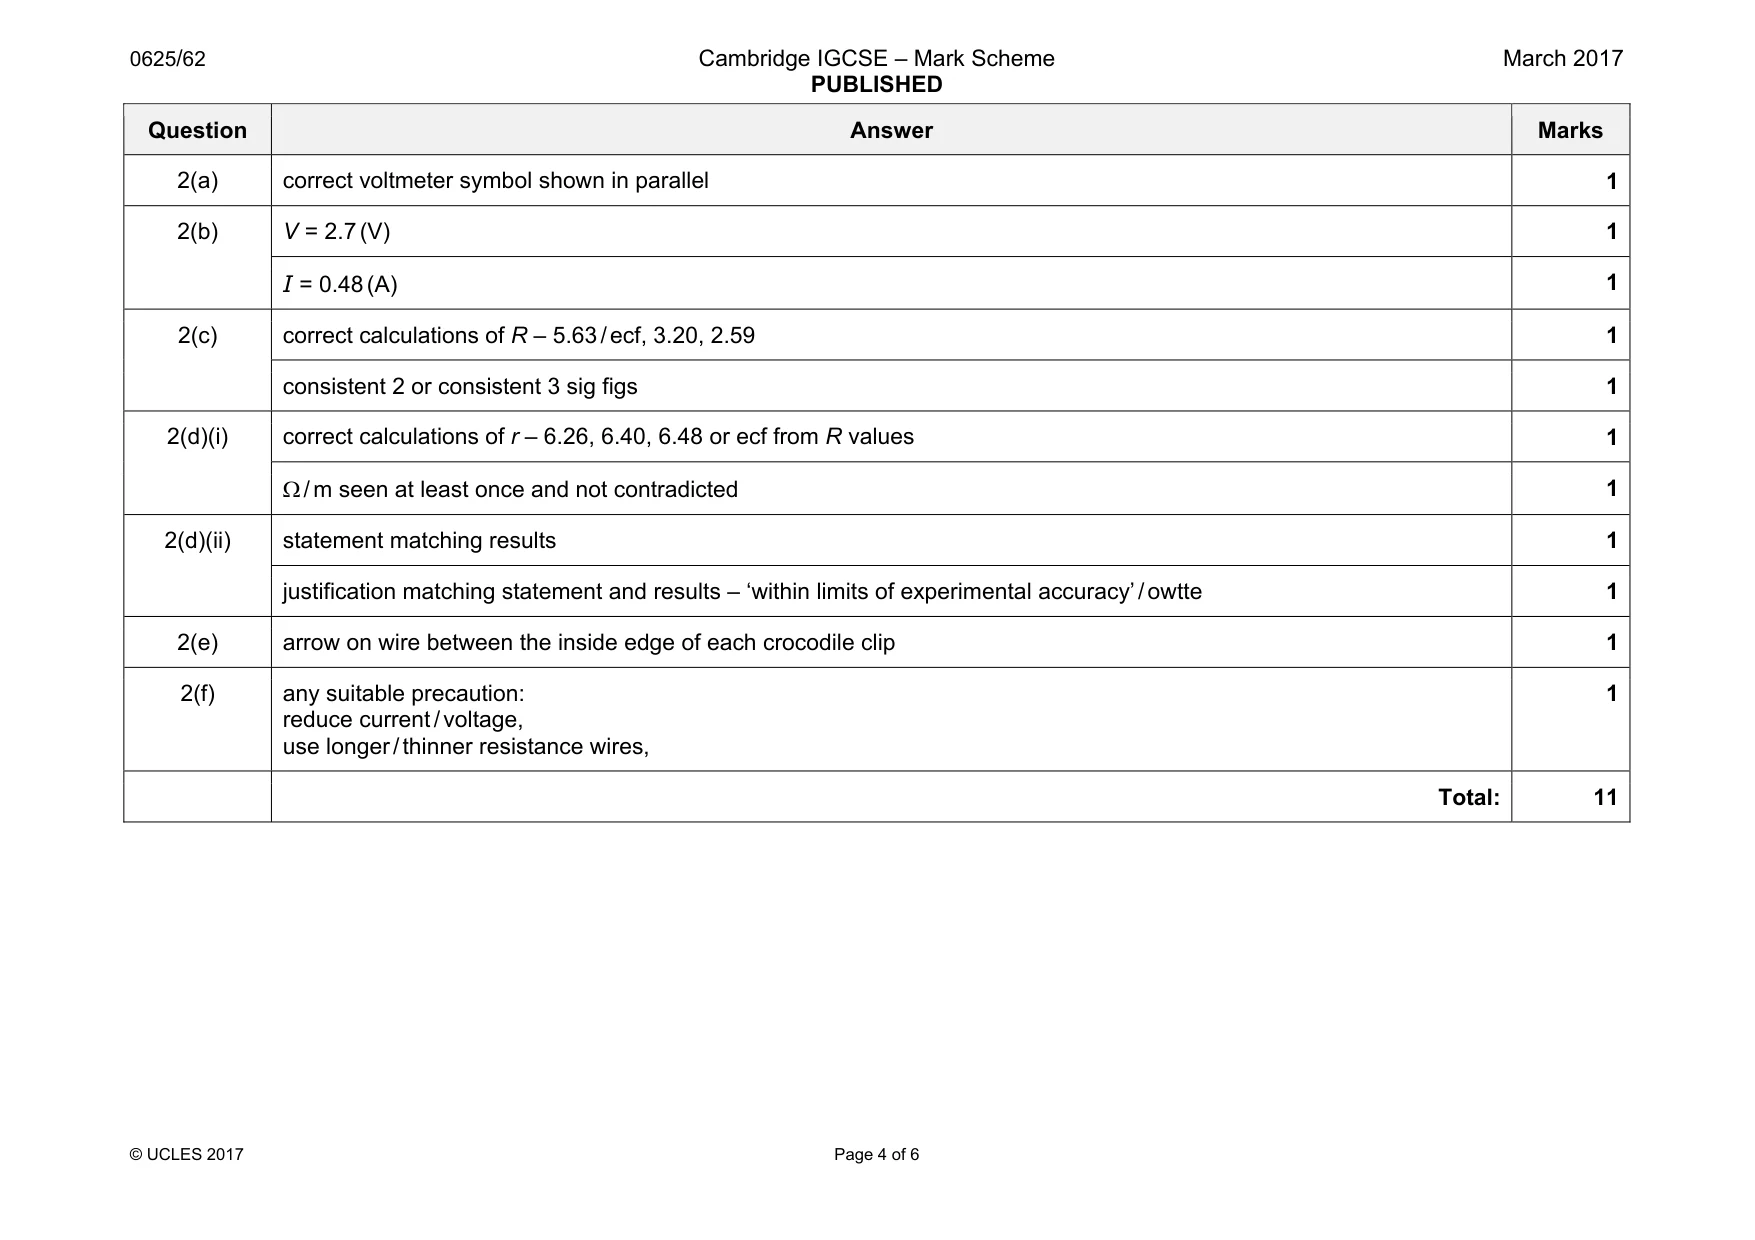
Mark scheme: 2(a) correct voltmeter symbol shown in parallel 1 2(b) V = 2.7 (V) 1 I = 0.48 (A) 1 2(c) correct calculations of R – 5.63 / ecf, 3.20, 2.59 1 consistent 2 or consistent 3 sig figs 1 2(d)(i) correct calculations of r – 6.26, 6.40, 6.48 or ecf from R values 1 Ω / m seen at least once and not contradicted 1 2(d)(ii) statement matching results 1 justification matching statement and results – ‘within limits of experimental accuracy’ / owtte 1 2(e) arrow on wire between the inside edge of each crocodile clip 1 2(f) any suitable precaution: reduce current / voltage, use longer / thinner resistance wires, 1 Total: 11
Q3 · Some students are investigating the magnification produced by a converging lens
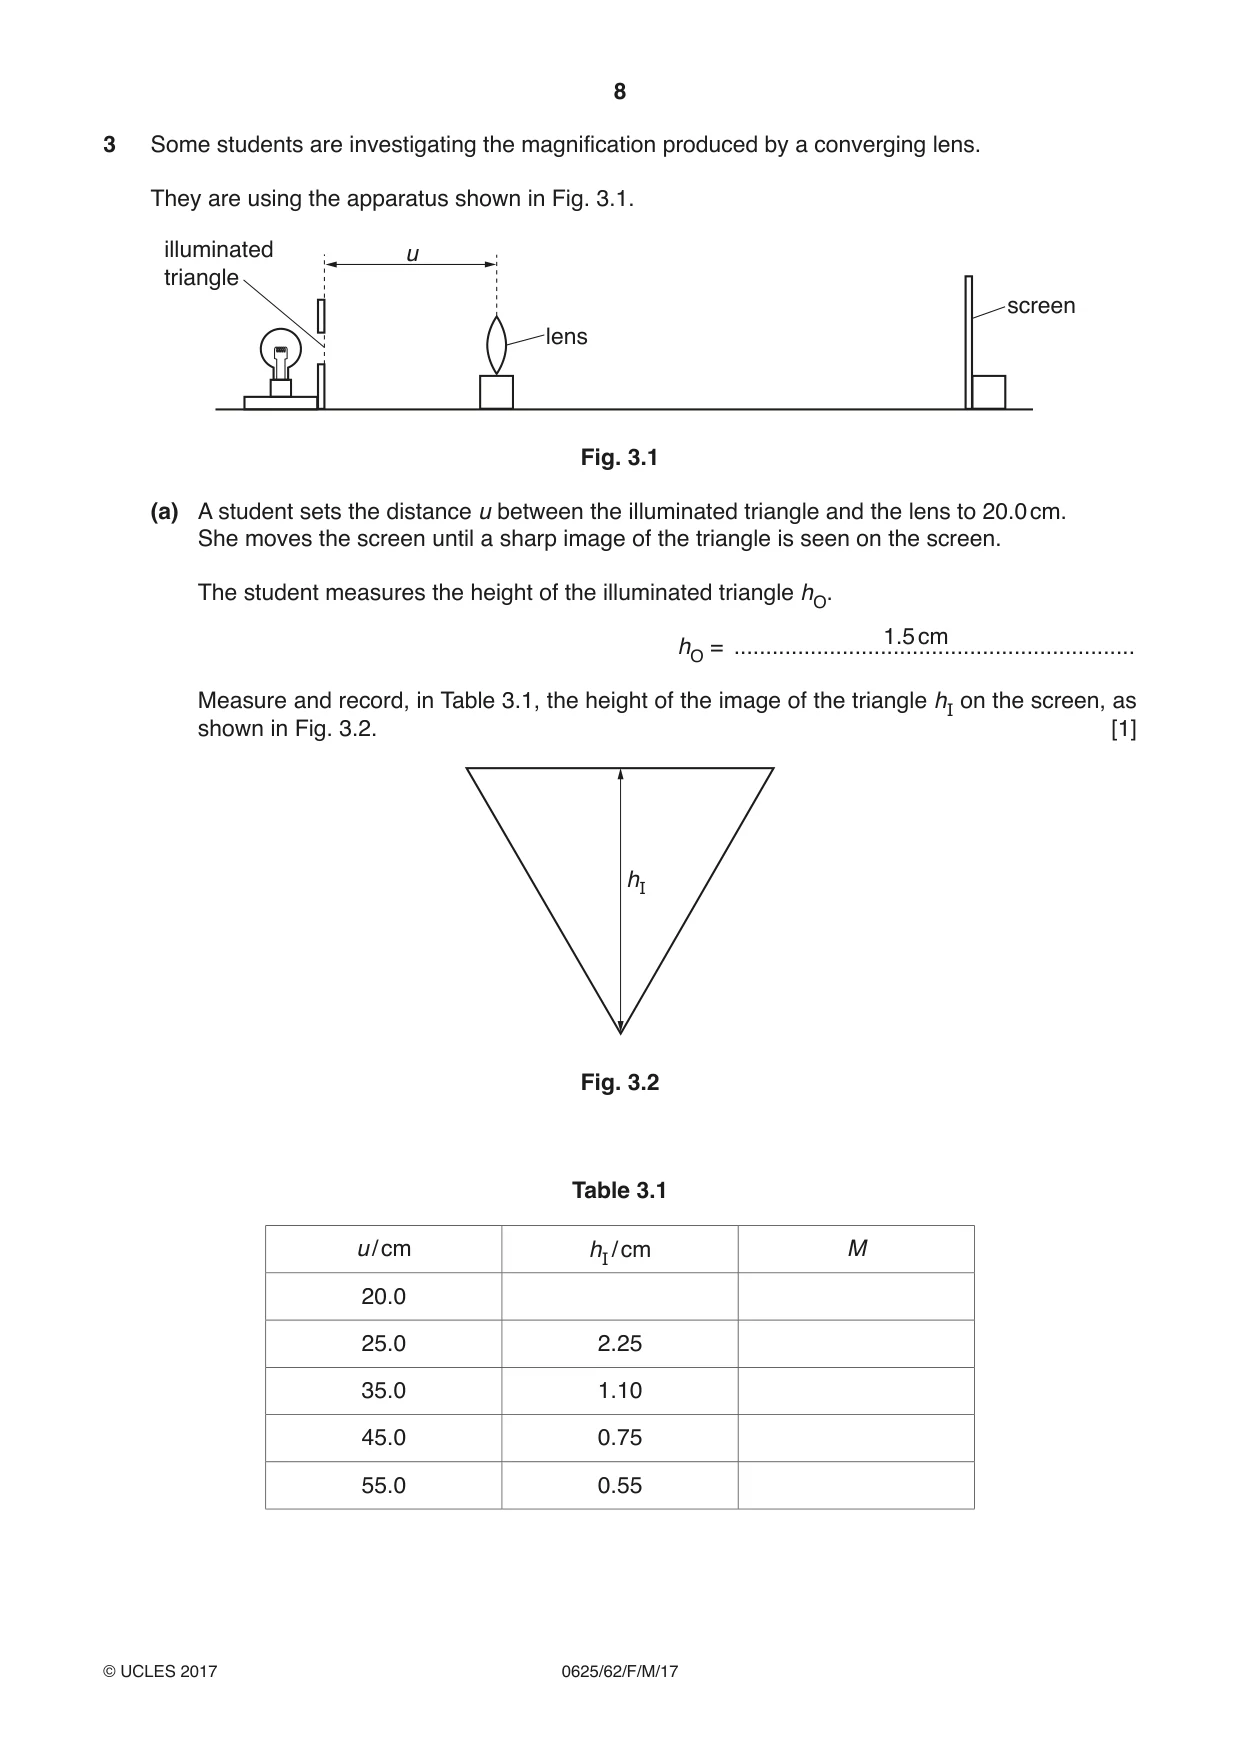
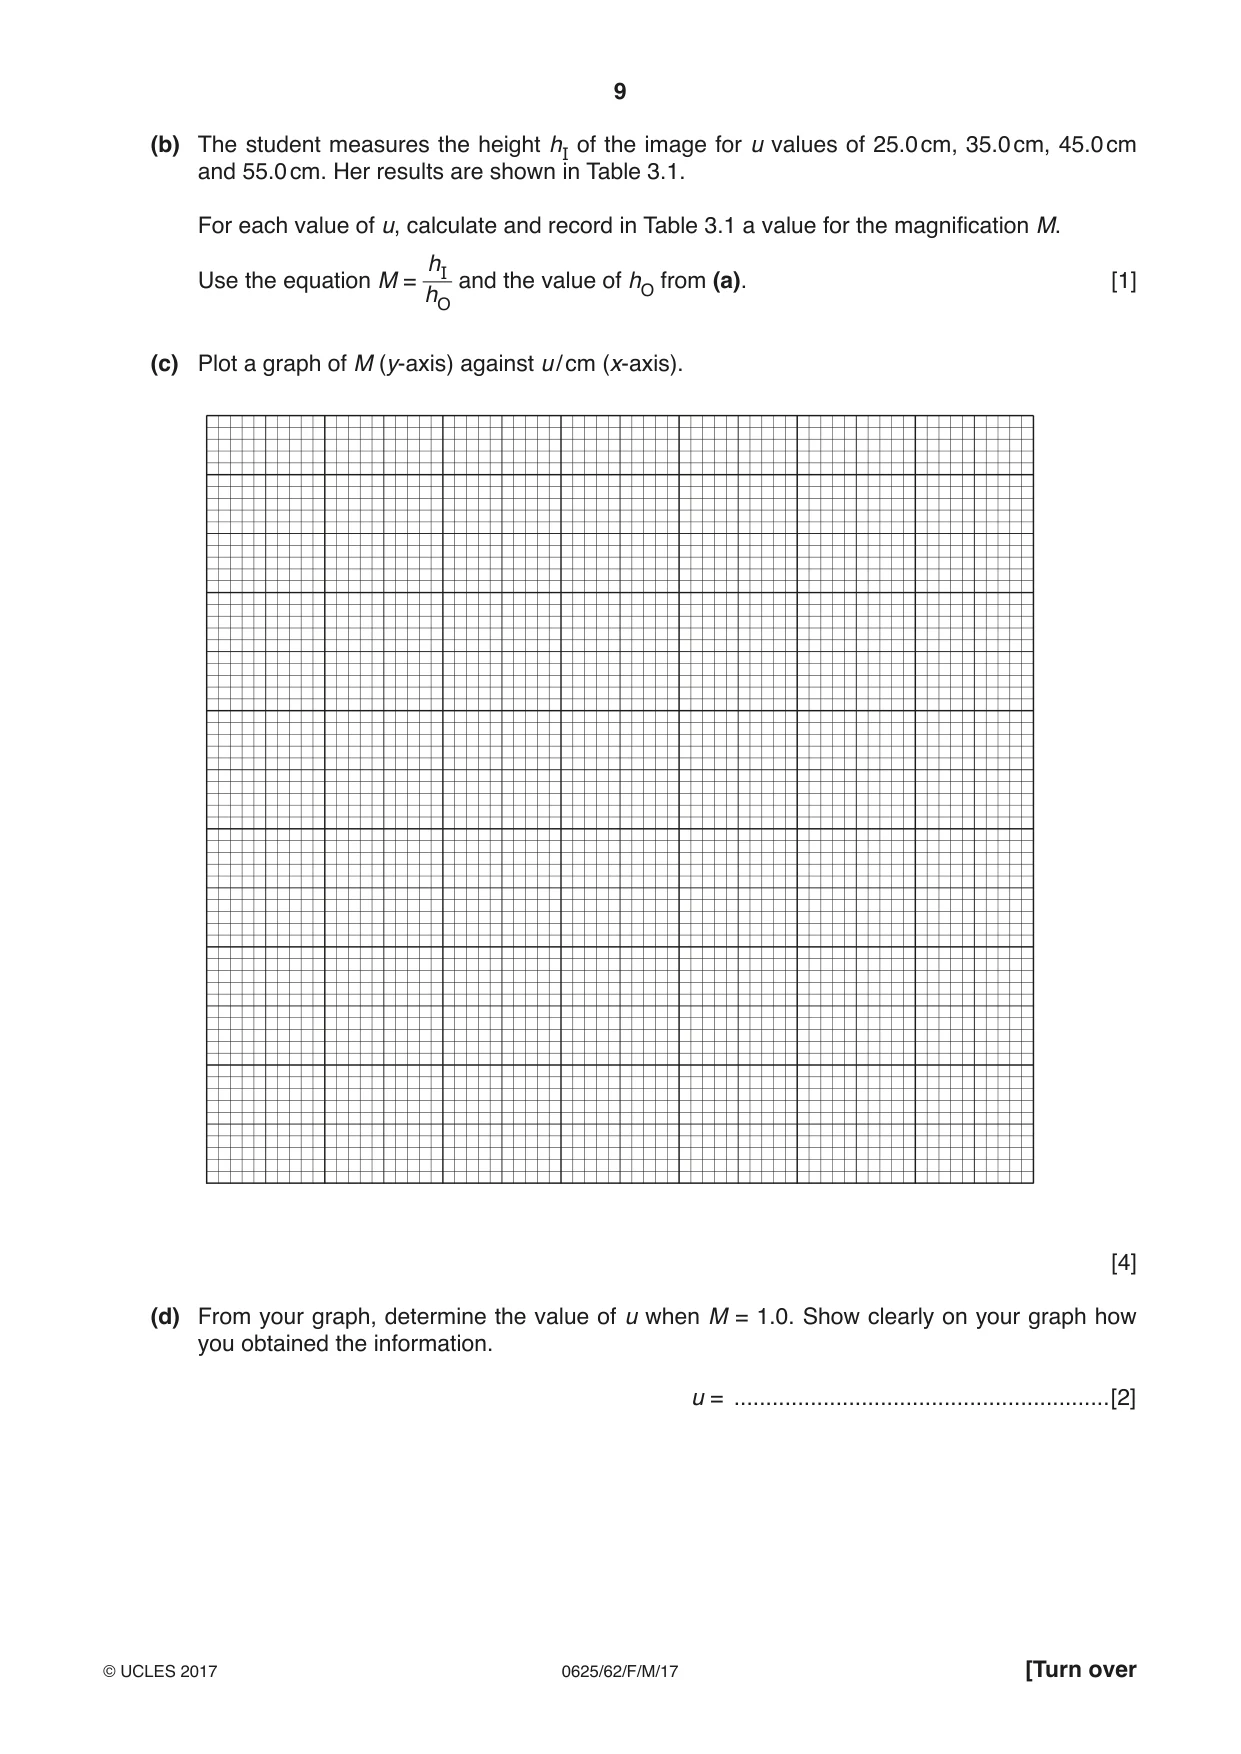
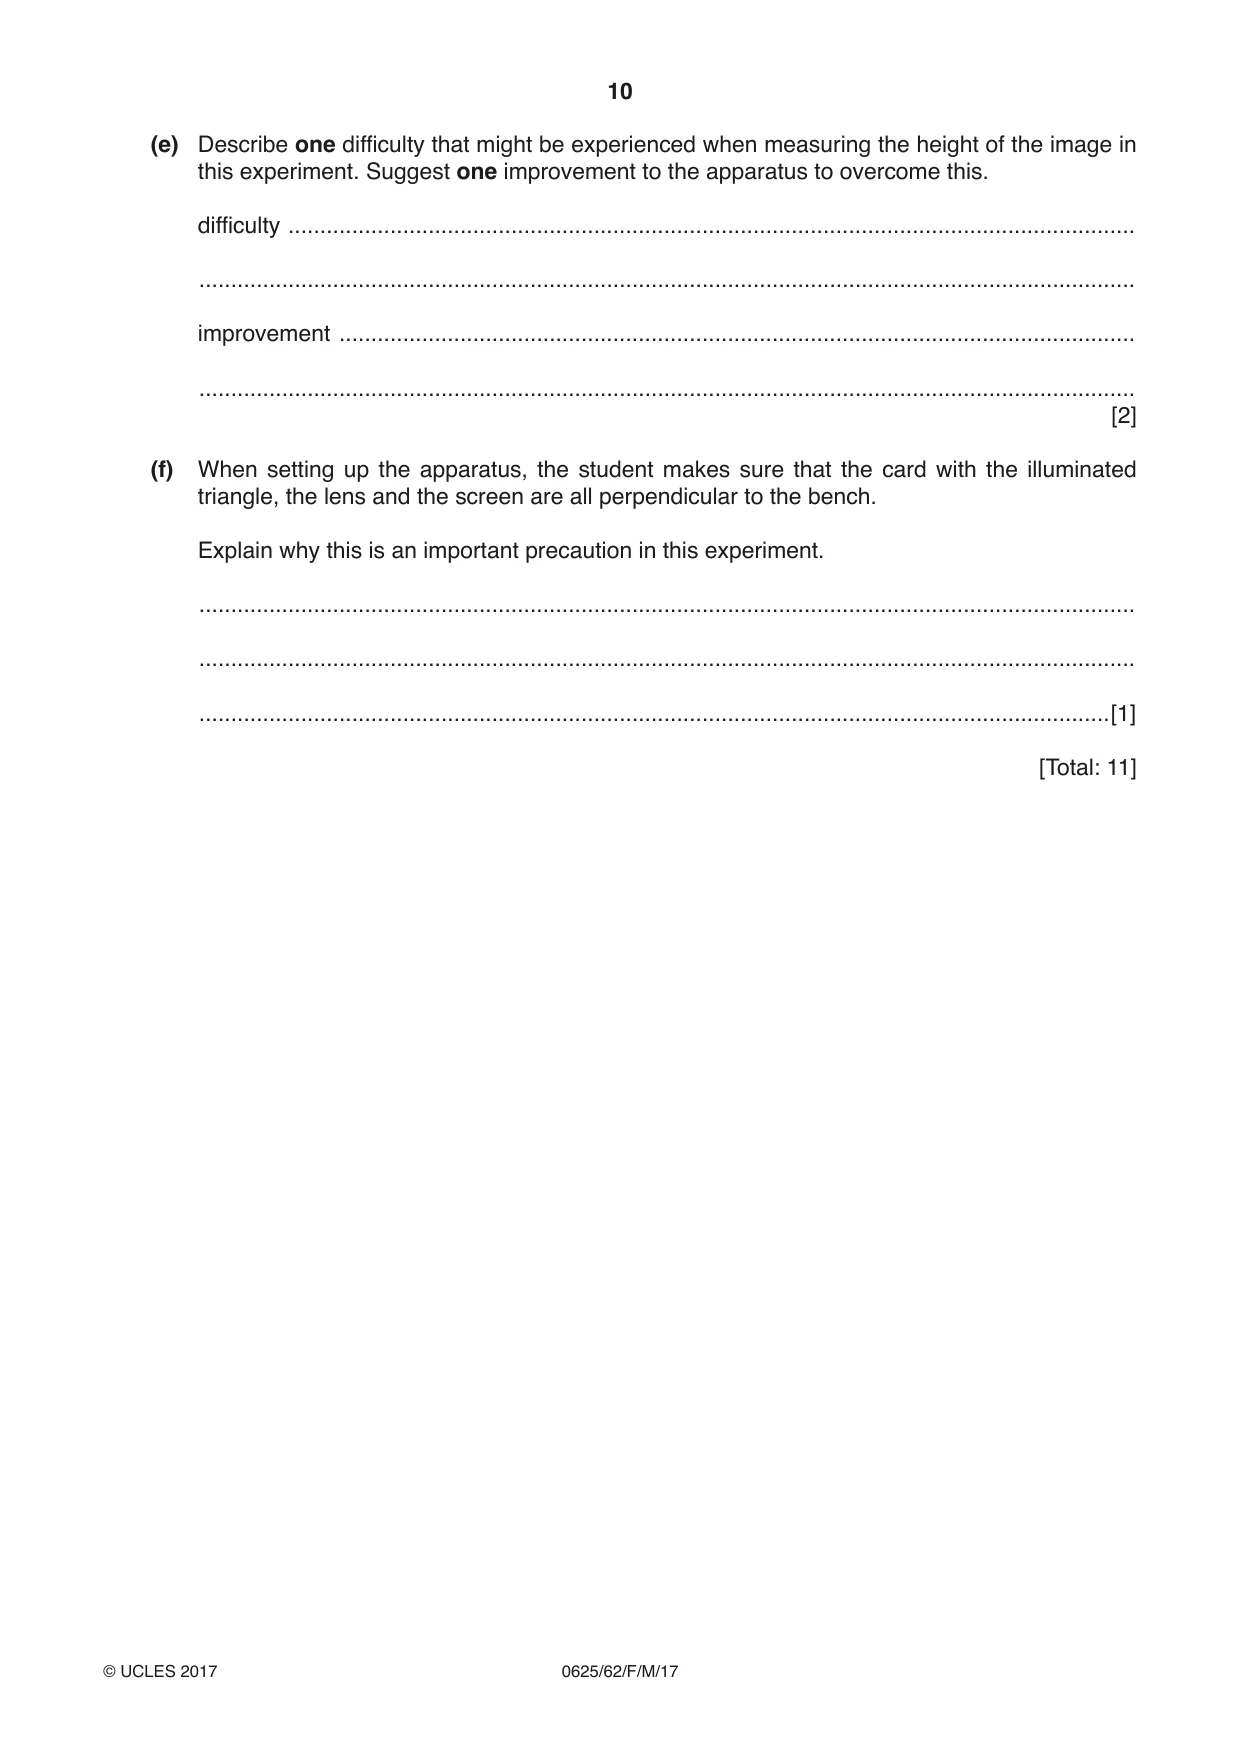
3 Some students are investigating the magnification produced by a converging lens. They are using the apparatus shown in Fig. 3.1. illuminated u triangle screen lens Fig. 3.1 (a) A student sets the distance u between the illuminated triangle and the lens to 20.0 cm. She moves the screen until a sharp image of the triangle is seen on the screen. The student measures the height of the illuminated triangle hO. 1.5 cm hO = ............................................................... Measure and record, in Table 3.1, the height of the image of the triangle hI on the screen, as shown in Fig. 3.2. [1] hI Fig. 3.2 Table 3.1 u / cm hI / cm M 20.0 25.0 2.25 35.0 1.10 45.0 0.75 55.0 0.55 (b) The student measures the height hI of the image for u values of 25.0 cm, 35.0 cm, 45.0 cm and 55.0 cm. Her results are shown in Table 3.1. For each value of u, calculate and record in Table 3.1 a value for the magnification M. hI Use the equation M = and the value of hO from (a). [1] hO (c) Plot a graph of M (y-axis) against u / cm (x-axis). [4] (d) From your graph, determine the value of u when M = 1.0. Show clearly on your graph how you obtained the information. u = ...........................................................[2] (e) Describe one difficulty that might be experienced when measuring the height of the image in this experiment. Suggest one improvement to the apparatus to overcome this. difficulty ..................................................................................................................................... ................................................................................................................................................... improvement ............................................................................................................................. ................................................................................................................................................... [2] (f) When setting up the apparatus, the student makes sure that the card with the illuminated triangle, the lens and the screen are all perpendicular to the bench. Explain why this is an important precaution in this experiment. ................................................................................................................................................... ................................................................................................................................................... ...............................................................................................................................................[1] [Total: 11]
Mark scheme: 3(a) 1 3(b) correct M calculations – 3.00 / ecf, 1.50, 0.73, 0.50, 0.37 1 3(c) graph: axes labelled with quantity and unit 1 appropriate scales (plots occupying at least ½ grid) 1 plots all correct to within ½ small square 1 well judged line and single, continuous thin line 1 3(d) construction line(s) clearly seen on graph 1 u in range 28.0 to 32.0 (cm) 1 3(e) any appropriate difficulty: e.g. hand / ruler in way of image 1 matching improvement: e.g. use translucent screen and view from behind, fix ruler / grid to screen 1 3(f) able to achieve a sharp / complete / focused image / owtte 1 Total: 11
Q4 · A student is investigating how the material of a spring affects its behaviour when…
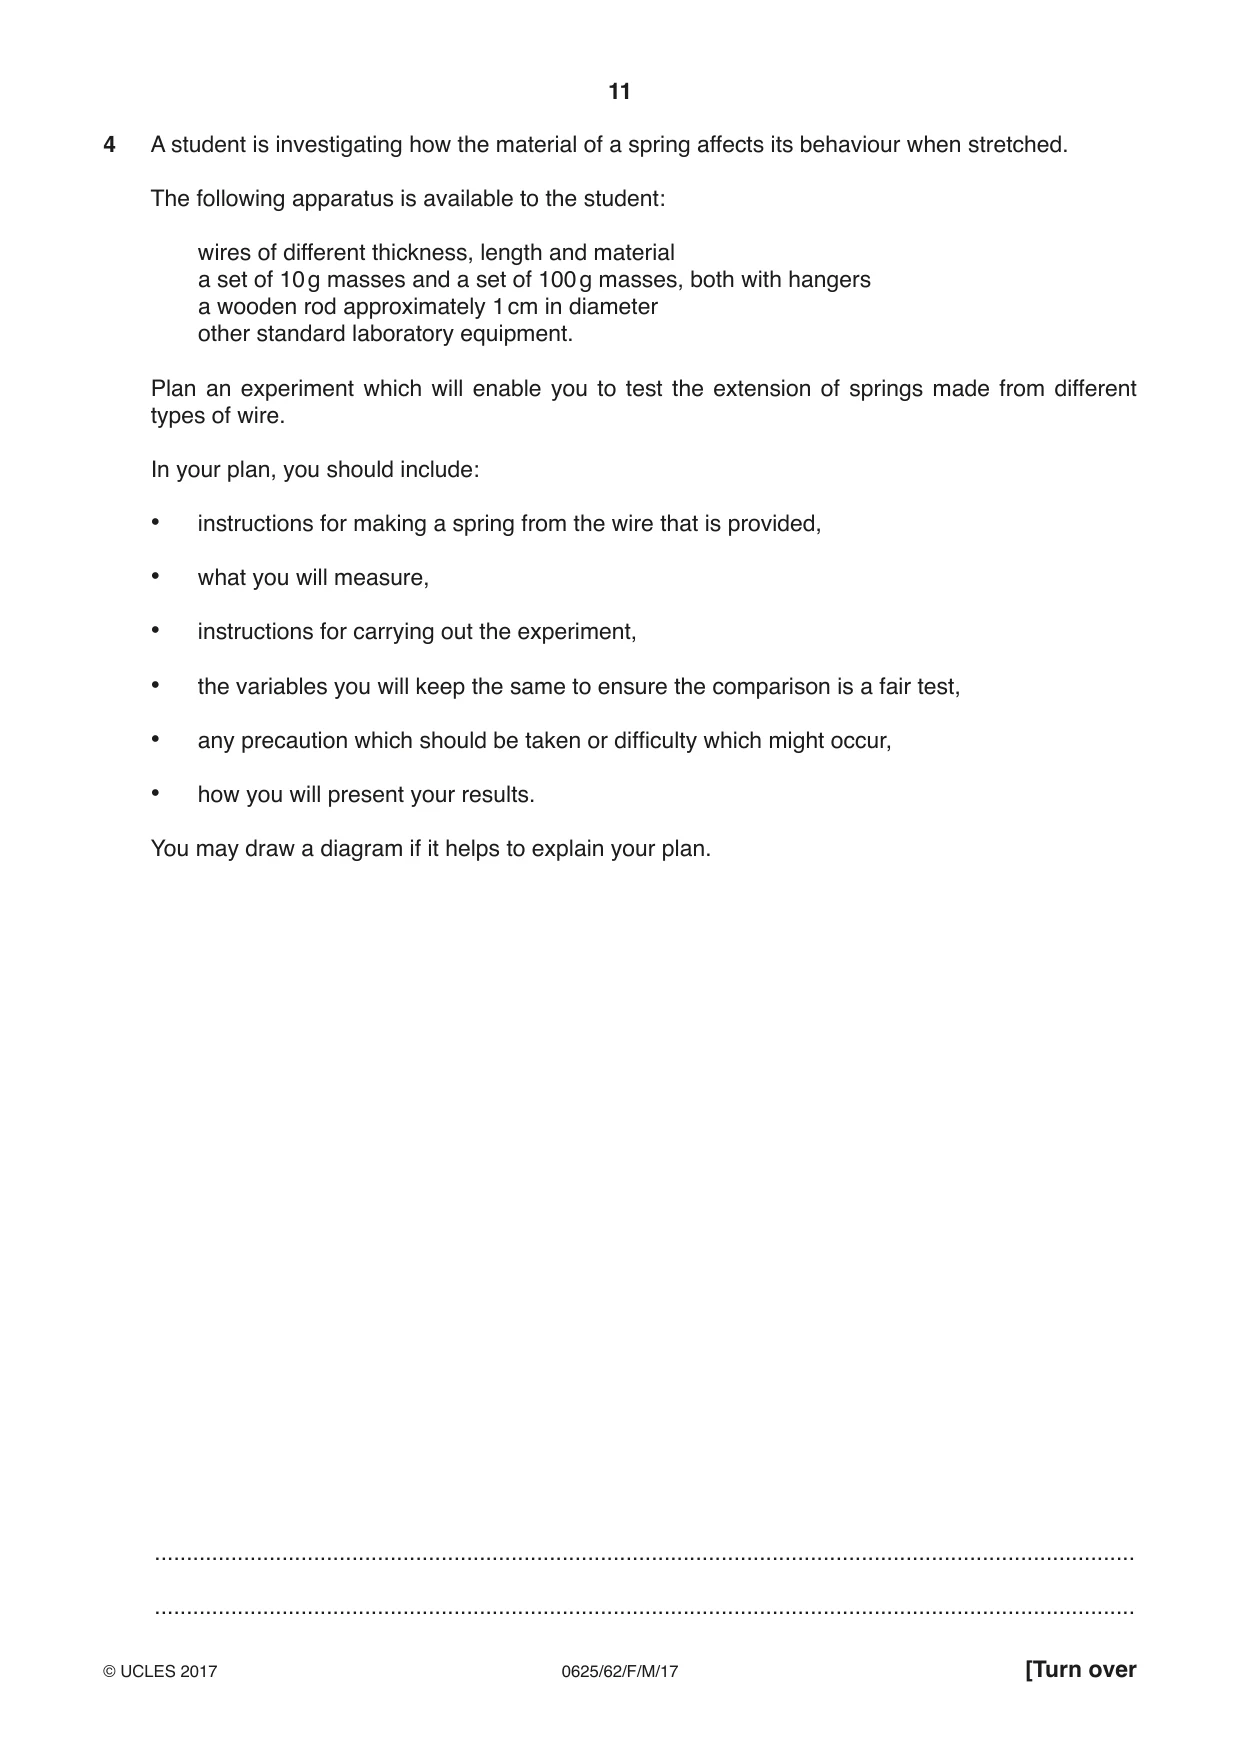
4 A student is investigating how the material of a spring affects its behaviour when stretched. The following apparatus is available to the student: wires of different thickness, length and material a set of 10 g masses and a set of 100 g masses, both with hangers a wooden rod approximately 1 cm in diameter other standard laboratory equipment. Plan an experiment which will enable you to test the extension of springs made from different types of wire. In your plan, you should include: • instructions for making a spring from the wire that is provided, • what you will measure, • instructions for carrying out the experiment, • the variables you will keep the same to ensure the comparison is a fair test, • any precaution which should be taken or difficulty which might occur, • how you will present your results. You may draw a diagram if it helps to explain your plan. .......................................................................................................................................................... .......................................................................................................................................................... .......................................................................................................................................................... .......................................................................................................................................................... .......................................................................................................................................................... .......................................................................................................................................................... .......................................................................................................................................................... .......................................................................................................................................................... .......................................................................................................................................................... .......................................................................................................................................................... .......................................................................................................................................................... .......................................................................................................................................................... .......................................................................................................................................................... .......................................................................................................................................................... .......................................................................................................................................................... .......................................................................................................................................................... .......................................................................................................................................................... .......................................................................................................................................................... ......................................................................................................................................................[7] [Total: 7]
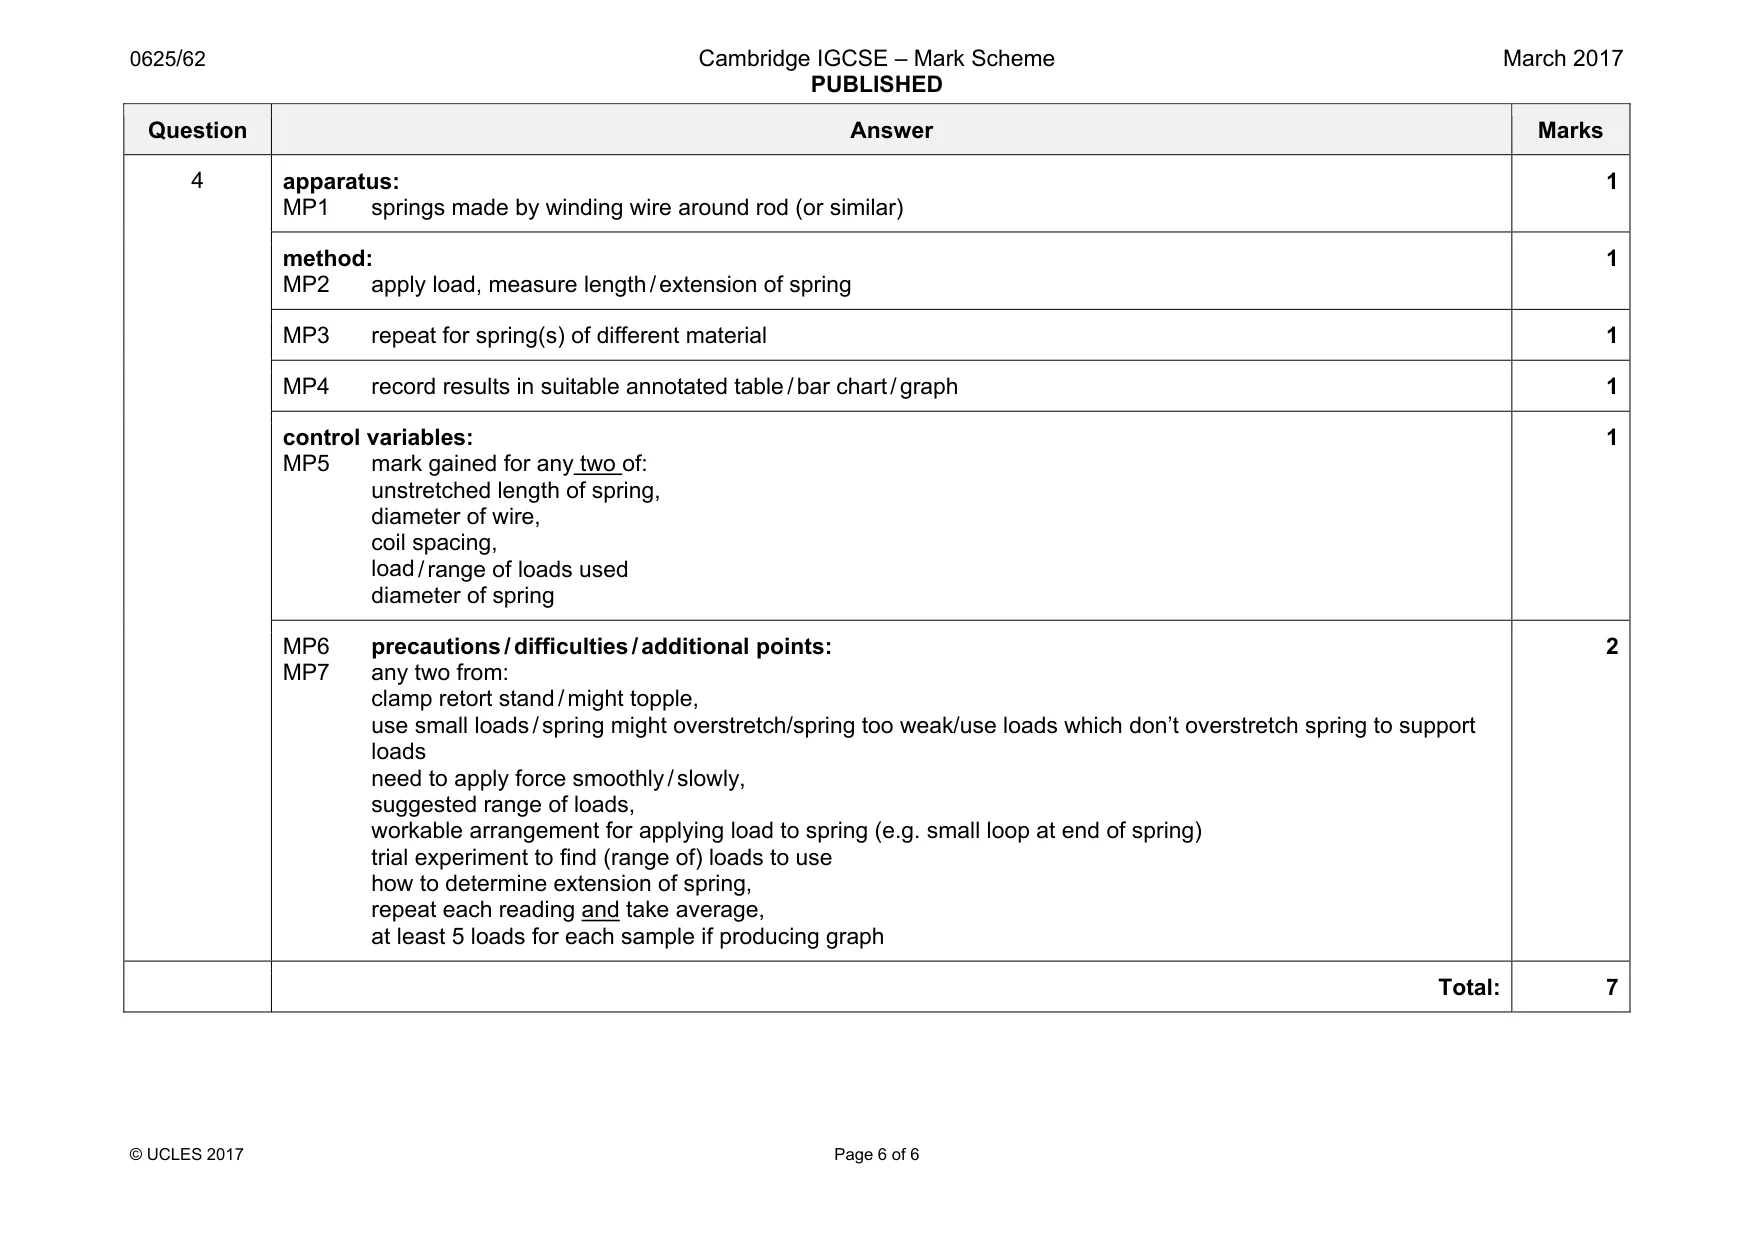
Mark scheme: 4 apparatus: MP1 springs made by winding wire around rod (or similar) 1 method: MP2 apply load, measure length / extension of spring 1 MP3 repeat for spring(s) of different material 1 MP4 record results in suitable annotated table / bar chart / graph 1 control variables: MP5 mark gained for any two of: unstretched length of spring, diameter of wire, coil spacing, load / range of loads used diameter of spring 1 MP6 precautions / difficulties / additional points: MP7 any two from: clamp retort stand / might topple, use small loads / spring might overstretch/spring too weak/use loads which don’t overstretch spring to support loads need to apply force smoothly / slowly, suggested range of loads, workable arrangement for applying load to spring (e.g. small loop at end of spring) trial experiment to find (range of) loads to use how to determine extension of spring, repeat each reading and take average, at least 5 loads for each sample if producing graph 2 Total: 7
What was in this paper
The subtopics covered by these 4 questions, and how many questions each got. Open one in a new tab to see every Cambridge question on it.
What you needed in this session
Cambridge’s own grade thresholds for 2017 Feb/March, Paper 6 · Variant 2. A higher threshold means an easier paper — the bar moves with how the cohort did.