Cambridge IGCSE Physics 0625 — 2016 Feb/March Paper 6 · Variant 2
0625/62/F/M/16 · 4 questions · 40 marks · ≈45 min
The question paper and its mark scheme, free to read here and free to download. This is Cambridge’s own paper, exactly as it was sat.
Question paper12 pages
Mark scheme5 pages
Answers below. Sit the paper first if you are practising.
Questions as text
Q1 · Some students are investigating the relationship between potential difference and current…
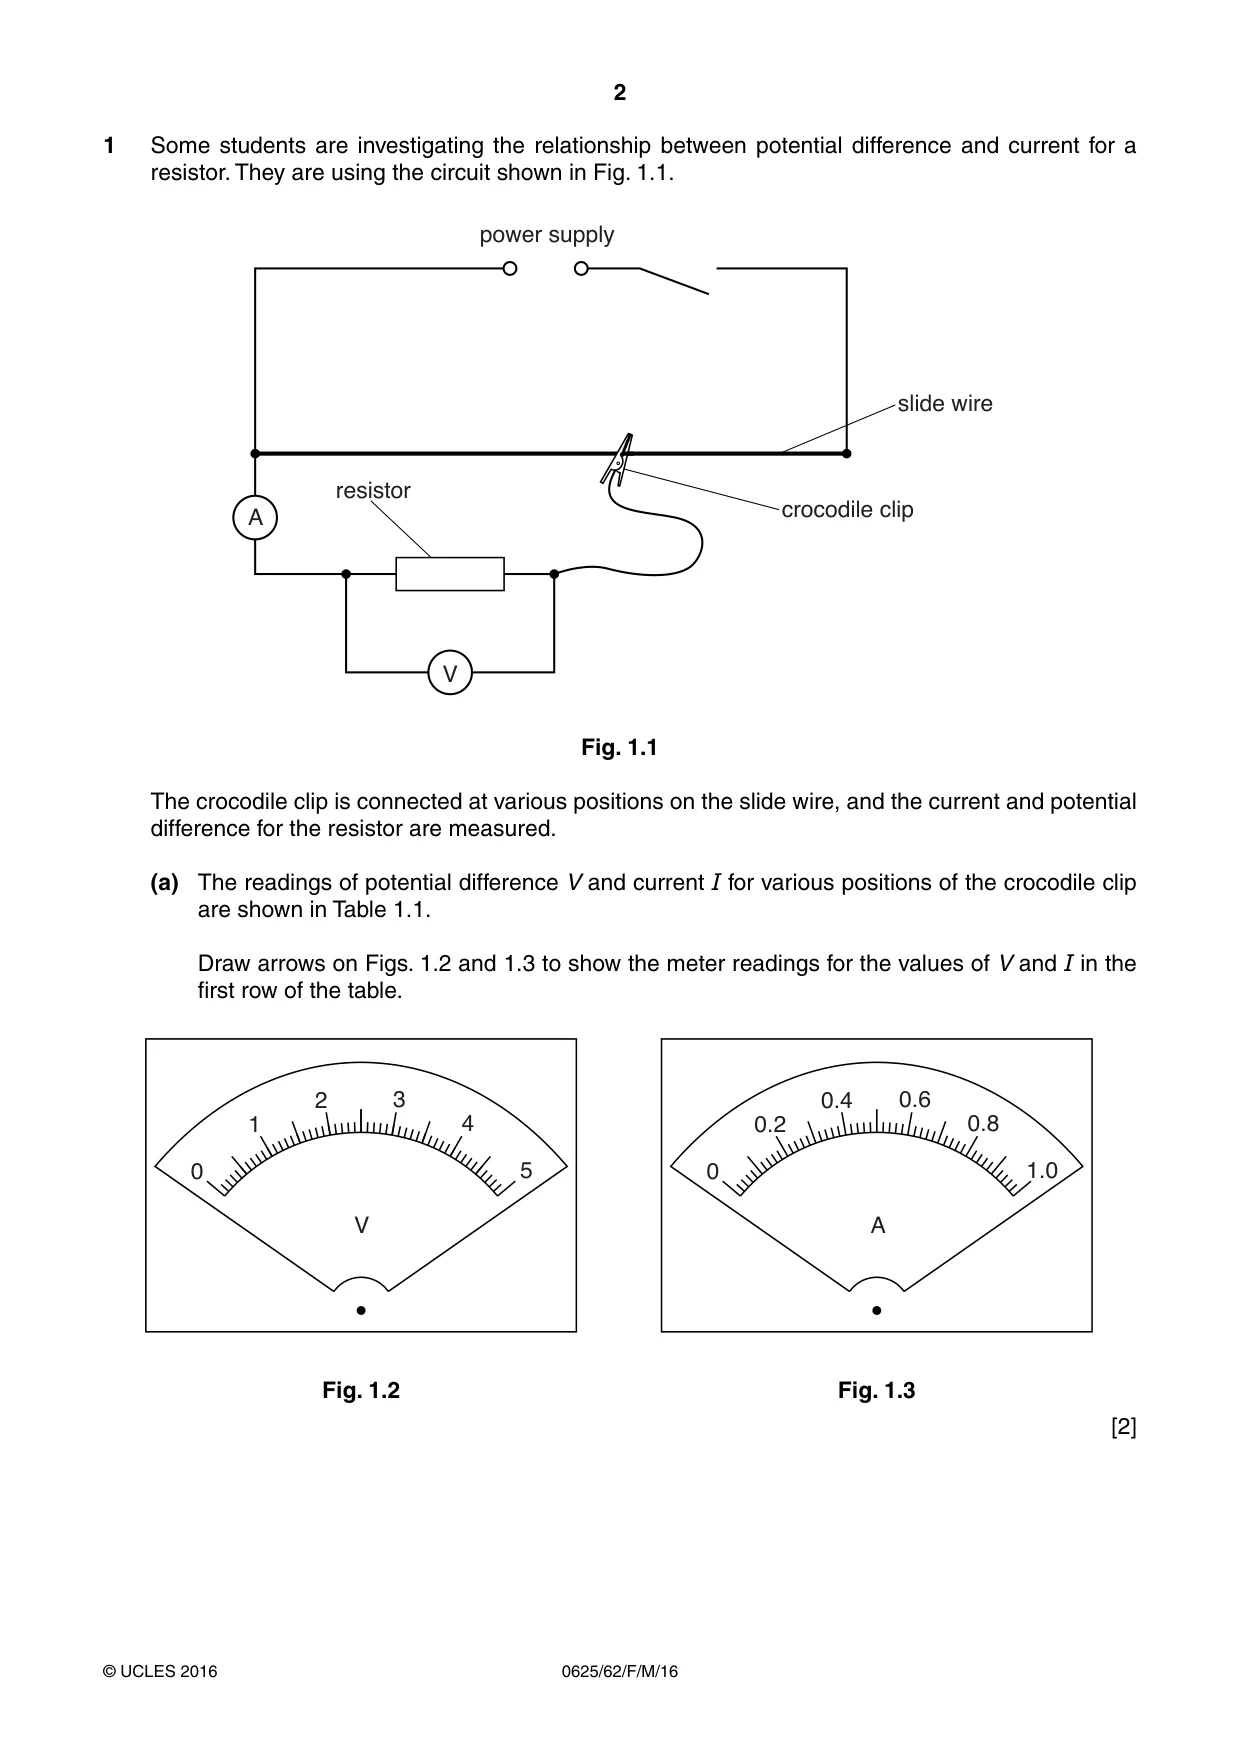
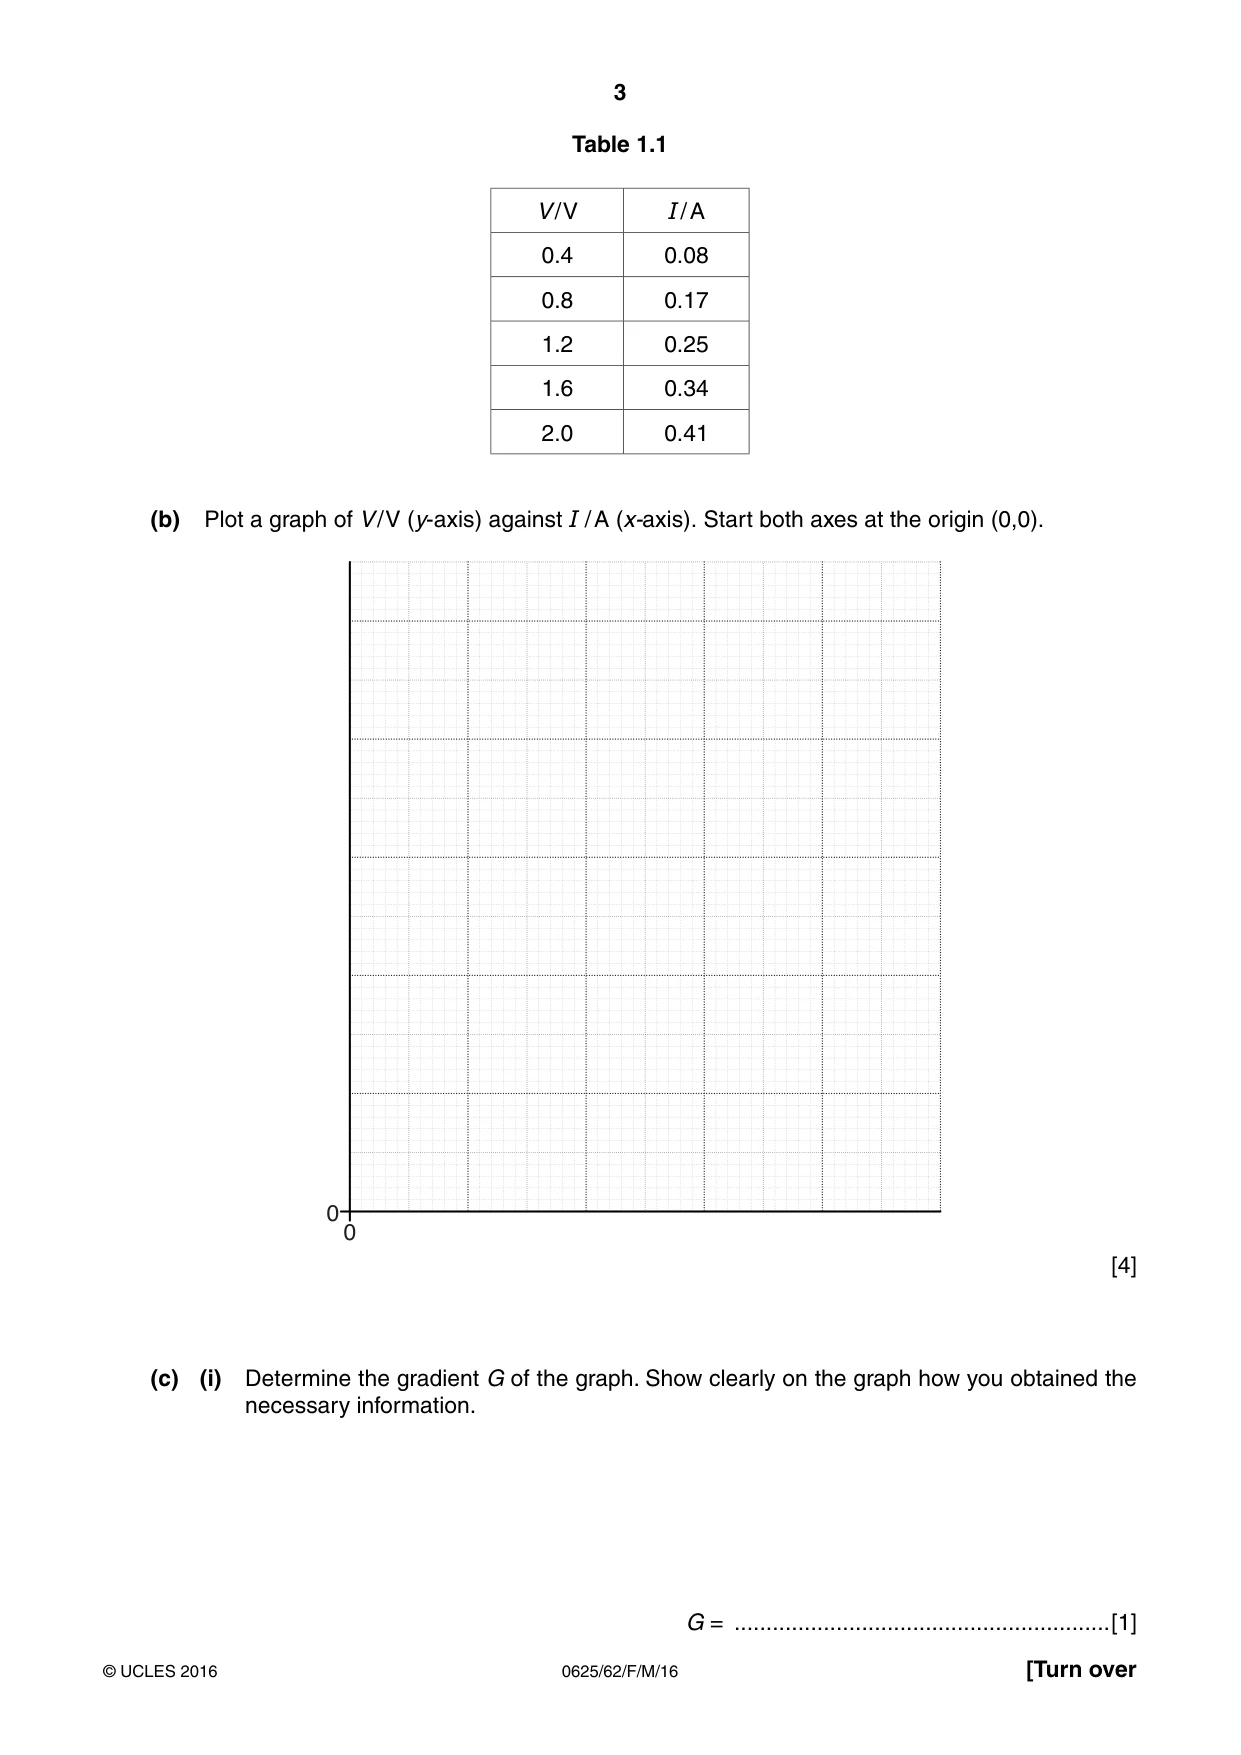
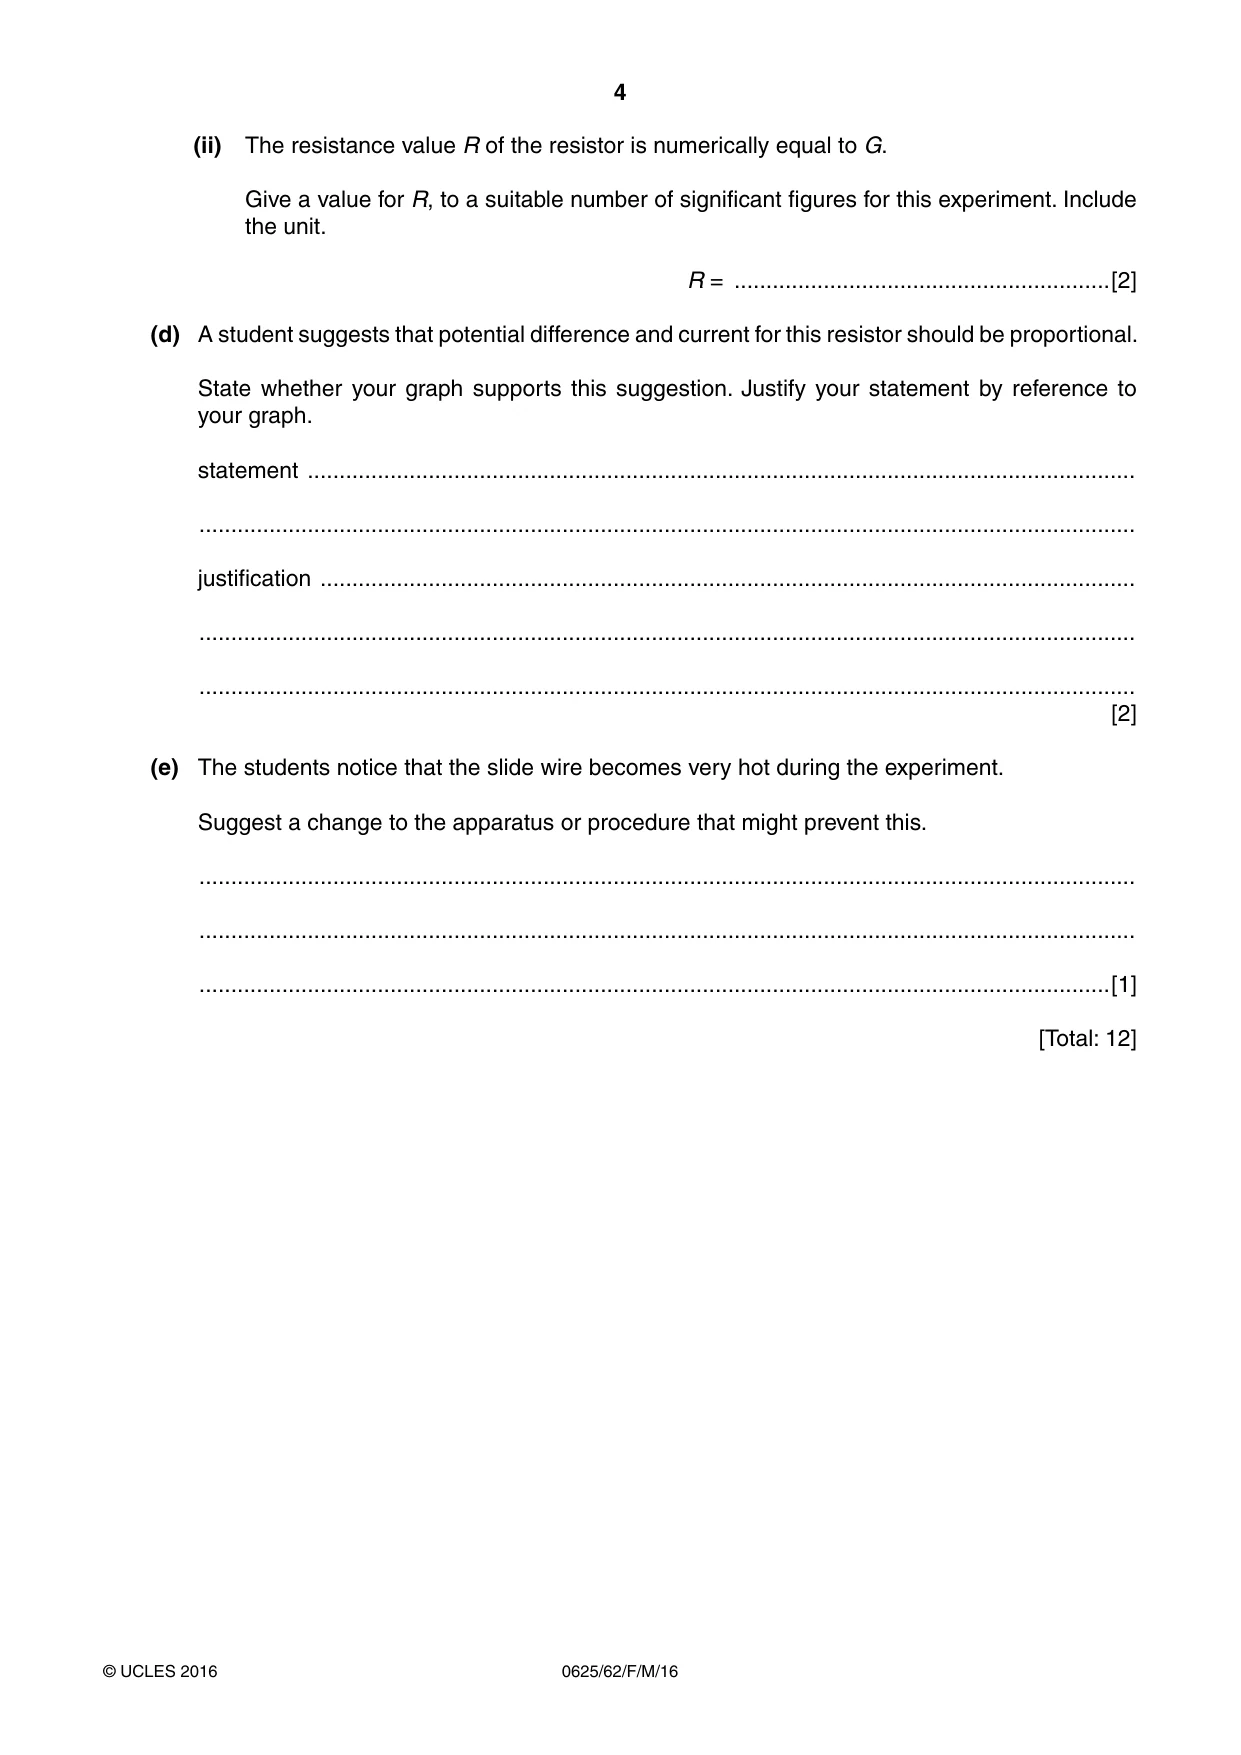
1 Some students are investigating the relationship between potential difference and current for a resistor. They are using the circuit shown in Fig. 1.1. power supply slide wire resistor crocodile clip A V Fig. 1.1 The crocodile clip is connected at various positions on the slide wire, and the current and potential difference for the resistor are measured. (a) The readings of potential difference V and current I for various positions of the crocodile clip are shown in Table 1.1. Draw arrows on Figs. 1.2 and 1.3 to show the meter readings for the values of V and I in the first row of the table. 9 $ Fig. 1.2 Fig. 1.3 [2] Table 1.1 V / V I / A 0.4 0.08 0.8 0.17 1.2 0.25 1.6 0.34 2.0 0.41 (b) Plot a graph of V / V (y-axis) against I / A (x-axis). Start both axes at the origin (0,0). 0 0 [4] (c) (i) Determine the gradient G of the graph. Show clearly on the graph how you obtained the necessary information. G = ...........................................................[1] (ii) The resistance value R of the resistor is numerically equal to G. Give a value for R, to a suitable number of significant figures for this experiment. Include the unit. R = ...........................................................[2] (d) A student suggests that potential difference and current for this resistor should be proportional. State whether your graph supports this suggestion. Justify your statement by reference to your graph. statement .................................................................................................................................. ................................................................................................................................................... justification ................................................................................................................................ ................................................................................................................................................... ................................................................................................................................................... [2] (e) The students notice that the slide wire becomes very hot during the experiment. Suggest a change to the apparatus or procedure that might prevent this. ................................................................................................................................................... ................................................................................................................................................... ...............................................................................................................................................[1] [Total: 12]
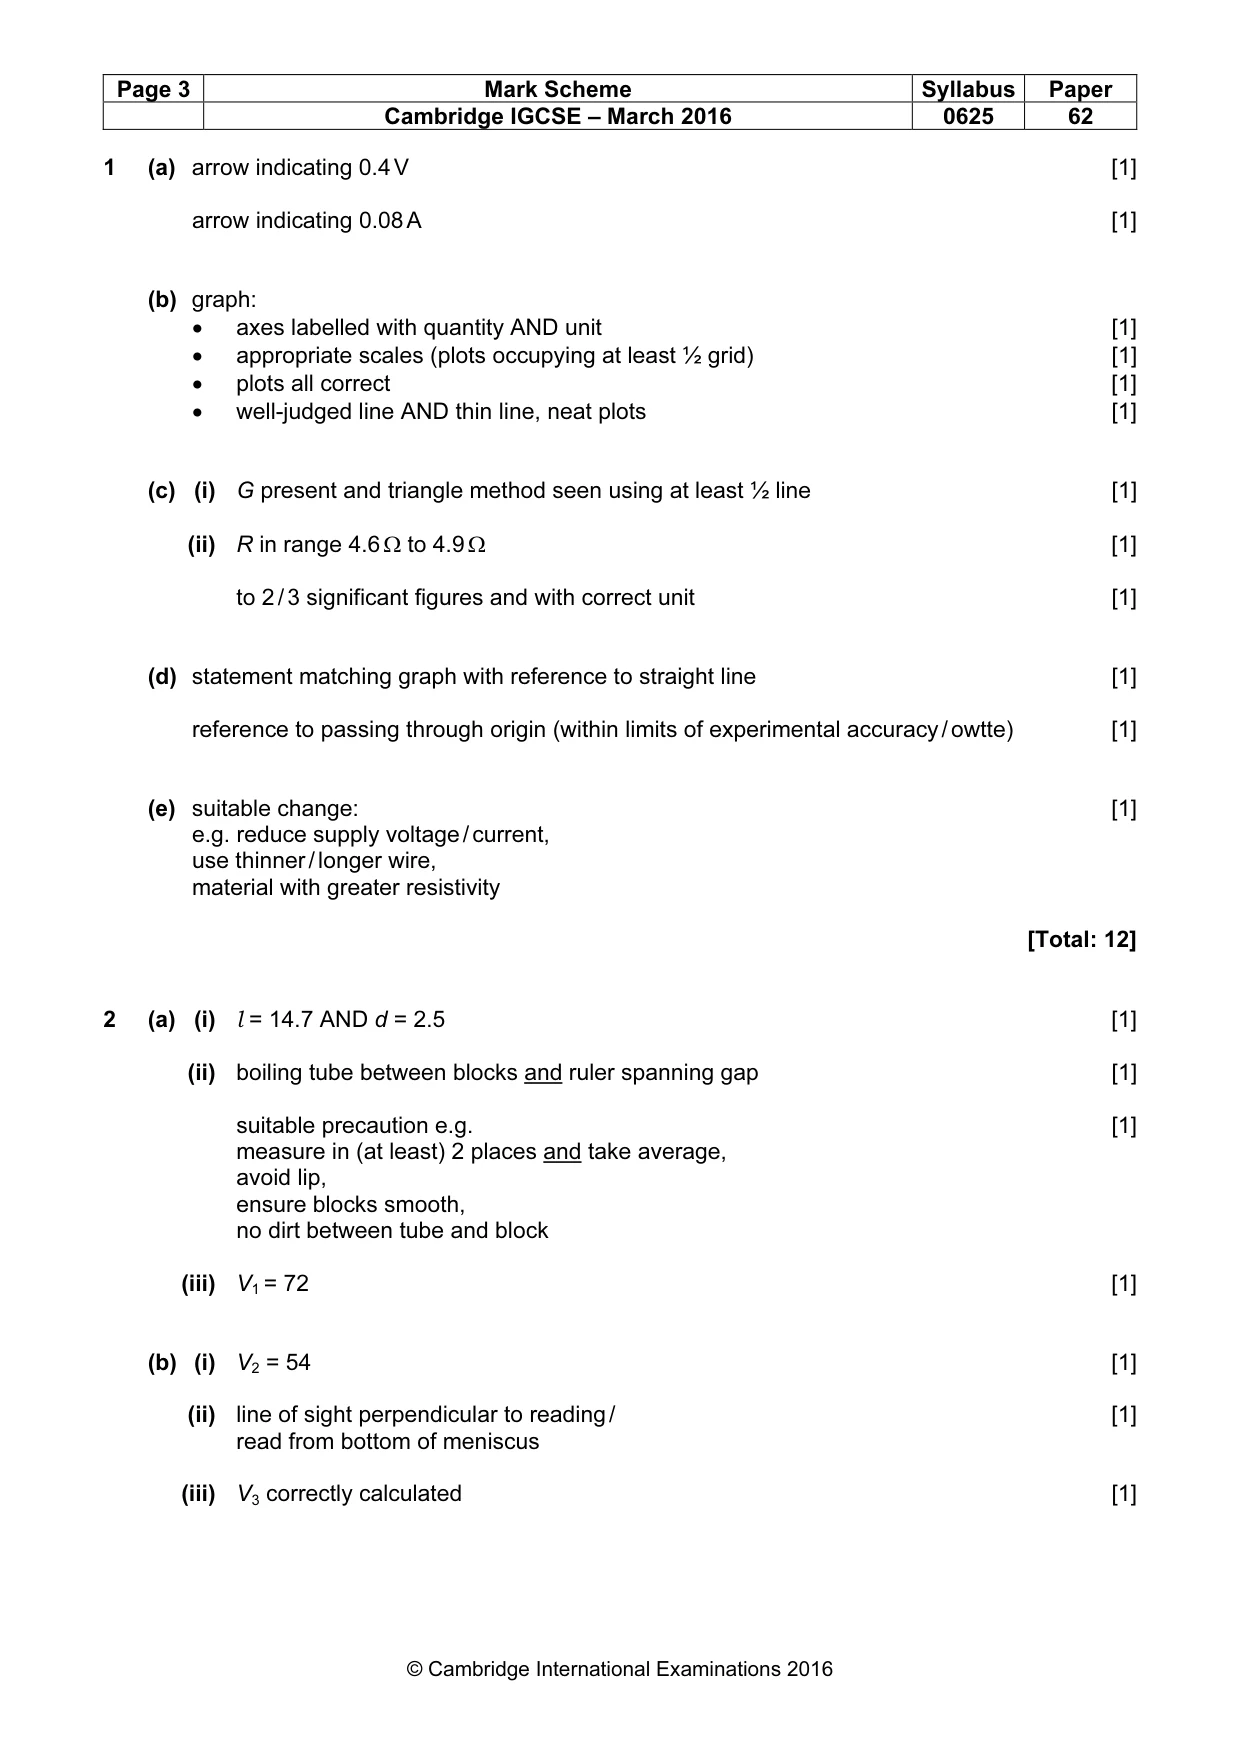
Mark scheme: 1 (a) arrow indicating 0.4 V [1] arrow indicating 0.08 A [1] (b) graph: • axes labelled with quantity AND unit [1] • appropriate scales (plots occupying at least ½ grid) [1] • plots all correct [1] • well-judged line AND thin line, neat plots [1] (c) (i) G present and triangle method seen using at least ½ line [1] (ii) R in range 4.6 Ω to 4.9 Ω [1] to 2 / 3 significant figures and with correct unit [1] (d) statement matching graph with reference to straight line [1] reference to passing through origin (within limits of experimental accuracy / owtte) [1] (e) suitable change: [1] e.g. reduce supply voltage / current, use thinner / longer wire, material with greater resistivity [Total: 12]
Q2 · The class is carrying out an experiment to determine the density of glass
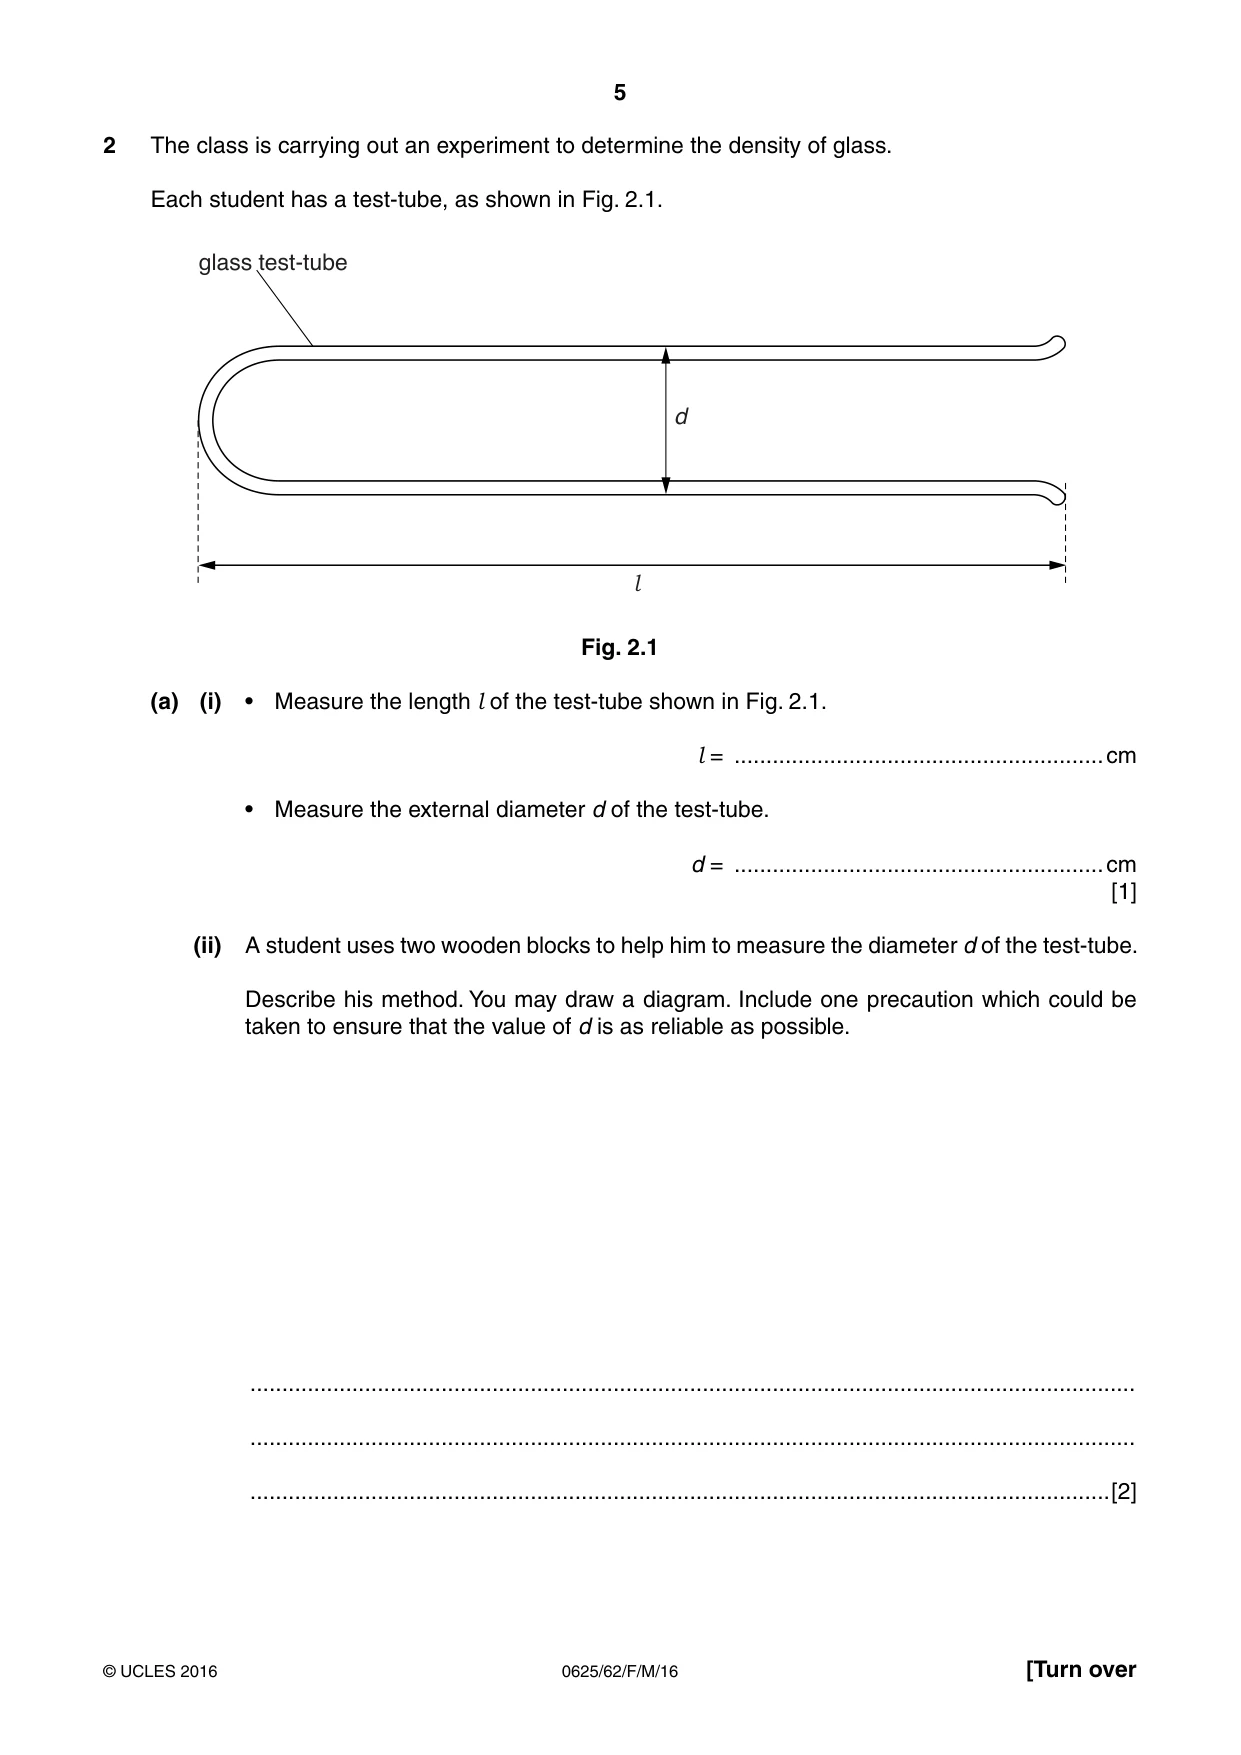
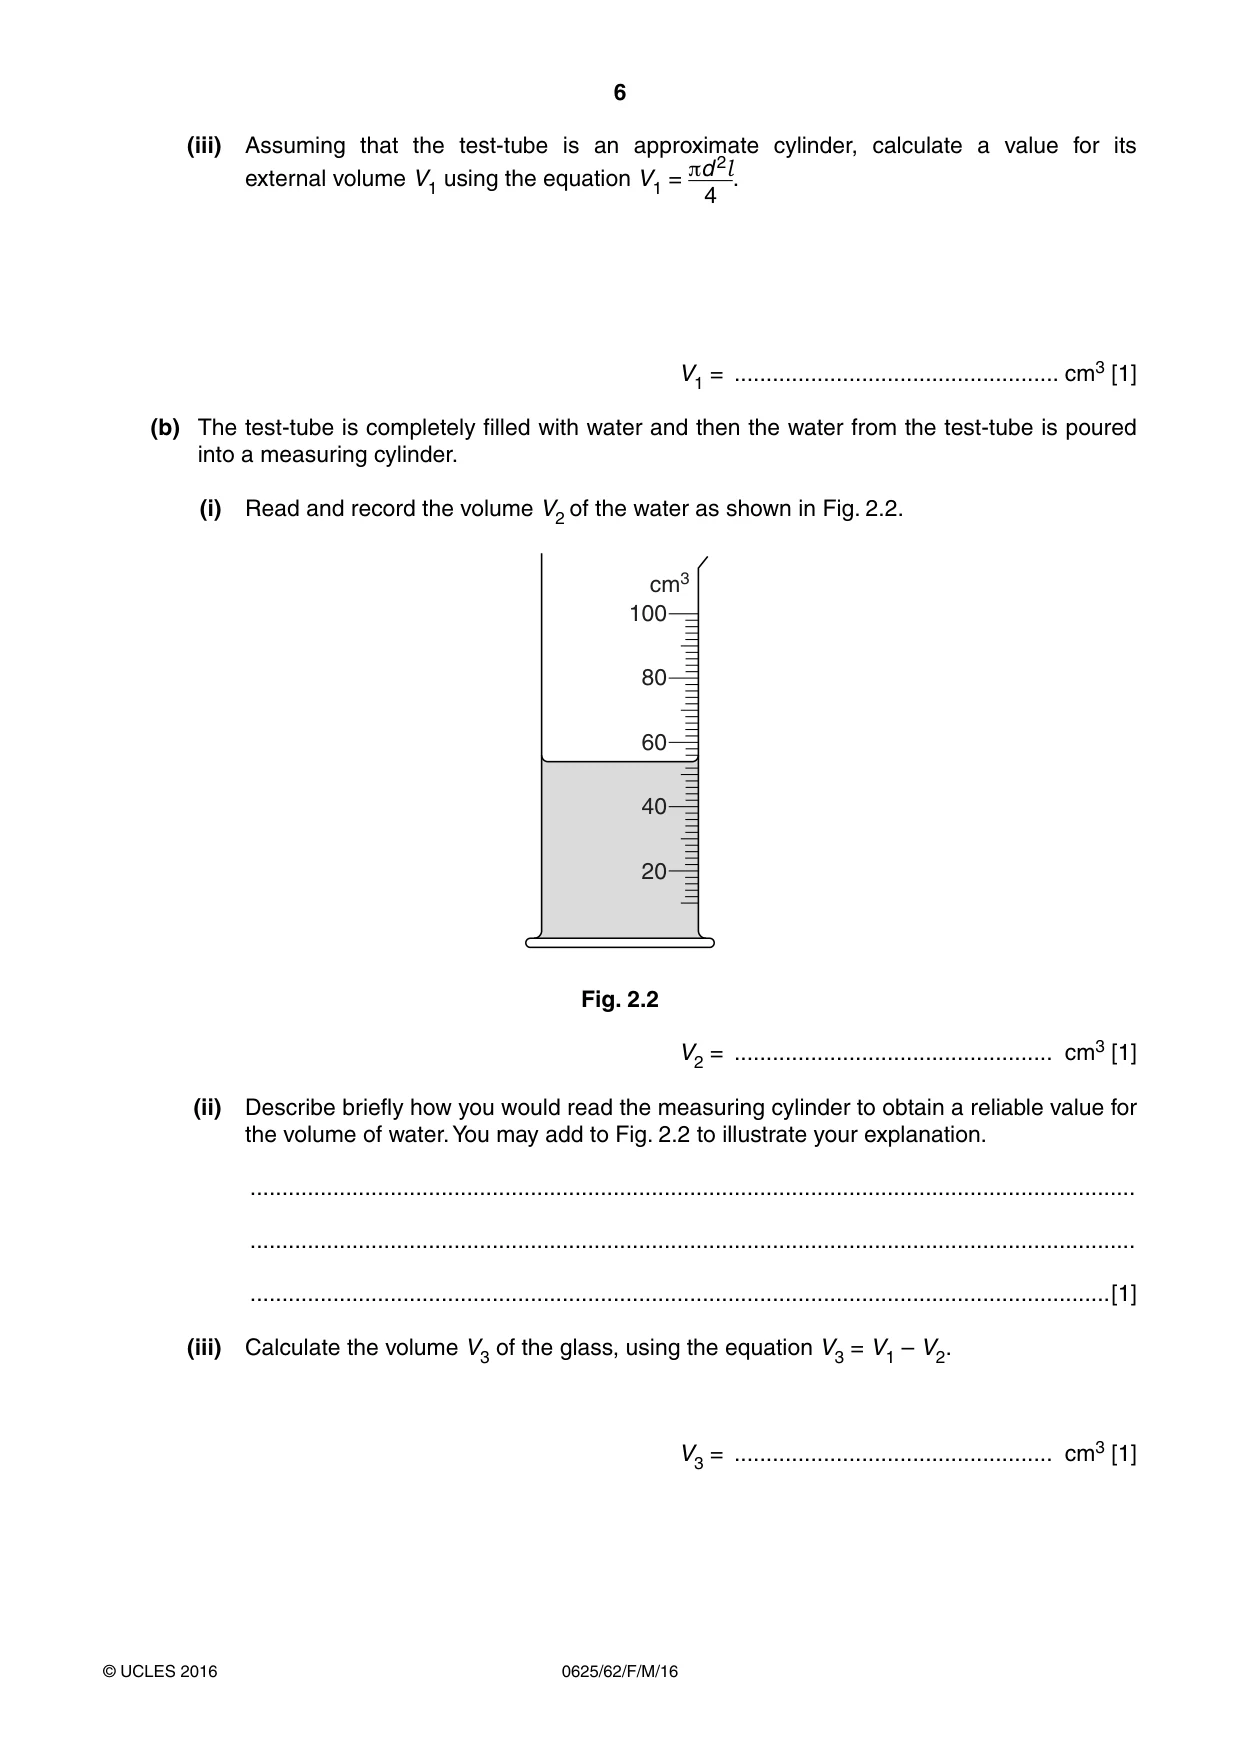
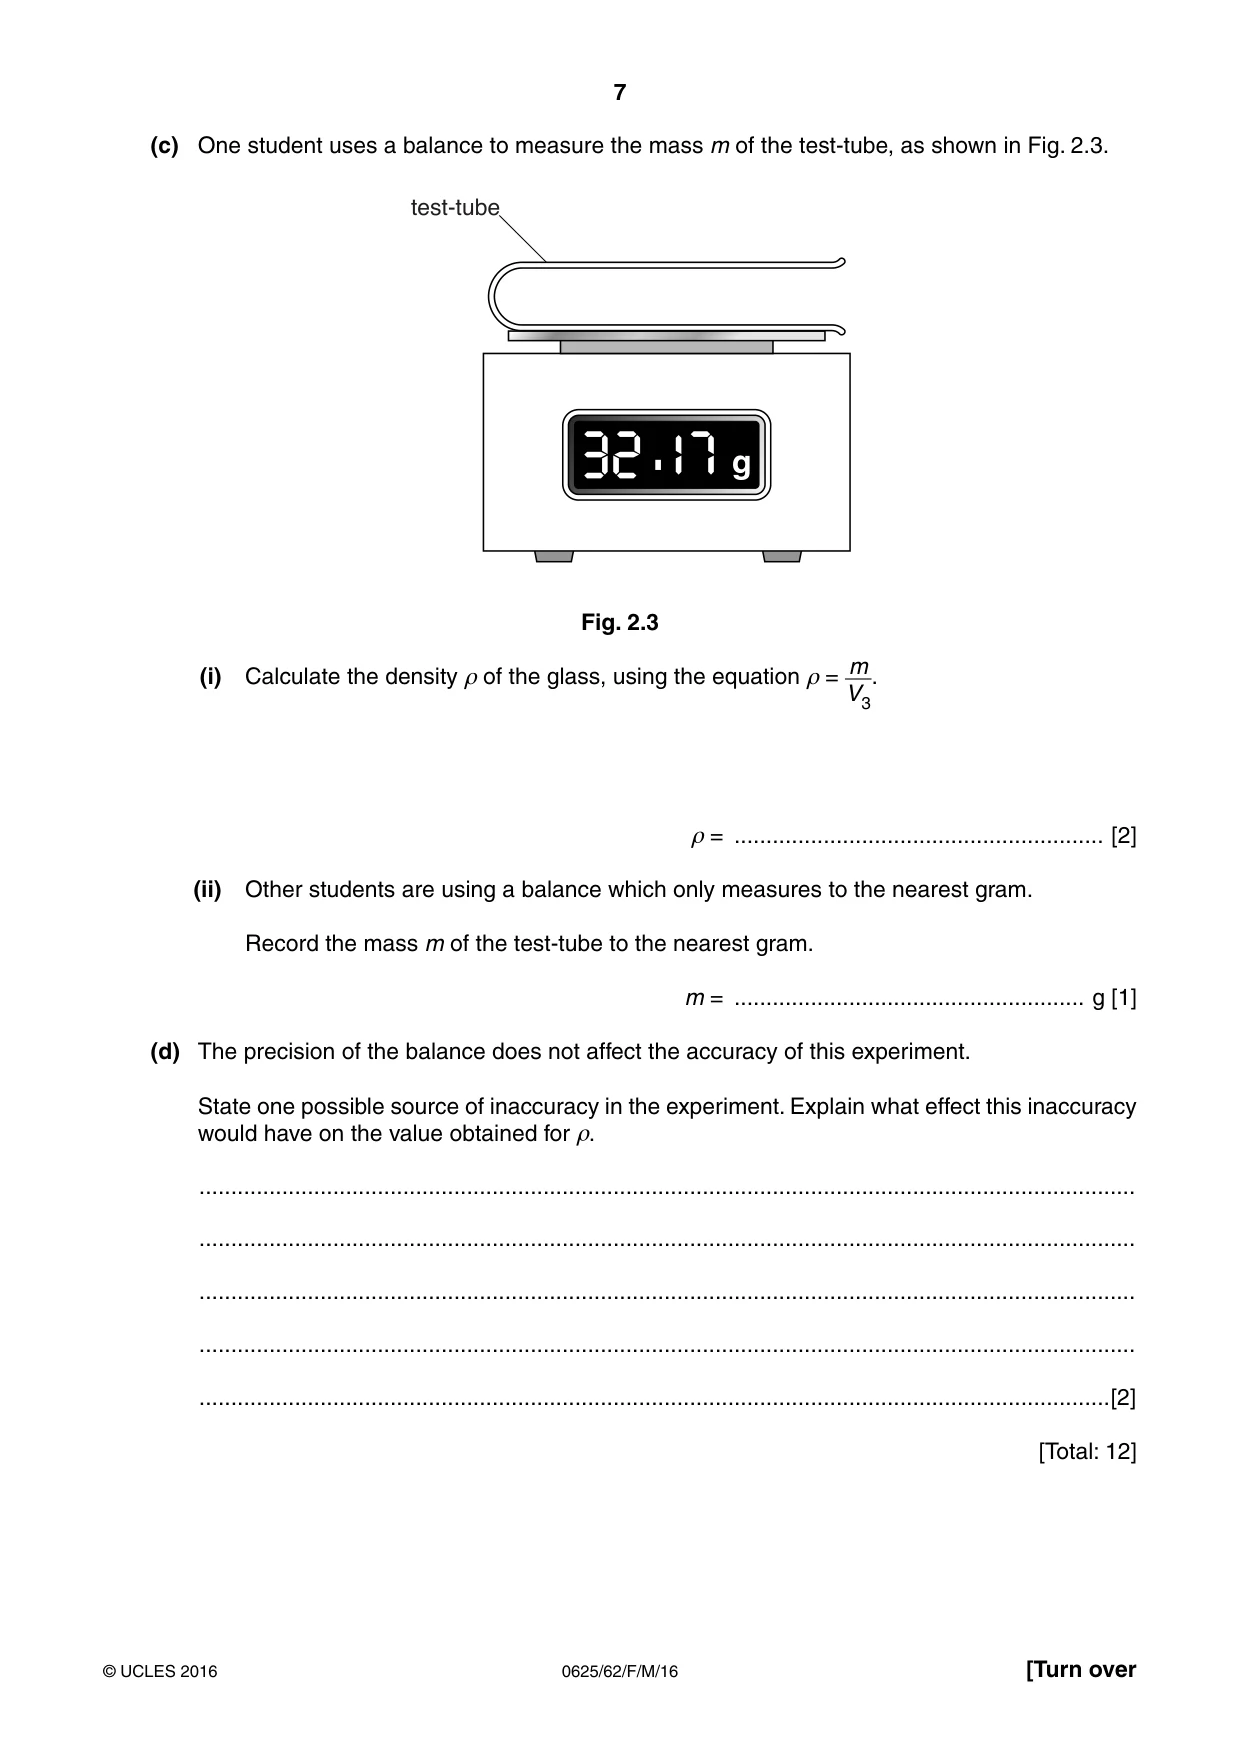
2 The class is carrying out an experiment to determine the density of glass. Each student has a test-tube, as shown in Fig. 2.1. glass test-tube d l Fig. 2.1 (a) (i) • Measure the length l of the test-tube shown in Fig. 2.1. l = ..........................................................cm • Measure the external diameter d of the test-tube. d = ..........................................................cm [1] (ii) A student uses two wooden blocks to help him to measure the diameter d of the test-tube. Describe his method. You may draw a diagram. Include one precaution which could be taken to ensure that the value of d is as reliable as possible. ........................................................................................................................................... ........................................................................................................................................... .......................................................................................................................................[2] (iii) Assuming that the test-tube is an approximate cylinder, calculate a value for its πd 2l external volume V1 using the equation V1 = . 4 V1 = ................................................... cm3 [1] (b) The test-tube is completely filled with water and then the water from the test-tube is poured into a measuring cylinder. (i) Read and record the volume V2 of the water as shown in Fig. 2.2. cm3 100 80 60 40 20 Fig. 2.2 V2 = .................................................. cm3 [1] (ii) Describe briefly how you would read the measuring cylinder to obtain a reliable value for the volume of water. You may add to Fig. 2.2 to illustrate your explanation. ........................................................................................................................................... ........................................................................................................................................... .......................................................................................................................................[1] (iii) Calculate the volume V3 of the glass, using the equation V3 = V1 – V2. V3 = .................................................. cm3 [1] (c) One student uses a balance to measure the mass m of the test-tube, as shown in Fig. 2.3. test-tube g Fig. 2.3 m (i) Calculate the density ρ of the glass, using the equation ρ = . V3 ρ = .......................................................... [2] (ii) Other students are using a balance which only measures to the nearest gram. Record the mass m of the test-tube to the nearest gram. m = ....................................................... g [1] (d) The precision of the balance does not affect the accuracy of this experiment. State one possible source of inaccuracy in the experiment. Explain what effect this inaccuracy would have on the value obtained for ρ. ................................................................................................................................................... ................................................................................................................................................... ................................................................................................................................................... ................................................................................................................................................... ...............................................................................................................................................[2] [Total: 12]
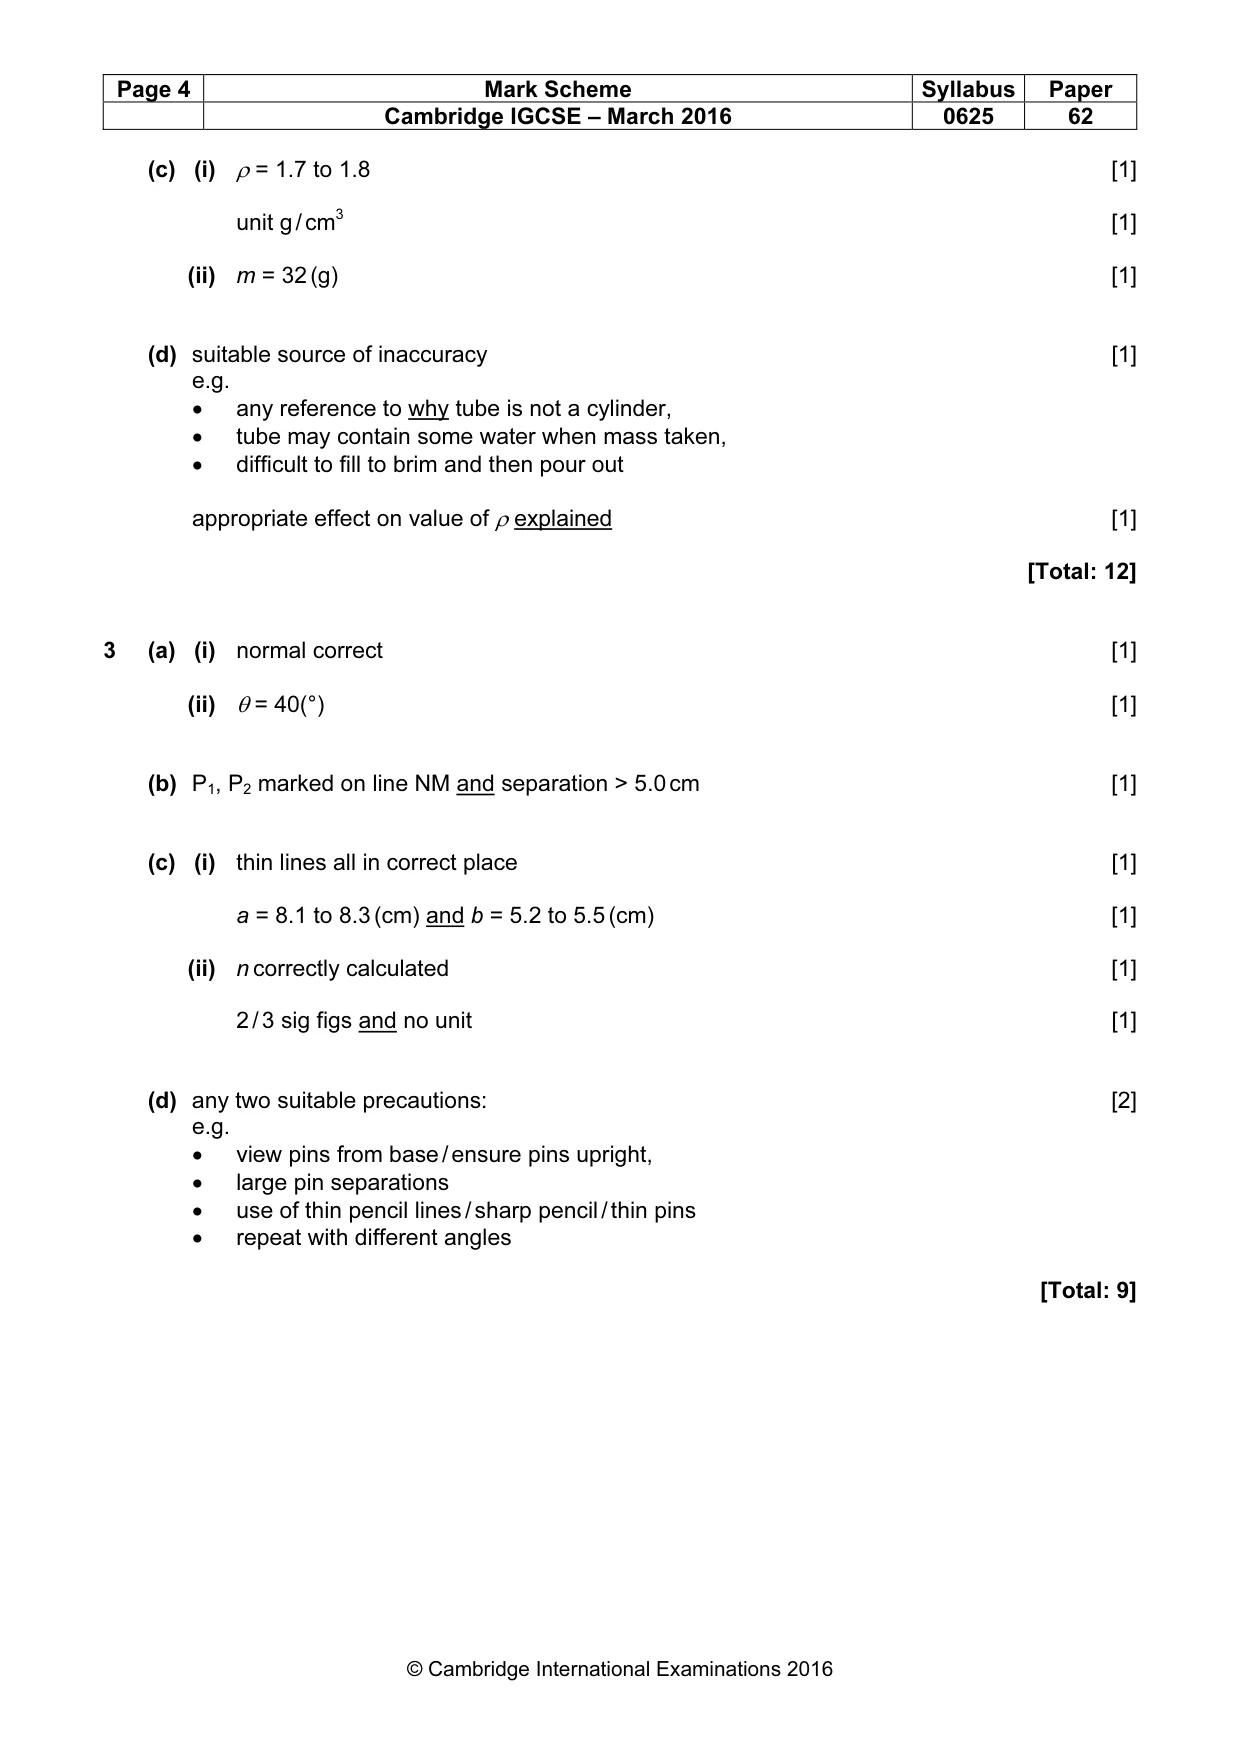
Mark scheme: 2 (a) (i) l = 14.7 AND d = 2.5 [1] (ii) boiling tube between blocks and ruler spanning gap [1] suitable precaution e.g. [1] measure in (at least) 2 places and take average, avoid lip, ensure blocks smooth, no dirt between tube and block (iii) V1 = 72 [1] (b) (i) V2 = 54 [1] (ii) line of sight perpendicular to reading / [1] read from bottom of meniscus (iii) V3 correctly calculated [1] (c) (i) ρ = 1.7 to 1.8 [1] unit g / cm3 [1] (ii) m = 32 (g) [1] (d) suitable source of inaccuracy [1] e.g. • any reference to why tube is not a cylinder, • tube may contain some water when mass taken, • difficult to fill to brim and then pour out appropriate effect on value of ρ explained [1] [Total: 12]
More questions on Physical quantities and measurement techniques
Q3 · A student is investigating the refraction of light by a transparent block
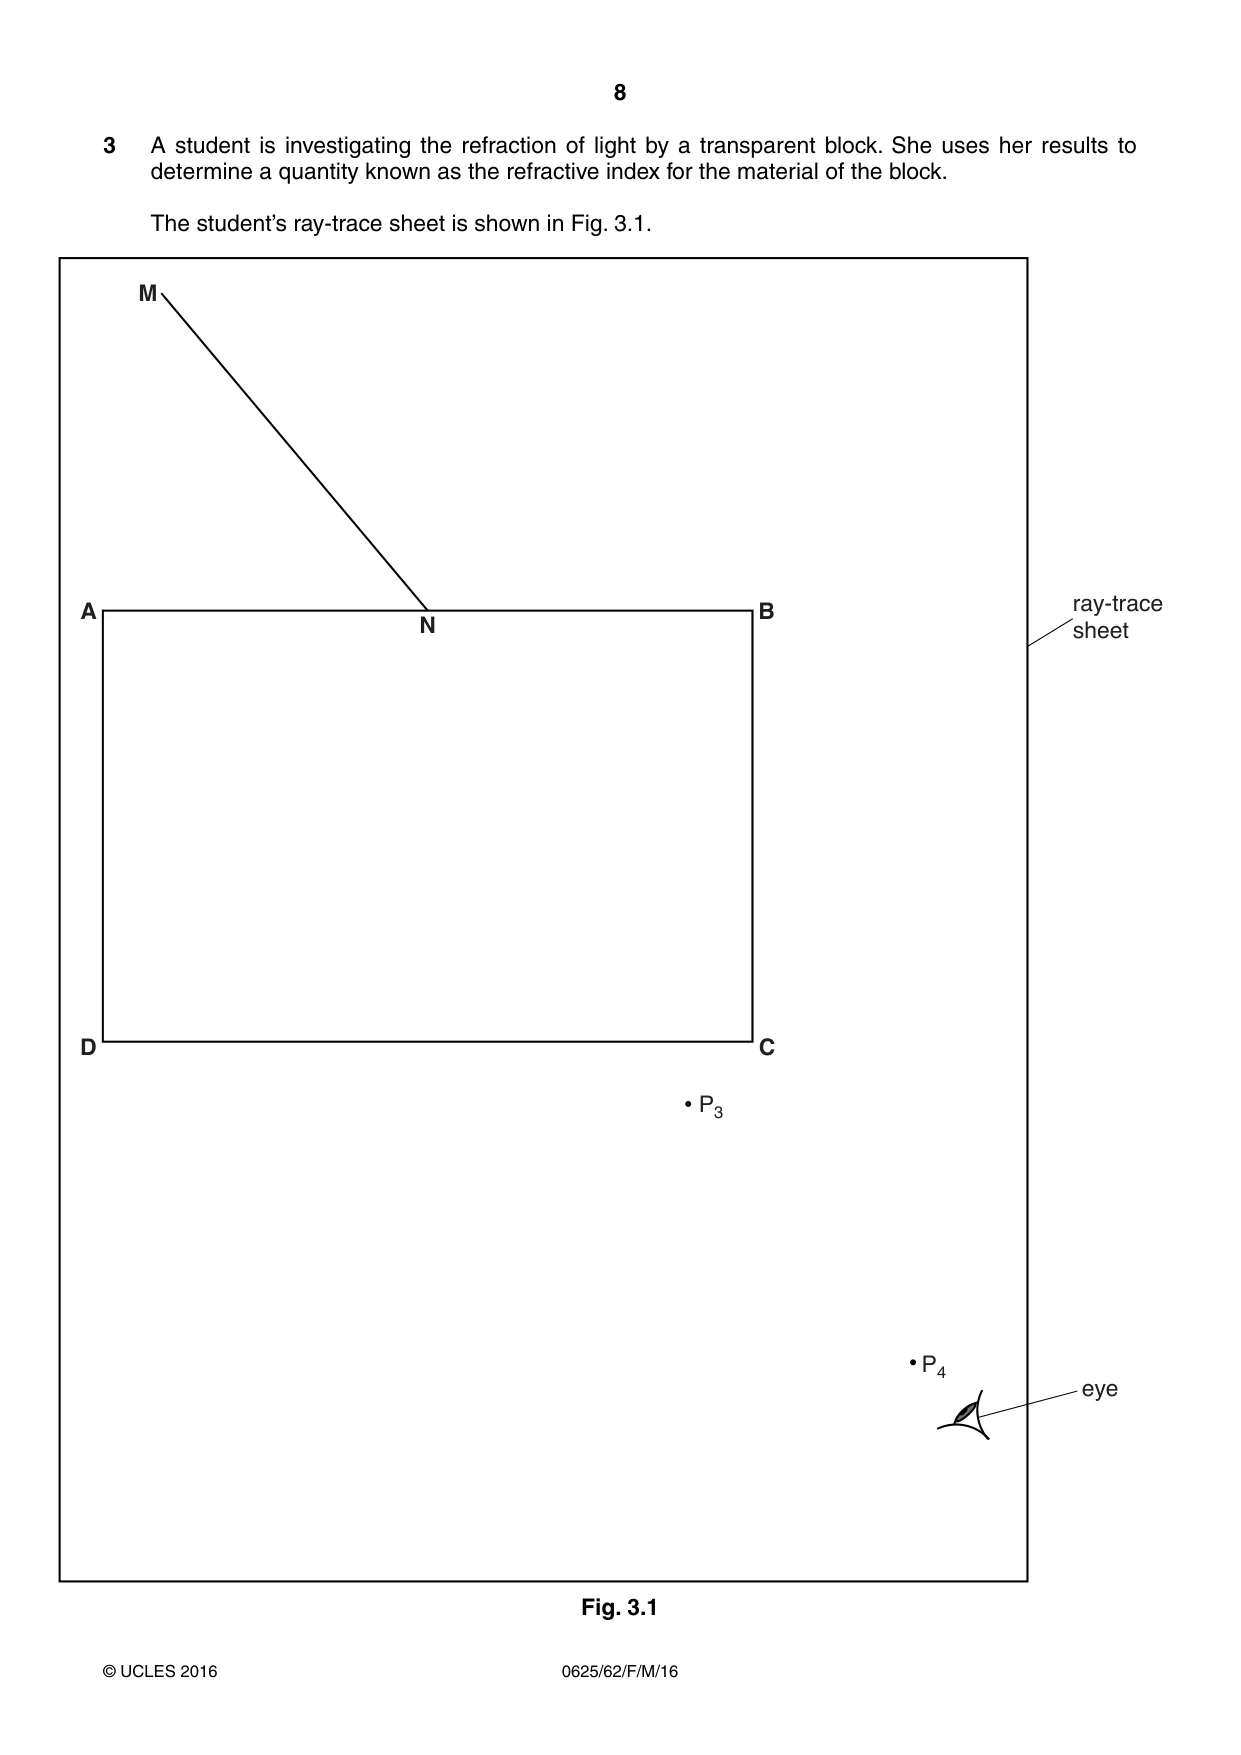
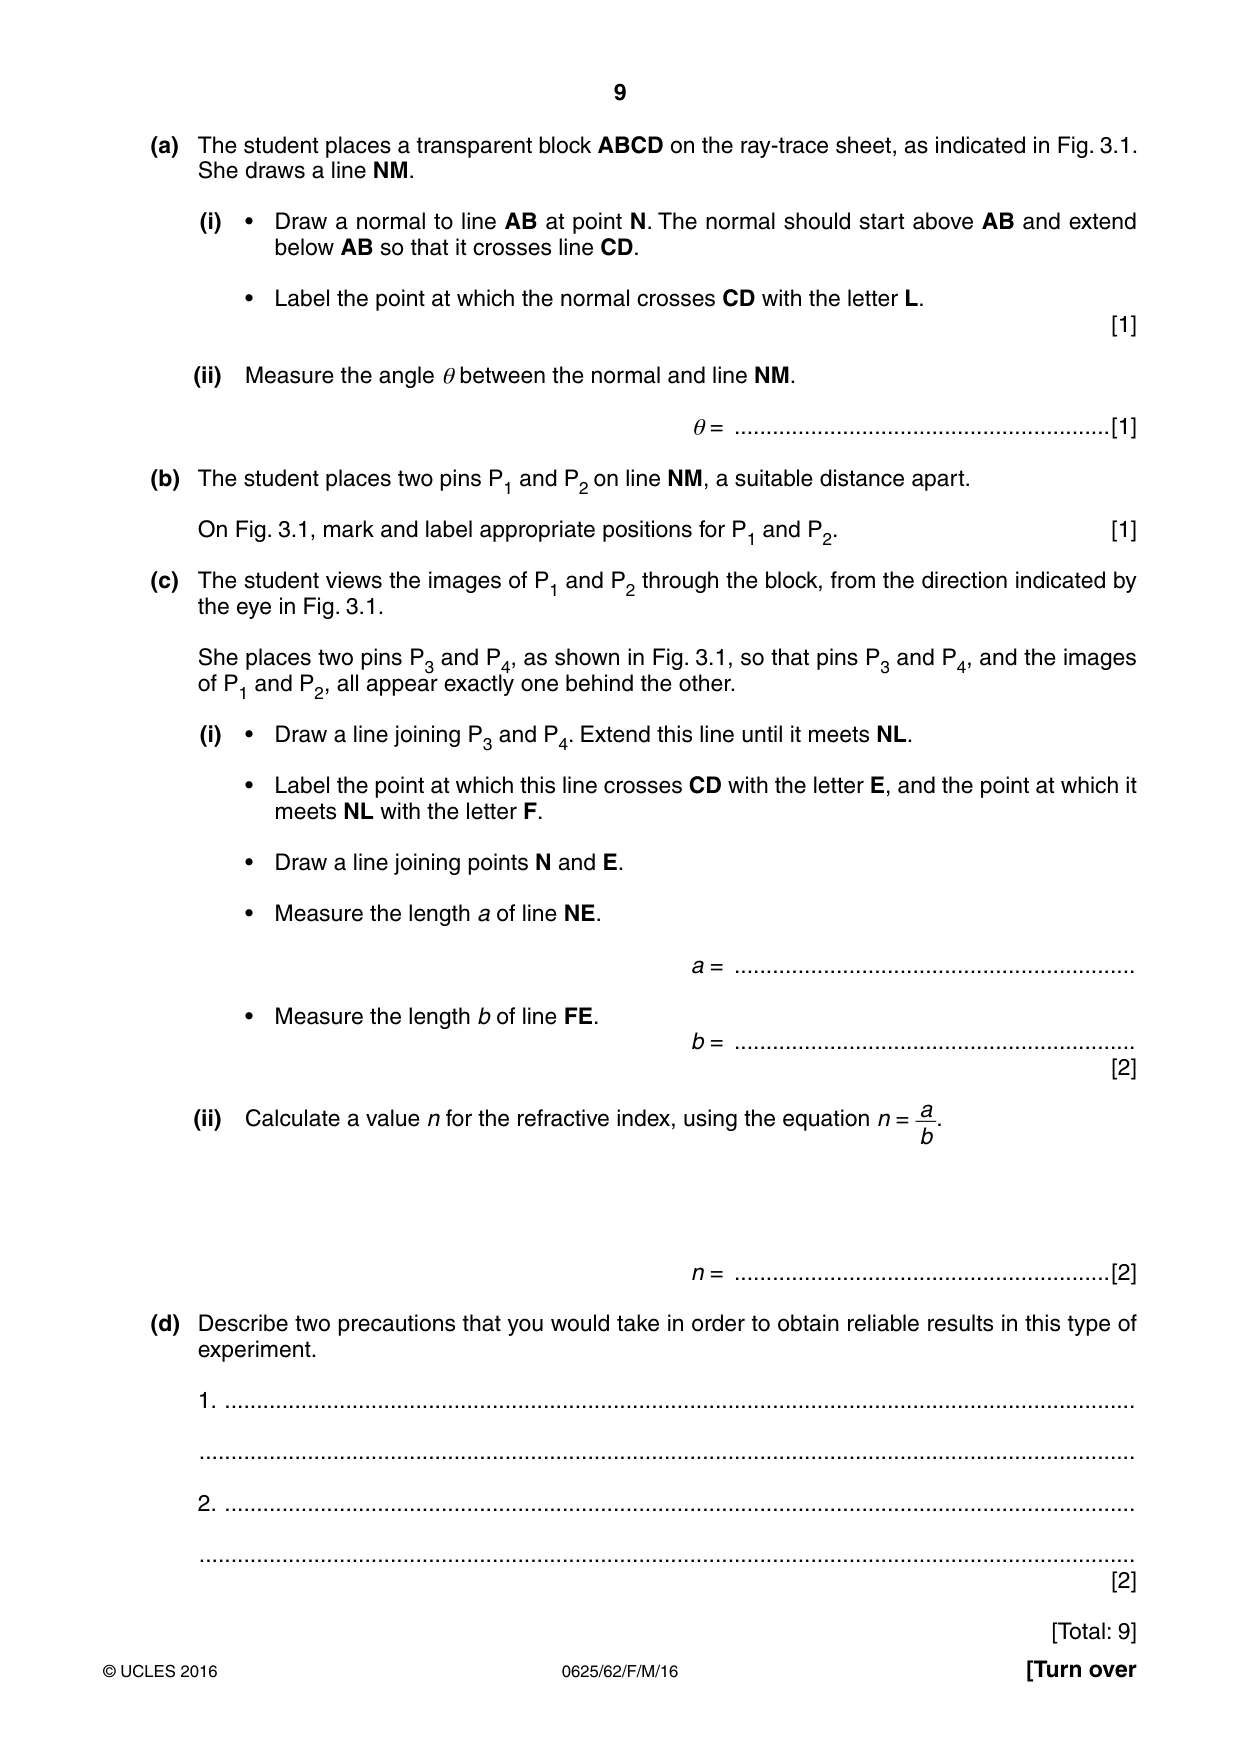
3 A student is investigating the refraction of light by a transparent block. She uses her results to determine a quantity known as the refractive index for the material of the block. The student’s ray-trace sheet is shown in Fig. 3.1. M ray-traceA B N sheet D C P3 P4 eye Fig. 3.1 (a) The student places a transparent block ABCD on the ray-trace sheet, as indicated in Fig. 3.1. She draws a line NM. (i) • Draw a normal to line AB at point N. The normal should start above AB and extend below AB so that it crosses line CD. • Label the point at which the normal crosses CD with the letter L. [1] (ii) Measure the angle θ between the normal and line NM. θ = ...........................................................[1] (b) The student places two pins P1 and P2 on line NM, a suitable distance apart. On Fig. 3.1, mark and label appropriate positions for P1 and P2. [1] (c) The student views the images of P1 and P2 through the block, from the direction indicated by the eye in Fig. 3.1. She places two pins P3 and P4, as shown in Fig. 3.1, so that pins P3 and P4, and the images of P1 and P2, all appear exactly one behind the other. (i) • Draw a line joining P3 and P4. Extend this line until it meets NL. • Label the point at which this line crosses CD with the letter E, and the point at which it meets NL with the letter F. • Draw a line joining points N and E. • Measure the length a of line NE. a = ............................................................... • Measure the length b of line FE. b = ............................................................... [2] a (ii) Calculate a value n for the refractive index, using the equation n = . b n = ...........................................................[2] (d) Describe two precautions that you would take in order to obtain reliable results in this type of experiment. 1. ............................................................................................................................................... ................................................................................................................................................... 2. ............................................................................................................................................... ................................................................................................................................................... [2] [Total: 9]
Mark scheme: 3 (a) (i) normal correct [1] (ii) θ = 40(°) [1] (b) P1, P2 marked on line NM and separation > 5.0 cm [1] (c) (i) thin lines all in correct place [1] a = 8.1 to 8.3 (cm) and b = 5.2 to 5.5 (cm) [1] (ii) n correctly calculated [1] 2 / 3 sig figs and no unit [1] (d) any two suitable precautions: [2] e.g. • view pins from base / ensure pins upright, • large pin separations • use of thin pencil lines / sharp pencil / thin pins • repeat with different angles [Total: 9]
Q4 · A student suggests that the area of the water surface will affect the rate of cooling of…
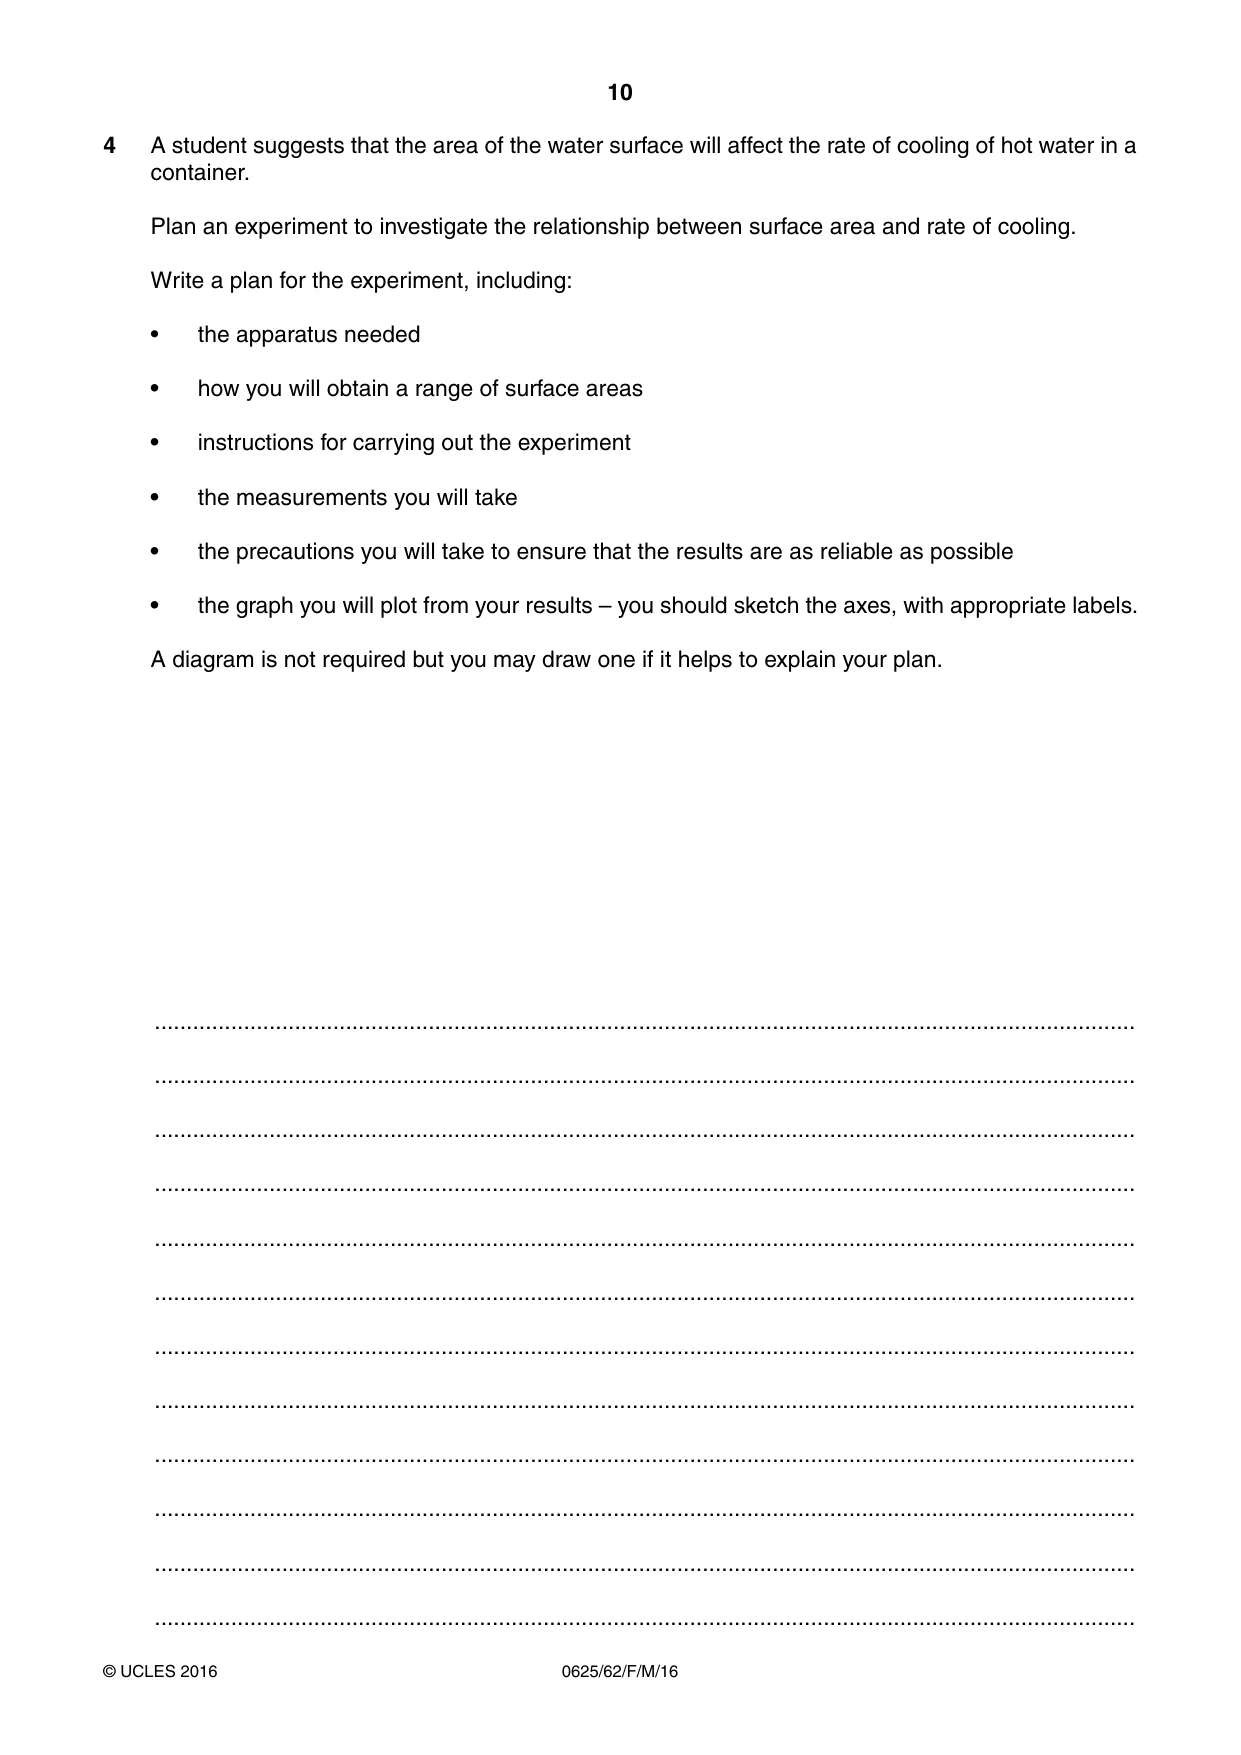
4 A student suggests that the area of the water surface will affect the rate of cooling of hot water in a container. Plan an experiment to investigate the relationship between surface area and rate of cooling. Write a plan for the experiment, including: • the apparatus needed • how you will obtain a range of surface areas • instructions for carrying out the experiment • the measurements you will take • the precautions you will take to ensure that the results are as reliable as possible • the graph you will plot from your results – you should sketch the axes, with appropriate labels. A diagram is not required but you may draw one if it helps to explain your plan. .......................................................................................................................................................... .......................................................................................................................................................... .......................................................................................................................................................... .......................................................................................................................................................... .......................................................................................................................................................... .......................................................................................................................................................... .......................................................................................................................................................... .......................................................................................................................................................... .......................................................................................................................................................... .......................................................................................................................................................... .......................................................................................................................................................... .......................................................................................................................................................... .......................................................................................................................................................... .......................................................................................................................................................... .......................................................................................................................................................... .......................................................................................................................................................... .......................................................................................................................................................... .......................................................................................................................................................... .......................................................................................................................................................... .......................................................................................................................................................... .......................................................................................................................................................... .......................................................................................................................................................... .......................................................................................................................................................... .......................................................................................................................................................... .......................................................................................................................................................... .......................................................................................................................................................... .......................................................................................................................................................... .......................................................................................................................................................... .......................................................................................................................................................... .......................................................................................................................................................... .......................................................................................................................................................... .......................................................................................................................................................... .......................................................................................................................................................... .......................................................................................................................................................... .......................................................................................................................................................... .......................................................................................................................................................... .......................................................................................................................................................... .......................................................................................................................................................... ......................................................................................................................................................[7]
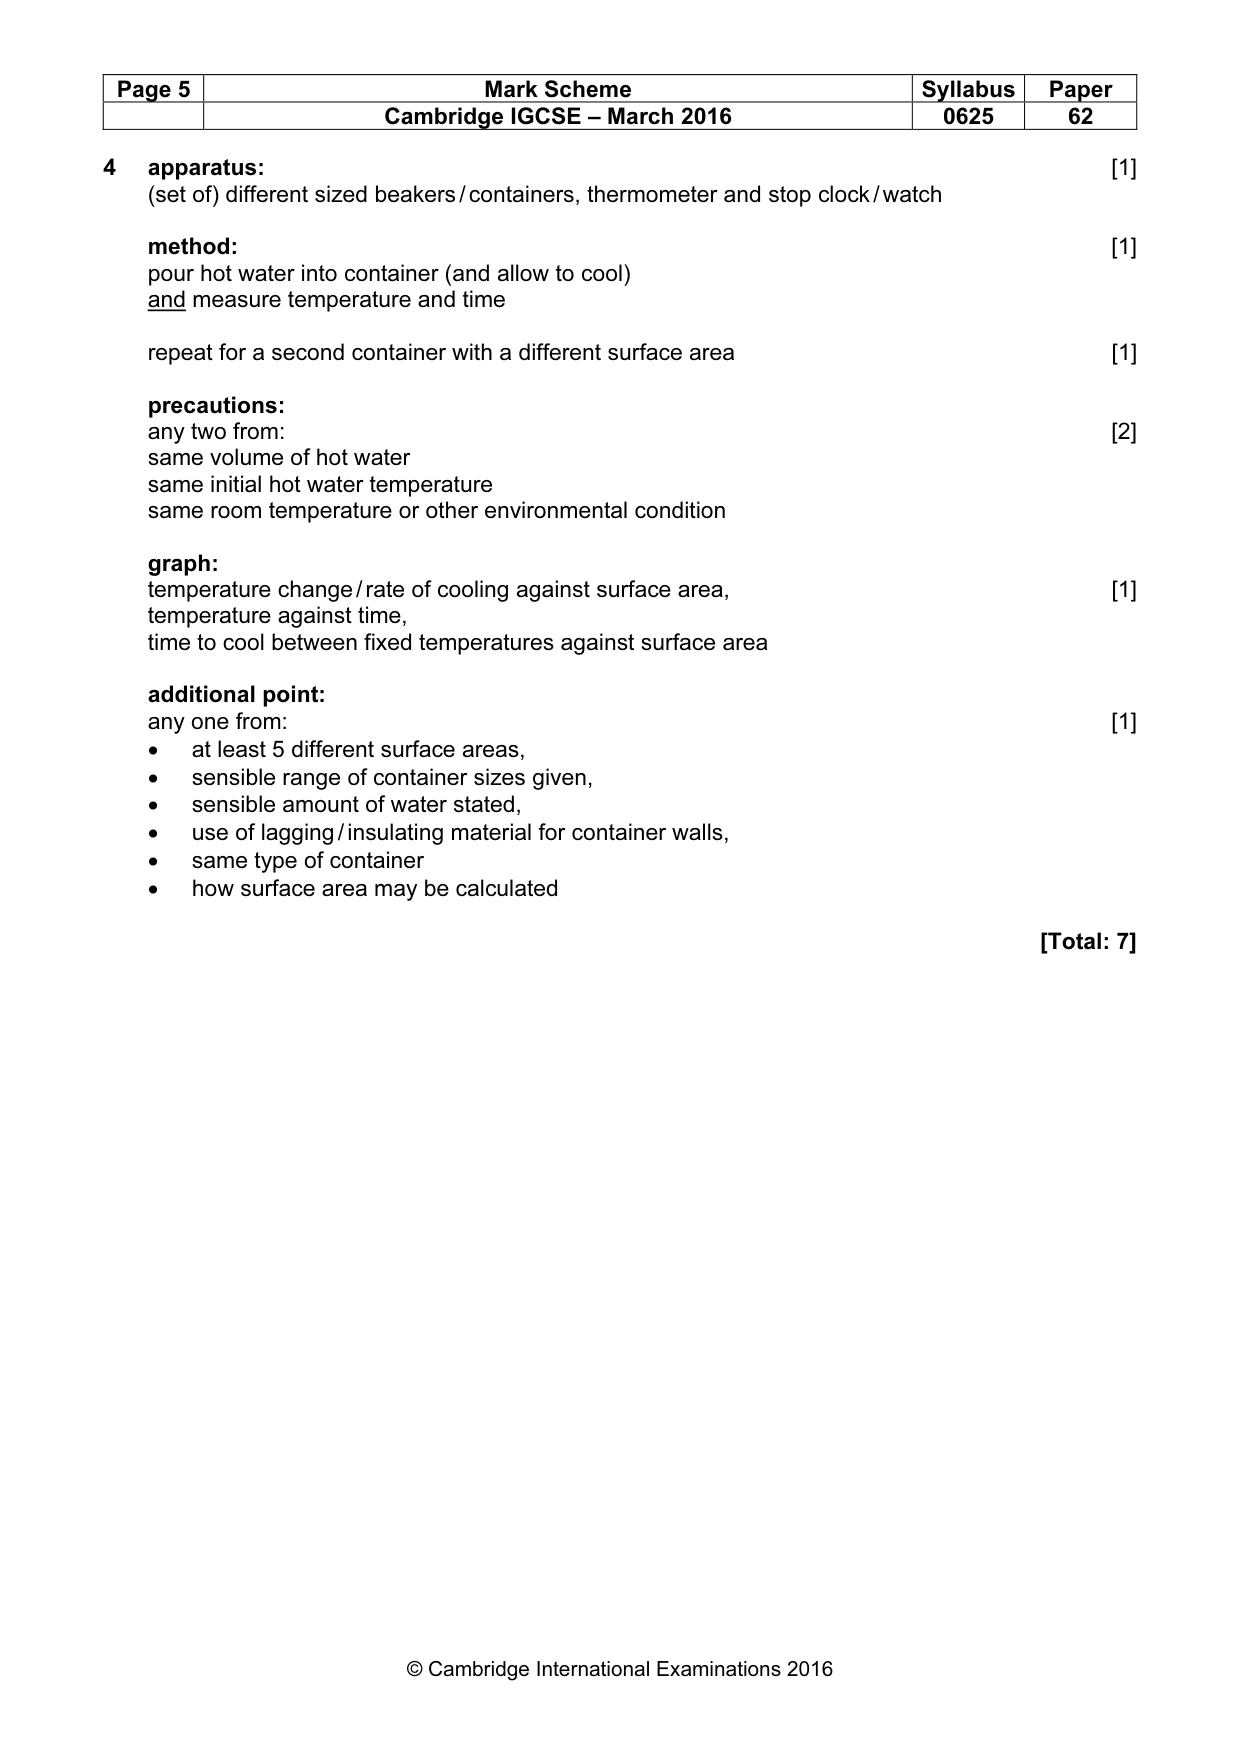
Mark scheme: 4 apparatus: [1] (set of) different sized beakers / containers, thermometer and stop clock / watch method: [1] pour hot water into container (and allow to cool) and measure temperature and time repeat for a second container with a different surface area [1] precautions: any two from: [2] same volume of hot water same initial hot water temperature same room temperature or other environmental condition graph: temperature change / rate of cooling against surface area, [1] temperature against time, time to cool between fixed temperatures against surface area additional point: any one from: [1] • at least 5 different surface areas, • sensible range of container sizes given, • sensible amount of water stated, • use of lagging / insulating material for container walls, • same type of container • how surface area may be calculated [Total: 7]
What was in this paper
The subtopics covered by these 4 questions, and how many questions each got. Open one in a new tab to see every Cambridge question on it.
What you needed in this session
Cambridge’s own grade thresholds for 2016 Feb/March, Paper 6 · Variant 2. A higher threshold means an easier paper — the bar moves with how the cohort did.