Cambridge IGCSE Physical Science 0652 — 2008 Oct/Nov Paper 6 · Variant 0
0652/60/O/N/08
The question paper and its mark scheme, free to read here and free to download. This is Cambridge’s own paper, exactly as it was sat.
Question paper20 pages


Mark scheme
No mark scheme is in the library for this paper.
Paper as text
Question paper, page 1
This document consists of 18 printed pages and 2 blank pages. IB08 11_0652_06/3RP © UCLES 2008 [Turn over *1009150870* For Examiner's Use 1 2 3 4 5 6 Total UNIVERSITY OF CAMBRIDGE INTERNATIONAL EXAMINATIONS International General Certificate of Secondary Education PHYSICAL SCIENCE 0652/06 Paper 6 Alternative to Practical October/November 2008 1 hour Candidates answer on the Question Paper. No Additional Materials are required. READ THESE INSTRUCTIONS FIRST Write your Centre number, candidate number and name on all the work you hand in. Write in dark blue or black pen. You may use a soft pencil for any diagrams or graphs. Do not use staples, paper clips, highlighters, glue or correction fluid. DO NOT WRITE IN ANY BARCODES. Answer all questions. At the end of the examination, fasten all your work securely together. The number of marks is given in brackets [ ] at the end of each question or part question. www.XtremePapers.com
Question paper, page 2
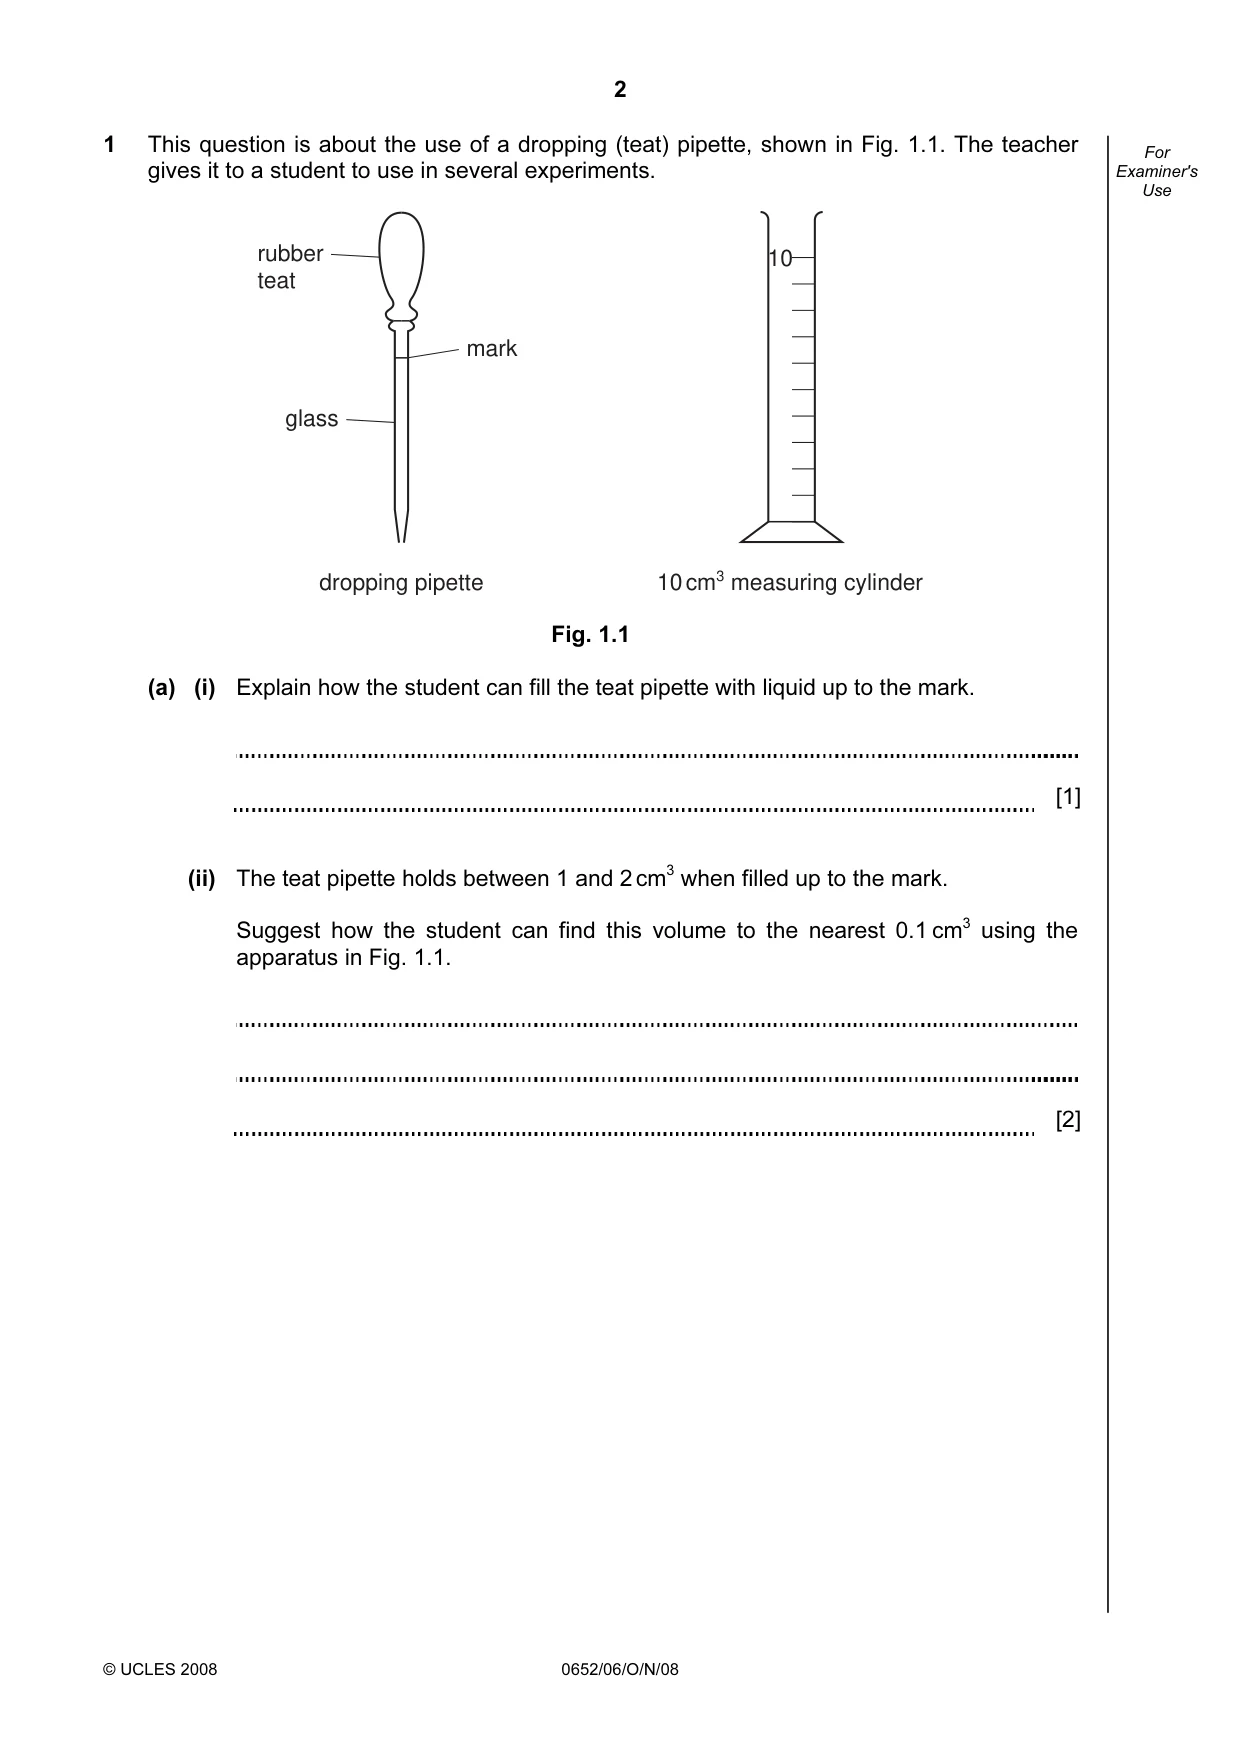
2 © UCLES 2008 0652/06/O/N/08 For Examiner's Use 1 This question is about the use of a dropping (teat) pipette, shown in Fig. 1.1. The teacher gives it to a student to use in several experiments. dropping pipette 10 cm3 measuring cylinder glass rubber teat mark 10 Fig. 1.1 (a) (i) Explain how the student can fill the teat pipette with liquid up to the mark. [1] (ii) The teat pipette holds between 1 and 2 cm3 when filled up to the mark. Suggest how the student can find this volume to the nearest 0.1 cm3 using the apparatus in Fig. 1.1. [2]
Question paper, page 3
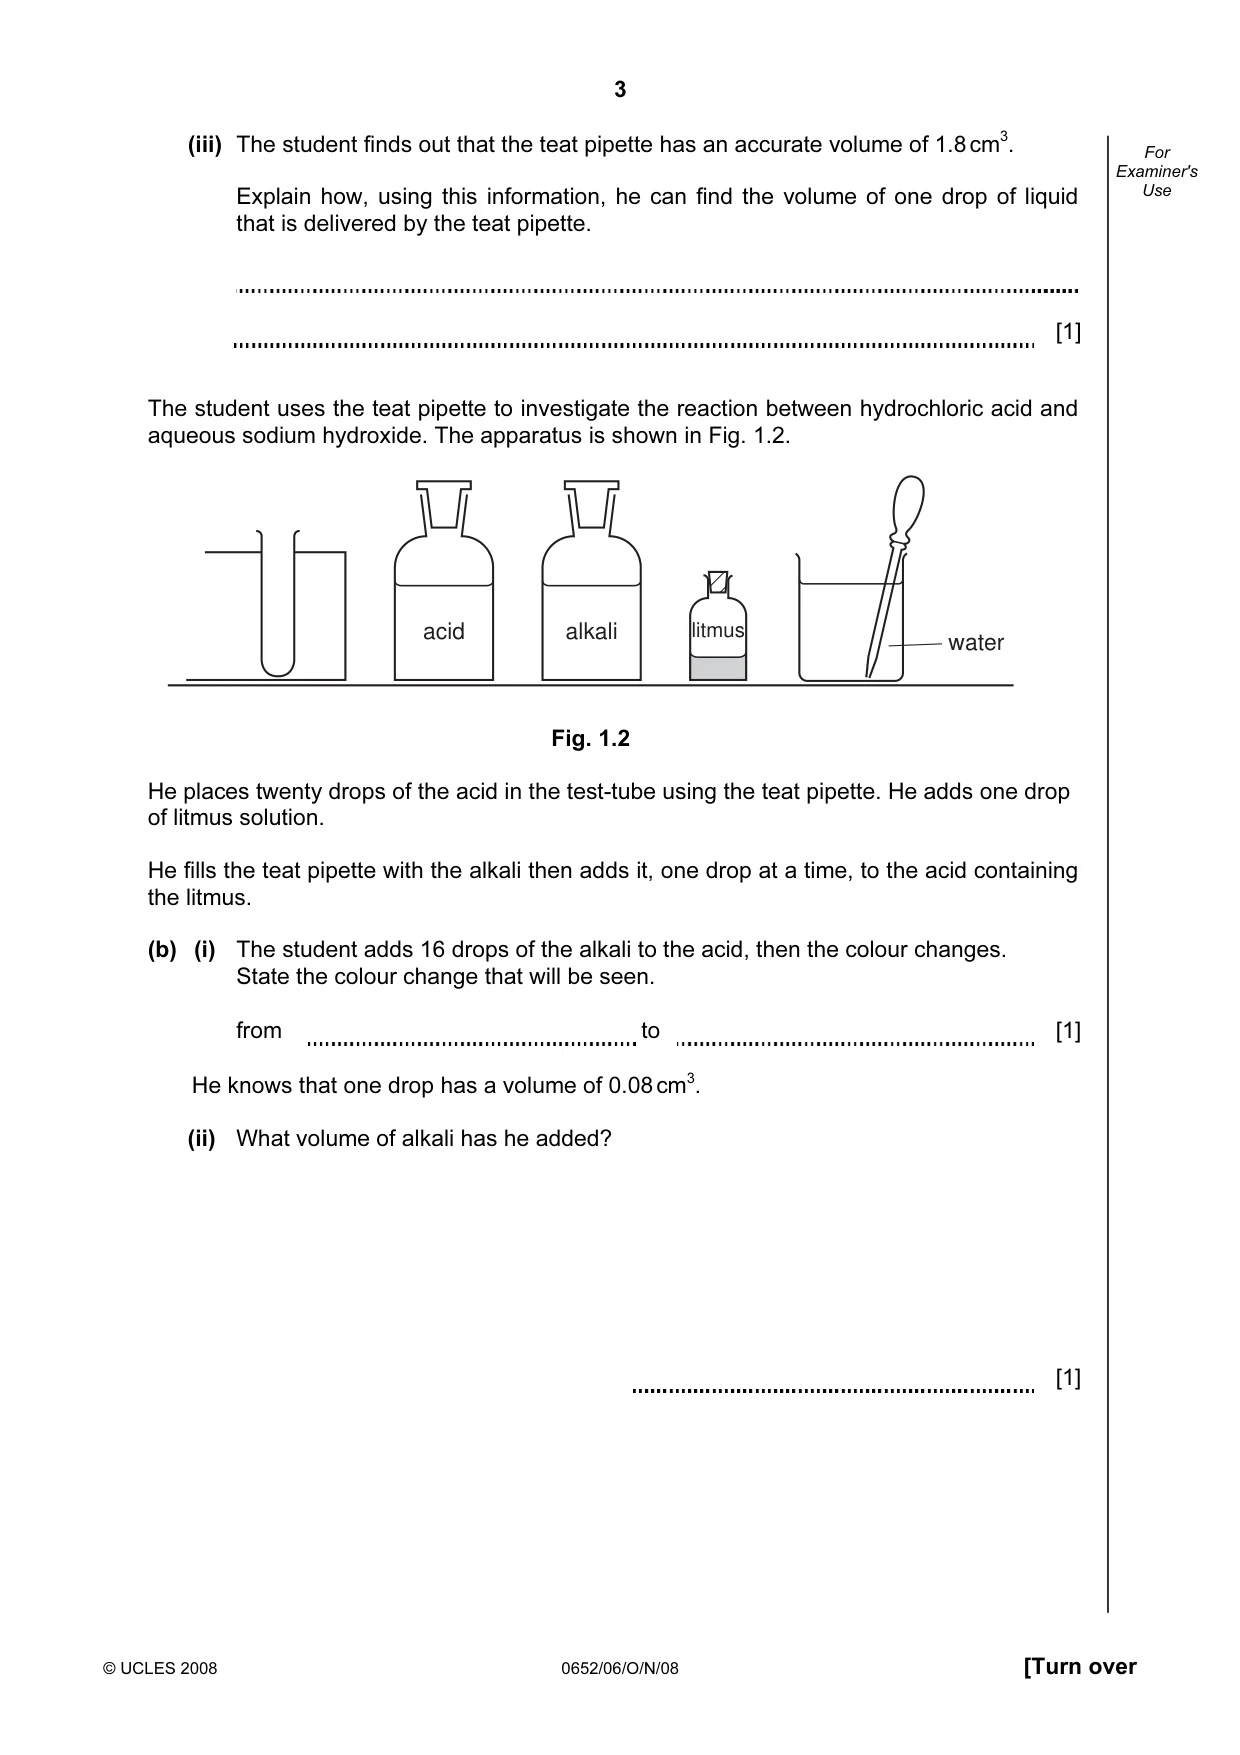
3 © UCLES 2008 0652/06/O/N/08 [Turn over For Examiner's Use (iii) The student finds out that the teat pipette has an accurate volume of 1.8 cm3. Explain how, using this information, he can find the volume of one drop of liquid that is delivered by the teat pipette. [1] The student uses the teat pipette to investigate the reaction between hydrochloric acid and aqueous sodium hydroxide. The apparatus is shown in Fig. 1.2. water acid alkali litmus Fig. 1.2 He places twenty drops of the acid in the test-tube using the teat pipette. He adds one drop of litmus solution. He fills the teat pipette with the alkali then adds it, one drop at a time, to the acid containing the litmus. (b) (i) The student adds 16 drops of the alkali to the acid, then the colour changes. State the colour change that will be seen. from to [1] He knows that one drop has a volume of 0.08 cm3. (ii) What volume of alkali has he added? [1]
Question paper, page 4
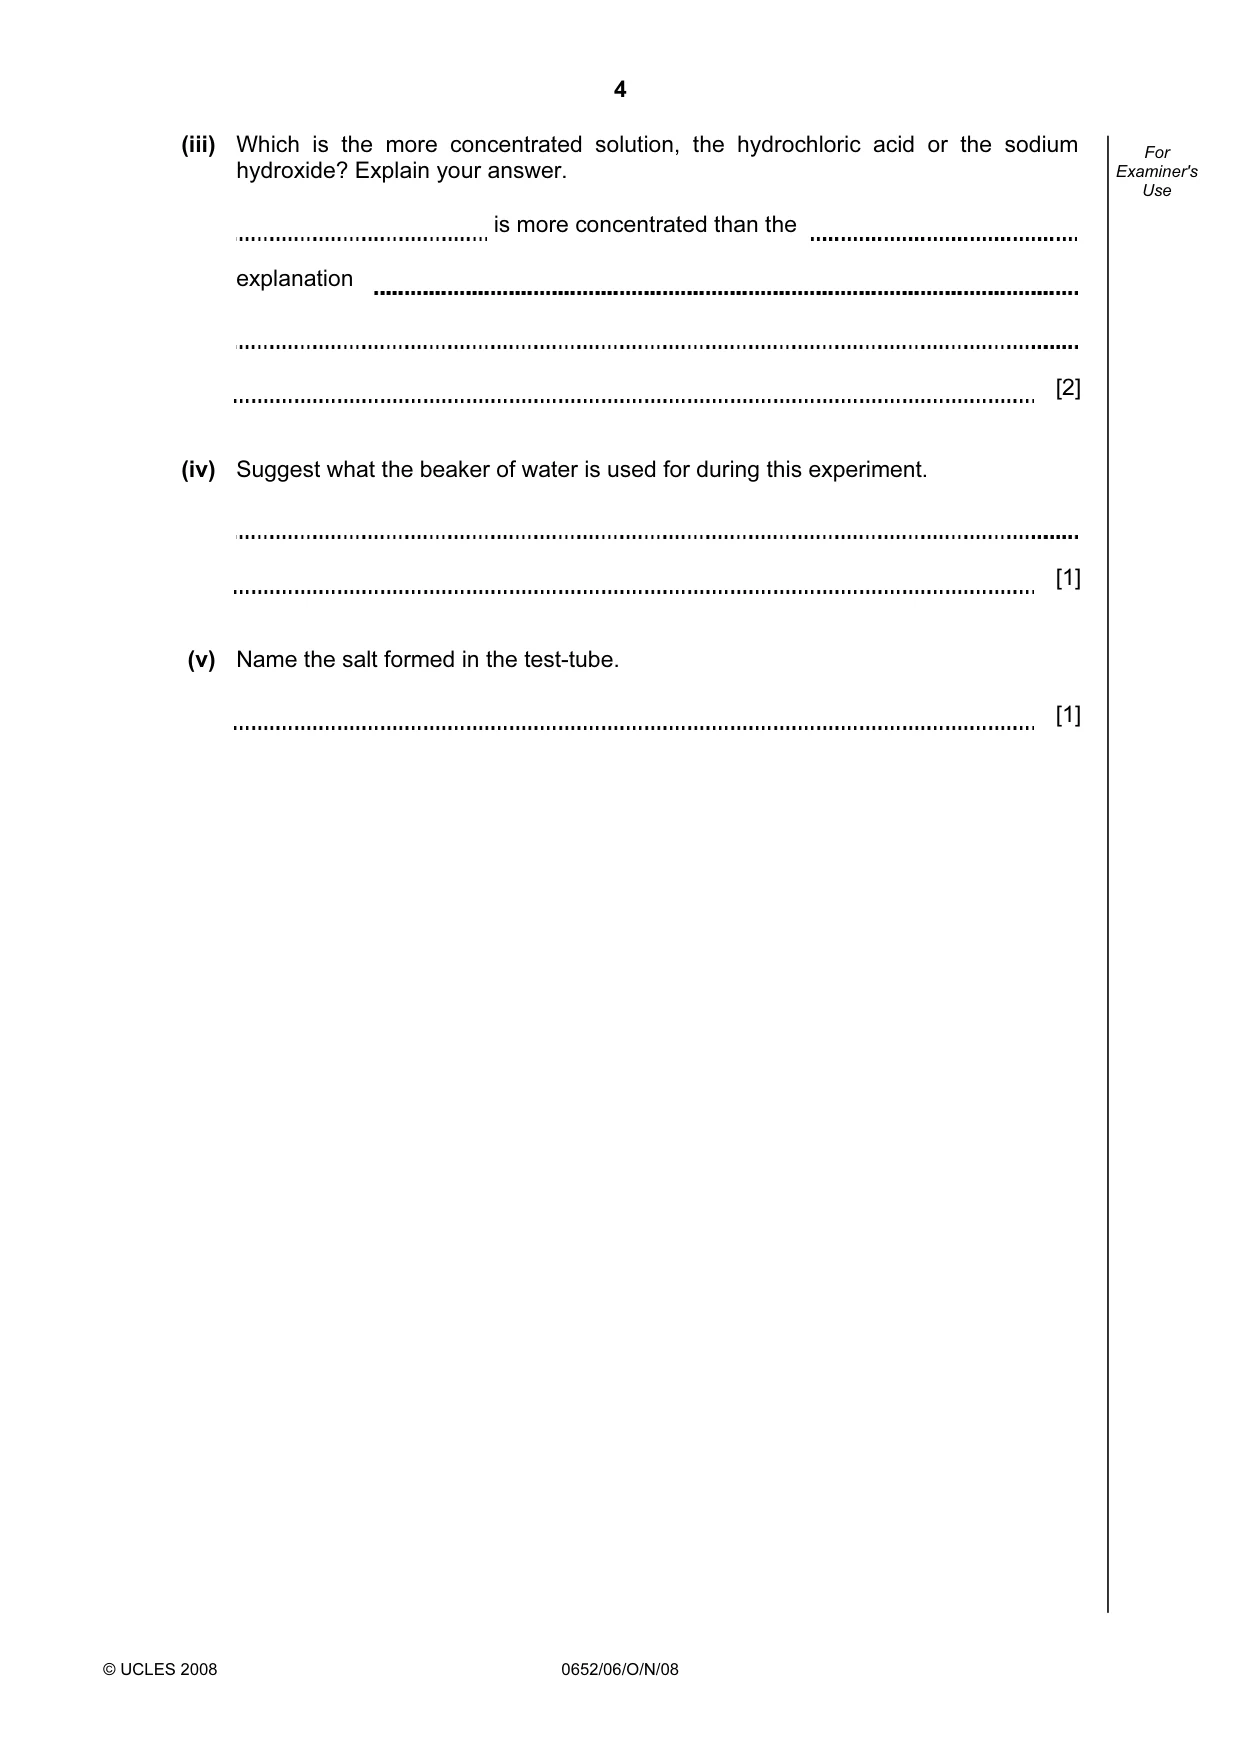
4 © UCLES 2008 0652/06/O/N/08 For Examiner's Use (iii) Which is the more concentrated solution, the hydrochloric acid or the sodium hydroxide? Explain your answer. is more concentrated than the explanation [2] (iv) Suggest what the beaker of water is used for during this experiment. [1] (v) Name the salt formed in the test-tube. [1]
Question paper, page 5
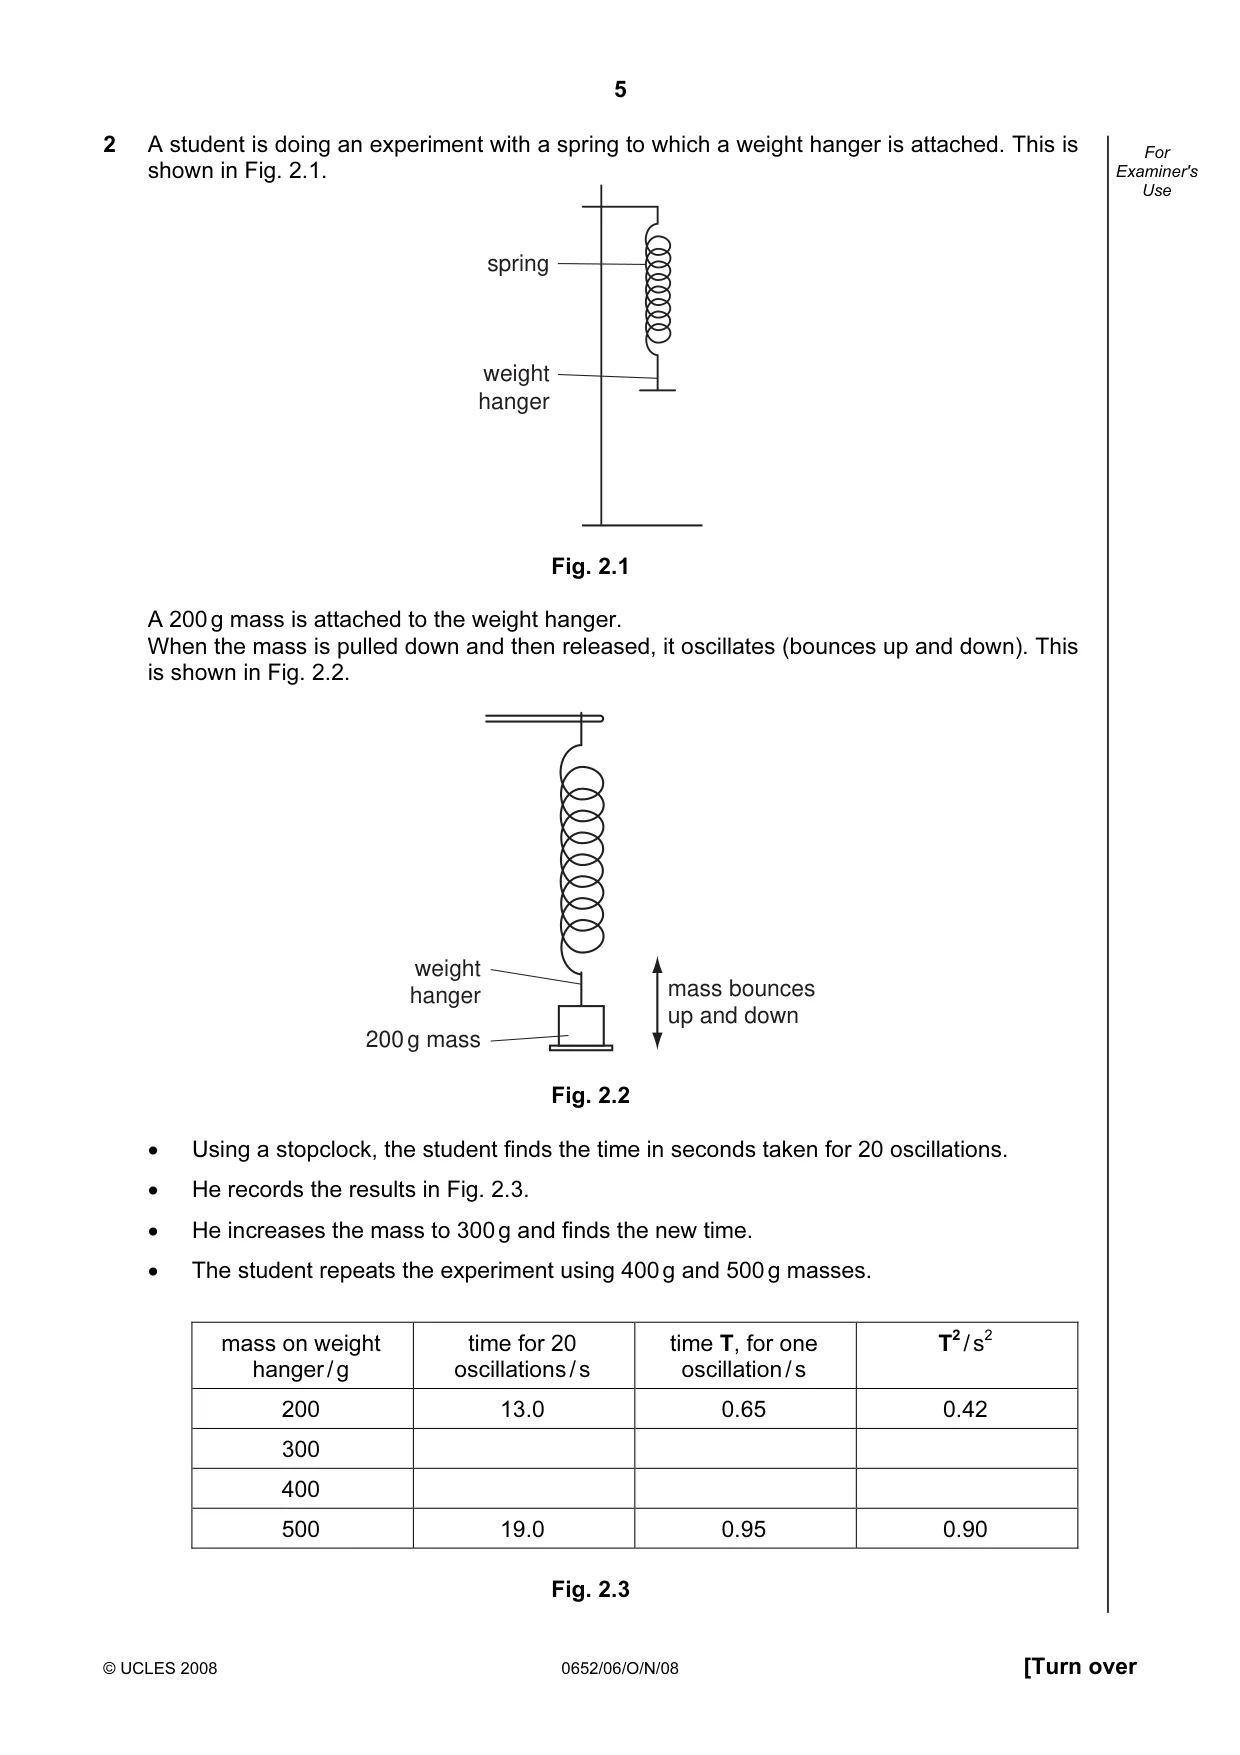
5 © UCLES 2008 0652/06/O/N/08 [Turn over For Examiner's Use 2 A student is doing an experiment with a spring to which a weight hanger is attached. This is shown in Fig. 2.1. spring weight hanger Fig. 2.1 A 200 g mass is attached to the weight hanger. When the mass is pulled down and then released, it oscillates (bounces up and down). This is shown in Fig. 2.2. weight hanger 200 g mass mass bounces up and down Fig. 2.2 • Using a stopclock, the student finds the time in seconds taken for 20 oscillations. • He records the results in Fig. 2.3. • He increases the mass to 300 g and finds the new time. • The student repeats the experiment using 400 g and 500 g masses. mass on weight hanger / g time for 20 oscillations / s time T, for one oscillation / s T2 / s2 200 13.0 0.65 0.42 300 400 500 19.0 0.95 0.90 Fig. 2.3
Question paper, page 6
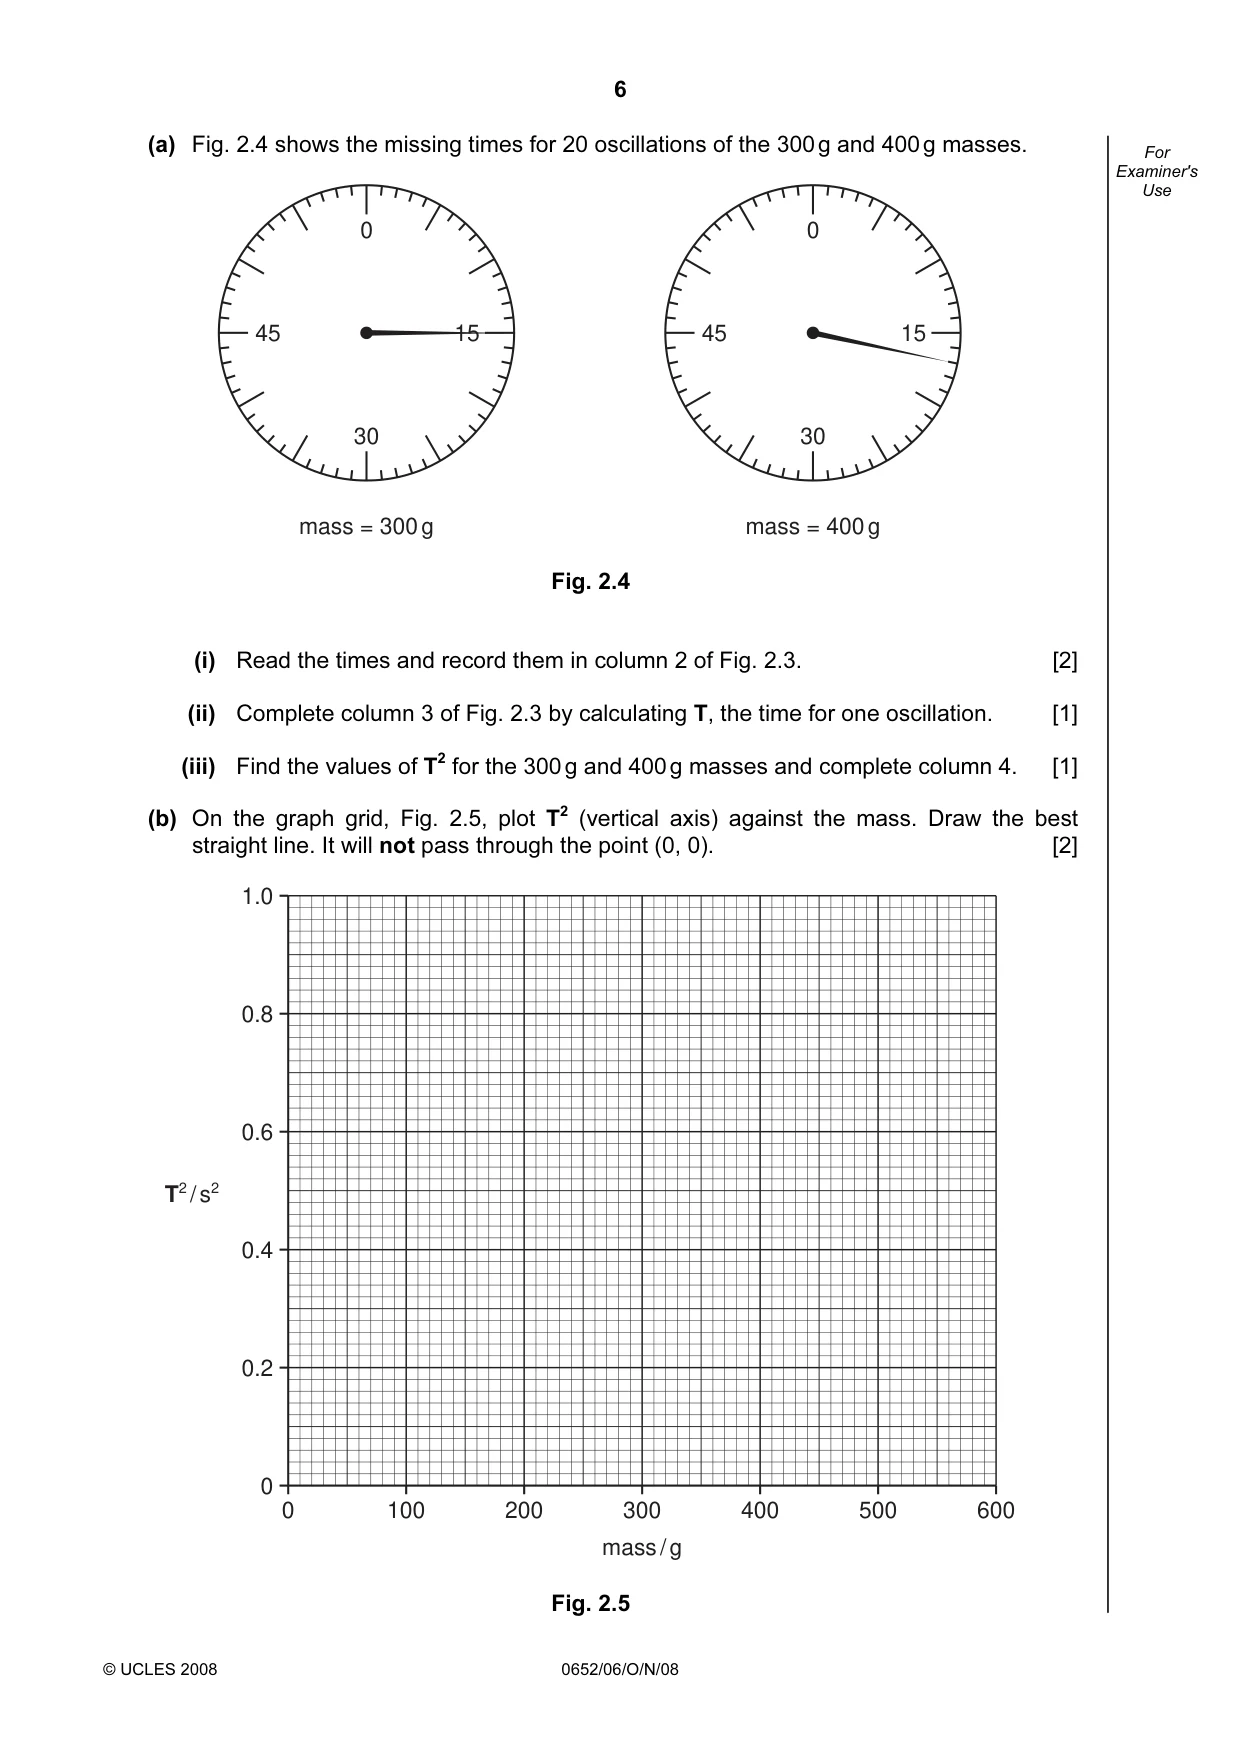
6 © UCLES 2008 0652/06/O/N/08 For Examiner's Use (a) Fig. 2.4 shows the missing times for 20 oscillations of the 300 g and 400 g masses. 0 30 45 15 mass = 300 g 0 30 45 15 mass = 400 g Fig. 2.4 (i) Read the times and record them in column 2 of Fig. 2.3. [2] (ii) Complete column 3 of Fig. 2.3 by calculating T, the time for one oscillation. [1] (iii) Find the values of T2 for the 300 g and 400 g masses and complete column 4. [1] (b) On the graph grid, Fig. 2.5, plot T2 (vertical axis) against the mass. Draw the best straight line. It will not pass through the point (0, 0). [2] 0 100 200 300 mass / g 400 500 600 1.0 0.8 0.6 0.4 0.2 0 T2 / s2 Fig. 2.5
Question paper, page 7
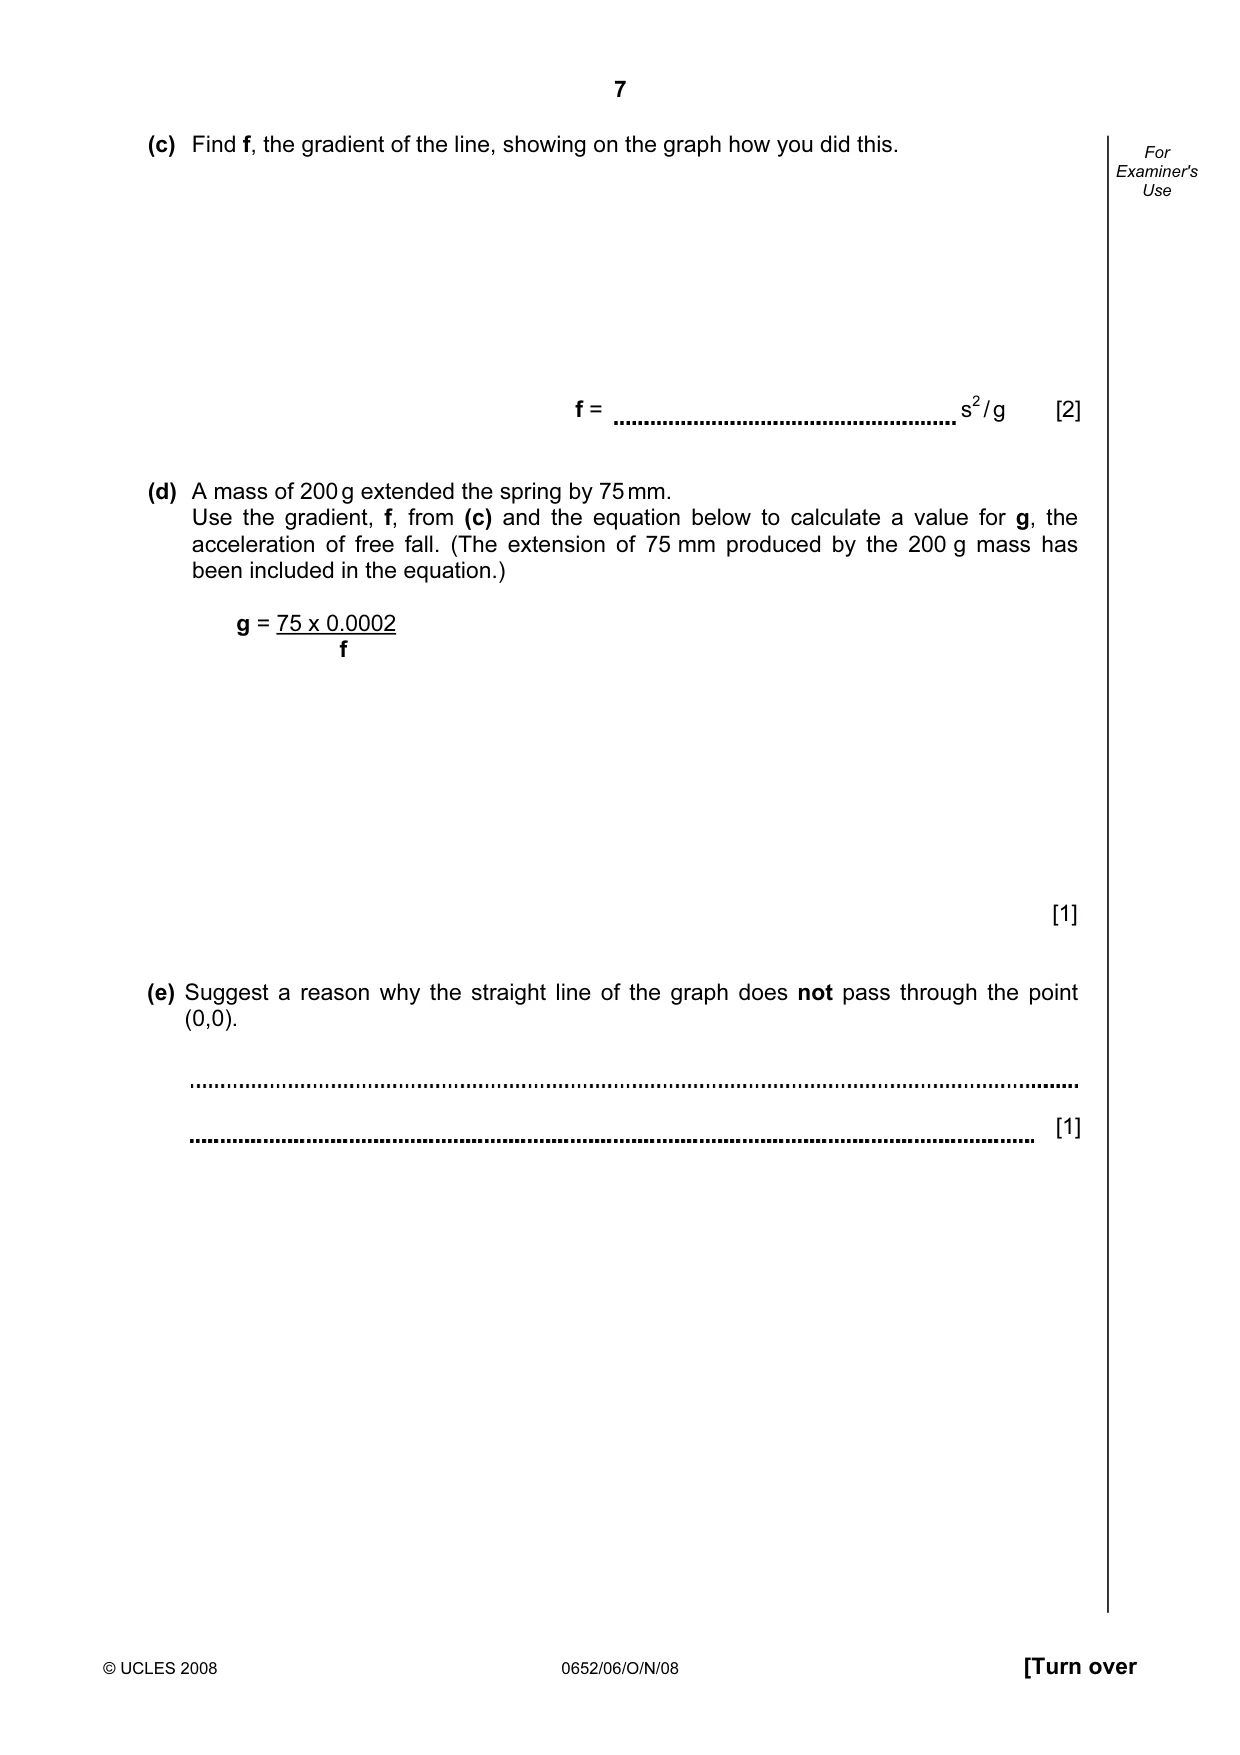
7 © UCLES 2008 0652/06/O/N/08 [Turn over For Examiner's Use (c) Find f, the gradient of the line, showing on the graph how you did this. f = s2 / g [2] (d) A mass of 200 g extended the spring by 75 mm. Use the gradient, f, from (c) and the equation below to calculate a value for g, the acceleration of free fall. (The extension of 75 mm produced by the 200 g mass has been included in the equation.) g = 75 x 0.0002 f [1] (e) Suggest a reason why the straight line of the graph does not pass through the point (0,0). [1]
Question paper, page 8
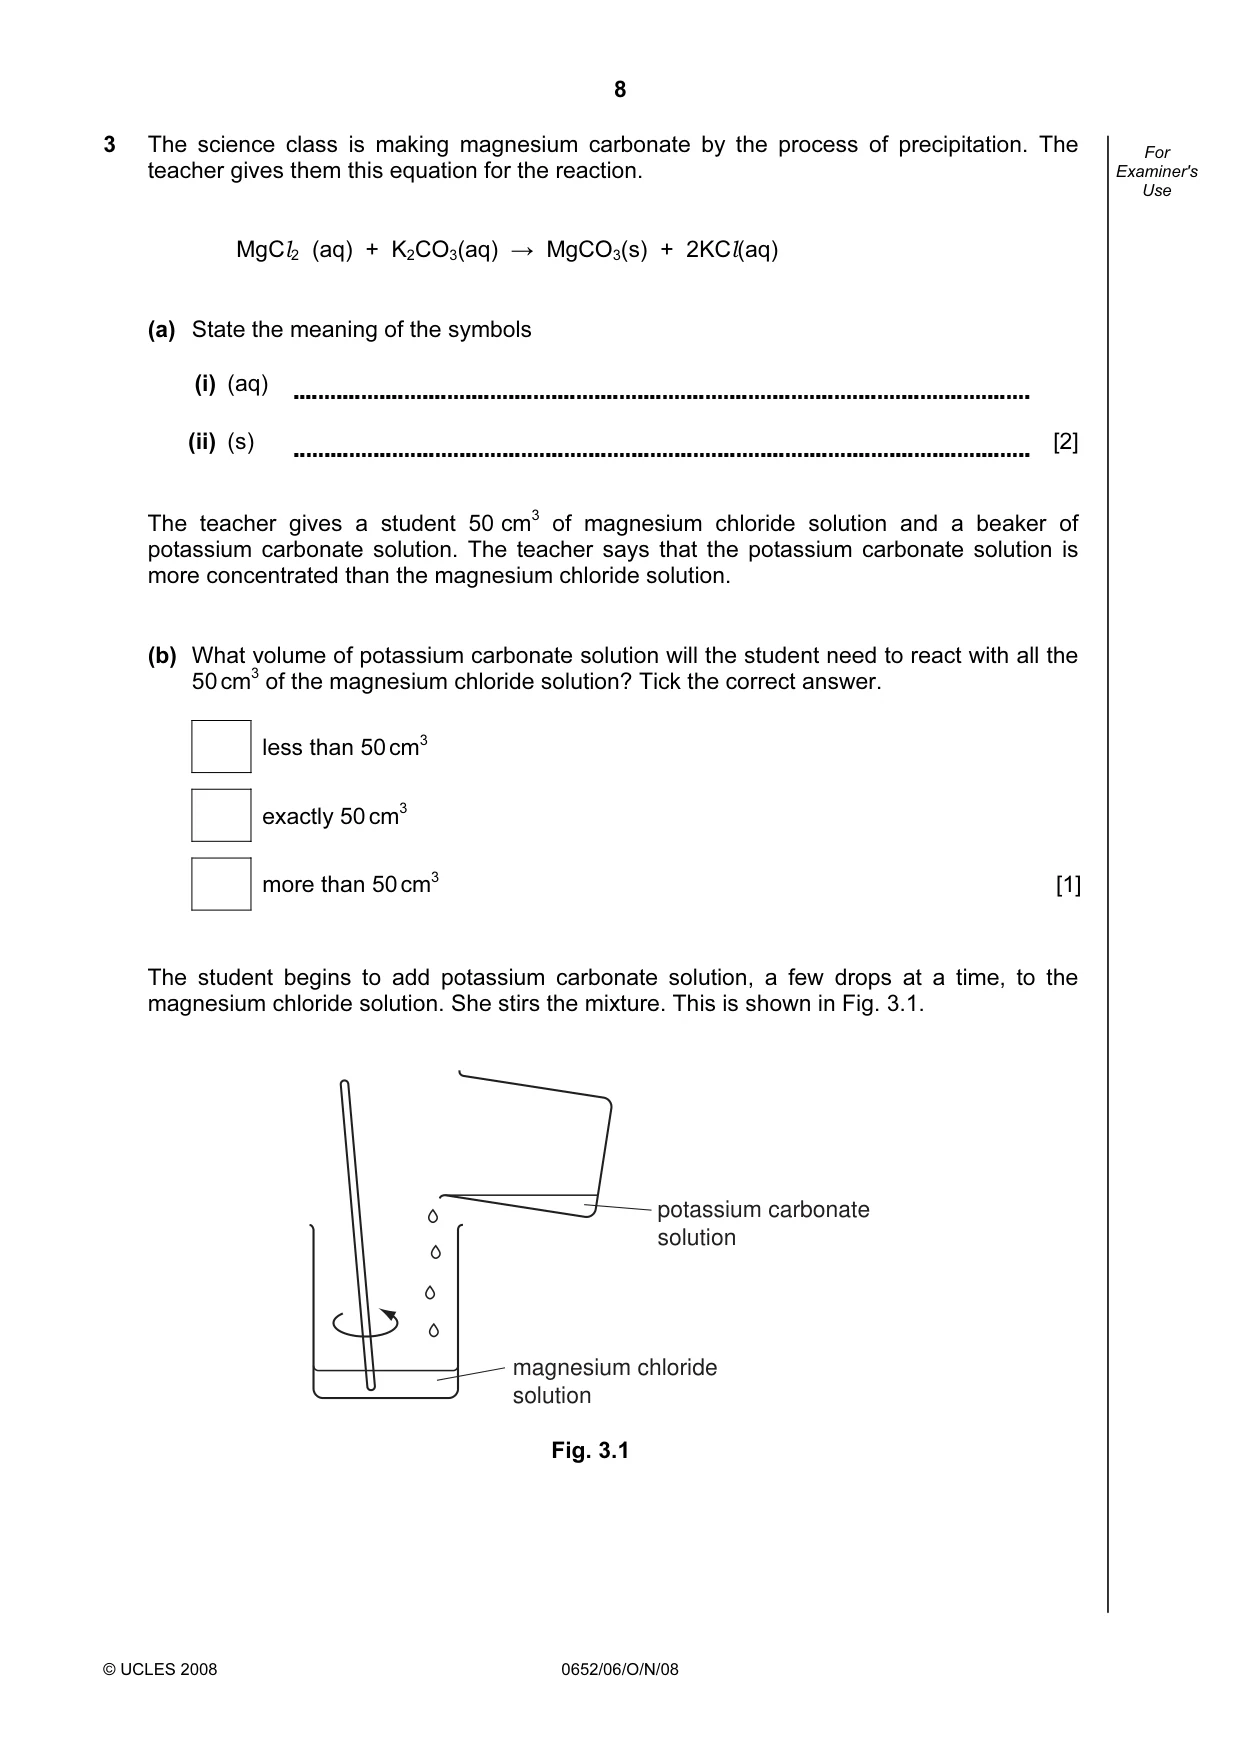
8 © UCLES 2008 0652/06/O/N/08 For Examiner's Use 3 The science class is making magnesium carbonate by the process of precipitation. The teacher gives them this equation for the reaction. MgCl2 (aq) + K2CO3(aq) → MgCO3(s) + 2KCl(aq) (a) State the meaning of the symbols (i) (aq) (ii) (s) [2] The teacher gives a student 50 cm3 of magnesium chloride solution and a beaker of potassium carbonate solution. The teacher says that the potassium carbonate solution is more concentrated than the magnesium chloride solution. (b) What volume of potassium carbonate solution will the student need to react with all the 50 cm3 of the magnesium chloride solution? Tick the correct answer. less than 50 cm3 exactly 50 cm3 more than 50 cm3 [1] The student begins to add potassium carbonate solution, a few drops at a time, to the magnesium chloride solution. She stirs the mixture. This is shown in Fig. 3.1. magnesium chloride solution potassium carbonate solution Fig. 3.1
Question paper, page 9
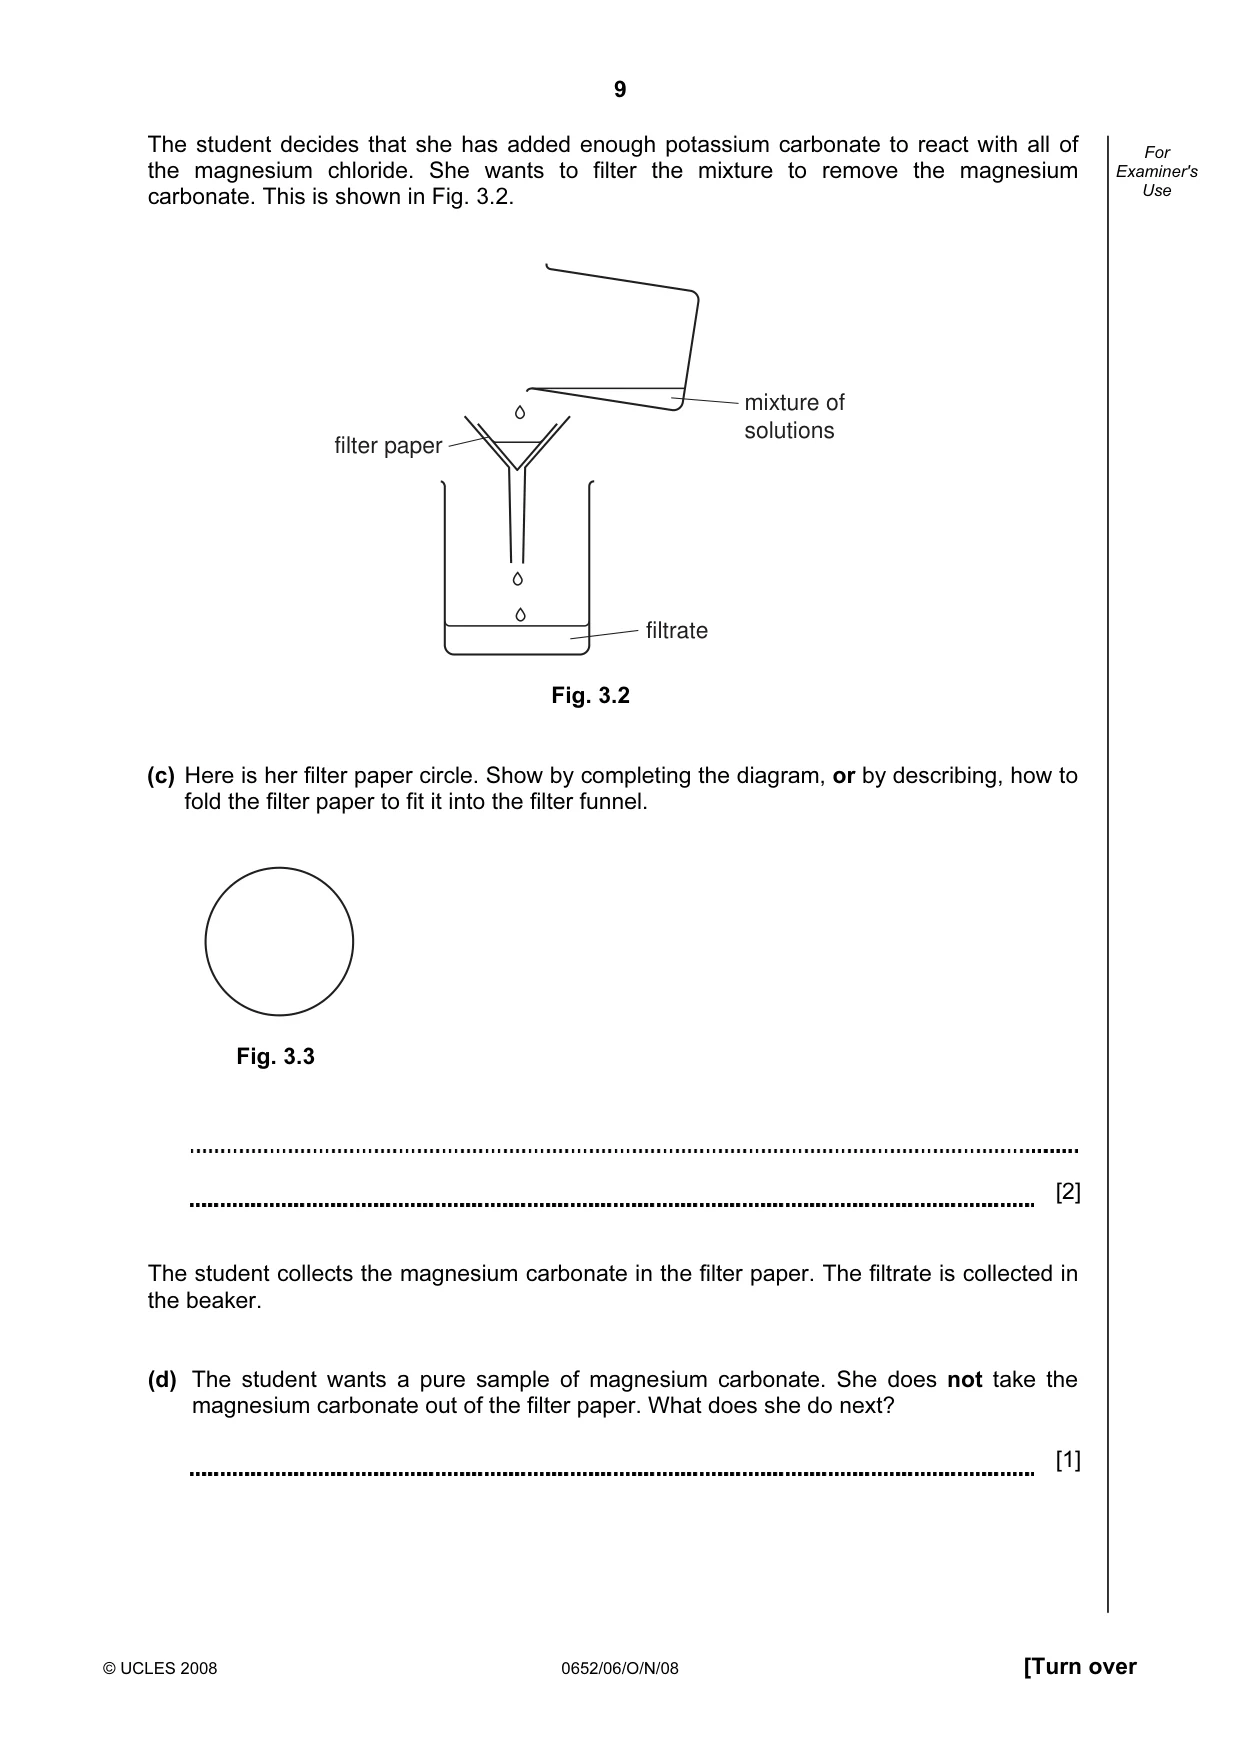
9 © UCLES 2008 0652/06/O/N/08 [Turn over For Examiner's Use The student decides that she has added enough potassium carbonate to react with all of the magnesium chloride. She wants to filter the mixture to remove the magnesium carbonate. This is shown in Fig. 3.2. filtrate mixture of solutions filter paper Fig. 3.2 (c) Here is her filter paper circle. Show by completing the diagram, or by describing, how to fold the filter paper to fit it into the filter funnel. Fig. 3.3 [2] The student collects the magnesium carbonate in the filter paper. The filtrate is collected in the beaker. (d) The student wants a pure sample of magnesium carbonate. She does not take the magnesium carbonate out of the filter paper. What does she do next? [1]
Question paper, page 10
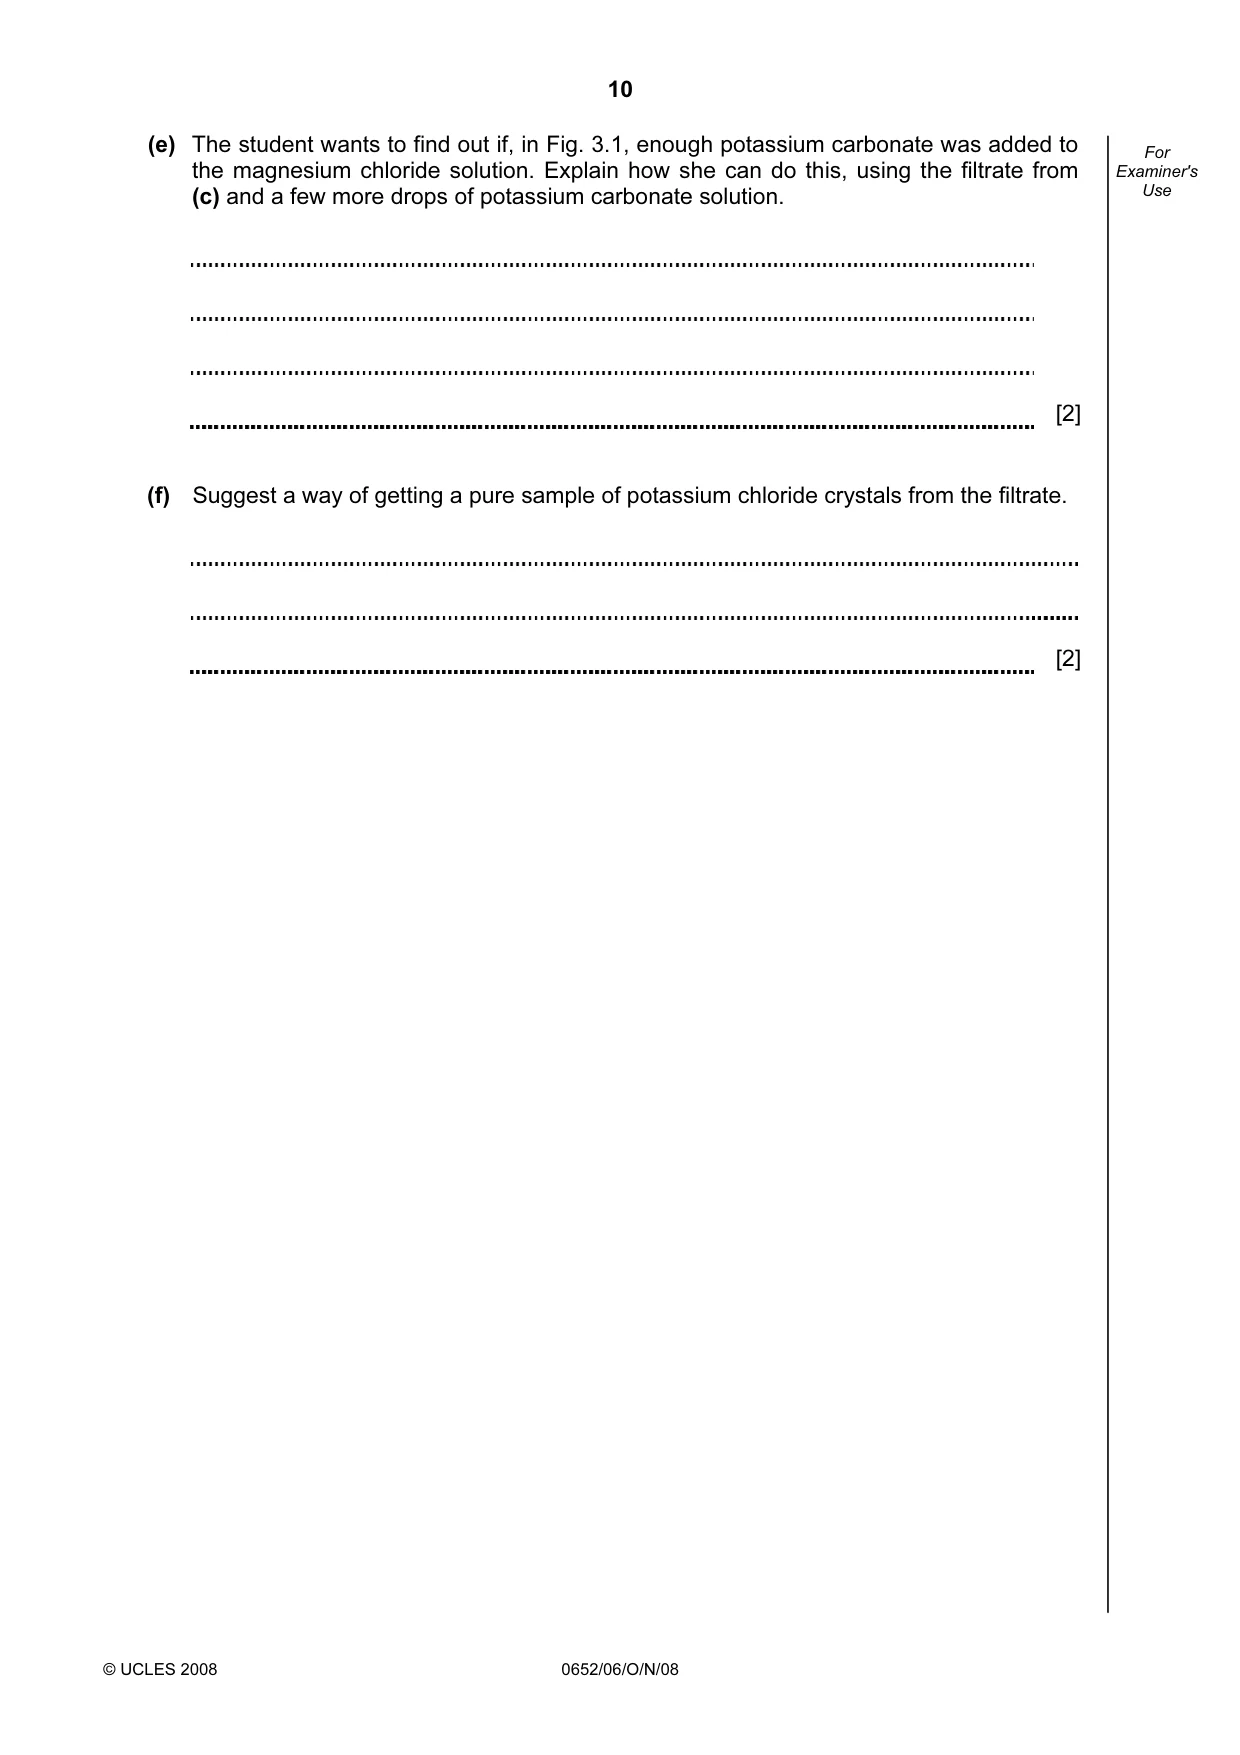
10 © UCLES 2008 0652/06/O/N/08 For Examiner's Use (e) The student wants to find out if, in Fig. 3.1, enough potassium carbonate was added to the magnesium chloride solution. Explain how she can do this, using the filtrate from (c) and a few more drops of potassium carbonate solution. [2] (f) Suggest a way of getting a pure sample of potassium chloride crystals from the filtrate. [2]
Question paper, page 11
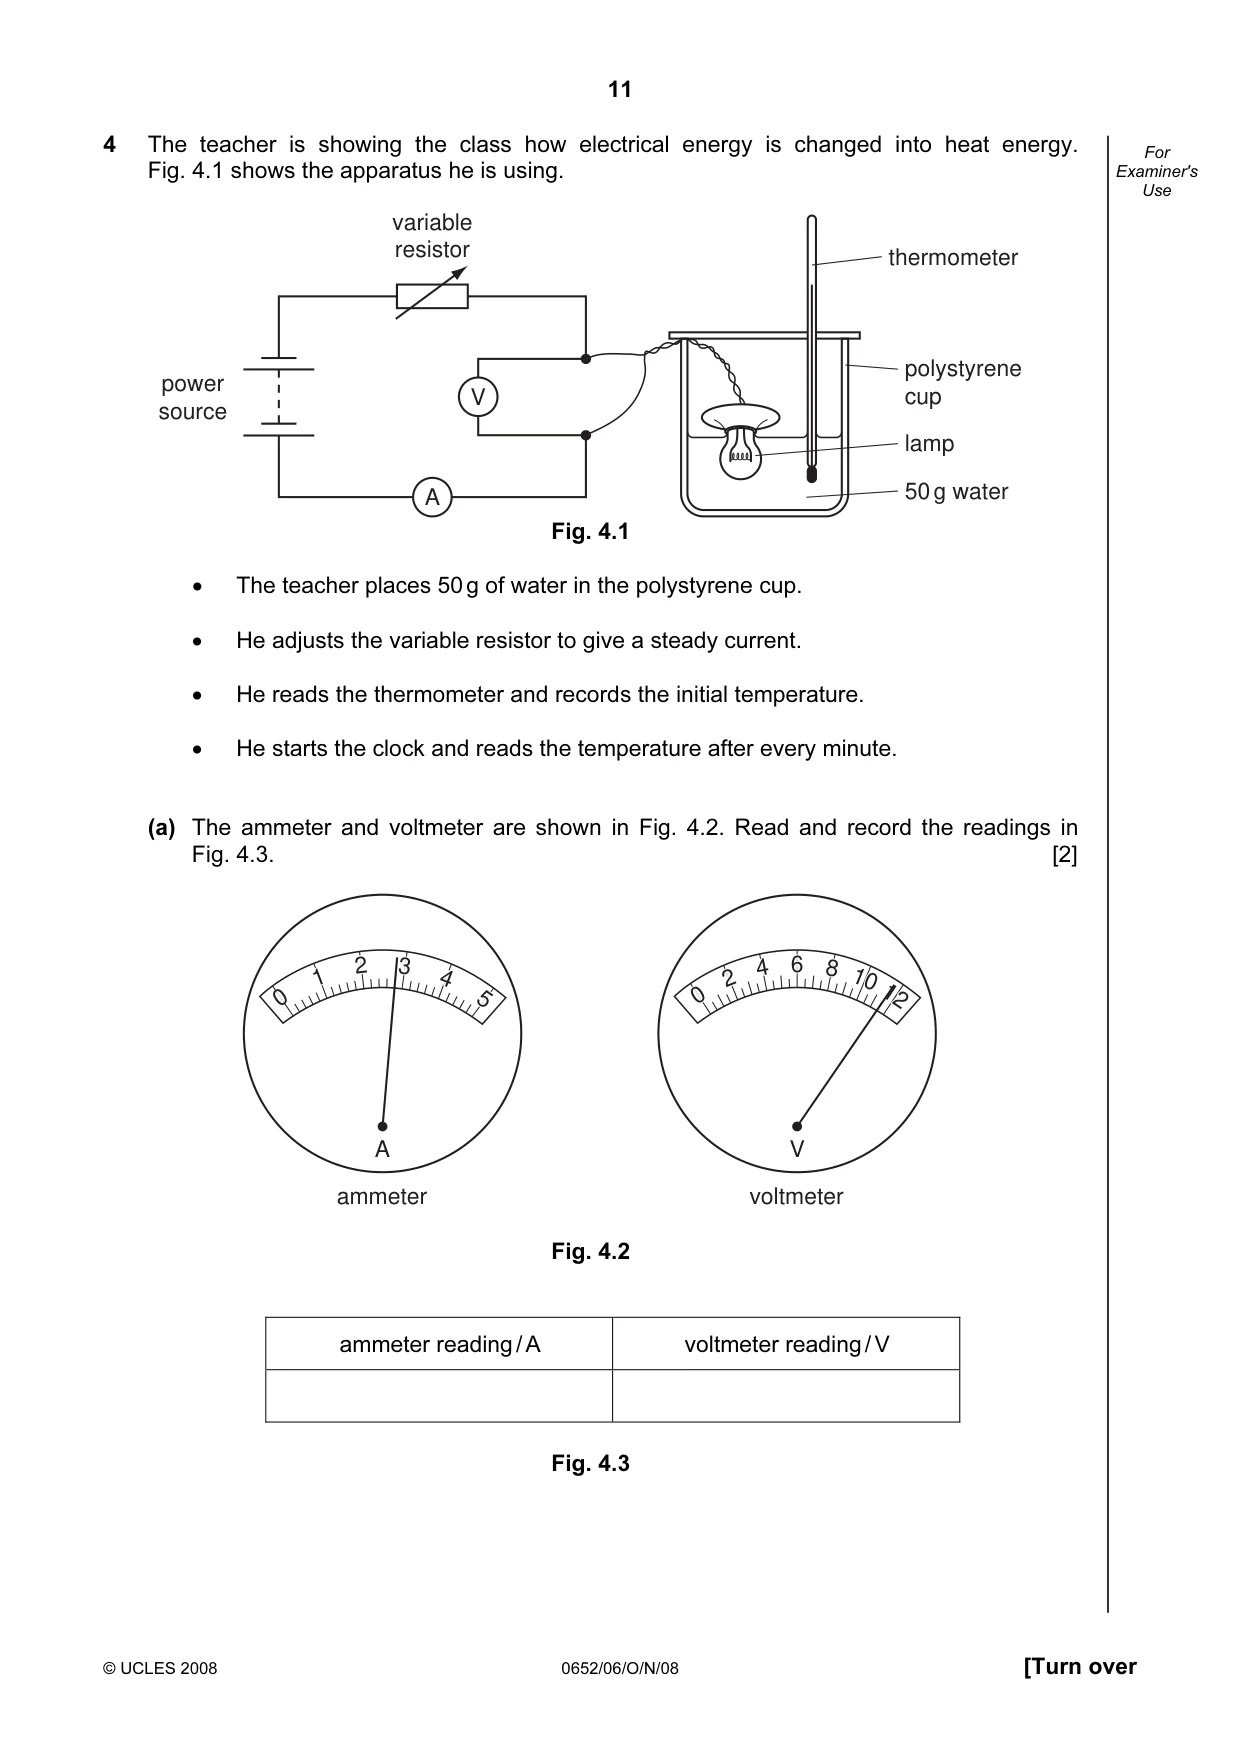
11 © UCLES 2008 0652/06/O/N/08 [Turn over For Examiner's Use 4 The teacher is showing the class how electrical energy is changed into heat energy. Fig. 4.1 shows the apparatus he is using. A V power source variable resistor thermometer polystyrene cup lamp 50 g water Fig. 4.1 • The teacher places 50 g of water in the polystyrene cup. • He adjusts the variable resistor to give a steady current. • He reads the thermometer and records the initial temperature. • He starts the clock and reads the temperature after every minute. (a) The ammeter and voltmeter are shown in Fig. 4.2. Read and record the readings in Fig. 4.3. [2] V voltmeter A ammeter 1 2 3 4 5 0 2 4 6 8 10 10 12 12 8 10 12 0 Fig. 4.2 ammeter reading / A voltmeter reading / V Fig. 4.3
Question paper, page 12
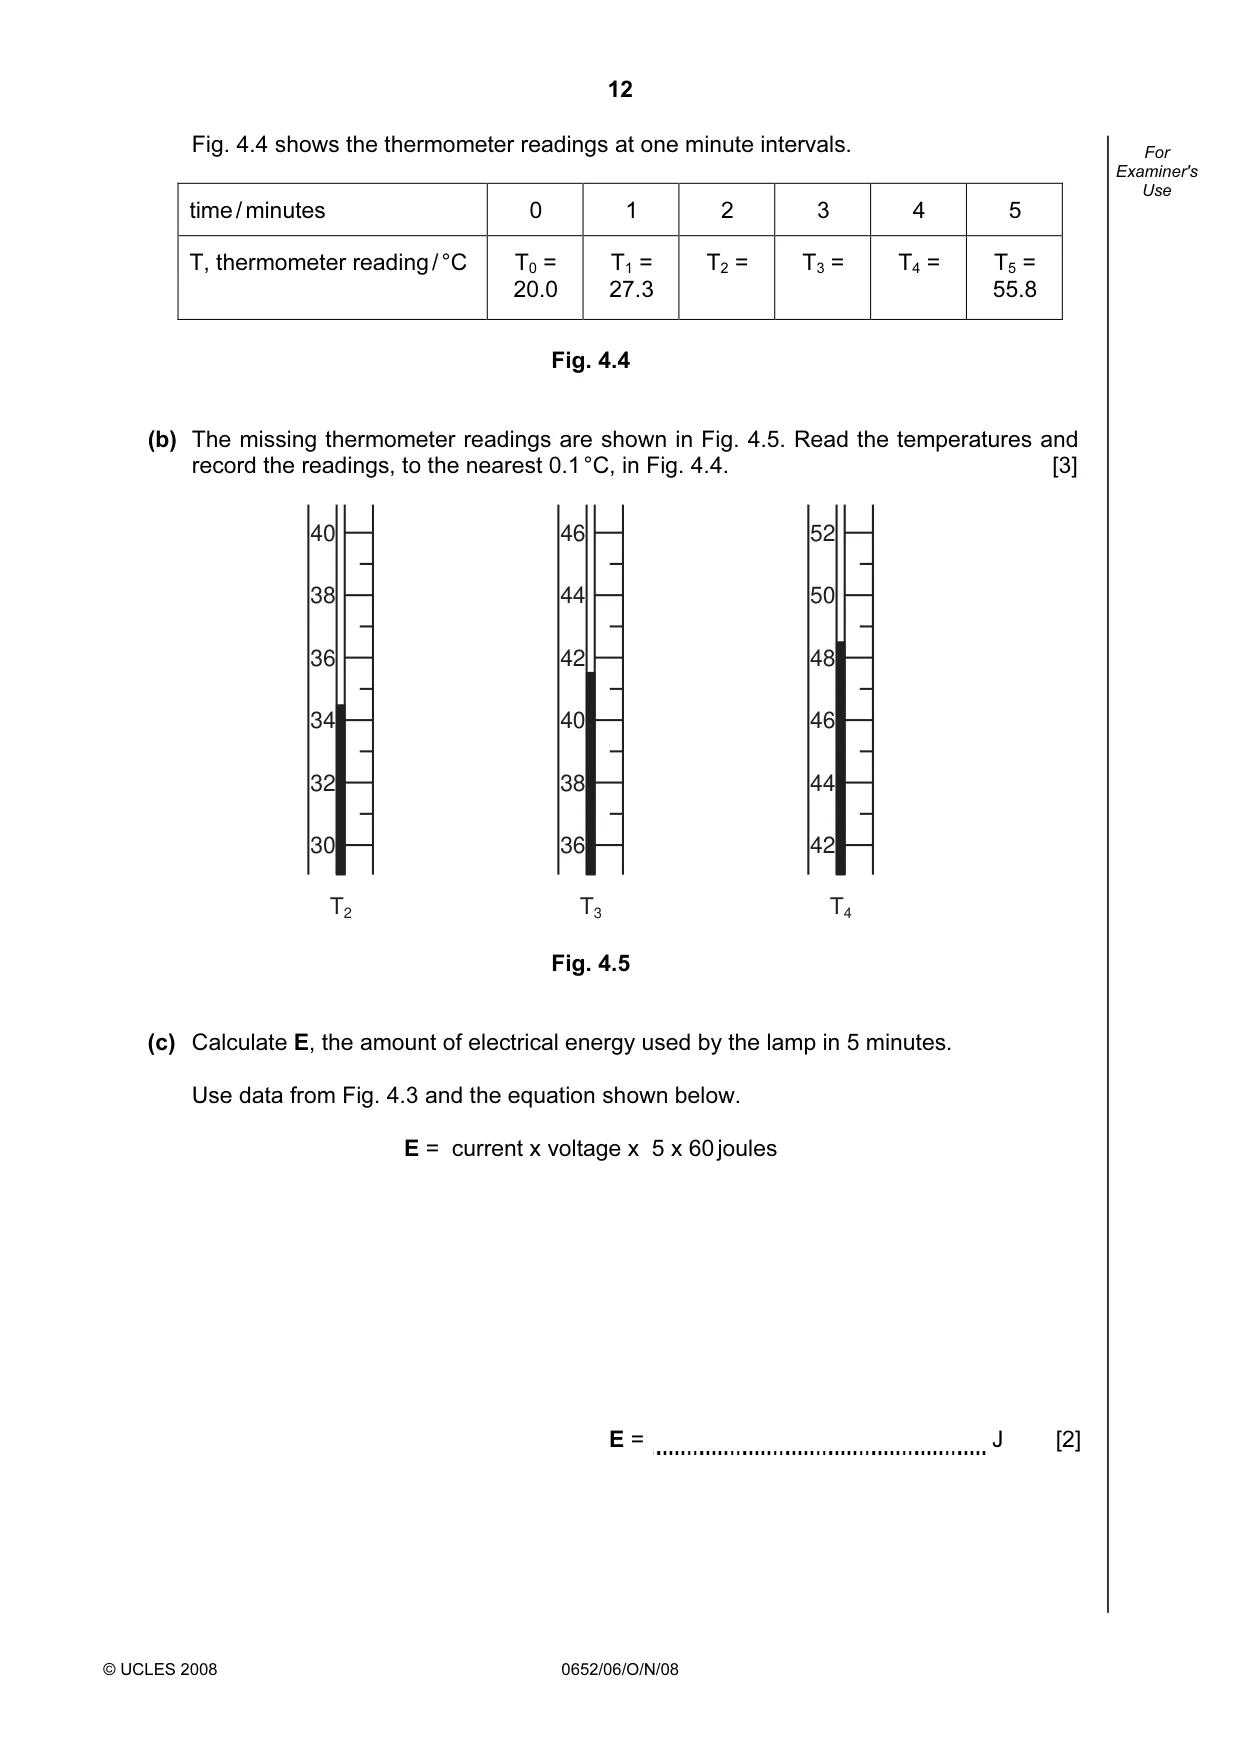
12 © UCLES 2008 0652/06/O/N/08 For Examiner's Use Fig. 4.4 shows the thermometer readings at one minute intervals. time / minutes 0 1 2 3 4 5 T, thermometer reading / °C T0 = 20.0 T1 = 27.3 T2 = T3 = T4 = T5 = 55.8 Fig. 4.4 (b) The missing thermometer readings are shown in Fig. 4.5. Read the temperatures and record the readings, to the nearest 0.1 °C, in Fig. 4.4. [3] 40 38 36 34 32 30 T2 46 44 42 40 38 36 T3 52 50 48 46 44 42 T4 Fig. 4.5 (c) Calculate E, the amount of electrical energy used by the lamp in 5 minutes. Use data from Fig. 4.3 and the equation shown below. E = current x voltage x 5 x 60 joules E = J [2]
Question paper, page 13
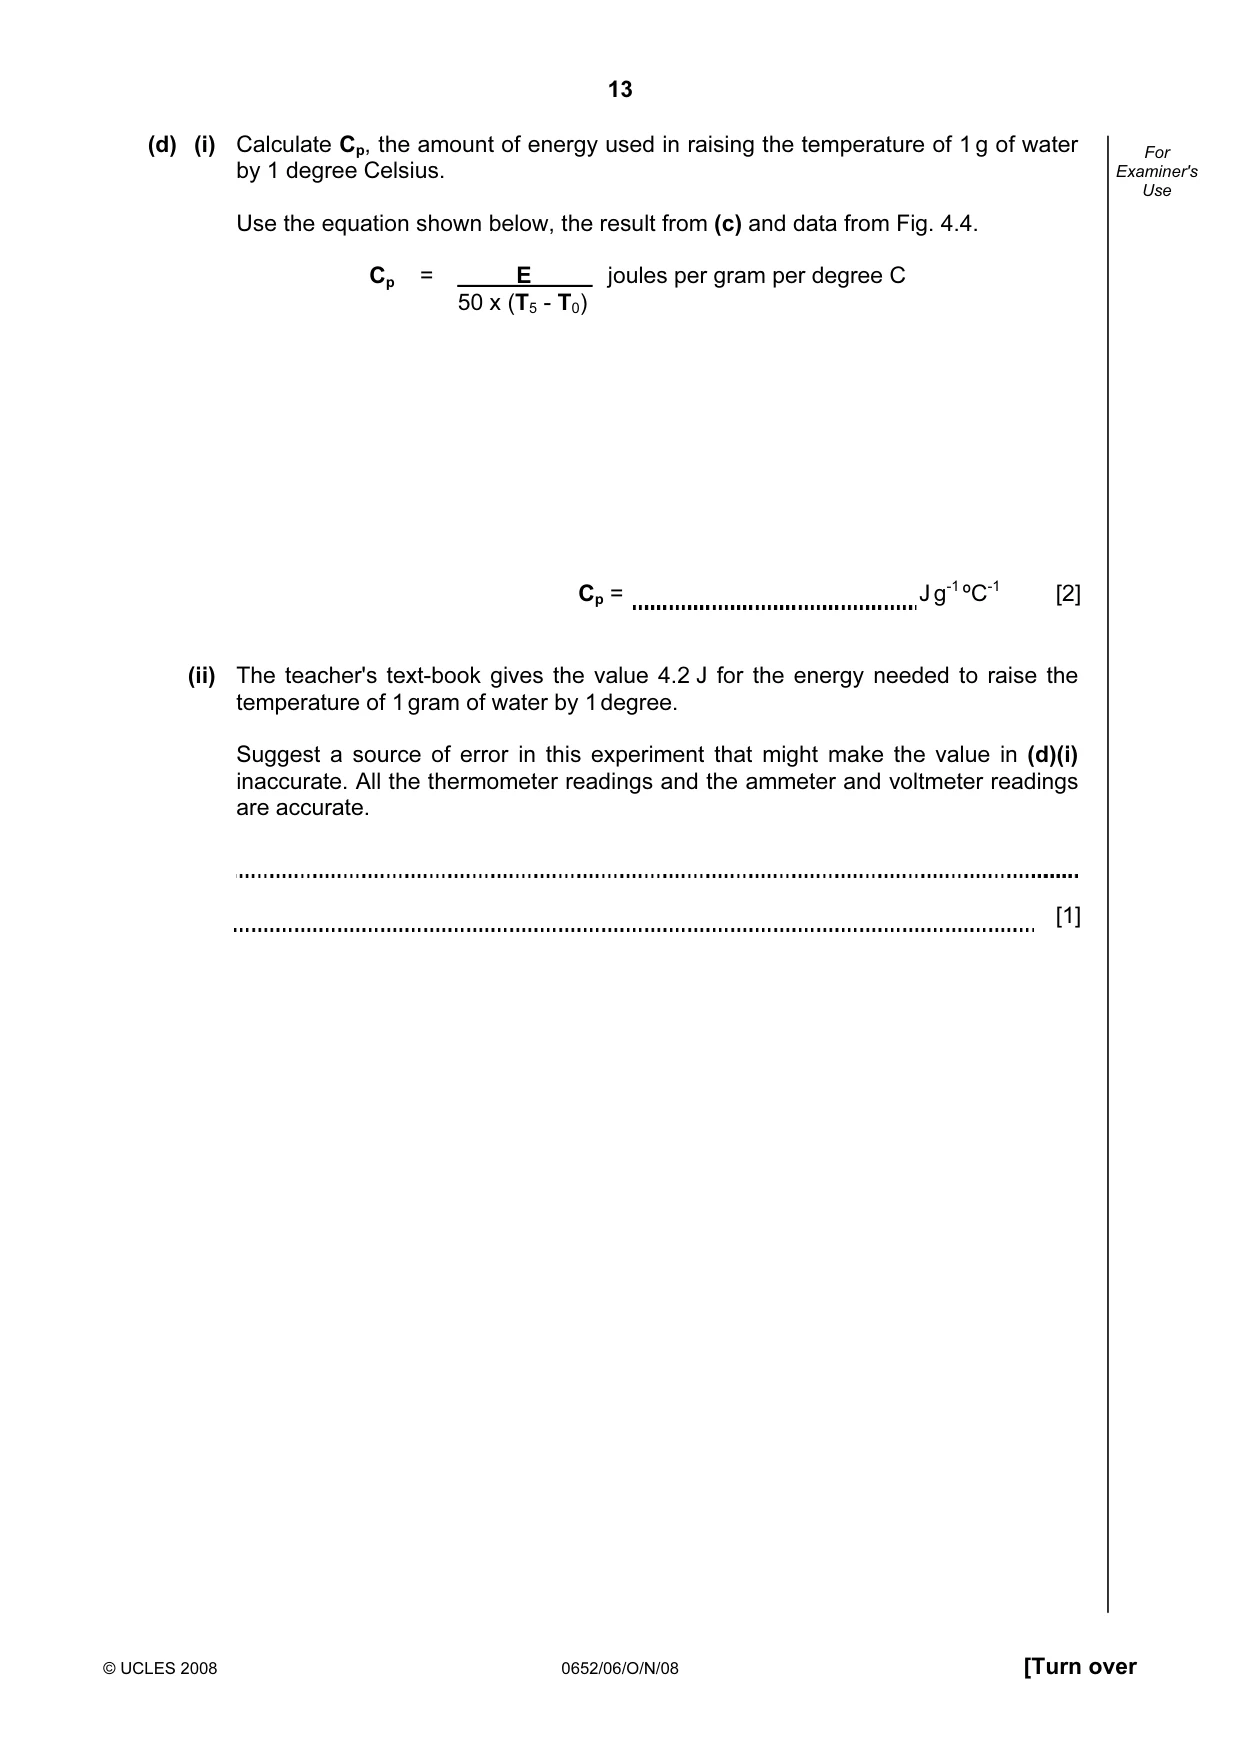
13 © UCLES 2008 0652/06/O/N/08 [Turn over For Examiner's Use (d) (i) Calculate Cp, the amount of energy used in raising the temperature of 1 g of water by 1 degree Celsius. Use the equation shown below, the result from (c) and data from Fig. 4.4. Cp = E joules per gram per degree C 50 x (T5 - T0) Cp = J g-1 ºC-1 [2] (ii) The teacher's text-book gives the value 4.2 J for the energy needed to raise the temperature of 1 gram of water by 1 degree. Suggest a source of error in this experiment that might make the value in (d)(i) inaccurate. All the thermometer readings and the ammeter and voltmeter readings are accurate. [1]
Question paper, page 14
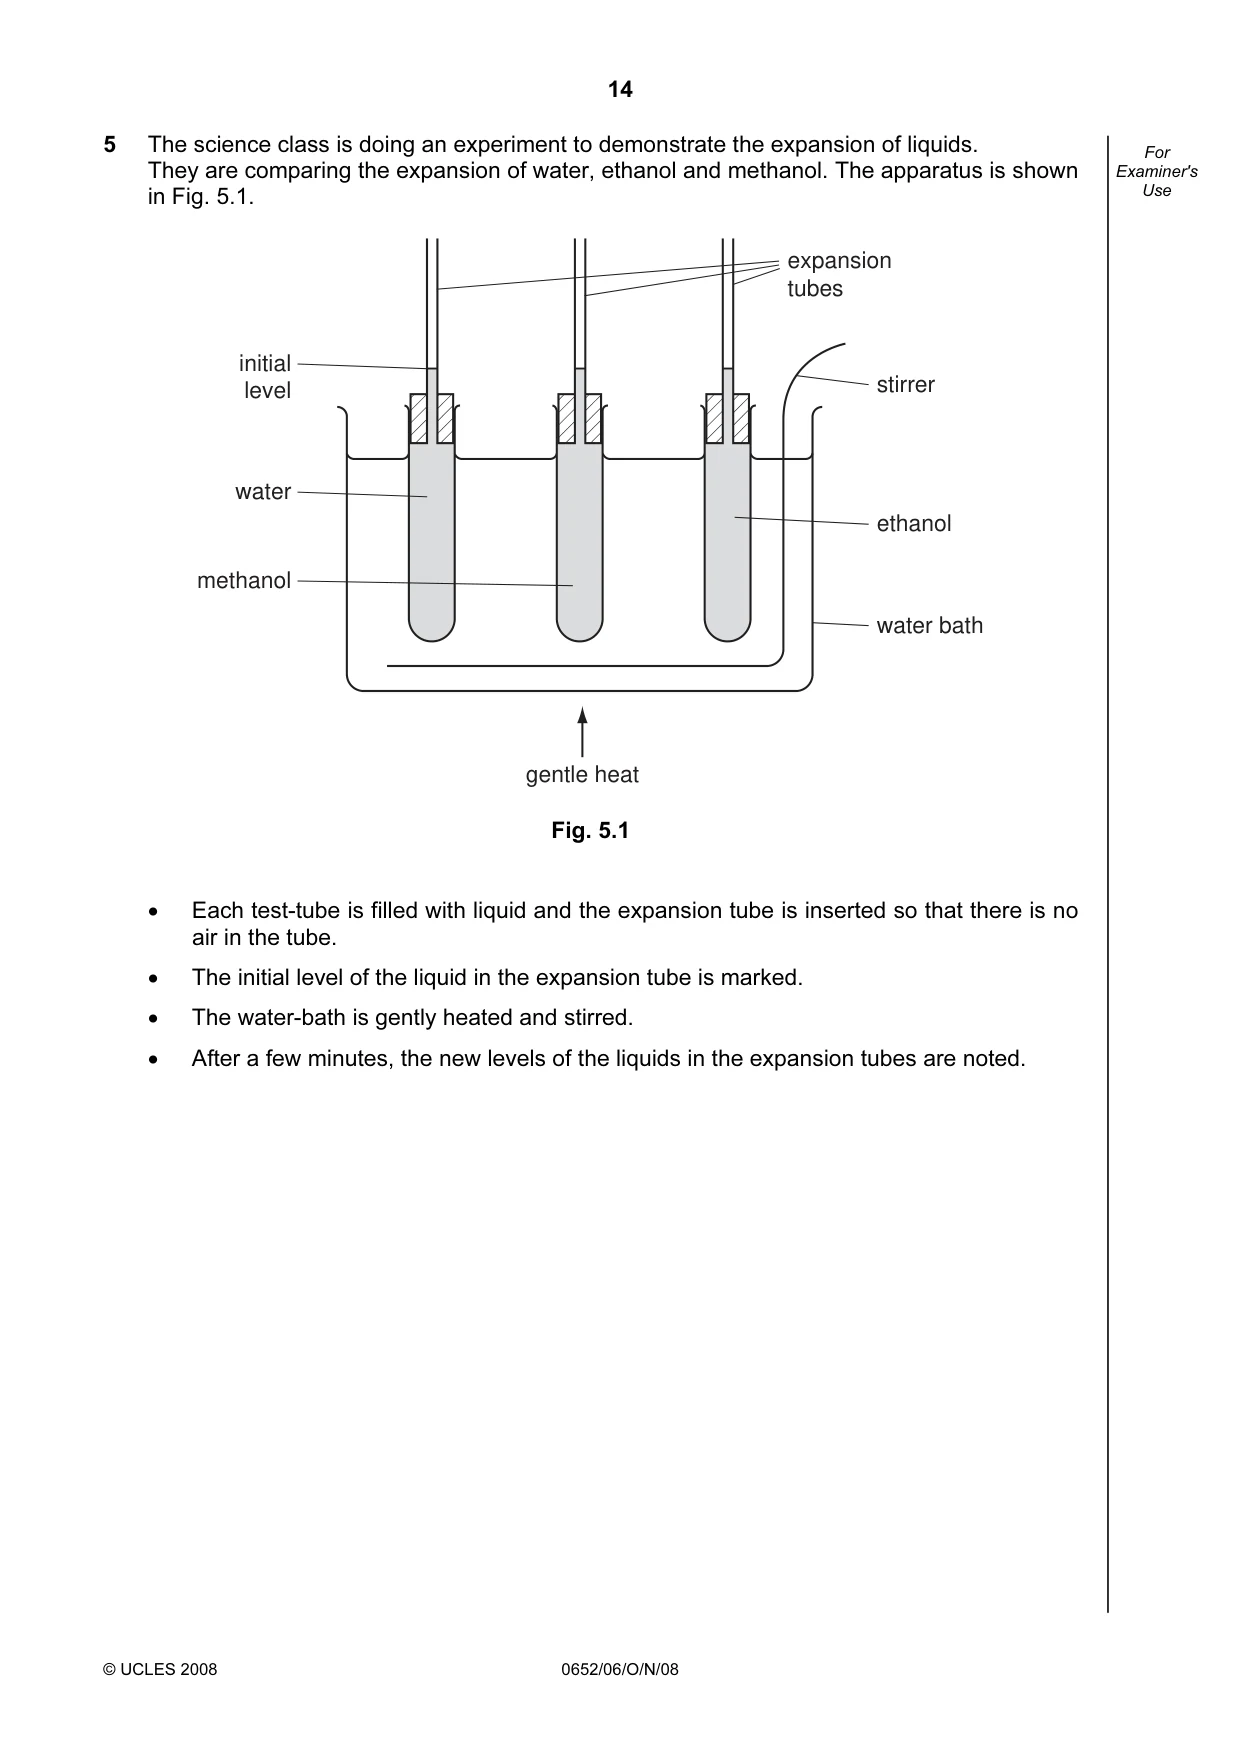
14 © UCLES 2008 0652/06/O/N/08 For Examiner's Use 5 The science class is doing an experiment to demonstrate the expansion of liquids. They are comparing the expansion of water, ethanol and methanol. The apparatus is shown in Fig. 5.1. stirrer ethanol water bath initial level water methanol gentle heat expansion tubes Fig. 5.1 • Each test-tube is filled with liquid and the expansion tube is inserted so that there is no air in the tube. • The initial level of the liquid in the expansion tube is marked. • The water-bath is gently heated and stirred. • After a few minutes, the new levels of the liquids in the expansion tubes are noted.
Question paper, page 15
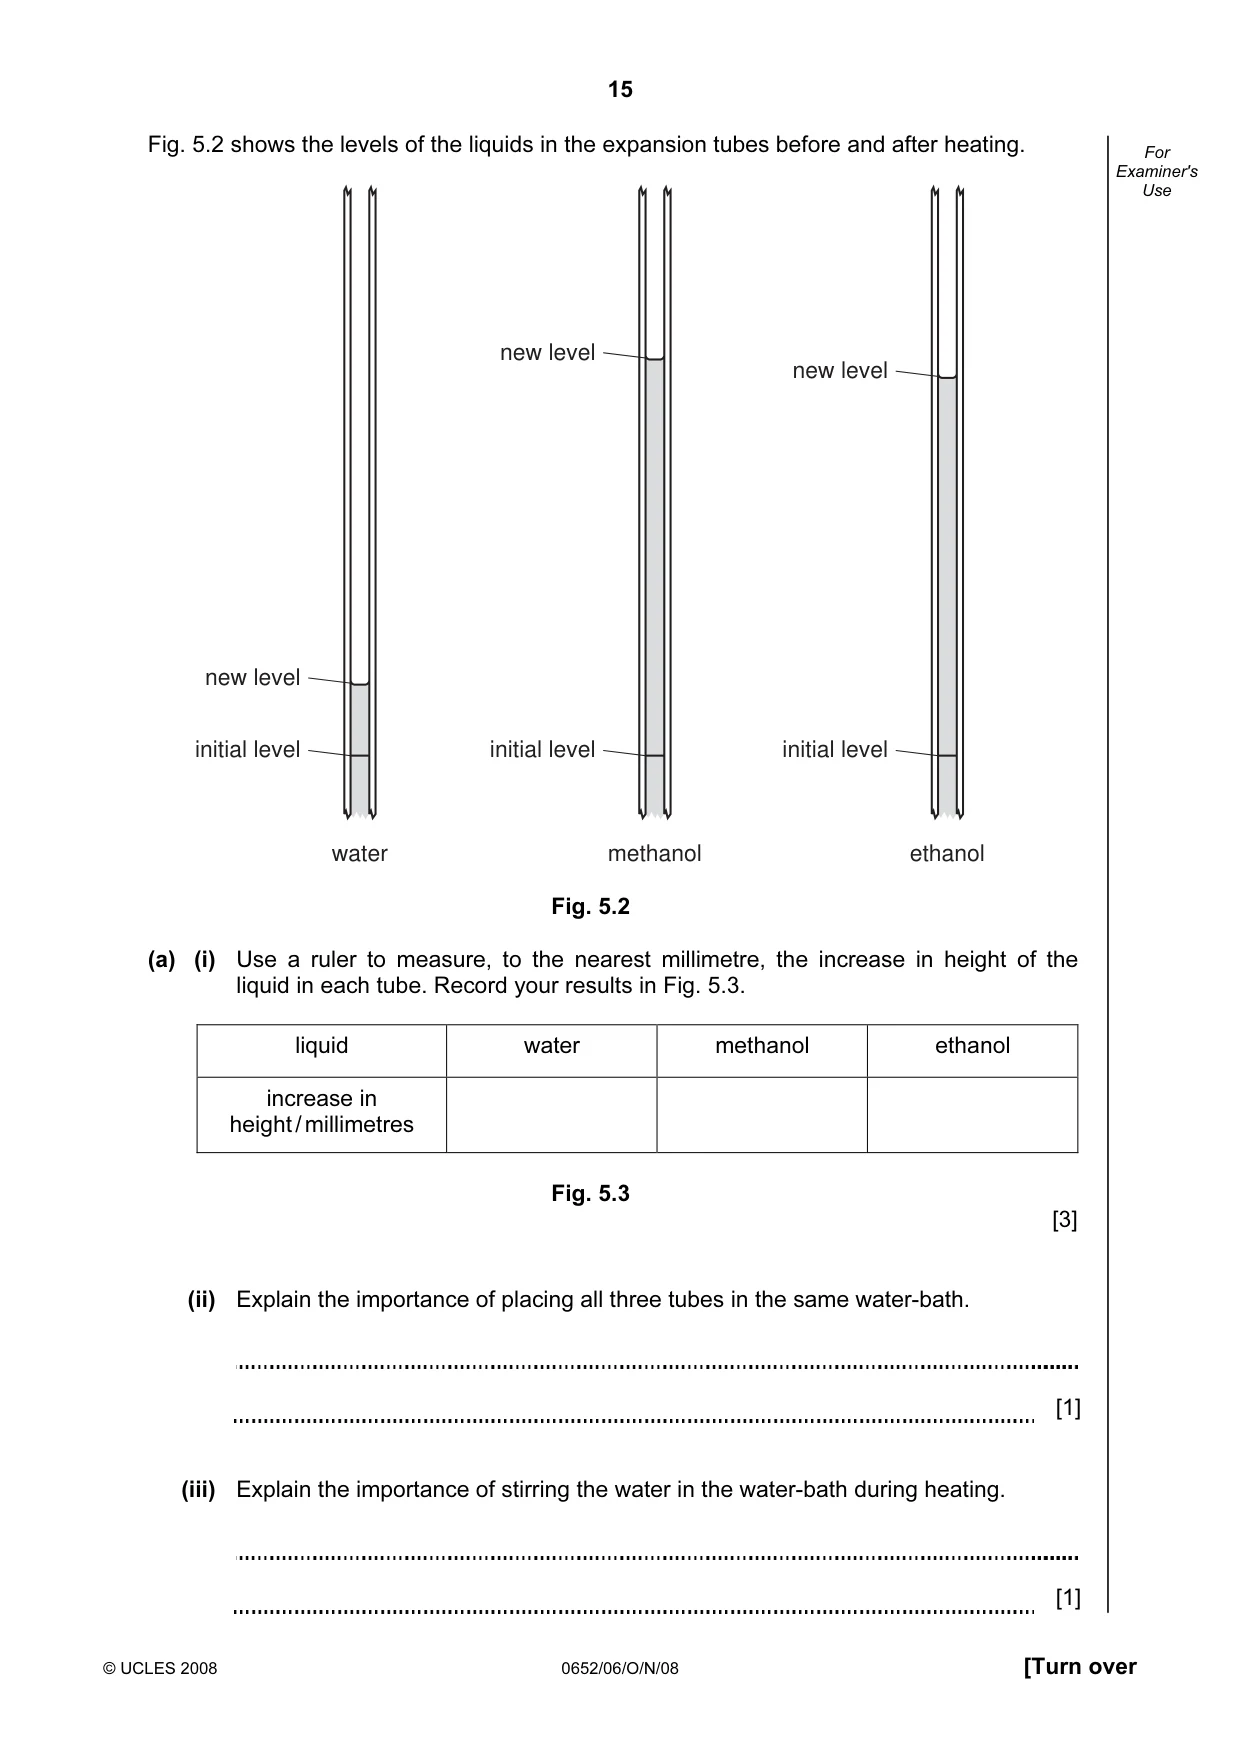
15 © UCLES 2008 0652/06/O/N/08 [Turn over For Examiner's Use Fig. 5.2 shows the levels of the liquids in the expansion tubes before and after heating. water initial level new level ethanol initial level new level methanol initial level new level Fig. 5.2 (a) (i) Use a ruler to measure, to the nearest millimetre, the increase in height of the liquid in each tube. Record your results in Fig. 5.3. liquid water methanol ethanol increase in height / millimetres Fig. 5.3 [3] (ii) Explain the importance of placing all three tubes in the same water-bath. [1] (iii) Explain the importance of stirring the water in the water-bath during heating. [1]
Question paper, page 16
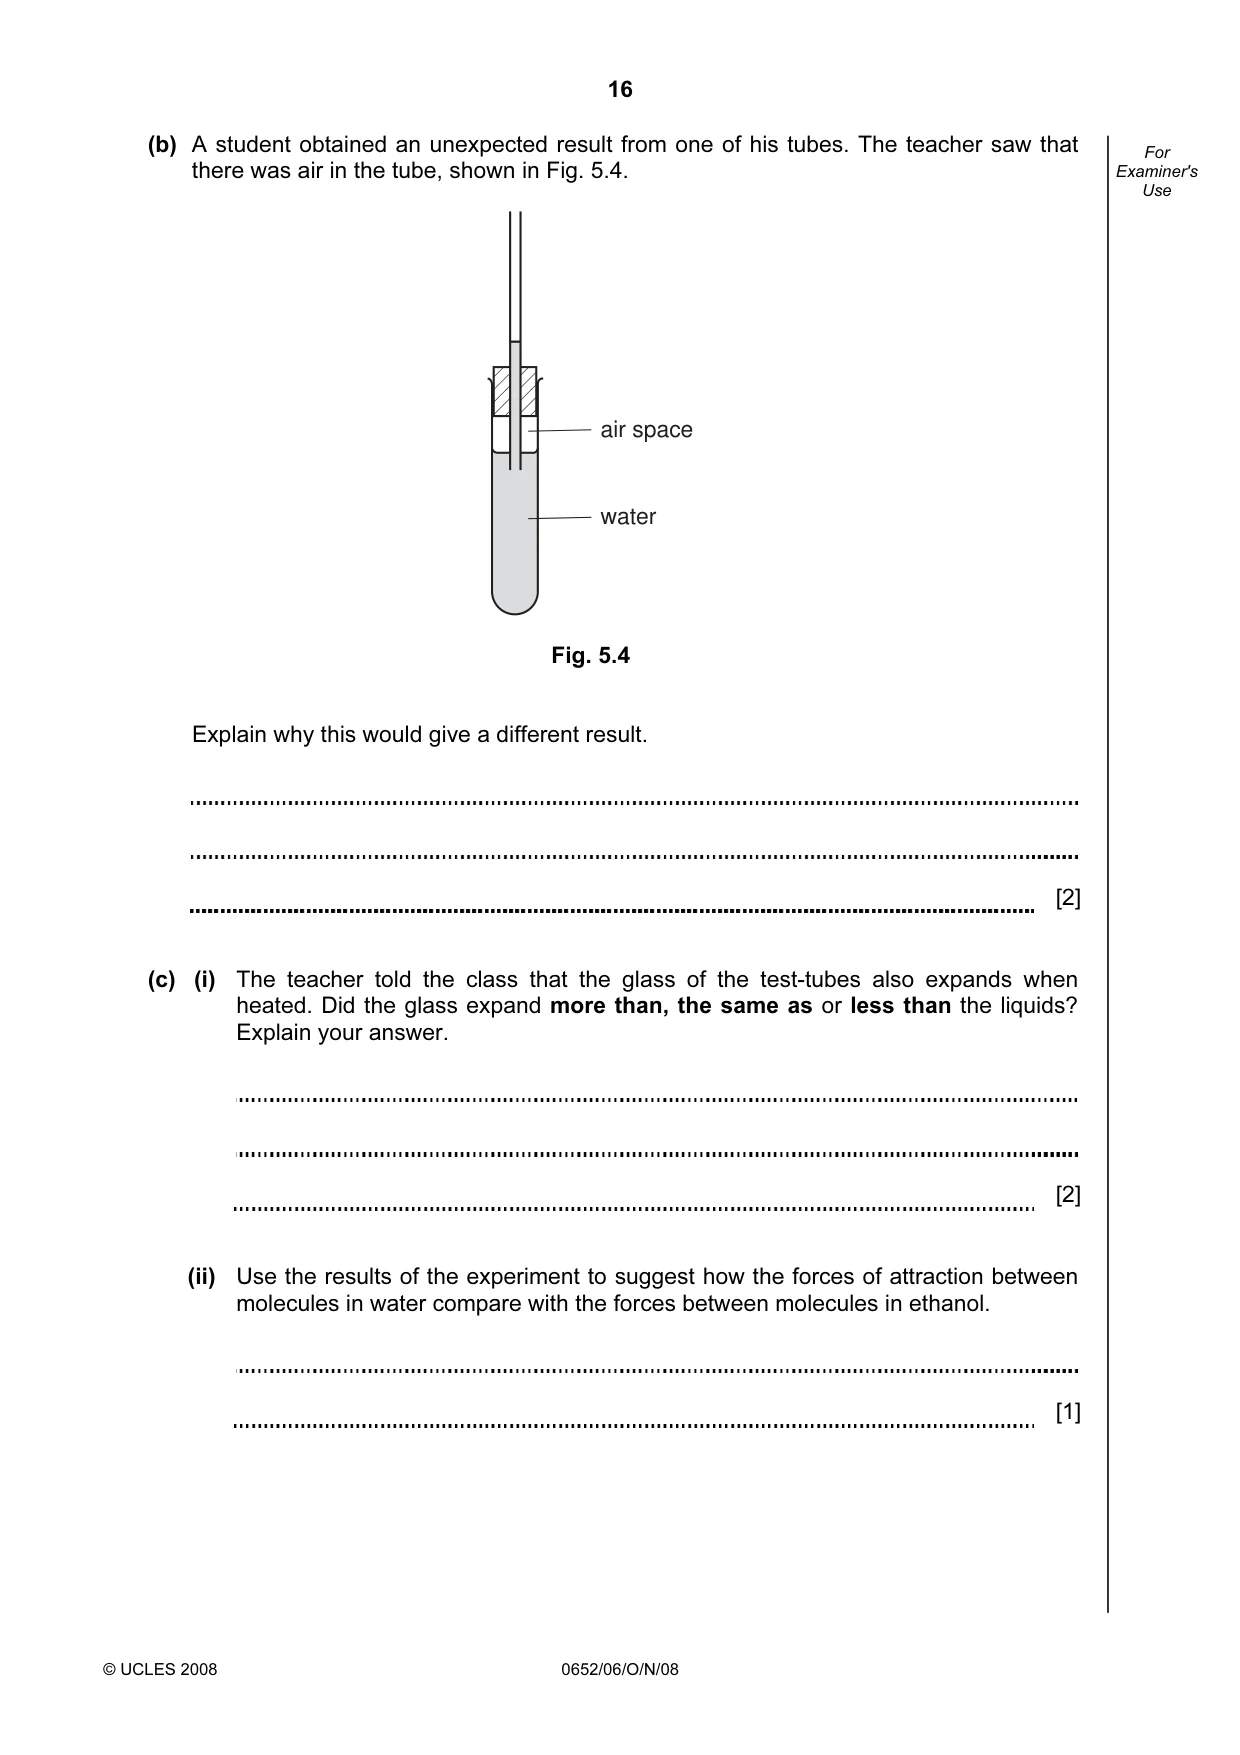
16 © UCLES 2008 0652/06/O/N/08 For Examiner's Use (b) A student obtained an unexpected result from one of his tubes. The teacher saw that there was air in the tube, shown in Fig. 5.4. air space water Fig. 5.4 Explain why this would give a different result. [2] (c) (i) The teacher told the class that the glass of the test-tubes also expands when heated. Did the glass expand more than, the same as or less than the liquids? Explain your answer. [2] (ii) Use the results of the experiment to suggest how the forces of attraction between molecules in water compare with the forces between molecules in ethanol. [1]
Question paper, page 17
17 0652/06/O/N/08 [Turn over BLANK PAGE Please turn over for Question 6.
Question paper, page 18
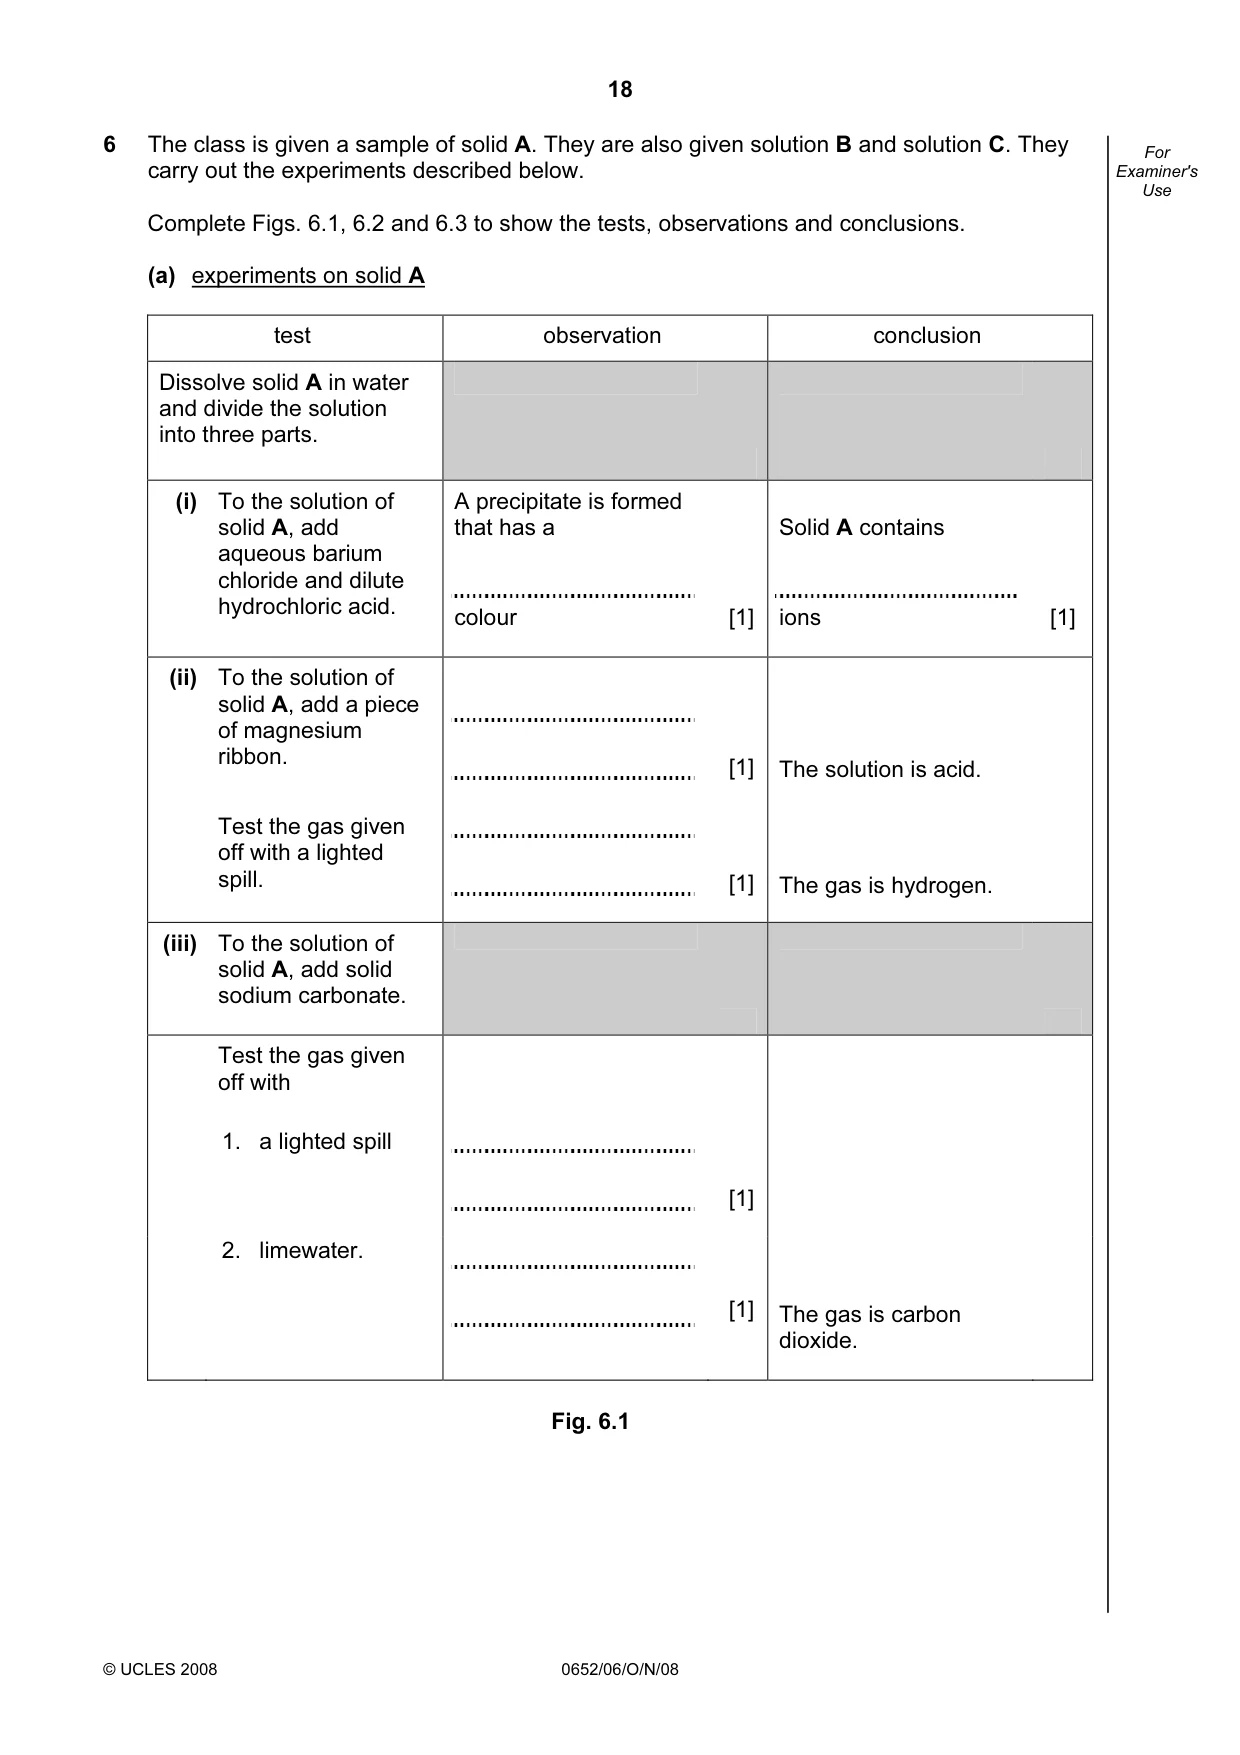
18 © UCLES 2008 0652/06/O/N/08 For Examiner's Use 6 The class is given a sample of solid A. They are also given solution B and solution C. They carry out the experiments described below. Complete Figs. 6.1, 6.2 and 6.3 to show the tests, observations and conclusions. (a) experiments on solid A test observation conclusion Dissolve solid A in water and divide the solution into three parts. (i) To the solution of solid A, add aqueous barium chloride and dilute hydrochloric acid. A precipitate is formed that has a colour [1] Solid A contains ions [1] (ii) To the solution of solid A, add a piece of magnesium ribbon. [1] The solution is acid. Test the gas given off with a lighted spill. [1] The gas is hydrogen. (iii) To the solution of solid A, add solid sodium carbonate. Test the gas given off with 1. a lighted spill [1] 2. limewater. [1] The gas is carbon dioxide. Fig. 6.1
Question paper, page 19
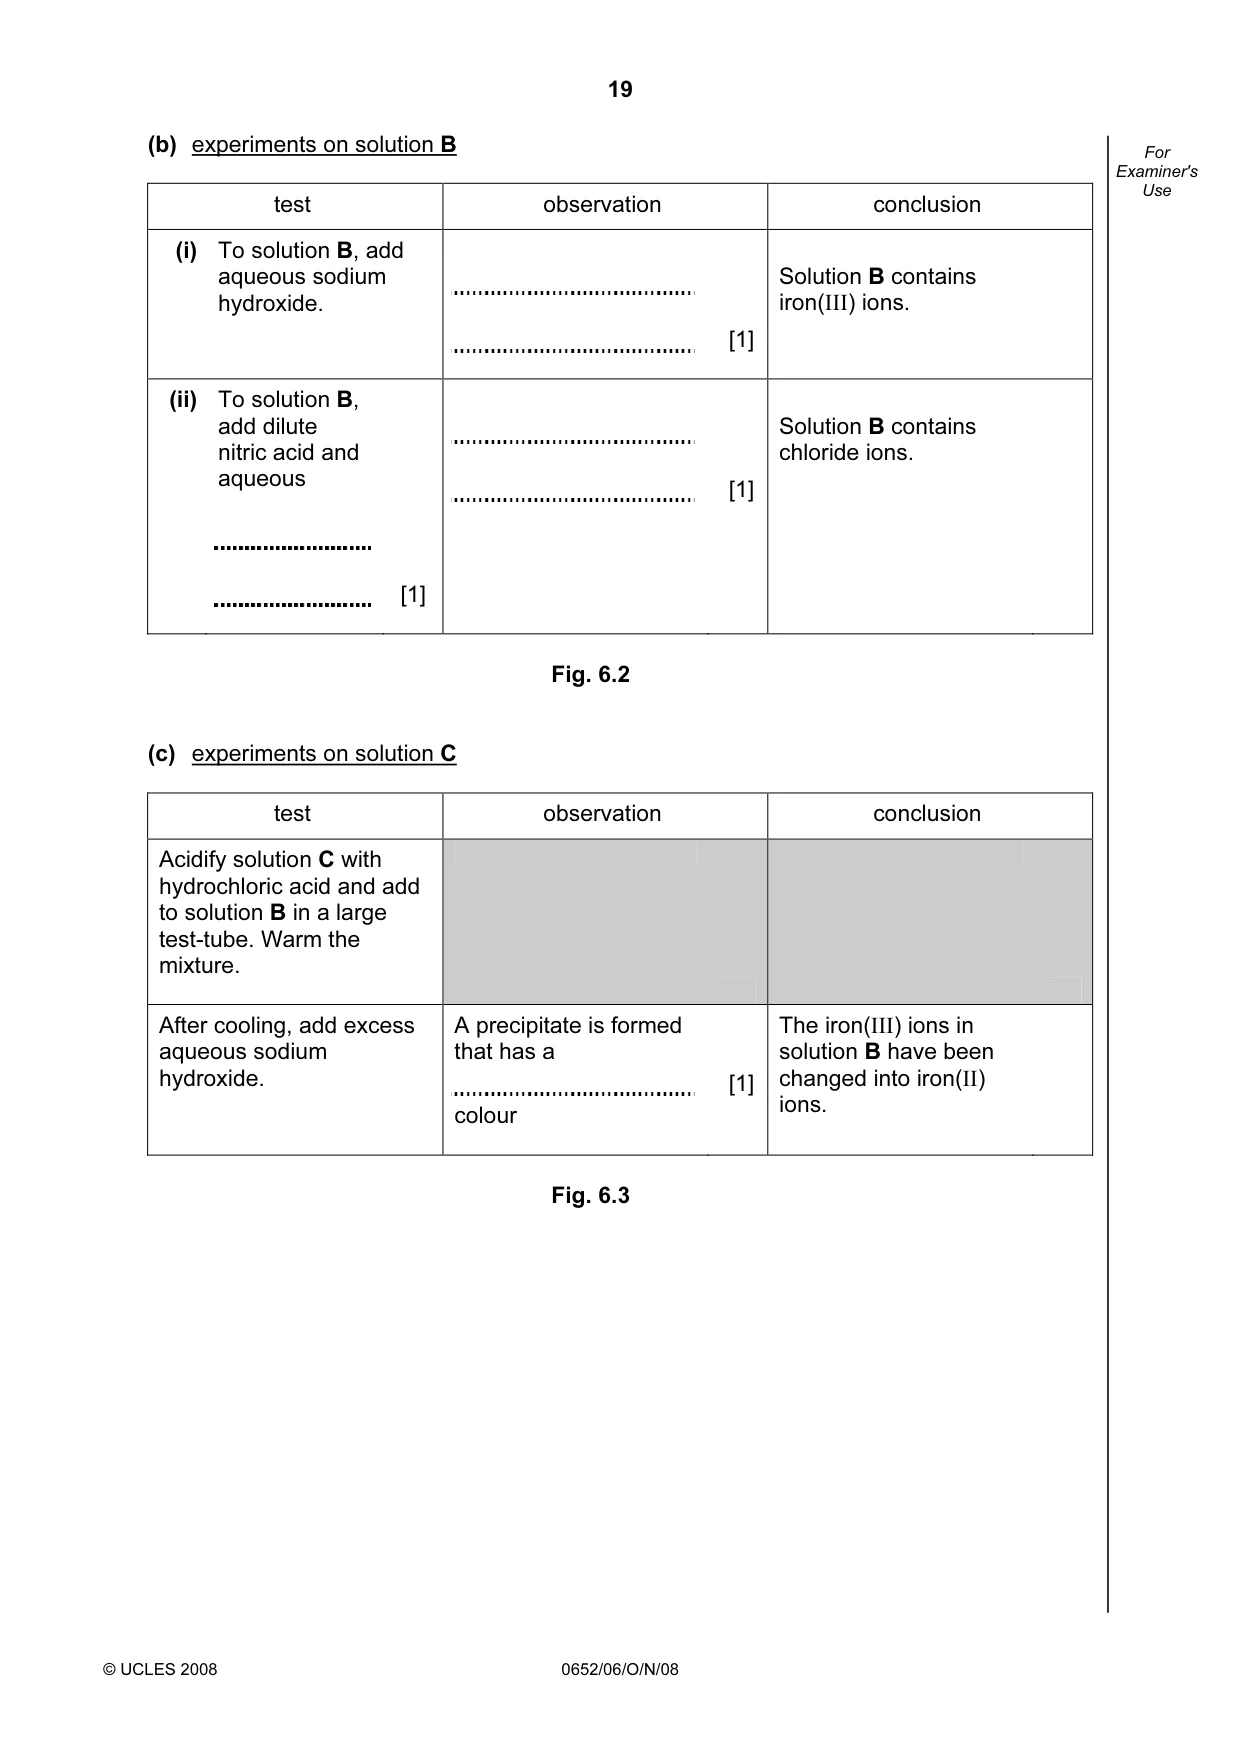
19 © UCLES 2008 0652/06/O/N/08 For Examiner's Use (b) experiments on solution B test observation conclusion (i) To solution B, add aqueous sodium hydroxide. [1] Solution B contains iron(III) ions. (ii) To solution B, add dilute nitric acid and aqueous [1] [1] Solution B contains chloride ions. Fig. 6.2 (c) experiments on solution C test observation conclusion Acidify solution C with hydrochloric acid and add to solution B in a large test-tube. Warm the mixture. After cooling, add excess aqueous sodium hydroxide. A precipitate is formed that has a colour [1] The iron(III) ions in solution B have been changed into iron(II) ions. Fig. 6.3
Question paper, page 20
20 Permission to reproduce items where third-party owned material protected by copyright is included has been sought and cleared where possible. Every reasonable effort has been made by the publisher (UCLES) to trace copyright holders, but if any items requiring clearance have unwittingly been included, the publisher will be pleased to make amends at the earliest possible opportunity. University of Cambridge International Examinations is part of the Cambridge Assessment Group. Cambridge Assessment is the brand name of University of Cambridge Local Examinations Syndicate (UCLES), which is itself a department of the University of Cambridge. 0652/06/O/N/08 BLANK PAGE