Cambridge IGCSE Mathematics - International 0607 — 2021 May/June Paper 6 · Variant 2
0607/62/M/J/21 · 60 marks · ≈68 min
The question paper and its mark scheme, free to read here and free to download. This is Cambridge’s own paper, exactly as it was sat.
Question paper16 pages
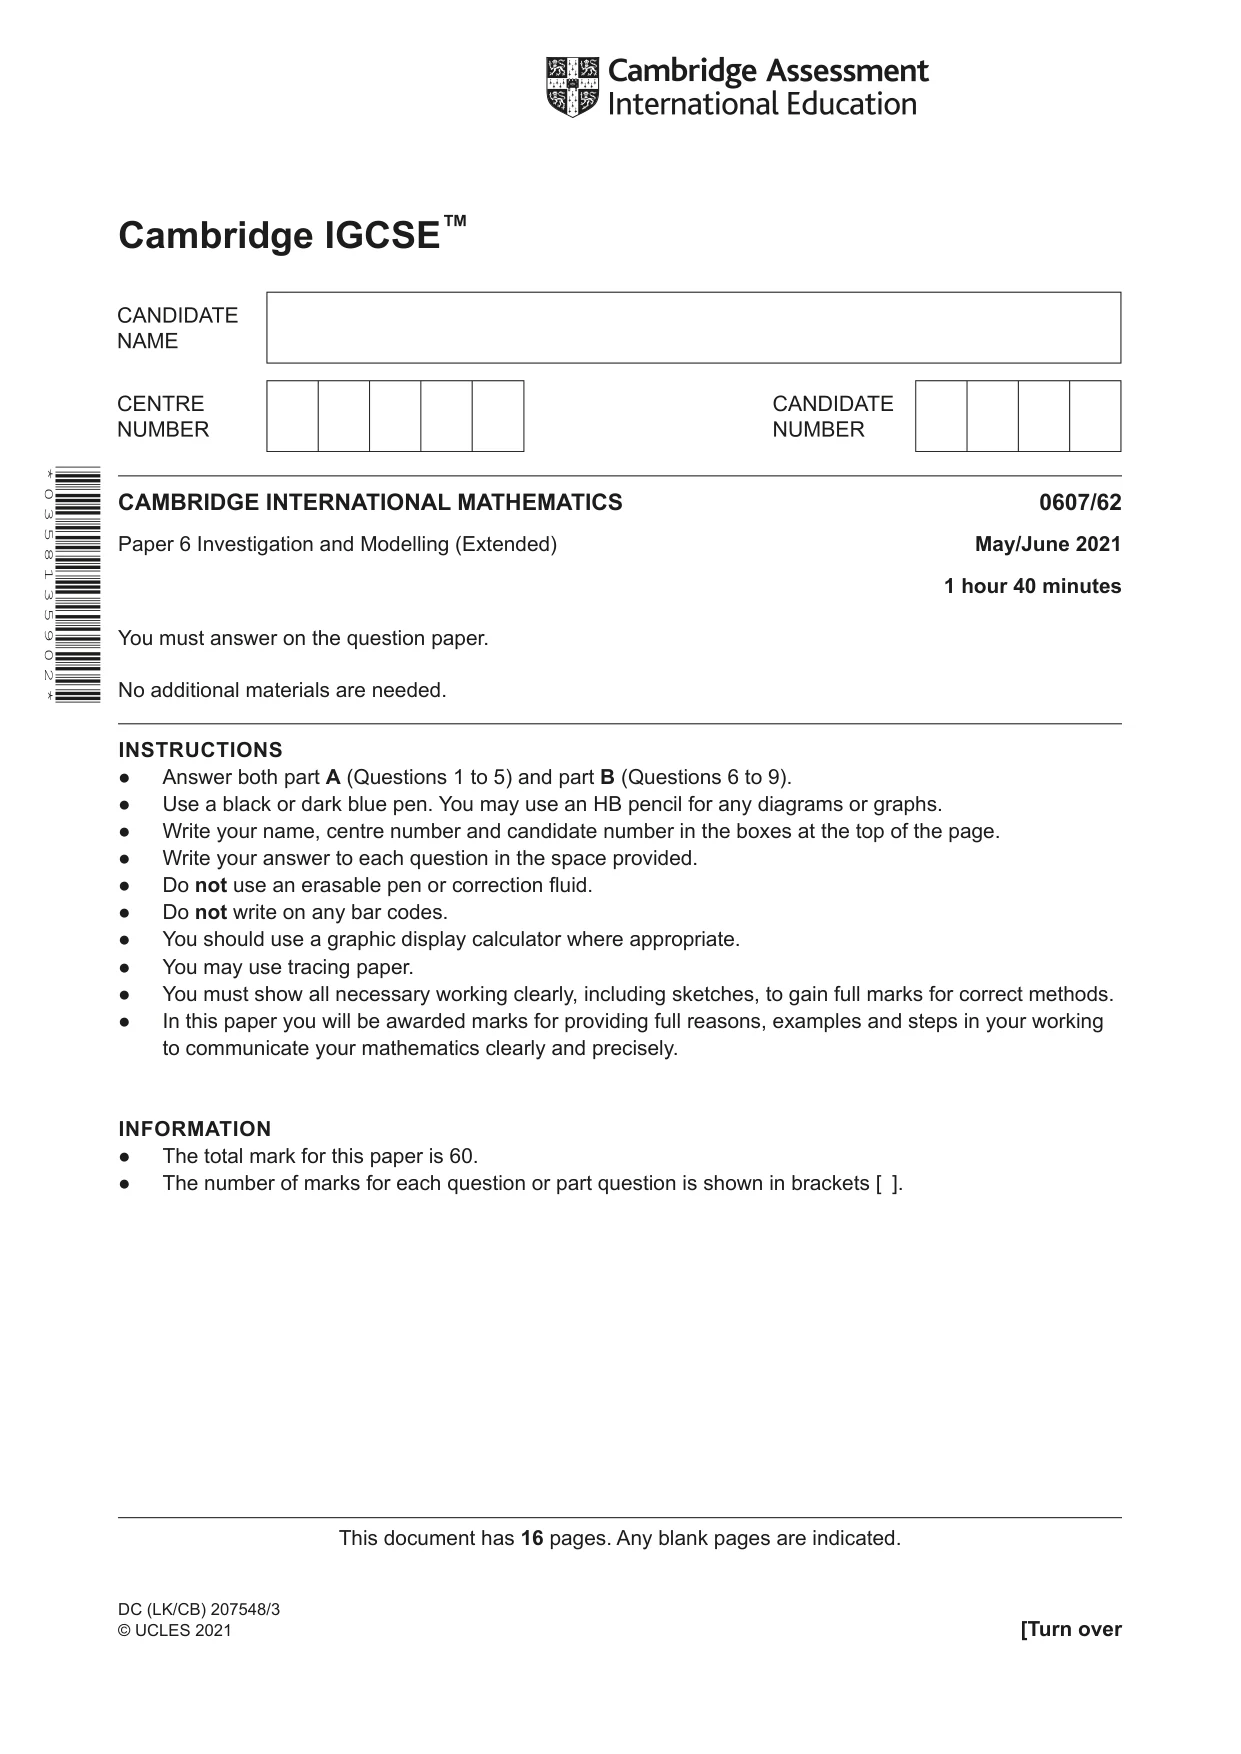


Mark scheme9 pages
Answers below. Sit the paper first if you are practising.
Paper as text
Question paper, page 1
This document has 16 pages. Any blank pages are indicated. Cambridge IGCSE™ CAMBRIDGE INTERNATIONAL MATHEMATICS 0607/62 Paper 6 Investigation and Modelling (Extended) May/June 2021 1 hour 40 minutes You must answer on the question paper. No additional materials are needed. INSTRUCTIONS ● Answer both part A (Questions 1 to 5) and part B (Questions 6 to 9). ● Use a black or dark blue pen. You may use an HB pencil for any diagrams or graphs. ● Write your name, centre number and candidate number in the boxes at the top of the page. ● Write your answer to each question in the space provided. ● Do not use an erasable pen or correction fluid. ● Do not write on any bar codes. ● You should use a graphic display calculator where appropriate. ● You may use tracing paper. ● You must show all necessary working clearly, including sketches, to gain full marks for correct methods. ● In this paper you will be awarded marks for providing full reasons, examples and steps in your working to communicate your mathematics clearly and precisely. INFORMATION ● The total mark for this paper is 60. ● The number of marks for each question or part question is shown in brackets [ ]. DC (LK/CB) 207548/3 © UCLES 2021 [Turn over * 0 3 5 8 1 3 5 9 0 2 *
Question paper, page 2
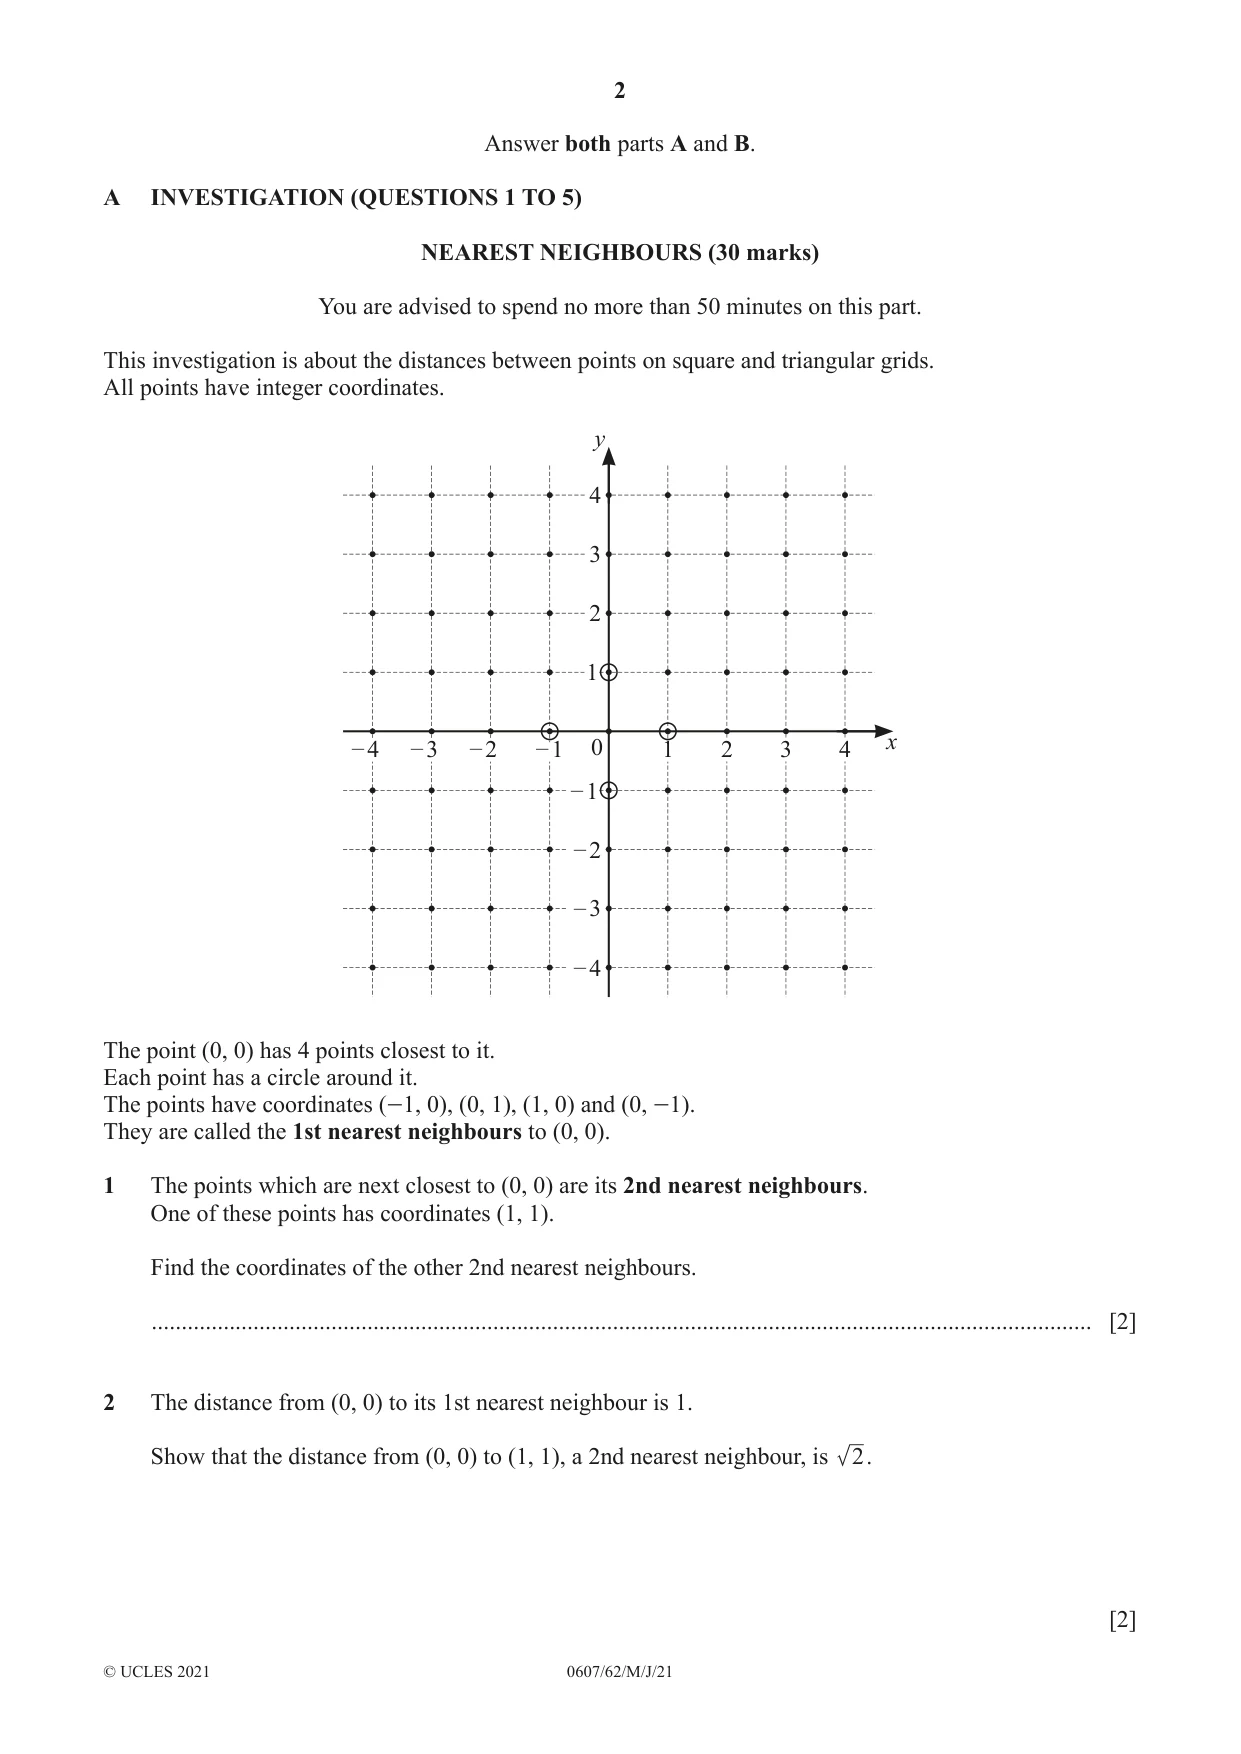
2 0607/62/M/J/21 © UCLES 2021 Answer both parts A and B. A INVESTIGATION (QUESTIONS 1 TO 5) NEAREST NEIGHBOURS (30 marks) You are advised to spend no more than 50 minutes on this part. This investigation is about the distances between points on square and triangular grids. All points have integer coordinates. x y 0 1 1 – 1 – 1 2 – 2 – 3 – 4 3 4 2 – 2 3 – 3 4 – 4 The point (0, 0) has 4 points closest to it. Each point has a circle around it. The points have coordinates (-1, 0), (0, 1), (1, 0) and (0, -1). They are called the 1st nearest neighbours to (0, 0). 1 The points which are next closest to (0, 0) are its 2nd nearest neighbours. One of these points has coordinates (1, 1). Find the coordinates of the other 2nd nearest neighbours. … [2] 2 The distance from (0, 0) to its 1st nearest neighbour is 1. Show that the distance from (0, 0) to (1, 1), a 2nd nearest neighbour, is 2. [2]
Question paper, page 3
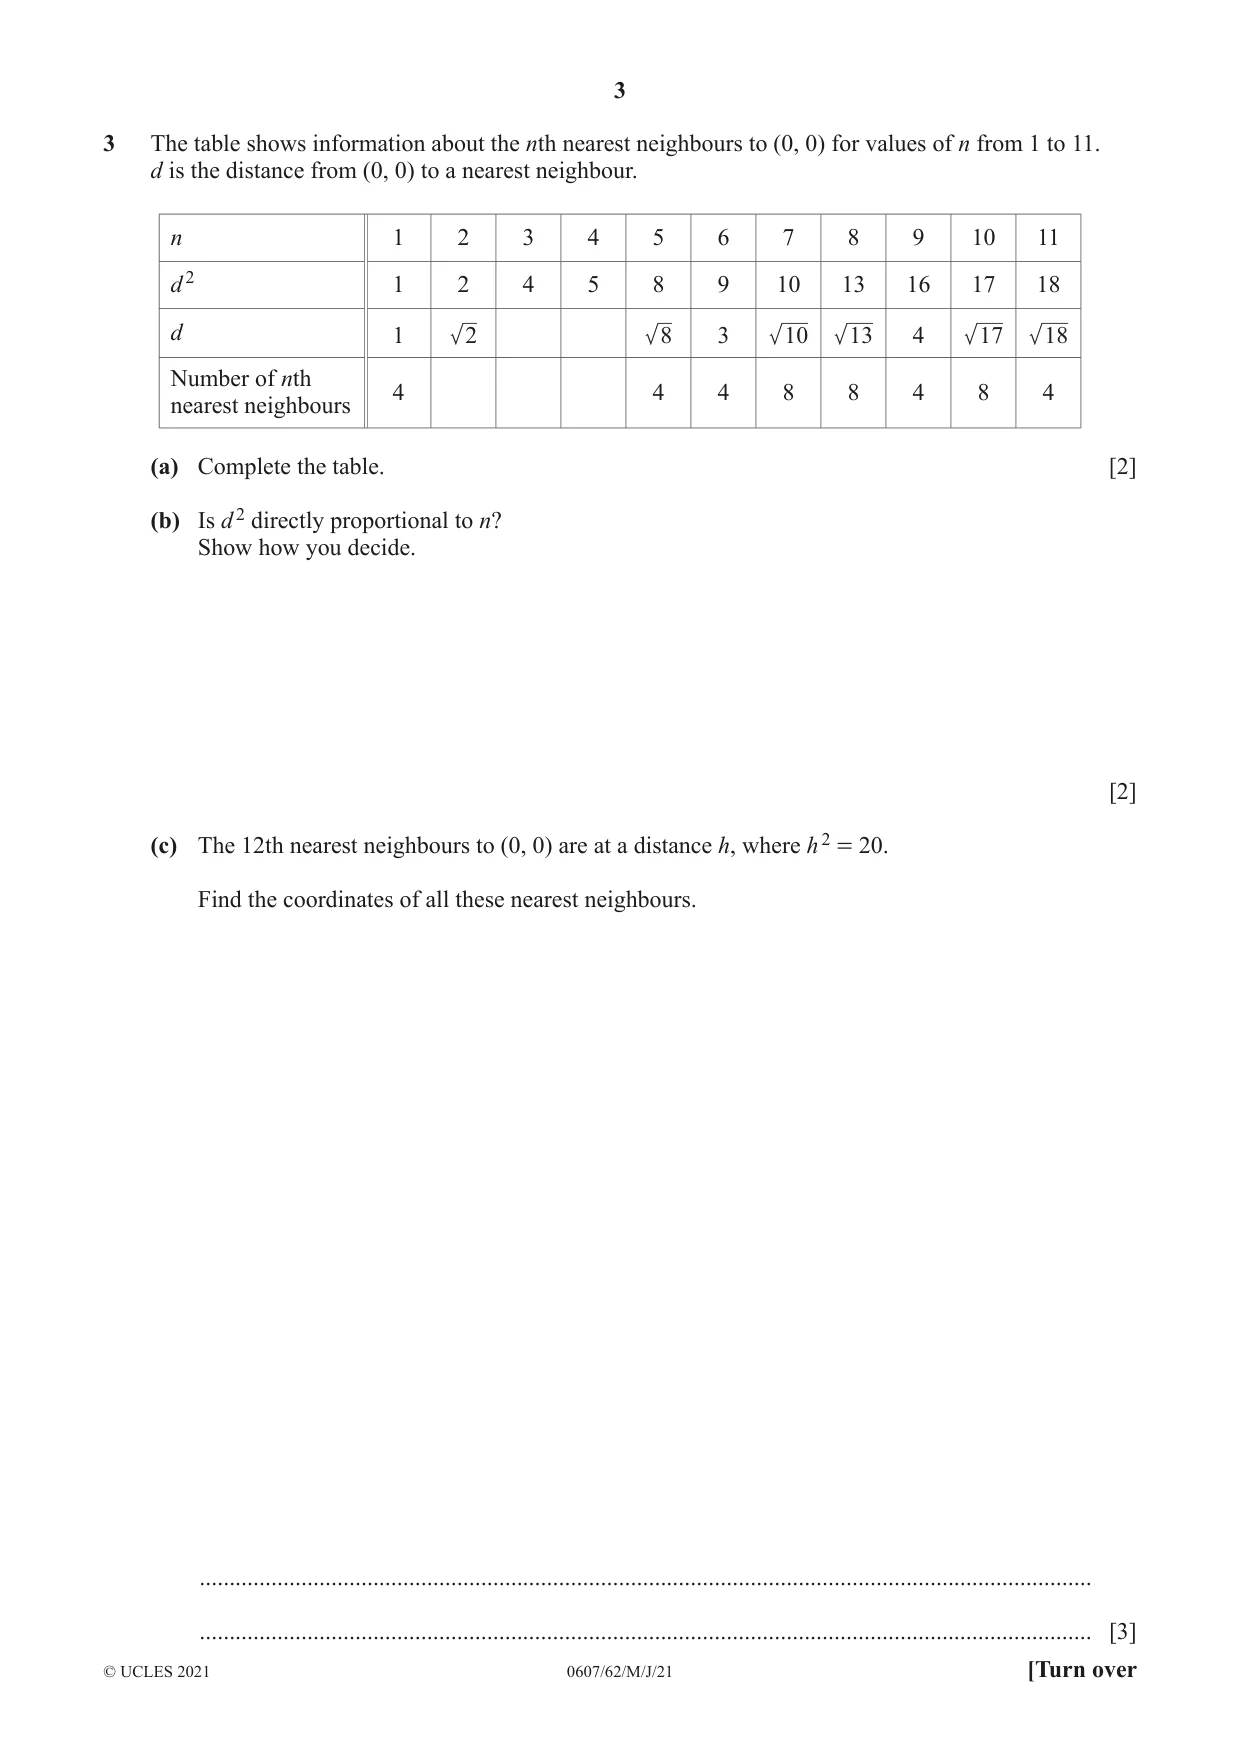
3 0607/62/M/J/21 © UCLES 2021 [Turn over 3 The table shows information about the nth nearest neighbours to (0, 0) for values of n from 1 to 11. d is the distance from (0, 0) to a nearest neighbour. n 1 2 3 4 5 6 7 8 9 10 11 d 2 1 2 4 5 8 9 10 13 16 17 18 d 1 2 8 3 10 13 4 17 18 Number of nth nearest neighbours 4 4 4 8 8 4 8 4 (a) Complete the table. [2] (b) Is d 2 directly proportional to n? Show how you decide. [2] (c) The 12th nearest neighbours to (0, 0) are at a distance h, where h 2 = 20. Find the coordinates of all these nearest neighbours. … … [3]
Question paper, page 4
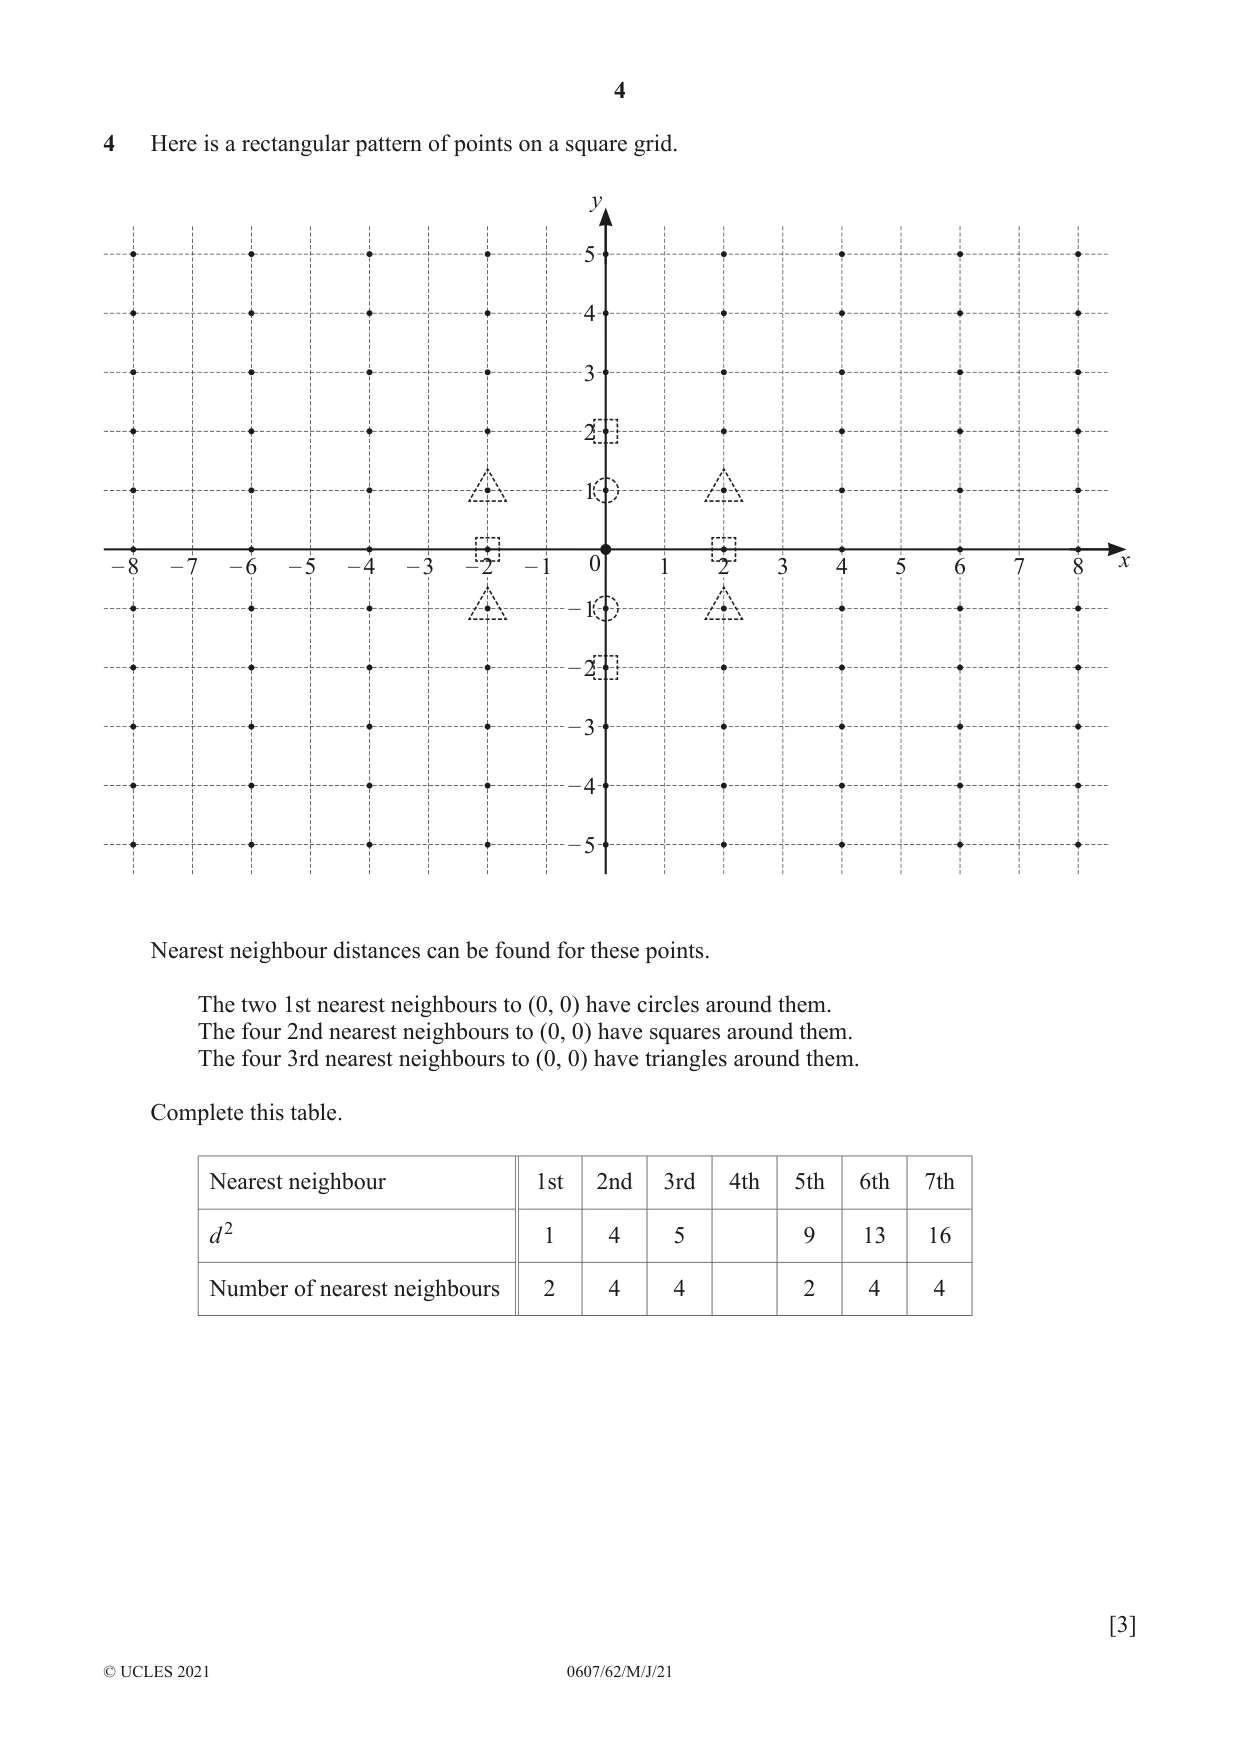
4 0607/62/M/J/21 © UCLES 2021 4 Here is a rectangular pattern of points on a square grid. x y 0 1 1 – 1 – 1 2 2 – 2 – 2 3 3 – 3 – 3 4 4 – 4 – 4 5 5 – 5 – 5 6 – 6 7 – 7 8 – 8 Nearest neighbour distances can be found for these points. The two 1st nearest neighbours to (0, 0) have circles around them. The four 2nd nearest neighbours to (0, 0) have squares around them. The four 3rd nearest neighbours to (0, 0) have triangles around them. Complete this table. Nearest neighbour 1st 2nd 3rd 4th 5th 6th 7th d 2 1 4 5 9 13 16 Number of nearest neighbours 2 4 4 2 4 4 [3]
Question paper, page 5
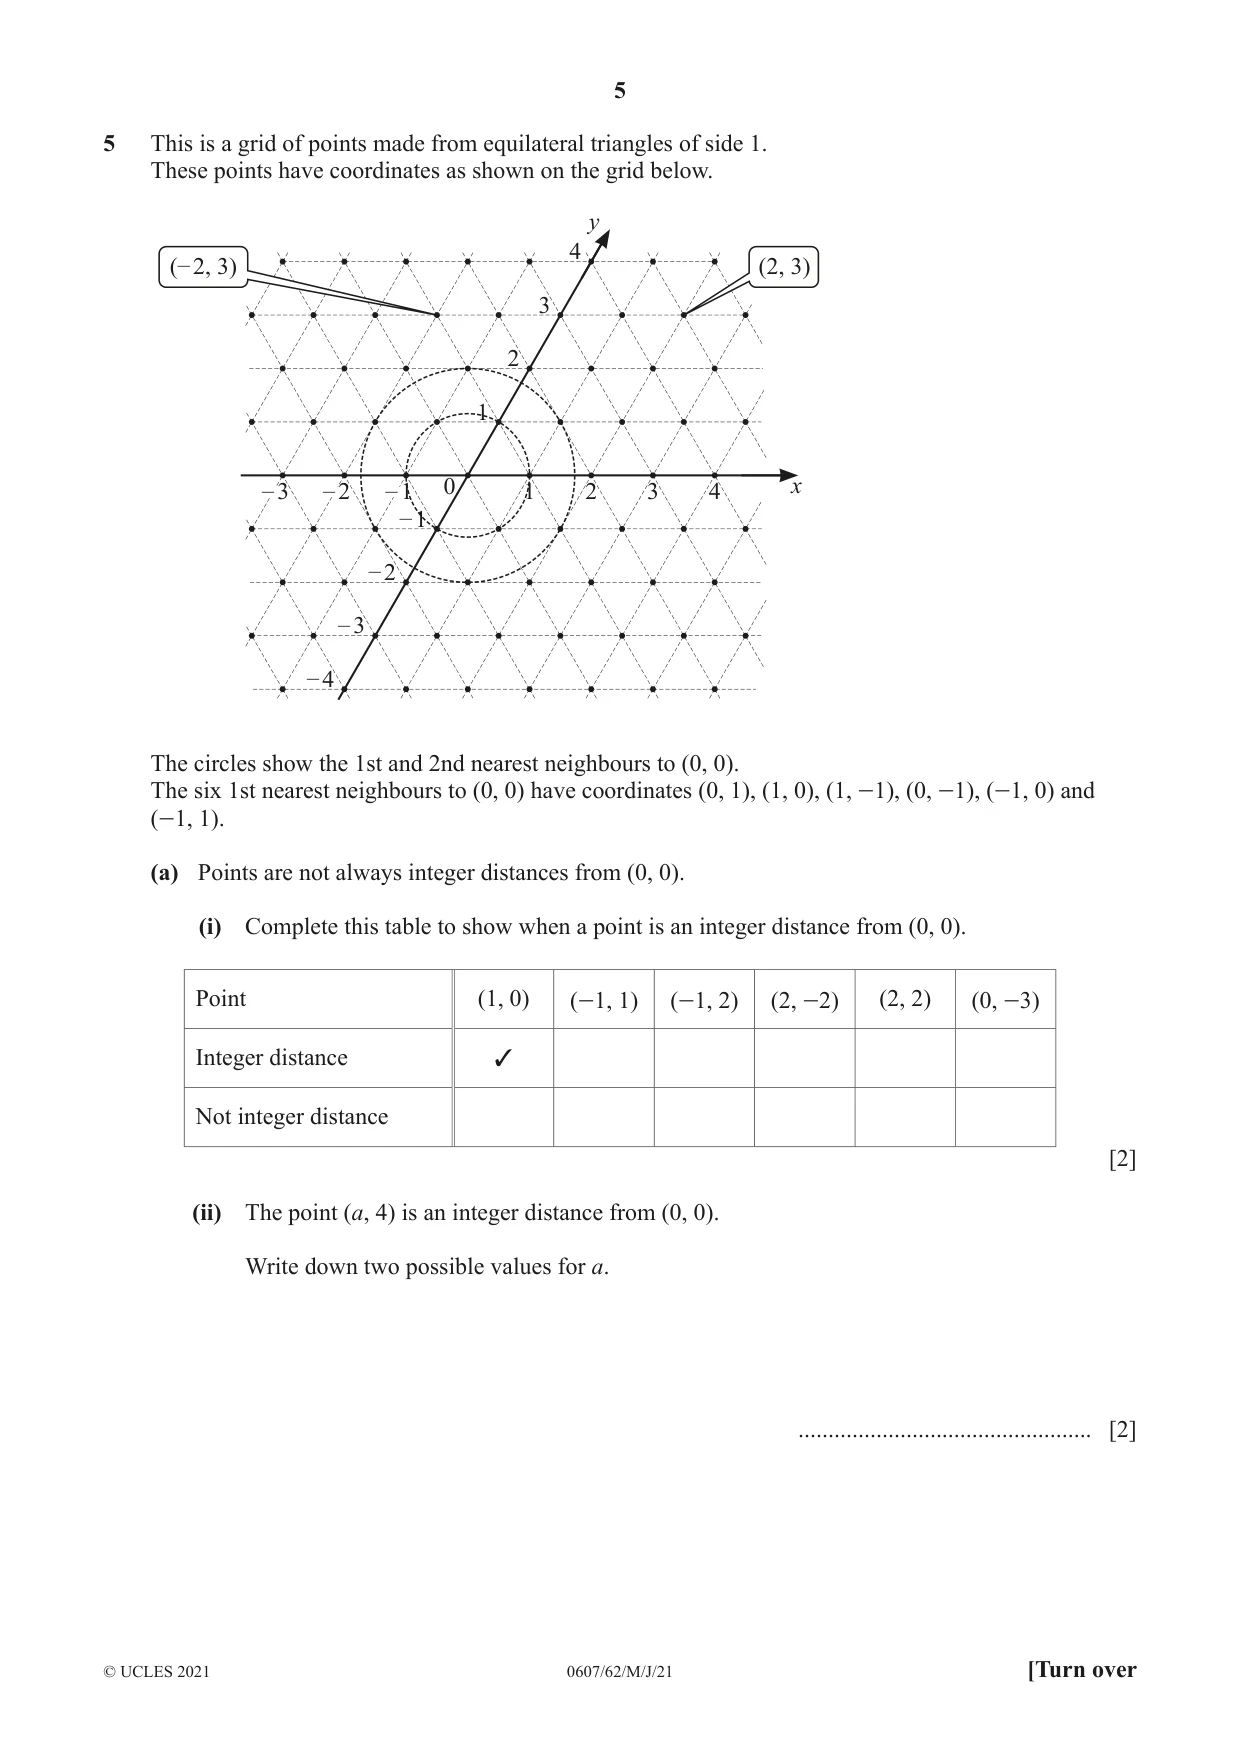
5 0607/62/M/J/21 © UCLES 2021 [Turn over 5 This is a grid of points made from equilateral triangles of side 1. These points have coordinates as shown on the grid below. x y 0 – 1 – 1 1 2 3 4 1 2 3 4 – 2 – 2 – 3 – 3 – 4 (– 2, 3) (2, 3) The circles show the 1st and 2nd nearest neighbours to (0, 0). The six 1st nearest neighbours to (0, 0) have coordinates (0, 1), (1, 0), (1, -1), (0, -1), (-1, 0) and (-1, 1). (a) Points are not always integer distances from (0, 0). (i) Complete this table to show when a point is an integer distance from (0, 0). Point (1, 0) (-1, 1) (-1, 2) (2, -2) (2, 2) (0, -3) Integer distance 3 Not integer distance [2] (ii) The point (a, 4) is an integer distance from (0, 0). Write down two possible values for a. … [2]
Question paper, page 6
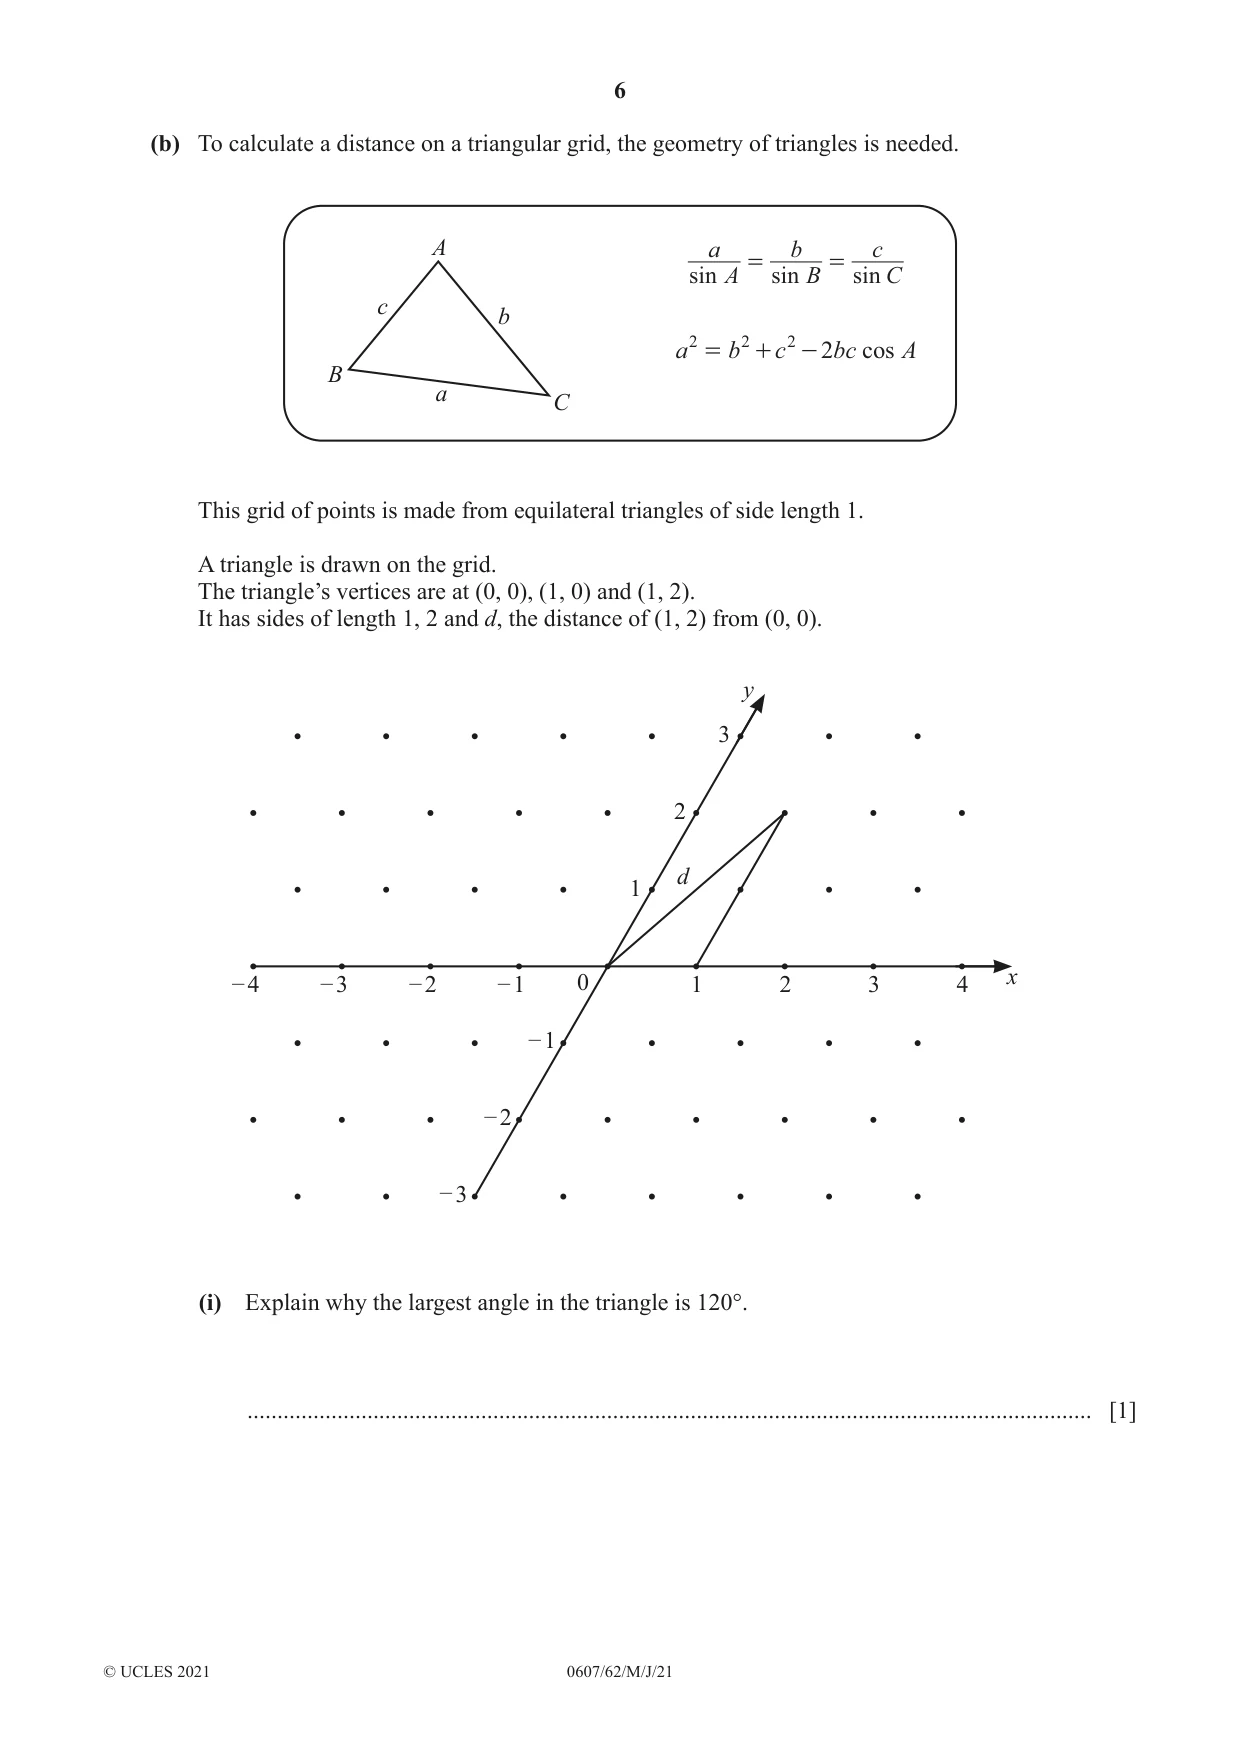
6 0607/62/M/J/21 © UCLES 2021 (b) To calculate a distance on a triangular grid, the geometry of triangles is needed. A B C a c b sin sin sin A a B b C c = = cos a b c bc A 2 2 2 2 = + - This grid of points is made from equilateral triangles of side length 1. A triangle is drawn on the grid. The triangle’s vertices are at (0, 0), (1, 0) and (1, 2). It has sides of length 1, 2 and d, the distance of (1, 2) from (0, 0). x y 4 3 3 2 d 2 1 1 – 1 – 1 – 2 – 2 – 3 – 3 – 4 0 (i) Explain why the largest angle in the triangle is 120°. … [1]
Question paper, page 7
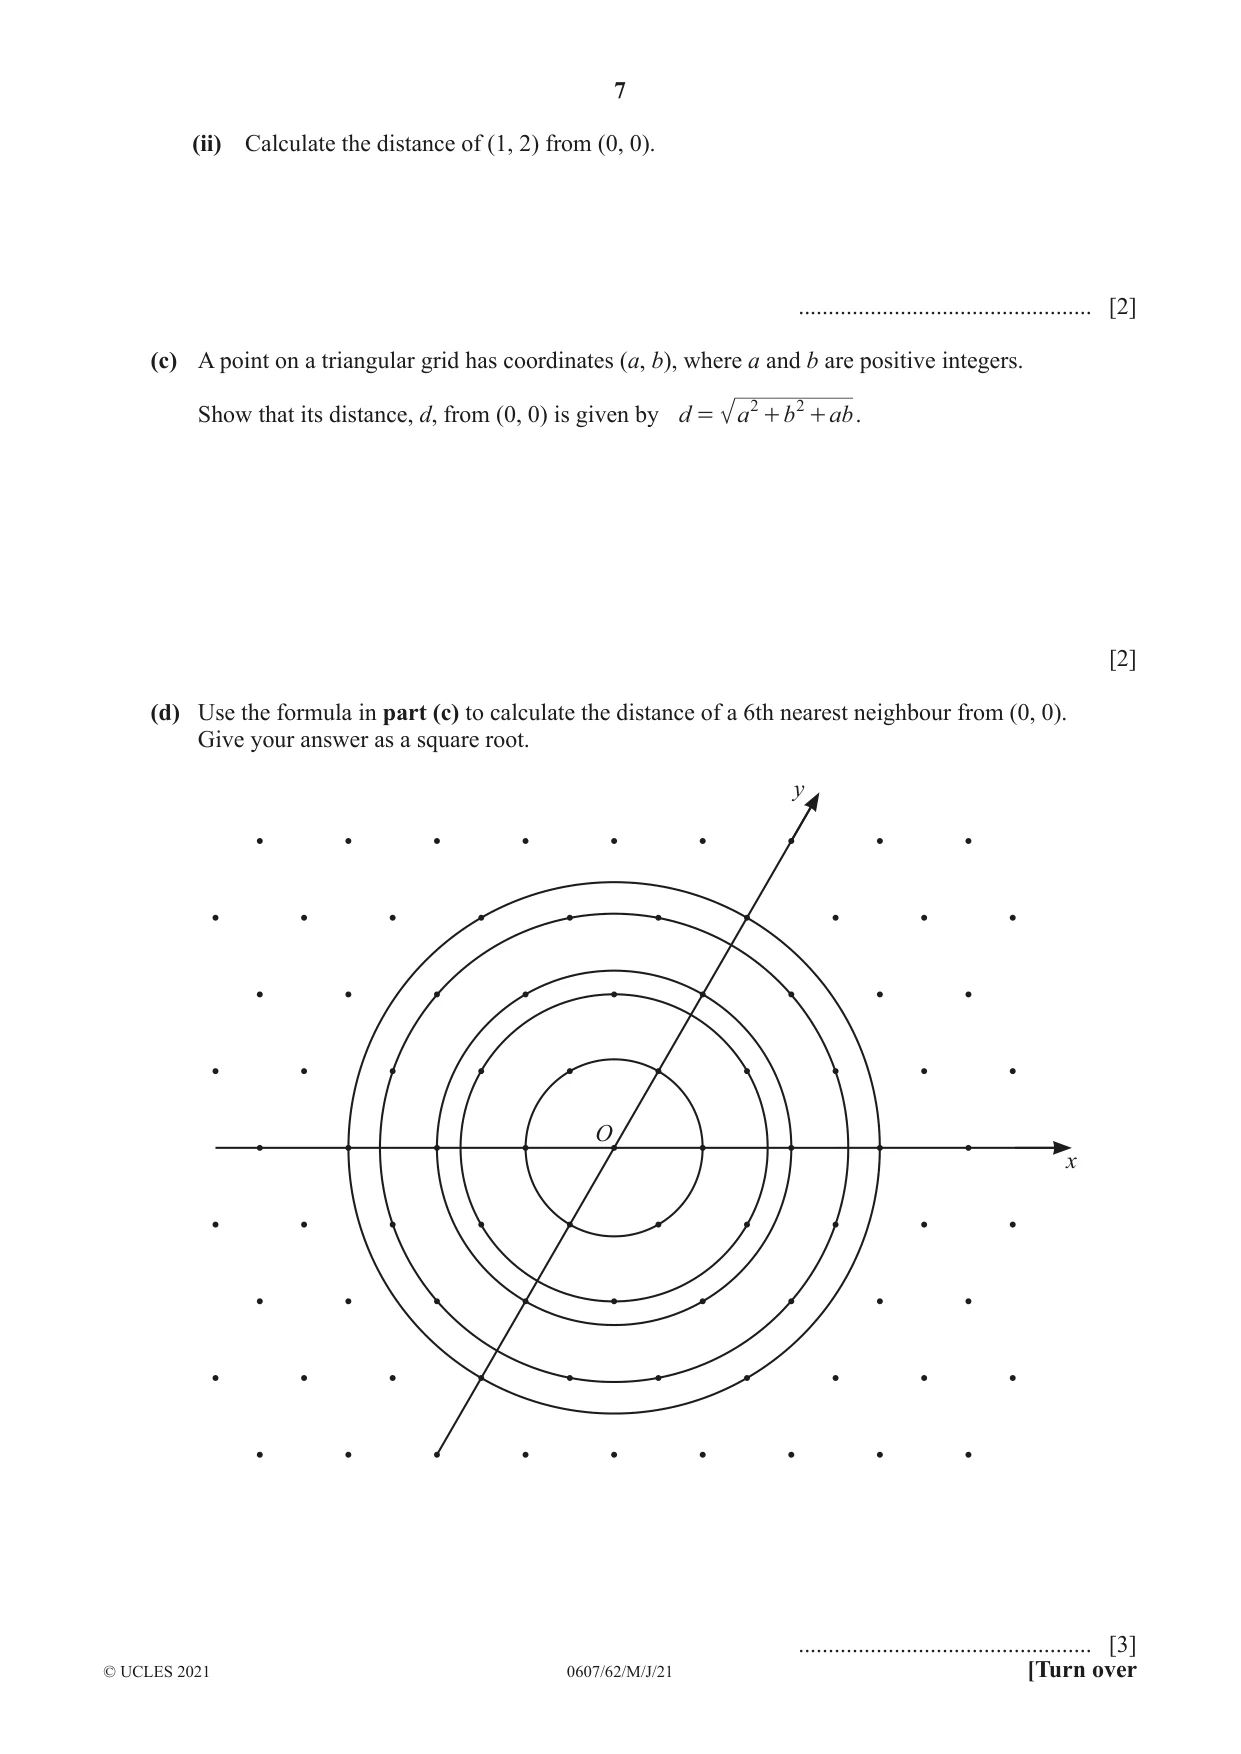
7 0607/62/M/J/21 © UCLES 2021 [Turn over (ii) Calculate the distance of (1, 2) from (0, 0). … [2] (c) A point on a triangular grid has coordinates (a, b), where a and b are positive integers. Show that its distance, d, from (0, 0) is given by d a b ab 2 2 = + + . [2] (d) Use the formula in part (c) to calculate the distance of a 6th nearest neighbour from (0, 0). Give your answer as a square root. x y O … [3]
Question paper, page 8
8 0607/62/M/J/21 © UCLES 2021 (e) Use the formula d a b ab 2 2 = + + to show that it is not possible for a nearest neighbour to be a distance of 14 from (0, 0) on a triangular grid. [4]
Question paper, page 9
9 0607/62/M/J/21 © UCLES 2021 [Turn over The modelling task starts on the next page.
Question paper, page 10
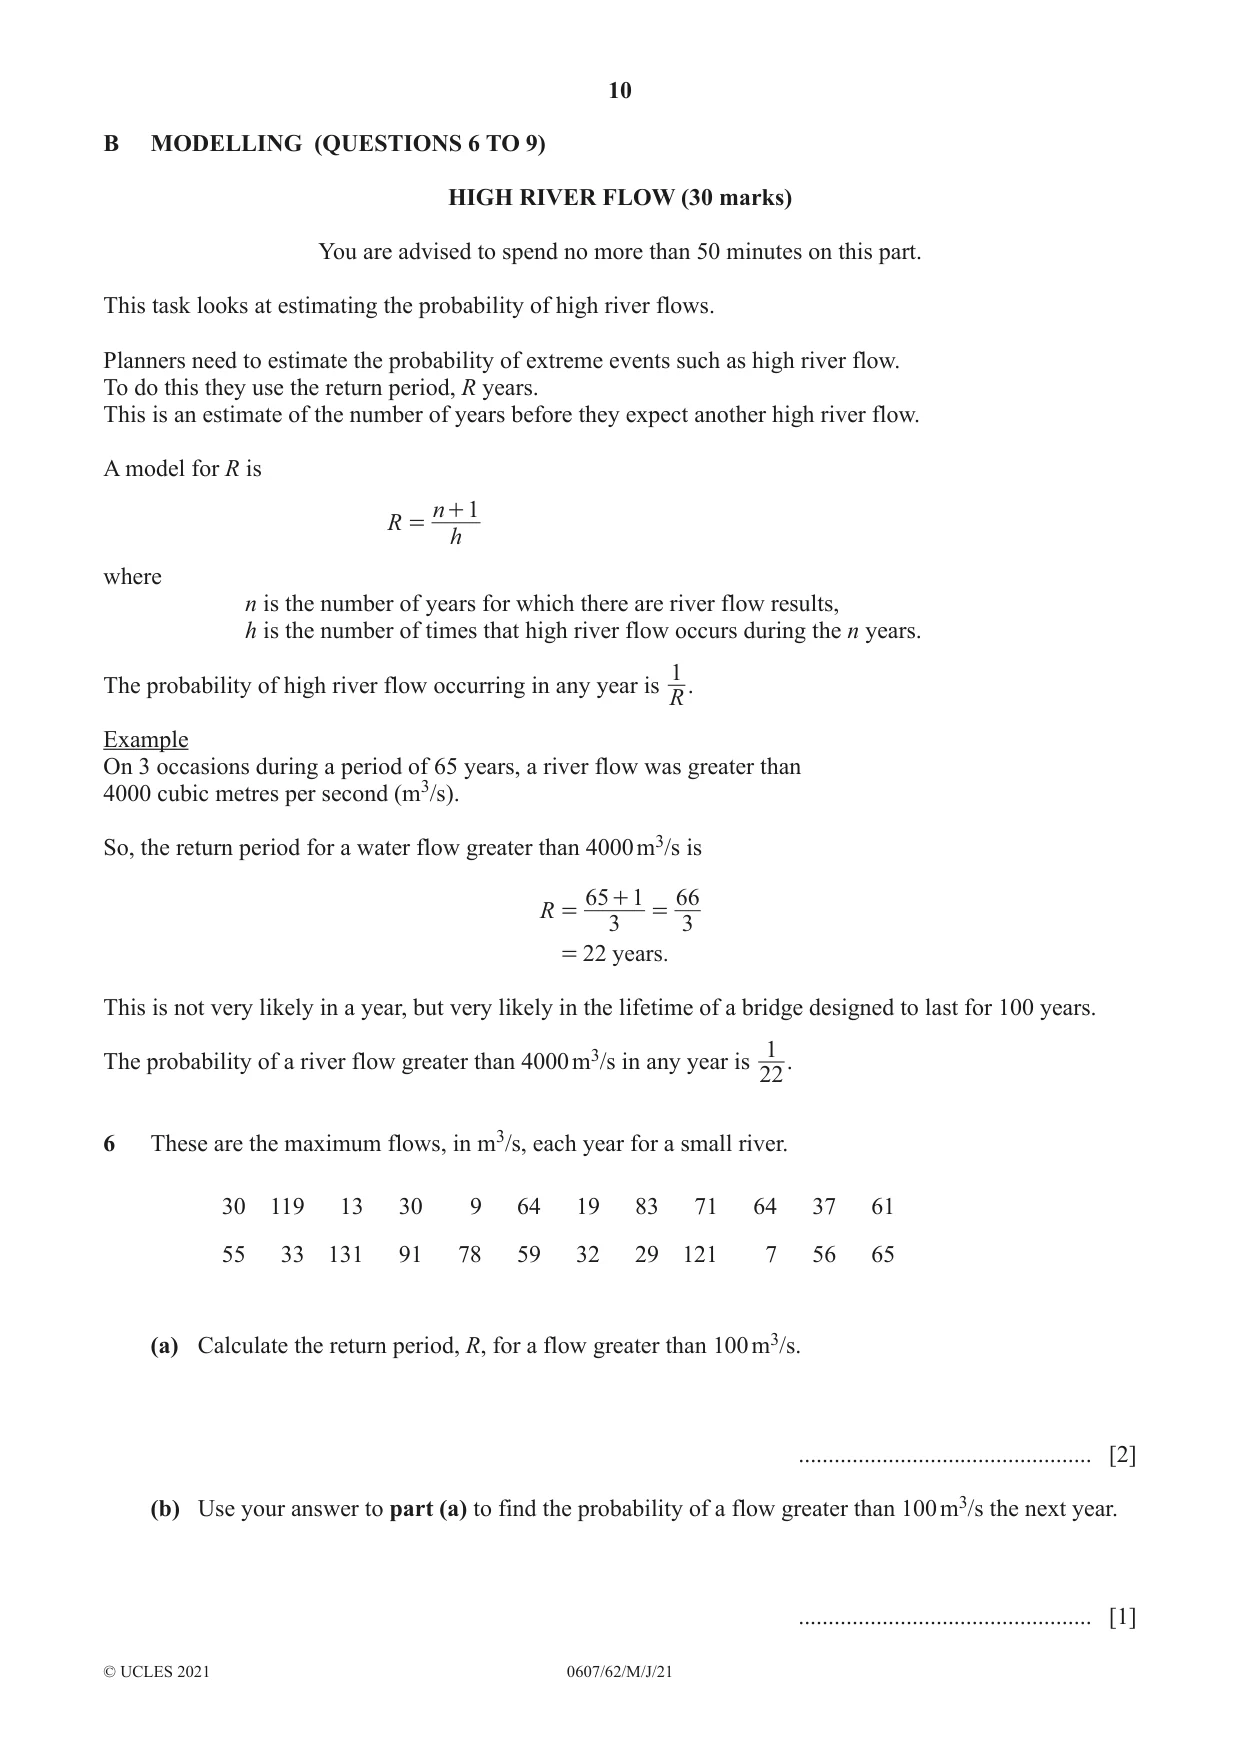
10 0607/62/M/J/21 © UCLES 2021 B MODELLING (QUESTIONS 6 TO 9) HIGH RIVER FLOW (30 marks) You are advised to spend no more than 50 minutes on this part. This task looks at estimating the probability of high river flows. Planners need to estimate the probability of extreme events such as high river flow. To do this they use the return period, R years. This is an estimate of the number of years before they expect another high river flow. A model for R is R h n 1 = + where n is the number of years for which there are river flow results, h is the number of times that high river flow occurs during the n years. The probability of high river flow occurring in any year is R 1 . Example On 3 occasions during a period of 65 years, a river flow was greater than 4000 cubic metres per second (m3/s). So, the return period for a water flow greater than 4000 m3/s is R 3 65 1 3 66 22 years. = + = = This is not very likely in a year, but very likely in the lifetime of a bridge designed to last for 100 years. The probability of a river flow greater than 4000 m3/s in any year is 22 1 . 6 These are the maximum flows, in m3/s, each year for a small river. 30 119 13 30 9 64 19 83 71 64 37 61 55 33 131 91 78 59 32 29 121 7 56 65 (a) Calculate the return period, R, for a flow greater than 100 m3/s. … [2] (b) Use your answer to part (a) to find the probability of a flow greater than 100 m3/s the next year. … [1]
Question paper, page 11
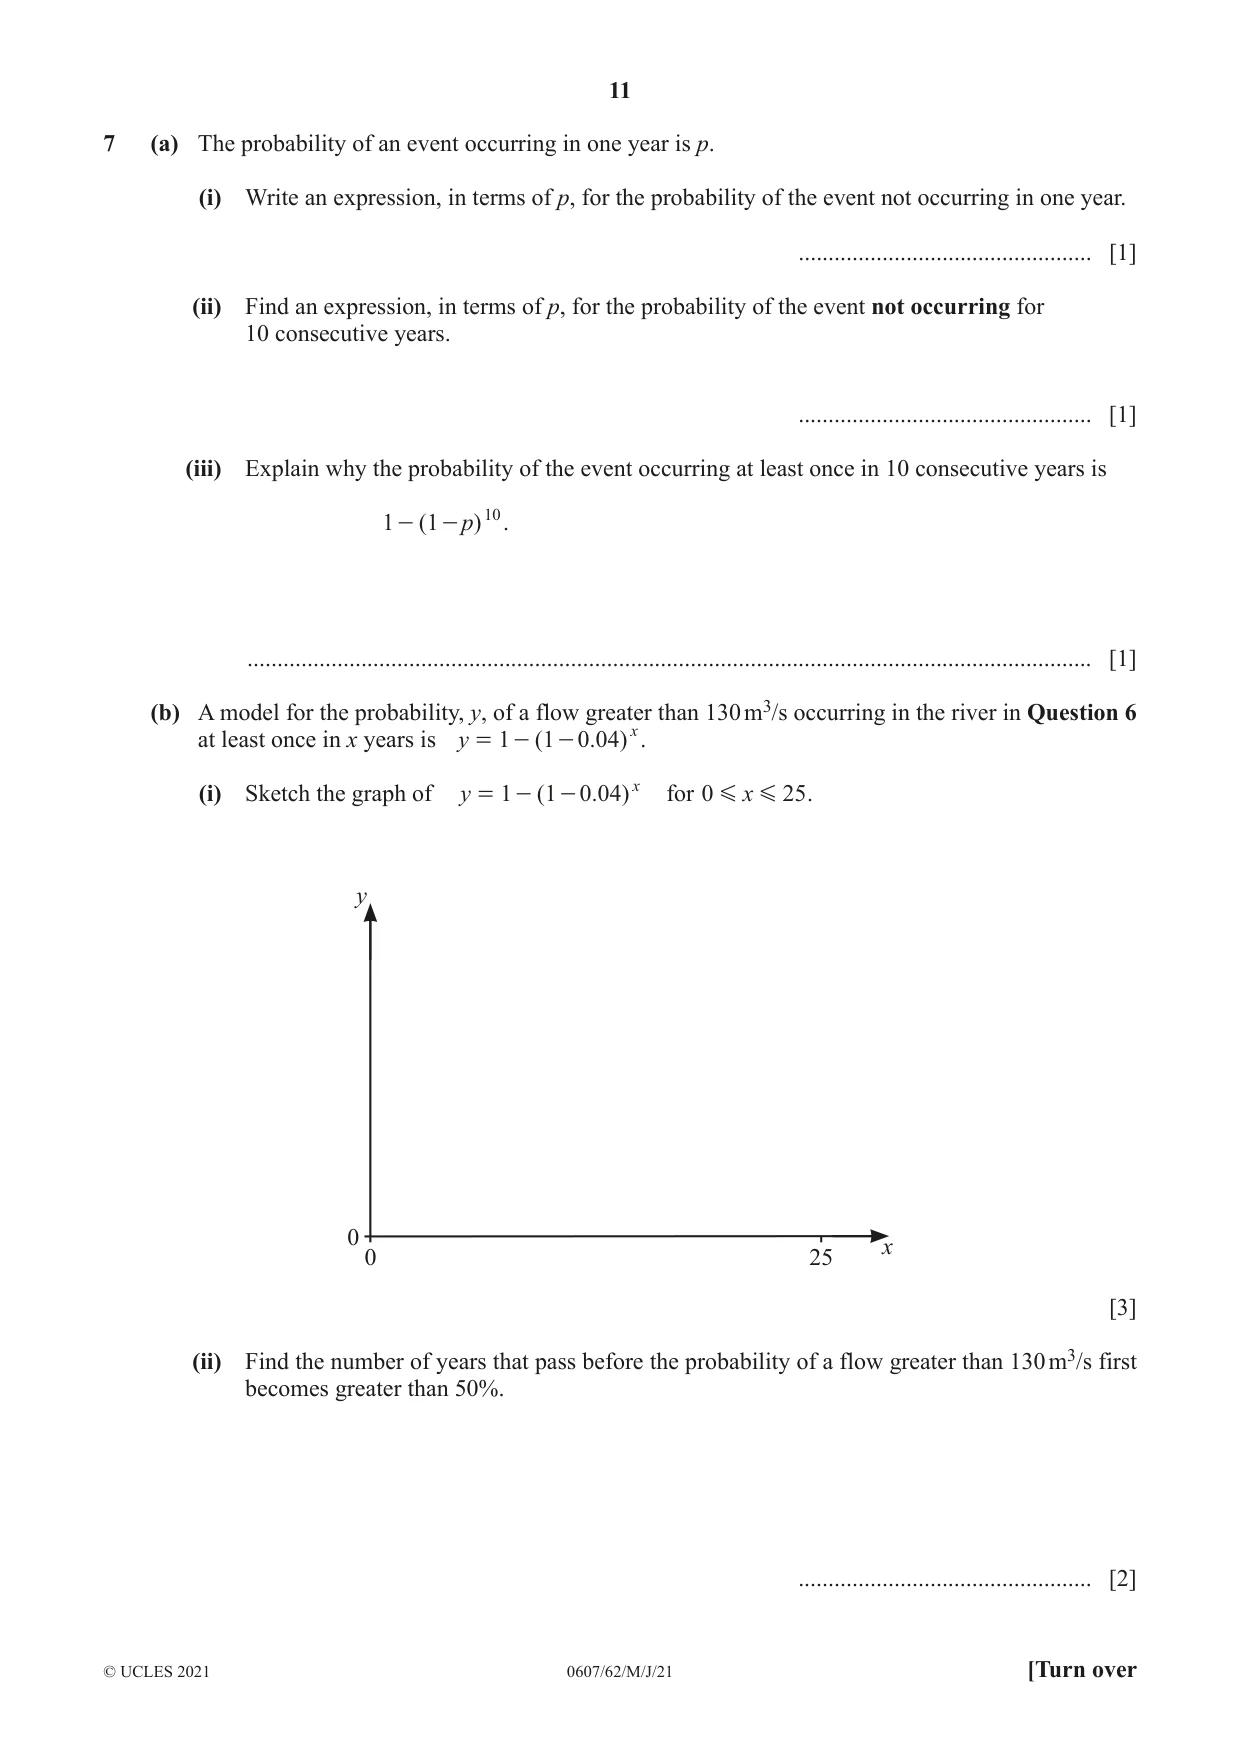
11 0607/62/M/J/21 © UCLES 2021 [Turn over 7 (a) The probability of an event occurring in one year is p. (i) Write an expression, in terms of p, for the probability of the event not occurring in one year. … [1] (ii) Find an expression, in terms of p, for the probability of the event not occurring for 10 consecutive years. … [1] (iii) Explain why the probability of the event occurring at least once in 10 consecutive years is ( ) p 1 1 10 - - . … [1] (b) A model for the probability, y, of a flow greater than 130 m3/s occurring in the river in Question 6 at least once in x years is ( . ) y 1 1 0 04 x = - - . (i) Sketch the graph of ( . ) y 1 1 0 04 x = - - for x 0 5 2 G G . x y 0 0 25 [3] (ii) Find the number of years that pass before the probability of a flow greater than 130 m3/s first becomes greater than 50%. … [2]
Question paper, page 12
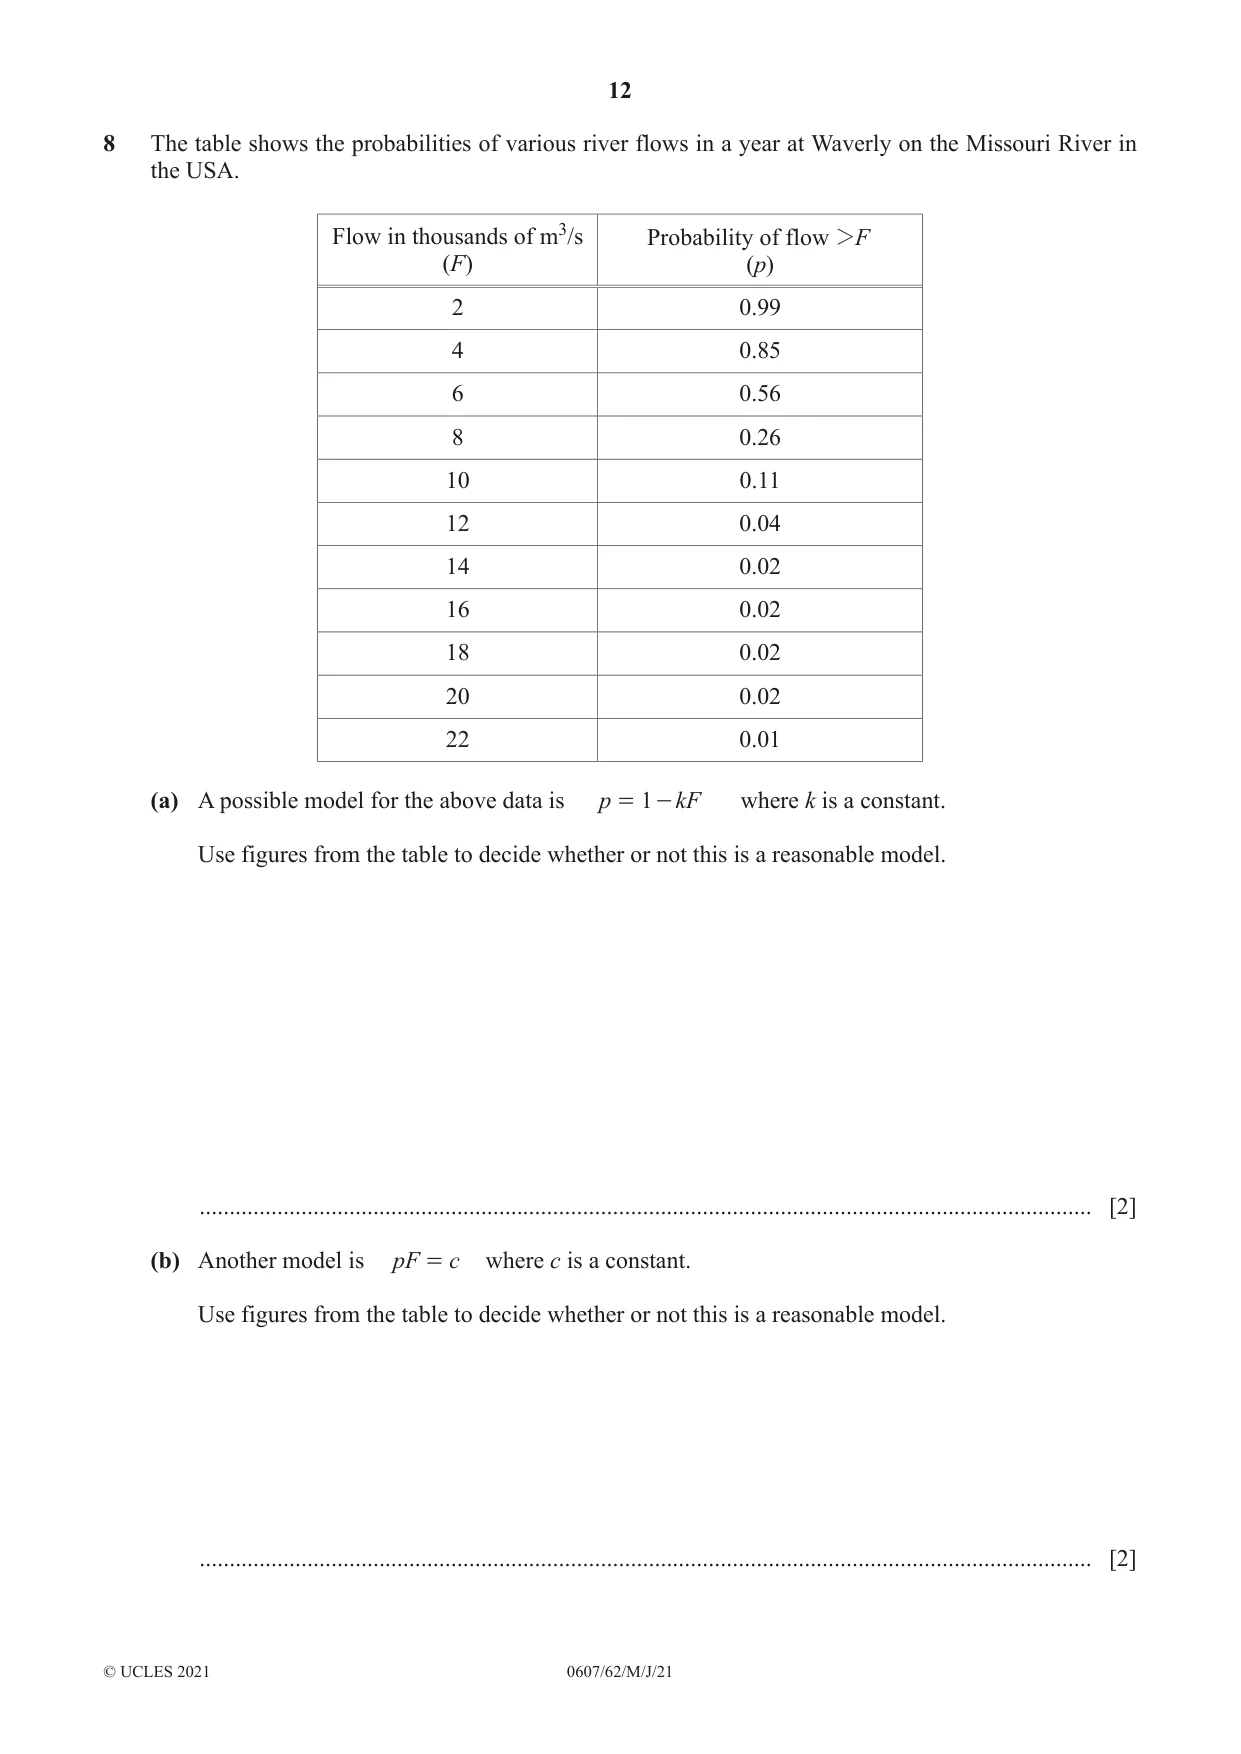
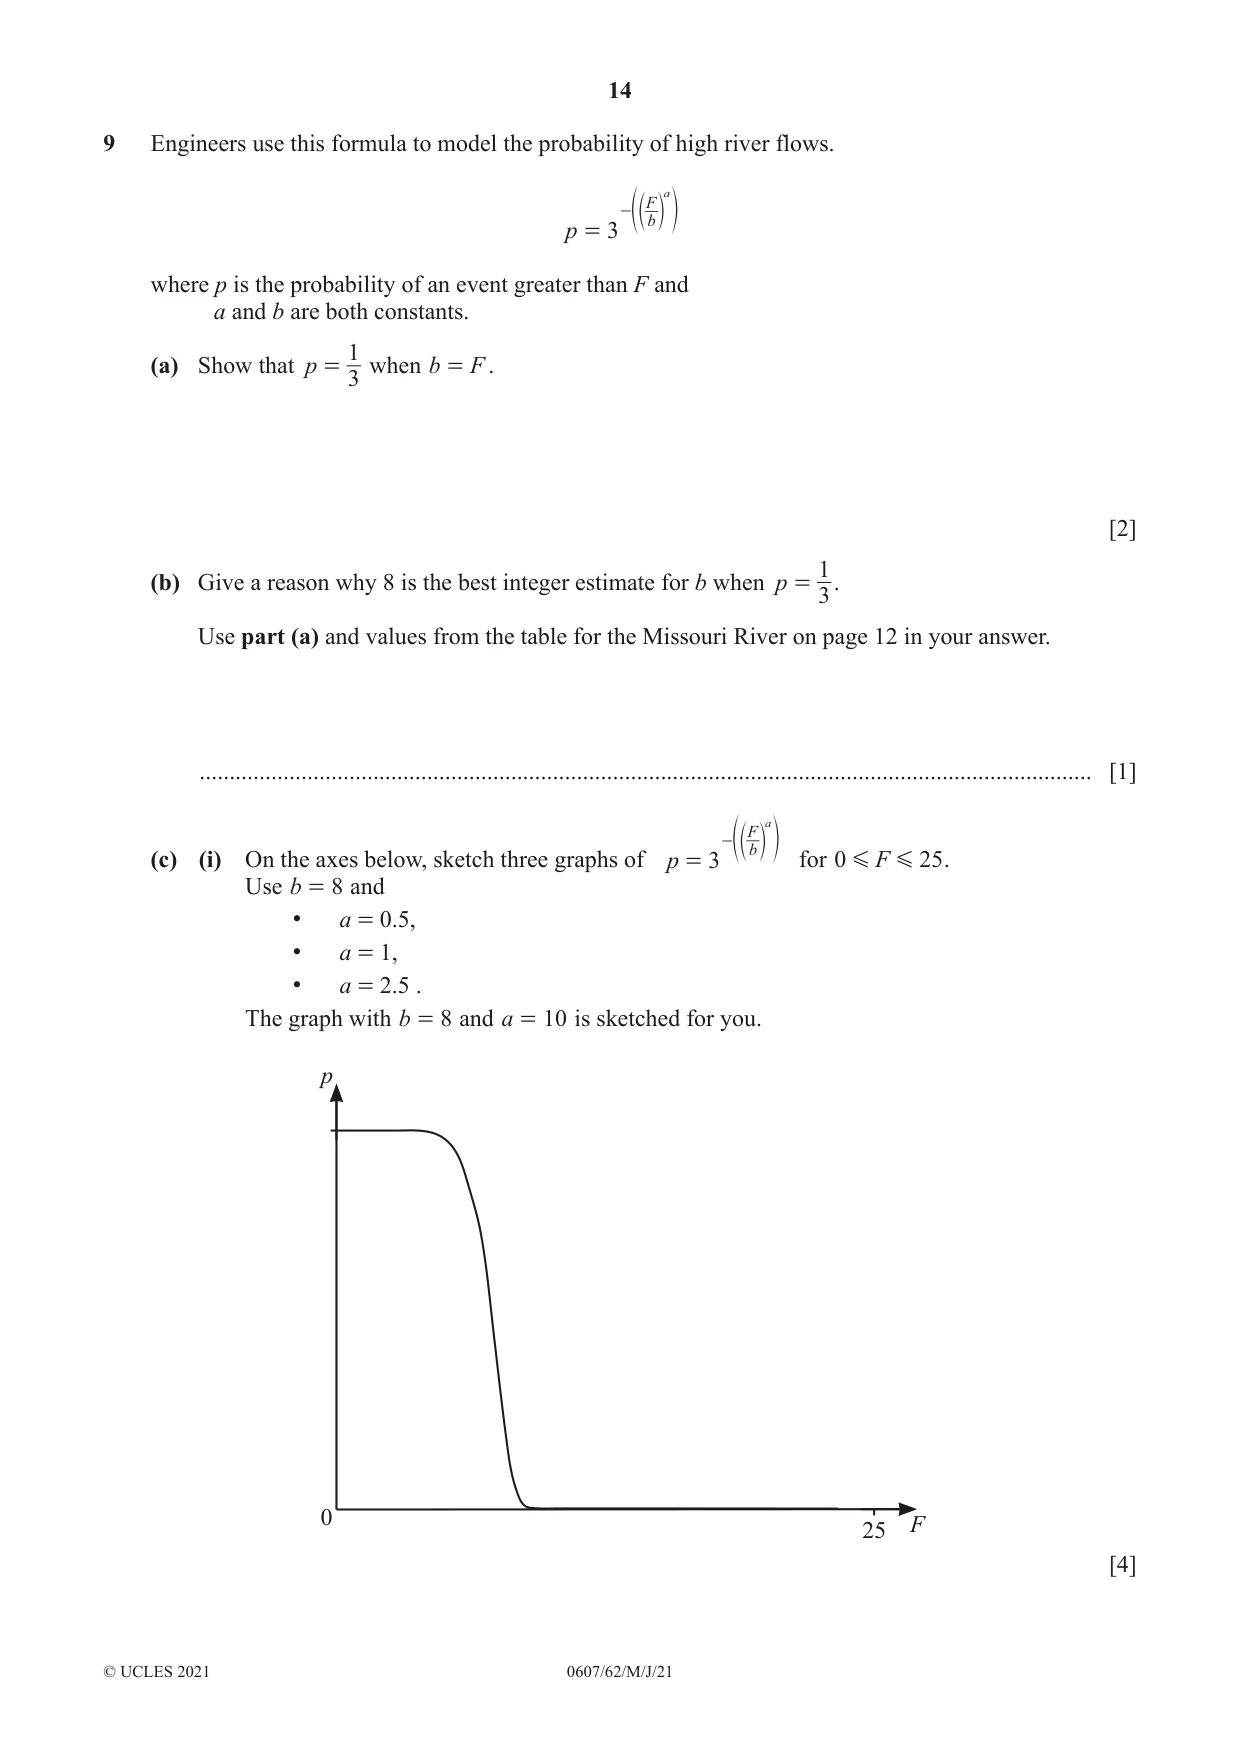
12 0607/62/M/J/21 © UCLES 2021 8 The table shows the probabilities of various river flows in a year at Waverly on the Missouri River in the USA. Flow in thousands of m3/s (F) Probability of flow F 2 (p) 2 0.99 4 0.85 6 0.56 8 0.26 10 0.11 12 0.04 14 0.02 16 0.02 18 0.02 20 0.02 22 0.01 (a) A possible model for the above data is p F k 1 = - where k is a constant. Use figures from the table to decide whether or not this is a reasonable model. … [2] (b) Another model is p c F = where c is a constant. Use figures from the table to decide whether or not this is a reasonable model. … [2]
Question paper, page 13
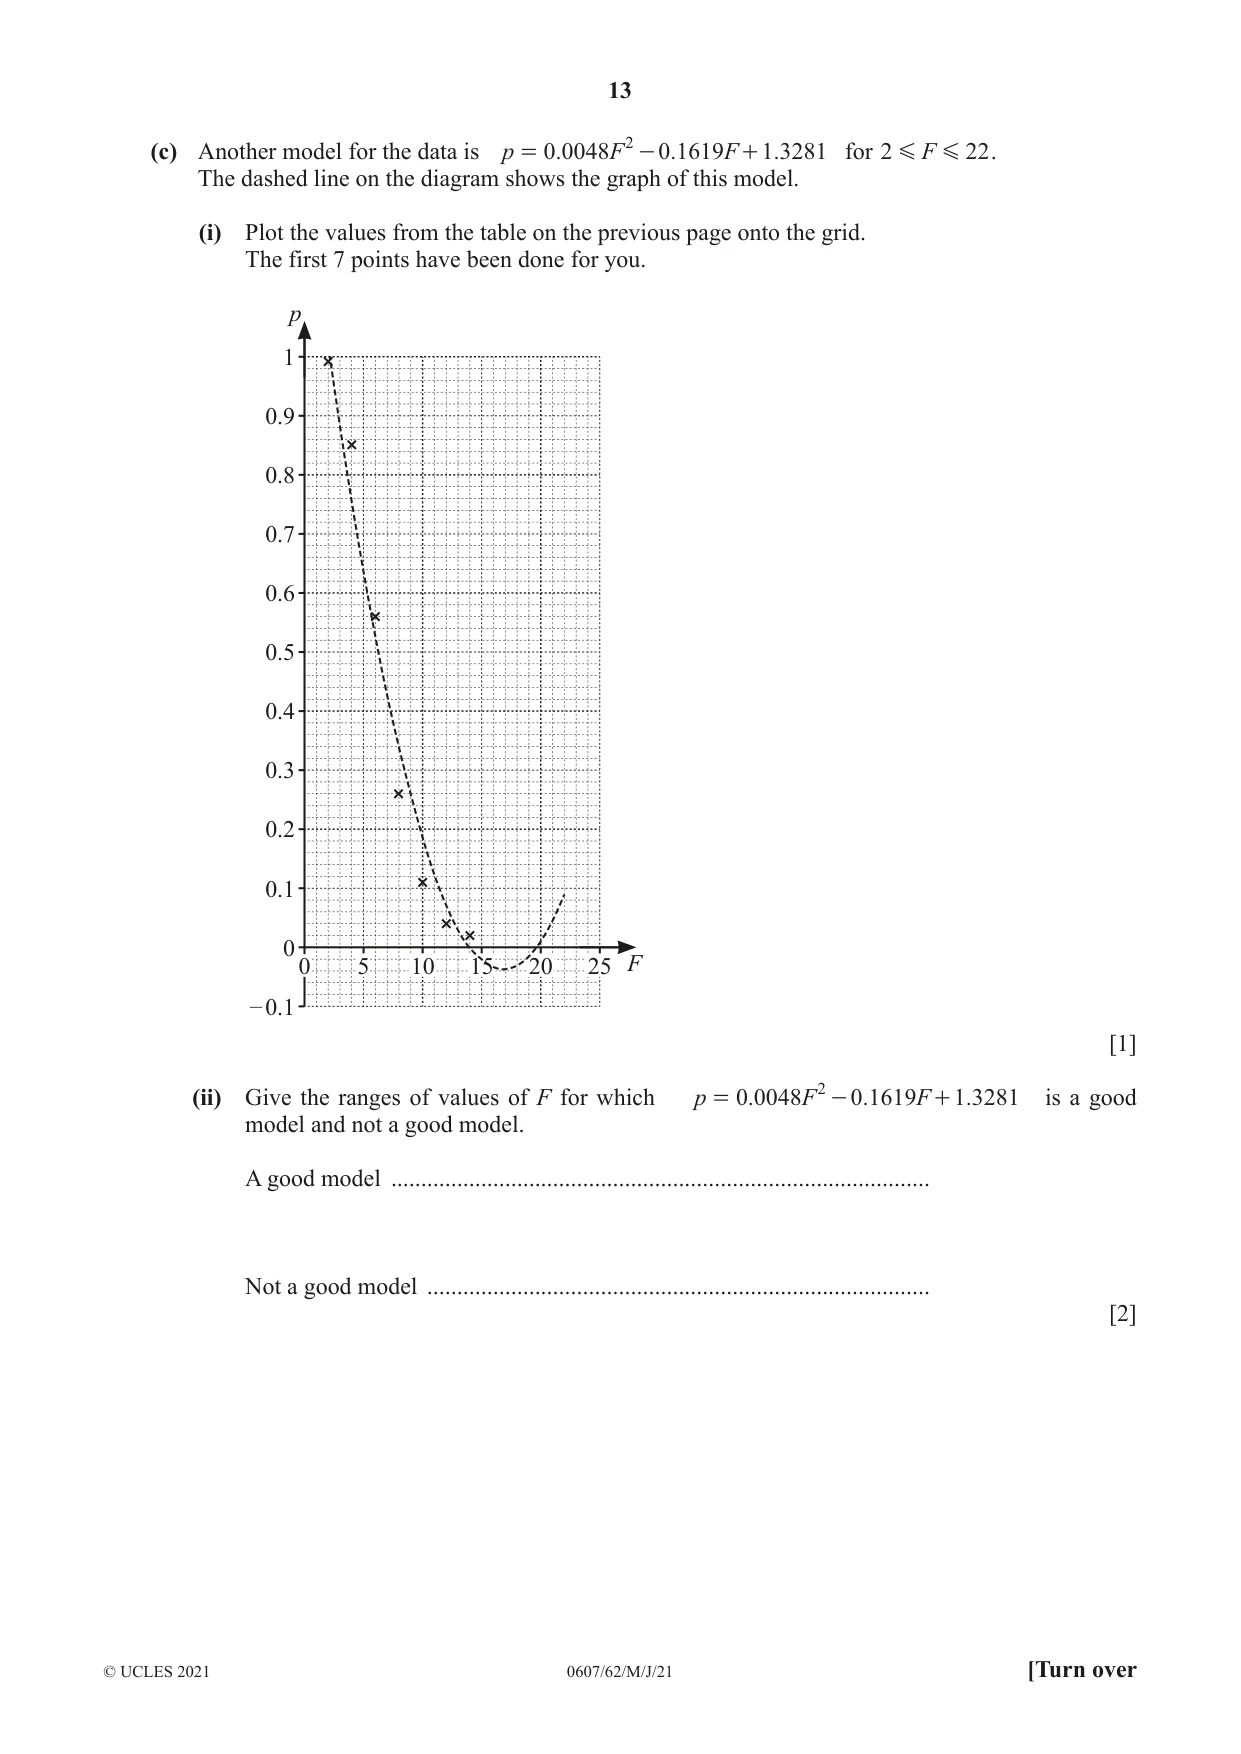
13 0607/62/M/J/21 © UCLES 2021 [Turn over (c) Another model for the data is . . . p F F 0 0048 1619 1 3281 0 2 = + - for F 2 22 G G . The dashed line on the diagram shows the graph of this model. (i) Plot the values from the table on the previous page onto the grid. The first 7 points have been done for you. F p 0 5 10 15 20 25 0 0.1 0.2 0.3 0.4 0.5 0.6 0.7 0.8 0.9 1 – 0.1 [1] (ii) Give the ranges of values of F for which . . . p F F 0 0048 1619 1 3281 0 2 = + - is a good model and not a good model. A good model … Not a good model … [2]
Question paper, page 14
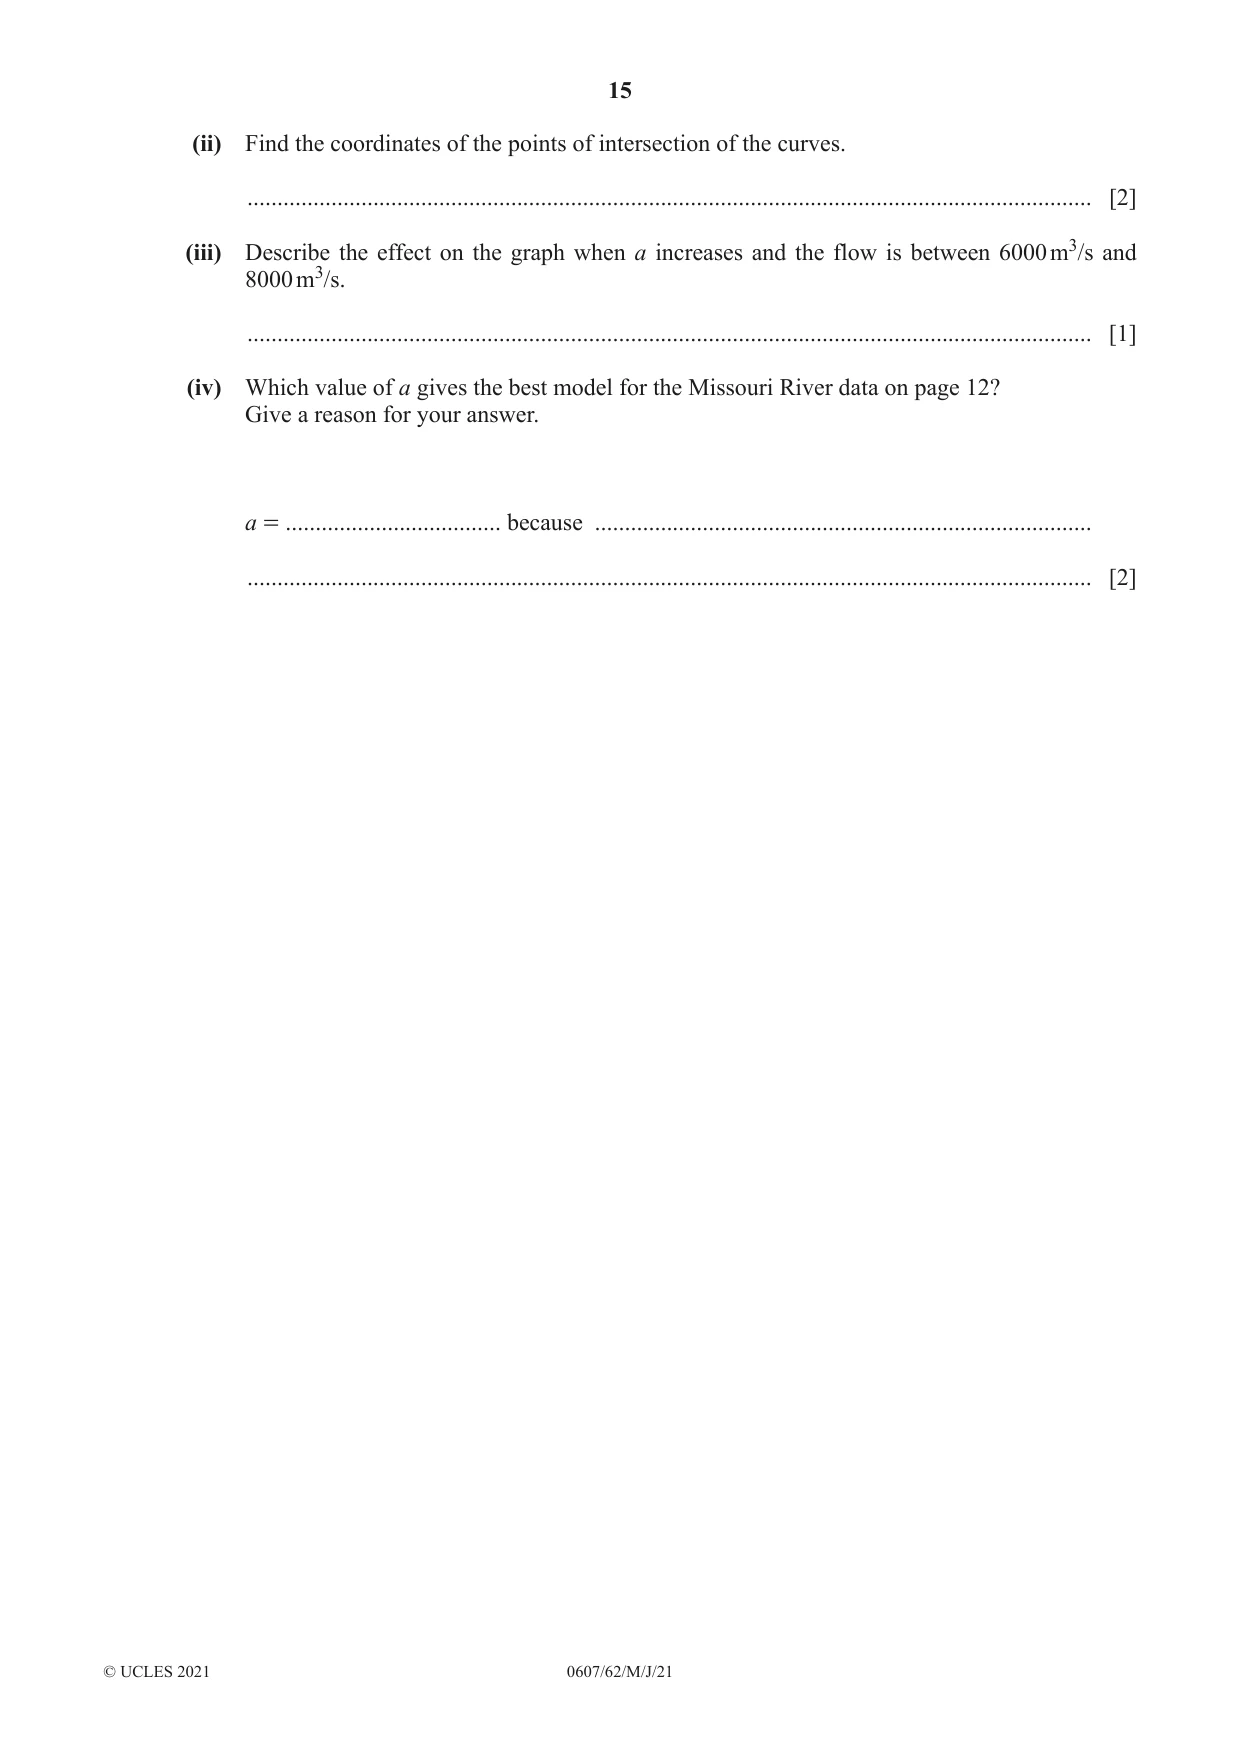
14 0607/62/M/J/21 © UCLES 2021 9 Engineers use this formula to model the probability of high river flows. b F a - p 3 = fe o p where p is the probability of an event greater than F and a and b are both constants. (a) Show that p 3 1 = when b F = . [2] (b) Give a reason why 8 is the best integer estimate for b when p 3 1 = . Use part (a) and values from the table for the Missouri River on page 12 in your answer. … [1] (c) (i) On the axes below, sketch three graphs of b F a - p 3 = fe o p for F 0 25 G G . Use b 8 = and • a = 0.5, • a = 1, • a = 2.5 . The graph with b 8 = and a 10 = is sketched for you. F p 0 25 [4]
Question paper, page 15
15 0607/62/M/J/21 © UCLES 2021 (ii) Find the coordinates of the points of intersection of the curves. … [2] (iii) Describe the effect on the graph when a increases and the flow is between 6000 m3/s and 8000 m3/s. … [1] (iv) Which value of a gives the best model for the Missouri River data on page 12? Give a reason for your answer. a = … because … … [2]
Question paper, page 16
16 0607/62/M/J/21 © UCLES 2021 Permission to reproduce items where third-party owned material protected by copyright is included has been sought and cleared where possible. Every reasonable effort has been made by the publisher (UCLES) to trace copyright holders, but if any items requiring clearance have unwittingly been included, the publisher will be pleased to make amends at the earliest possible opportunity. To avoid the issue of disclosure of answer-related information to candidates, all copyright acknowledgements are reproduced online in the Cambridge Assessment International Education Copyright Acknowledgements Booklet. This is produced for each series of examinations and is freely available to download at www.cambridgeinternational.org after the live examination series. Cambridge Assessment International Education is part of the Cambridge Assessment Group. Cambridge Assessment is the brand name of the University of Cambridge Local Examinations Syndicate (UCLES), which itself is a department of the University of Cambridge. BLANK PAGE
Mark scheme, page 1
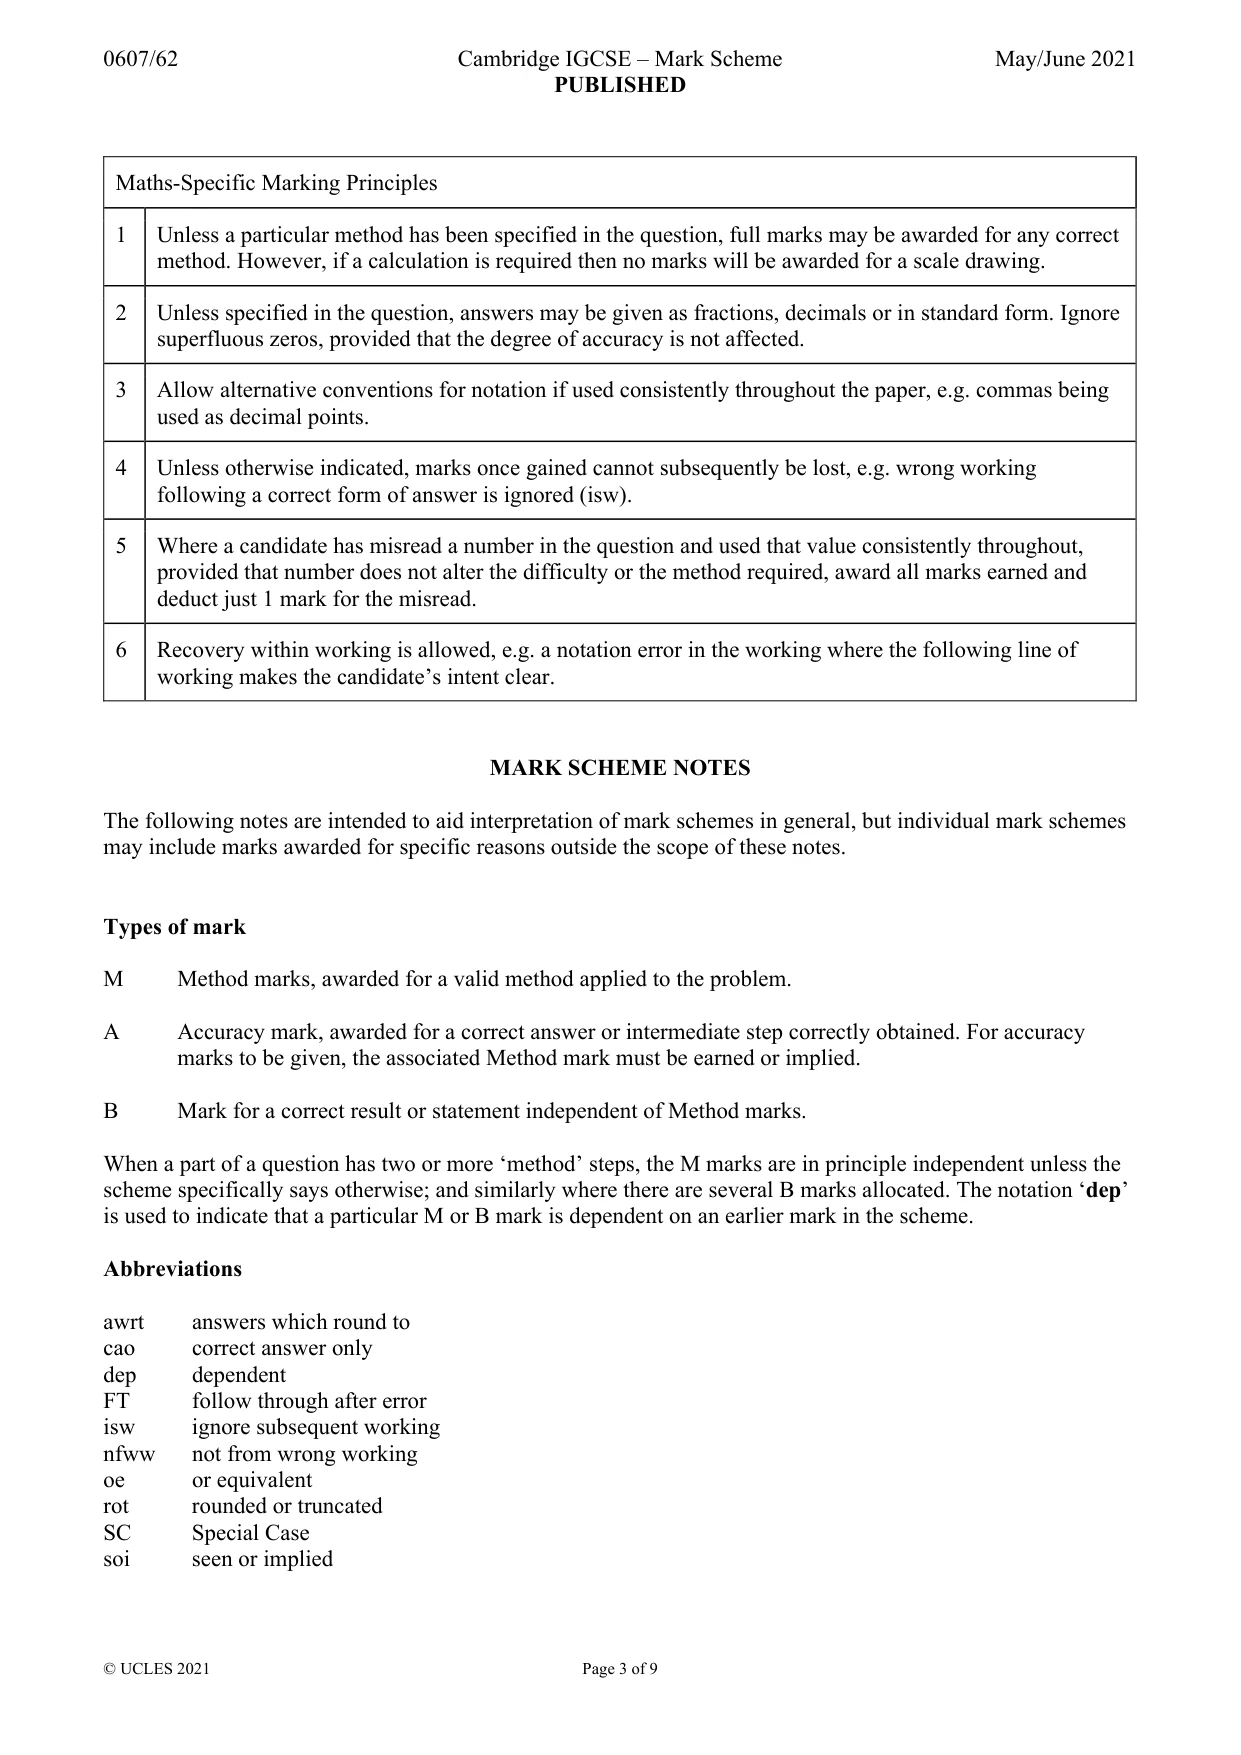
This document consists of 9 printed pages. © UCLES 2021 [Turn over Cambridge IGCSE™ CAMBRIDGE INTERNATIONAL MATHEMATICS 0607/62 Paper 6 (Extended) May/June 2021 MARK SCHEME Maximum Mark: 60 Published This mark scheme is published as an aid to teachers and candidates, to indicate the requirements of the examination. It shows the basis on which Examiners were instructed to award marks. It does not indicate the details of the discussions that took place at an Examiners’ meeting before marking began, which would have considered the acceptability of alternative answers. Mark schemes should be read in conjunction with the question paper and the Principal Examiner Report for Teachers. Cambridge International will not enter into discussions about these mark schemes. Cambridge International is publishing the mark schemes for the May/June 2021 series for most Cambridge IGCSE™, Cambridge International A and AS Level components and some Cambridge O Level components.
Mark scheme, page 2
0607/62 Cambridge IGCSE – Mark Scheme PUBLISHED May/June 2021 © UCLES 2021 Page 2 of 9 Generic Marking Principles These general marking principles must be applied by all examiners when marking candidate answers. They should be applied alongside the specific content of the mark scheme or generic level descriptors for a question. Each question paper and mark scheme will also comply with these marking principles. GENERIC MARKING PRINCIPLE 1: Marks must be awarded in line with: • the specific content of the mark scheme or the generic level descriptors for the question • the specific skills defined in the mark scheme or in the generic level descriptors for the question • the standard of response required by a candidate as exemplified by the standardisation scripts. GENERIC MARKING PRINCIPLE 2: Marks awarded are always whole marks (not half marks, or other fractions). GENERIC MARKING PRINCIPLE 3: Marks must be awarded positively: • marks are awarded for correct/valid answers, as defined in the mark scheme. However, credit is given for valid answers which go beyond the scope of the syllabus and mark scheme, referring to your Team Leader as appropriate • marks are awarded when candidates clearly demonstrate what they know and can do • marks are not deducted for errors • marks are not deducted for omissions • answers should only be judged on the quality of spelling, punctuation and grammar when these features are specifically assessed by the question as indicated by the mark scheme. The meaning, however, should be unambiguous. GENERIC MARKING PRINCIPLE 4: Rules must be applied consistently, e.g. in situations where candidates have not followed instructions or in the application of generic level descriptors. GENERIC MARKING PRINCIPLE 5: Marks should be awarded using the full range of marks defined in the mark scheme for the question (however; the use of the full mark range may be limited according to the quality of the candidate responses seen). GENERIC MARKING PRINCIPLE 6: Marks awarded are based solely on the requirements as defined in the mark scheme. Marks should not be awarded with grade thresholds or grade descriptors in mind.
Mark scheme, page 3
0607/62 Cambridge IGCSE – Mark Scheme PUBLISHED May/June 2021 © UCLES 2021 Page 3 of 9 Maths-Specific Marking Principles 1 Unless a particular method has been specified in the question, full marks may be awarded for any correct method. However, if a calculation is required then no marks will be awarded for a scale drawing. 2 Unless specified in the question, answers may be given as fractions, decimals or in standard form. Ignore superfluous zeros, provided that the degree of accuracy is not affected. 3 Allow alternative conventions for notation if used consistently throughout the paper, e.g. commas being used as decimal points. 4 Unless otherwise indicated, marks once gained cannot subsequently be lost, e.g. wrong working following a correct form of answer is ignored (isw). 5 Where a candidate has misread a number in the question and used that value consistently throughout, provided that number does not alter the difficulty or the method required, award all marks earned and deduct just 1 mark for the misread. 6 Recovery within working is allowed, e.g. a notation error in the working where the following line of working makes the candidate’s intent clear. MARK SCHEME NOTES The following notes are intended to aid interpretation of mark schemes in general, but individual mark schemes may include marks awarded for specific reasons outside the scope of these notes. Types of mark M Method marks, awarded for a valid method applied to the problem. A Accuracy mark, awarded for a correct answer or intermediate step correctly obtained. For accuracy marks to be given, the associated Method mark must be earned or implied. B Mark for a correct result or statement independent of Method marks. When a part of a question has two or more ‘method’ steps, the M marks are in principle independent unless the scheme specifically says otherwise; and similarly where there are several B marks allocated. The notation ‘dep’ is used to indicate that a particular M or B mark is dependent on an earlier mark in the scheme. Abbreviations awrt answers which round to cao correct answer only dep dependent FT follow through after error isw ignore subsequent working nfww not from wrong working oe or equivalent rot rounded or truncated SC Special Case soi seen or implied
Mark scheme, page 4
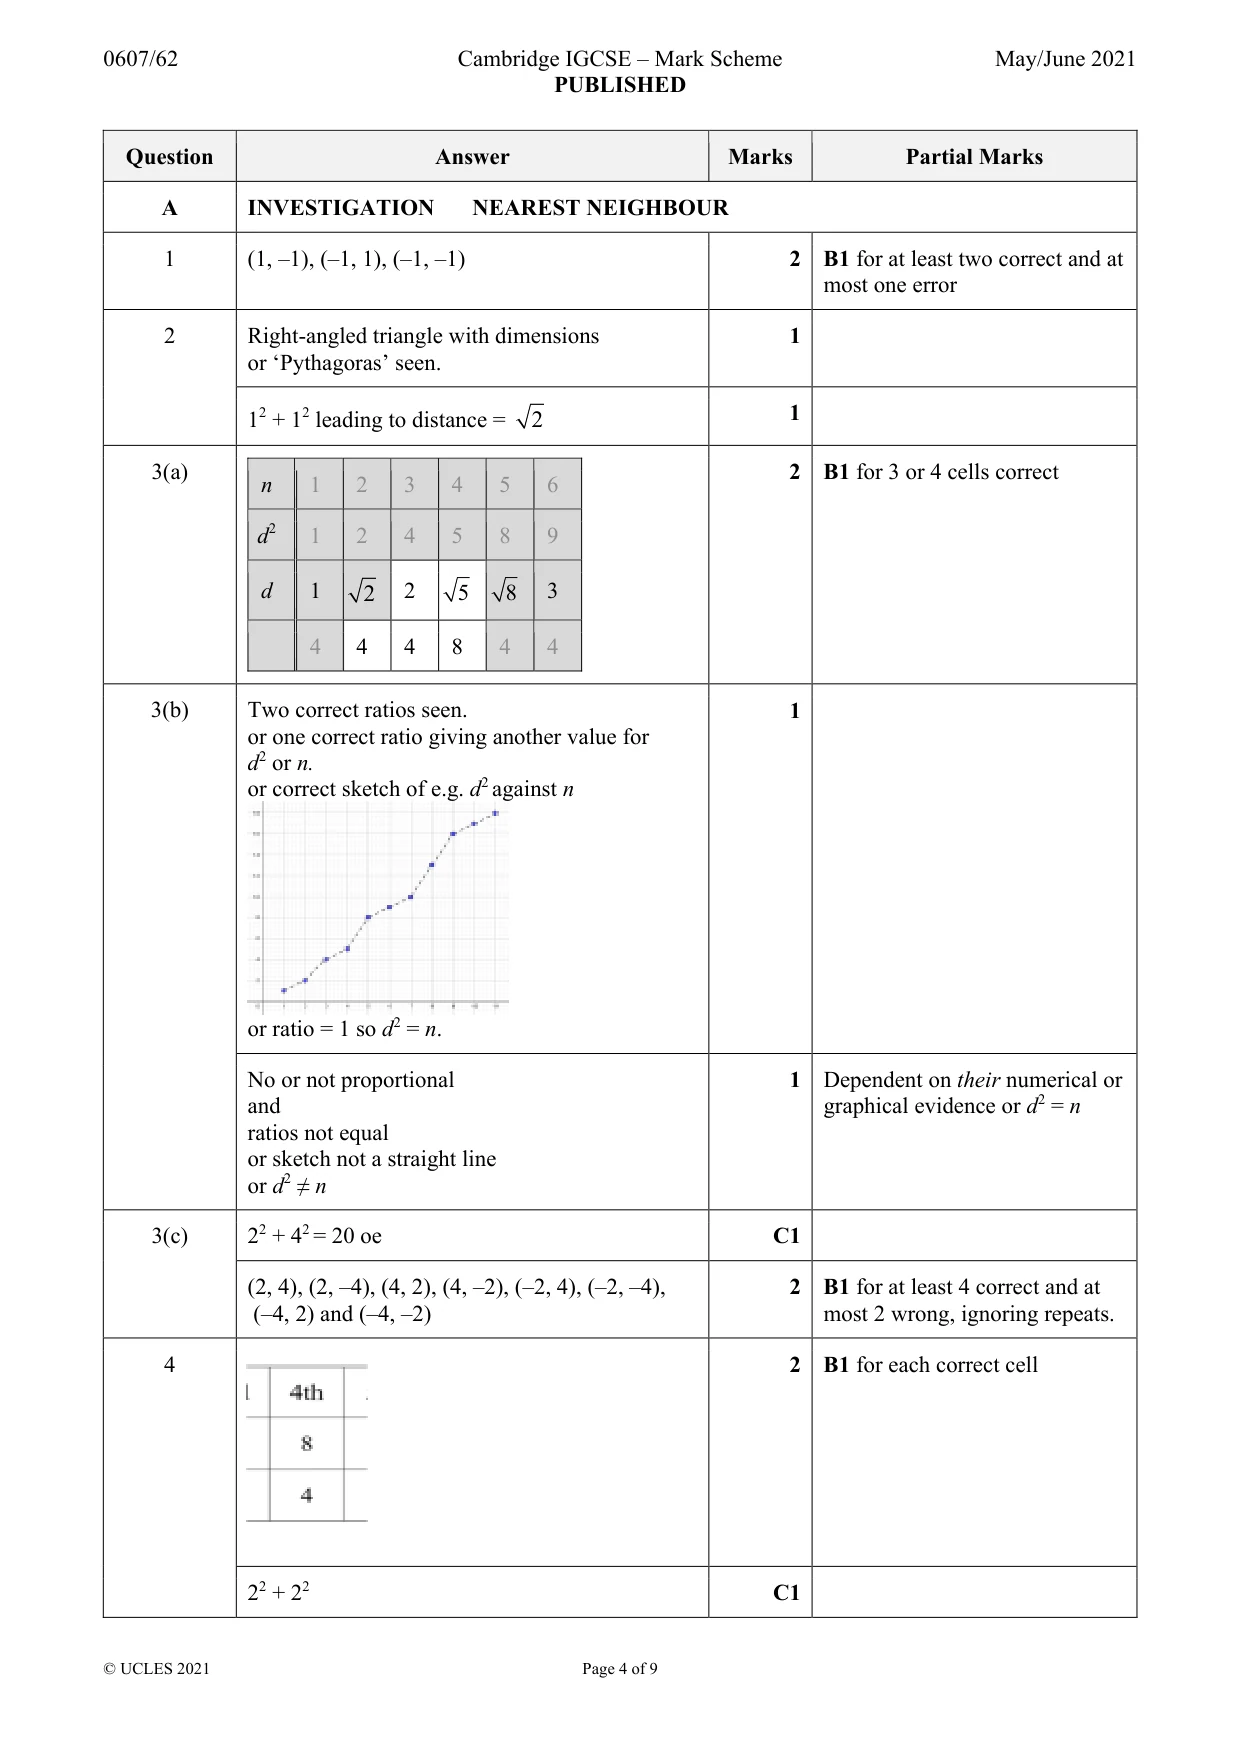
0607/62 Cambridge IGCSE – Mark Scheme PUBLISHED May/June 2021 © UCLES 2021 Page 4 of 9 Question Answer Marks Partial Marks A INVESTIGATION NEAREST NEIGHBOUR 1 (1, –1), (–1, 1), (–1, –1) 2 B1 for at least two correct and at most one error 2 Right-angled triangle with dimensions or ‘Pythagoras’ seen. 1 12 + 12 leading to distance = 2 1 3(a) n 1 2 3 4 5 6 d2 1 2 4 5 8 9 d 1 2 2 5 8 3 4 4 4 8 4 4 2 B1 for 3 or 4 cells correct 3(b) Two correct ratios seen. or one correct ratio giving another value for d2 or n. or correct sketch of e.g. d2 against n or ratio = 1 so d2 = n. 1 No or not proportional and ratios not equal or sketch not a straight line or d2 ≠ n 1 Dependent on their numerical or graphical evidence or d2 = n 3(c) 22 + 42 = 20 oe C1 (2, 4), (2, –4), (4, 2), (4, –2), (–2, 4), (–2, –4), (–4, 2) and (–4, –2) 2 B1 for at least 4 correct and at most 2 wrong, ignoring repeats. 4 2 B1 for each correct cell 22 + 22 C1
Mark scheme, page 5
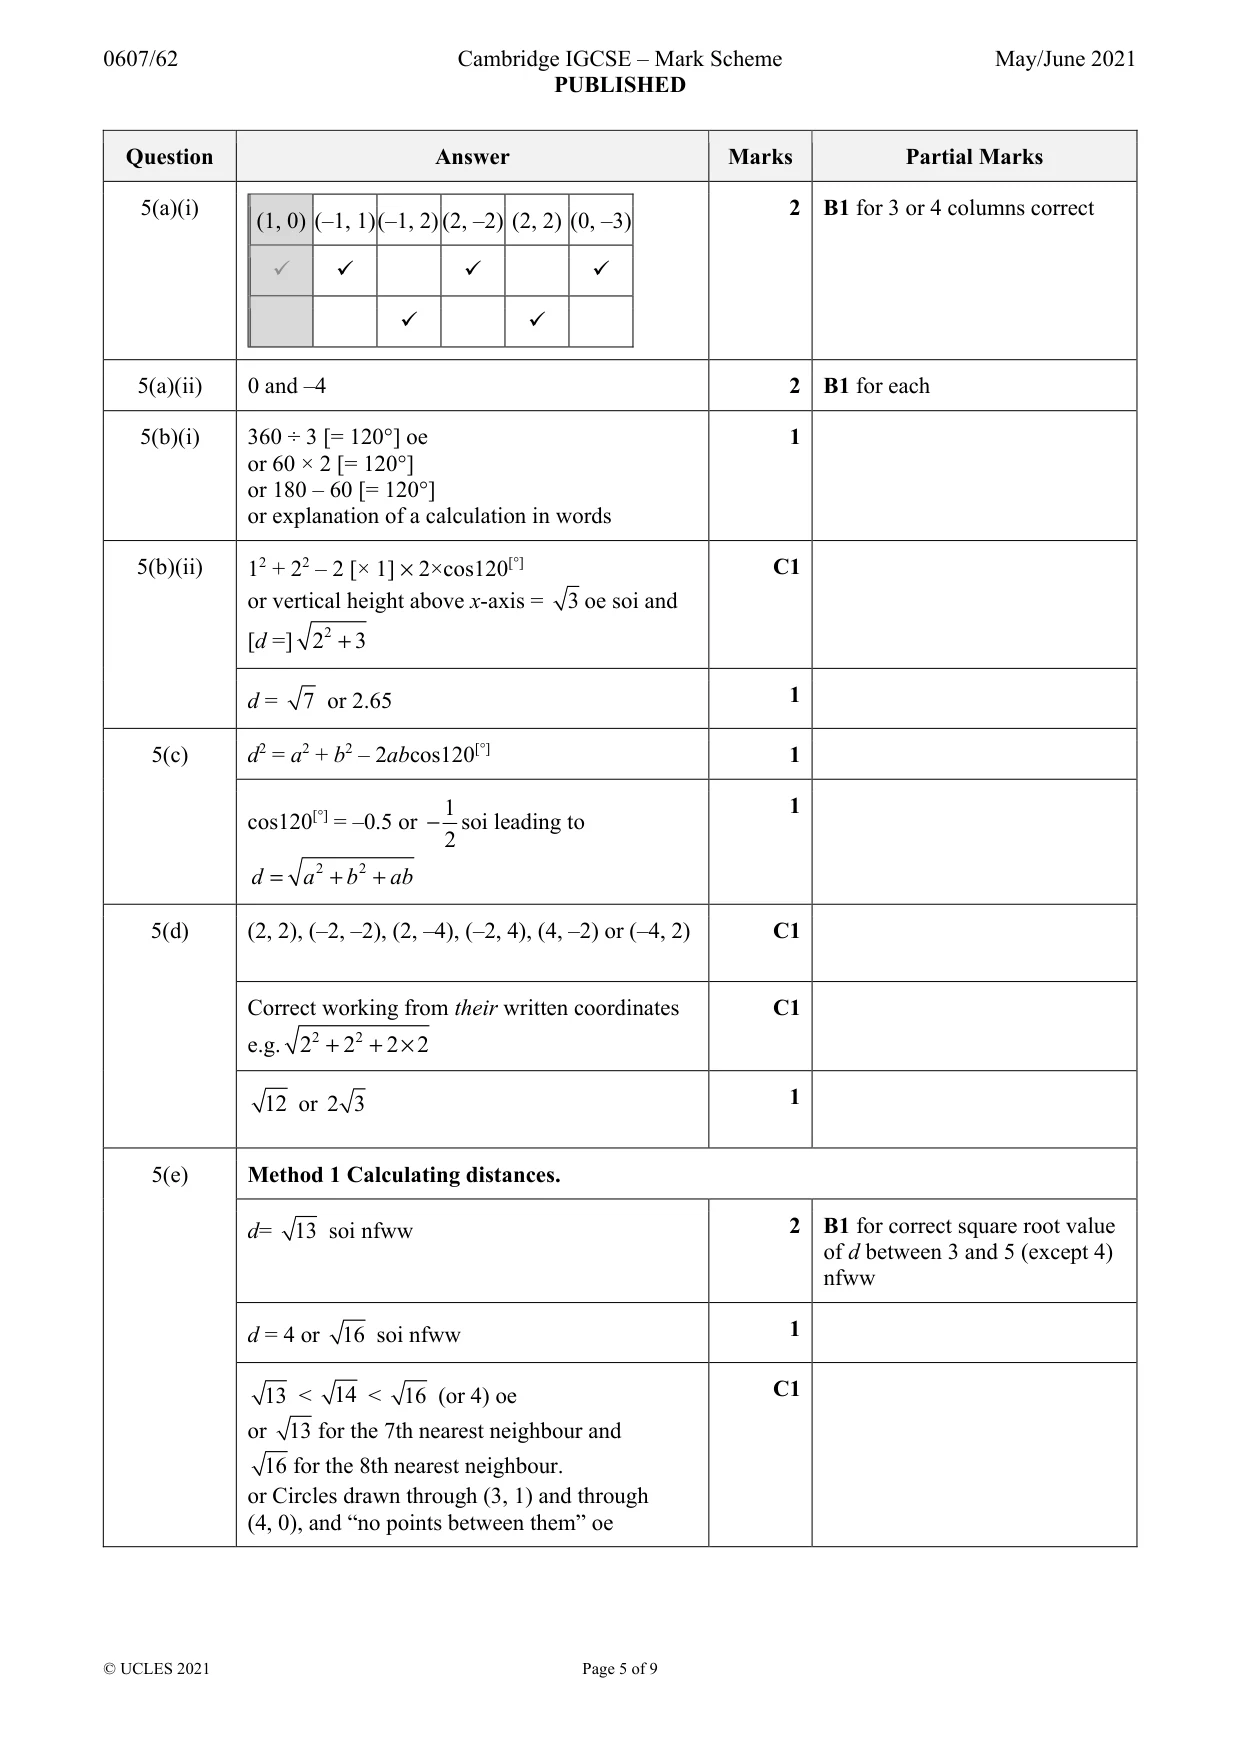
0607/62 Cambridge IGCSE – Mark Scheme PUBLISHED May/June 2021 © UCLES 2021 Page 5 of 9 Question Answer Marks Partial Marks 5(a)(i) (1, 0) (–1, 1) (–1, 2) (2, –2) (2, 2) (0, –3) 2 B1 for 3 or 4 columns correct 5(a)(ii) 0 and –4 2 B1 for each 5(b)(i) 360 ÷ 3 [= 120°] oe or 60 × 2 [= 120°] or 180 – 60 [= 120°] or explanation of a calculation in words 1 5(b)(ii) 12 + 22 – 2 [× 1] × 2×cos120[°] or vertical height above x-axis = 3 oe soi and [d =] 2 2 3 + C1 d = 7 or 2.65 1 5(c) d2 = a2 + b2 – 2abcos120[°] 1 cos120[°] = –0.5 or 1 2 − soi leading to 2 2 = + + d a b ab 1 5(d) (2, 2), (–2, –2), (2, –4), (–2, 4), (4, –2) or (–4, 2) C1 Correct working from their written coordinates e.g. 2 2 2 2 2 2 + + × C1 12 or 2 3 1 5(e) Method 1 Calculating distances. d= 13 soi nfww 2 B1 for correct square root value of d between 3 and 5 (except 4) nfww d = 4 or 16 soi nfww 1 13 < 14 < 16 (or 4) oe or 13 for the 7th nearest neighbour and 16 for the 8th nearest neighbour. or Circles drawn through (3, 1) and through (4, 0), and “no points between them” oe C1
Mark scheme, page 6
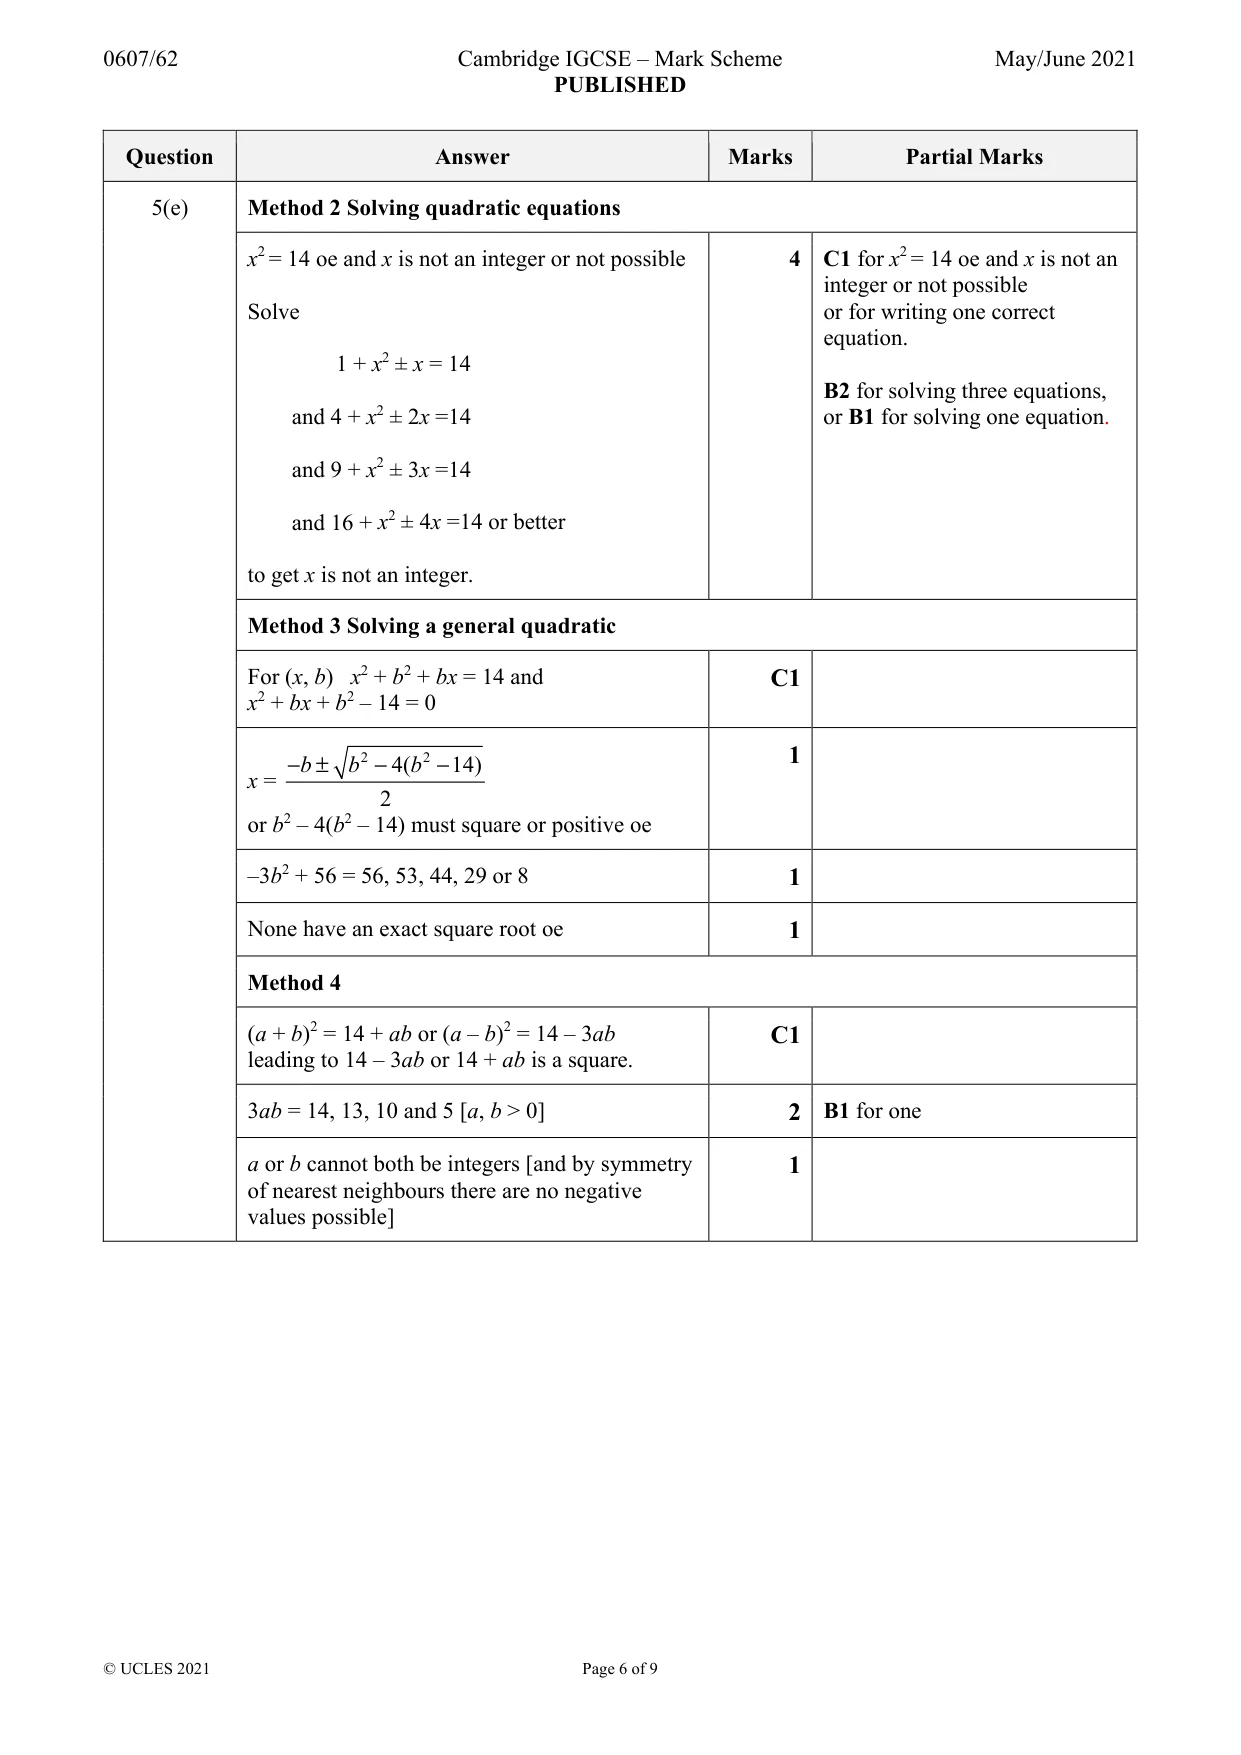
0607/62 Cambridge IGCSE – Mark Scheme PUBLISHED May/June 2021 © UCLES 2021 Page 6 of 9 Question Answer Marks Partial Marks 5(e) Method 2 Solving quadratic equations x2 = 14 oe and x is not an integer or not possible Solve 1 + x2 ± x = 14 and 4 + x2 ± 2x =14 and 9 + x2 ± 3x =14 and 16 + x2 ± 4x =14 or better to get x is not an integer. 4 C1 for x2 = 14 oe and x is not an integer or not possible or for writing one correct equation. B2 for solving three equations, or B1 for solving one equation. Method 3 Solving a general quadratic For (x, b) x2 + b2 + bx = 14 and x2 + bx + b2 – 14 = 0 C1 x = 2 2 4( 14) 2 −± − − b b b or b2 – 4(b2 – 14) must square or positive oe 1 –3b2 + 56 = 56, 53, 44, 29 or 8 1 None have an exact square root oe 1 Method 4 (a + b)2 = 14 + ab or (a – b)2 = 14 – 3ab leading to 14 – 3ab or 14 + ab is a square. C1 3ab = 14, 13, 10 and 5 [a, b > 0] 2 B1 for one a or b cannot both be integers [and by symmetry of nearest neighbours there are no negative values possible] 1
Mark scheme, page 7
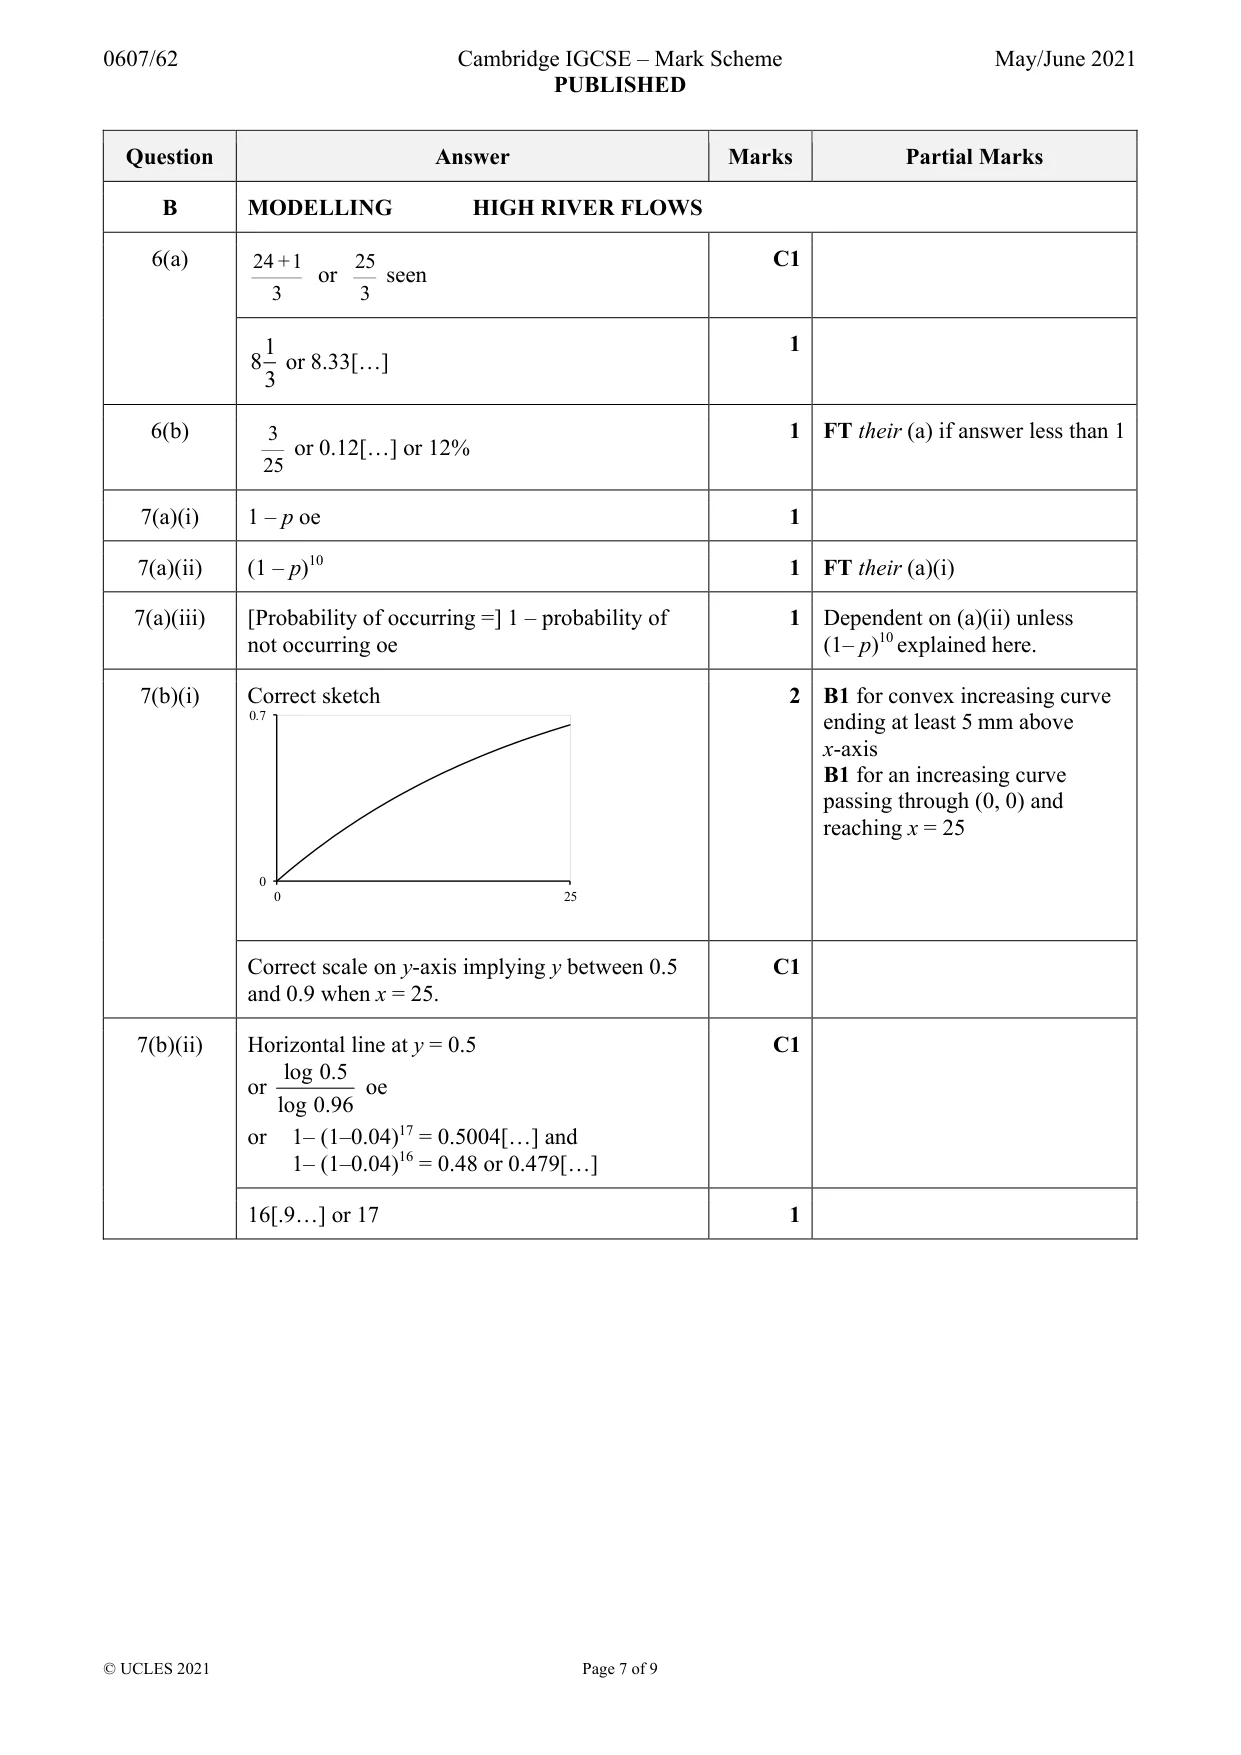
0607/62 Cambridge IGCSE – Mark Scheme PUBLISHED May/June 2021 © UCLES 2021 Page 7 of 9 Question Answer Marks Partial Marks B MODELLING HIGH RIVER FLOWS 6(a) 24 +1 25 3 3 or seen C1 1 83 or 8.33[…] 1 6(b) 3 25 or 0.12[…] or 12% 1 FT their (a) if answer less than 1 7(a)(i) 1 – p oe 1 7(a)(ii) (1 – p)10 1 FT their (a)(i) 7(a)(iii) [Probability of occurring =] 1 – probability of not occurring oe 1 Dependent on (a)(ii) unless (1– p)10 explained here. 7(b)(i) Correct sketch 2 B1 for convex increasing curve ending at least 5 mm above x-axis B1 for an increasing curve passing through (0, 0) and reaching x = 25 Correct scale on y-axis implying y between 0.5 and 0.9 when x = 25. C1 7(b)(ii) Horizontal line at y = 0.5 or log 0.5 log 0.96 oe or 1– (1–0.04)17 = 0.5004[…] and 1– (1–0.04)16 = 0.48 or 0.479[…] C1 16[.9…] or 17 1 0 0.7 0 25
Mark scheme, page 8
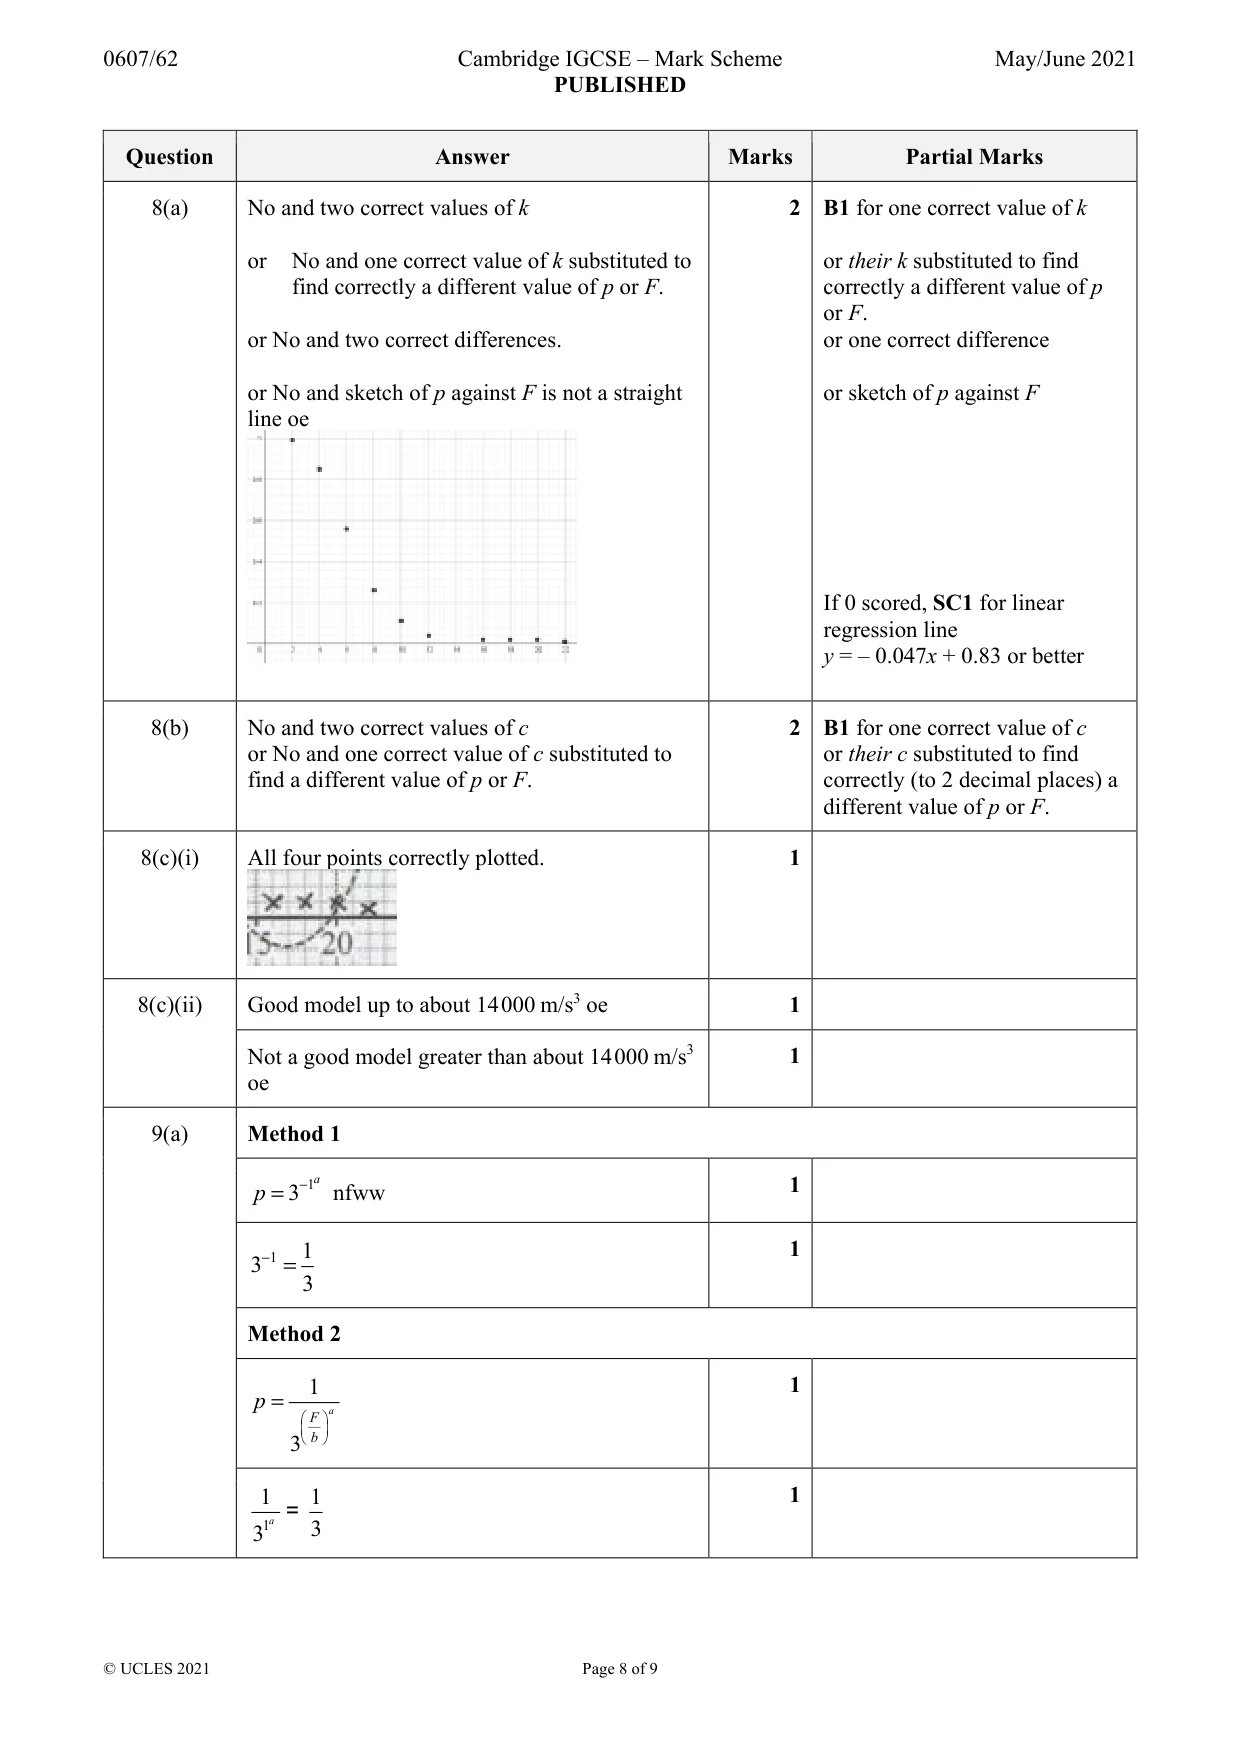
0607/62 Cambridge IGCSE – Mark Scheme PUBLISHED May/June 2021 © UCLES 2021 Page 8 of 9 Question Answer Marks Partial Marks 8(a) No and two correct values of k or No and one correct value of k substituted to find correctly a different value of p or F. or No and two correct differences. or No and sketch of p against F is not a straight line oe 2 B1 for one correct value of k or their k substituted to find correctly a different value of p or F. or one correct difference or sketch of p against F If 0 scored, SC1 for linear regression line y = – 0.047x + 0.83 or better 8(b) No and two correct values of c or No and one correct value of c substituted to find a different value of p or F. 2 B1 for one correct value of c or their c substituted to find correctly (to 2 decimal places) a different value of p or F. 8(c)(i) All four points correctly plotted. 1 8(c)(ii) Good model up to about 14 000 m/s3 oe 1 Not a good model greater than about 14 000 m/s3 oe 1 9(a) Method 1 1 3− = a p nfww 1 1 1 3 3 −= 1 Method 2 1 3 = a F b p 1 1 1 3 a = 1 3 1
Mark scheme, page 9
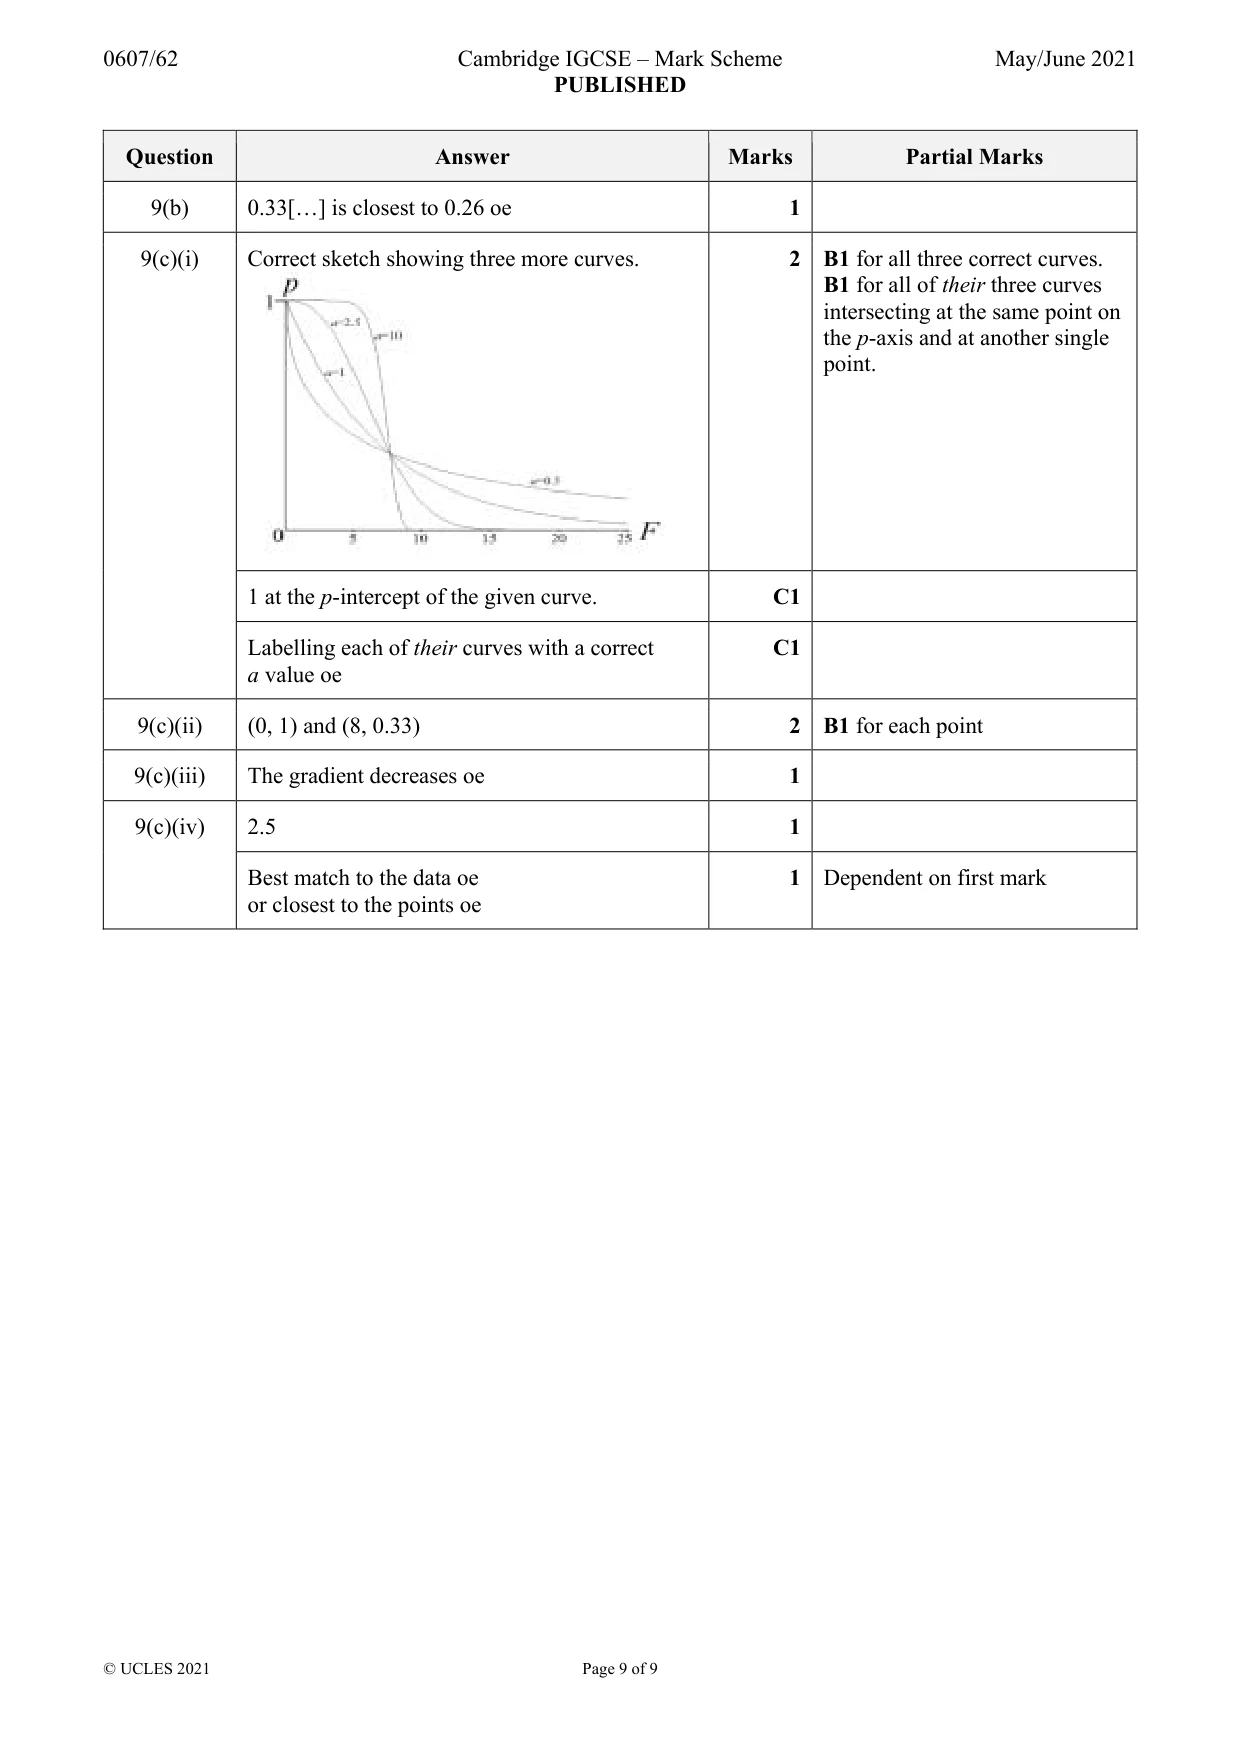
0607/62 Cambridge IGCSE – Mark Scheme PUBLISHED May/June 2021 © UCLES 2021 Page 9 of 9 Question Answer Marks Partial Marks 9(b) 0.33[…] is closest to 0.26 oe 1 9(c)(i) Correct sketch showing three more curves. 2 B1 for all three correct curves. B1 for all of their three curves intersecting at the same point on the p-axis and at another single point. 1 at the p-intercept of the given curve. C1 Labelling each of their curves with a correct a value oe C1 9(c)(ii) (0, 1) and (8, 0.33) 2 B1 for each point 9(c)(iii) The gradient decreases oe 1 9(c)(iv) 2.5 1 Best match to the data oe or closest to the points oe 1 Dependent on first mark
What you needed in this session
Cambridge’s own grade thresholds for 2021 May/June, Paper 6 · Variant 2. A higher threshold means an easier paper — the bar moves with how the cohort did.