Cambridge IGCSE Mathematics - International 0607 — 2016 Oct/Nov Paper 6 · Variant 3
0607/63/O/N/16 · 40 marks · ≈45 min
The question paper and its mark scheme, free to read here and free to download. This is Cambridge’s own paper, exactly as it was sat.
Question paper16 pages
Mark scheme4 pages
Answers below. Sit the paper first if you are practising.
Paper as text
Question paper, page 1
This document consists of 16 printed pages. DC (NH/SG) 117171/3 © UCLES 2016 [Turn over * 9 1 6 3 2 9 6 8 8 0 * CAMBRIDGE INTERNATIONAL MATHEMATICS 0607/63 Paper 6 (Extended) October/November 2016 1 hour 30 minutes Candidates answer on the Question Paper. Additional Materials: Graphics Calculator READ THESE INSTRUCTIONS FIRST Write your Centre number, candidate number and name on all the work you hand in. Write in dark blue or black pen. Do not use staples, paper clips, glue or correction fluid. You may use an HB pencil for any diagrams or graphs. DO NOT WRITE IN ANY BARCODES. Answer both parts A and B. You must show all relevant working to gain full marks for correct methods, including sketches. In this paper you will also be assessed on your ability to provide full reasons and communicate your mathematics clearly and precisely. At the end of the examination, fasten all your work securely together. The total number of marks for this paper is 40. Cambridge International Examinations Cambridge International General Certificate of Secondary Education
Question paper, page 2
2 0607/63/O/N/16 © UCLES 2016 THE INVESTIGATION STARTS ON PAGE 3.
Question paper, page 3
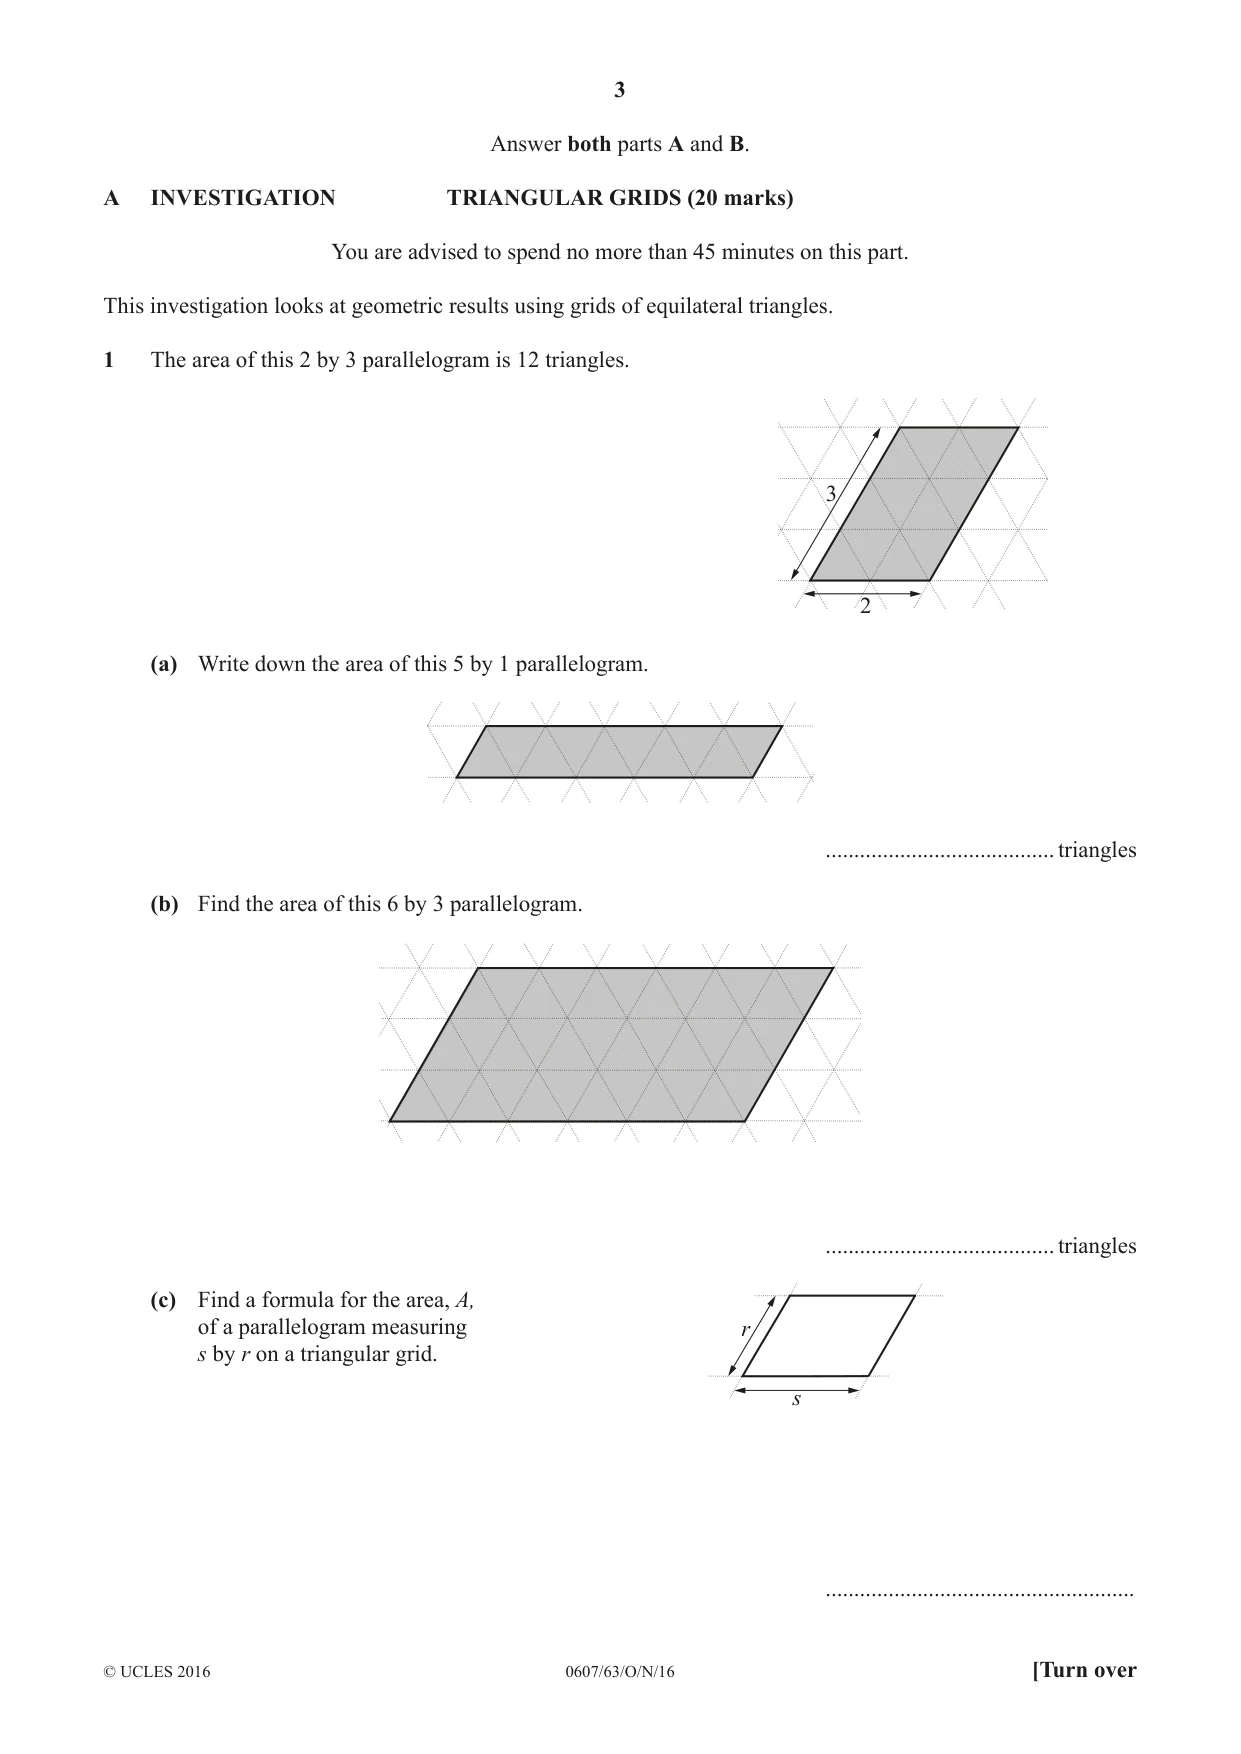
3 0607/63/O/N/16 © UCLES 2016 [Turn over Answer both parts A and B. A INVESTIGATION TRIANGULAR GRIDS (20 marks) You are advised to spend no more than 45 minutes on this part. This investigation looks at geometric results using grids of equilateral triangles. 1 The area of this 2 by 3 parallelogram is 12 triangles. 3 2 (a) Write down the area of this 5 by 1 parallelogram. … triangles (b) Find the area of this 6 by 3 parallelogram. … triangles (c) Find a formula for the area, A, of a parallelogram measuring s by r on a triangular grid. r s …
Question paper, page 4
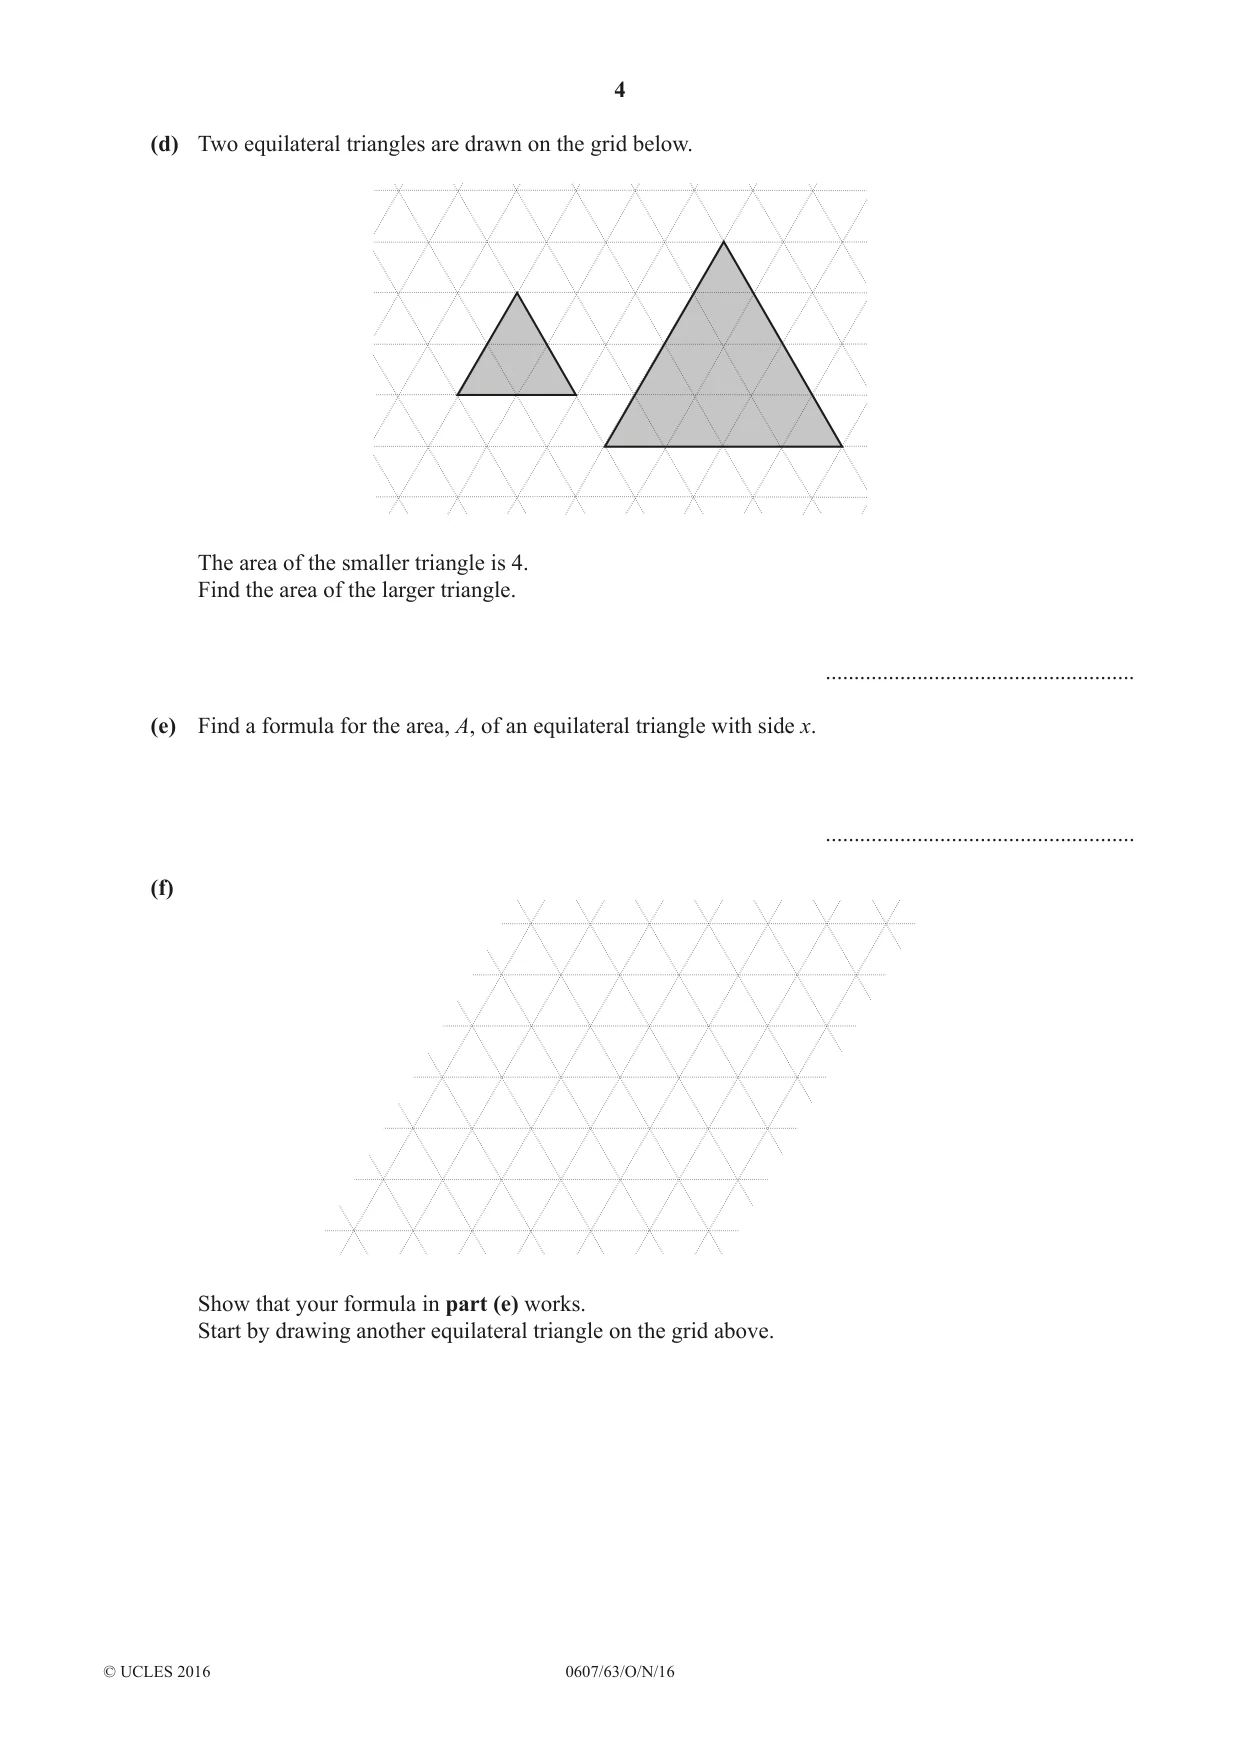
4 0607/63/O/N/16 © UCLES 2016 (d) Two equilateral triangles are drawn on the grid below. The area of the smaller triangle is 4. Find the area of the larger triangle. … (e) Find a formula for the area, A, of an equilateral triangle with side x. … (f) Show that your formula in part (e) works. Start by drawing another equilateral triangle on the grid above.
Question paper, page 5
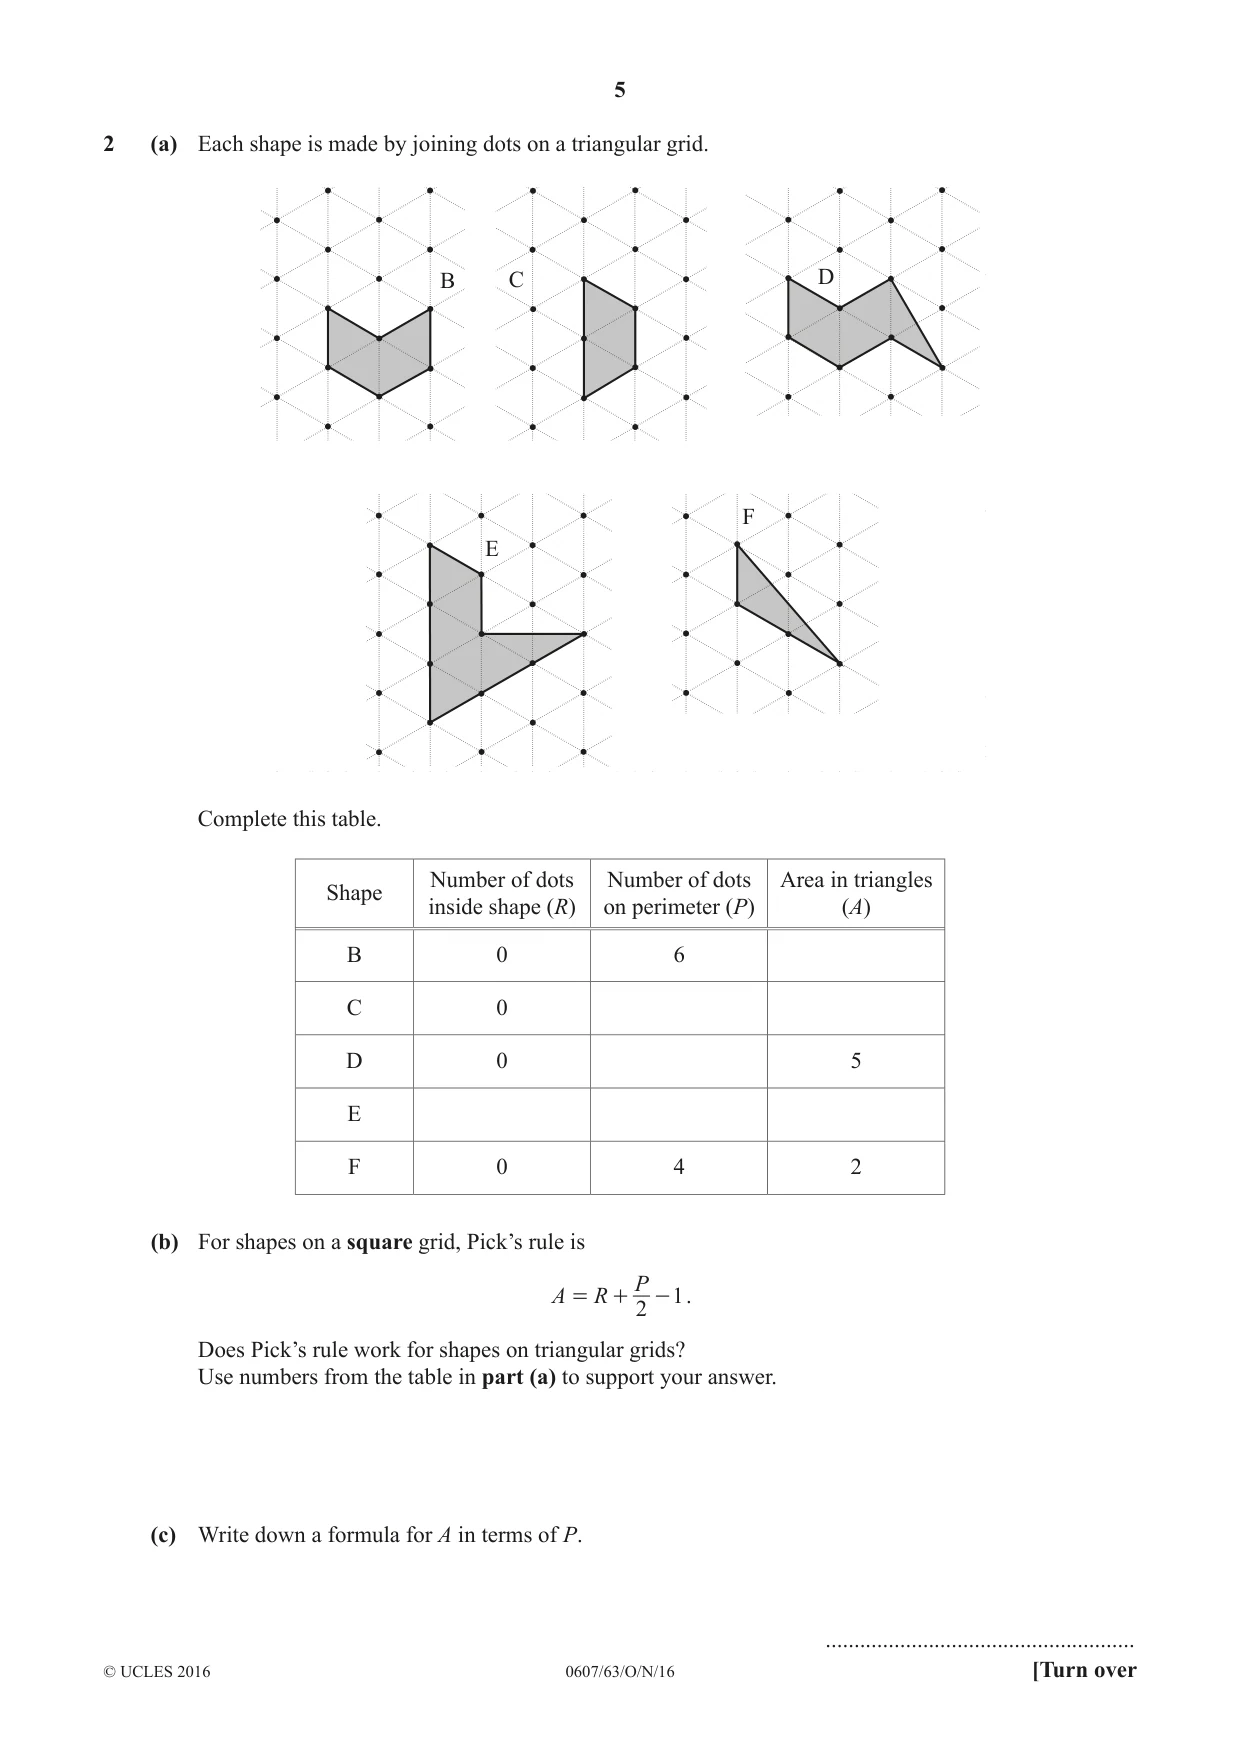
5 0607/63/O/N/16 © UCLES 2016 [Turn over 2 (a) Each shape is made by joining dots on a triangular grid. B D C E F Complete this table. Shape Number of dots inside shape (R) Number of dots on perimeter (P) Area in triangles (A) B 0 6 C 0 D 0 5 E F 0 4 2 (b) For shapes on a square grid, Pick’s rule is 1 2 A R P = + - . Does Pick’s rule work for shapes on triangular grids? Use numbers from the table in part (a) to support your answer. (c) Write down a formula for A in terms of P. …
Question paper, page 6
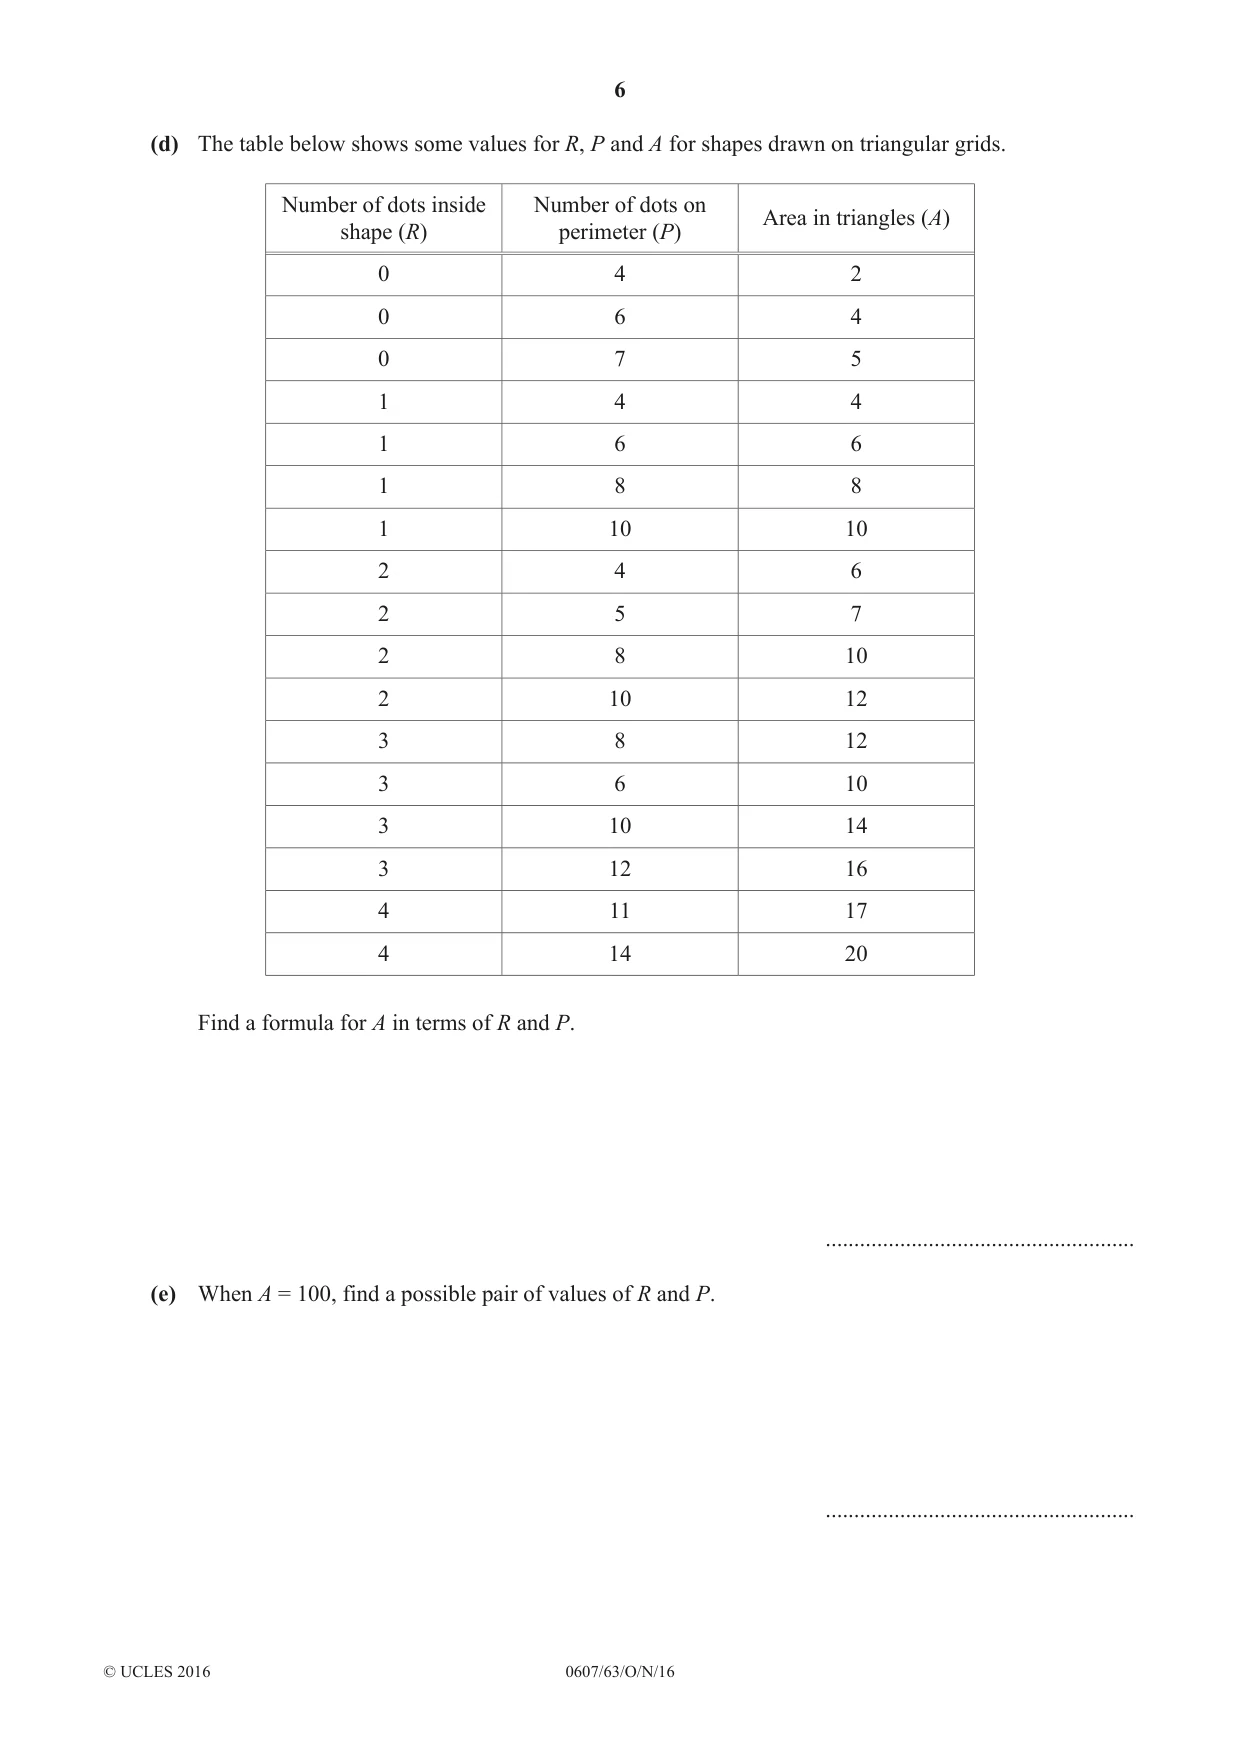
6 0607/63/O/N/16 © UCLES 2016 (d) The table below shows some values for R, P and A for shapes drawn on triangular grids. Number of dots inside shape (R) Number of dots on perimeter (P) Area in triangles (A) 0 4 2 0 6 4 0 7 5 1 4 4 1 6 6 1 8 8 1 10 10 2 4 6 2 5 7 2 8 10 2 10 12 3 8 12 3 6 10 3 10 14 3 12 16 4 11 17 4 14 20 Find a formula for A in terms of R and P. … (e) When A = 100, find a possible pair of values of R and P. …
Question paper, page 7
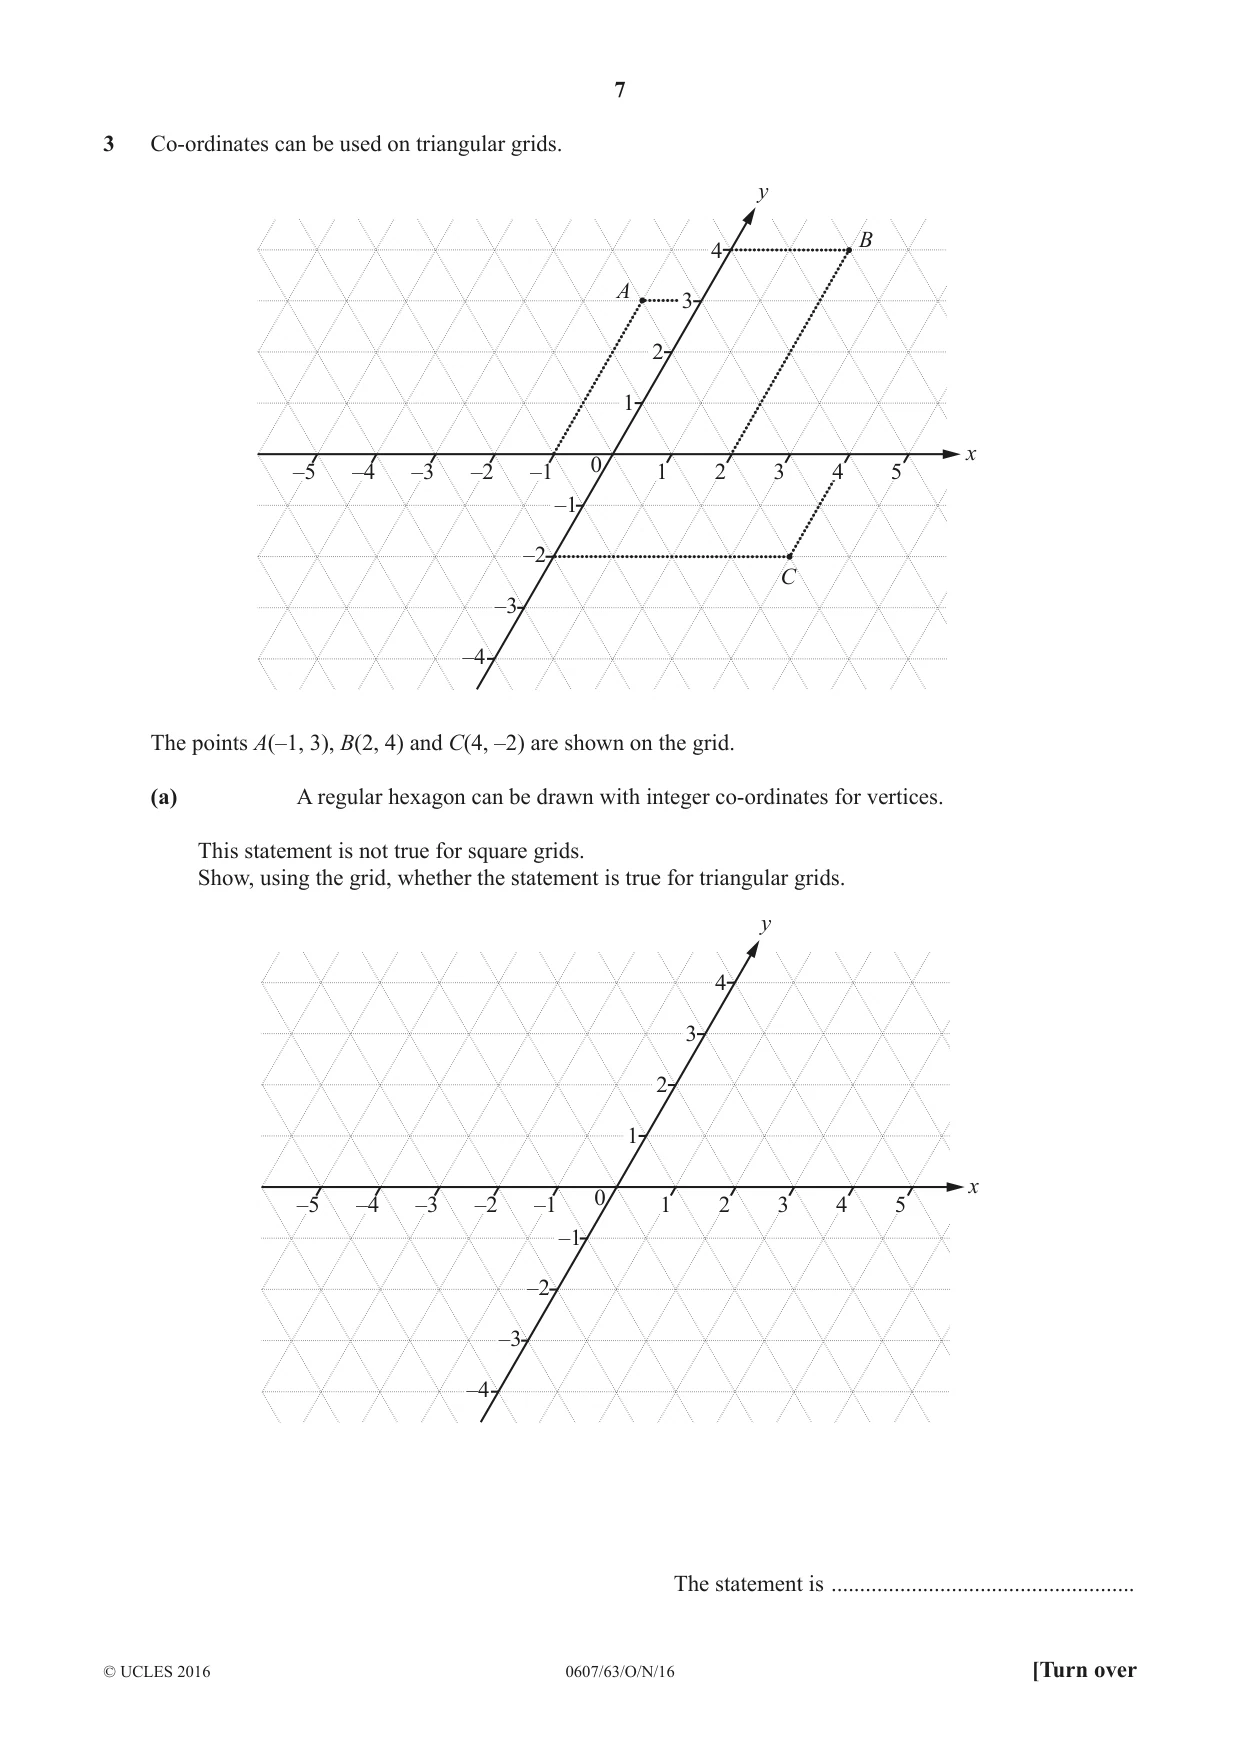
7 0607/63/O/N/16 © UCLES 2016 [Turn over 3 Co-ordinates can be used on triangular grids. –1 1 1 –1 –2 –3 –4 –5 2 3 4 5 2 3 4 –2 –3 –4 0 y A B C x The points A(–1, 3), B(2, 4) and C(4, –2) are shown on the grid. (a) A regular hexagon can be drawn with integer co-ordinates for vertices. This statement is not true for square grids. Show, using the grid, whether the statement is true for triangular grids. –1 1 1 –1 –2 –3 –4 –5 2 3 4 5 2 3 4 –2 –3 –4 0 y x The statement is …
Question paper, page 8
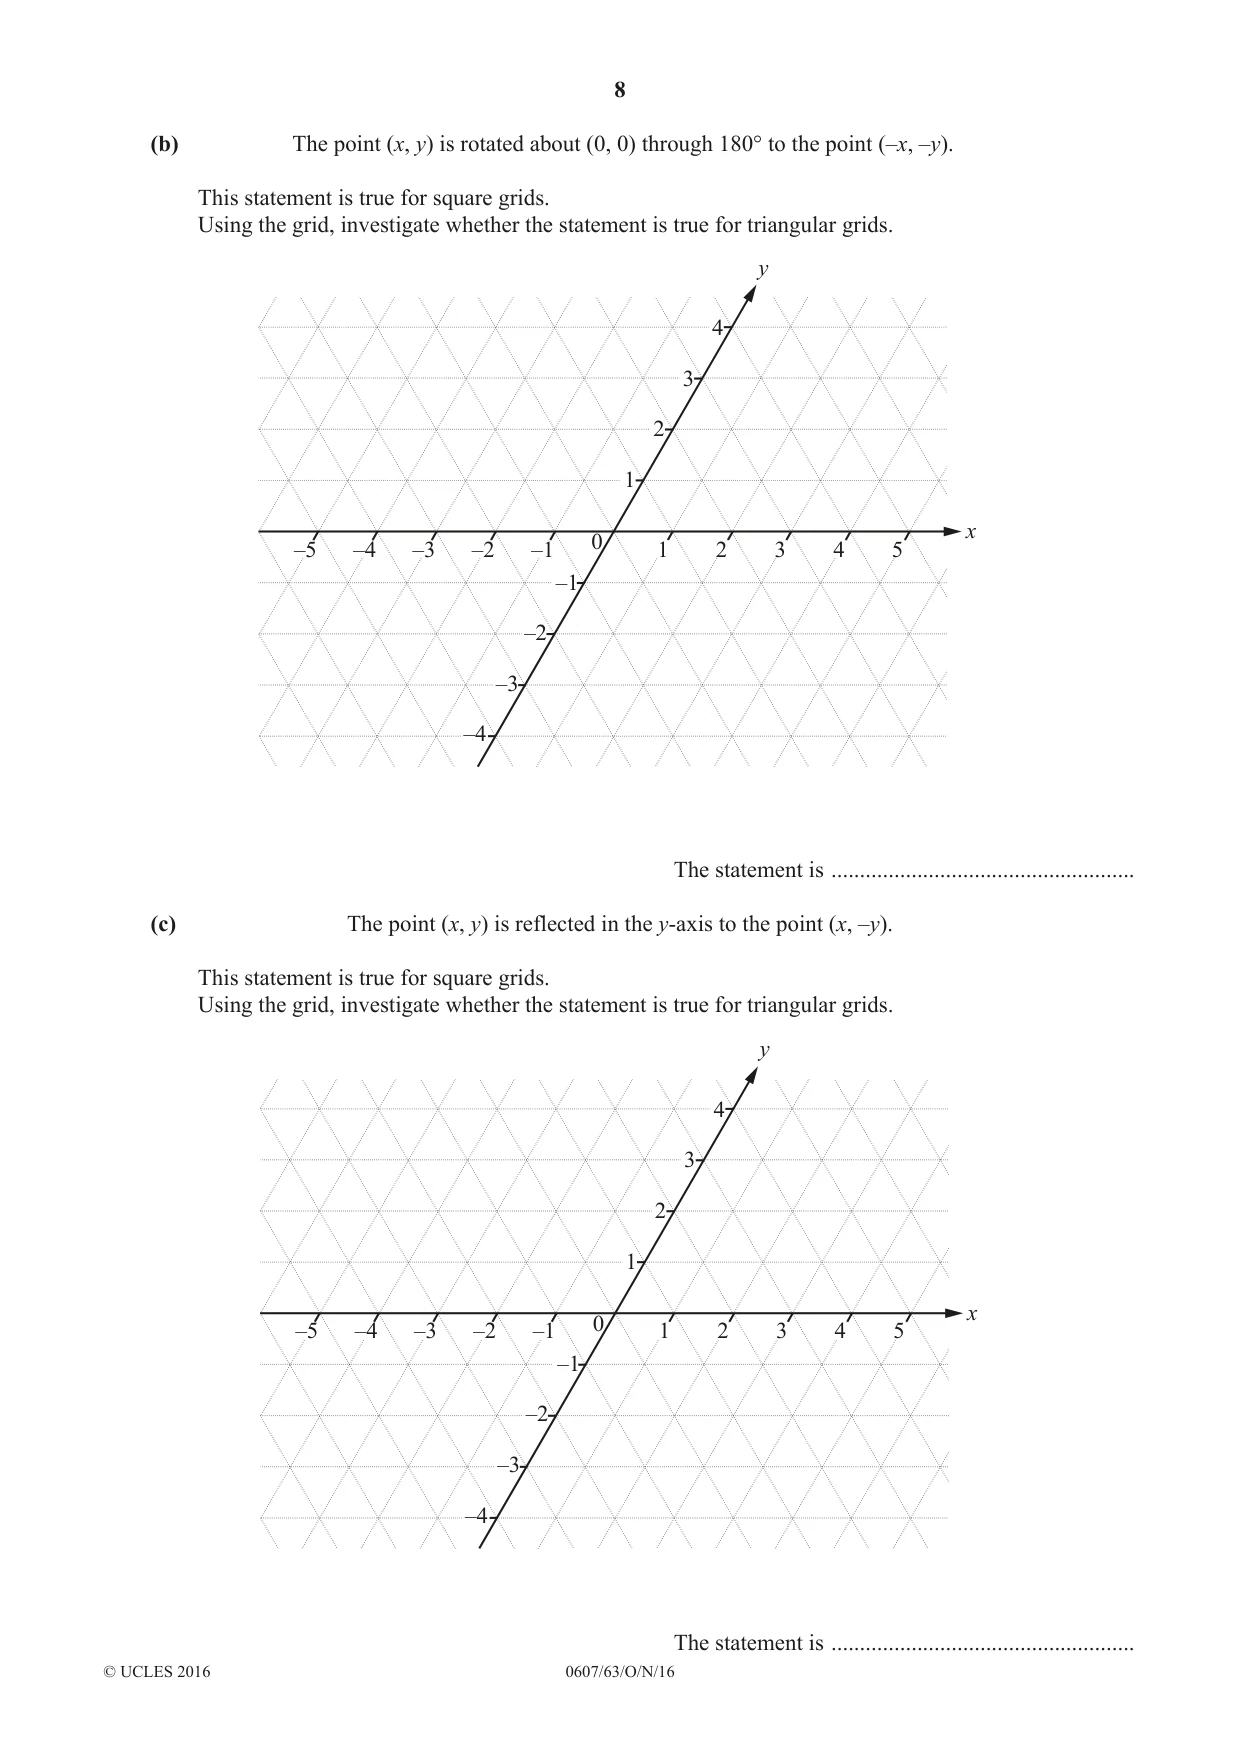
8 0607/63/O/N/16 © UCLES 2016 (b) The point (x, y) is rotated about (0, 0) through 180° to the point (–x, –y). This statement is true for square grids. Using the grid, investigate whether the statement is true for triangular grids. –1 1 1 –1 –2 –3 –4 –5 2 3 4 5 2 3 4 –2 –3 –4 0 y x The statement is … (c) The point (x, y) is reflected in the y-axis to the point (x, –y). This statement is true for square grids. Using the grid, investigate whether the statement is true for triangular grids. –1 1 1 –1 –2 –3 –4 –5 2 3 4 5 2 3 4 –2 –3 –4 0 y x The statement is …
Question paper, page 9
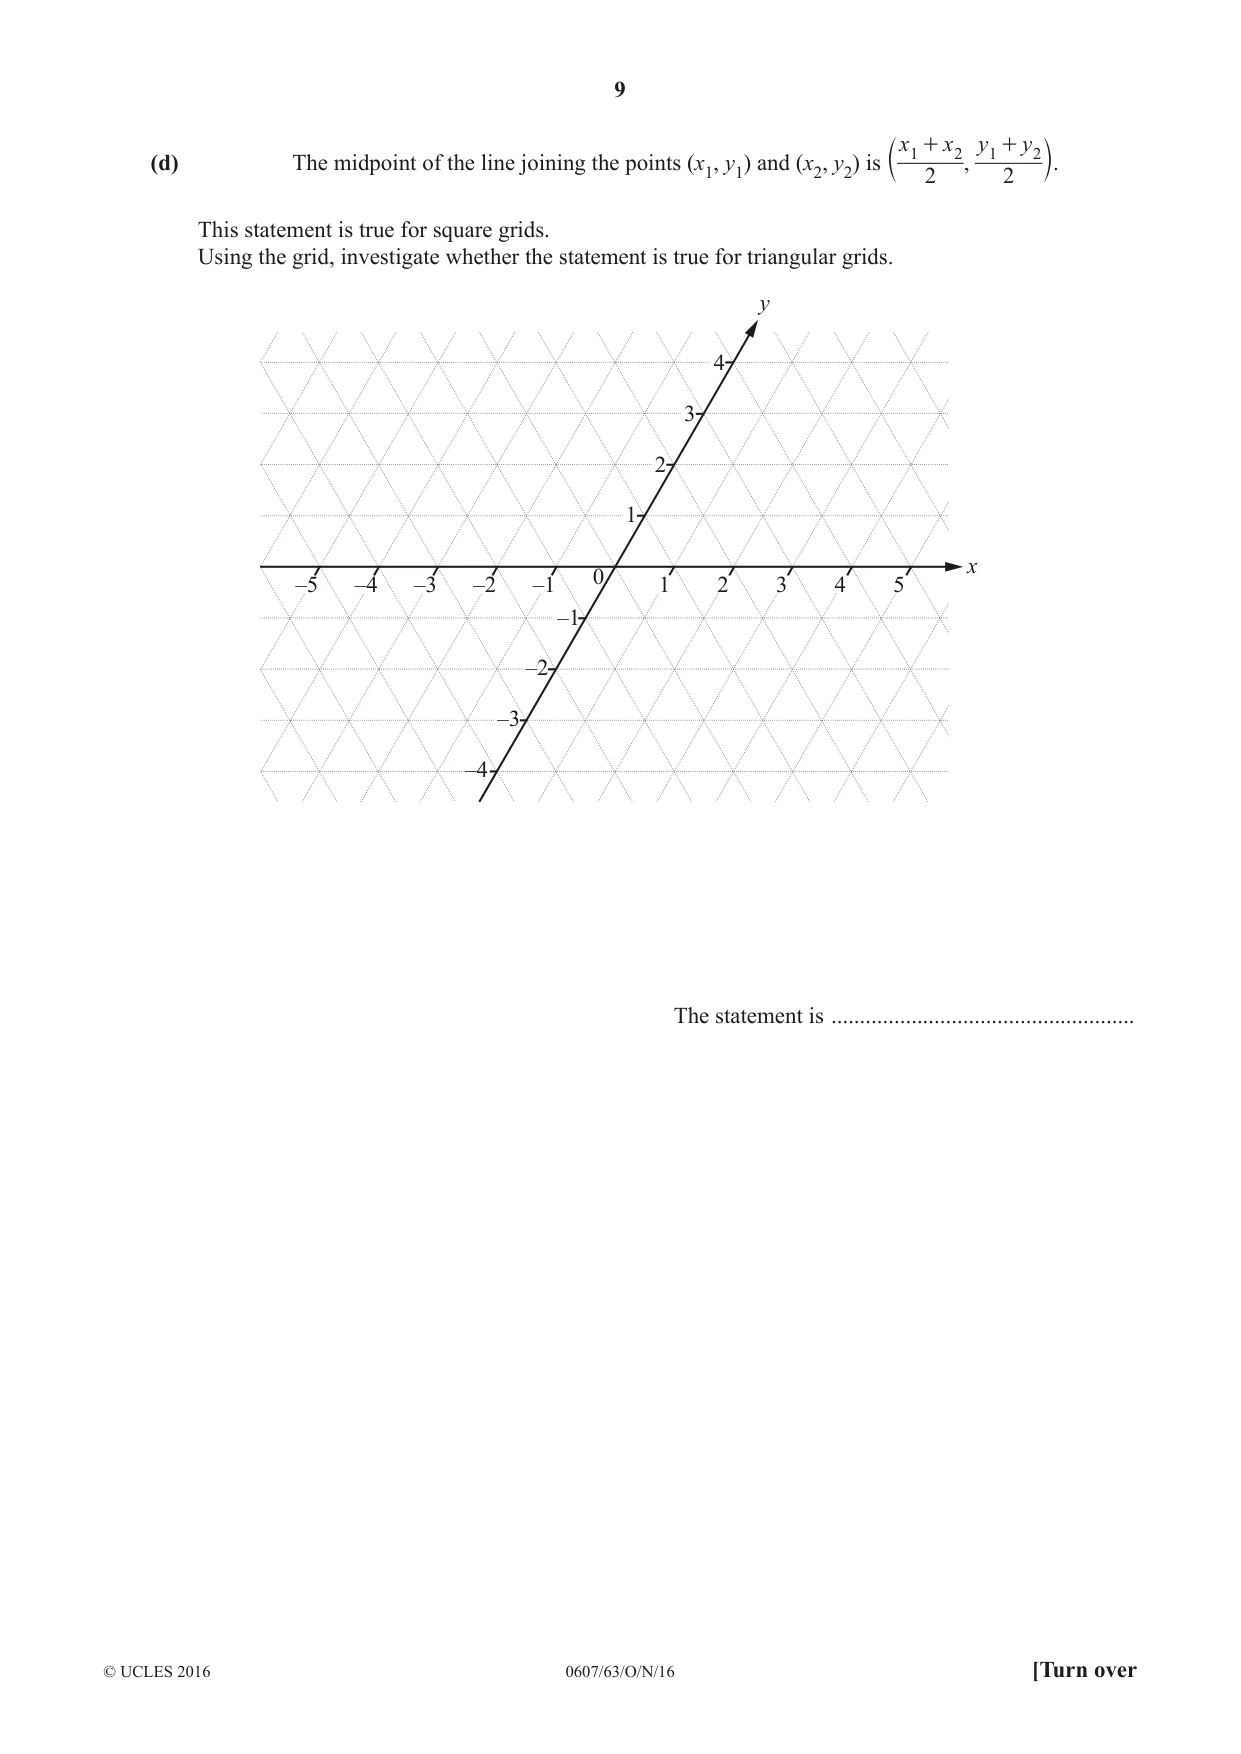
9 0607/63/O/N/16 © UCLES 2016 [Turn over (d) The midpoint of the line joining the points (x1, y1) and (x2, y2) is 2 , 2 x x y y 1 2 1 2 + + c m. This statement is true for square grids. Using the grid, investigate whether the statement is true for triangular grids. –1 1 1 –1 –2 –3 –4 –5 2 3 4 5 2 3 4 –2 –3 –4 0 y x The statement is …
Question paper, page 10
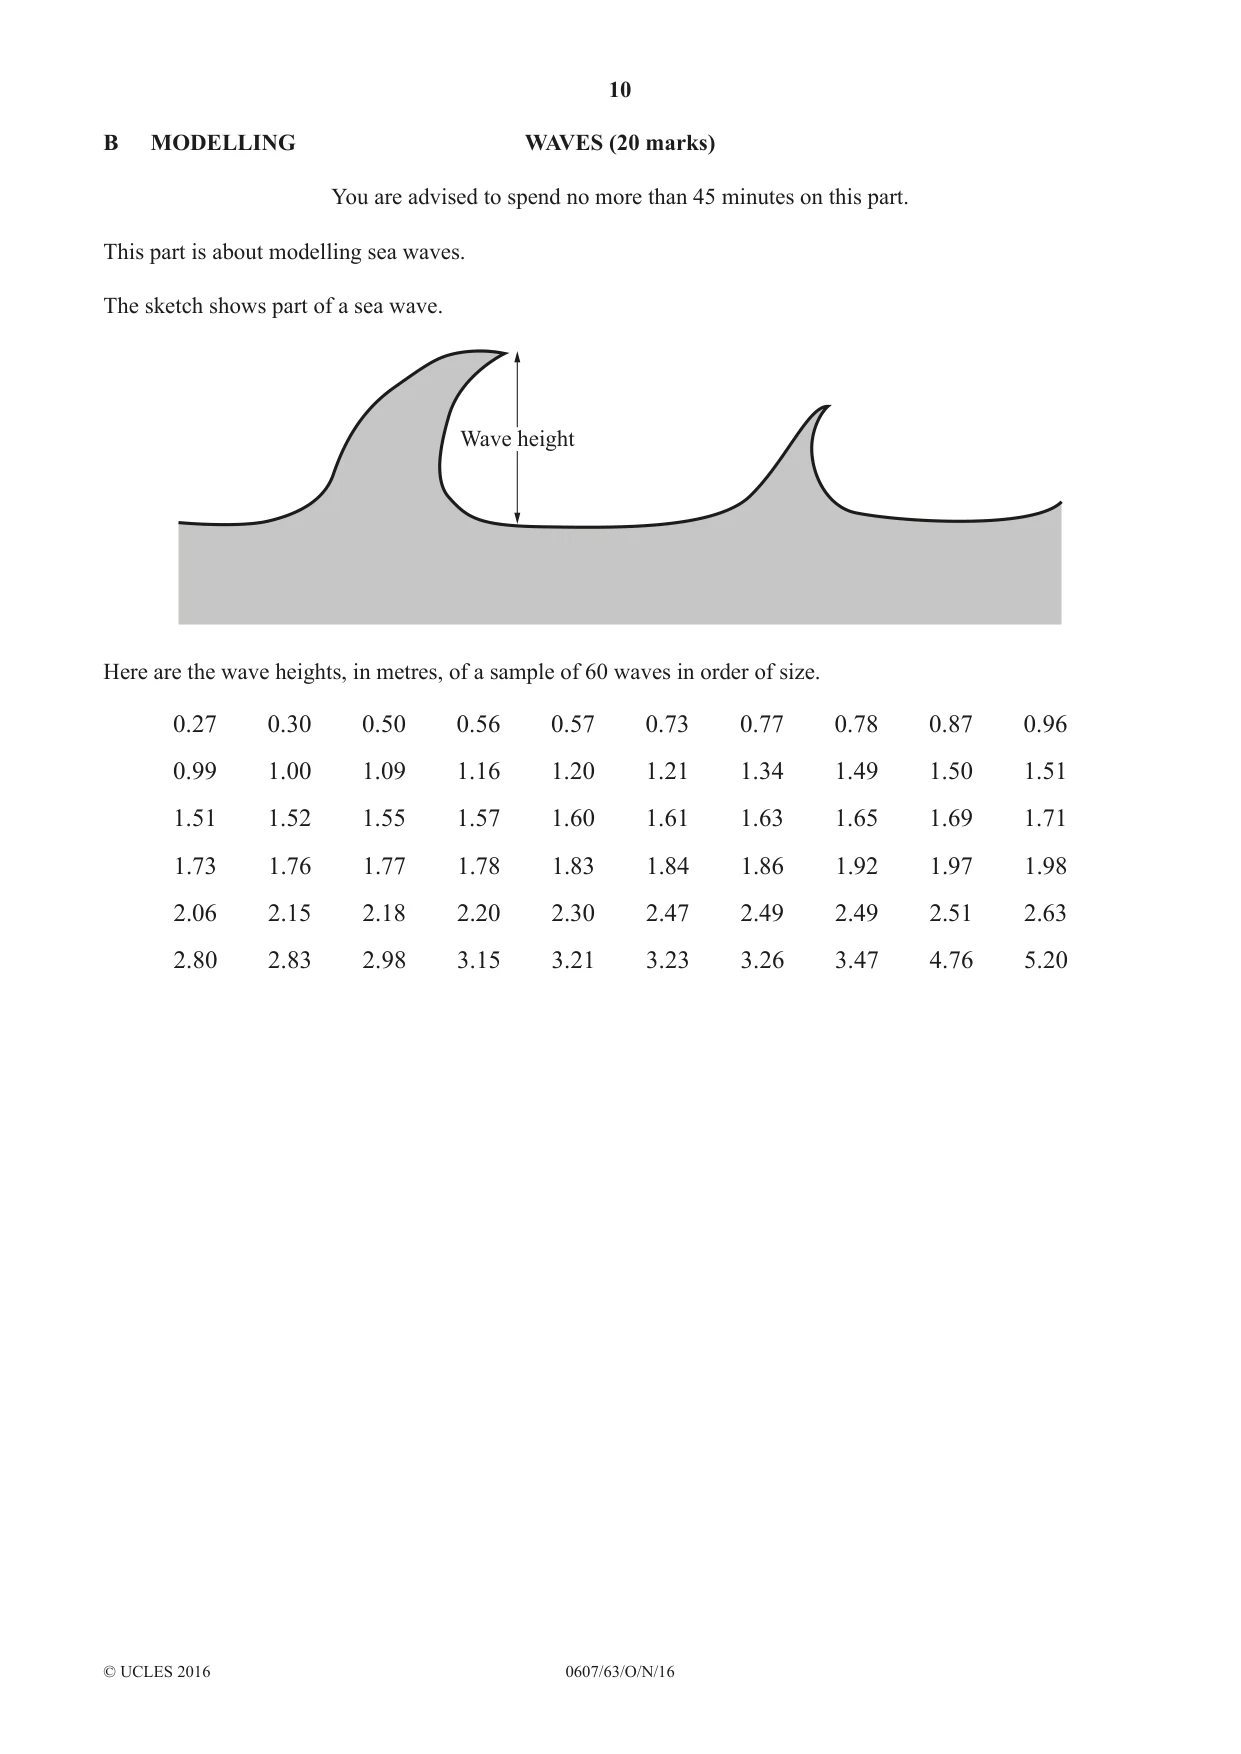
10 0607/63/O/N/16 © UCLES 2016 B MODELLING WAVES (20 marks) You are advised to spend no more than 45 minutes on this part. This part is about modelling sea waves. The sketch shows part of a sea wave. Wave height Here are the wave heights, in metres, of a sample of 60 waves in order of size. 0.27 0.30 0.50 0.56 0.57 0.73 0.77 0.78 0.87 0.96 0.99 1.00 1.09 1.16 1.20 1.21 1.34 1.49 1.50 1.51 1.51 1.52 1.55 1.57 1.60 1.61 1.63 1.65 1.69 1.71 1.73 1.76 1.77 1.78 1.83 1.84 1.86 1.92 1.97 1.98 2.06 2.15 2.18 2.20 2.30 2.47 2.49 2.49 2.51 2.63 2.80 2.83 2.98 3.15 3.21 3.23 3.26 3.47 4.76 5.20
Question paper, page 11
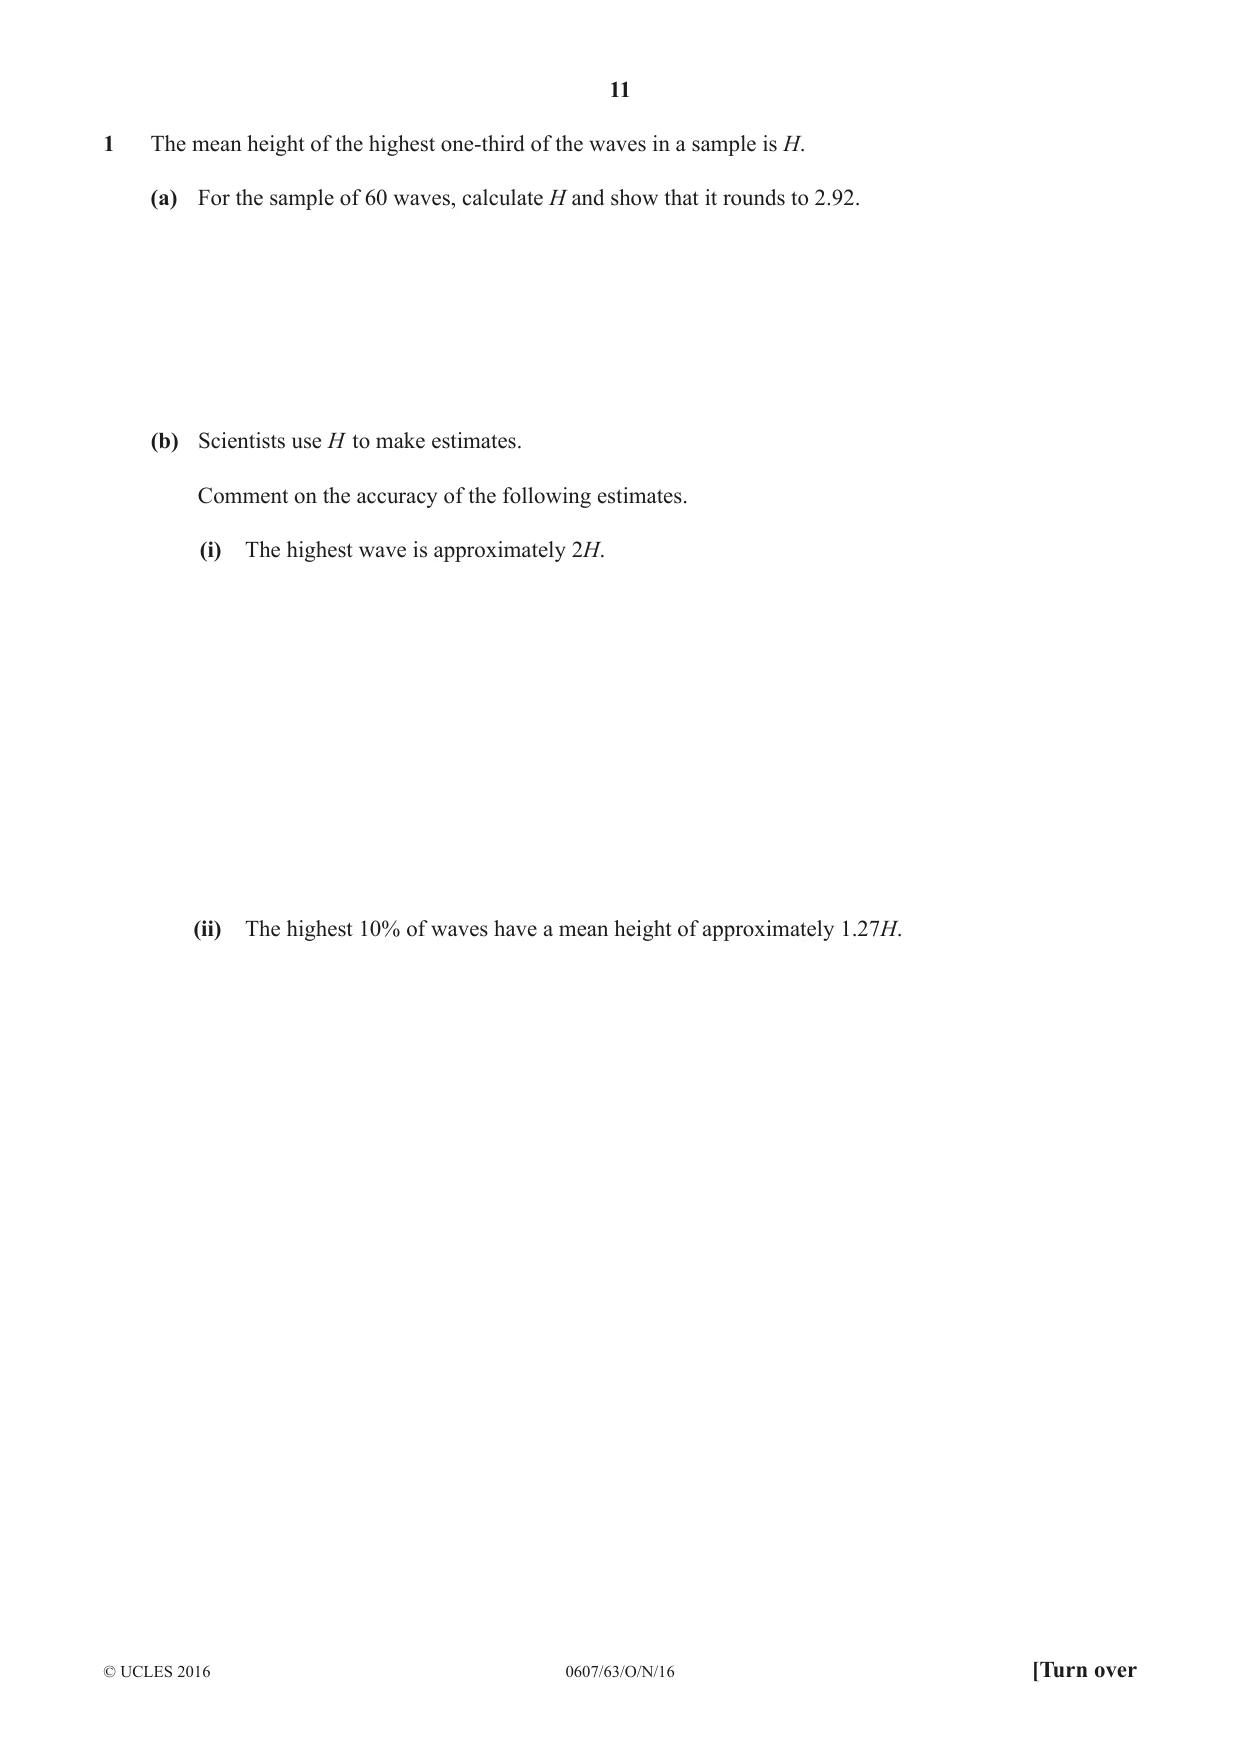
11 0607/63/O/N/16 © UCLES 2016 [Turn over 1 The mean height of the highest one-third of the waves in a sample is H. (a) For the sample of 60 waves, calculate H and show that it rounds to 2.92. (b) Scientists use H to make estimates. Comment on the accuracy of the following estimates. (i) The highest wave is approximately 2H. (ii) The highest 10% of waves have a mean height of approximately 1.27H.
Question paper, page 12
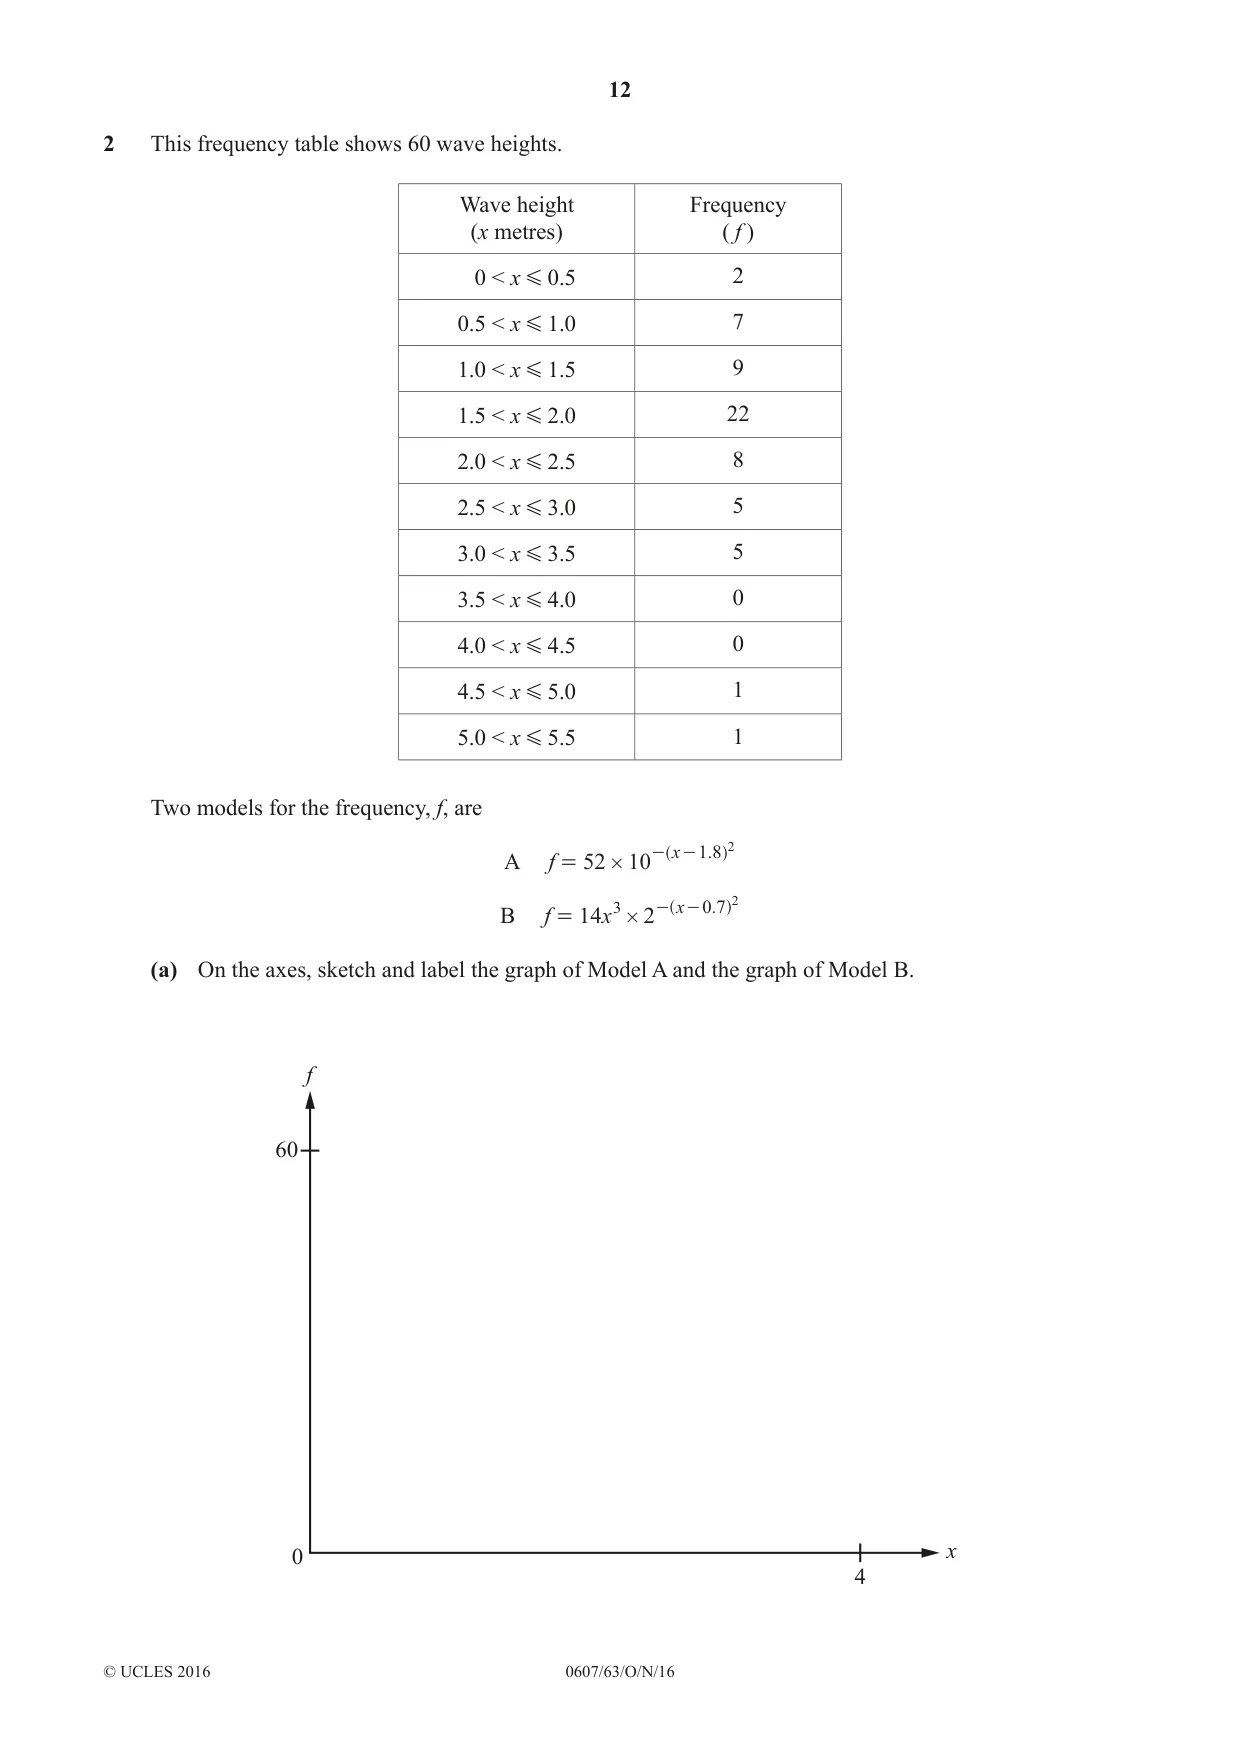
12 0607/63/O/N/16 © UCLES 2016 2 This frequency table shows 60 wave heights. Wave height (x metres) Frequency ( f ) 0 < x G 0.5 2 0.5 < x G 1.0 7 1.0 < x G 1.5 9 1.5 < x G 2.0 22 2.0 < x G 2.5 8 2.5 < x G 3.0 5 3.0 < x G 3.5 5 3.5 < x G 4.0 0 4.0 < x G 4.5 0 4.5 < x G 5.0 1 5.0 < x G 5.5 1 Two models for the frequency, f, are A 52 10 f 1.8 x # = - - 2 ^ h B 14 2 f x3 0.7 x # = - - 2 ^ h (a) On the axes, sketch and label the graph of Model A and the graph of Model B. f x 60 0 4
Question paper, page 13
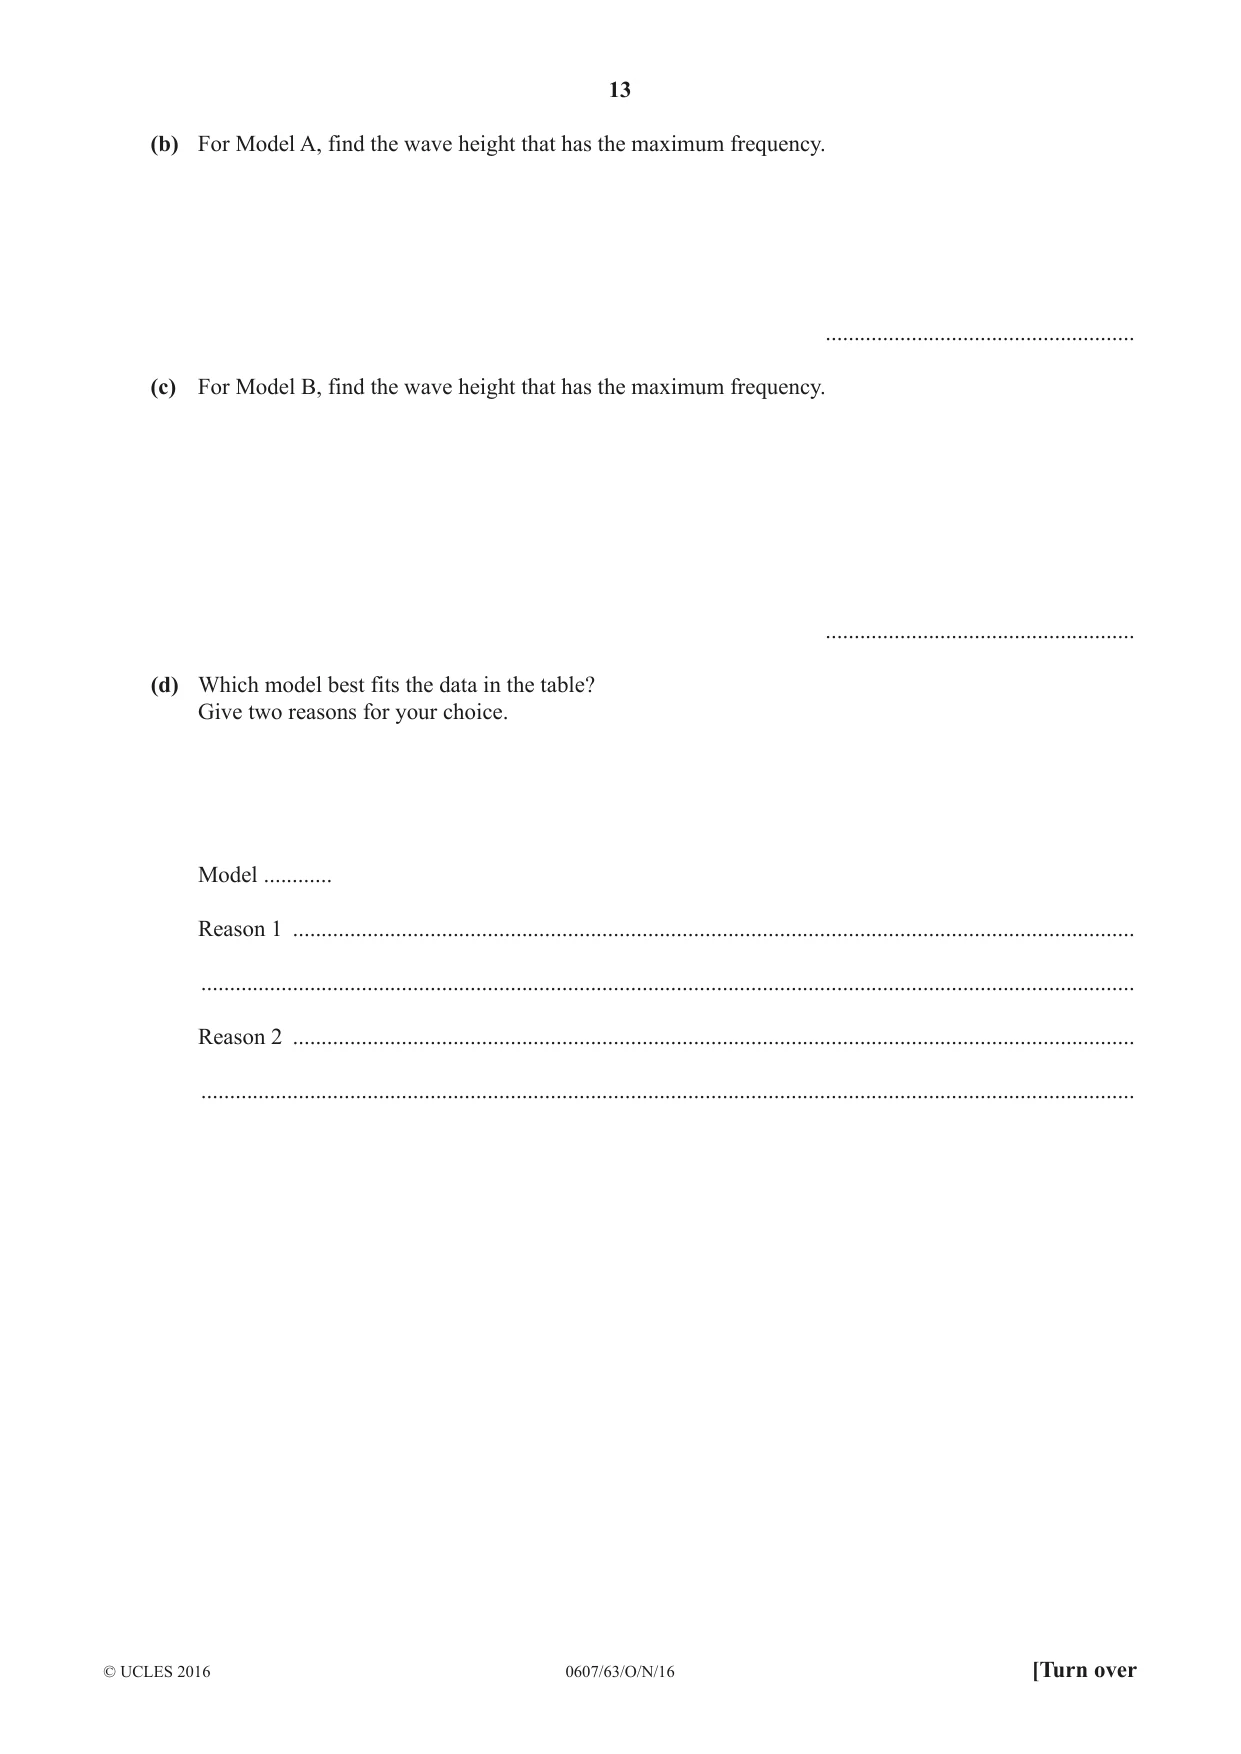
13 0607/63/O/N/16 © UCLES 2016 [Turn over (b) For Model A, find the wave height that has the maximum frequency. … (c) For Model B, find the wave height that has the maximum frequency. … (d) Which model best fits the data in the table? Give two reasons for your choice. Model … Reason 1 … … Reason 2 … …
Question paper, page 14
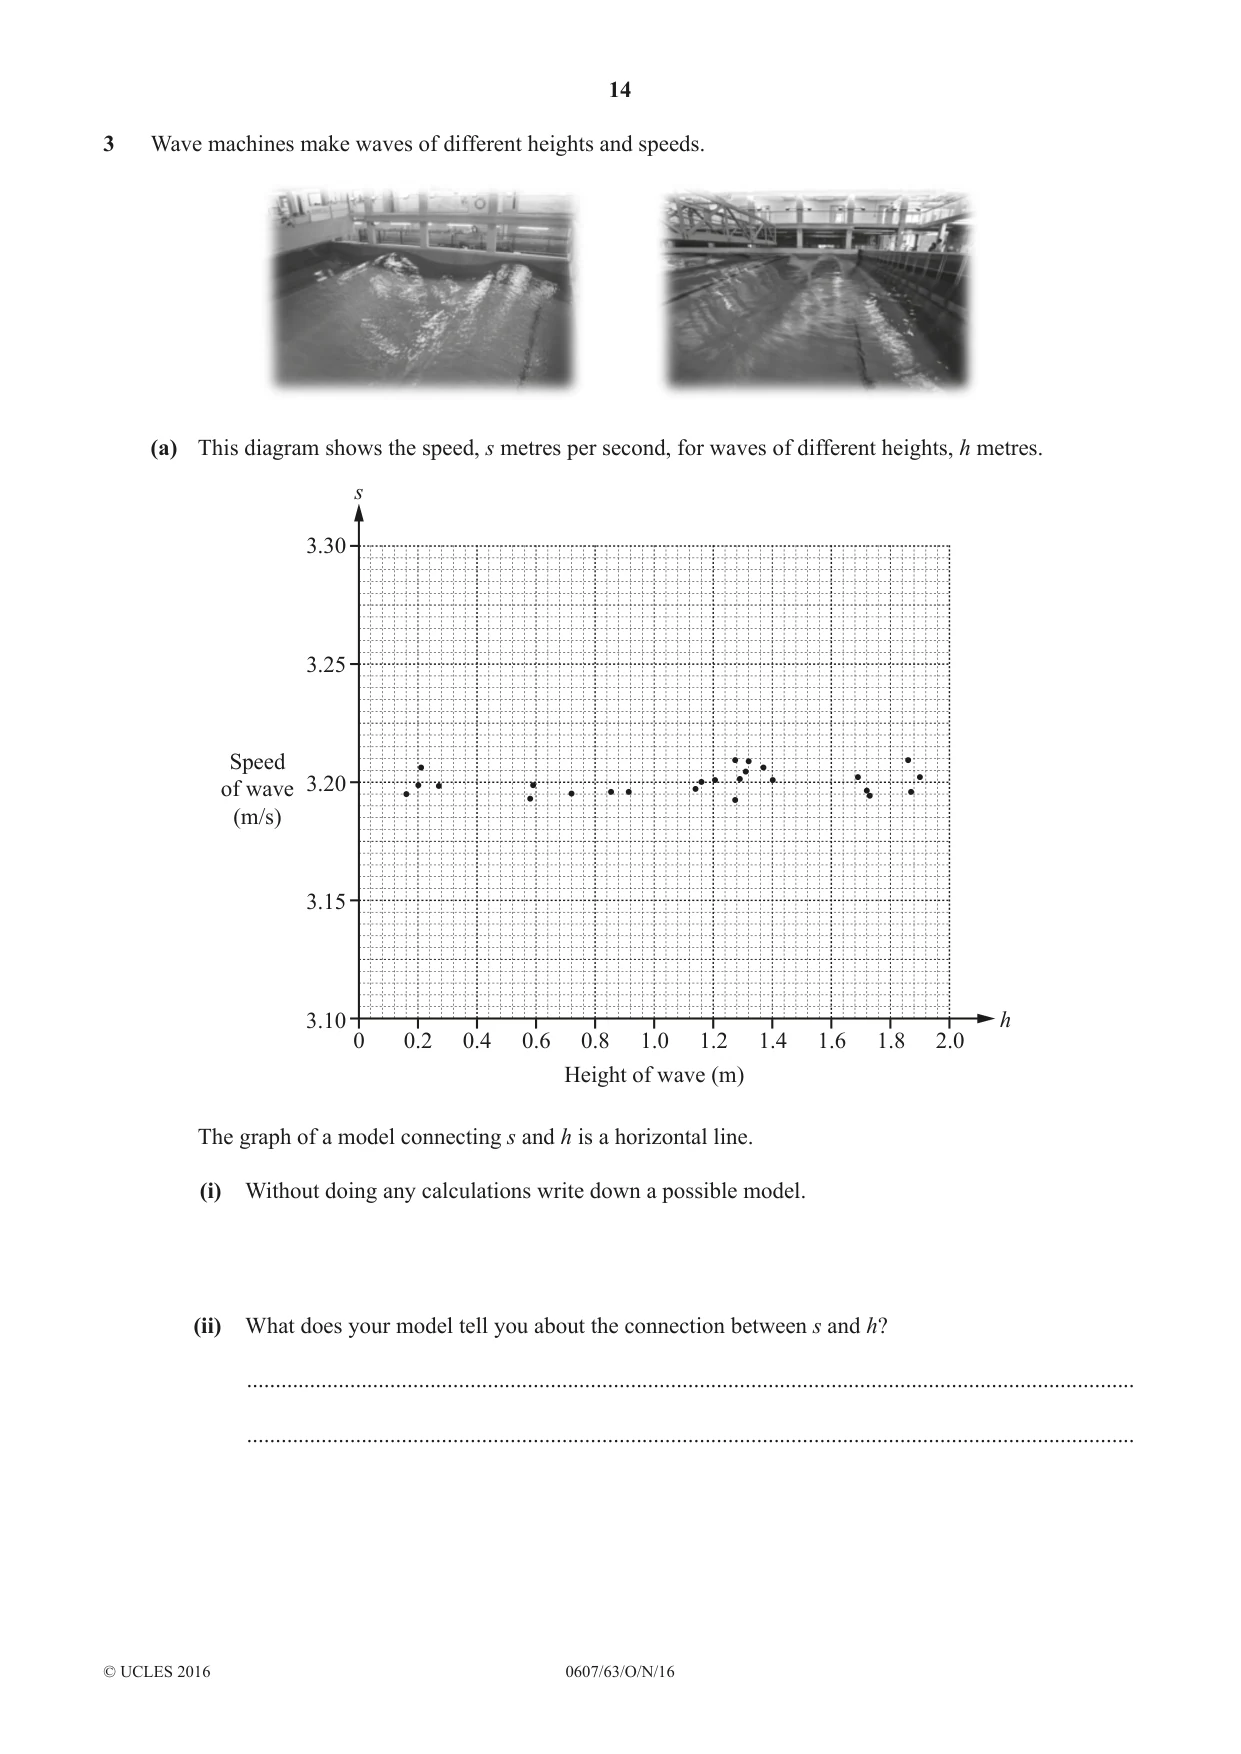
14 0607/63/O/N/16 © UCLES 2016 3 Wave machines make waves of different heights and speeds. (a) This diagram shows the speed, s metres per second, for waves of different heights, h metres. 3.10 0 0.2 0.4 0.6 0.8 1.0 1.2 1.4 1.6 1.8 2.0 3.15 3.20 3.25 3.30 s Speed of wave (m/s) Height of wave (m) h The graph of a model connecting s and h is a horizontal line. (i) Without doing any calculations write down a possible model. (ii) What does your model tell you about the connection between s and h? … …
Question paper, page 15
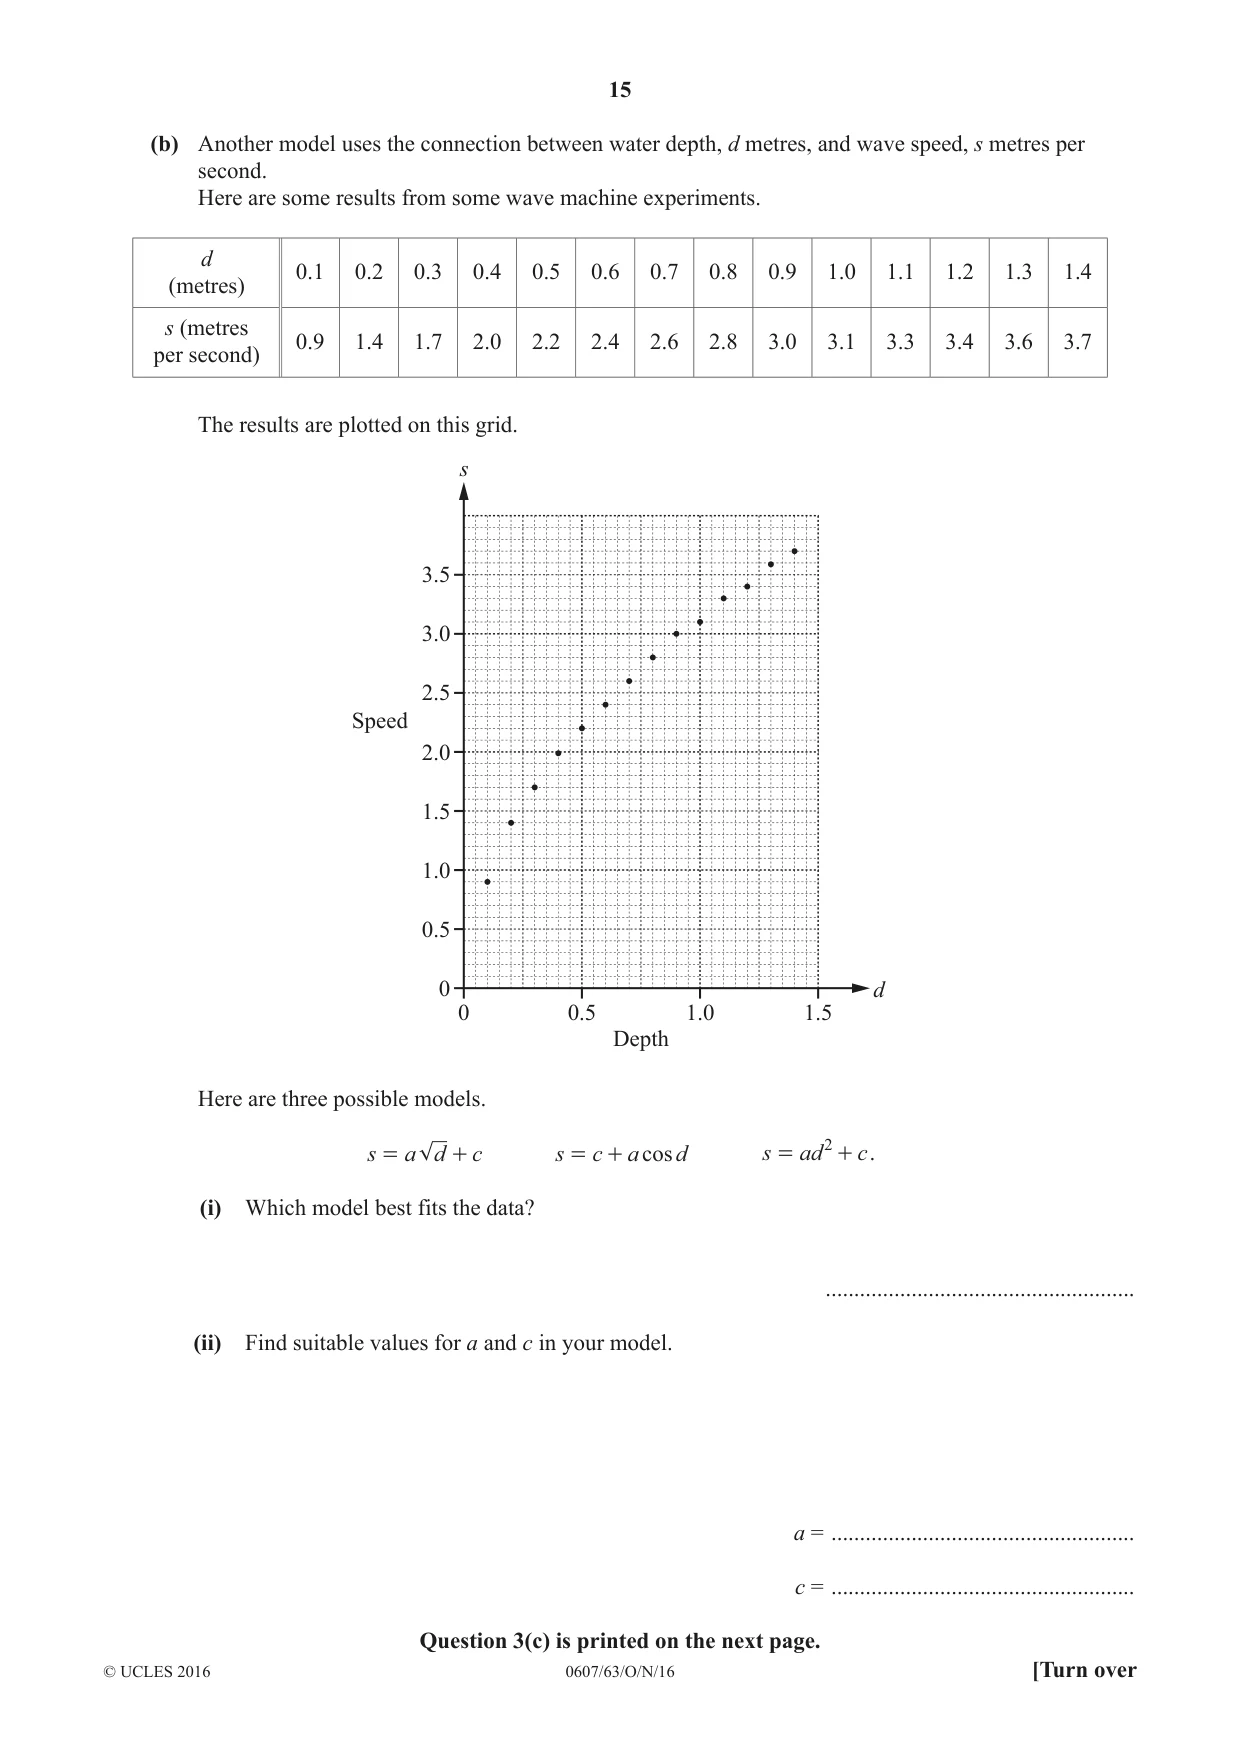
15 0607/63/O/N/16 © UCLES 2016 [Turn over (b) Another model uses the connection between water depth, d metres, and wave speed, s metres per second. Here are some results from some wave machine experiments. d (metres) 0.1 0.2 0.3 0.4 0.5 0.6 0.7 0.8 0.9 1.0 1.1 1.2 1.3 1.4 s (metres per second) 0.9 1.4 1.7 2.0 2.2 2.4 2.6 2.8 3.0 3.1 3.3 3.4 3.6 3.7 The results are plotted on this grid. 0 0 0.5 1.0 1.5 0.5 1.0 1.5 2.0 2.5 3.0 3.5 s d Speed Depth Here are three possible models. s a d c = + cos s c a d = + s ad2 = c + . (i) Which model best fits the data? … (ii) Find suitable values for a and c in your model. a = … c = … Question 3(c) is printed on the next page.
Question paper, page 16
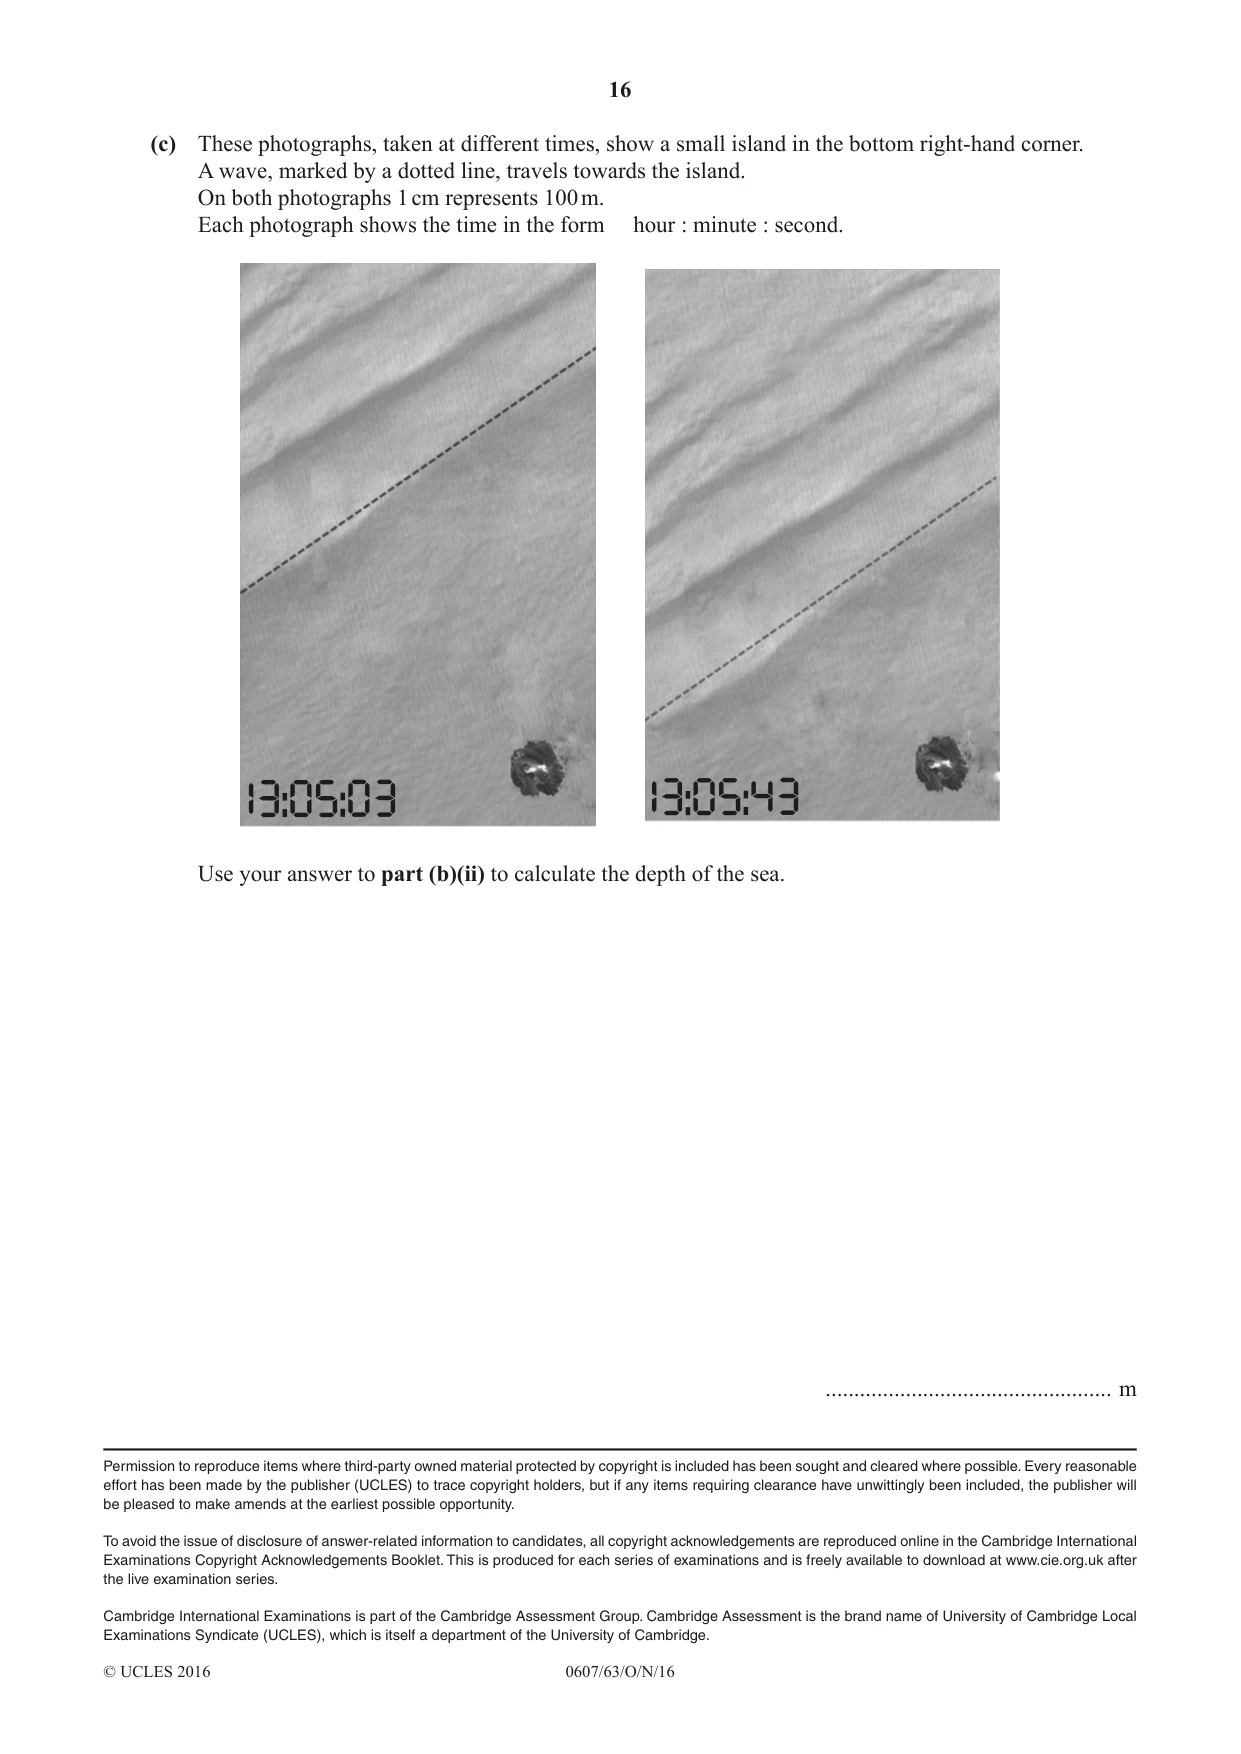
16 0607/63/O/N/16 © UCLES 2016 Permission to reproduce items where third-party owned material protected by copyright is included has been sought and cleared where possible. Every reasonable effort has been made by the publisher (UCLES) to trace copyright holders, but if any items requiring clearance have unwittingly been included, the publisher will be pleased to make amends at the earliest possible opportunity. To avoid the issue of disclosure of answer-related information to candidates, all copyright acknowledgements are reproduced online in the Cambridge International Examinations Copyright Acknowledgements Booklet. This is produced for each series of examinations and is freely available to download at www.cie.org.uk after the live examination series. Cambridge International Examinations is part of the Cambridge Assessment Group. Cambridge Assessment is the brand name of University of Cambridge Local Examinations Syndicate (UCLES), which is itself a department of the University of Cambridge. (c) These photographs, taken at different times, show a small island in the bottom right-hand corner. A wave, marked by a dotted line, travels towards the island. On both photographs 1 cm represents 100 m. Each photograph shows the time in the form hour : minute : second. Use your answer to part (b)(ii) to calculate the depth of the sea. … m
Mark scheme, page 1
® IGCSE is the registered trademark of Cambridge International Examinations. This document consists of 4 printed pages. © UCLES 2016 [Turn over Cambridge International Examinations Cambridge International General Certificate of Secondary Education CAMBRIDGE INTERNATIONAL MATHEMATICS 0607/63 Paper 6 (Extended) October/November 2016 MARK SCHEME Maximum Mark: 40 Published This mark scheme is published as an aid to teachers and candidates, to indicate the requirements of the examination. It shows the basis on which Examiners were instructed to award marks. It does not indicate the details of the discussions that took place at an Examiners’ meeting before marking began, which would have considered the acceptability of alternative answers. Mark schemes should be read in conjunction with the question paper and the Principal Examiner Report for Teachers. Cambridge will not enter into discussions about these mark schemes. Cambridge is publishing the mark schemes for the October/November 2016 series for most Cambridge IGCSE®, Cambridge International A and AS Level components and some Cambridge O Level components.
Mark scheme, page 2
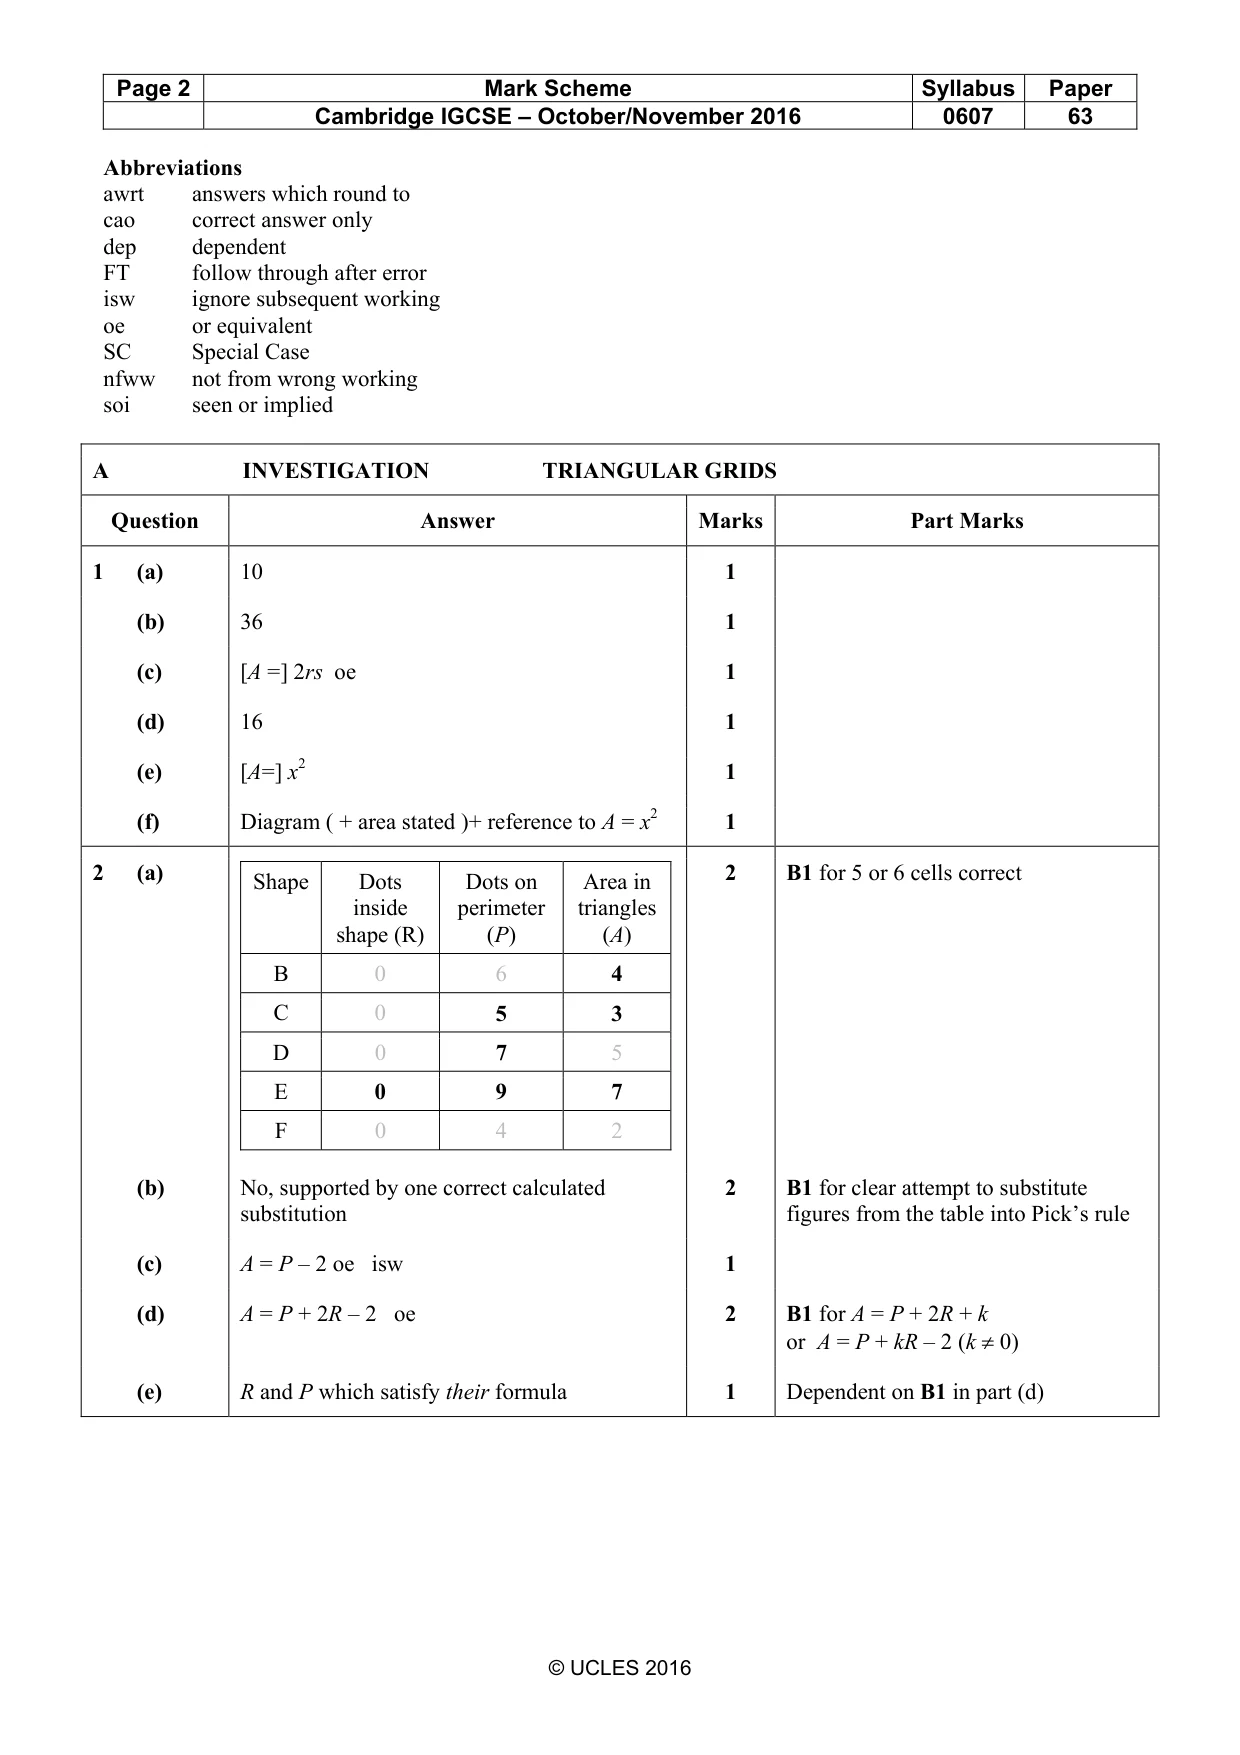
Page 2 Mark Scheme Syllabus Paper Cambridge IGCSE – October/November 2016 0607 63 © UCLES 2016 Abbreviations awrt answers which round to cao correct answer only dep dependent FT follow through after error isw ignore subsequent working oe or equivalent SC Special Case nfww not from wrong working soi seen or implied A INVESTIGATION TRIANGULAR GRIDS Question Answer Marks Part Marks 1 (a) 10 1 (b) 36 1 (c) [A =] 2rs oe 1 (d) 16 1 (e) [A=] x2 1 (f) Diagram ( + area stated )+ reference to A = x2 1 2 (a) Shape Dots inside shape (R) Dots on perimeter (P) Area in triangles (A) B 0 6 4 C 0 5 3 D 0 7 5 E 0 9 7 F 0 4 2 2 B1 for 5 or 6 cells correct (b) No, supported by one correct calculated substitution 2 B1 for clear attempt to substitute figures from the table into Pick’s rule (c) A = P – 2 oe isw 1 (d) A = P + 2R – 2 oe 2 B1 for A = P + 2R + k or A = P + kR – 2 (k ≠ 0) (e) R and P which satisfy their formula 1 Dependent on B1 in part (d)
Mark scheme, page 3
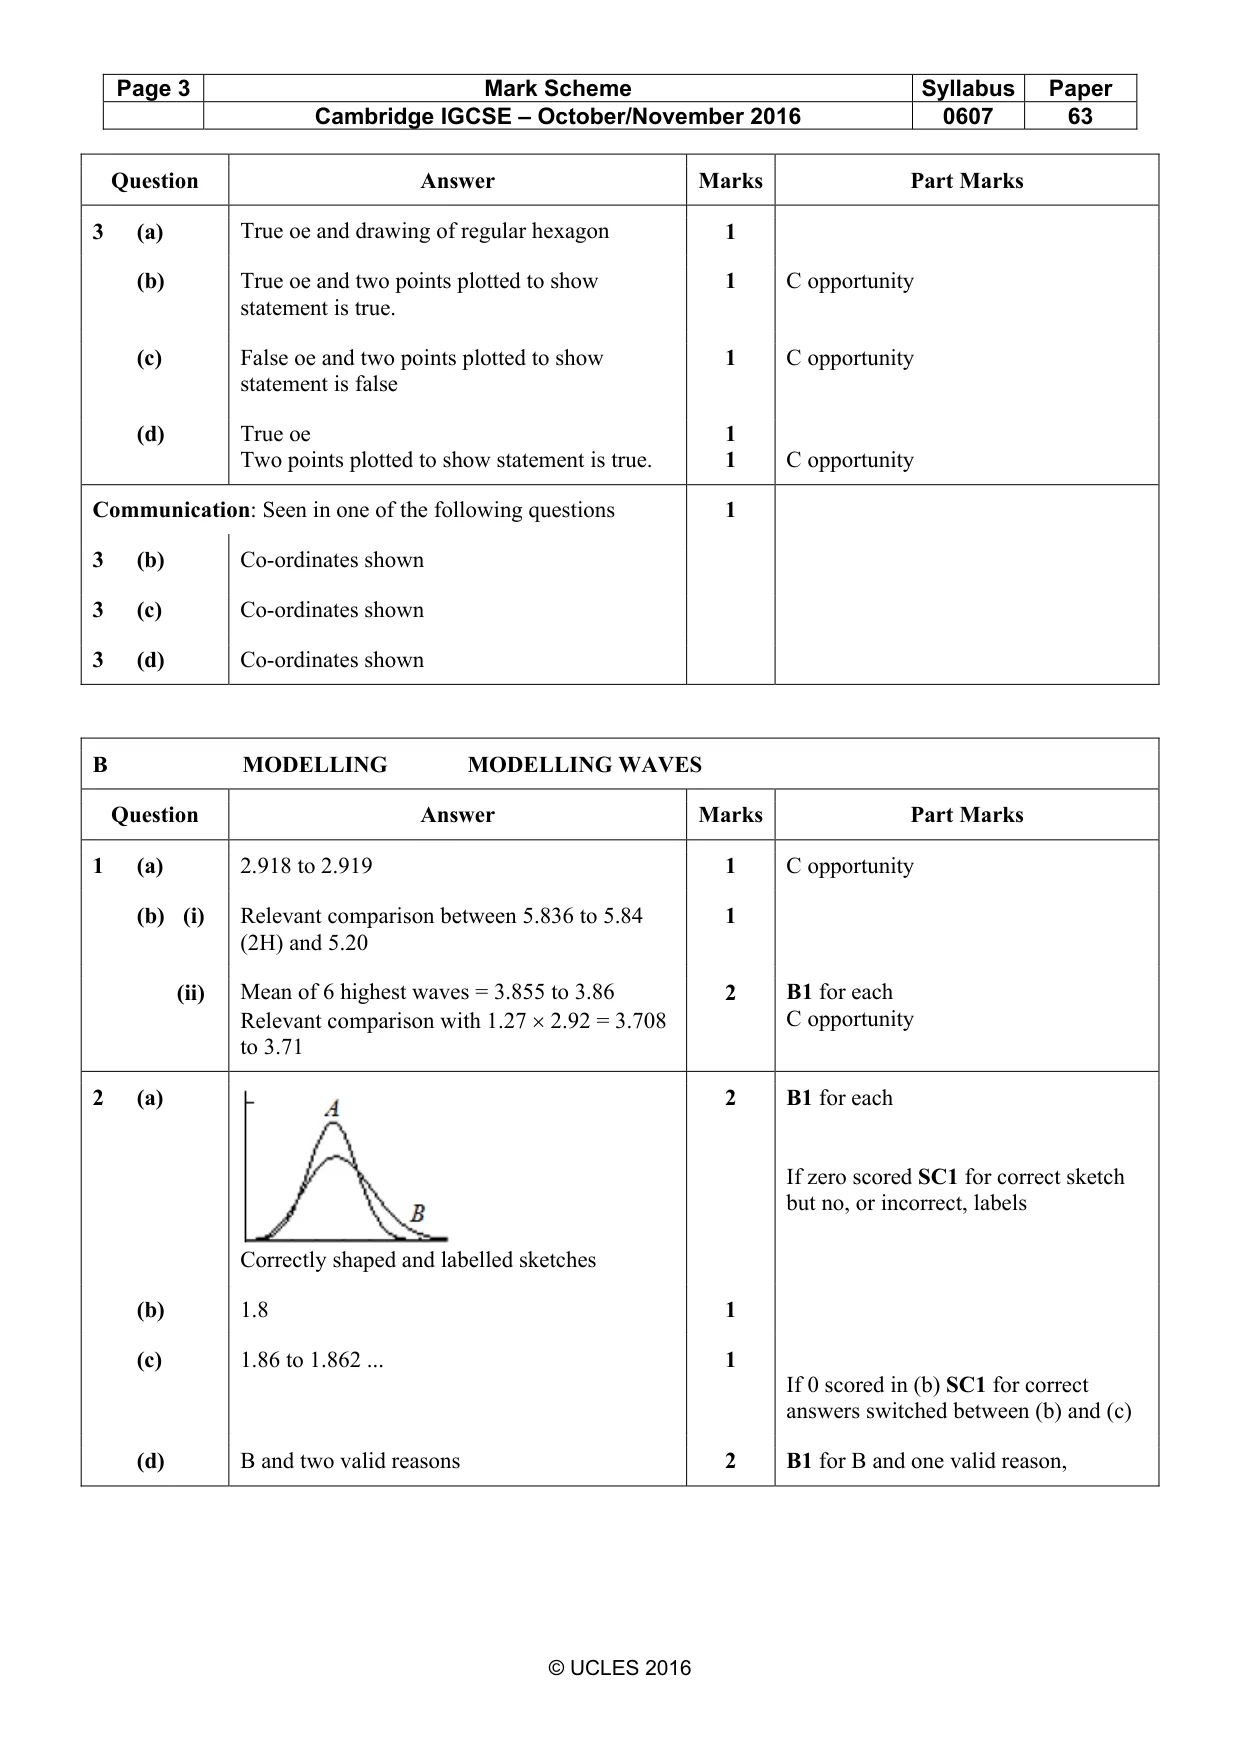
Page 3 Mark Scheme Syllabus Paper Cambridge IGCSE – October/November 2016 0607 63 © UCLES 2016 Question Answer Marks Part Marks 3 (a) True oe and drawing of regular hexagon 1 (b) True oe and two points plotted to show statement is true. 1 C opportunity (c) False oe and two points plotted to show statement is false 1 C opportunity (d) True oe Two points plotted to show statement is true. 1 1 C opportunity Communication: Seen in one of the following questions 1 3 (b) Co-ordinates shown 3 (c) Co-ordinates shown 3 (d) Co-ordinates shown B MODELLING MODELLING WAVES Question Answer Marks Part Marks 1 (a) 2.918 to 2.919 1 C opportunity (b) (i) Relevant comparison between 5.836 to 5.84 (2H) and 5.20 1 (ii) Mean of 6 highest waves = 3.855 to 3.86 Relevant comparison with 1.27 × 2.92 = 3.708 to 3.71 2 B1 for each C opportunity 2 (a) Correctly shaped and labelled sketches 2 B1 for each If zero scored SC1 for correct sketch but no, or incorrect, labels (b) 1.8 1 (c) 1.86 to 1.862 ... 1 If 0 scored in (b) SC1 for correct answers switched between (b) and (c) (d) B and two valid reasons 2 B1 for B and one valid reason,
Mark scheme, page 4
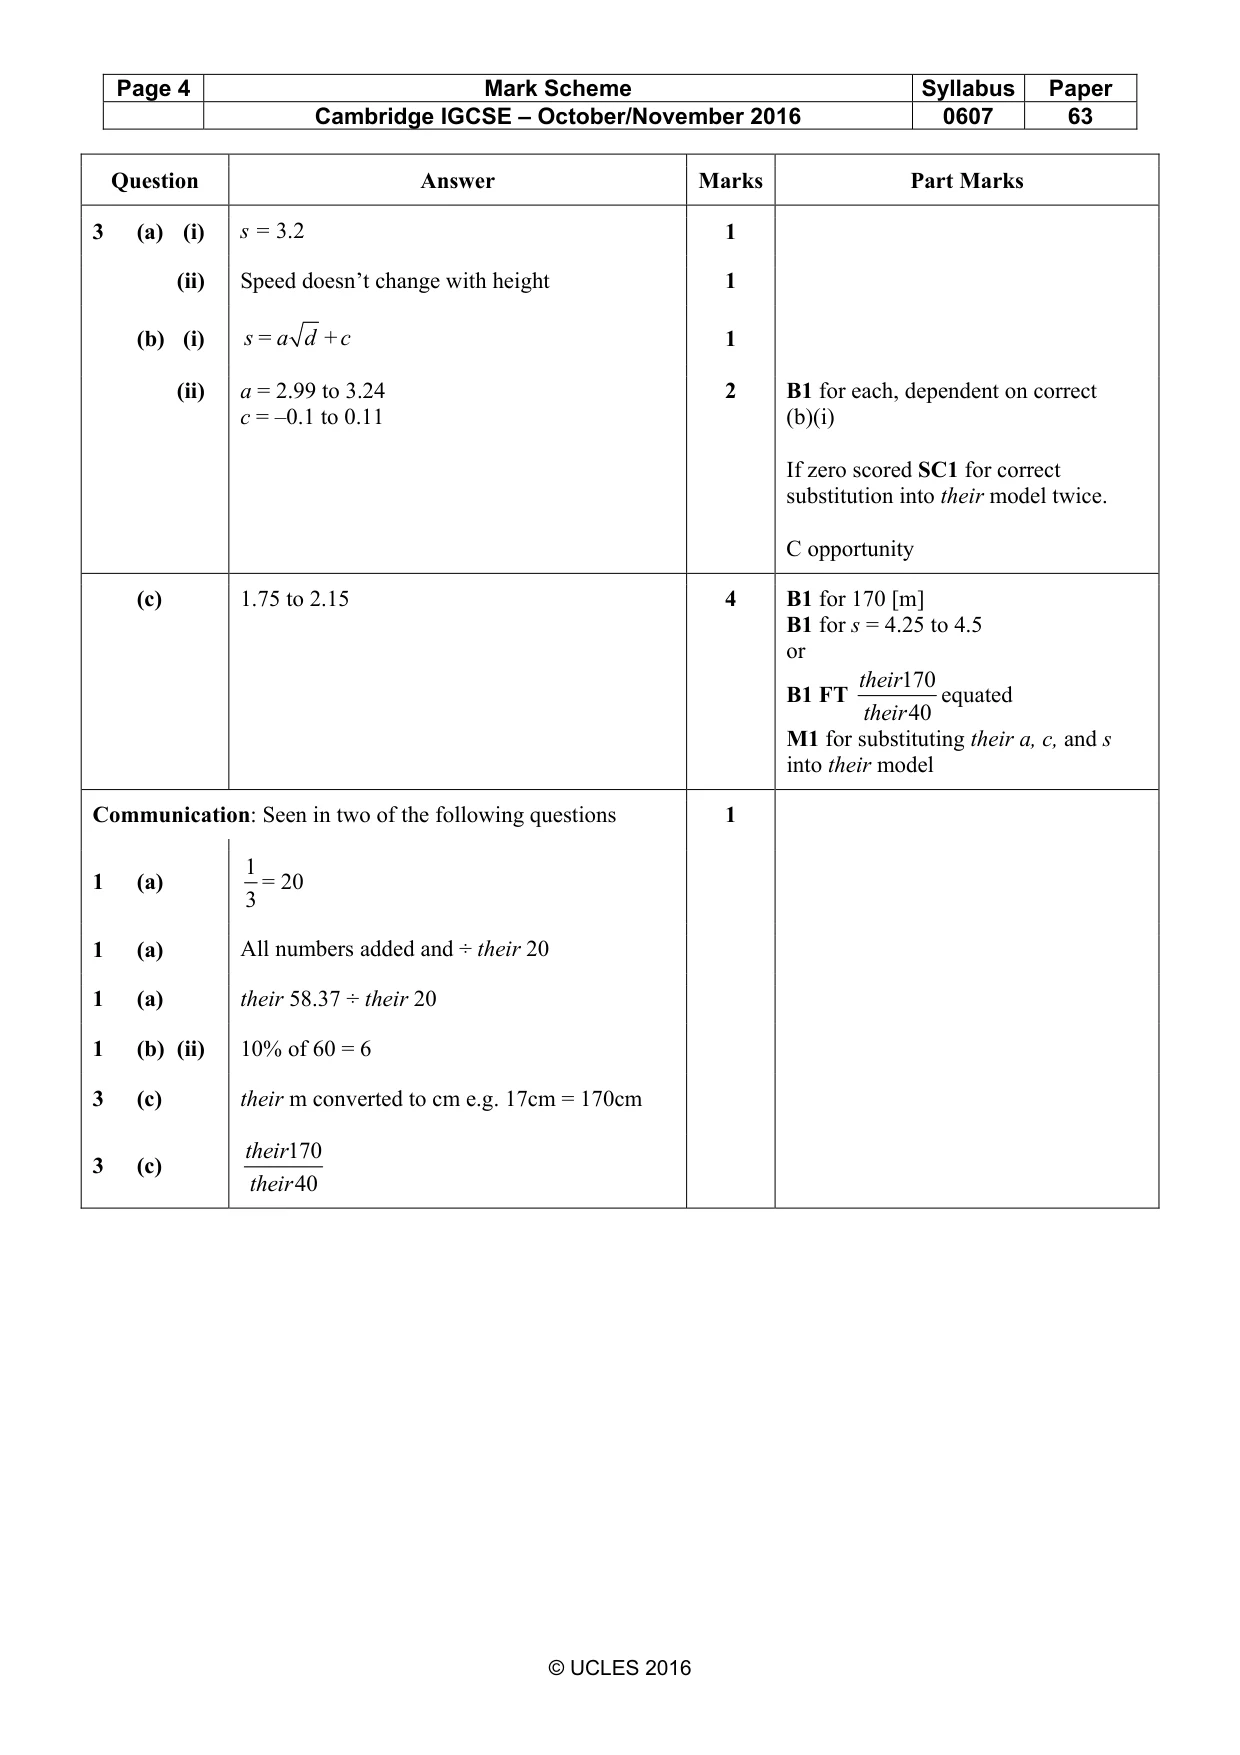
Page 4 Mark Scheme Syllabus Paper Cambridge IGCSE – October/November 2016 0607 63 © UCLES 2016 Question Answer Marks Part Marks 3 (a) (i) s = 3.2 1 (ii) Speed doesn’t change with height 1 (b) (i) s= a d +c 1 (ii) a = 2.99 to 3.24 c = –0.1 to 0.11 2 B1 for each, dependent on correct (b)(i) If zero scored SC1 for correct substitution into their model twice. C opportunity (c) 1.75 to 2.15 4 B1 for 170 [m] B1 for s = 4.25 to 4.5 or B1 FT 170 40 their their equated M1 for substituting their a, c, and s into their model Communication: Seen in two of the following questions 1 1 (a) 1 3 = 20 1 (a) All numbers added and ÷ their 20 1 (a) their 58.37 ÷ their 20 1 (b) (ii) 10% of 60 = 6 3 (c) their m converted to cm e.g. 17cm = 170cm 3 (c) 170 40 their their
What you needed in this session
Cambridge’s own grade thresholds for 2016 Oct/Nov, Paper 6 · Variant 3. A higher threshold means an easier paper — the bar moves with how the cohort did.