Cambridge IGCSE Mathematics 0580 — 2006 May/June Paper 4 · Variant 1
0580/41/M/J/06 · 9 questions · 130 marks · ≈146 min
The question paper and its mark scheme, free to read here and free to download. This is Cambridge’s own paper, exactly as it was sat.
Question paper8 pages
Mark scheme6 pages
Answers below. Sit the paper first if you are practising.
Questions as text
Q1 · A train completed a journey of 850 kilometres with an average speed of 80 kilometres per…
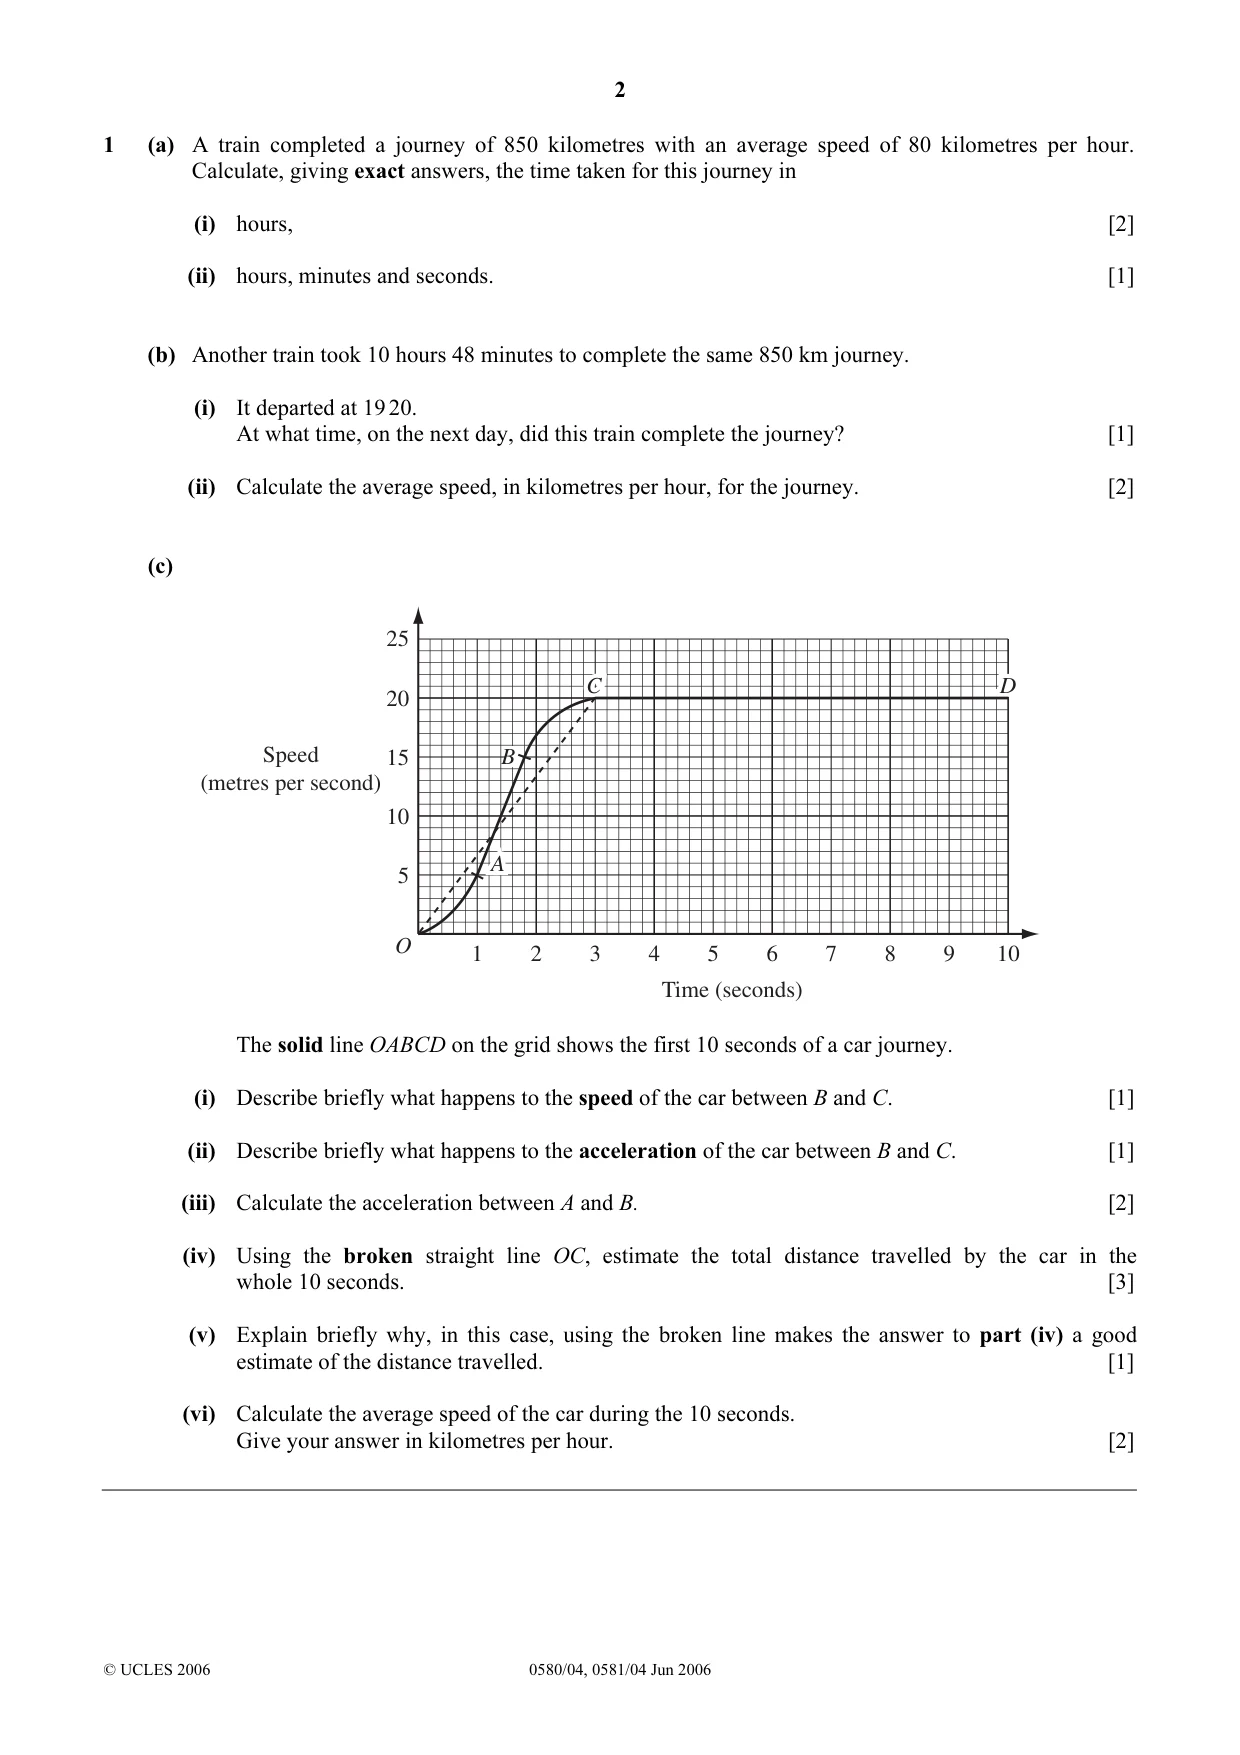
1 (a) A train completed a journey of 850 kilometres with an average speed of 80 kilometres per hour. Calculate, giving exact answers, the time taken for this journey in (i) hours, [2] (ii) hours, minutes and seconds. [1] (b) Another train took 10 hours 48 minutes to complete the same 850 km journey. (i) It departed at 19 20. At what time, on the next day, did this train complete the journey? [1] (ii) Calculate the average speed, in kilometres per hour, for the journey. [2] (c) 25 C D 20 Speed 15 BB (metres per second) 10 A 5 O 1 2 3 4 5 6 7 8 9 10 Time (seconds) The solid line OABCD on the grid shows the first 10 seconds of a car journey. (i) Describe briefly what happens to the speed of the car between B and C. [1] (ii) Describe briefly what happens to the acceleration of the car between B and C. [1] (iii) Calculate the acceleration between A and B. [2] (iv) Using the broken straight line OC, estimate the total distance travelled by the car in the whole 10 seconds. [3] (v) Explain briefly why, in this case, using the broken line makes the answer to part (iv) a good estimate of the distance travelled. [1] (vi) Calculate the average speed of the car during the 10 seconds. Give your answer in kilometres per hour. [2]
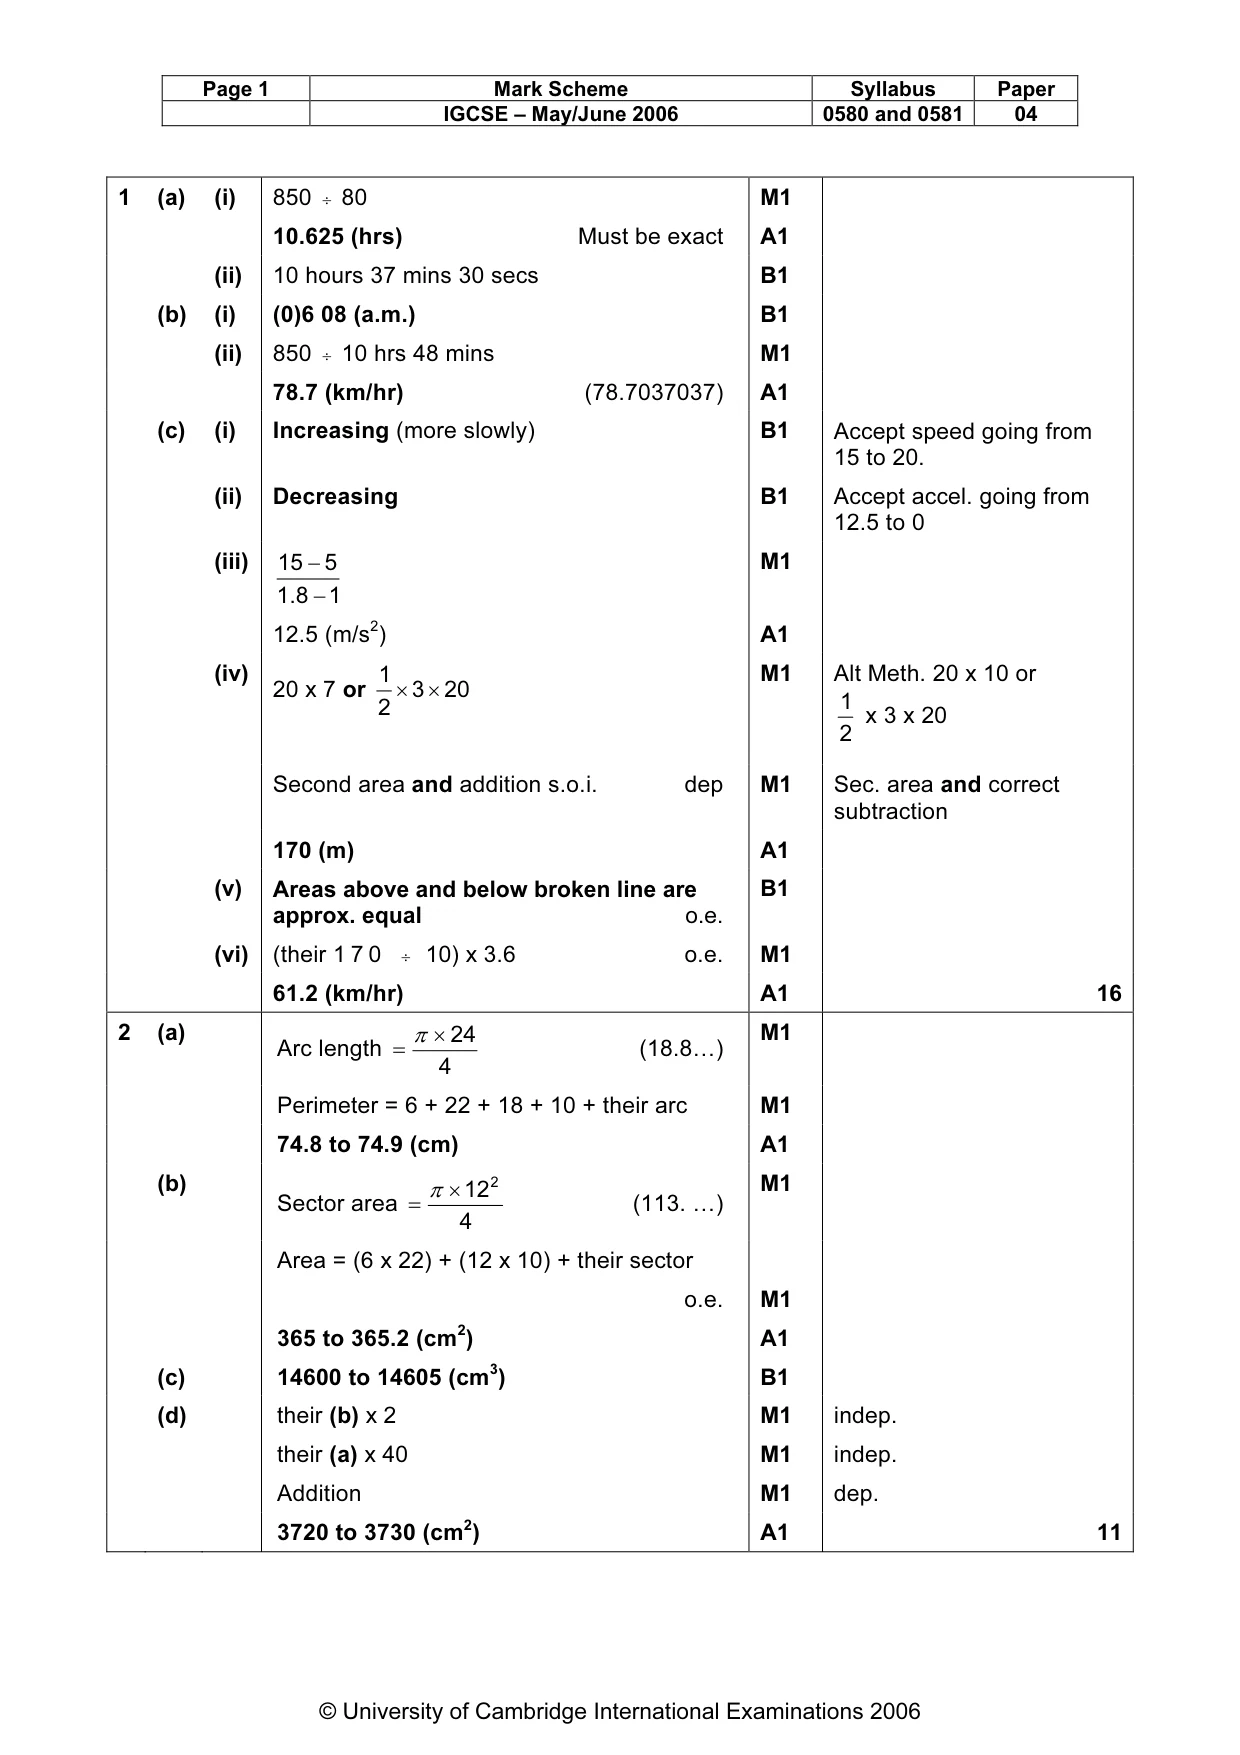
Mark scheme: 1 (a) (i) 850 ÷ 80 M1 10.625 (hrs) Must be exact A1 (ii) 10 hours 37 mins 30 secs B1 (b) (i) (0)6 08 (a.m.) B1 (ii) 850 ÷ 10 hrs 48 mins M1 78.7 (km/hr) (78.7037037) A1 (c) (i) Increasing (more slowly) B1 Accept speed going from 15 to 20. (ii) Decreasing B1 Accept accel. going from 12.5 to 0 (iii) 15 − 5 M1 1 . 8 − 1 12.5 (m/s2) A1 (iv) 1 M1 Alt Meth. 20 x 10 or 20 x 7 or × 3 × 20 2 1 x 3 x 20 2 Second area and addition s.o.i. dep M1 Sec. area and correct subtraction 170 (m) A1 (v) Areas above and below broken line are B1 approx. equal o.e. (vi) (their 1 7 0 ÷ 10) x 3.6 o.e. M1 61.2 (km/hr) A1 16
Q2 · NOT TO B C SCALE B C 12 cm 18 cm A O 12 cm A 40 cm E 22 cm D E D Diagram 1 Diagram 2…
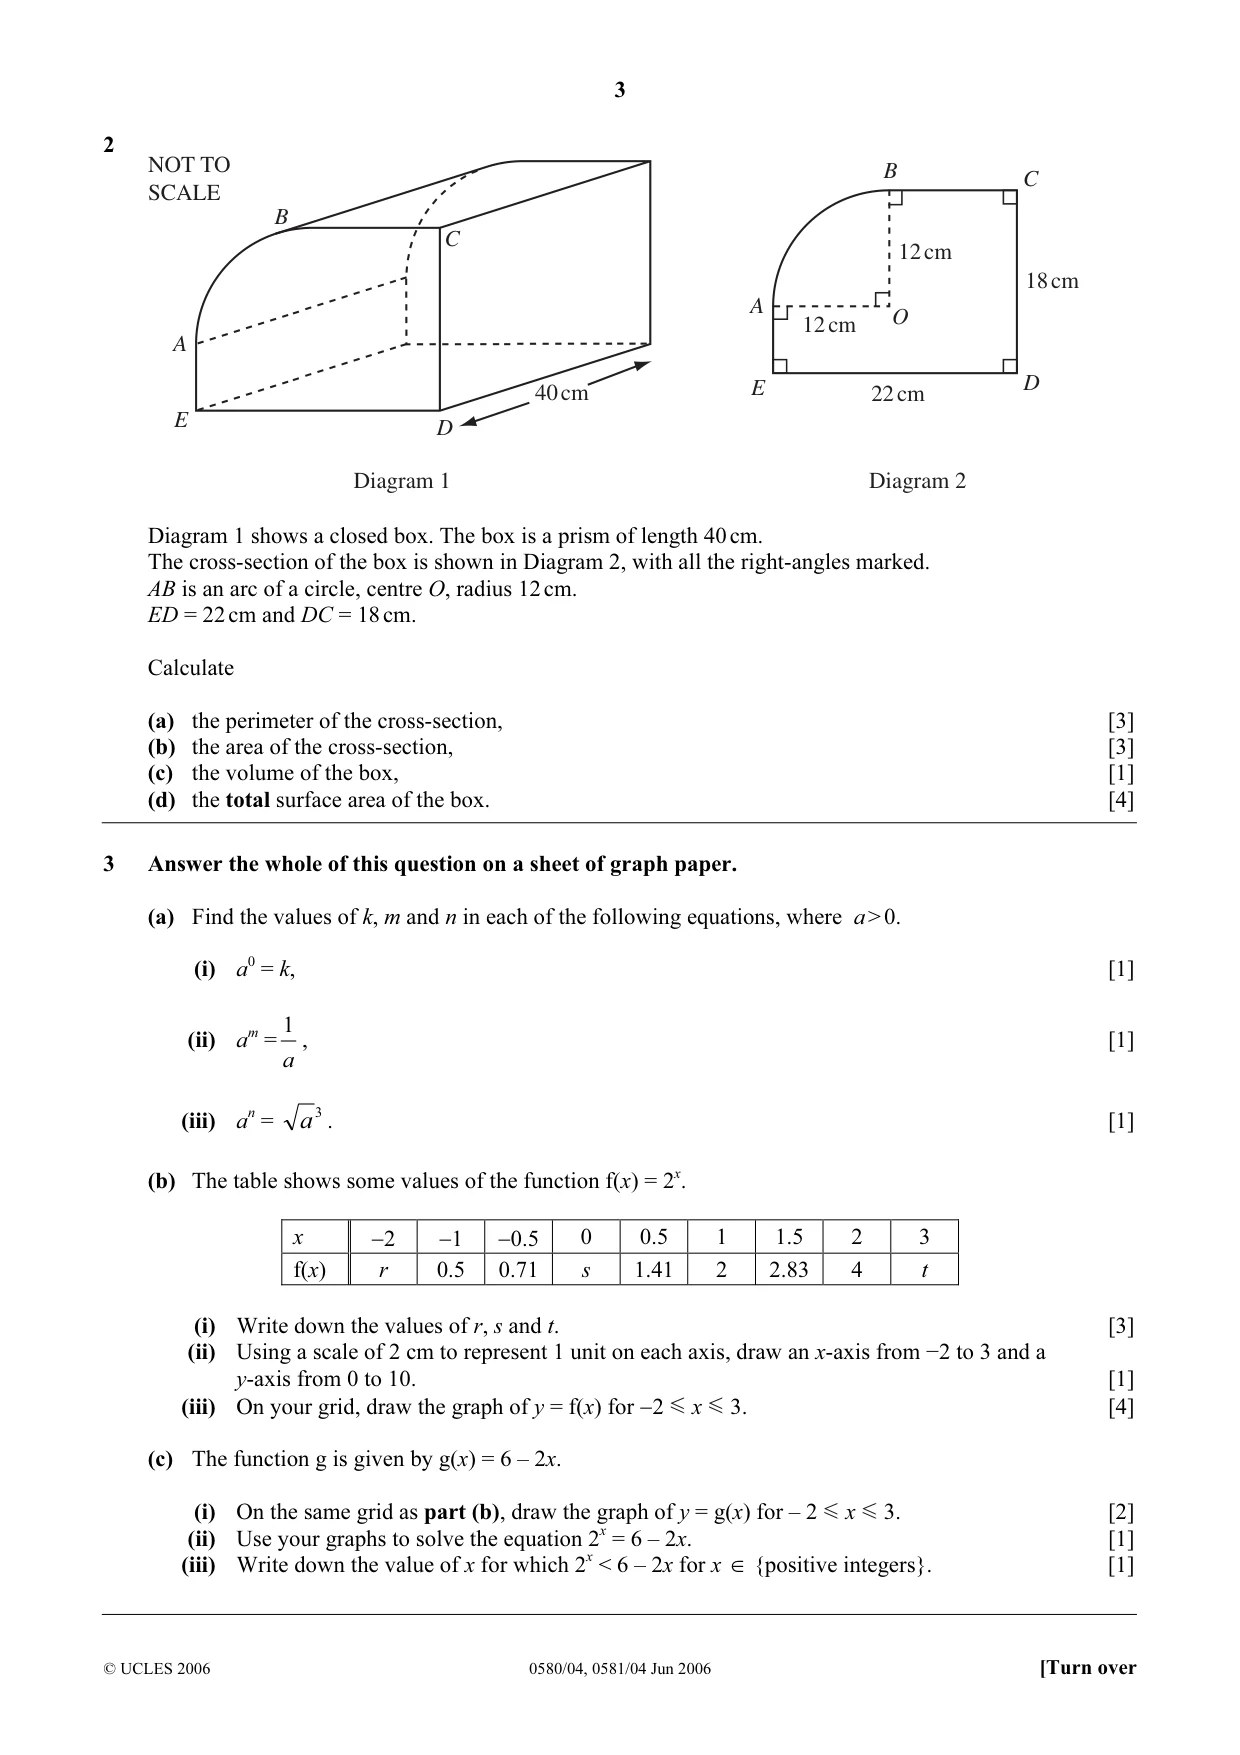
2 NOT TO B C SCALE B C 12 cm 18 cm A O 12 cm A 40 cm E 22 cm D E D Diagram 1 Diagram 2 Diagram 1 shows a closed box. The box is a prism of length 40 cm. The cross-section of the box is shown in Diagram 2, with all the right-angles marked. AB is an arc of a circle, centre O, radius 12 cm. ED = 22 cm and DC = 18 cm. Calculate (a) the perimeter of the cross-section, [3] (b) the area of the cross-section, [3] (c) the volume of the box, [1] (d) the total surface area of the box. [4]
Mark scheme: 2 (a) π × 24 M1 Arc length = (18.8…) 4 Perimeter = 6 + 22 + 18 + 10 + their arc M1 74.8 to 74.9 (cm) A1 (b) π × 122 M1 Sector area = (113. …) 4 Area = (6 x 22) + (12 x 10) + their sector o.e. M1 365 to 365.2 (cm2) A1 (c) 14600 to 14605 (cm3) B1 (d) their (b) x 2 M1 indep. their (a) x 40 M1 indep. Addition M1 dep. 3720 to 3730 (cm2) A1 11 IGCSE – May/June 2006 0580 and 0581 04
Q3 · Answer the whole of this question on a sheet of graph paper
3 Answer the whole of this question on a sheet of graph paper. (a) Find the values of k, m and n in each of the following equations, where a > 0. (i) a0 = k, [1] 1 (ii) am = , [1] a (iii) an = a 3 . [1] (b) The table shows some values of the function f(x) = 2x. x −2 −1 −0.5 0 0.5 1 1.5 2 3 f(x) r 0.5 0.71 s 1.41 2 2.83 4 t (i) Write down the values of r, s and t. [3] (ii) Using a scale of 2 cm to represent 1 unit on each axis, draw an x-axis from −2 to 3 and a y-axis from 0 to 10. [1] (iii) On your grid, draw the graph of y = f(x) for −2 x 3. [4] (c) The function g is given by g(x) = 6 – 2x. (i) On the same grid as part (b), draw the graph of y = g(x) for – 2 x 3. [2] (ii) Use your graphs to solve the equation 2x = 6 – 2x. [1] (iii) Write down the value of x for which 2x < 6 – 2x for x ∈ {positive integers}. [1]
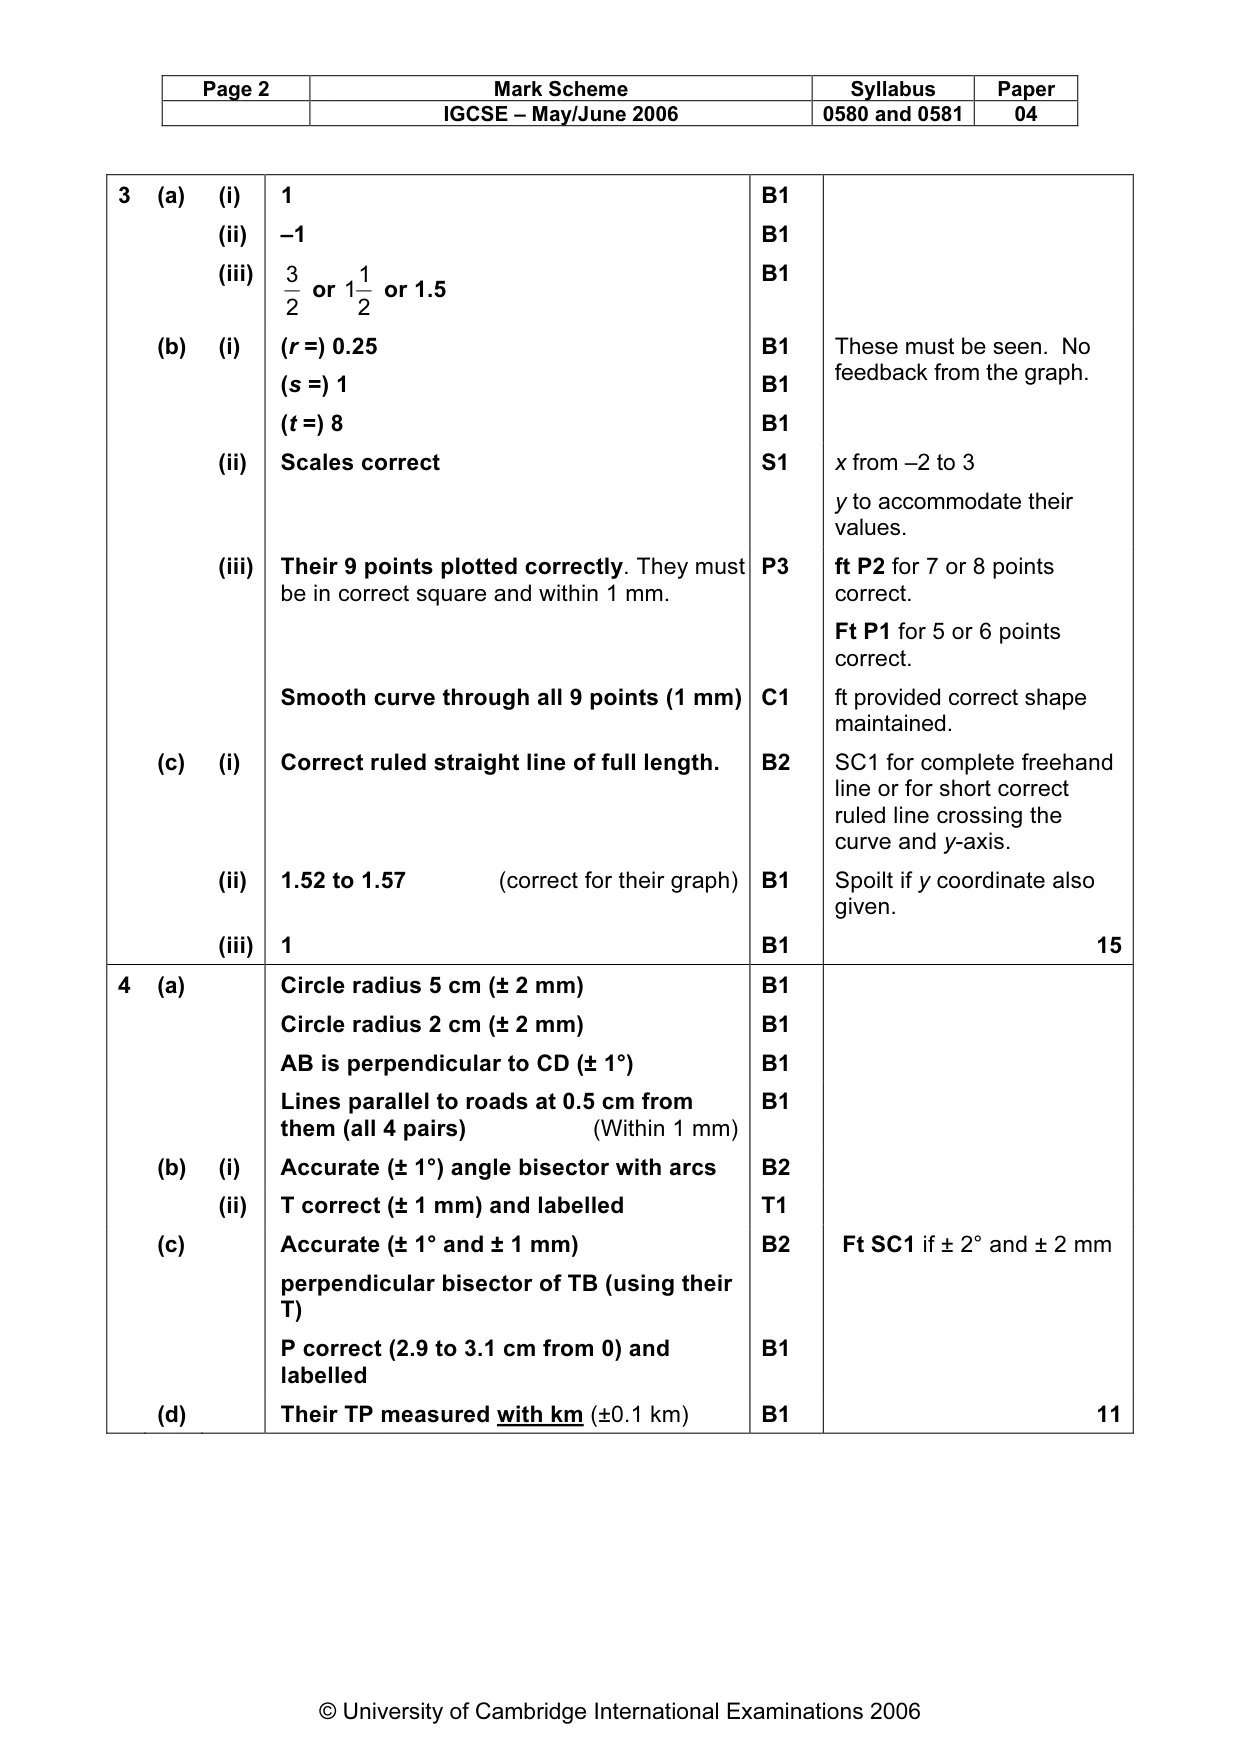
Mark scheme: 3 (a) (i) 1 B1 (ii) –1 B1 (iii) 3 1 B1 or 1 or 1.5 2 2 (b) (i) (r =) 0.25 B1 These must be seen. No feedback from the graph. (s =) 1 B1 (t =) 8 B1 (ii) Scales correct S1 x from –2 to 3 y to accommodate their values. (iii) Their 9 points plotted correctly. They must P3 ft P2 for 7 or 8 points be in correct square and within 1 mm. correct. Ft P1 for 5 or 6 points correct. Smooth curve through all 9 points (1 mm) C1 ft provided correct shape maintained. (c) (i) Correct ruled straight line of full length. B2 SC1 for complete freehand line or for short correct ruled line crossing the curve and y-axis. (ii) 1.52 to 1.57 (correct for their graph) B1 Spoilt if y coordinate also given. (iii) 1 B1 15
Q4 · C North A B O NOT TO SCALE D The diagram shows a plan for a new city
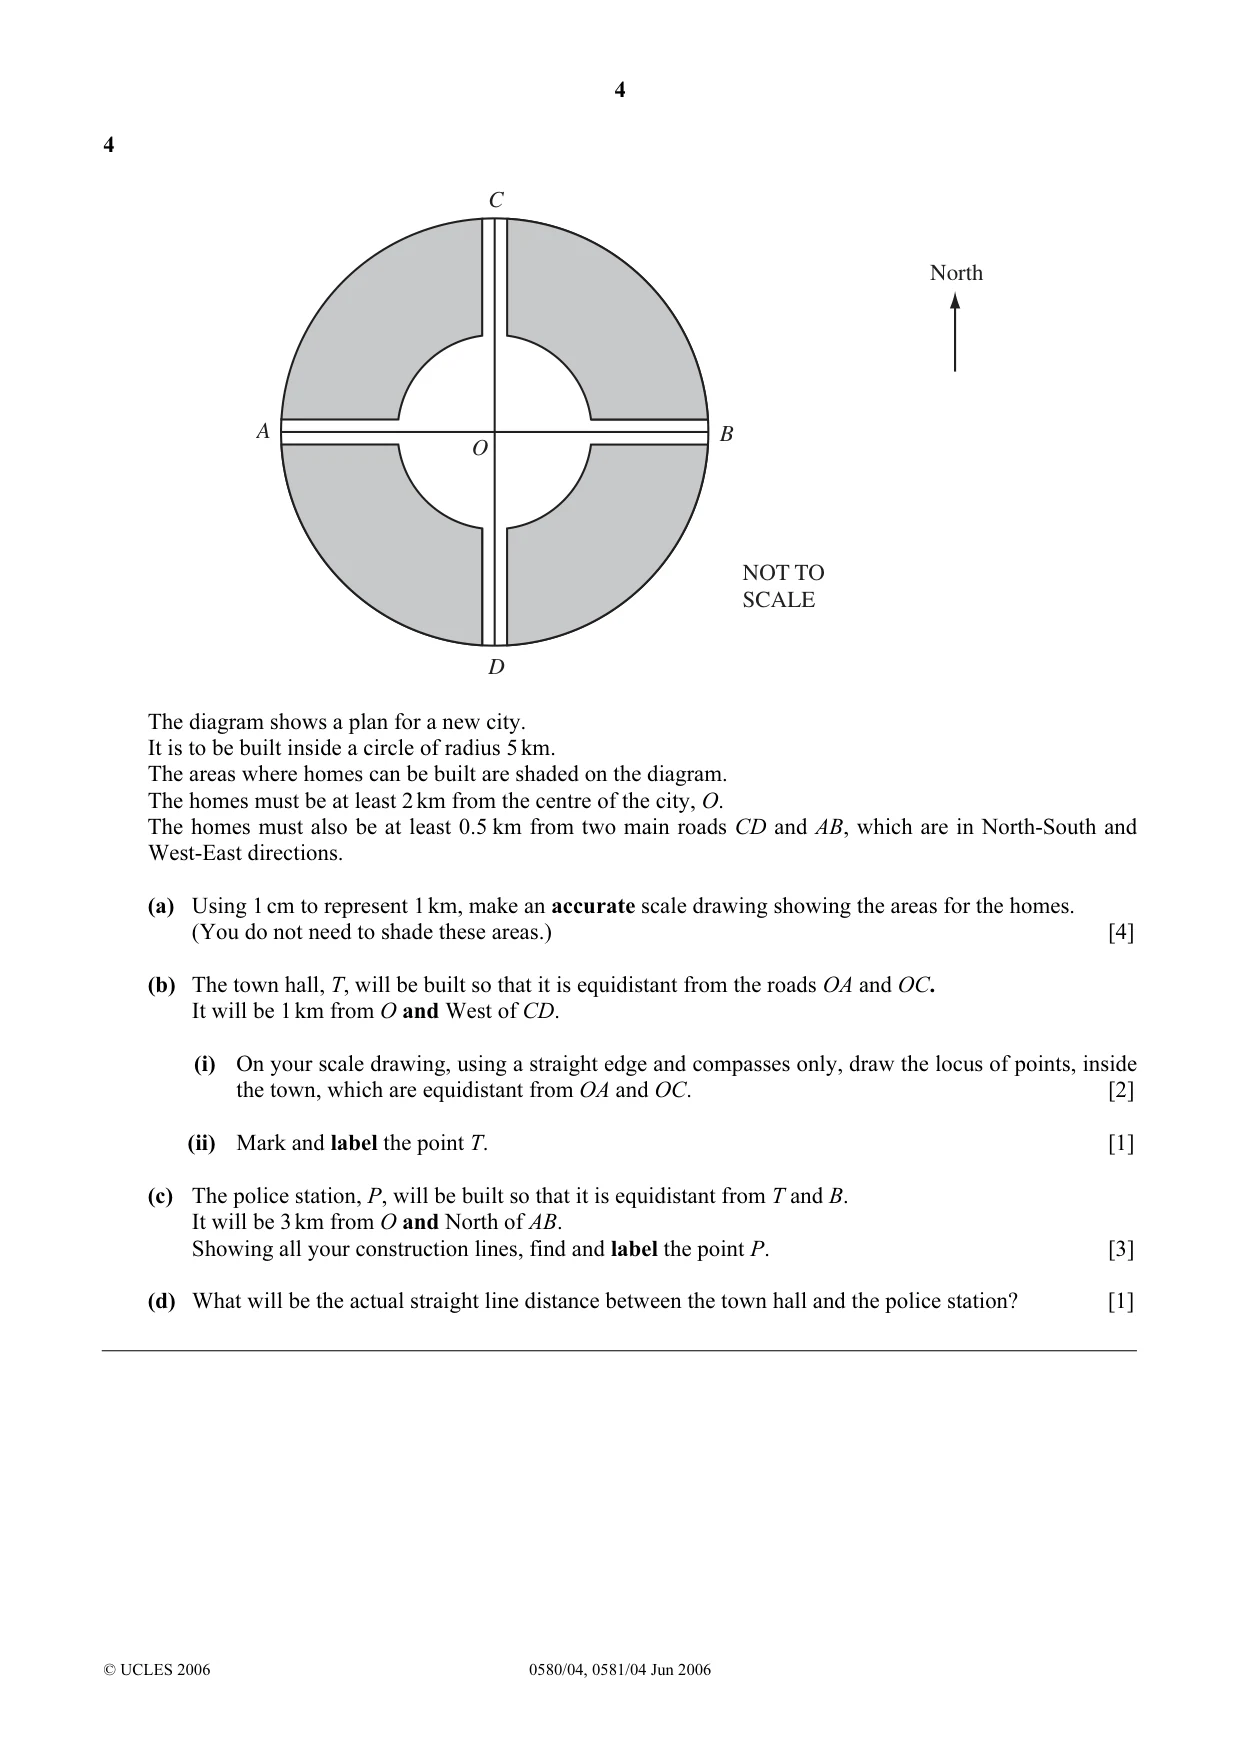
4 C North A B O NOT TO SCALE D The diagram shows a plan for a new city. It is to be built inside a circle of radius 5 km. The areas where homes can be built are shaded on the diagram. The homes must be at least 2 km from the centre of the city, O. The homes must also be at least 0.5 km from two main roads CD and AB, which are in North-South and West-East directions. (a) Using 1 cm to represent 1 km, make an accurate scale drawing showing the areas for the homes. (You do not need to shade these areas.) [4] (b) The town hall, T, will be built so that it is equidistant from the roads OA and OC. It will be 1 km from O and West of CD. (i) On your scale drawing, using a straight edge and compasses only, draw the locus of points, inside the town, which are equidistant from OA and OC. [2] (ii) Mark and label the point T. [1] (c) The police station, P, will be built so that it is equidistant from T and B. It will be 3 km from O and North of AB. Showing all your construction lines, find and label the point P. [3] (d) What will be the actual straight line distance between the town hall and the police station? [1]
Mark scheme: 4 (a) Circle radius 5 cm (± 2 mm) B1 Circle radius 2 cm (± 2 mm) B1 AB is perpendicular to CD (± 1°) B1 Lines parallel to roads at 0.5 cm from B1 them (all 4 pairs) (Within 1 mm) (b) (i) Accurate (± 1°) angle bisector with arcs B2 (ii) T correct (± 1 mm) and labelled T1 (c) Accurate (± 1° and ± 1 mm) B2 Ft SC1 if ± 2° and ± 2 mm perpendicular bisector of TB (using their T) P correct (2.9 to 3.1 cm from 0) and B1 labelled (d) Their TP measured with km (±0.1 km) B1 11 IGCSE – May/June 2006 0580 and 0581 04
Q5 · The length, y, of a solid is inversely proportional to the square of its height, x
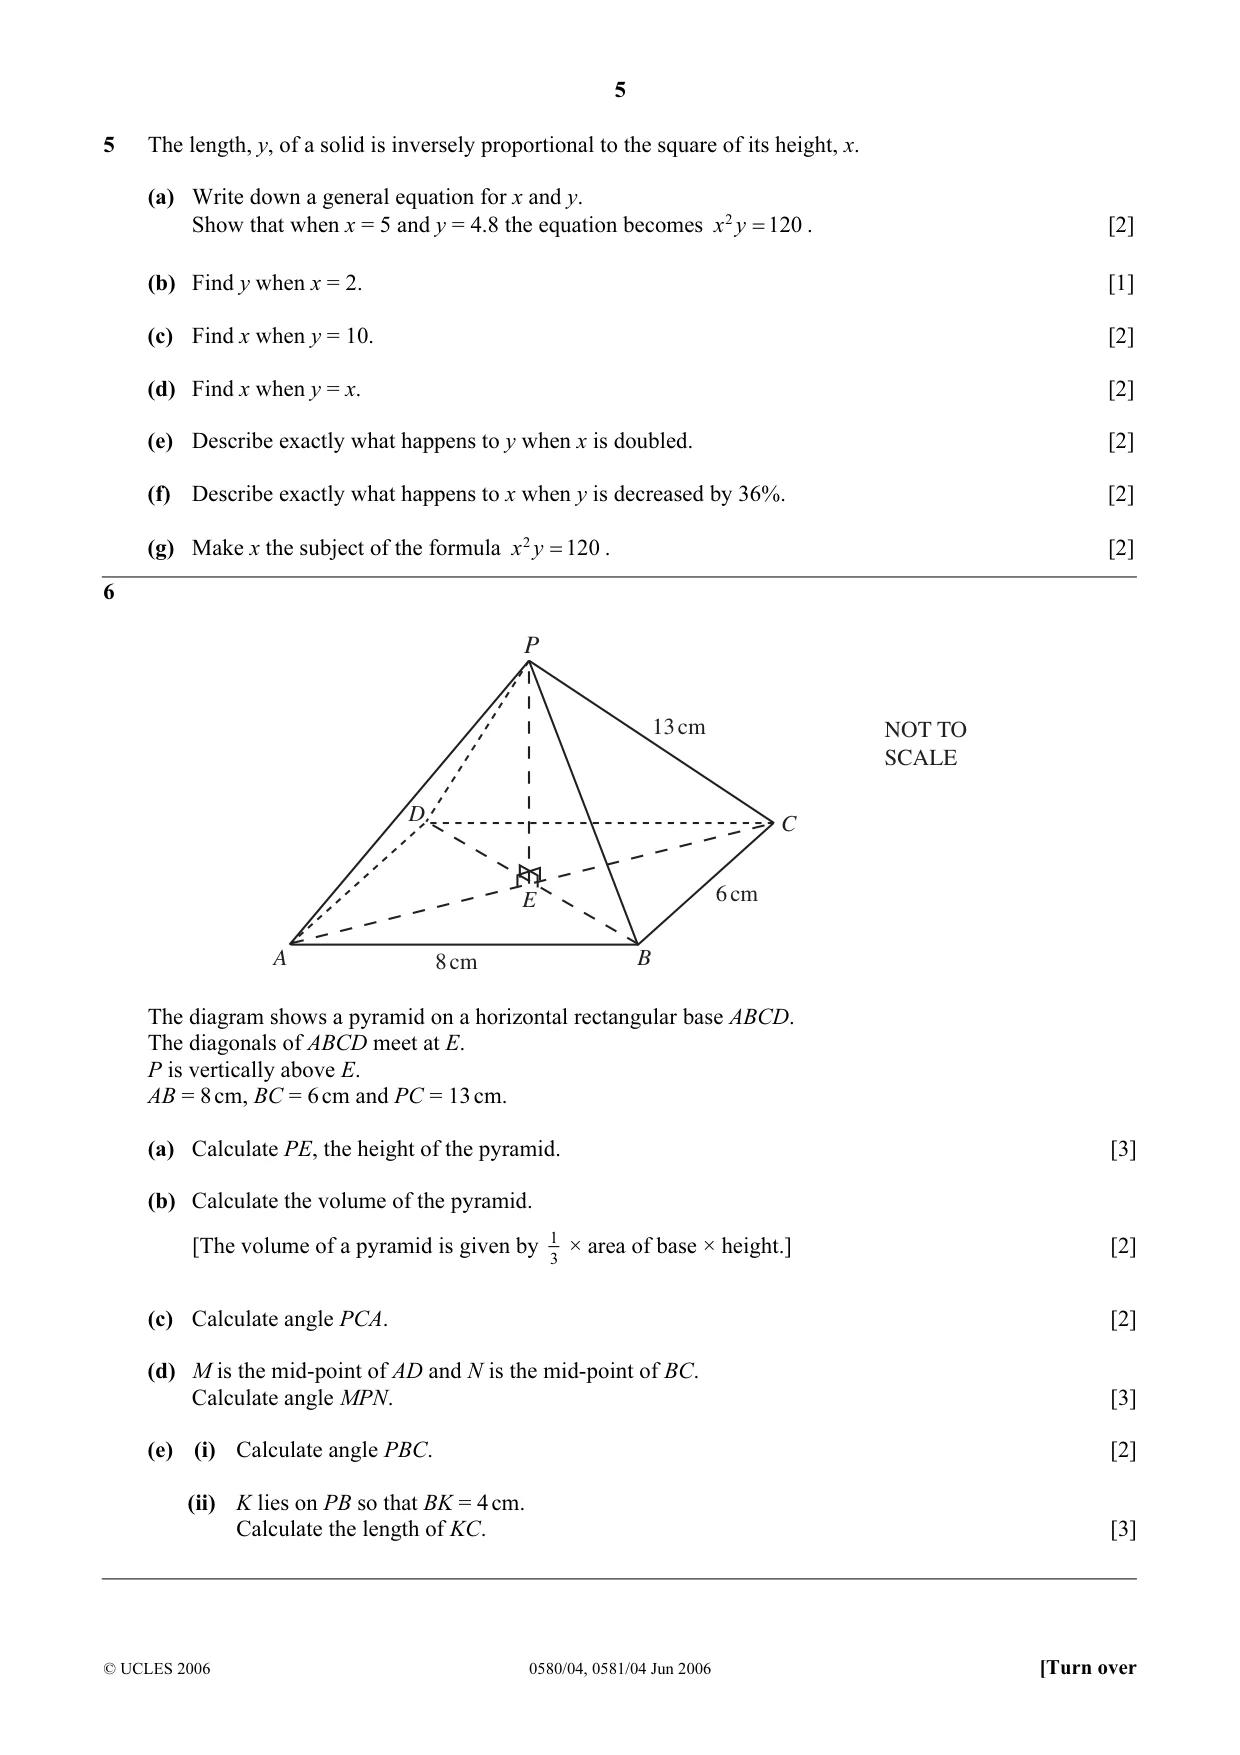
5 The length, y, of a solid is inversely proportional to the square of its height, x. (a) Write down a general equation for x and y. Show that when x = 5 and y = 4.8 the equation becomes x 2 y = 120 . [2] (b) Find y when x = 2. [1] (c) Find x when y = 10. [2] (d) Find x when y = x. [2] (e) Describe exactly what happens to y when x is doubled. [2] (f) Describe exactly what happens to x when y is decreased by 36%. [2] (g) Make x the subject of the formula x 2 y = 120 . [2]
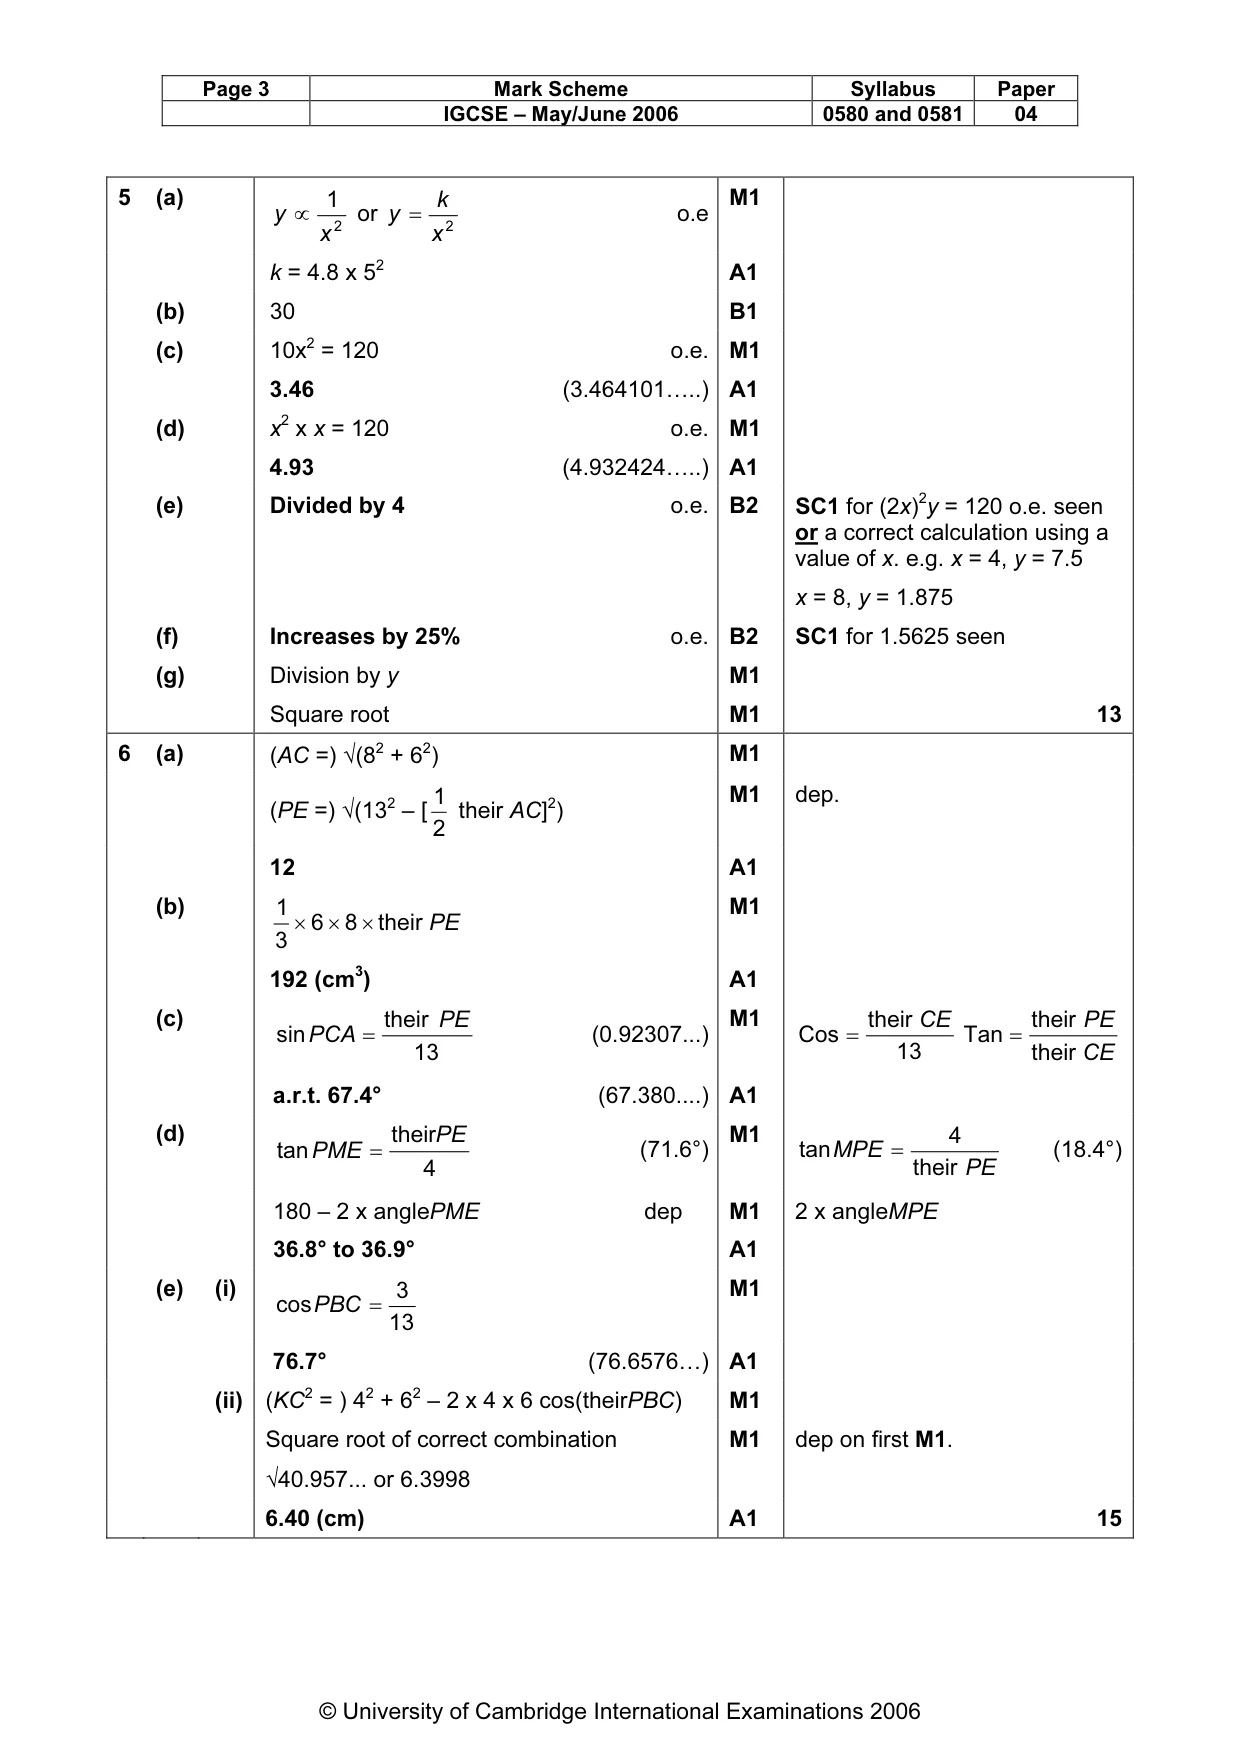
Mark scheme: 5 (a) 1 k M1 y ∝ or y = o.e x 2 x 2 k = 4.8 x 52 A1 (b) 30 B1 (c) 10x2 = 120 o.e. M1 3.46 (3.464101…..) A1 (d) x2 x x = 120 o.e. M1 4.93 (4.932424…..) A1 (e) Divided by 4 o.e. B2 SC1 for (2x)2y = 120 o.e. seen or a correct calculation using a value of x. e.g. x = 4, y = 7.5 x = 8, y = 1.875 (f) Increases by 25% o.e. B2 SC1 for 1.5625 seen (g) Division by y M1 Square root M1 13 √ 2 2
Q6 · P 13 cm NOT TO SCALE D C E 6 cm A 8 cm B The diagram shows a pyramid on a horizontal…
6 P 13 cm NOT TO SCALE D C E 6 cm A 8 cm B The diagram shows a pyramid on a horizontal rectangular base ABCD. The diagonals of ABCD meet at E. P is vertically above E. AB = 8 cm, BC = 6 cm and PC = 13 cm. (a) Calculate PE, the height of the pyramid. [3] (b) Calculate the volume of the pyramid. [The volume of a pyramid is given by 1 × area of base × height.] [2] 3 (c) Calculate angle PCA. [2] (d) M is the mid-point of AD and N is the mid-point of BC. Calculate angle MPN. [3] (e) (i) Calculate angle PBC. [2] (ii) K lies on PB so that BK = 4 cm. Calculate the length of KC. [3]
Mark scheme: 6 (a) (AC =) √(82 + 62) M1 1 M1 dep. (PE =) √(132 – [ their AC]2) 2 12 A1 (b) 1 M1 × 6 × 8 × their PE 3 192 (cm3) A1 (c) their PE M1 their CE their PE sin PCA = (0.92307...) Cos = Tan = 13 13 their CE a.r.t. 67.4° (67.380....) A1 (d) theirPE M1 4 tan PME = (71.6°) tan MPE = (18.4°) 4 their PE 180 – 2 x anglePME dep M1 2 x angleMPE 36.8° to 36.9° A1 (e) (i) 3 M1 cos PBC = 13 76.7° (76.6576…) A1 (ii) (KC2 = ) 42 + 62 – 2 x 4 x 6 cos(theirPBC) M1 Square root of correct combination M1 dep on first M1. √40.957... or 6.3998 6.40 (cm) A1 15 IGCSE – May/June 2006 0580 and 0581 04
Q7 · 3 7 Transformation T is translation by the vector
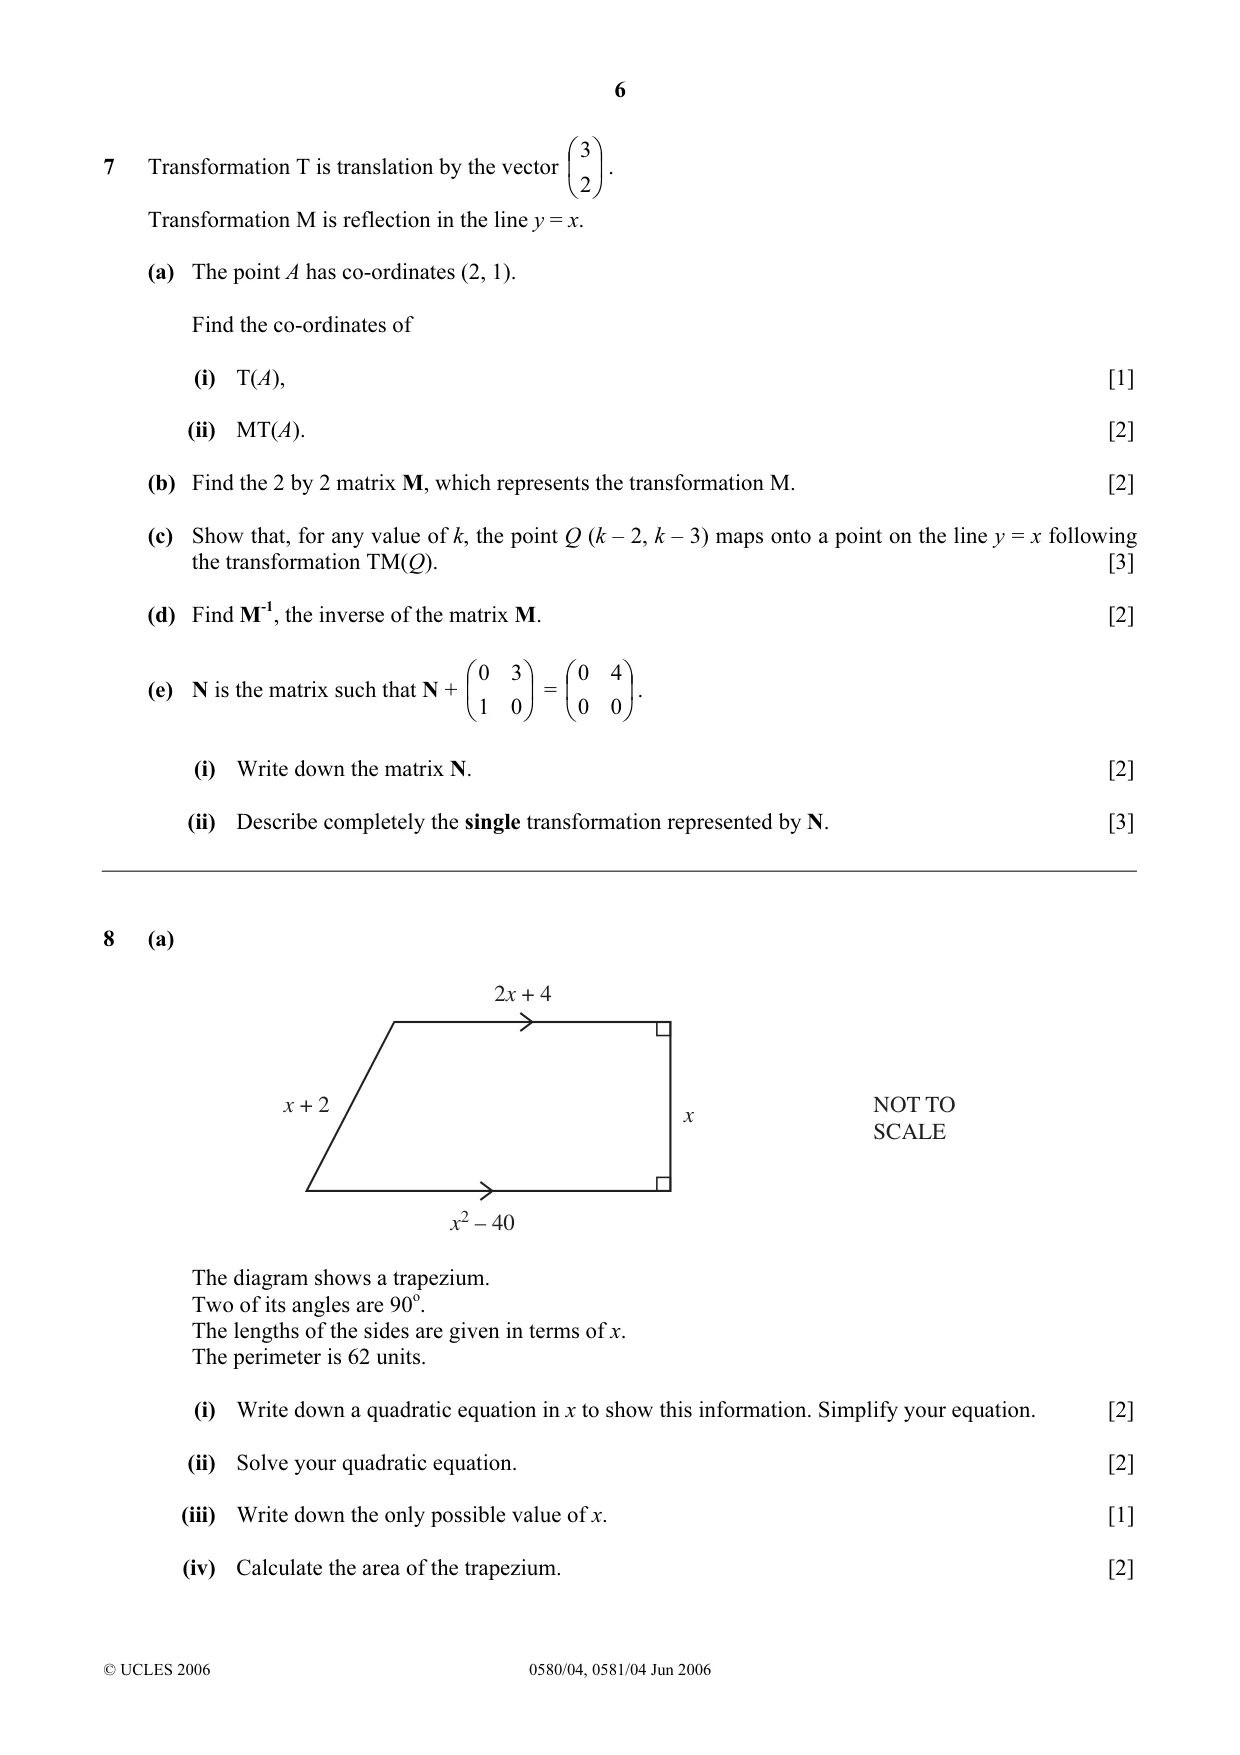
3 7 Transformation T is translation by the vector . 2 Transformation M is reflection in the line y = x. (a) The point A has co-ordinates (2, 1). Find the co-ordinates of (i) T(A), [1] (ii) MT(A). [2] (b) Find the 2 by 2 matrix M, which represents the transformation M. [2] (c) Show that, for any value of k, the point Q (k – 2, k – 3) maps onto a point on the line y = x following the transformation TM(Q). [3] (d) Find M-1, the inverse of the matrix M. [2] 0 3 0 4 (e) N is the matrix such that N + = . 1 0 0 0 (i) Write down the matrix N. [2] (ii) Describe completely the single transformation represented by N. [3]
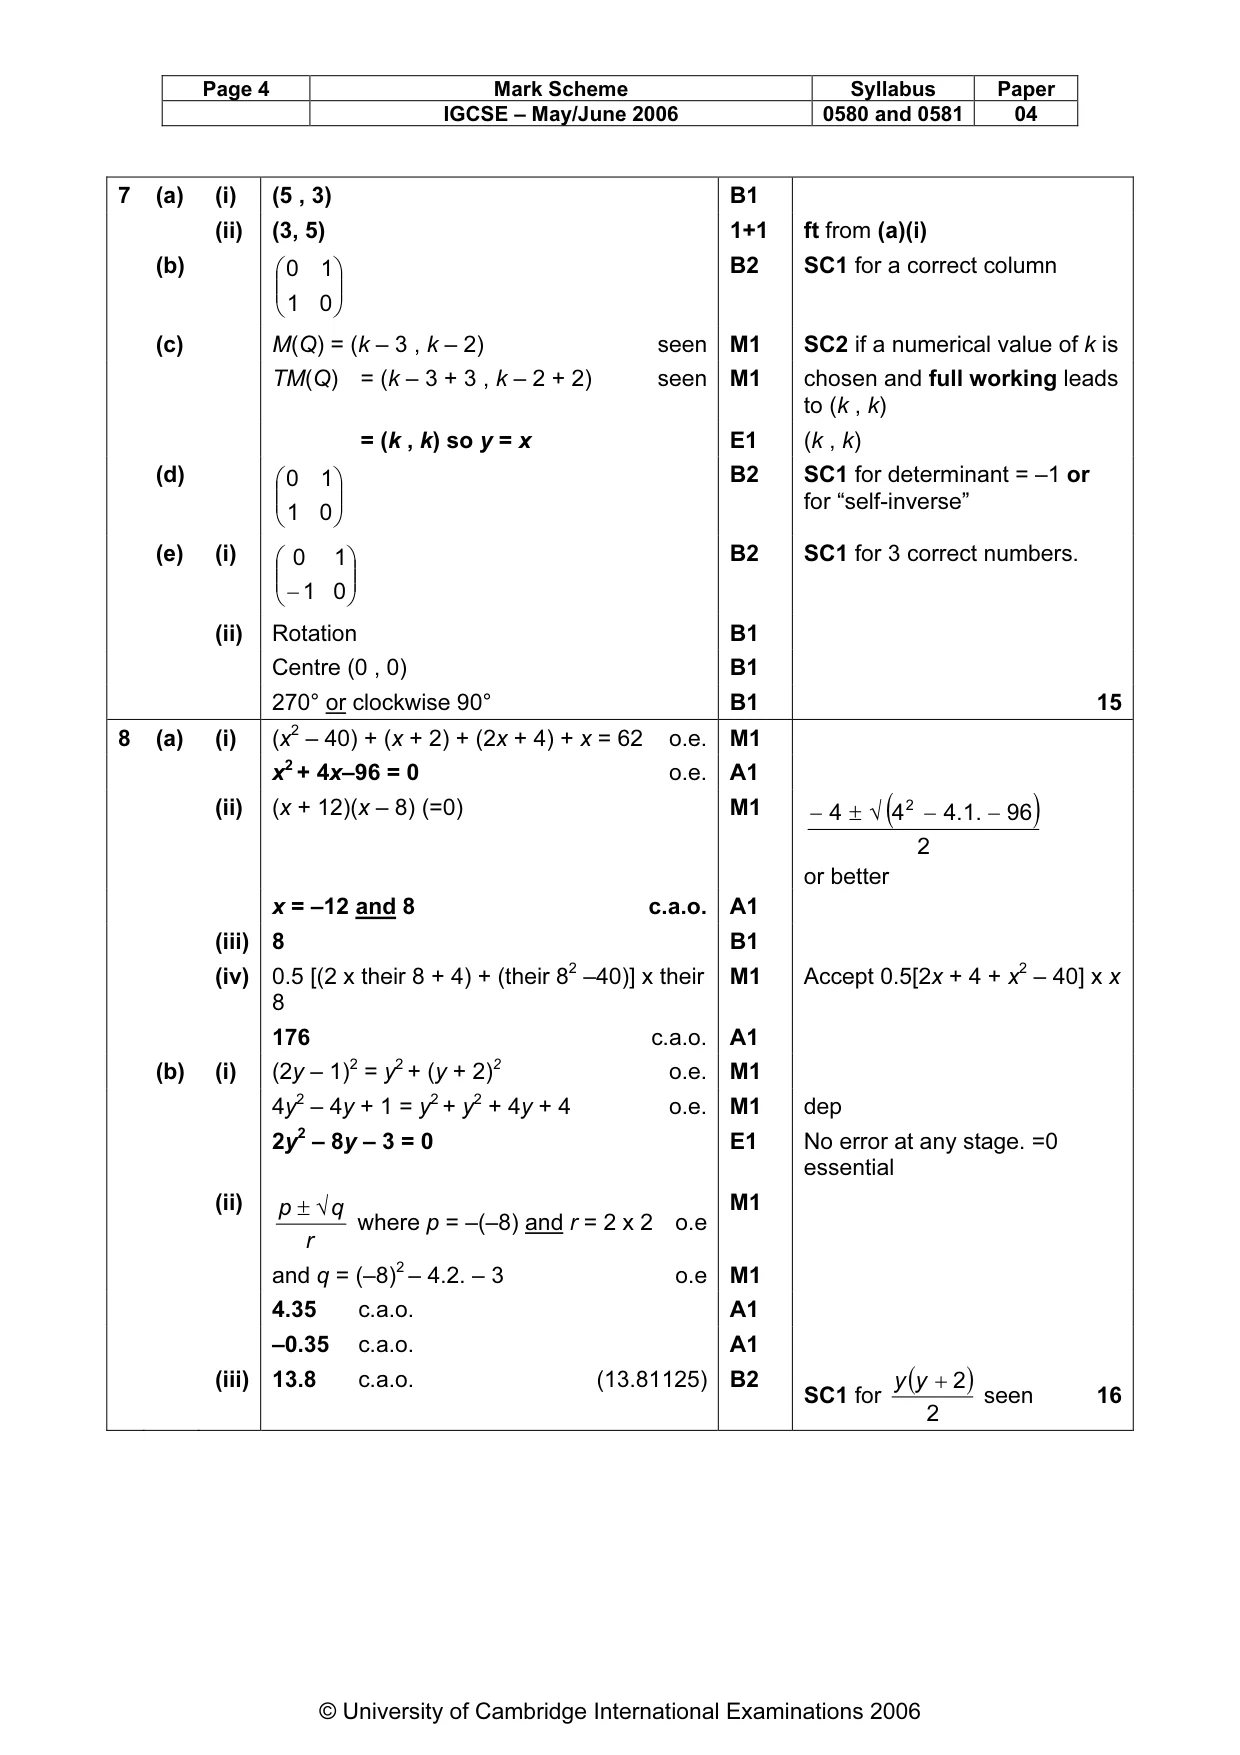
Mark scheme: 7 (a) (i) (5 , 3) B1 (ii) (3, 5) 1+1 ft from (a)(i) (b) 0 1 B2 SC1 for a correct column 1 0 (c) M(Q) = (k – 3 , k – 2) seen M1 SC2 if a numerical value of k is TM(Q) = (k – 3 + 3 , k – 2 + 2) seen M1 chosen and full working leads to (k , k) = (k , k) so y = x E1 (k , k) (d) 0 1 B2 SC1 for determinant = –1 or for “self-inverse” 1 0 (e) (i) 0 1 B2 SC1 for 3 correct numbers. − 1 0 (ii) Rotation B1 Centre (0 , 0) B1 270° or clockwise 90° B1 15 2
Q8 · 2x + 4 x + 2 NOT TO x SCALE x2 – 40 The diagram shows a trapezium
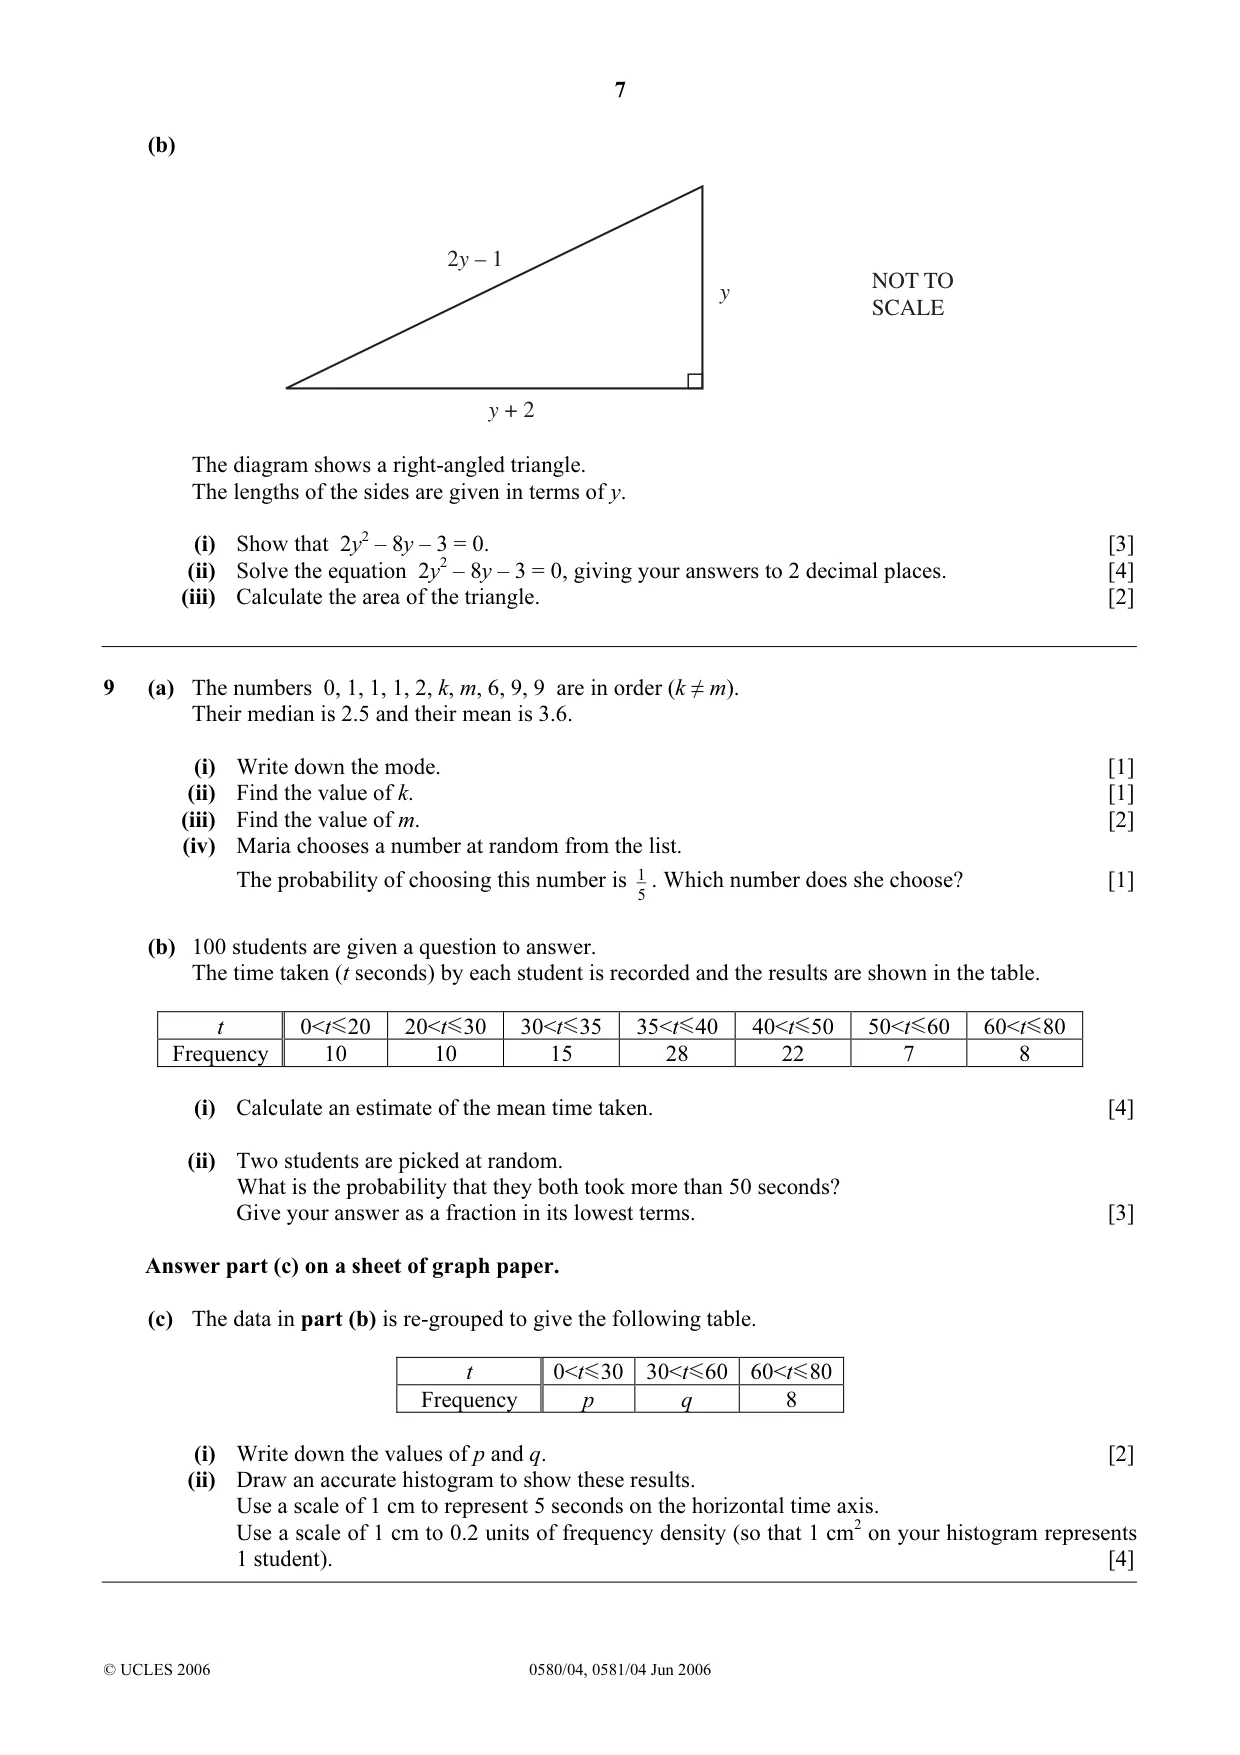
8 (a) 2x + 4 x + 2 NOT TO x SCALE x2 – 40 The diagram shows a trapezium. Two of its angles are 90o. The lengths of the sides are given in terms of x. The perimeter is 62 units. (i) Write down a quadratic equation in x to show this information. Simplify your equation. [2] (ii) Solve your quadratic equation. [2] (iii) Write down the only possible value of x. [1] (iv) Calculate the area of the trapezium. [2] (b) 2y – 1 NOT TO y SCALE y + 2 The diagram shows a right-angled triangle. The lengths of the sides are given in terms of y. (i) Show that 2y2 – 8y – 3 = 0. [3] (ii) Solve the equation 2y2 – 8y – 3 = 0, giving your answers to 2 decimal places. [4] (iii) Calculate the area of the triangle. [2]
Mark scheme: 8 (a) (i) (x2 – 40) + (x + 2) + (2x + 4) + x = 62 o.e. M1 x2 + 4x–96 = 0 o.e. A1 (ii) (x + 12)(x – 8) (=0) M1 − 4 ± √ (4 2 − 4 . 1 . − 96 ) 2 or better x = –12 and 8 c.a.o. A1 (iii) 8 B1 (iv) 0.5 [(2 x their 8 + 4) + (their 82 –40)] x their M1 Accept 0.5[2x + 4 + x2 – 40] x x 8 176 c.a.o. A1 (b) (i) (2y – 1)2 = y2 + (y + 2)2 o.e. M1 4y2 – 4y + 1 = y2 + y2 + 4y + 4 o.e. M1 dep 2y2 – 8y – 3 = 0 E1 No error at any stage. =0 essential (ii) p ± √ q M1 where p = –(–8) and r = 2 x 2 o.e r and q = (–8)2 – 4.2. – 3 o.e M1 4.35 c.a.o. A1 –0.35 c.a.o. A1 (iii) 13.8 c.a.o. (13.81125) B2 y (y + 2 ) SC1 for seen 16 2 IGCSE – May/June 2006 0580 and 0581 04
Q9 · The numbers 0, 1, 1, 1, 2, k, m, 6, 9, 9 are in order (k ≠ m)
9 (a) The numbers 0, 1, 1, 1, 2, k, m, 6, 9, 9 are in order (k ≠ m). Their median is 2.5 and their mean is 3.6. (i) Write down the mode. [1] (ii) Find the value of k. [1] (iii) Find the value of m. [2] (iv) Maria chooses a number at random from the list. The probability of choosing this number is 1 . Which number does she choose? [1] 5 (b) 100 students are given a question to answer. The time taken (t seconds) by each student is recorded and the results are shown in the table. t 0<t 20 20<t 30 30<t 35 35<t 40 40<t 50 50<t 60 60<t 80 Frequency 10 10 15 28 22 7 8 (i) Calculate an estimate of the mean time taken. [4] (ii) Two students are picked at random. What is the probability that they both took more than 50 seconds? Give your answer as a fraction in its lowest terms. [3] Answer part (c) on a sheet of graph paper. (c) The data in part (b) is re-grouped to give the following table. t 0<t 30 30<t 60 60<t 80 Frequency p q 8 (i) Write down the values of p and q. [2] (ii) Draw an accurate histogram to show these results. Use a scale of 1 cm to represent 5 seconds on the horizontal time axis. Use a scale of 1 cm to 0.2 units of frequency density (so that 1 cm2 on your histogram represents 1 student). [4]
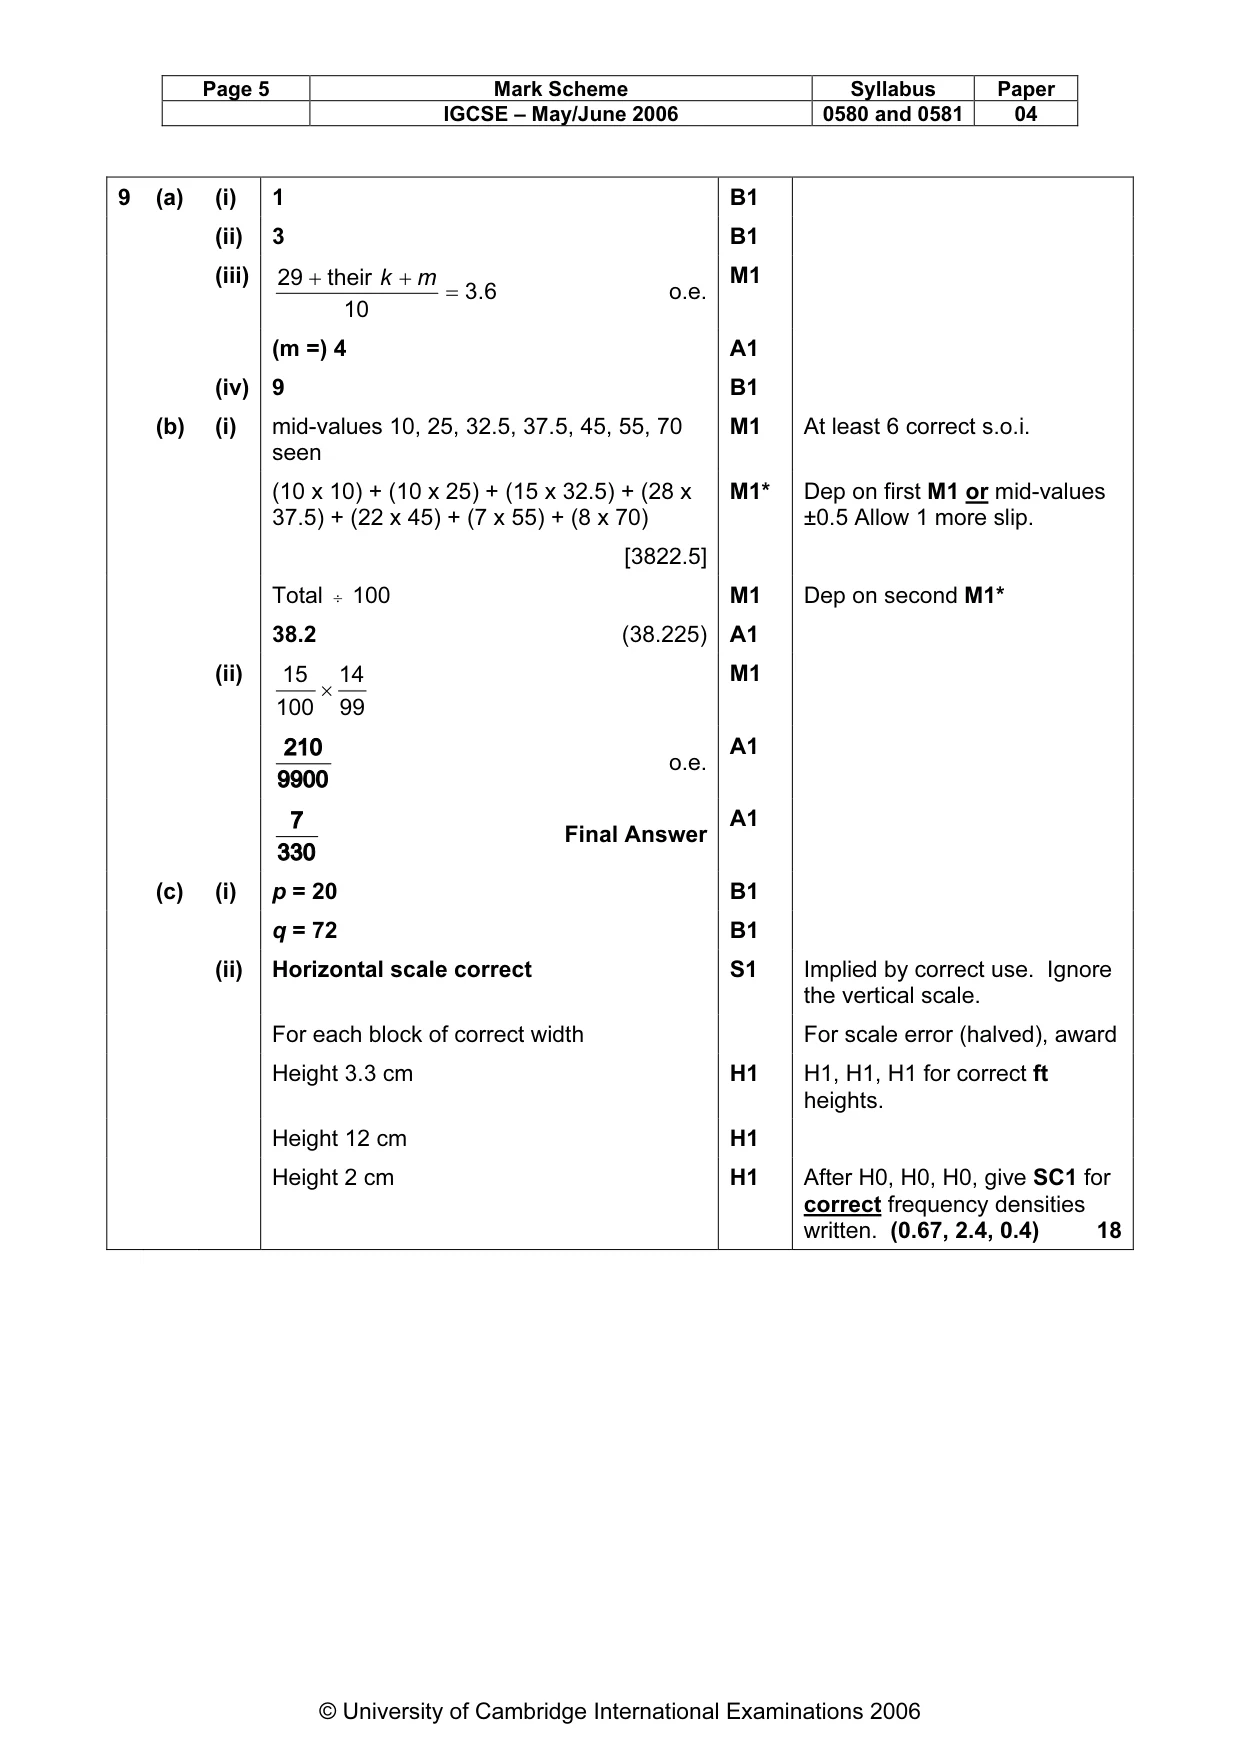
Mark scheme: 9 (a) (i) 1 B1 (ii) 3 B1 (iii) 29 + their k + m M1 = 3 . 6 o.e. 10 (m =) 4 A1 (iv) 9 B1 (b) (i) mid-values 10, 25, 32.5, 37.5, 45, 55, 70 M1 At least 6 correct s.o.i. seen (10 x 10) + (10 x 25) + (15 x 32.5) + (28 x M1* Dep on first M1 or mid-values 37.5) + (22 x 45) + (7 x 55) + (8 x 70) ±0.5 Allow 1 more slip. [3822.5] Total ÷ 100 M1 Dep on second M1* 38.2 (38.225) A1 (ii) 15 14 M1 × 100 99 210 A1 o.e. 9900 7 A1 Final Answer 330 (c) (i) p = 20 B1 q = 72 B1 (ii) Horizontal scale correct S1 Implied by correct use. Ignore the vertical scale. For each block of correct width For scale error (halved), award Height 3.3 cm H1 H1, H1, H1 for correct ft heights. Height 12 cm H1 Height 2 cm H1 After H0, H0, H0, give SC1 for correct frequency densities written. (0.67, 2.4, 0.4) 18
What was in this paper
The subtopics covered by these 9 questions, and how many questions each got. Open one in a new tab to see every Cambridge question on it.
What you needed in this session
Cambridge’s own grade thresholds for 2006 May/June, Paper 4 · Variant 1. A higher threshold means an easier paper — the bar moves with how the cohort did.