Cambridge A Level Physics 9702 — 2018 Oct/Nov Paper 3 · Variant 6
9702/36/O/N/18 · 2 questions · 40 marks · ≈45 min
The question paper and its mark scheme, free to read here and free to download. This is Cambridge’s own paper, exactly as it was sat.
Question paper12 pages

Mark scheme8 pages
Answers below. Sit the paper first if you are practising.
Questions as text
Q1 · In this experiment, you will investigate a system in equilibrium
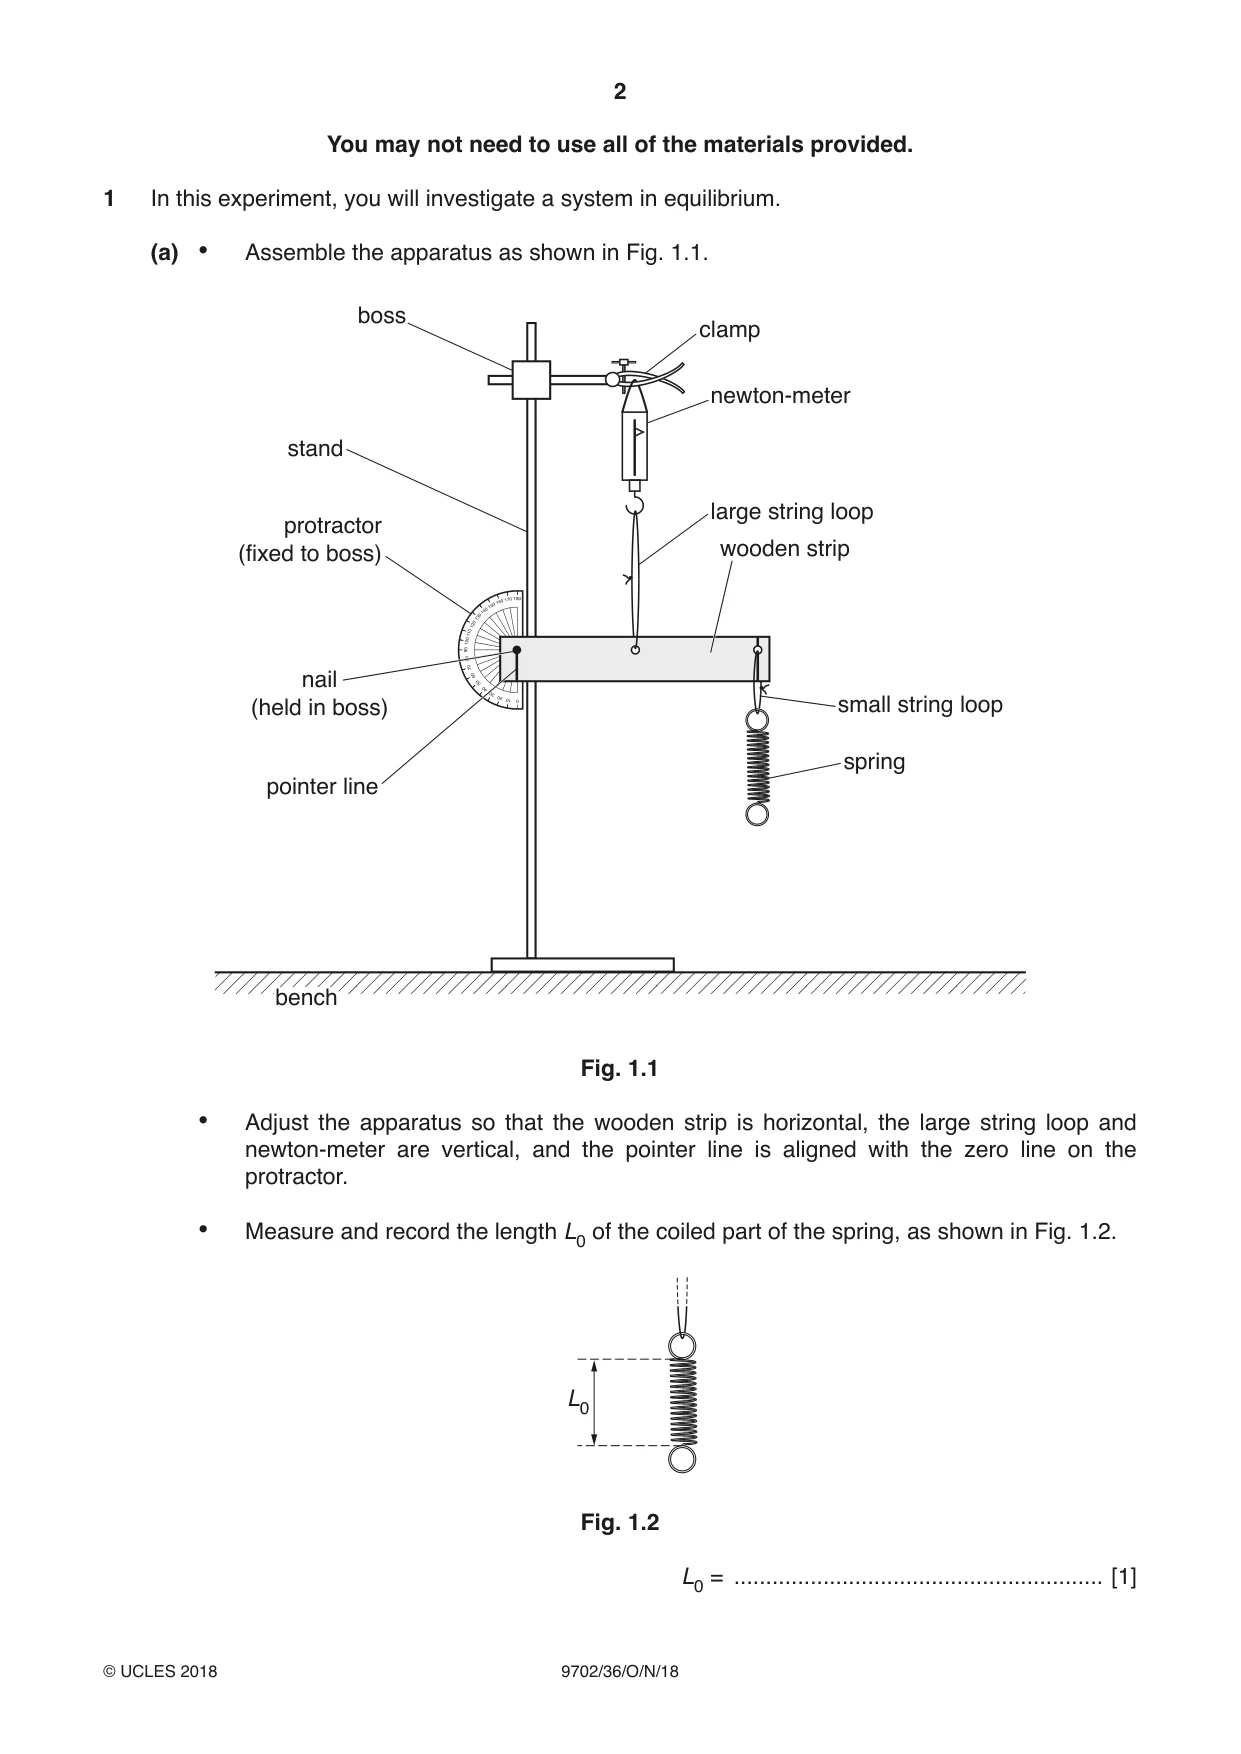
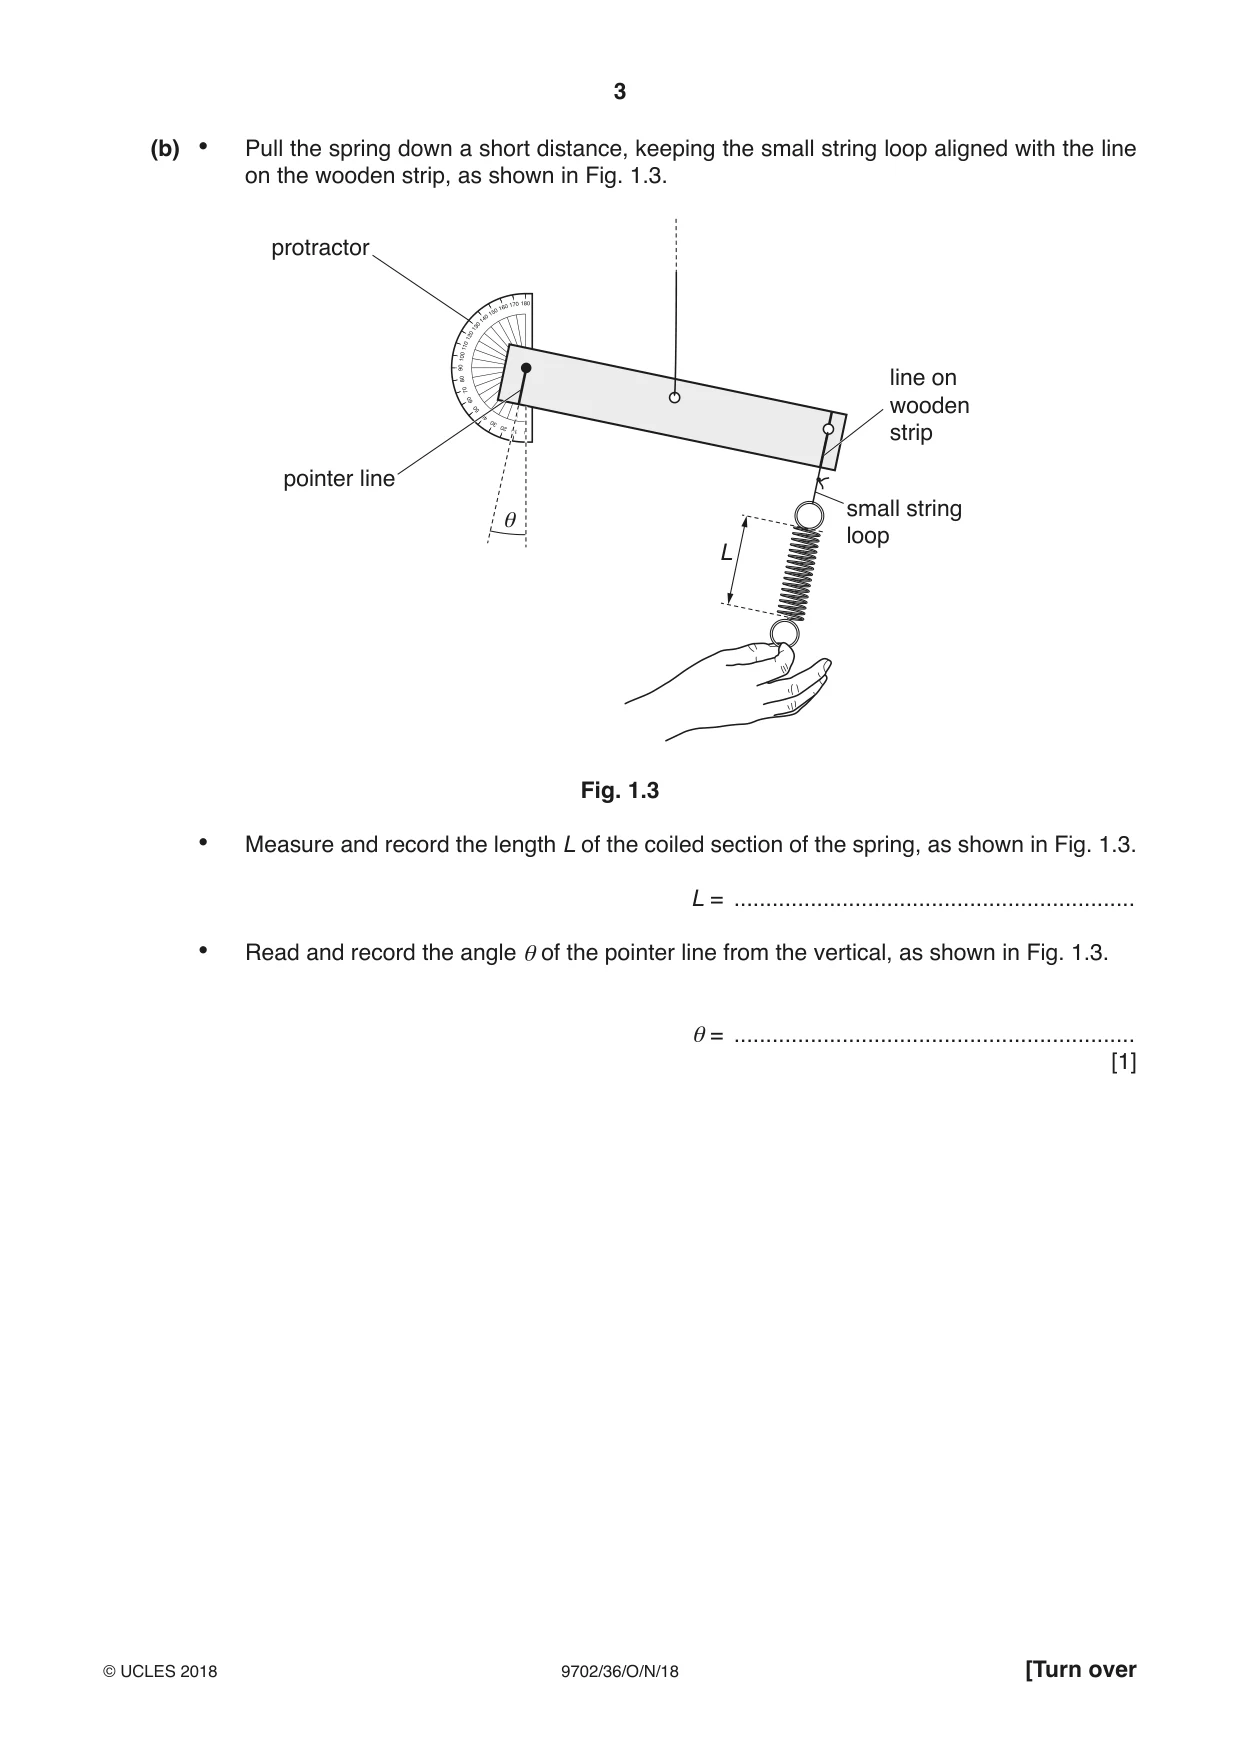
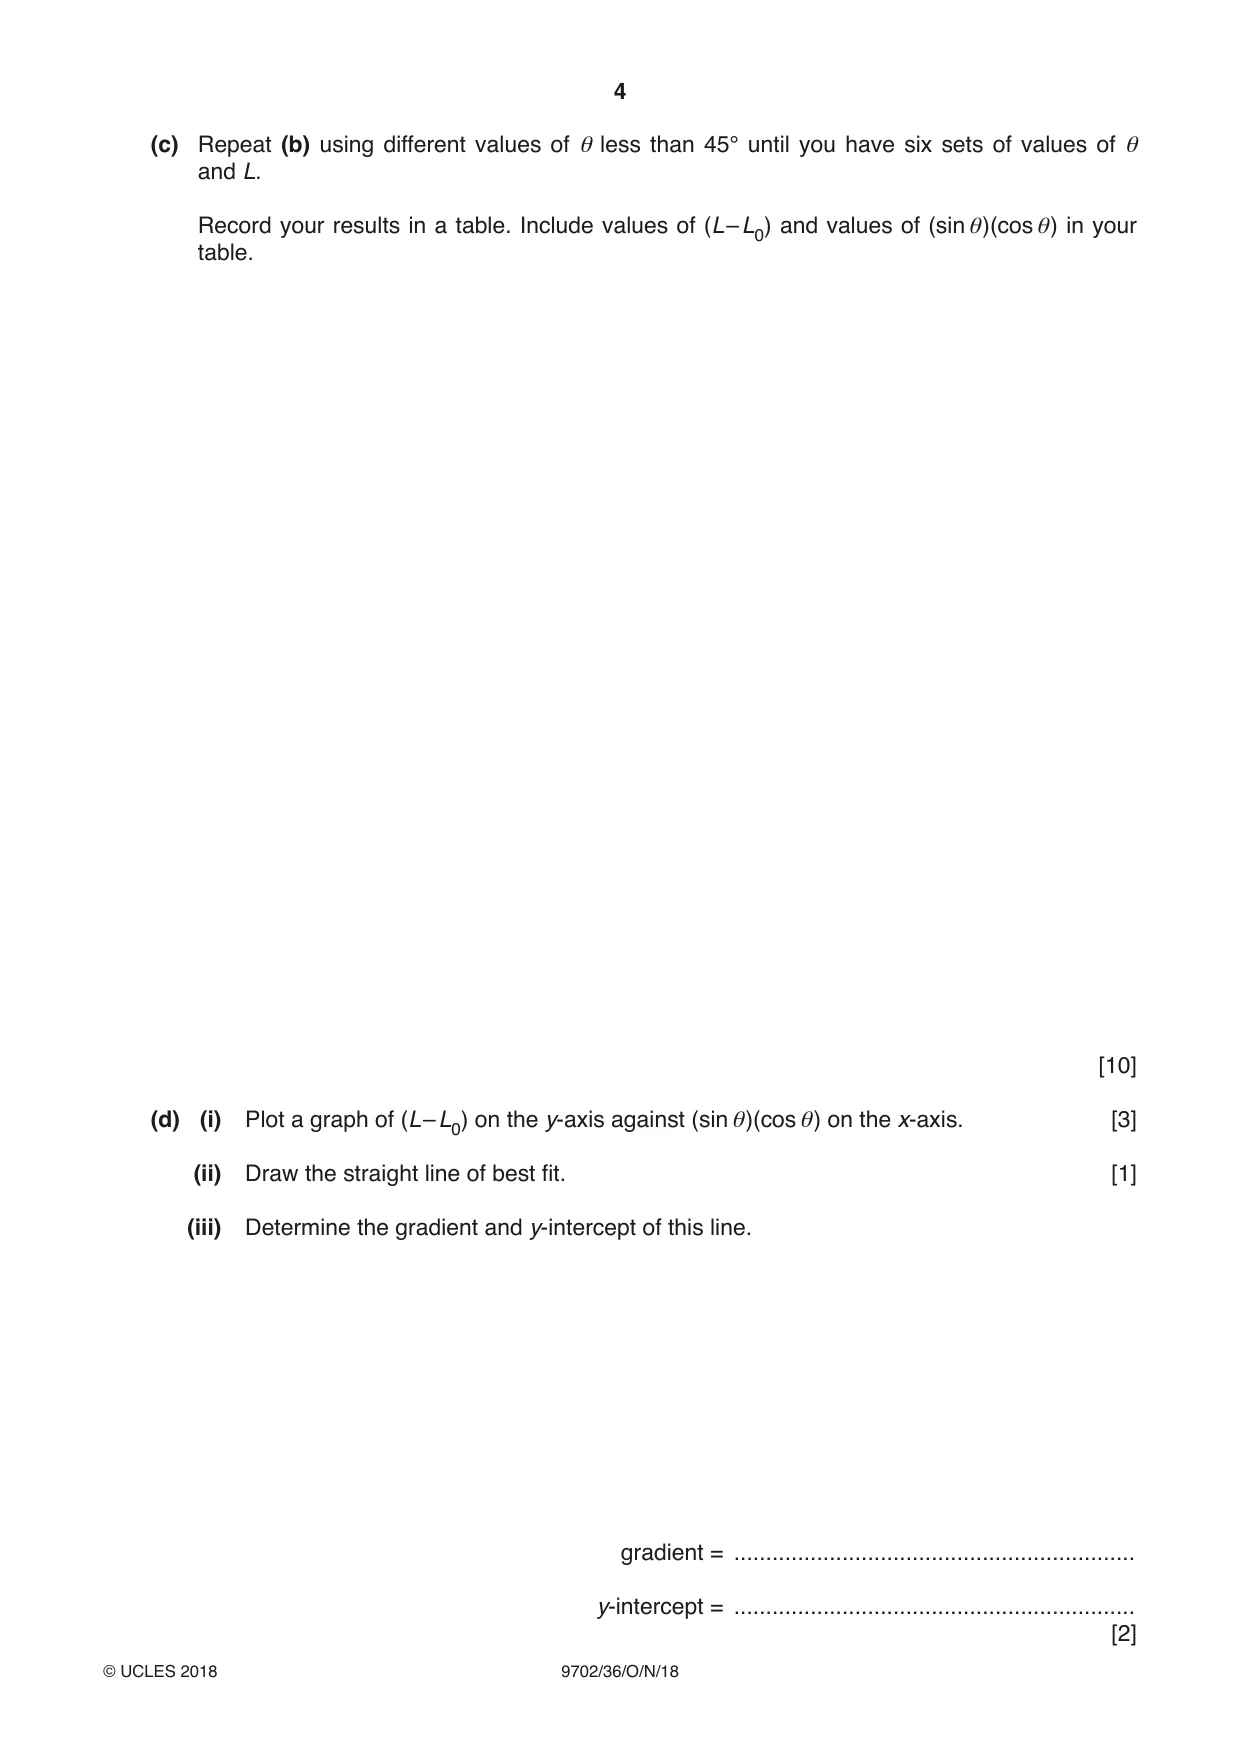
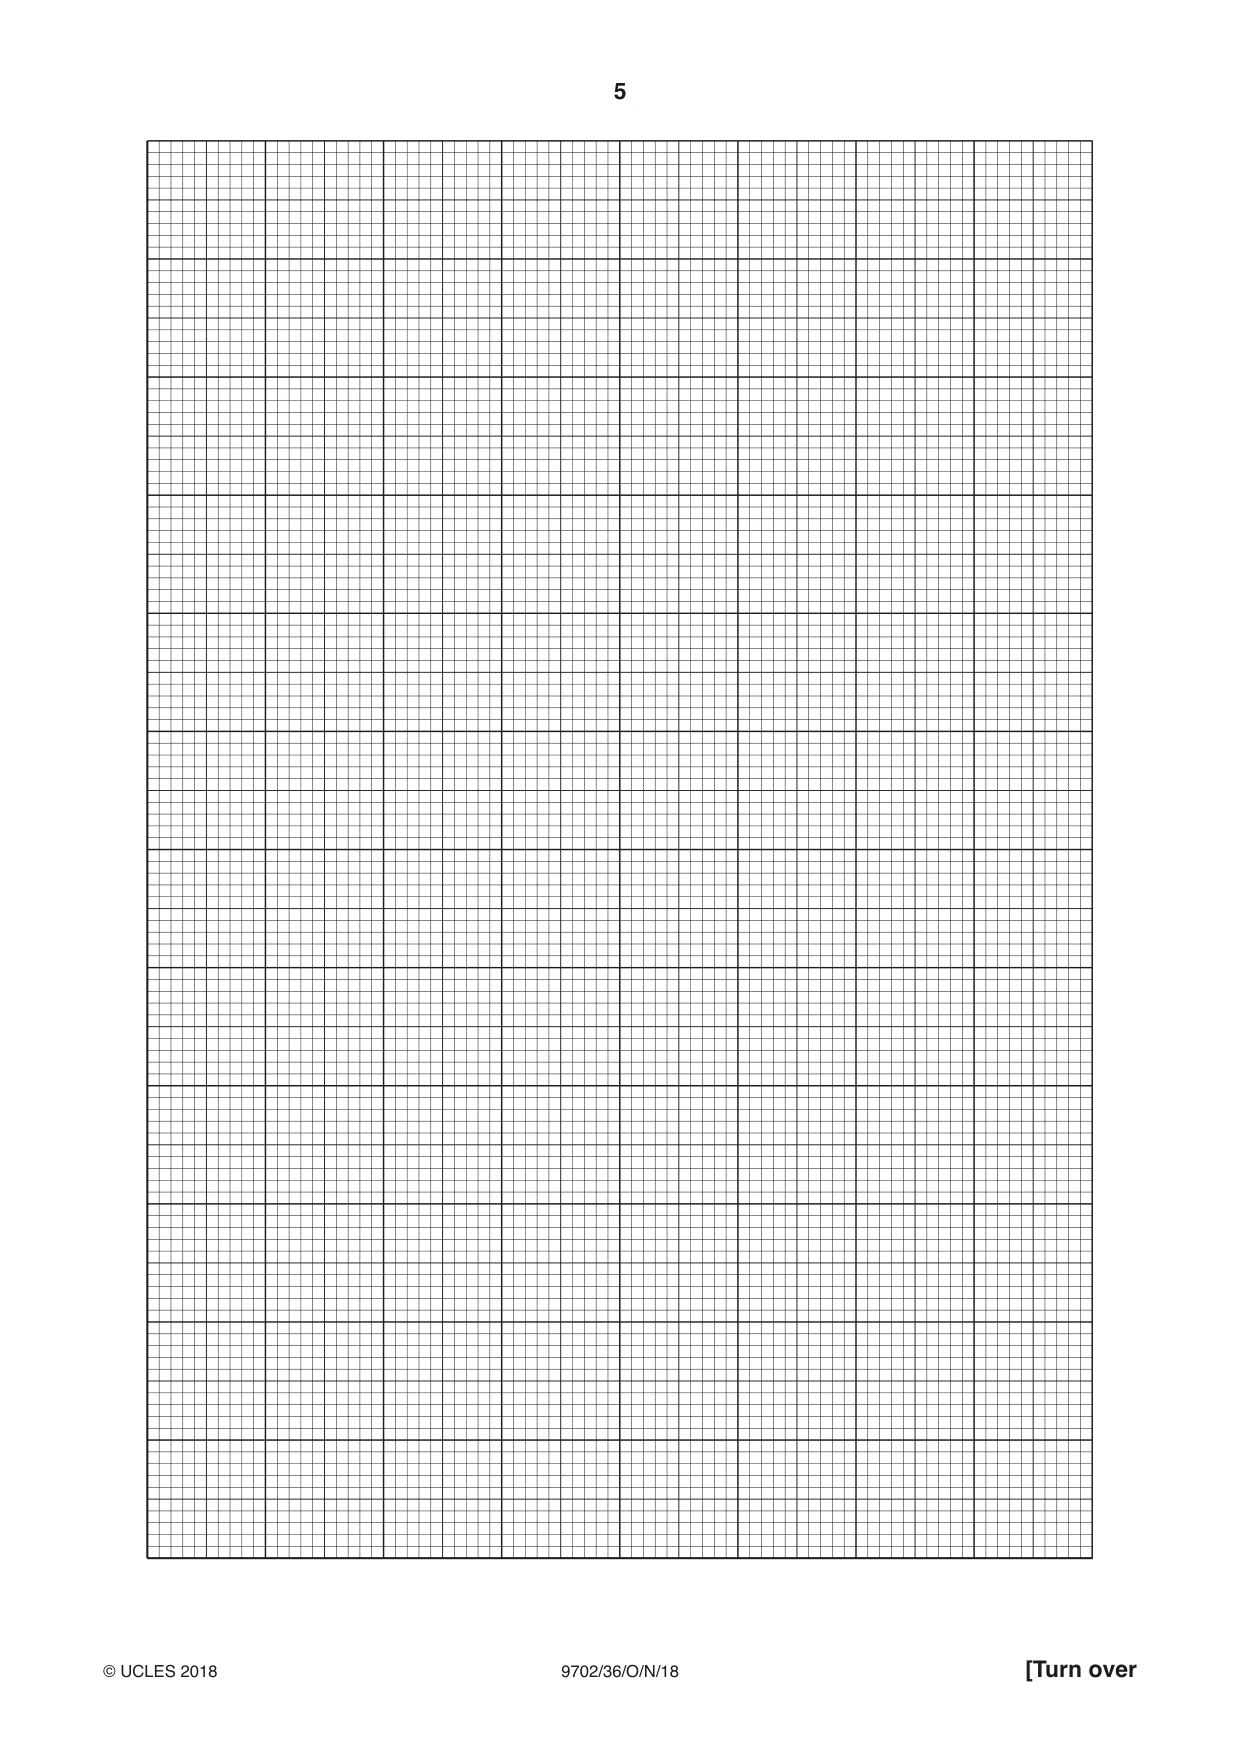
1 In this experiment, you will investigate a system in equilibrium. (a) • Assemble the apparatus as shown in Fig. 1.1. boss clamp newton-meter stand large string loop protractor (fixed to boss) wooden strip nail (held in boss) small string loop spring pointer line bench Fig. 1.1 • Adjust the apparatus so that the wooden strip is horizontal, the large string loop and newton-meter are vertical, and the pointer line is aligned with the zero line on the protractor. • Measure and record the length L0 of the coiled part of the spring, as shown in Fig. 1.2. L0 Fig. 1.2 L0 = .......................................................... [1] (b) • Pull the spring down a short distance, keeping the small string loop aligned with the line on the wooden strip, as shown in Fig. 1.3. protractor line on wooden strip pointer line small string θ loop L Fig. 1.3 • Measure and record the length L of the coiled section of the spring, as shown in Fig. 1.3. L = ............................................................... • Read and record the angle θ of the pointer line from the vertical, as shown in Fig. 1.3. θ = ............................................................... [1] (c) Repeat (b) using different values of θ less than 45° until you have six sets of values of θ and L. Record your results in a table. Include values of (L – L0) and values of (sin θ)(cos θ) in your table. [10] (d) (i) Plot a graph of (L – L0) on the y-axis against (sin θ)(cos θ) on the x-axis. [3] (ii) Draw the straight line of best fit. [1] (iii) Determine the gradient and y-intercept of this line. gradient = ............................................................... y-intercept = ............................................................... [2] (e) It is suggested that the quantities L and θ are related by the equation (L – L0) = a (sin θ)(cos θ) + b where a and b are constants. Use your answers in (d)(iii) to determine the values of a and b. Give appropriate units. a = ............................................................... b = ............................................................... [2] [Total: 20] You may not need to use all of the materials provided.
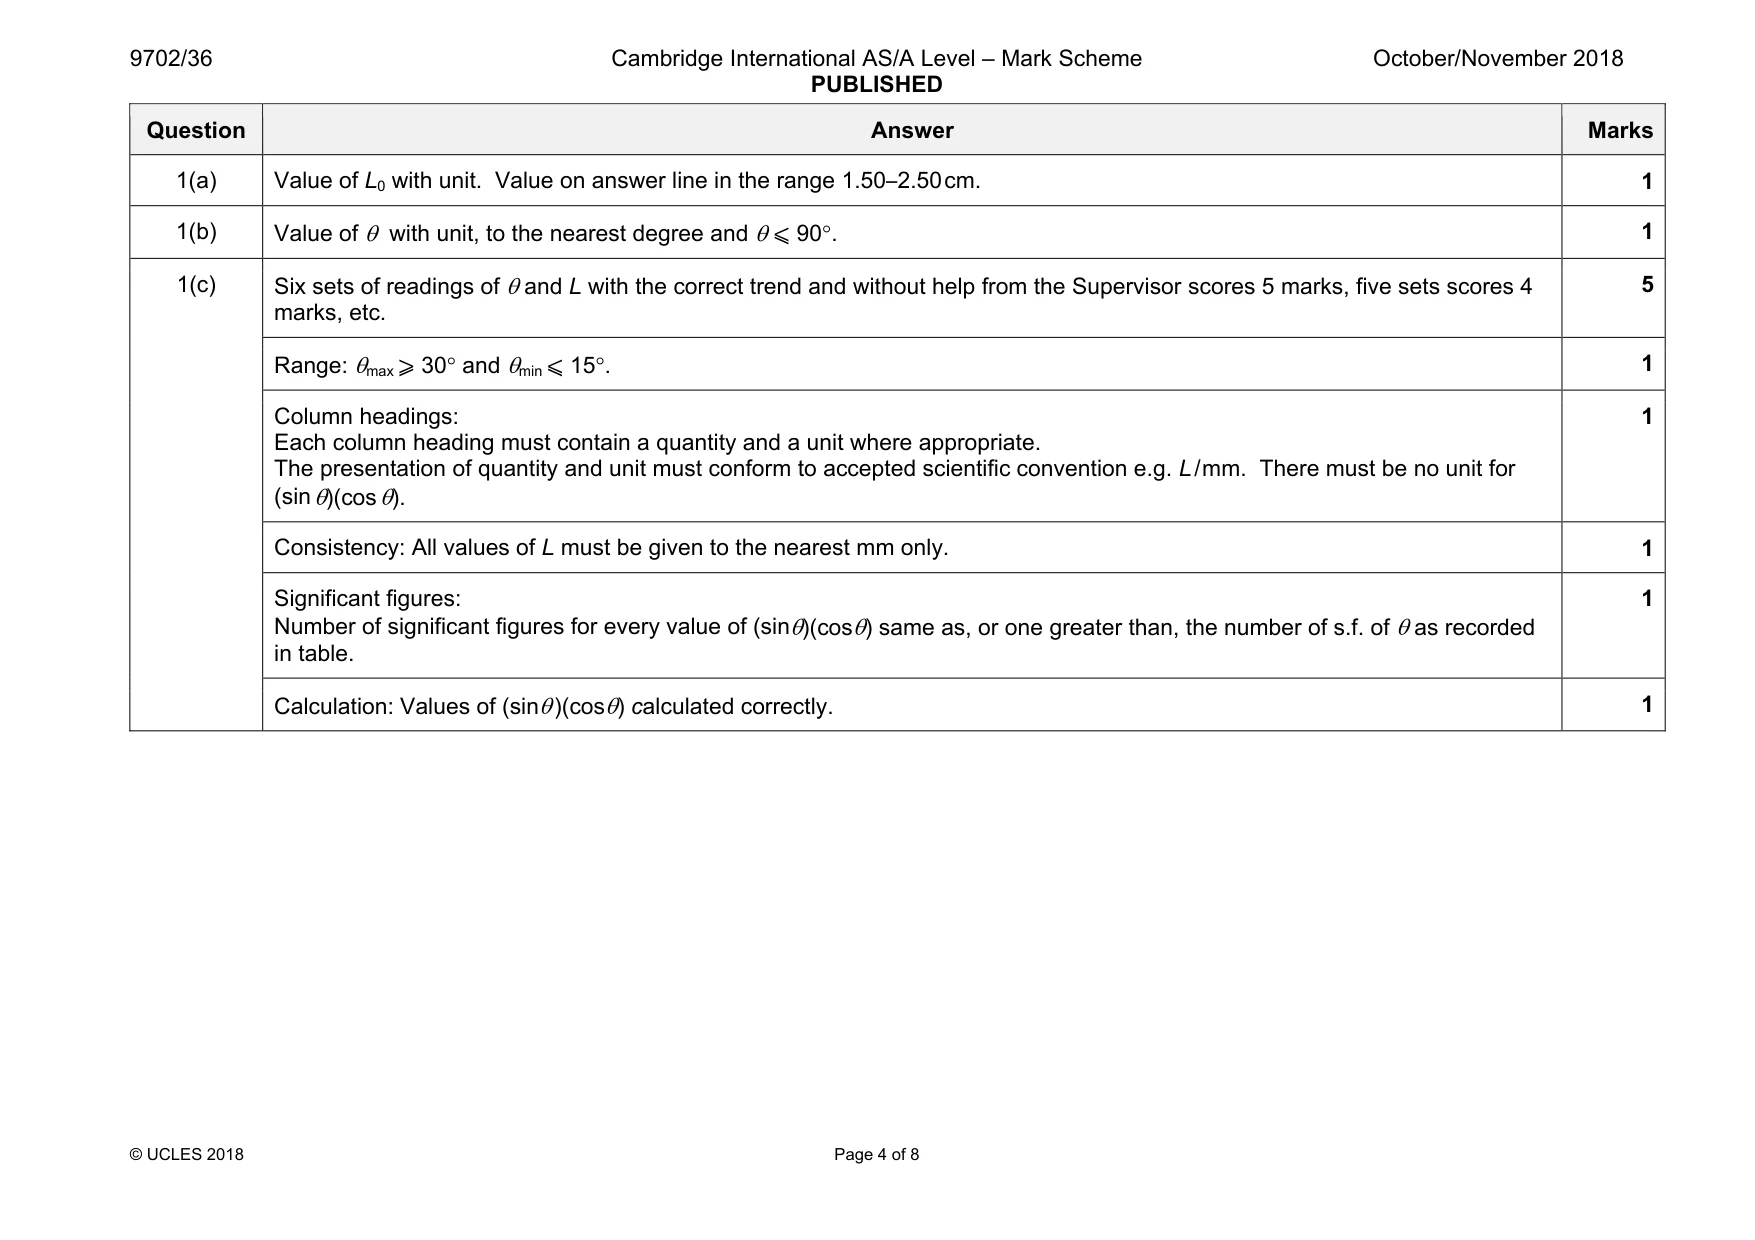
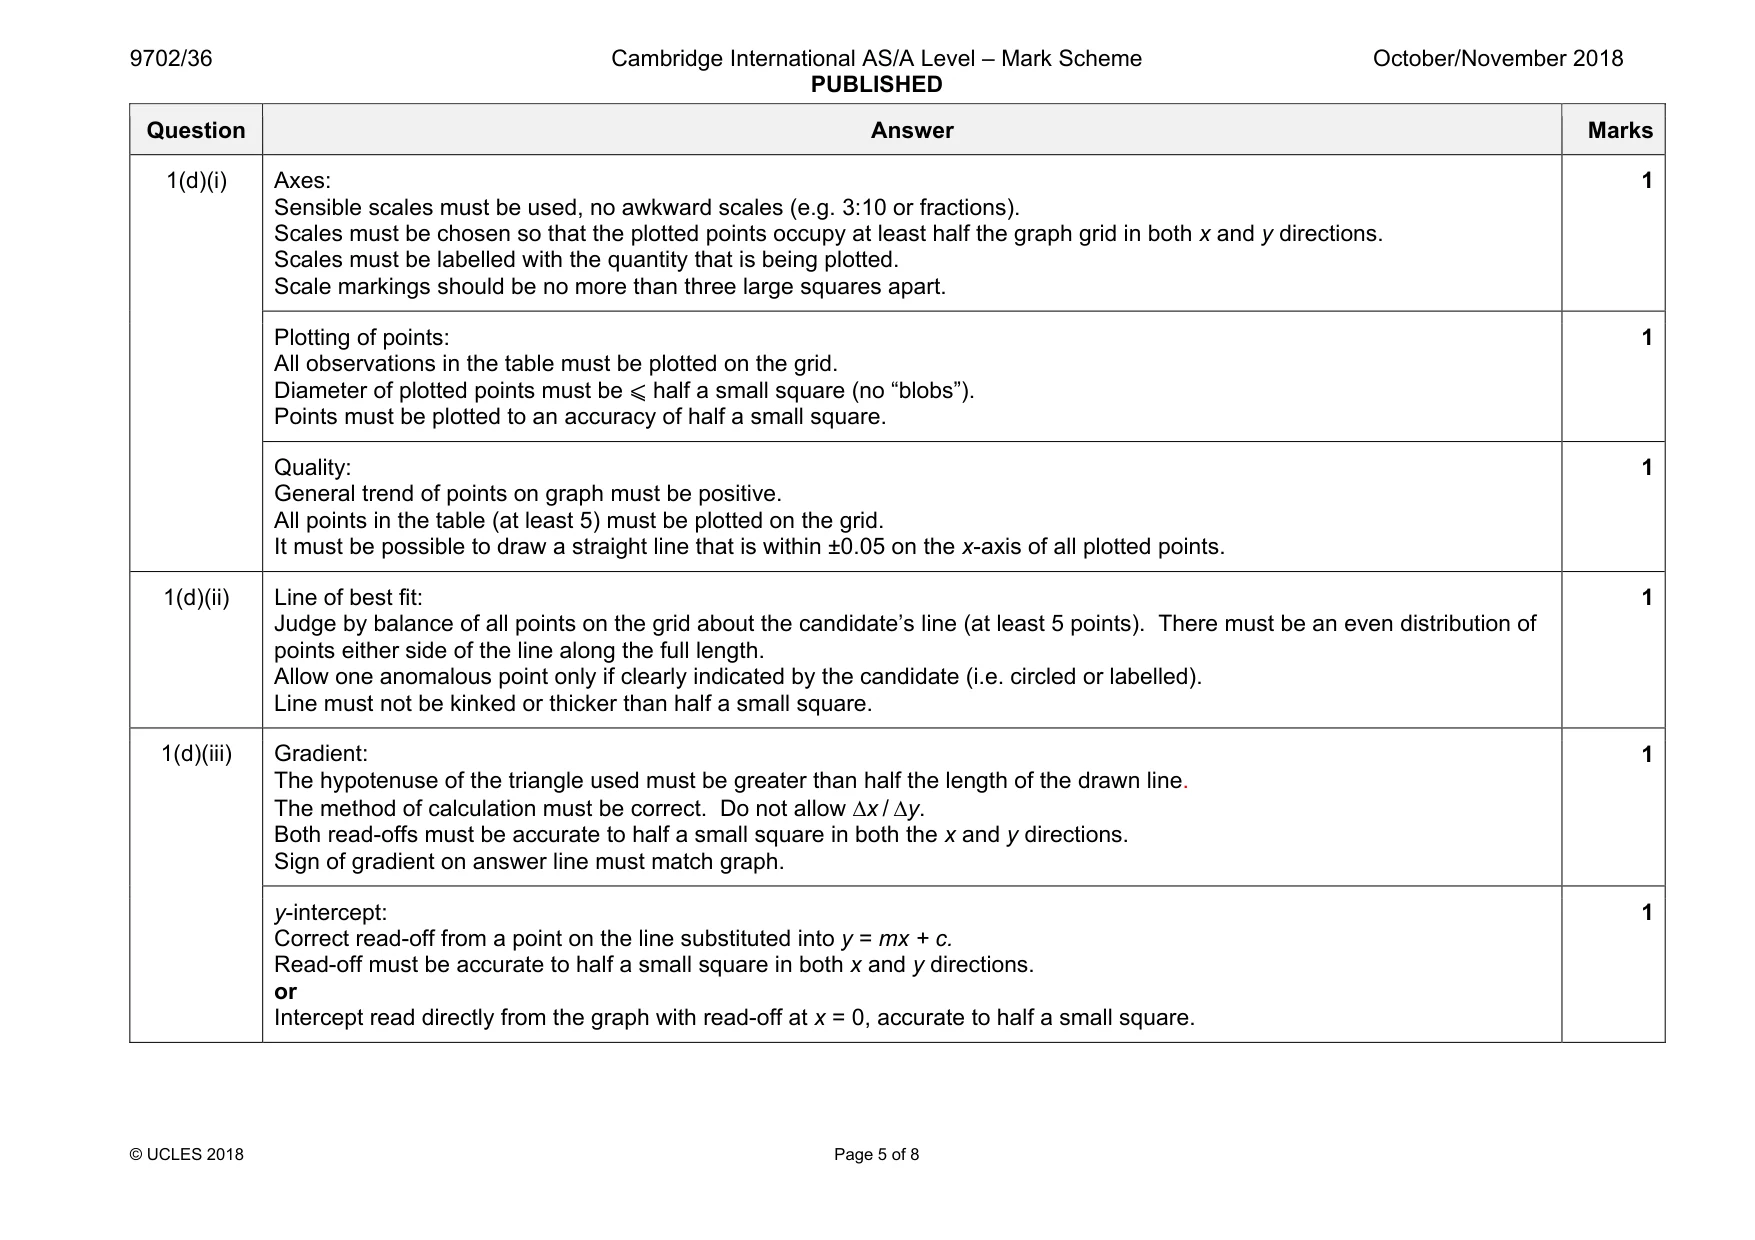
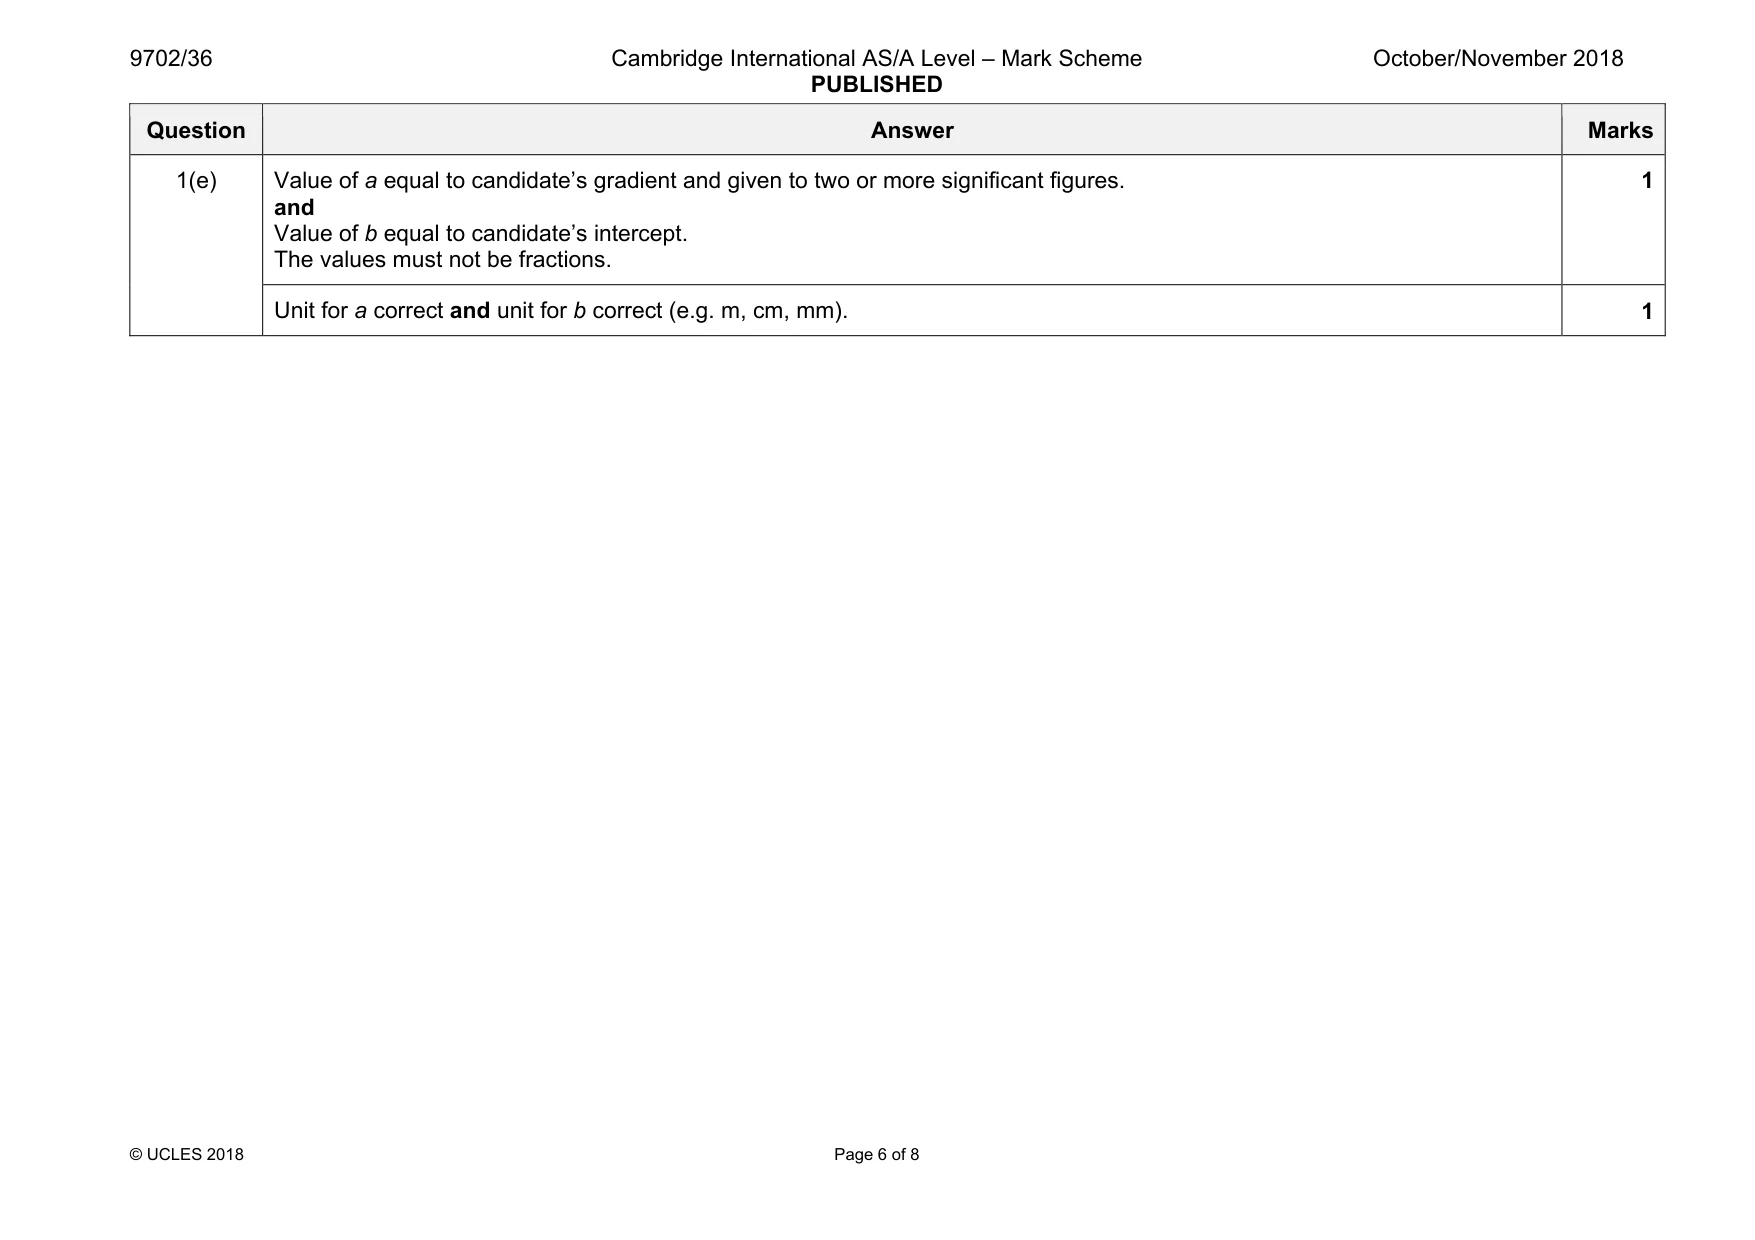
Mark scheme: 1(a) Value of L0 with unit. Value on answer line in the range 1.50—2.50 cm. 1 1(b) Value of θ with unit, to the nearest degree and θ ⩽ 90°. 1 1(c) Six sets of readings of θ and L with the correct trend and without help from the Supervisor scores 5 marks, five sets scores 4 marks, etc. 5 Range: θmax ⩾ 30° and θmin ⩽ 15°. 1 Column headings: Each column heading must contain a quantity and a unit where appropriate. The presentation of quantity and unit must conform to accepted scientific convention e.g. L / mm. There must be no unit for (sin θ)(cos θ). 1 Consistency: All values of L must be given to the nearest mm only. 1 Significant figures: Number of significant figures for every value of (sinθ)(cosθ) same as, or one greater than, the number of s.f. of θ as recorded in table. 1 Calculation: Values of (sinθ )(cosθ) calculated correctly. 1 Question Answer Marks 1(d)(i) Axes: Sensible scales must be used, no awkward scales (e.g. 3:10 or fractions). Scales must be chosen so that the plotted points occupy at least half the graph grid in both x and y directions. Scales must be labelled with the quantity that is being plotted. Scale markings should be no more than three large squares apart. 1 Plotting of points: All observations in the table must be plotted on the grid. Diameter of plotted points must be ⩽ half a small square (no “blobs”). Points must be plotted to an accuracy of half a small square. 1 Quality: General trend of points on graph must be positive. All points in the table (at least 5) must be plotted on the grid. It must be possible to draw a straight line that is within ±0.05 on the x-axis of all plotted points. 1 1(d)(ii) Line of best fit: Judge by balance of all points on the grid about the candidate’s line (at least 5 points). There must be an even distribution of points either side of the line along the full length. Allow one anomalous point only if clearly indicated by the candidate (i.e. circled or labelled). Line must not be kinked or thicker than half a small square. 1 1(d)(iii) Gradient: The hypotenuse of the triangle used must be greater than half the length of the drawn line. The method of calculation must be correct. Do not allow ∆x / ∆y. Both read-offs must be accurate to half a small square in both the x and y directions. Sign of gradient on answer line must match graph. 1 y-intercept: Correct read-off from a point on the line substituted into y = mx + c. Read-off must be accurate to half a small square in both x and y directions. or Intercept read directly from the graph with read-off at x = 0, accurate to half a small square. 1 Question Answer Marks 1(e) Value of a equal to candidate’s gradient and given to two or more significant figures. and Value of b equal to candidate’s intercept. The values must not be fractions. 1 Unit for a correct and unit for b correct (e.g. m, cm, mm). 1
Q2 · In this experiment, you will investigate the motion of a hacksaw blade
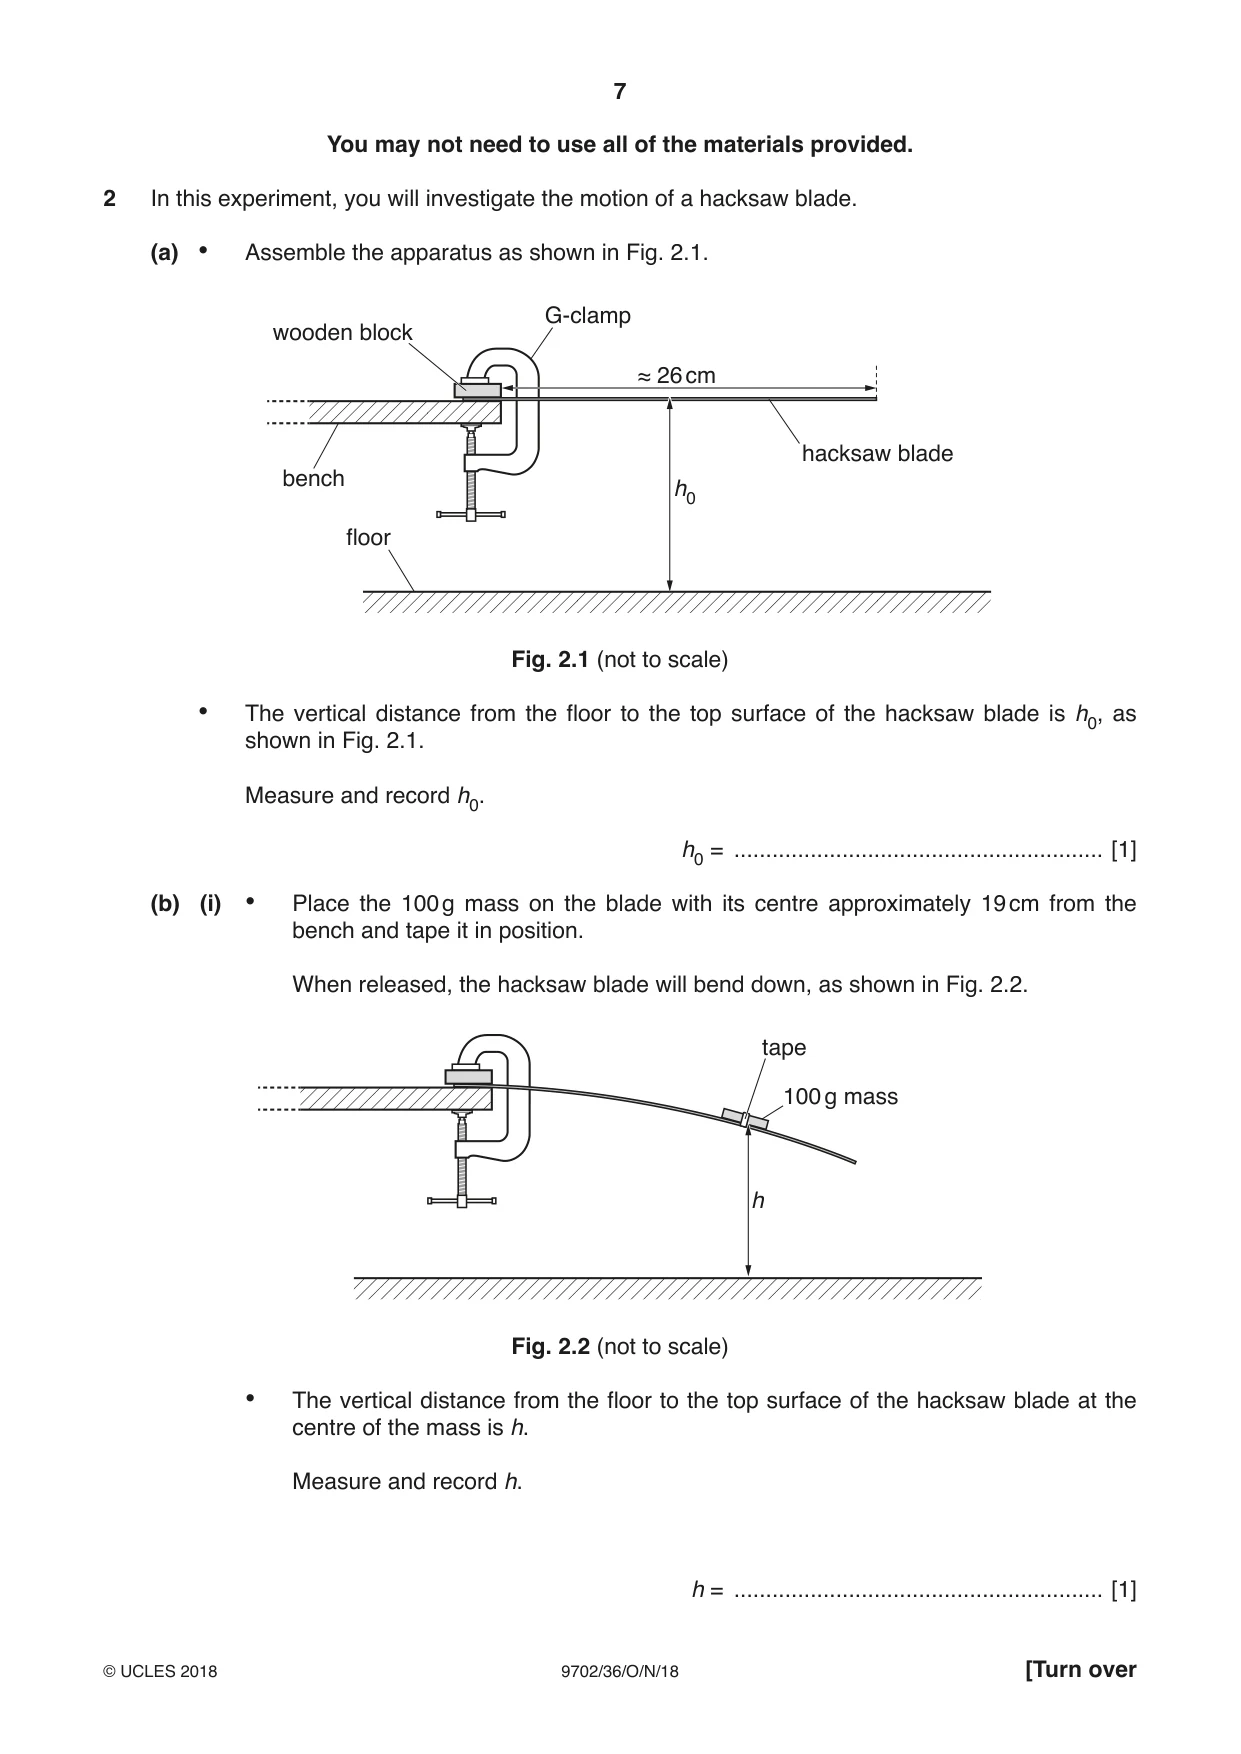
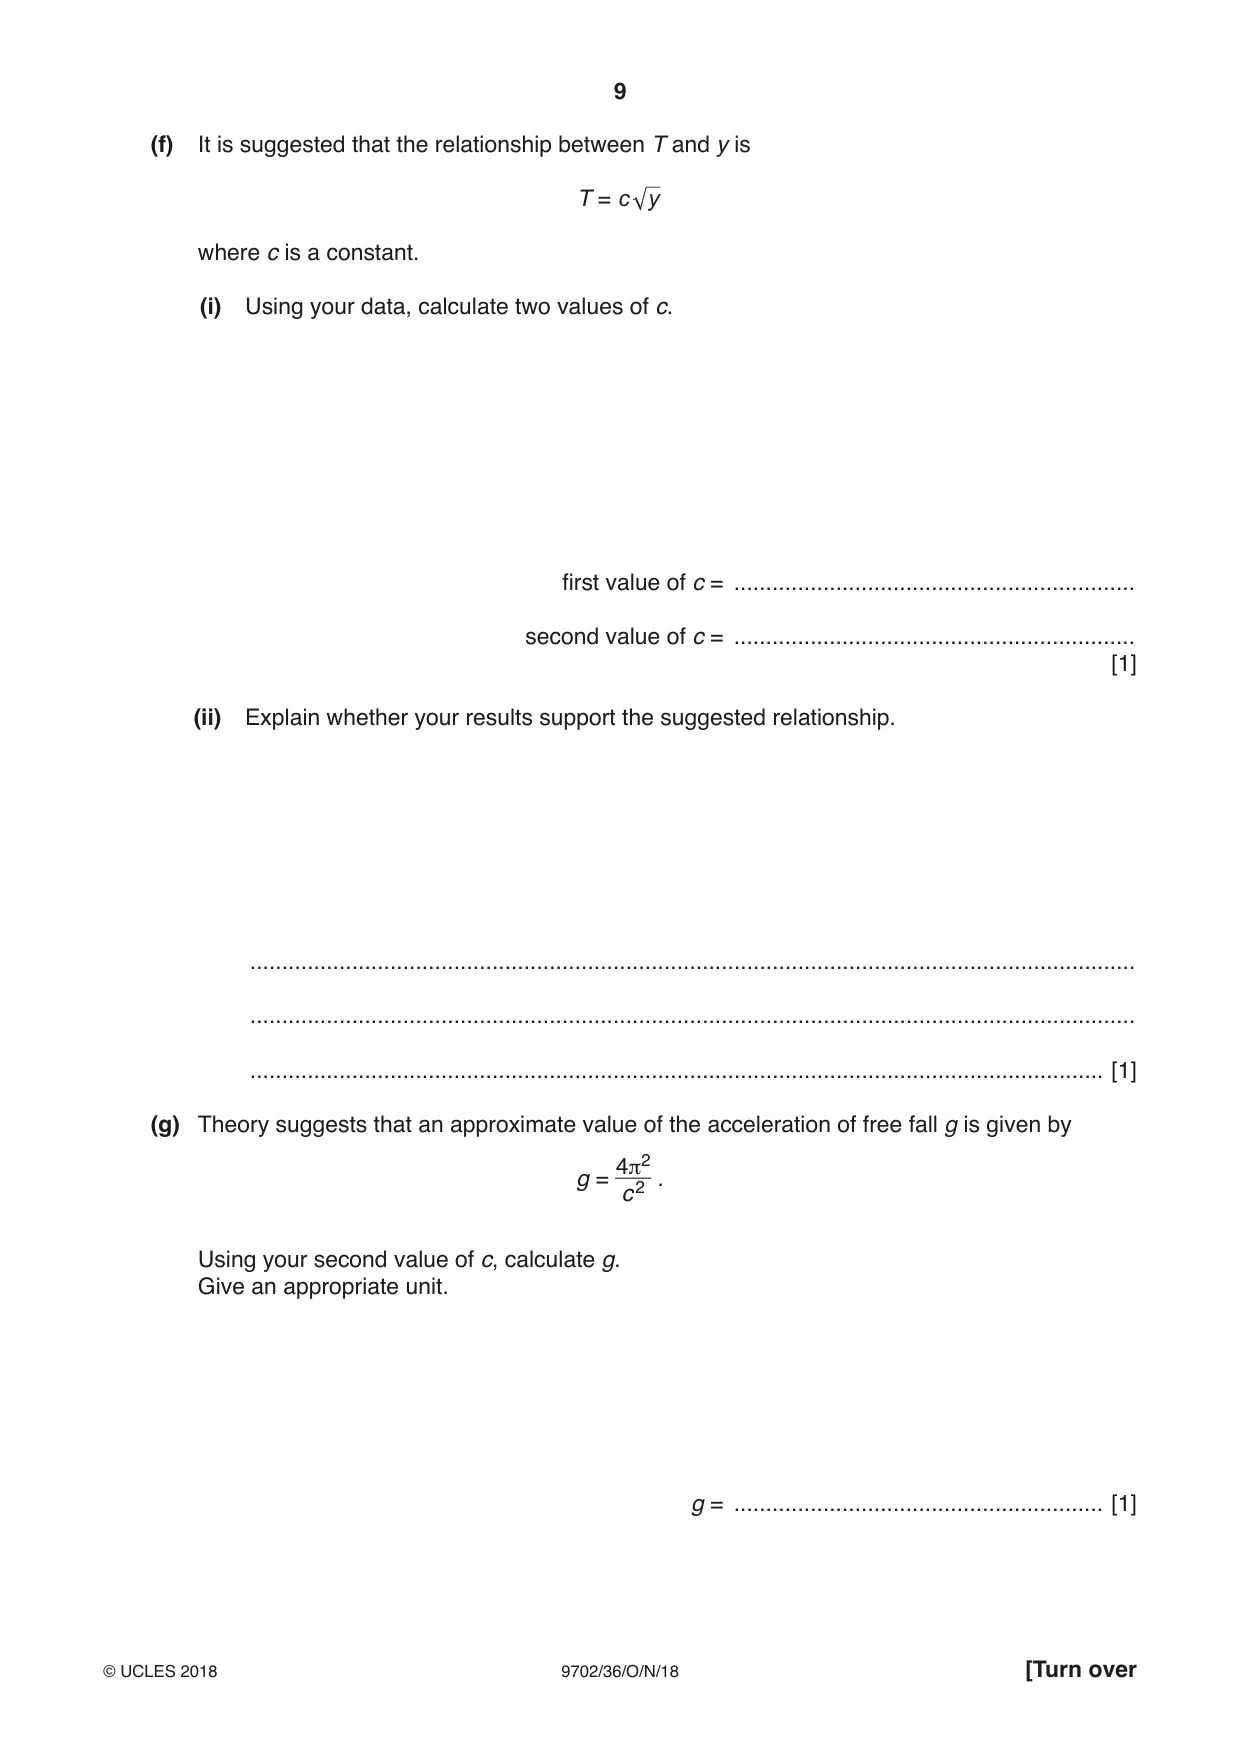
2 In this experiment, you will investigate the motion of a hacksaw blade. (a) • Assemble the apparatus as shown in Fig. 2.1. G-clamp wooden block ≈ 26 cm hacksaw blade bench h0 floor Fig. 2.1 (not to scale) • The vertical distance from the floor to the top surface of the hacksaw blade is h0, as shown in Fig. 2.1. Measure and record h0. h0 = .......................................................... [1] (b) (i) • Place the 100 g mass on the blade with its centre approximately 19 cm from the bench and tape it in position. When released, the hacksaw blade will bend down, as shown in Fig. 2.2. tape 100 g mass h Fig. 2.2 (not to scale) • The vertical distance from the floor to the top surface of the hacksaw blade at the centre of the mass is h. Measure and record h. h = .......................................................... [1] (ii) Calculate y, where y = h0 – h. y = .......................................................... [1] (c) Estimate the percentage uncertainty in your value of y. percentage uncertainty = .......................................................... [1] (d) Push the end of the hacksaw blade down a small distance and then release it. The blade will oscillate. Determine the period T of the oscillations. T = .......................................................... [2] (e) • Move the slotted mass approximately 3 cm further from the bench and fix it with tape. • Measure and record h. h = ............................................................... • Repeat (b)(ii) and (d). y = ............................................................... T = ............................................................... [3] (f) It is suggested that the relationship between T and y is T = c y where c is a constant. (i) Using your data, calculate two values of c. first value of c = ............................................................... second value of c = ............................................................... [1] (ii) Explain whether your results support the suggested relationship. ........................................................................................................................................... ........................................................................................................................................... ...................................................................................................................................... [1] (g) Theory suggests that an approximate value of the acceleration of free fall g is given by 4π2 g = . c2 Using your second value of c, calculate g. Give an appropriate unit. g = .......................................................... [1]
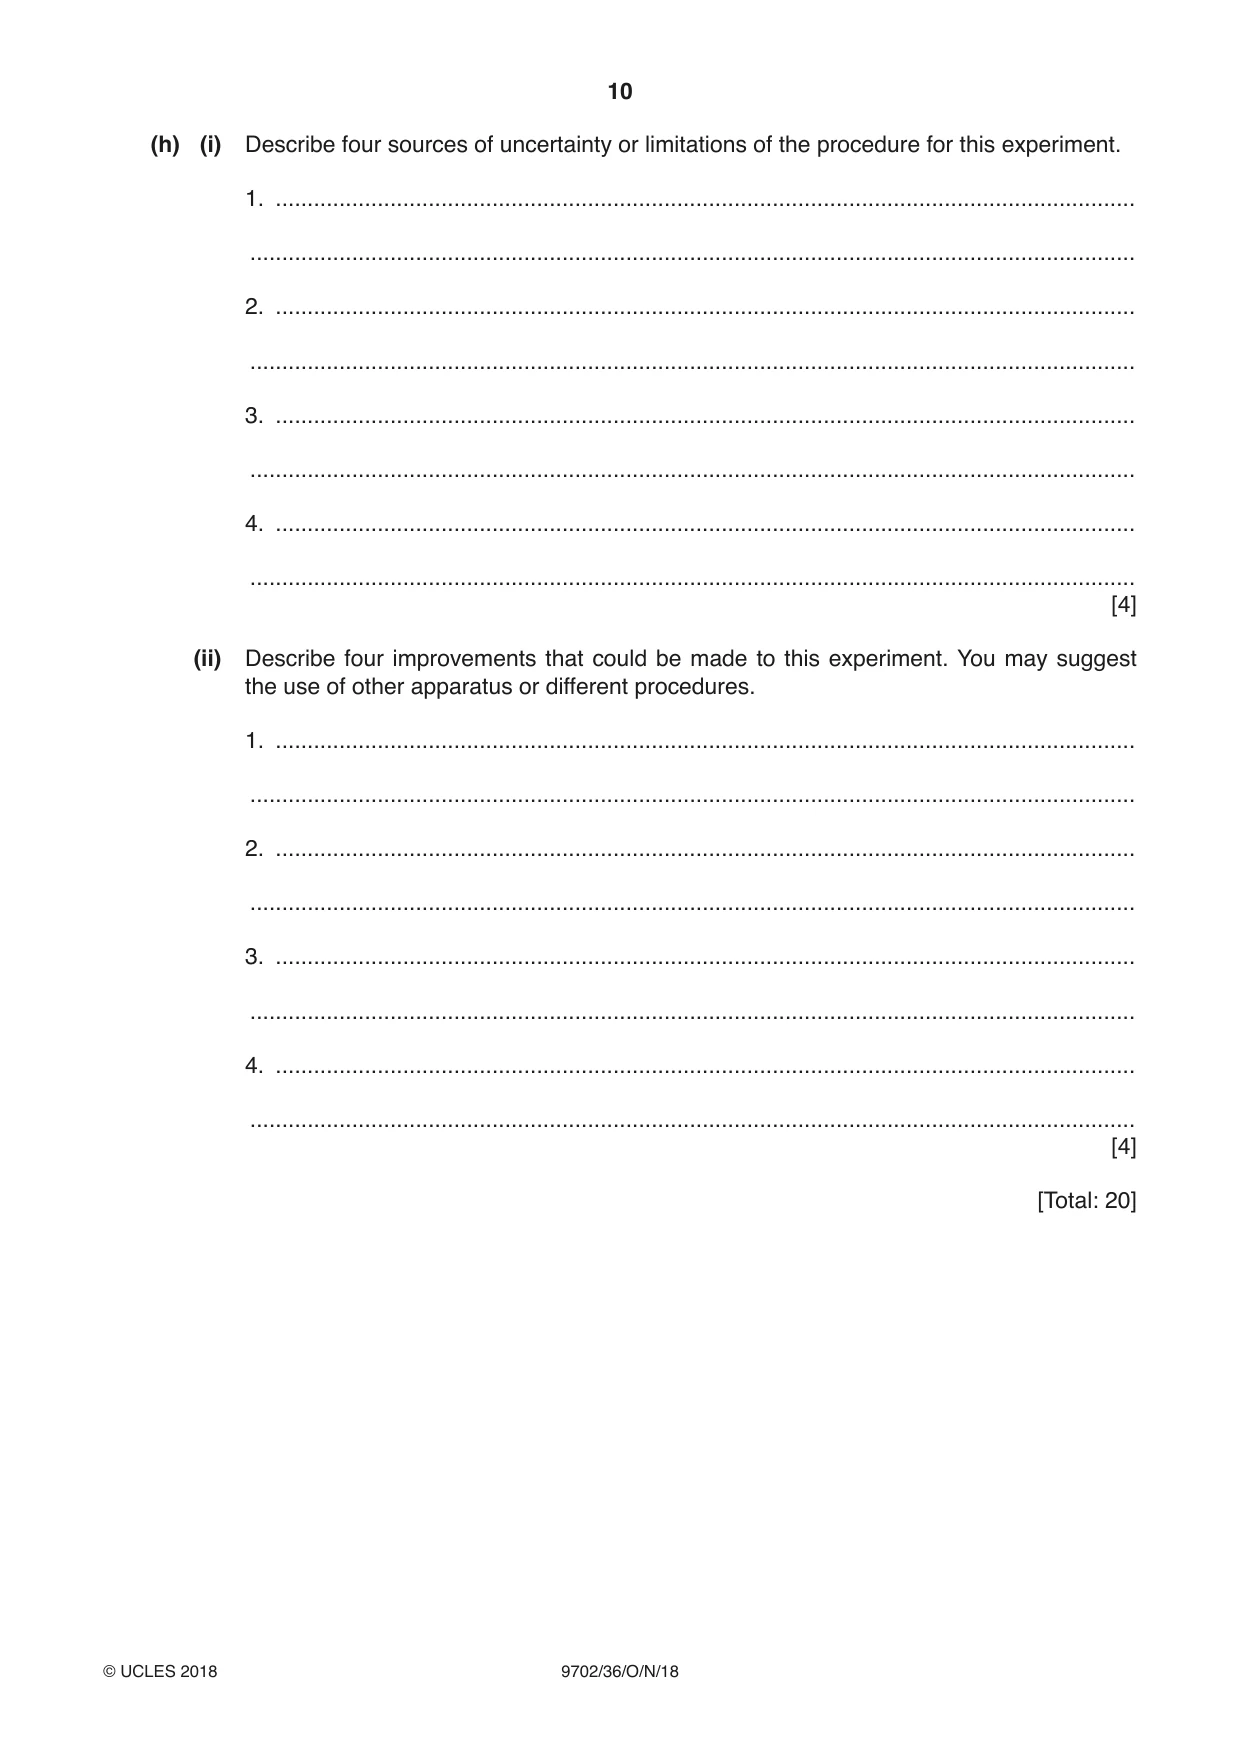
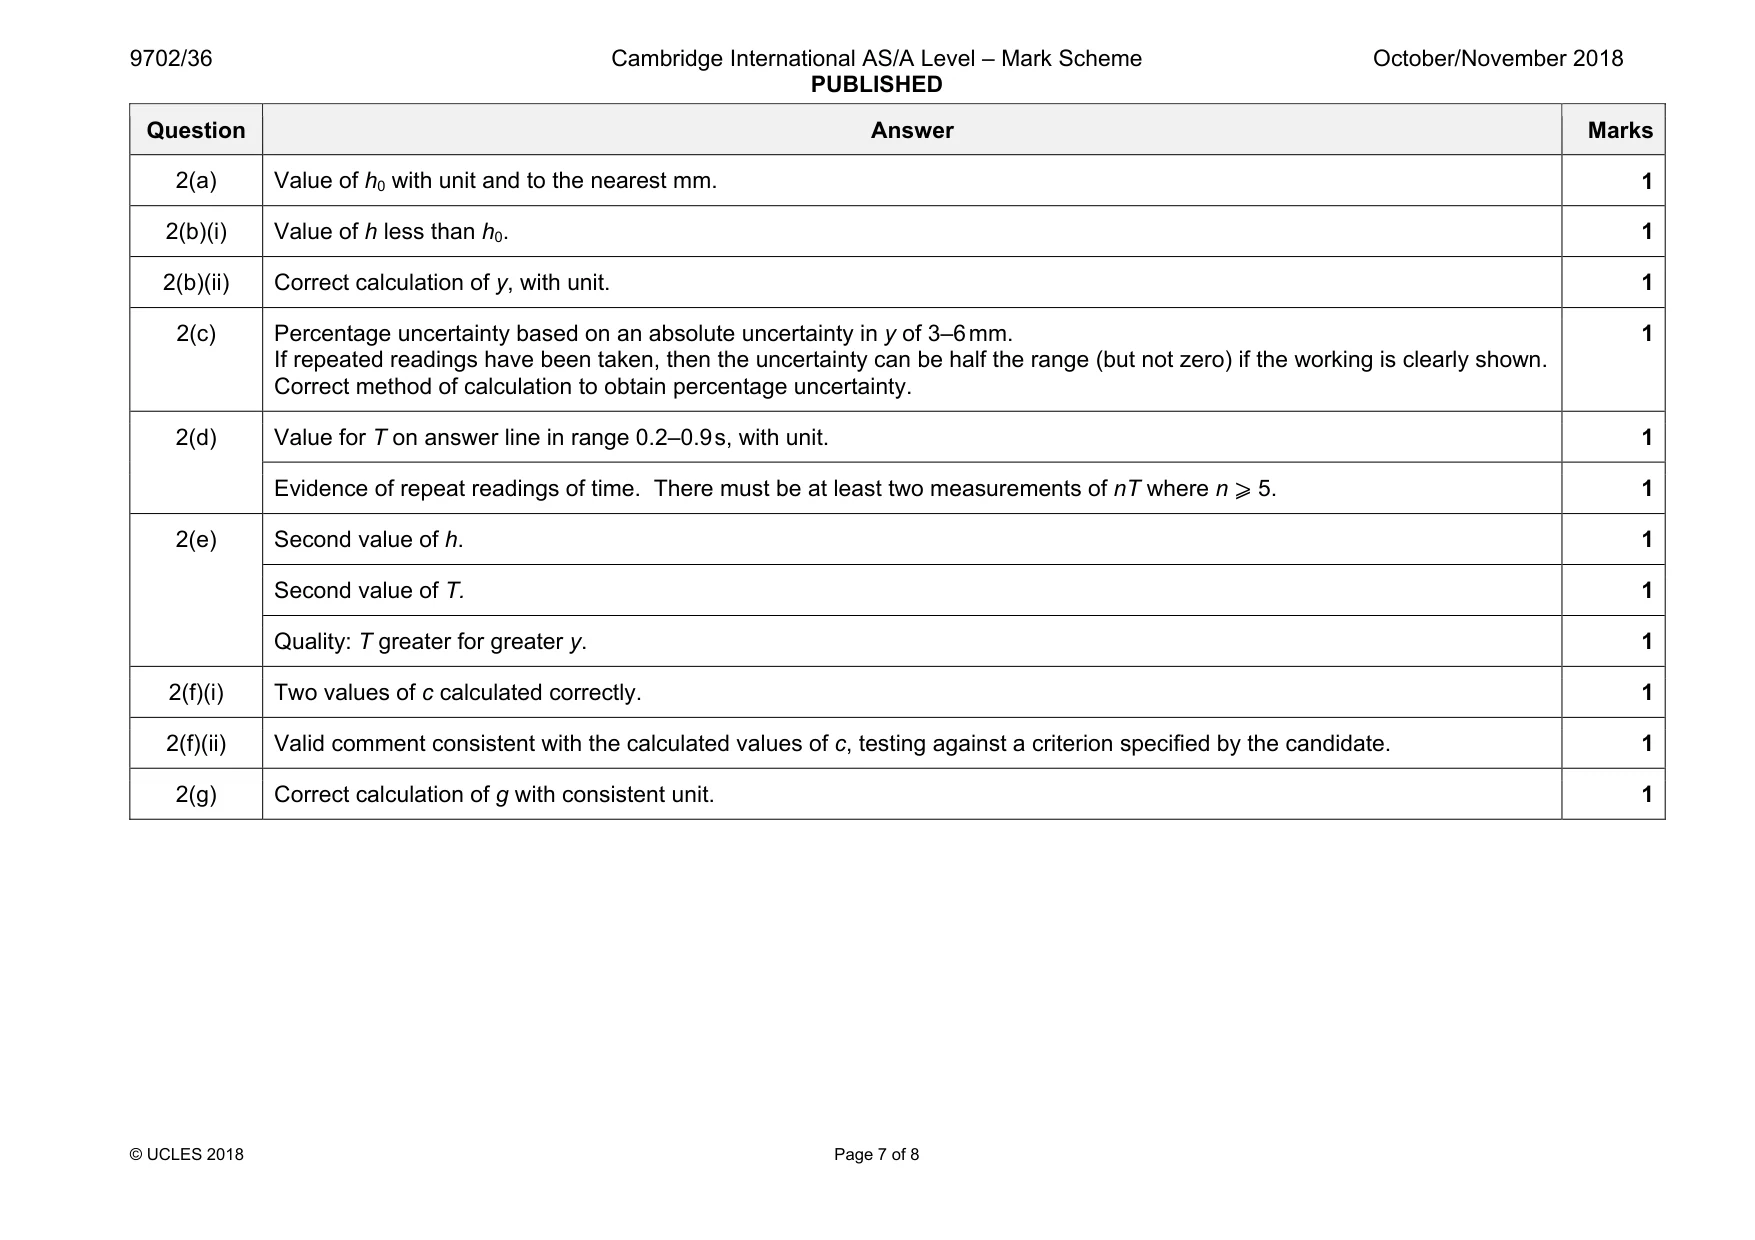
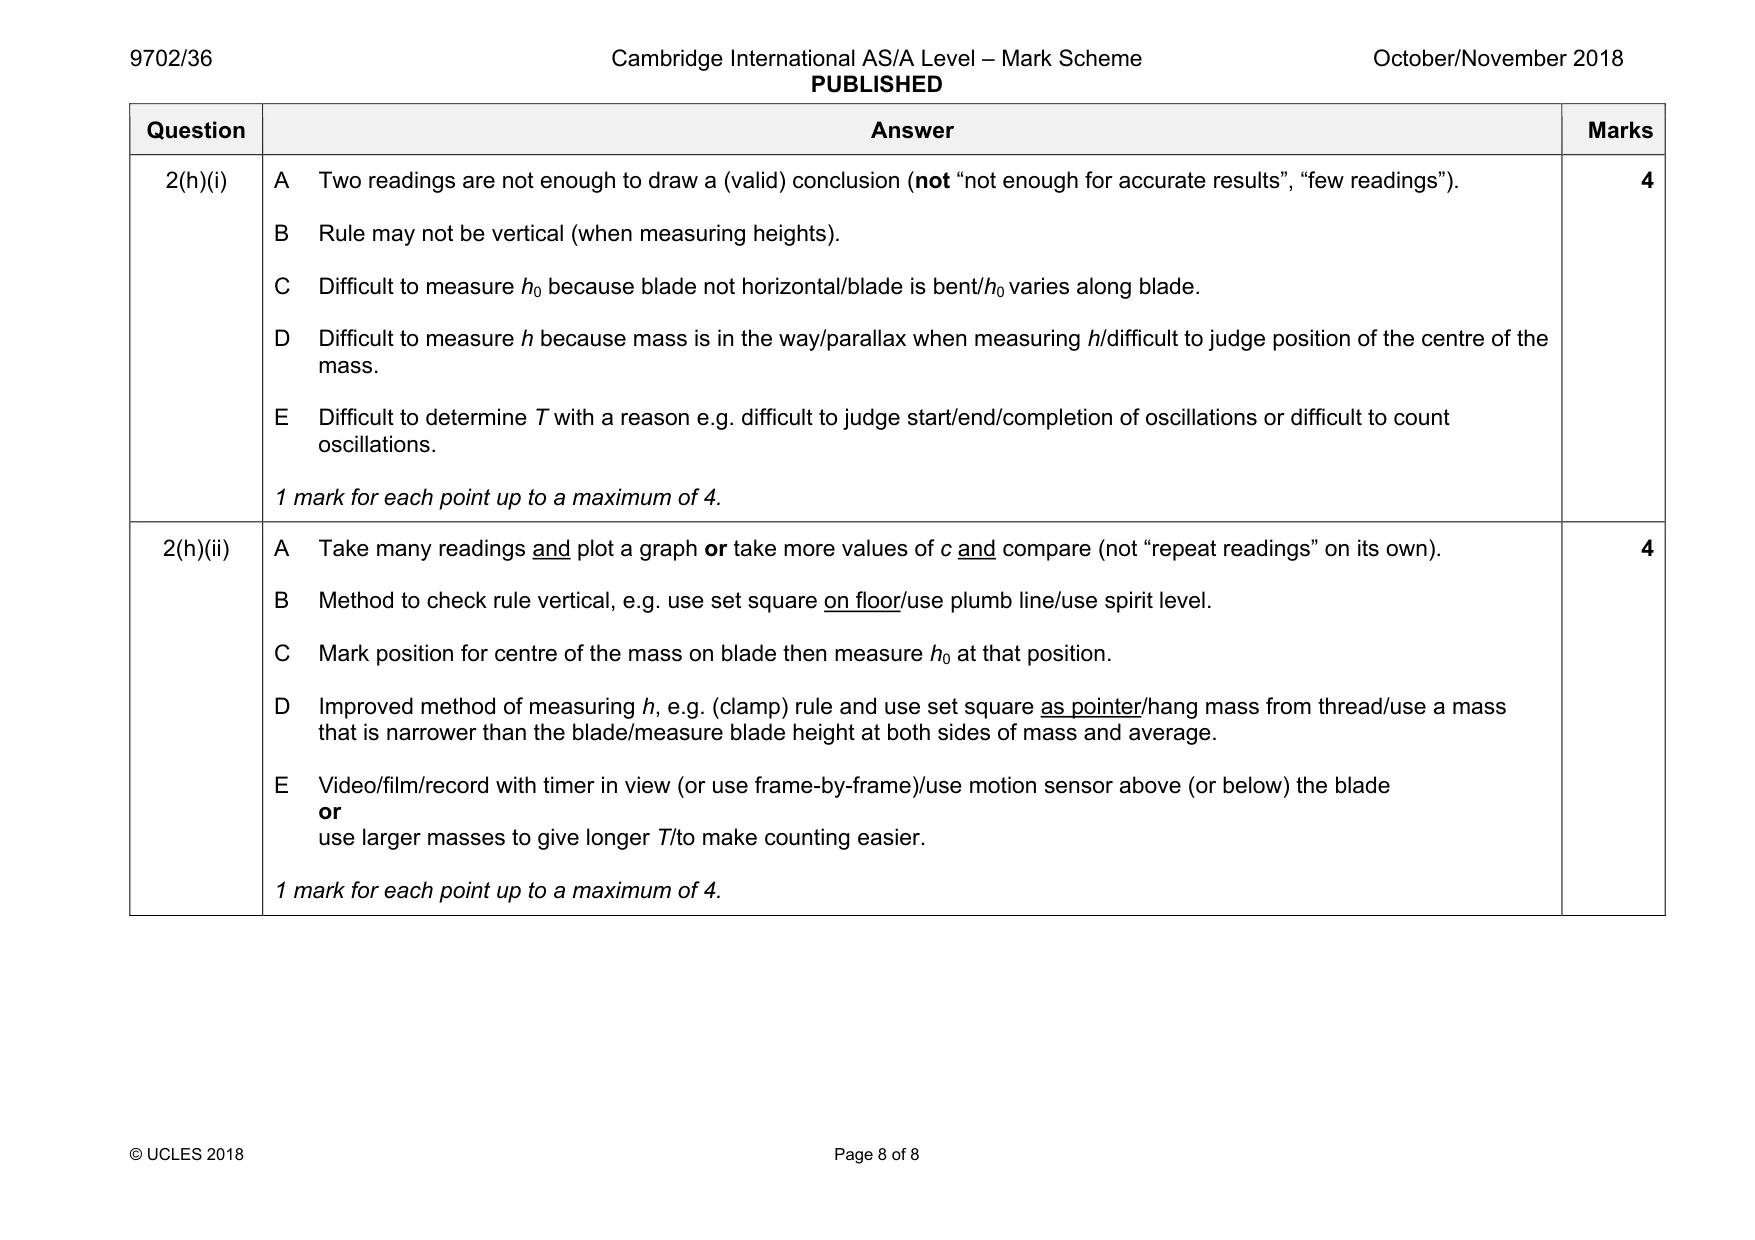
Mark scheme: 2(a) Value of h0 with unit and to the nearest mm. 1 2(b)(i) Value of h less than h0. 1 2(b)(ii) Correct calculation of y, with unit. 1 2(c) Percentage uncertainty based on an absolute uncertainty in y of 3–6 mm. If repeated readings have been taken, then the uncertainty can be half the range (but not zero) if the working is clearly shown. Correct method of calculation to obtain percentage uncertainty. 1 2(d) Value for T on answer line in range 0.2–0.9 s, with unit. 1 Evidence of repeat readings of time. There must be at least two measurements of nT where n ⩾ 5. 1 2(e) Second value of h. 1 Second value of T. 1 Quality: T greater for greater y. 1 2(f)(i) Two values of c calculated correctly. 1 2(f)(ii) Valid comment consistent with the calculated values of c, testing against a criterion specified by the candidate. 1 2(g) Correct calculation of g with consistent unit. 1 Question Answer Marks 2(h)(i) A Two readings are not enough to draw a (valid) conclusion (not “not enough for accurate results”, “few readings”). B Rule may not be vertical (when measuring heights). C Difficult to measure h0 because blade not horizontal/blade is bent/h0 varies along blade. D Difficult to measure h because mass is in the way/parallax when measuring h/difficult to judge position of the centre of the mass. E Difficult to determine T with a reason e.g. difficult to judge start/end/completion of oscillations or difficult to count oscillations. 1 mark for each point up to a maximum of 4. 4 2(h)(ii) A Take many readings and plot a graph or take more values of c and compare (not “repeat readings” on its own). B Method to check rule vertical, e.g. use set square on floor/use plumb line/use spirit level. C Mark position for centre of the mass on blade then measure h0 at that position. D Improved method of measuring h, e.g. (clamp) rule and use set square as pointer/hang mass from thread/use a mass that is narrower than the blade/measure blade height at both sides of mass and average. E Video/film/record with timer in view (or use frame-by-frame)/use motion sensor above (or below) the blade or use larger masses to give longer T/to make counting easier. 1 mark for each point up to a maximum of 4. 4
What was in this paper
The subtopics covered by these 2 questions, and how many questions each got. Open one in a new tab to see every Cambridge question on it.
What you needed in this session
Cambridge’s own grade thresholds for 2018 Oct/Nov, Paper 3 · Variant 6. A higher threshold means an easier paper — the bar moves with how the cohort did.